PROVINCIAL AGRI WORKER HOUSEHOLD CENSUS - elsenburg.com Agri... · Ministry of Economic...
37
Ministry of Economic Opportunities: Press Conference Cape Town 02 November 2017 PROVINCIAL AGRI WORKER HOUSEHOLD CENSUS
Transcript of PROVINCIAL AGRI WORKER HOUSEHOLD CENSUS - elsenburg.com Agri... · Ministry of Economic...
Ministry of Economic Opportunities: Press Conference
Cape Town 02 November 2017
PROVINCIAL AGRI WORKER HOUSEHOLD CENSUS

© Western Cape Government 2012 |
Presentation Outline
Census Background and Key Findings
Rural Development: Farm Worker Development Responses
Agricultural Economic Services support of Ethical Trade Compliance
The Human Capital Development response by the WCDoA
Q & A
2

Census Background
© Western Cape Government 2014 |
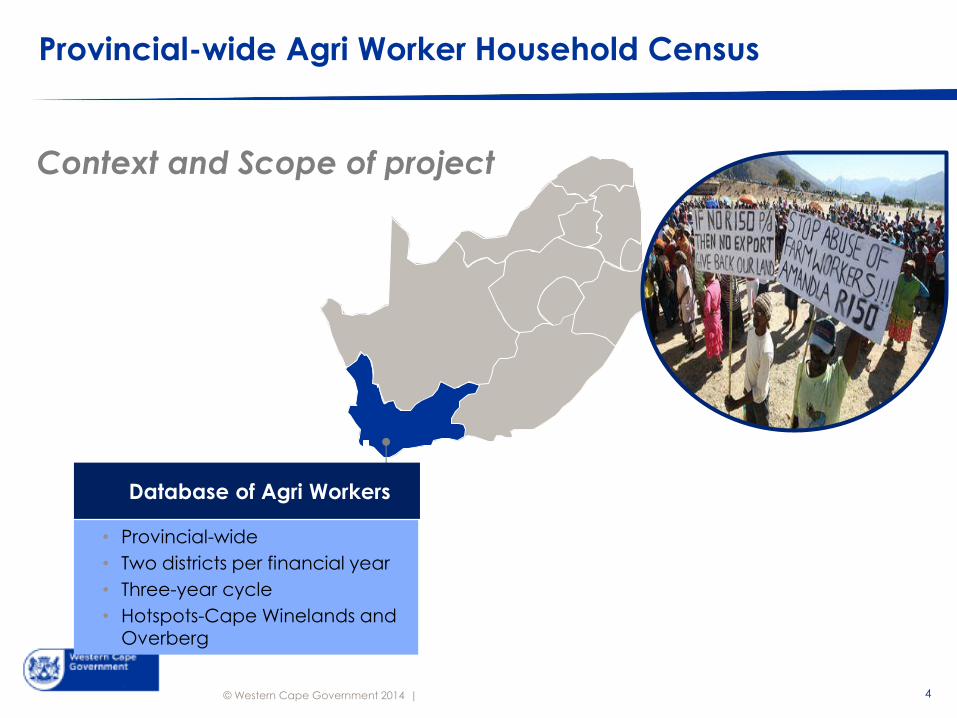
Provincial-wide Agri Worker Household Census
4
Database of Agri Workers
• Provincial-wide
• Two districts per financial year
• Three-year cycle
• Hotspots-Cape Winelands and Overberg
Context and Scope of project

© Western Cape Government 2014 | 5 PG MTEC 1 Engagement

© Western Cape Government 2014 |
Cabinet- Agreed Action Plan
6 Go to Insert > Header & Footer > Enter presentation name into footer field
Continue the three-year cycle- finish first round end 2016/2017
Upgrading capacity to strengthen baseline
towards achieving PSGs
Provincial Top Management confirmation (Sept 2015)
of departmental participation
1
2
3
4
Communicate findings and inform departmental and
municipal programmes

Cape Winelands
7
© Western Cape Government 2012 |
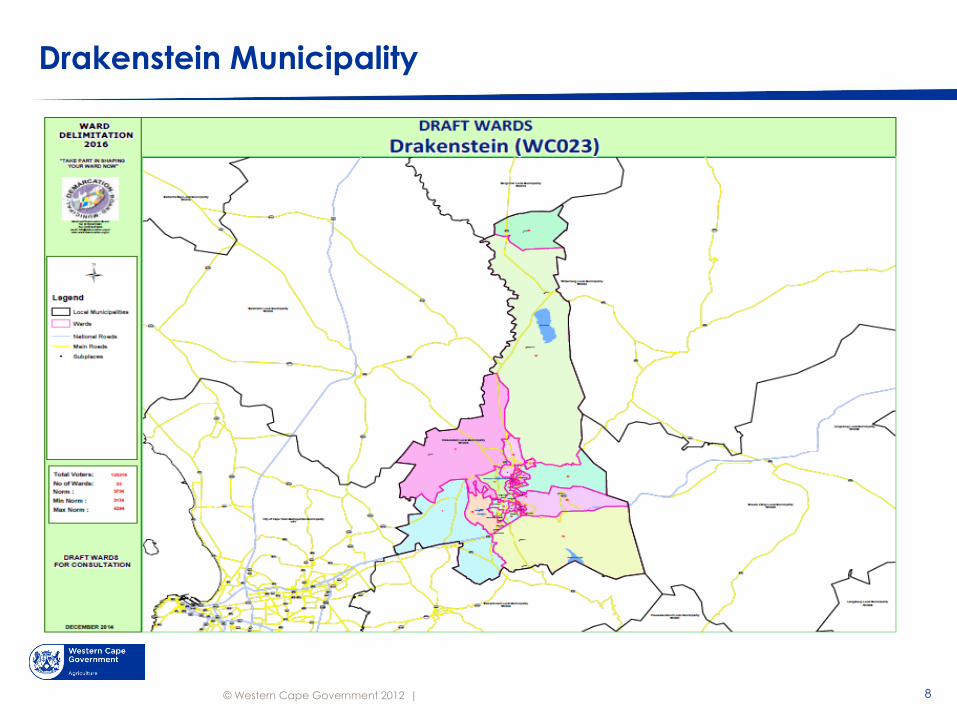
Drakenstein Municipality
8

© Western Cape Government 2012 |
Ward 3 Drakenstein Municipality
9

Key Findings

Population breakdown
0.0% 5.0% 10.0% 15.0% 20.0% 25.0% 30.0% 35.0%
Age 0-6
Age 7 - 13
Age 14-18
Age 19-34
Age 35-49
Age 50-64
Age 65+
Age 0-6 Age 7 - 13 Age 14-18 Age 19-34 Age 35-49 Age 50-64 Age 65+
counts 13.0% 14.00% 7.2% 32.2% 21.1% 10.8% 1.8%
11

© Western Cape Government 2012 | 12
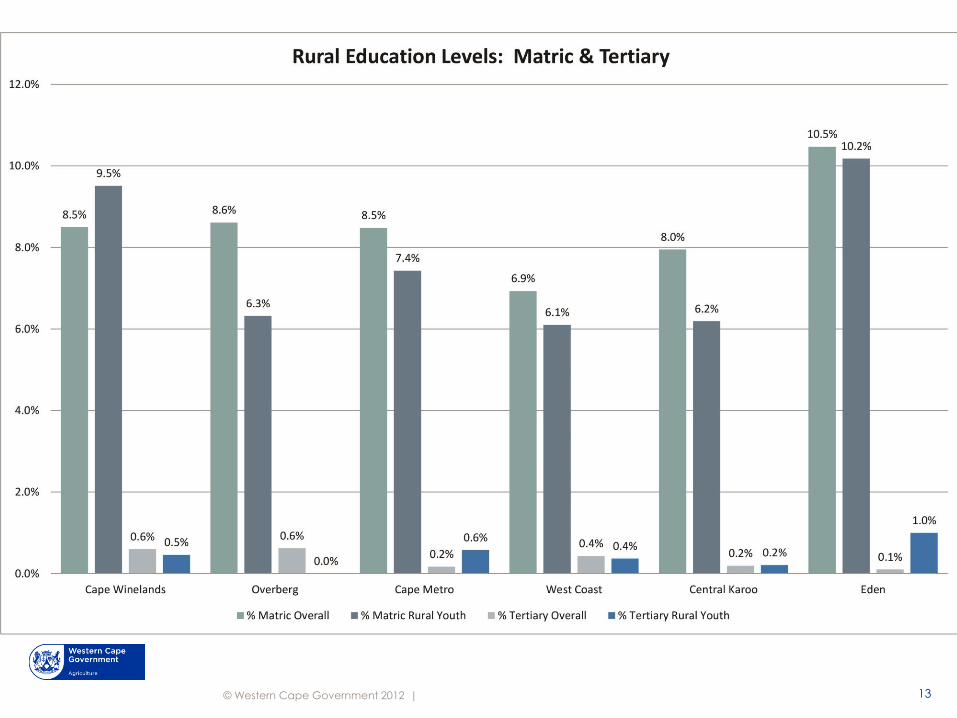
© Western Cape Government 2012 | 13

Education: BV vs HRV Local Municipalities
2% 1%
12%
63%
21%
1% 0% 1% 1%
14%
64%
17%
1% 0% 0%
10%
20%
30%
40%
50%
60%
70%
None Primary Senior Primary Some High School Matriculation Tertiary ABET
Highest Level of Education
Hex River Valley Breede River LM
14
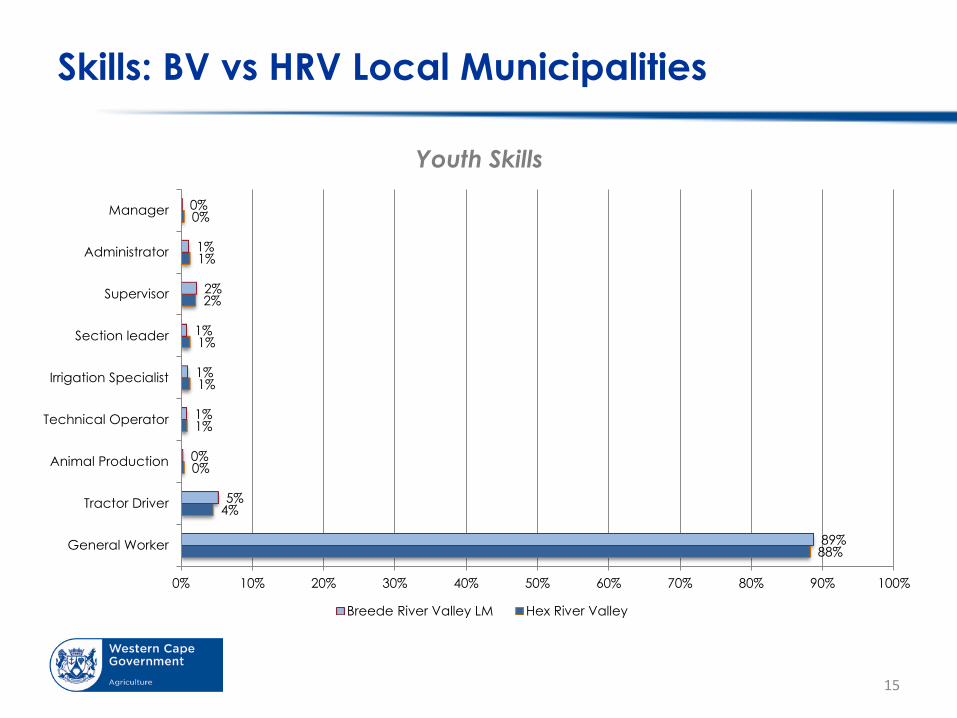
Skills: BV vs HRV Local Municipalities
88%
4%
0%
1%
1%
1%
2%
1%
0%
89%
5%
0%
1%
1%
1%
2%
1%
0%
0% 10% 20% 30% 40% 50% 60% 70% 80% 90% 100%
General Worker
Tractor Driver
Animal Production
Technical Operator
Irrigation Specialist
Section leader
Supervisor
Administrator
Manager
Youth Skills
Breede River Valley LM Hex River Valley
15

© Western Cape Government 2012 |
Job differentiation
16
Region
Agri worker positions occupied (%)
Ge
ne
ral w
ork
er
Tra
cto
r d
rive
r
An
ima
l
pro
du
ctio
n
Tec
hn
ica
l
op
era
tor
Irri
ga
tio
n
spe
cia
list
Se
ctio
n le
ad
er
Su
pe
rvis
or
Ad
min
istr
atio
n
Ma
na
ge
r
Cape Metro 2.6% 2.6% 7.2% 4.1% 0.6% 0.9% 1.6% 1.1% 0.0%
Cape Winelands 51.6% 59.1% 31.9% 61.3% 72.0% 62.6% 71.4% 74.3% 66.2%
Central Karoo 1.6% 0.6% 6.6% 0.0% 0.0% 0.0% 0.4% 0.5% 1.4%
Eden 7.4% 6.9% 14.9% 4.5% 1.5% 4.7% 2.8% 2.7% 2.7%
Overberg 11.1% 9.8% 10.4% 18.5% 11.2% 14.0% 9.0% 5.9% 16.2%
West Coast 25.6% 21.0% 29.0% 11.5% 14.6% 17.8% 14.8% 15.5% 13.5%
Province (n) 16664 1029 335 243 329 214 566 187 74
Province (%) 84.8% 5.2% 1.7% 1.2% 1.7% 1.1% 2.9% 1.0% 0.4%

Human Settlements
Is your house on the farm? Yes No
Cape Metro 68.0% 32.0%
Cape Winelands 80.0% 20.0%
Central Karoo 70.0% 30.0%
Eden 59.0% 41.0%
Overberg 81.0% 19.0%
West Coast 81.0% 19.0%
Total 78,0% 22.0%
17

18

Social Ills
0 1 2 3 4 5 6
Drug Abuse
Alcoholism
FAS
Unemployment
Gangsterism
Gambling
Crime
Child Neglect
Domestic Violence
Poor health
Teenage Pregnancy
Social Issues: Severity Rank
19
WCDoA’s Rural Development:
Farm Worker Development Responses
© Western Cape Government 2012 |
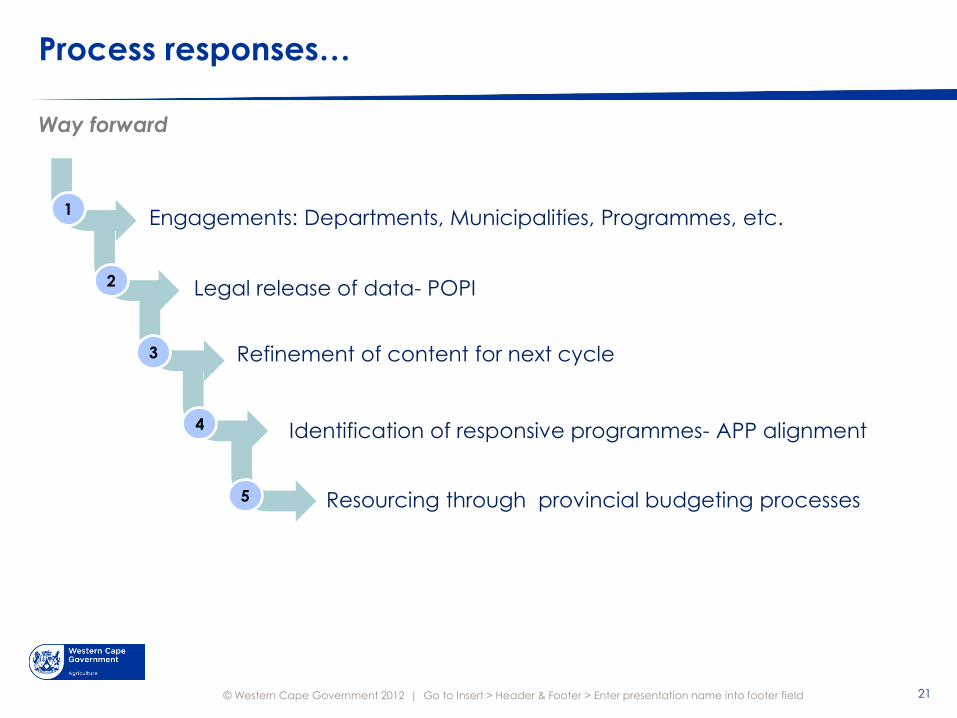
Process responses…
Way forward
21 Go to Insert > Header & Footer > Enter presentation name into footer field
Engagements: Departments, Municipalities, Programmes, etc.
Refinement of content for next cycle
1
2
3
4
5
Identification of responsive programmes- APP alignment
Legal release of data- POPI
Resourcing through provincial budgeting processes

© Western Cape Government 2012 |
Service responses…
22 Go to Insert > Header & Footer > Enter presentation name into footer field
Agri Worker Referral System
Career Wise Interventions for Rural Youth
1
2
3
4
5
Substance Abuse Prevention
Early Childhood Development
Rural Girl Child Mentorship
6 Skill Development- e.g. Financial literacy
Ongoing organisational support of community forums 7

WCDoA’s Agricultural Economic Services support:
Ethical Trade Compliance

© Western Cape Government 2012 |
Why Wine Ethical Trade Programme
24 Go to Insert > Header & Footer > Enter presentation name into footer field
0
10
20
30
40
50
60
0
100
200
300
400
500
600
199
1
199
2
199
3
1994
199
5
199
6
199
7
199
8
199
9
200
0
200
1
200
2
200
3
200
4
200
5
200
6
200
7
2008
200
9
201
0
201
1
201
2
201
3
201
4
201
5
201
6
% S
ha
re
Vo
lum
e (
mil
litre
s)
Export Volume Export as % of Harvest

© Western Cape Government 2012 |
Why Wine Ethical Trade Programme
25 Go to Insert > Header & Footer > Enter presentation name into footer field
0
200
400
600
800
1 000
1 200
1 400
1 600
1 800
Ra
nd
Mill
ion
s

© Western Cape Government 2012 |
WIETA Progress
26 Go to Insert > Header & Footer > Enter presentation name into footer field
Dec
2012
Dec
2013
Dec
2014
Dec
2015
Dec
2016
April
2017
July
2017
Membership 490 776 1116 1401 1427 1479 1485
Audited 165 347 730 1046 1123 1157 1144
Certified
*
126 203 367 735 976 1047 907

© Western Cape Government 2012 |
WIETA Progress
27 Go to Insert > Header & Footer > Enter presentation name into footer field
72 29
108
302 258
51
820
0
100
200
300
400
500
600
700
800
900
2012 2013 2014 2015 2016 2017 Total
Wines
WINES APPROVED FOR
FAIR LABOUR SEAL

© Western Cape Government 2012 | 28 Go to Insert > Header & Footer > Enter presentation name into footer field

© Western Cape Government 2012 |
WIETA Progress
29 Go to Insert > Header & Footer > Enter presentation name into footer field
Year Agri-workers trained
2014 1462
2015 1741
2016 1521
TOTAL 4724
Training modules & Development of Material
In Introduction to Ethical Trading and Code,
Occupational Health and Safety,
Chemical Handling,
Committee Training,
Labour Law

© Western Cape Government 2012 |
WIETA Progress
30 Go to Insert > Header & Footer > Enter presentation name into footer field
WCDoA:
Human Capital Development Response

© Western Cape Government 2012 |
Agricultural Partnership for Youth Development (APFYD)
32 Go to Insert > Header & Footer > Enter presentation name into footer field
APFYD emanated from end 2013 agr-worker protests to respond to the recommendations of
the FARE process of skills development, and employment
Focus was especially rural youth/agri-worker children but later expanded to include all youth I
the Province
Progress
Partnerships ( MOU’s) with farmers as host-employers to serve as mentors, make available their
farms for workplace experience

© Western Cape Government 2012 | 33 Go to Insert > Header & Footer > Enter presentation name into footer field
Xkjcnlaknc

© Western Cape Government 2012 |
Agricultural Partnership for Youth Development (APFYD)
34 Go to Insert > Header & Footer > Enter presentation name into footer field
Agri Worker Census 2016
Rural Development Farmworker (Agriworker) Census: Across all 5 districts i.e. Cape
Winelands, Cape Metro, Central Karoo, Eden, West Coast – indicate a 15-66 % youth
unemployment
Cape Winelands and West Coast highest rate of incomplete matric- needs training
programmes to bridge the lack of a matric qualification. Learnership and accredited
short courses that can lead to a qualification could go a long way in filling this gap
Cape Metro of concern- highest matric rate , yet highest matric unemployment- need
for more specialised training- offering career guidance, exposure to Agriculture as
possible career through internships and bursaries can provide possible opportunities
for youth
© Western Cape Government 2012 |
Agricultural Partnership for Youth Development (APFYD)
35 Go to Insert > Header & Footer > Enter presentation name into footer field
Though project has received provincial , national, and international recognition
Recognised by CPSI for entry in the World Government Summit 2018 Innovation- Observatory
of Public Sector Innovation, it must be expanded to address the increasing youth
unemployment especially in the critical areas mentioned.

Questions and Answers

© Western Cape Government 2012 |
Enkosi
Thank you
Dankie