Providing support for the use of analogies in demand forecasting tasks
14
Providing support for the use of analogies in demand forecasting tasks Wing Yee Lee a , Paul Goodwin a, ⁎ , Robert Fildes b , Konstantinos Nikolopoulos c , Michael Lawrence d a School of Management, University of Bath, Bath, BA2 7AY, United Kingdom b Department of Management Science, Lancaster University Management School, LA1 4YX, United Kingdom c Decision Sciences and Operations Management Group, Manchester Business School, Booth Street East, Manchester, M15 6PB, United Kingdom d School of Information Systems, Technology and Management, University of New South Wales, Sydney 2052, Australia Abstract Management judgment is widely used to adjust statistical forecasts in order to take into account special events, such as sales promotions. There is evidence that forecasters often use information from analogous events from the past to help to estimate the effects of an anticipated special event. Unaided forecasters using such an approach may suffer from errors in recall, difficulties in making judgments about similarity, and difficulties in adapting the information from analogous events to match the attributes of the anticipated event. We conducted an experiment to investigate whether a forecasting support system (FSS), which provided users with guidance on similarity judgments and support for adaptation judgments, could lead to more accurate forecasts of the effects of sales promotions. The experiment suggested that a simple, easily implemented form of adaptation support could significantly improve forecast accuracy under some conditions. The support is also likely to be acceptable to potential users. © 2007 International Institute of Forecasters. Published by Elsevier B.V. All rights reserved. Keywords: Judgmental forecasting; Forecasting by analogy; Forecasting support system; Sales promotions 1. Introduction Research over the last 25 years has shown that judgmental adjustments to statistical forecasts can improve accuracy under appropriate conditions (Goodwin, 2002). In particular, judgment can be valuable when the forecaster has access to important information about a forthcoming event that cannot be used in a statistical model (Sanders & Ritzman, 2001). A typical event in sales forecasting would be a sales promotion campaign. Quantitative data on the effects of such campaigns might be scarce because of their infrequency or their diverse nature. In addition to improvements in accuracy, judgmental adjust- ments may also give forecasters a sense of ownership of the forecasting process, and they may value the opportunity to apply their expertise. This is likely to International Journal of Forecasting 23 (2007) 377 – 390 www.elsevier.com/locate/ijforecast ⁎ Corresponding author. E-mail address: [email protected] (P. Goodwin). 0169-2070/$ - see front matter © 2007 International Institute of Forecasters. Published by Elsevier B.V. All rights reserved. doi:10.1016/j.ijforecast.2007.02.006
-
Upload
wing-yee-lee -
Category
Documents
-
view
215 -
download
2
Transcript of Providing support for the use of analogies in demand forecasting tasks

sting 23 (2007) 377–390www.elsevier.com/locate/ijforecast
International Journal of Foreca
Providing support for the use of analogies indemand forecasting tasks
Wing Yee Lee a, Paul Goodwin a,⁎, Robert Fildes b,Konstantinos Nikolopoulos c, Michael Lawrence d
a School of Management, University of Bath, Bath, BA2 7AY, United Kingdomb Department of Management Science, Lancaster University Management School, LA1 4YX, United Kingdom
c Decision Sciences and Operations Management Group, Manchester Business School,Booth Street East, Manchester, M15 6PB, United Kingdom
d School of Information Systems, Technology and Management, University of New South Wales, Sydney 2052, Australia
Abstract
Management judgment is widely used to adjust statistical forecasts in order to take into account special events, such as salespromotions. There is evidence that forecasters often use information from analogous events from the past to help to estimate theeffects of an anticipated special event. Unaided forecasters using such an approach may suffer from errors in recall, difficultiesin making judgments about similarity, and difficulties in adapting the information from analogous events to match the attributesof the anticipated event. We conducted an experiment to investigate whether a forecasting support system (FSS), whichprovided users with guidance on similarity judgments and support for adaptation judgments, could lead to more accurateforecasts of the effects of sales promotions. The experiment suggested that a simple, easily implemented form of adaptationsupport could significantly improve forecast accuracy under some conditions. The support is also likely to be acceptable topotential users.© 2007 International Institute of Forecasters. Published by Elsevier B.V. All rights reserved.
Keywords: Judgmental forecasting; Forecasting by analogy; Forecasting support system; Sales promotions
1. Introduction
Research over the last 25 years has shown thatjudgmental adjustments to statistical forecasts canimprove accuracy under appropriate conditions(Goodwin, 2002). In particular, judgment can bevaluable when the forecaster has access to important
⁎ Corresponding author.E-mail address: [email protected] (P. Goodwin).
0169-2070/$ - see front matter © 2007 International Institute of Fdoi:10.1016/j.ijforecast.2007.02.006
orecaste
information about a forthcoming event that cannot beused in a statistical model (Sanders & Ritzman,2001). A typical event in sales forecasting would be asales promotion campaign. Quantitative data on theeffects of such campaigns might be scarce because oftheir infrequency or their diverse nature. In additionto improvements in accuracy, judgmental adjust-ments may also give forecasters a sense of ownershipof the forecasting process, and they may value theopportunity to apply their expertise. This is likely to
rs. Published by Elsevier B.V. All rights reserved.

378 W.Y. Lee et al. / International Journal of Forecasting 23 (2007) 377–390
increase the acceptability of the adjusted forecastsrelative to those derived solely from a statisticalmethod (Lawrence, Goodwin, & Fildes, 2002; Taylor& Thomas, 1982). Both of these benefits highlightthe importance of researching the effects of judg-mental adjustment in sales forecasting.
The conditions favouring judgmental adjustmenthave been investigated in a number of studies (e.g.Willemain, 1989, 1991), as have methods for encour-aging forecasters to adjust only when these conditionsapply (e.g. Goodwin, 2000). However, the question ofhow forecasters can be supported in their task ofestimating the size of adjustments has largely beenunexplored by researchers (Fildes, Goodwin, &Lawrence, 2006). Three exceptions are the papers byWolfe and Flores (1990), Flores, Olson, and Wolfe(1992) and Webby, O'Connor, and Edmundson(2005), which all investigated the merits of decom-posing the judgmental adjustment task.
An intuitively reasonable principle of any judgmentalsupport method is that it is more likely to be acceptable ifit accords with the user's natural thinking processes. Oneapproach to estimation that people appear to use naturallyis comparisons with analogies. For example, in anexperiment which required people to forecast the demandfor a product in periods when it was being promoted,Goodwin and Fildes (1999) found evidence that theforecasters identified the past promotion that had themostsimilar expenditure and used the sales associatedwith thispromotion as a basis for their forecast. Hoch and Schkade(1996) found similar ‘pattern matching’ tendencies in aforecasting task involving the credit rating of loanapplicants, while McIntyre, Achabal, and Miller (1993),in a field study, observed the use of analogies by expertbuyers at specialty and department stores when theyforecasted the effects of promotions. In addition, our ownobservations of sales forecastingmeetings in supply chaincompanies have found that forecasters commonly searchfor past circumstances analogous to those which willprevail in the forecasting period in order to establish abasis for their judgmental forecasts. For instance, theforecasters of a beverage company used themonthly salesrelated to a previous similar sport tournament as areference for the forecast of the sales in the month whenan upcoming football championship was to take place.
Despite their apparent widespread use by fore-casters, there are reasons to doubt the efficacy of aninformal use of analogies. First, the forecaster may
have to recall similar cases (e.g. the most similarpromotion campaigns) from memory and judge theirsimilarity to the target case. Second, limitations inhuman information processing capacity may mean thatthe forecaster relies on a single recalled case. Finally,the forecaster will have to adapt the outcome of thepast case to take into account the aspects of the targetcase that are different. These difficulties suggest that aforecasting support system (FSS) may be effective inimproving the accuracy of judgments if it includesfeatures which: 1) reduce the demands on memory, 2)provide guidance on similarity, and 3) provideinformation to support adaptation judgments.
In this paper we report on an experiment thatinvestigated the effectiveness of providing variouslevels of support for the use of analogies in salesforecasting. Analogies, in the form of similar promo-tion campaigns, were provided to help forecastersdetermine how much they should adjust statisticalsales forecasts to take into account the effects offorthcoming promotions. We first review previouswork related to the cognitive process underlyingForecasting by Analogy (FBA) in sales forecasting.Next, we explore the issues related to the variousstages of FBA. We then describe and explain thedesign of the forecasting support system that wasdeveloped, and our research hypotheses. We nextdescribe the experiment and findings. Finally, weconsider the limitations of this research and itsimplications for future research and for practitioners.
2. Literature review
The concept of applying analogues to reasoning hasbeen explored in many research fields, includingpsychology, artificial intelligence and decision supportsystems. Labels for the concept have varied according tothe research tradition and the applications of theanalogues. In psychology, it is termed ‘patternmatching’,and is found to be a basic component of many humancognitivemodels (Lindsay&Norman, 1977). In artificialintelligence, it is known as Case-based Reasoning(CBR), and many expert systems have been built toemulate or assist people such as chefs (to create recipes)and architects (to design buildings) (Kolodner, 1993).
Surprisingly, relatively few applications of analo-gies in forecasting have been reported. Duncan et al.(2001) applied the approach to time series forecasting,

379W.Y. Lee et al. / International Journal of Forecasting 23 (2007) 377–390
while Nikolopoulos, Goodwin, Patelis, and Assim-akopoulos (2007) used it to forecast TV audienceratings (in this application the process was referred toas 'nearest neighbour analysis'). McIntyre et al. (1993)constructed an expert system, based on the use ofanalogies by buyers in specialty and department stores,to forecast the effects of sales promotions. However,all these studies either used an algorithm to deriveforecasts from the analogies or formalised thejudgmental process in an expert system, and theresulting forecasts were obtained without interactionwith the forecaster. Only Green and Armstrong (2004),who investigated analogies in forecasting the out-comes of conflicts, and Hoch and Schkade (1996),who applied it to loan applicant credit rating forecasts,considered how the judgmental process associatedwith analogies could be supported.
What are the support needs of forecasters whoemploy analogies? After interpreting the target situation,the process of using analogies to produce forecasts islikely to involve three stages: i) recall, ii) similarityjudgments and iii) adaptation judgments. When con-fronted with a forecasting task, the forecaster first needsto recall some past cases, then to judge how suitable eachcase is as a reference for the target case. The suitability islikely to be determined by how similar the past case is tothe target. Finally, when one or several cases are selected,the forecaster needs to adapt the outcomes of these casesaccording to the differences between them and the targetcase, in order to determine the final forecast value. Ateach of these stages cognitive limitationsmay reduce theaccuracy of the judgments made.
A number of issues are related to the unaidedforecaster's ability to recall analogous past cases. First,human memory limitations may mean that only a smallsample of past cases may be recalled. Second, thedetails of these cases may be recalled incorrectly. Ourmemory is organised based on differences betweenincidents and norms (Schank, 1982); the more‘unusual’ the case is, the more likely we are toremember it, and hence recall it. Other incidents maybecome blended and turned into more abstract rules.Such phenomena might be particularly common fordecision makers with years of experience, as is shownin the review by Klein and Calderwood (1988). Third,the manner in which cases are recalled may hamper therecollection of the most suitable cases (Gentner, 1989).Klein and Calderwood argue that old cases are often
recalled serially, as opposed to concurrently, based onfamiliarity. The goal is to satisfy (i.e. find past casesthat are ‘good enough’), rather than to optimise. If thisalso applies to sales forecasting using FBA, it wouldmean that forecasters might not apply the mostappropriate cases.
One obvious way to reduce some of these limitationsof memory is to provide a database of past cases (we referto this as memory support). Hoch and Schkade (1996)found that this support significantly improved forecastaccuracy when the task involved a high level ofpredictability (i.e. low levels of noise). However, theprovision of memory support significantly reducedaccuracy when the task involved a low level ofpredictability. It seems that the forecasters may havematched the target case with just a single case from thedatabase, and failed to appreciate its limited value whenthe predictability was low.
This over-reliance on a single case might be able to bereduced if the support system automatically selected andhighlighted several similar cases from the database (werefer to this as similarity support). In relatively unpredict-able environments (i.e. where there are high levels ofnoise), the diversity of the outcomes associatedwith thesesimilar cases should bring the lack of diagnosticity of anindividual case to the forecaster's attention. Indeed, Hochand Schkade found that requiring forecasters to focus onan ‘average’ of past cases, rather a specific past case, led toimproved forecasts in an unpredictable environment(while yielding the same level of performance in apredictable environment). In their research into forecast-ing in conflict situations, Green and Armstrong (2004)also found that forecasters who invoked several analogiesmade more accurate forecasts.
However, similarity support offers other potentialbenefits. First, when a sales promotion has severalattributes (e.g. duration, type, time of year, location), thejudgment ofwhich past promotions aremost similar to thetarget case may be a difficult one (Gentner, 1989;Holyoak, 1985). For example, cognitive limitations maymean that the forecaster simply searches for cases that areidentical to the target case on just one or two attributes andignores the effects of the other attributes (this would beanalogous to theway decisionmakersmake choiceswhenconfronted with options that possess multiple attributes,see Goodwin &Wright, 2004). Second, similar cases thatare selected automatically are likely to have severalattributes which are identical or similar to those of the
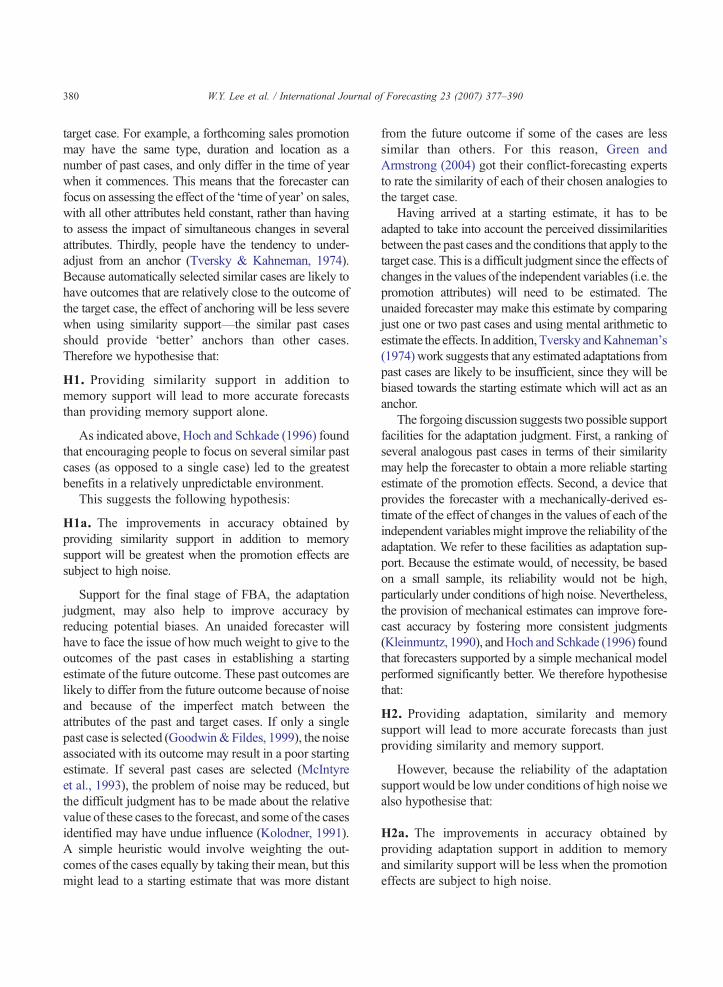
380 W.Y. Lee et al. / International Journal of Forecasting 23 (2007) 377–390
target case. For example, a forthcoming sales promotionmay have the same type, duration and location as anumber of past cases, and only differ in the time of yearwhen it commences. This means that the forecaster canfocus on assessing the effect of the ‘time of year’ on sales,with all other attributes held constant, rather than havingto assess the impact of simultaneous changes in severalattributes. Thirdly, people have the tendency to under-adjust from an anchor (Tversky & Kahneman, 1974).Because automatically selected similar cases are likely tohave outcomes that are relatively close to the outcome ofthe target case, the effect of anchoring will be less severewhen using similarity support—the similar past casesshould provide ‘better’ anchors than other cases.Therefore we hypothesise that:
H1. Providing similarity support in addition tomemory support will lead to more accurate forecaststhan providing memory support alone.
As indicated above, Hoch and Schkade (1996) foundthat encouraging people to focus on several similar pastcases (as opposed to a single case) led to the greatestbenefits in a relatively unpredictable environment.
This suggests the following hypothesis:
H1a. The improvements in accuracy obtained byproviding similarity support in addition to memorysupport will be greatest when the promotion effects aresubject to high noise.
Support for the final stage of FBA, the adaptationjudgment, may also help to improve accuracy byreducing potential biases. An unaided forecaster willhave to face the issue of how much weight to give to theoutcomes of the past cases in establishing a startingestimate of the future outcome. These past outcomes arelikely to differ from the future outcome because of noiseand because of the imperfect match between theattributes of the past and target cases. If only a singlepast case is selected (Goodwin&Fildes, 1999), the noiseassociated with its outcome may result in a poor startingestimate. If several past cases are selected (McIntyreet al., 1993), the problem of noise may be reduced, butthe difficult judgment has to be made about the relativevalue of these cases to the forecast, and some of the casesidentified may have undue influence (Kolodner, 1991).A simple heuristic would involve weighting the out-comes of the cases equally by taking their mean, but thismight lead to a starting estimate that was more distant
from the future outcome if some of the cases are lesssimilar than others. For this reason, Green andArmstrong (2004) got their conflict-forecasting expertsto rate the similarity of each of their chosen analogies tothe target case.
Having arrived at a starting estimate, it has to beadapted to take into account the perceived dissimilaritiesbetween the past cases and the conditions that apply to thetarget case. This is a difficult judgment since the effects ofchanges in the values of the independent variables (i.e. thepromotion attributes) will need to be estimated. Theunaided forecaster may make this estimate by comparingjust one or two past cases and using mental arithmetic toestimate the effects. In addition, Tversky andKahneman's(1974) work suggests that any estimated adaptations frompast cases are likely to be insufficient, since they will bebiased towards the starting estimate which will act as ananchor.
The forgoing discussion suggests two possible supportfacilities for the adaptation judgment. First, a ranking ofseveral analogous past cases in terms of their similaritymay help the forecaster to obtain a more reliable startingestimate of the promotion effects. Second, a device thatprovides the forecaster with a mechanically-derived es-timate of the effect of changes in the values of each of theindependent variables might improve the reliability of theadaptation. We refer to these facilities as adaptation sup-port. Because the estimate would, of necessity, be basedon a small sample, its reliability would not be high,particularly under conditions of high noise. Nevertheless,the provision of mechanical estimates can improve fore-cast accuracy by fostering more consistent judgments(Kleinmuntz, 1990), andHoch and Schkade (1996) foundthat forecasters supported by a simple mechanical modelperformed significantly better. We therefore hypothesisethat:
H2. Providing adaptation, similarity and memorysupport will lead to more accurate forecasts than justproviding similarity and memory support.
However, because the reliability of the adaptationsupport would be low under conditions of high noise wealso hypothesise that:
H2a. The improvements in accuracy obtained byproviding adaptation support in addition to memoryand similarity support will be less when the promotioneffects are subject to high noise.

381W.Y. Lee et al. / International Journal of Forecasting 23 (2007) 377–390
The effectiveness of any form of support will, in part,be dependent on its acceptability to forecasters (Taylor &Thomas, 1982). The acceptability of new technologies topotential users has been the subject of much research, anda number of a number of alternative explanations havebeen proposed (e.g. Ajzen, 1991; Davis, Bagozzi, &Warshaw, 1992; Thompson, Higgins, & Howell, 1994;Venkatesh&Davis, 2000). Venkatesh,Morris, Davis, andDavis (2003) have sought to unify these competingexplanations in a model called the Unified Theory ofAcceptance and Use of Technology (UTAUT). Thismodel distinguishes between users' intentions to use anew information technology and actual usage. Userintentions are determined by: i) performance expectancy(the degree to which an individual believes that usingthe system will help to bring gains in job performance),ii) effort expectancy (the degree of ease associated withusing the system), and iii) social influence (the extent towhich the individual believes that ‘important others’believe that he or she should use the new system). TheUTAUT also suggests that the effect of thesedeterminants on users' intentions is moderated by age,gender and experience. User intentions have a directeffect on actual usage when the individual believes thatan organizational and technical infrastructure exists tosupport the use of the system.
Social influence is not tested in the current study.Performance expectancy is likely to be greater if thepotential user sees the support as being transparent,intuitively reasonable and relevant to the task (Yates,Veinott, & Patalano, 2003). Since the proposed supportsystem is designed to support the natural cognitiveprocess of forecasters in an intuitively reasonable andtransparent way, performance expectancy is likely to begreater if more stages in this process are supported.However, supporting more stages of the process is likelyto require more effort on behalf of the user, thus raisingeffort expectancy. The degree of acceptance of the supportsystem will therefore depend upon whether the perfor-mance expectancy of the user is sufficient to outweigh theincreased effort expectancy (Payne, Bettman, & Johnson,1993). Given that a key principle of the support system'sdesign was to produce a simple and user-friendlyinterface, we hypothesize that:
H3. The level of acceptance of the FSS will bepositively associated with the number of stages of theFBA process that it supports.
3. Research design
A laboratory experiment was conducted to test thehypotheses. The experiment employed a simulation of asales forecasting task. For the simulation, forecasters tookon the role of manufacturers who needed to forecast thesales of products they distribute to supermarkets, whichrun sales promotion campaigns. The forecasts requiredwere the estimated additional sales at the supermarkets inthe month during which a promotion took place (i.e. thesales that were extra to the ‘baseline’ sales that wouldhave applied had there not been a promotion). RealBritishstore names were used for the supermarkets to increasethe realism of the task. The forecasters were 54undergraduate and postgraduate students from themanagement schools at the universities of Bath andLancaster. Each participant received a £5 as a reward fortaking part, and the 50% of students who made the mostaccurate forecasts in their groupswere given an additional£5. Remus (1986) foundmanagement students to be goodproxies for real managers in an experiment involvingproduction scheduling decisions.
The participants produced their forecasts using acomputerised forecasting support system (FSS) whichhad certain facilities available depending on theexperimental treatment. An example of an interfacefor one of the treatments is shown in Fig. 1. Alltreatments had certain common features. First, foreach forecast, there was a description of the forth-coming promotion. Second, the baseline ‘forecast’ forthe product in the forecast period was presented, andthe forecasters were informed that their ‘experience’suggested that this forecast was a reliable indicator ofbaseline sales. The third common feature was a pair ofinput textboxes where the forecaster entered a forecastof the additional sales resulting from the promotion.One of the input boxes was in units, and the other inpercentages (i.e. the additional sales as a percentage ofthe baseline ‘forecast’). The forecasters could entertheir forecast in either format, and the correspondingvalue in the other format would automatically bepresented in the other textbox. This feature wassuggested by several participants in a pilot study. Thefinal common feature was a simple calculator thatcould handle addition, difference, multiplication anddivision. This was built in to the system so thatforecasters' cognitive load was reduced, and becausethe forecasters at the companies we visited often used

Fig. 1. Interface for memory support (Level 1).
382 W.Y. Lee et al. / International Journal of Forecasting 23 (2007) 377–390
calculators along with their forecasting supportsystems.
The experiment was a 3 (support level)×2 (noiselevel)×2 (promotional model type) factorial design.The forecasters were randomly assigned to one of thethree support levels. The noise and promotion modeltype factors were within-subject variables.
3.1. Support levels
Forecasters in Level 1 received only memory supportin the form of a database of 30 past promotions for agiven product, as in Hoch and Schkade's (1996) study(see Fig. 1). This was presented in two pages, andprovided information on the month when the promotiontook place, its duration and type, the store that wasrunning it, the estimated baseline sales for the monthwhen it took place, and the estimated extra sales that it
achieved, expressed both as an absolute value and as apercentage of the baseline sales.
Level 2 forecasters received support for bothmemoryand similarity judgments. The interface was the same asthat for Level 1, but also included the presentation of atable giving details of the three promotions in thedatabase that were the most similar to the upcomingpromotion (i.e. the target case) (see Fig. 2). These werepresented in order of similarity.
To identify the most similar promotions, or in otherwords, the past cases that were most likely to have theclosest promotion effects, a hierarchical rule systemwasapplied. First of all, the number of matching promotionattributes (i.e. duration, promotion type and store) wasestablished between each past case and the target case.Similar attribute alternatives, such as ‘Tesco’ and‘Sainsburys’ for store, were used as proxies for eachother. The greater the number of matching attributes, the

Fig. 2. Interface for memory and similarity support (Level 2).
383W.Y. Lee et al. / International Journal of Forecasting 23 (2007) 377–390
more similar the cases were seen to be. When there wereties in this number, in the selection of cases more weightwas placed on the similarity of the promotion type,followed by similarity of store and then similarity ofduration. This was because promotion type had the mostvaried alternatives (see Table 2), and hence was morelikely to be the key in distinguishing the similarity levelbetween cases. For instance, when two of the threeattributes of several cases were the same as those of atarget case, those with the same promotion type andstore would usually be selected over those with the samepromotion type and duration, followed by those with thesame store and duration. Of course, because of noise, the
most similar case might not turn out to have a promotioneffect as close to the forecast promotion as the second orthird most similar case.
Level 3 forecasters received support for memory,similarity judgments and adaptation judgments. Toprovide the adaptation support, the computer searchedfor pairs of cases in the relevant product's database thatdiffered in only one aspect (e.g. duration). For each pairit calculated the ratio of the percentage promotion effectsof the two cases. Finally, it calculated the mean ratio forall pairs of promotions that just differed on this aspect.For example, it might find that for a given product, onaverage, all else remaining equal, 2-week promotions

384 W.Y. Lee et al. / International Journal of Forecasting 23 (2007) 377–390
had an effect 1.5 times greater than 1-week promotions.The user could then use a simple interface (see Fig. 3) tointerrogate the computer to discover these ratios. Thissupport was designed to be easily understood in terms ofboth how the valueswere derived and how theymight beapplied, so that the feature would be acceptable to users.
3.2. Noise levels
One of two levels of noise was added to thepromotion effects. The expected absolute noise (ormean absolute deviation) for low-noise and high-noiseproductswas 5%and 15% respectively. This assumptionand the procedure used to generate the noise werederived from the study by Goodwin and Fildes (1999).
3.3. Promotional model types
The evidence and theories of the effects of salespromotions in the marketing literature are sketchy
Fig. 3. Interface for memory, similarity
and conflicting. Some are at conceptual levels, andhence no mathematical modelling is used, whileothers propose models that are too complex and maketoo many specific assumptions to be applied in thisstudy. In simulating the effects of promotions, wetherefore used data we had gathered directly fromcompanies, and information contained in papers thatwe judged to be relevant to the context of ourexperiment (e.g. Raghubir, Inman, & Grand, 2004).However, in order to broaden the extent to which thefindings could be generalised, the promotion effectswere generated for individual products from theindependent variables using either an additive or amultiplicative model. The key difference between thetwo models is that the promotion attributes of themultiplicative model interact with one another; forinstance, the effect of a ‘Buy One Get One Free’promotion is magnified more if is at Tesco super-market, rather than Somerfield. The basic structuresof the models are shown in Table 1.
and adaptation support (Level 3).

Table 2Effects used in promotion generating models
Promotionattributes
Attributealternatives
Multiplicativemodel effects
Additivemodel effects(sales units)
Duration (D) 1-week 0.25 45322-week 0.375 6800
Type ofpromotion (T)
10% off 1.6 479130% off 2.3 688840% off 3.0 89843 for 2 3.5 10,481
Buy oneget one free
4 11,979
Store (S) Somerfield 1.4 2241Waitrose 1.5 2401
Sainsbury's 2.5 4003Tesco 2.6 4163
385W.Y. Lee et al. / International Journal of Forecasting 23 (2007) 377–390
The expected baseline sales (A) of each productwas determined by first generating a random numberfrom a normal distribution with a mean of 0 andstandard deviation of 1. This value was thenmultiplied by 10,000 and added to 30,000 so thatthe average sales value was positive. These stepsensured that the expected baseline sales levels weresimilar to the sales levels of the products of thecompanies visited by the research team. Table 2shows the values of duration (D), store (S) andpromotion type (T) that were used in the models. Therelative effects of the individual promotion attributeswere the same regardless of the promotional modeltype (see Table 2). For instance, in the case of type ofpromotion, a ‘buy-one-get-one-free’ has a 14.3%greater effect than a “3 for 2” in both models. Theeffects for the additive model shown in Table 2 arebased on an expected baseline sales level (i.e. A) of8000. For a product with different average sales, theeffects were adjusted so that the promotion effectsremained proportional to the average sales.
3.4. Experimental procedure
Before carrying out the forecasting task, theparticipants were asked to read an introductorydocument to familiarise themselves with their rolesand the assumptions used in the experiment. Thiscontained a description of the relative effects of thedifferent promotion attributes. With the help of thisinformation, the relative importance of the attributes inthe promotion mix (e.g. promotion type was moreinfluential) should have been derivable from the
Table 1Models used to generate promotion effects
Multiplicativemodels
E=[A×D×(S×T−1)]+ε
Additive models E=[(D+S+T) / 8000×A]+ε
WhereE Promotion effectA Expected baseline sales for the monthD Effect of promotion duration (all promotions were
assumed to take place within a given month)S Effect of storeT Effect of promotion typeε Noise on promotion effect
database. This ensured that even the forecastersreceiving the Level 1 treatment had the opportunityto assess the similarity of past promotions to the targetcase. The forecasters then had a practice session thatinvolved making forecasts for four trial products. Aftermaking the forecast in each trial they received outcomefeedback which told them what the actual sales levelwas. This information was conveyed both in absoluteunits and as the percentage by which sales hadexceeded the system baseline forecast. The forecastersthen proceeded to the main experiment, whichinvolved making forecasts of the promotion effectson the sales of 12 products. Six of the productsinvolved promotion effects generated by the additivemodel, while six had effects generated by themultiplicative model. For each model there was anequal split between products which had effects subjectto high noise and those subject to low noise.
On completion of the forecasting tasks, participantsresponded to a questionnaire that was designed to obtaininformation on their reasoning processes and their attitudeto the support they received. The first four questions,which required forecasters to rate the program on four 7-level scales, were adopted from Yang and Yoo (2004),who found cognitive attitude measures to be reliablepredictors of the usage of an information system. All foursemantic pairs were based on the seven cognitive wordpairs proposed by Crites, Fabrigar, and Petty (1994).Yang and Yoo only applied the first three in their study;the fourth pair was added in this research because they

386 W.Y. Lee et al. / International Journal of Forecasting 23 (2007) 377–390
also observed that ‘perceived usefulness’ was anothergood predictor of information system use. These were:
1. I think that the program is a wise ↔ foolishinstrument in performing the task
2. I think that the program is a beneficial ↔ harmfulinstrument in performing the task
3. I think that the program is a valuable ↔ worthlessinstrument in performing the task
4. I think that the program is very useful ↔ useless tothe task.
There were also three open questions in thequestionnaire: one related to the strategy the forecasteremployed to derive forecasts, the other two askingwhether there was anything about the program theforecaster found useful or otherwise. They were:
5. Did you have a strategy/method when making yourforecasts? If so, what was it and why? A detailedanswer to this question would be extremely useful tomy analysis.
6. What features of the program did you findobstructive/annoying in carrying out your task?
7. What features of the program did you find useful incarrying out your task?
The whole process took around 40 minutes. Onsome occasions, further clarifications from participantswere requested, either verbally, immediately after theircompletion of the questionnaires, or via emails.
4. Results and analysis
4.1. Forecast accuracy
Forecasters' performance was assessed using themedian absolute percentage error (MdAPE), whichis suitable for comparing forecasting methods acrossdifferent time series. Also, unlike the mean absolutepercentage error (MAPE) this measure is not dis-torted by extreme percentage errors. As the partici-pants were not expected to forecast noise (Goodwin&Fildes, 1999; Harvey&Bolger, 1996), the MdAPEwas computed by comparing forecasts with signals(i.e. the effect of the promotion that was beingpredicted excluding noise, or E− ε in the notation ofTable 1).
The forecasts of 6 participants were excluded fromthe analysis for various reasons. For example, twoparticipants conferred during the experiment, whileanother participant's forecasts constituted an extremeoutlier, which was likely to be a result of a data entryerror. As a result, there were 17 sets of observations forLevel 1, 15 for Level 2 and 16 for Level 3.
When all the products were considered, that is,regardless of the promotional model type and the noiselevel, it was found to be appropriate to assume that theMdAPEs of the three support levels had homogenousvariances (Levene's test: p=0.870). A one-way ANOVAtest was therefore applied to test for the differencesbetween the three levels of support. This revealed thattherewas a significant difference between the three levels( p=0.025). Multiple comparisons were applied usingthe Scheffé test to determine the differences between thesupports. The Scheffé test is robust for unequal numbersof observations among groups (Bryman & Cramer,2001). It showed that, while Level 3 was significantlymore accurate than Level 1, Level 2 did not lead tosignificant improvements over Level 1. H1was thereforerejected, but there was partial support for H2 in thatmemory+similarity+adaptation support led to signifi-cantly greater accuracy than memory support alone( p=0.026). Indeed, Level 3 support led to the lowestmeanMdAPE (with themean taken across forecasters fora given product) for 8 of the 12 products.
Towhat extent was the performance of the three levelsof support conditional on the nature of the promotioneffect (i.e., whether it was generated using an additive ormultiplicative model and whether it was subject to low orhigh noise)? Further analysis revealed that that therewas asignificant interaction between Model, Noise and Levelof support ( p=0.001). Fig. 4 shows this interaction. Post-hoc pairwise comparisons showed that Level 3 supportled to forecasts that were significantly more accurate thanthose produced under the other two levels when thepromotion effect was either i) additive and subject to highnoise (Level 3 vs. Level 1, p=0.001, Level 3 vs. Level 2,p=0.041) or ii) multiplicative and subject to low noise(Level 3 vs. Level 1, pb0.001, Level 3 vs. Level 2,p=0.015). For products subject to the other promotioneffects, no significant differences were found between thelevels of support. Thus, there was no support for H1a(though Fig. 4 does show greater benefits for providingsimilarity support when noise is high, as H1a suggests)or H2a. Contrary to H2a, the increased benefits of

Fig. 4. Interaction between type of support and type of promotioneffect.
387W.Y. Lee et al. / International Journal of Forecasting 23 (2007) 377–390
Table 3Variation in participants' forecasts
Support Mean of standard deviations of forecasts
Memory 12,430Memory+similarity 10,897Memory+similarity+adaptation
8811
additionally providing adaptation support were notalways negated when noise was high. These benefitswere conditional on whether the promotion effect wasadditive or multiplicative. In summary, providingmemory+similarity+adaptation support appears tocarry no risks of harming forecasting accuracy andunder some conditions it appears to produce significantlymore accurate forecasts.
4.2. User acceptance
Forecasters' responses to the four rating questionsin the post-experiment questionnaire were used to testH3, that greater level of support would increase thelikelihood that the support system would be acceptedby users. As the responses were highly skewed evenafter logarithmic transformation, the nonparametricKruskal–Wallis Test was applied to see if there weresignificant differences in the attitudes of respondentsdepending on the level of support they received.Significant differences (at pb0.05) were found for allfour ratings. The median test revealed that a higherproportion of forecasters receiving Level 3 supportrated their support as being wiser and more valuable.Surprisingly, relatively more Level 2 forecasters ratedtheir support less beneficial and valuable than those ofthe other two supports. No significant correlation wasfound between forecast accuracy and attitude ratings.The findings therefore only partly support H3, in that
the higher cognitive attitude scores of Level 3indicated that it was more likely to be acceptablethan the other two support levels. However, Level 2forecasters found their support was even less accept-able than those of Level 1 forecasters. Nevertheless, itshould be noted that the median ratings for thedifferent attributes were relatively high for all thelevels of support, suggesting that none of them wouldbe unacceptable to potential users.
5. Discussion
Four main results emerge from this experiment.First, providing memory+ similarity + adaptation(Level 3) support for the use of analogies appears, ingeneral, to improve forecast accuracy. Second, pro-viding only memory+similarity (Level 2) supportdoes not appear to be beneficial. Third, the effective-ness of Level 3 support appears to be conditional onthe nature of the promotion effect. Finally, Level 3support appears to be highly acceptable to forecasters.
To try to explain these results, we first attempted todetermine the relative influence of the different levelsof support on the forecasters. We did this by comparingthe variation in the forecasts produced by the differentforecasters in each condition. For each product, thestandard deviation of the forecasts produced by theparticipants receiving a given type of support wascalculated. Table 3 shows the means of these standarddeviations for each type of support. It can be seen that,typically, there was less variation in the forecasts whenmore support was provided. Thus, it seems that thosejust receiving memory+similarity support were lessinfluenced by the system than those who also receivedadaptation support. However, the variation in theforecasts of the level 3 participants is still too high toconclude that they were simply using the ratiosmechanically.
The relatively high variation of the forecastsproduced in the memory+similarity support condition

388 W.Y. Lee et al. / International Journal of Forecasting 23 (2007) 377–390
suggests that many of the forecasters did not use thesimilarity support in the way in which it was designedto be used, that is, to only consider the three listedcases as the starting point for their forecasts. Indeed, itappears from the responses to the questionnaire thattwo-thirds of the Level 2 forecasters considered othercases (half of the Level 3 forecasters gave a similarindication).
Deviations from the intended usage of the similaritysupport might have arisen from a belief that cases otherthan those provided by the similarity support were alsorelevant, or the belief that the three similar casesdisplayed were not the most similar. Among the 18forecasters who explicitly stated that they used casesnot listed in the similarity support, 6 claimed to use the3 cases suggested, but felt that it was more beneficialto consider more cases.
Differences between subjects' approaches to asses-sing the similarity between cases and the approach thatwe used in providing similarity support might alsohave contributed to the discrepancy between theintended and actual usage of the similarity support.Twelve of the 18 forecasters stated that store orduration were their primary criterion in determiningwhether cases were similar. As none of the informationgiven to the forecasters suggested this should be thecase, these assumptions might be derived from theforecasters' own perceptions of the world. Four of theforecasters also claimed that they took into account thetime when the past promotions occurred, even thoughthey were informed explicitly that this was notrelevant. Five of the forecasters would consider onlypast cases in which a particular attribute was the same.This strategy appears to be similar to the lexicographicstrategy employed in multiattribute decision making,in that the forecasters' focus was on a single attributeof the promotion (Goodwin & Wright, 2004).
The limited use of our similarity support suggeststhat it would be worth investigating a form ofsimilarity support that was more interactive, transpar-ent, comprehensible and flexible. For example, suchsupport might include a facility to enable users to sortcases in the database. Forecasters could then search forthe most similar cases in terms of their own definitionsof similarity.
Finally, why was the effectiveness of Level 3 supportcontingent on the nature of the promotion effect? Thismay have been a combination of task difficulty and the
reliability of the ratios that were provided to support theadaptation phase— this reliability was affected by boththe noise level and the type of promotional model. Themean MdAPEs achieved by forecasters who receivedonly memory support (Level 1) (see Fig. 4) suggest thatthe forecasting difficulty of the promotion effects can beranked from the easiest to the most difficult as follows:1) additive+ low noise, 2) additive+high noise, 3)multiplicative+low noise and 4) multiplicative+highnoise. In the easiest tasks (additive+ low noise), therewas less scope for improvement. As Hoch and Schkade(1996) found, the use of a single analogous case is likelyto work well when outcomes are subject to low levels ofnoise, so there would be little advantage in presentingthree cases. Moreover, any potentially small advantageof the support was likely to be negated by the (relativelysmall) sampling errors associated with the ratioestimates. For the most difficult tasks (multiplicative+high noise), the ratios provided were relativelyinaccurate estimates of the true ratios, so the potentialbenefits of the support were lost. Thus, the support waseffective in the two ‘medium difficulty’ tasks wherethere were substantial potential improvements to begained that were not undermined by inaccurate ratioestimation.
6. Conclusions
The use of analogies for forecasting the effects ofspecial events appears to be a natural and widespreadphenomenon in company forecasting, but to date therehas been a shortage of studies in the literature whichhave investigated how the approach might be sup-ported through appropriate software design. Hoch andSchkade (1996) showed that memory support can bebeneficial, but only when the environment is relativelypredictable. In unpredictable environments it can bedamaging. The experiment reported in this paper hasshown that the provision of relatively simple addition-al facilities, alongside memory support, can lead toimprovements in accuracy under some conditions,without carrying any associated risk of damagingaccuracy in others. These additional facilities alsoappear to be acceptable to users.
There are some caveats. Simulated promotion effectswere used in order to allow the experiment to be rununder controlled conditions where the true values of theunderlying ‘signal’ were known. Tests in real time on

389W.Y. Lee et al. / International Journal of Forecasting 23 (2007) 377–390
real data in commercial environments are needed toconfirm that our findings have a practical application.Research is also needed to investigate how best todevelop and enhance the support system described here.For instance, would allowing users to select the mostsimilar cases, albeit with some guidance provided by thesystem, be more effective than providing them auto-matically? Would information on the reliability of theratios provided for adaptation support encourage usersto identify conditions where the use of the ratios is morelikely to be beneficial? Future studies will address thesequestions, and will also assess the benefits of theapproach in practical contexts. On a more general level,this study has addressed the much neglected question ofhow the determination of the size of adjustment tostatistical forecasts can be supported. More attention tothis research issue might be beneficial.
The support proposed here was not only intuitive andtransparent, and hence likely to be acceptable toforecasters, but was also easy to create. Our resultssuggest that it may well be worth including the method infuture forecasting software (more details of the softwareplatform used in this experiment are available from theauthors). Indeed, most current software systems used incompanies provide little incentive even for the creation ofa centralised record of past special events and their results.Many packages do include note functions where usersmay input details of the reasons for adjusting a certainforecast. However, these functions are often merelytextboxes where no structure is provided. This makes thesearch for the details of past events cumbersome, and thismay be particularly problematical when there are changesin forecasting personnel, as new staff may havedifficulties in making sense of sets of freeform notes.The creation of a structured database would allow theimplementation of more comprehensive FBA support,and this should have a positive effect on forecast accuracy.
Acknowledgements
This research was supported by Engineering andPhysical Sciences Research Council (EPSRC) grantsGR/60198/01 and GR/60181/01.
References
Ajzen, I. (1991). The theory of planned behavior. OrganizationalBehavior and Human Decision Processes, 50, 179−211.
Bryman, A., & Cramer, D. (2001). Quantitative data analysis withSPSS release 10 for Windows. Hove: Routledge.
Crites, S. L., Fabrigar, L. R., & Petty, R. E. (1994). Measuring theaffective and cognitive properties of attitudes — Conceptual andmethodological issues. Personality and Social Psychology Bulletin,20, 619−634.
Davis, F. D., Bagozzi, R. P., & Warshaw, P. R. (1992). Extrinsic andintrinsic motivation to use computers in the workplace. Journalof Applied Social Psychology, 22, 1111−1132.
Duncan, G. T., Gorr, W. L., & Szczypula, J. (2001). Forecastinganalogous time series. In J. S. Armstrong (Ed.), Principles ofForecasting (pp. 195–213). Boston: Kluwer Academic Publishers.
Fildes, R., Goodwin, P., & Lawrence, M. (2006). The design featuresof forecasting support systems and their effectiveness. DecisionSupport Systems, 42, 351−361.
Flores, B. E., Olson, D. L., & Wolfe, C. (1992). Judgmentaladjustments of forecasts: A comparison of methods. Interna-tional Journal of Forecasting, 7, 421−433.
Gentner, D. (1989). Finding the needle: Accessing and reasoning fromprior cases. In K. J. Hammond (Ed.), Proceedings of the DARPAworkshop on case-based reasoning, Vol. 2 (pp. 137–143). SanMateo, California: Morgan Kaufmann.
Goodwin, P. (2000). Improving the voluntary integration ofstatistical forecasts and judgment. International Journal ofForecasting, 16, 85−99.
Goodwin, P. (2002). Integrating management judgment withstatistical methods to improve short-term forecasts. Omega, 30,127−135.
Goodwin, P., & Fildes, R. (1999). Judgmental forecasts of time seriesaffected by special events: Does providing a statistical forecastimprove accuracy? Journal of Behavioral Decision Making, 12,37−53.
Goodwin, P., & Wright, G. (2004). Decision analysis formanagement judgment (3rd edition). Chichester: Wiley.
Green, K. C., & Armstrong, J. S. (2004). Structured analogies forforecasting. Monash econometrics and business statisticsworking papers, number 17/04.
Harvey, N., & Bolger, F. (1996). Graphs versus tables: Effects of datapresentation format on judgemental forecasting. InternationalJournal of Forecasting, 12, 119−137.
Hoch, S. J., & Schkade, D. A. (1996). A psychological ap-proach to decision support systems. Management Science,42, 51−64.
Holyoak, K. J. (1985). The pragmatics of analogical transfer. InG. H. Bower (Ed.), The psychology of learning and motivation(pp. 59−87). Orlando: Academic Press.
Klein, G. A., & Calderwood, R. (1988). How do people useanalogues to make decisions? In J. L. Kolodner (Ed.), Pro-ceedings of the DARPA workshop on case-based reasoning. SanMateo, California: Morgan Kaufmann.
Kleinmuntz, B. (1990). Why we still use our heads instead offormulas: Toward an integrative approach. PsychologicalBulletin, 107, 296−310.
Kolodner, J. L. (1991). Improving human decision making throughcase-based decision aiding. AI Magazine, 12, 52−68.
Kolodner, J. L. (1993). Case-based reasoning. San Mateo,California: Morgan Kaufmann.

390 W.Y. Lee et al. / International Journal of Forecasting 23 (2007) 377–390
Lawrence, M., Goodwin, P., & Fildes, R. (2002). Influence of userparticipation on DSS use and decision accuracy. Omega, 30,381−392.
Lindsay, P. H., & Norman, D. A. (1977). Human informationprocessing: An introduction to psychology. London: AcademicPress.
McIntyre, S. H., Achabal, D. D., & Miller, C. M. (1993). Applyingcase-based reasoning to forecasting retail sales. Journal ofRetailing, 69, 372−398.
Nikolopoulos, K., Goodwin, P., Patelis, A., & Assimakopoulos, V.(2007). Forecasting with cue information: A comparison ofmultiple regression with alternative forecasting approaches.European Journal of Operational Research, 180, 354−368.
Payne, J. W., Bettman, J. R., & Johnson, E. J. (1993). The adaptivedecision maker. Cambridge: Cambridge University Press.
Raghubir, P., Inman, J. J., & Grand, H. (2004). The three faces ofconsumer promotions. California Management Review, 46,23−42.
Remus, W. (1986). Graduate students as surrogates for managers inexperiments on business decision making. Journal of BusinessResearch, 14, 19−25.
Sanders, N. R., & Ritzman, L. P. (2001). Judgmental adjustment ofstatistical forecasts. In J. S. Armstrong (Ed.), Principles ofForecasting (pp. 405–416). Boston: Kluwer Academic Publishers.
Schank, R. C. (1982). Dynamic theory: A theory of reminding andlearning in computers and people. Cambridge: CambridgeUniversity Press.
Taylor, P. F., & Thomas, M. E. (1982). Short term forecasting:Horses for courses. Journal of the Operational Research Society,33, 685−694.
Thompson, R. L., Higgins, C. A., & Howell, J. M. (1994). Influenceof experience on personal computer utilization: Testing a
conceptual model. Journal of Management Information Systems,11, 167−187.
Tversky, A., & Kahneman, D. (1974). Judgment under uncertainty:Heuristics and biases. Science, 185, 1124−1131.
Venkatesh, V., & Davis, F. D. (2000). A theoretical extension of thetechnology acceptance model: Four longitudinal field studies.Management Science, 46, 186−204.
Venkatesh, V., Morris, M. G., Davis, G. B., & Davis, F. D. (2003).User acceptance of information technology: Towards a unifiedview. MIS Quarterly, 27, 425−478.
Webby, R., O'Connor, M., & Edmundson, B. (2005). Forecastingsupport systems for the incorporation of event information: Anempirical investigation. International Journal of Forecasting,21, 411−423.
Willemain, T. R. (1989). Graphical adjustment of statisticalforecasts. International Journal of Forecasting, 5, 179−185.
Willemain, T. R. (1991). The effect of graphical adjustment onforecast accuracy. International Journal of Forecasting, 7,151−154.
Wolfe, C., & Flores, B. (1990). Judgemental adjustment of earningsforecasts. Journal of Forecasting, 9, 389−405.
Yang, H. D., & Yoo, Y. (2004). It's all about attitude: Revisiting thetechnology acceptance model. Decision Support Systems, 38,19−31.
Yates, J. F., Veinott, E. S., & Patalano, A. L. (2003). Hard decisions,bad decisions: On decision quality and decision aiding. In L.Schneider & J. Shanteau (Eds.), Emerging perspectives onjudgment and decision research (pp. 13−63). New York:Cambridge University Press.