Providing flexible food portions in a restaurant setting ...
134
Providing flexible food portions in a restaurant setting: Impact on business operations, food consumption and food waste. A THESIS SUBMITTED TO THE FACULTY OF UNIVERSITY OF MINNESOTA BY Sarah Elizabeth Berkowitz IN PARTIAL FULFILLMENT OF THE REQUIREMENTS FOR THE DEGREE OF MASTER OF SCIENCE Len Marquart, Ph.D., R.D., Advisor Marla Reicks, Ph.D., R.D., Advisor April 2015
Transcript of Providing flexible food portions in a restaurant setting ...

Providing flexible food portions in a restaurant setting: Impact on business operations, food consumption and
food waste.
A THESIS SUBMITTED TO THE FACULTY OF
UNIVERSITY OF MINNESOTA BY
Sarah Elizabeth Berkowitz
IN PARTIAL FULFILLMENT OF THE REQUIREMENTS FOR THE DEGREE OF MASTER OF SCIENCE
Len Marquart, Ph.D., R.D., Advisor Marla Reicks, Ph.D., R.D., Advisor
April 2015

© Sarah Elizabeth Berkowitz 2015

i
Acknowledgements I would like to thank all the people who made this project possible. My deepest thanks to Len Marquart, Marla Reicks, Elton Mykerezi, and Dennis Degeneff for all their efforts toward this project. Thanks to all of the undergraduate students who spent many hours collecting and documenting plate waste at Patterson Dental in Mendota Heights, MN and the Town and Country Club in St. Paul, MN. I would like to thank Jeremy Figgy and the staff at Patterson dental and Mike Osten and John Kain and the staff at the Town and Country Club for partnering with us to conduct this study. I would also like to thank The Food Policy Research Center and a grant from the National Institute of Food and Agriculture for providing the funding to make this study possible. And most importantly, I would like to express my deepest appreciation to my family for their love and support throughout my graduate school career and during the writing of this thesis.

ii
Dedication
This thesis is dedicated to my B-boys.

iii
Abstract
Large portion sizes in restaurants have been identified as a public health risk.
The objectives of this study were to assess the impact of adding reduced-portion
menu items to the menu on customer selection, energy and nutrient intake, plate
waste and business operations. A field experiment was conducted to examine
the impact of offering flexible portion sizes in 2 food service environments: a
cafeteria setting and a sit-down restaurant setting in St. Paul MN. Patrons were
surveyed at the beginning and end of the study to assess current usage, dining
needs and frequency of healthful behaviors. Purchasing, consumption and food
waste data were collected throughout the study. Reduced sized portions were
added to the menus halfway through the study in the spring of 2013. The
management teams were interviewed at the completion of the study. Sales data
show that reduced-portion entrees made up 10-30% of entrée sales across both
food service environments. Energy and nutrient intakes decreased and food
waste was reduced at both locations. The management teams both reported the
added items provided higher profit margins or cost savings and improved
customer satisfaction. Both locations have implemented the menu changes
indefinitely. These outcomes could serve as the foundation for future work with
reduced-portion sized menu items in different types of restaurant settings to
promote public health.

iv
Table of Contents
Acknowledgements………………………………………….………………….........….i
Dedication……………………………………………………………………………..…ii
Abstract………………………………………………………………………………..…iii
List of Tables………………………………………………………………………..….viii
List of Appendices………………………………………………………………..…….ix
List of Abbreviations………………………………………………………………..…...x
Chapter 1: Literature Review…………………………………………………..…….1
Increased consumption of Food Away From Home (FAFH)………………..……...1 Nutritional Quality of Restaurant Meals……………………………………..………..2 Restaurant Portion Sizes……………………………………………………………….6
Menu Labeling & Public Policy……………………………………………..………….8
Portion Size and Energy Intake……………………………………………..……….14
Increased Portion Size – Lab Based – Single Occasion…………………..14
Increased Portion Size – Lab Based – Multiple Days………………….….19
Increased Portion Size – Naturalistic Environment – Single Occasion….21
Increased Portion Size – Naturalistic Environment – Multiple Day……....23
Reduced-portion Size – Lab and Naturalistic Environments……..……….25
Practicality of Reduced Size Restaurant Portions………………………………….27
Food Waste……………………………………………………………………...……..30
Reduced Restaurant Portion Sizes – Food Waste Reduction…………...……….32

v
Summary………………………………………………………………..………………33
References……………………………………………………………………..………35
Chapter 2: Objective, Hypotheses and Research Question………….………45
Chapter 3: Materials and Methods……………………………………..………….47
Overview…………………………………………………………………….………….47
Patterson Dental Materials and Methods…………………….…….……...….48
Planning/Schedule…………………………………………………………….48
Subjects…………………………………………………………..…………….49
Experimental Schedule………………………………………………………..49
Surveys……………………………………………………………...………….50
Plate Waste Collection Protocol…………………………………..…………51
Plates………………………………………………………………..………….52
Average Serving Sizes……………………………………………..…………52
Signage……………………………………………………………..…………..53
Lunch Process……………………………………………………...………….53
Waste Collection……………………………………………………..………..54
Plate Waste Measurement……………………………………………………54
Determining Plate Waste – Special Considerations……………...………..55
Amount Consumed…………………………………………….…..………….56
Nutritional Analysis…………………………………………………………….56
Management Interview………………………………………………………..56
Statistical Analysis…………………………………………..…….…………..57

vi
Town and Country Club (TCC) Materials and Methods…..………………..62
Planning/Schedule………………………………………………...…………..62
Subjects…………………………………………………………………………62
Experimental Schedule………………………………………………………..63
Surveys………………………………………………………...……………….63
Plate Waste Collection Protocol…………………………………..…………64
Meal Process……………………………………………………..……………65
Data Collection……………………………………………………..………….66
Waste Collection……………………………………………………..………..67
Plate Waste Measurement…………………………………………..……….67
Amount Consumed…………………………………………………………….67
Nutritional Analysis…………………………………………………………….68
Nutritional Analysis – Special Considerations………………………………68
Management Team Interview…………………………………………...……69
Statistical Analysis……………………………………………………………..69
Chapter 4: Results……………………………………………………………………73
Patterson Dental Results……………………………………………………...…73
Nutritional Intake and Plate Waste…………………………………………..73
Sales…………………………………………………………………...............73
Demographic Characteristics of Survey Participants……………..……….74
Survey Responses………………………………………………….…………74
Summary of Interview Results………………………………………..………76

vii
Town and Country Club Results……………………………………………..…80
Nutritional Intake and Plate Waste………………………………..…………80
Sales…………………………………………………………………..………..80
Demographic Characteristics of Survey Participants…………..………….81
Survey Responses……………………………………………...……………..81
Summary of Interview Results………………………………….…………….82
Chapter 5: Discussion………………………………………………….……………87
Selection of Reduced-Portion Menu Items………….………………………………87
Effects on Energy and Nutrient Intakes……………………………………………..89
Effects on Subsequent Food Intakes……………………………..…………………90
Effects on Plate Waste………………………………………………………………..91
Effects on Business Profitability…………………………………………….………..92
Characteristics of Reduced-Portion Buyers……………………………….………..92
Restaurant Feasibility……………………………………………………………..…..93
Strengths and Limitations…………………………………………………..…………95
Conclusions and Implications for Future Research……………………….……….96
References……....……………………………………………………………………..98
Appendices……………………………………………………………………………108

viii
List of Tables
Table 1. Patterson Dental plate waste collection schedule…………..……..59
Table 2. Patterson Dental nutritional content of mean full and half Portion entrée serving size……………………………………..…….60 Table 3. Patterson Dental test of equal proportions………………………….61 Table 4. TCC entrée components………………………………………….…..71 Table 5. TCC nutritional content of mean full and half portion entrée serving size including sides………………………………………..…72 Table 6. Patterson Dental calorie and nutrient intake by Pre-phase (only full portions available) and Post-phase (full and reduced portions available)………………………………………………….….77 Table 7. Patterson Dental Percent reduced-portion entrée sales by week…………………………………………………………..…..…77 Table 8. Patterson Dental demographic characteristics for respondents by survey phase………………………………………………………..78 Table 9. Patterson Dental demographic characteristics for post survey respondents by half portion buyer or non-buyer……………..….…78 Table 10. Patterson Dental – post-phase survey responses by half portion buyer or non-buyer………………………………………………..…...79 Table 11. TCC calorie and nutrient intake by full and reduced size portion for entrees purchased in post phase………………………...………84 Table 12. TCC Sales – number and percent of reduced-portion sized entrees prior and post intervention…………………………………..84 Table 13. TCC demographic characteristics for respondents by survey phase…………………………………………………………………....85 Table 14. TCC demographic characteristics for post-phase survey respondents by half portion buyer or non-buyer……………………86 Table 15. TCC post survey healthy behavior responses of “most of the time or always” by half portion buyer or non-buyer………………………86
ix
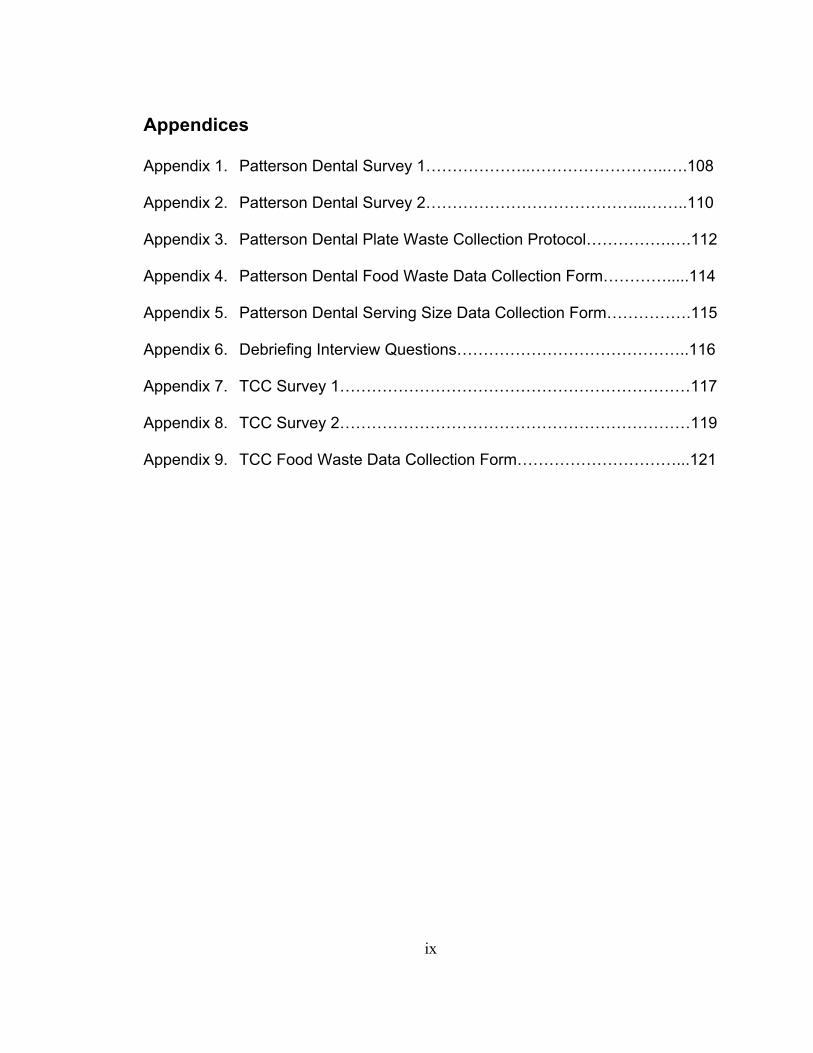
Appendices
Appendix 1. Patterson Dental Survey 1………………..……………………..….108
Appendix 2. Patterson Dental Survey 2…………………………………...……..110
Appendix 3. Patterson Dental Plate Waste Collection Protocol…………….….112
Appendix 4. Patterson Dental Food Waste Data Collection Form………….....114
Appendix 5. Patterson Dental Serving Size Data Collection Form…………….115
Appendix 6. Debriefing Interview Questions……………………………………..116
Appendix 7. TCC Survey 1…………………………………………………………117
Appendix 8. TCC Survey 2…………………………………………………………119
Appendix 9. TCC Food Waste Data Collection Form…………………………...121

x
List of Abbreviations
AFHFE: Away from home food expenditure BMI: Body mass index
BRFSS: Behavioral Risk Factor Surveillance System CDC: Centers for Disease Control and Prevention
CSFII: Continuing Survey of Food Intakes by Individuals
DHKS: Diet and Health Knowledge Survey
DRV: Dietary Reference Value EPA: Environmental Protection Agency
ERS: Economic Research Service
FAFH: Food away from home
FAO: Food and Agriculture Organization FDA: Food and Drug Administration FWRA: Food Waste Reduction Alliance HEI: Healthy Eating Index
MEPS: Medical Expenditure Panel NDSR: Nutrition Data System for Research NHANES: National Health and Nutrition Examination Survey NRDC: Natural Resources Defense Council TCC: Town and Country Club US: United States
USDA: U. S. Department of Agriculture

1
Chapter 1: Literature Review Increased consumption of Food Away From Home (FAFH) During the past 40 years, the amount of food consumed outside of the
home has increased tremendously in the United States (US).1,2,3 The National
Restaurant Association reported that restaurant industry sales have increased
from $42.8 billion dollars in 1970 to $683.4 billion dollars in projected sales for
2014.1 The percentage of food dollars spent on food away from home (FAFH)
has increased from 25.9% in 1970 to 43.1% in 2012 based on annual analysis of
US food consumption and production by the US Department of Agriculture
(USDA) Economic Research Service (ERS).2 Data from a flexible consumer
behavior survey conducted by USDA showed that more than 80% of individuals
ate at least one meal prepared away from home weekly and roughly 25% of
individuals consumed 5 or more meals prepared away from home weekly.3
Concurrent with the increased consumption of FAFH has been a rise in
the obesity rates of Americans. According to the Centers for Disease Control and
Prevention (CDC), an adult with a Body Mass Index (BMI) [weight (kg)/(height
(m))2] between 25 and 29.9 is considered overweight and an adult with a BMI
above 30 is considered obese.4 Children are considered overweight if their BMI
is between the 85th and 95th percentile and obese if they exceed the 95th
percentile for children of the same age and gender.5

2
A 2014 analysis of data from the 2011-2012 National Health and Nutrition
Examination Survey (NHANES) indicates that 68.5% of American adults are
overweight or obese.6 Almost 35% of adults and 17% of children and adolescents
are considered obese.6 Obesity rates have risen dramatically in recent decades,
more than doubling for adults and children 6-11 years6,7,8 and quadrupling for
adolescents since 1980.6,8
Obesity has become a public health crisis in America. Being overweight or
obese is a risk factor for many diseases and conditions, including type 2
diabetes, hypertension, coronary heart disease, stroke, dyslipidemia, liver and
gallbladder disease, sleep apnea, osteoarthritis and certain types of cancer.9,10
Analysis of data from 1998 and 2006 Medical Expenditure Panel Surveys
(MEPS) found that health problems related to obesity are costing Americans over
$147 billion dollars annually.11
Because the rise in obesity has paralleled the rise in FAFH consumption,
numerous studies have investigated both the nutritional quality of restaurant
foods12,13,14,15,16,17,18,19,20,21 and the portion sizes of restaurant foods22,23,24,25,26,27
to determine the impact these factors have on rising obesity rates.
Nutritional Quality of Restaurant Meals Numerous studies have examined the nutritional quality of FAFH and have
found FAFH to be high in calories and nutrients of concern and associated with
reduced diet quality and increased obesity in adults.12,13,14,15,16,17,18,19,20,21

3
McCrory et al. (1999)12 examined food frequency questionnaires for 73
healthy adult men and women Frequency of food consumption from 7 different
types of restaurants (pizza, Mexican, burger, Chinese, fried chicken, fried fish
and “other”) was measured. Body fatness was associated with greater frequency
of restaurant food consumption. Because of the small sample size, it is unclear if
this association is representative of adults nationally. Therefore, a number of
studies have utilized national survey data to examine the association of FAFH
consumption with diet quality and obesity.13,14,15,16,17,18
An examination of the changes in FAFH frequency and diet quality utilizing
data for individuals over 2 years from USDA’s 1977-78 and 1994-1996
Continuing Survey of Food Intakes by Individuals (CSFII) found that calories from
FAFH increase from 18% to 32% of total calories.13 FAFH was also higher in
calories, fat, and saturated fat and lower in fiber, calcium and iron than meals
prepared at home.
A 2004 study focusing on the impact of fast food intake on diet quality
was based on data analysis for adults over 20 years from the USDA’s 1994-1996
CSFII.14 Those who reported eating fast food consumed significantly higher
amounts of calories, fat, saturated fat, carbohydrates, sugar and protein than
those who did not consume fast food. They also reported lower consumption of
fruits and dairy and lower intakes of calcium, magnesium, vitamin A, and vitamin
C.

4
Kant et al. (2004)15 examined the impact of commercially prepared food
on diet quality using data from adults over age 18 from the 1997 and 1999
National Health Interview Survey and the 1999-2000 NHANES. Results showed
an increase in the frequency of eating commercially prepared food. They also
found a positive association between BMI and the number of commercially
prepared meals consumed (p<0.0001).
A 2008 study analyzed dietary data for US adults aged 20-65 from the
1994-96 CSFII and the CSFII/Diet and Health Knowledge Survey (DHKS).16
Increased away-from-home food expenditures (AFHFE) were associated with
lower diet quality measures, such as increased fat and saturated fat, lower levels
of fiber and lower Healthy Eating Index (HEI) scores. The HEI is a measure of
diet quality assessing adherence to the 2010 Dietary Guidelines for
Americans.28,29
A more recent study compared dietary intake data for adults over age 20
on 2 non-consecutive days from the 1994-96 CSFII and 2003-04 NHANES to
examine how changes in the number of meals eaten outside the home impact
dietary quality. Mancino et al (2009)17 Greater intakes of FAFH increased calorie,
saturated fat and sodium intakes as compared to meals consumed at home.
Each meal consumed outside of the home added an additional 130 calories on
average to the daily total intake and decreased HEI scores by 2 points. The
additional calories were estimated to add about 2 pounds each year. A
subsequent study extended this analysis to examine the effect of FAFH on fruit,

5
vegetable and whole grain intakes.18 Eating out reduced the dietary density of
fruit in the diet by 15.5-22.3%, whole grain by 12.2 – 26.4%, dairy by 8.6 –
11.8%, and total vegetables by 8.7%.
In addition to the studies analyzing survey data, recent studies19,20,21
have also examined the nutritional quality of restaurant meals by analyzing the
nutritional information provided by restaurants. Two studies conducted by Wu
and Sturm (2012, 2013)19,20 examined the nutritional quality of foods served in
the top chain restaurants in the US based on a list of the top 400 restaurant
chains by Restaurants and Institutions magazine. The first study19 was
conducted prior to the passage of the Affordable Care Act,30 requiring national
nutrition labeling. Nutrition information was collected for 245 restaurants chains,
via website or e-mail request. While the majority of the entrees (without sides)
were within one third of the USDA’s estimated adult energy needs of 2000
calories/day, most were high in sodium, fat and saturated fat. Overall, 96% of the
entrees exceeded the USDA guidelines for calories, fat, sodium and/or saturated
fat.
A follow-up study conducted within one-year passage of the Affordable
Care Act,30 examined changes in the energy and sodium content of menu
offerings.20 Utilizing the same list of the top 400 restaurants, nutrition information
was collected for 213 restaurant chains. While many restaurants had made menu
changes during the year, evidence of improved nutritional quality was not found.

6
New menu items tended to be equally high in calories and sodium as the items
they replaced.
A similar study21 examined the menus of 21 full-service restaurant chains
in the Philadelphia area after the passage of local menu labeling legislation.31 A
total of 2,615 menu items, including appetizers, entrees, side dishes, desserts
and a variety of drinks were analyzed for energy and nutrient content. Meals
consisting of an entrée and sides along with half of an appetizer averaged 1,495
calories, 28 grams (g) saturated fat, 3,312 milligrams (mg) sodium, and 11 g
fiber. Adding a nonalcoholic drink and one-half of a dessert added a mean of
2,020 calories, 39 g saturated fat, 3,760 mg sodium and 12 g fiber. In addition,
menu items labeled as “healthy choices” were only found on half of the menus
and the number of choices was limited.
These studies show that eating FAFH is associated with higher caloric
intake as well as higher intakes of fat and saturated fat and lower intakes of
vegetables, fruits, whole grains and other key nutrients. While it may be possible
to find healthy options at some restaurants; the majority of FAFH is high in
calories, fat and sodium and low in nutritional quality.
Restaurant Portion Sizes
Concurrent with the rise in obesity and increased meals eaten outside the
home, portion sizes of meals served at restaurants in the US have risen
dramatically22,23,24 Similar increases have been seen globally.25,26,27 The trend

7
toward larger portion sizes at restaurants in the US began in the 1970’s. and
portion sizes have continued to rise.22
Considerable evidence exists to confirm an increase in portion sizes at
restaurants in the US since the 1970’s. Young and Nestle (2002)22 examined
portion sizes of foods available at family style, fast food and take-out restaurants
and compared them with the current federal standards. The current portions were
also compared with portion sizes available in previous years. All items, with the
exception of sliced white bread, exceeded the USDA and US Food and Drug
Administration (FDA) standards by as much as 700%. When compared to their
original portion sizes, most items available at the time of the study were larger,
with some, such as soda, as much as 2-5 times larger.
Nielson (2003)23 examined the trends in portion size consumption of foods
available at stores, restaurants and fast food establishments by analyzing data
from 63,380 individuals aged 2 and older from the Nationwide Food Consumption
Survey in 1977-1978 1989–1991, 1994-1996 and 1998 CSFII. Portion sizes and
energy intake for all foods except pizza increased between 1977 and 1996.
Piernas and Popkin (2011)24 examined changes in portion sizes of foods
commonly eaten by children, such as pizza, soft drinks, burgers, fries, etc.
available in stores, restaurants and fast food establishments. Data from 31,337
children ages 12-18 were examined from 4 USDA food intake surveys; the 1777-
1778 USDA Nationwide Food Consumption Survey, the 1989 – 1991 CSFII,
the1994–1996 and 1998 CSFII and combined NHANES data from 2003–2004

8
and 2005–2006. Portion sizes for all foods examined, except for desserts, were
significantly increased. Larger portion sizes resulted in greater energy intake for
certain foods, such as pizza, (+172 calories/portion since 1977-78).
These studies show that the portion sizes of FAFH have increased over
the past 30 years. Large portion sizes along with the high caloric content of
FAFH and increased consumption of FAFH, may contribute to the rising obesity
rates in the US.
Menu Labeling & Public Policy
Higher rates of obesity along with an increased prevalence of eating away
from home has led to legislation at the local, state and national levels. The intent
of legislation has been to both inform consumers about the caloric and nutritional
content of food available at restaurants and to encourage greater availability of
healthy food choices. Policy approaches have included banning certain
ingredients, such as trans fats,32 limiting building permits for fast food
restaurants,33 placing requirements on children’s meals,34 and the most
commonly utilized approach – menu labeling. Menu labeling regulation
encourages restaurant patrons to select healthier food choices, yet a secondary
goal is to encourage restaurants to offer healthier menu options. Several cities
and counties, such as New York,35 Philadelphia,36 and King County, WA37 have
enacted restaurant menu labeling laws, which require restaurants to post caloric
information by each menu item. Menu labeling will soon be required nationally.

9
The Patient Protection and Affordable Health Care Act30 was passed in 2010.
The FDA proposed guidelines for the law in 2011,38 however the final version has
not yet been released. The law requires restaurant chains with more than 20
outlets to post caloric information for all menu items on menus or menu boards.
They must also post a health statement highlighting the recommended daily
caloric intake for the average person and provide additional nutritional
information for all menu items upon request.39
A recent CDC study utilized survey data for adults from 17 states that
used the Sugar Sweetened Beverages and Menu Labeling optional module from
the 2012 Behavioral Risk Factor Surveillance System (BRFSS) survey.40 Most
(97%) respondents reported noticing menu labeling at restaurants and 57%
indicated they used the menu labels to decide what to order. In all states, women
utilized menu labels more than men. While this study shows a large percentage
of adults notice and utilize menu labels at restaurants, it does not show the
impact of menu labeling on the nutritional quality of items purchased or
consumed. Therefore, this literature review will focus on the studies conducted in
restaurant settings since the introduction of menu labels in New York City,
Philadelphia and King County, as this may be the most relevant baseline to
determine the impact of menu labeling on actual consumer purchasing and
consumption.
Elbel et al. (2009)41 examined survey and receipt data collected in 14 New
York City and 5 matched New Jersey (no labels) fast-food restaurants 1 month

10
before and 2 months after calorie labeling was implemented in New York City.
Calories purchased post labeling were compared to same store purchases prior
to menu labeling as well as compared to purchasing changes at matched New
Jersey restaurants. Although 54% of surveyed customers noticed the menu
labels in New York City and 27.7% indicated utilizing them to make menu choice,
calories purchased were not significantly different compared to same store pre
labeling purchases. Significant differences were also not observed in the New
Jersey restaurants.
Pulos and Leng (2010)42 analyzed entrée sales data from 6 full service
restaurants collected for 3 months before and 3 months after the introduction of
menu labels in Pierce County, Washington. Although not significant, study results
showed that after nutrition information was added to the menu, decreases of 15
calories, 1.5 g fat, and 45 mg sodium were observed for the average entrée
purchased.
Similarly, an examination of transaction data at a Mexican restaurant
chain for 13 months after the introduction of menu labeling in King County, WA
found no significant change in purchasing behavior.43
Another long term study collected data 9 months before the introduction of
menu labeling and 1-year after at 168 fast-food restaurant locations in New York
City.44 Findings showed that 15% of customers reported using the calorie
information and that these customers purchased 106 fewer calories than those
who did not utilize the calorie information. Overall, there was no significant

11
change in mean calories purchased, however some individual restaurant brands
showed a significant decrease in mean calories purchased (McDonalds, Au Bon
Pan, and KFC), while others showed a significant increase (Subway).
An examination of transaction records at Starbucks in New York City over
a 14-month period following the introduction of menu labeling showed a
significant change in calories purchased.45 Transaction records for New York City
stores were compared with transaction records from Boston and Philadelphia
stores, which lacked menu labels. Calories per transaction were 6% lower in New
York City.
Most recently, Auchincloss et al. (2013)46 conducted a cross-sectional
study comparing transactions at 7 restaurant outlets in a large full-service
restaurant chain 1 year after the implementation of menu labeling. Transaction
records at 5 restaurant outlets with menu labeling were compared to 2 outlets
without menu labeling. Customers at the restaurants that included menu labels
purchased food with 151 fewer calories, 224 mg less sodium, and 3.7 g less
saturated fat compared to customers at the unlabeled restaurants. Customers,
who indicated that the nutrition information affected their order, ordered 400
fewer calories, 370 mg less sodium and 10 g less saturated fat.
The strengths of these studies include real world consumers and
examination of actual purchases. Many studies examined changes in calories
purchased before and after menu labeling or compared calories purchased within
matched restaurants in locations without menu labeling. Most studies included

12
data collection over a long period of time, which addresses the sustained impact
of menu labeling. However, nutritional analysis data were primarily based on
purchased food items, rather than foods consumed by customers. The lack of
food consumption measurements to assess food and nutrient intakes from
customer food purchases is a major limitation for all of these studies.
These studies highlight the inconsistent results of many menu-labeling
studies. While some studies show a significant decrease in calories
purchased,45,46 some show mixed results44 and others do not find any significant
differences compared to calories purchased before menu labeling.41,42,43 This
lack of consistency makes it difficult to predict whether the nationwide
requirements of menu labeling will be effective in encouraging restaurant patrons
to make healthier choices.
Although a secondary goal of restaurant menu labeling is to encourage
restaurants to offer healthier menu items, studies assessing menu changes since
the introduction of menu labeling are limited. Additional studies need to examine
the changes in offerings in restaurants. Wu and Sturm conducted a series of
studies19,20 examining the ability of menu labeling to change calorie and sodium
levels in foods during the first year following the requirement of menu labeling in
New York City and found no significant changes. These results contradict a study
by Bruemmer et al. (2012),47 that compared calories, saturated fat and sodium
levels prior to menu labeling and during an 18-month follow-up in King County,

13
WA. A significant decrease in the calorie content of meals (p<0.0001) after menu
labeling was observed.
Auchincloss et al (2014)21 analyzed 21 full-service restaurant menus after
Philadelphia menu labeling requirements went into effect. Menu items were
compared against Dietary Reference Values (DRVs) based on a 2000
calories/day diet. A la carte entrees were found to exceed recommended levels if
they surpassed 40% of DRVs for entrees and 10% of DRVs for side dishes.
Calorie, saturated fat and sodium levels exceeded DRVs for a single meal and
often exceeded daily DRVs. Additional studies also found that customers ordered
meals exceeding 1/3 of the USDA’s estimated adult energy needs of 2000
calories/day after the implementation of menu labeling.44,48,49,50
Although Brummer et al. (2012)47 observed significant reductions in calorie
levels of meals offered after the implementation of menu labeling; most studies
found no change or that menu items continued to exceed recommended levels. It
is unclear from these studies, whether the introduction of nationwide menu
labeling will encourage restaurants to offer healthier menu items.
One additional limitation with the current menu labeling legislation is that it
only applies to chain restaurants with more than 20 outlets, which means many
independent and locally owned restaurants do not need to follow these
regulations. One study examined the feasibility of menu labeling in locally owned
restaurants, a project conducted by the Tacoma-Pierce County Health
Department recruited 24 locally-owned restaurants to voluntarily add nutrition

14
information to their menus. Throughout the process, researchers identified
significant barriers to menu labeling at local restaurants; such as the need for
standardize recipes, large time commitment required, and high costs associated
with nutrient analysis.51
Because of the lack of clarity on the effectiveness of menu labeling
legislation, alternative approaches should be considered, such as reduced-
portion sizes. Other approaches may be necessary to improve the healthfulness
of restaurant meals and change eating behaviors to impact the obesity epidemic
in the US.
Portion Size and Energy Intake
Increases in portion size have been shown to increase energy
consumption across several age groups. Numerous studies have shown
increased energy intake in adults with larger portion sizes.
52,53,54,55,56,57,58,59,60,61,62,63,64,65 Additional studies with children have shown similar
results. 66,67,68,69,70,71,72,73 The influence of portion sizes on adult energy intake will
be explored based on research using varying study designs and settings.
Increased Portion Sizes – Lab Based – Single Occasion
Several controlled studies with adults have demonstrated in a laboratory
setting that increased portion sizes are correlated with increased energy
intake.53,54,55,56,64 A series of laboratory-based studies were conducted at Penn

15
State to investigate the effects of large portion sizes on energy intake. The first
study53 utilized a between-person experimental design and served participants a
macaroni and cheese dish in 4 different portion sizes (500g, 625g, 750g and
1,000g) one day a week over 4 weeks. Participants were divided into 2 groups, a
self-serve group or a pre-served group. Food was weighed before and after the
meal to determine the amount consumed. In this group of 51 men and women, a
significant increase in energy intake (P<0.05) was observed with increasing
portion sizes (546, 610, 652 and 708 calories, respectively). The increase in
portion amounted to a 30% increase in energy intake when the 1,000 g portion
was served compared to the 500 g portion. Additionally, no interaction was
observed between energy intake and serving method and no significant
differences were observed in ratings of hunger and fullness, despite increased
consumption with larger portion size.
A second study by Rolls, Roe and Meengs (2004)54 investigated the effect
of increasing food portion size on energy intake when served as a discrete unit.
One day a week over 4 weeks, 75 men and women were served a submarine
sandwich in 4 different sizes (6, 8, 10, or 12 inches). Sandwiches were weighed
before and after the meal to determine the amount consumed. Both men and
women significantly increased their energy intake (P<0.0001) when served the
12-inch sandwich compared to the 8-inch sandwich. Women consumed 74
additional calories, which represented a 12% increase in energy intake and men
consumed 186 additional calories, which represented a 23% increase in energy

16
intake. Again no significant differences were found in ratings of hunger and
fullness, despite increased consumption.
A third study by Rolls et al. (2004)55 examined the effect of portion size of
a prepackaged snack on both snack consumption and consumption at the
subsequent meal. Potato chips were served in one of 5 different sized packages:
28g, 42g, 85g, 128g or 170g along with 1 liter of water to 51 men and women on
5 separate days. All foods (snack and subsequent meal) were weighed before
and after the snack or meal to determine the amount consumed. Both men and
women ate significantly more potato chips (P<0.0001) as the package size
increased. Men consumed an additional 311 calories and women an additional
184 calories from the largest package compared to the smallest package.
Participants also returned ~3 hours later to eat a standardized dinner. Combined
energy intake for both snack and dinner was significantly higher for women
(p<0.023) and men (p<0.0001) as the package size of the potato chips
increased. The mean energy intake for snack and dinner combined increased by
143 calories when comparing the largest package to the smallest package.
Geier, Rozin and Doros (2006)60 suggested that unit bias can lead to
increased consumption when larger portion sizes are offered which corroborates
the findings of Rolls et al. (2004a)53 and Rolls et al. (2004b).54 Unit bias was
described as “a sense that a single entity (within a reasonable range of sizes) is
the appropriate amount to engage, consume, or consider”.60 Thus when larger-
sized units of food were served, individuals would eat more because they

17
interpret a unit, regardless of size, as an appropriate amount to eat. The
researchers conducted a number of small experiments with free snacks offered
in public settings and found that the amount of food selected increased as the
unit size increased. This study has limitations however, because it did not
measure actual consumption, only the amount selected.
A study examining the effect of serving larger portion sizes to 13 young
adults also observed that energy intake was significantly increased.56 Rather
than providing a set amount of food for all participants, this study established a
baseline consumption level for each participant. Participants were instructed to
consume as much as they wanted from a buffet lunch consisting of vegetable
soup, rigatoni pasta and tomato sauce, breadsticks, ice cream and water during
3 meals over the course of 1 week. The mean energy intake was calculated and
used as the baseline portion size. During the following week, participants
consumed the same meal at 100%, 125% and 150% of baseline. Increased
consumption was found for all components of the meal with the larger portion
sizes (p<0.01). Mean energy intake increased by 165 calories for the 125%
portion compared to the control (100%) and increased 105 calories for the 150%
portion compared to the 125% portion.
Rolls et al. (2010)64 examined whether larger portion sizes of low energy
dense foods like vegetables would also lead to increased consumption. Rolls
conducted 2 crossover-design studies. In the first, 49 men and women were
served 3 meals consisting of a vegetable, grain and meat on the same weekday
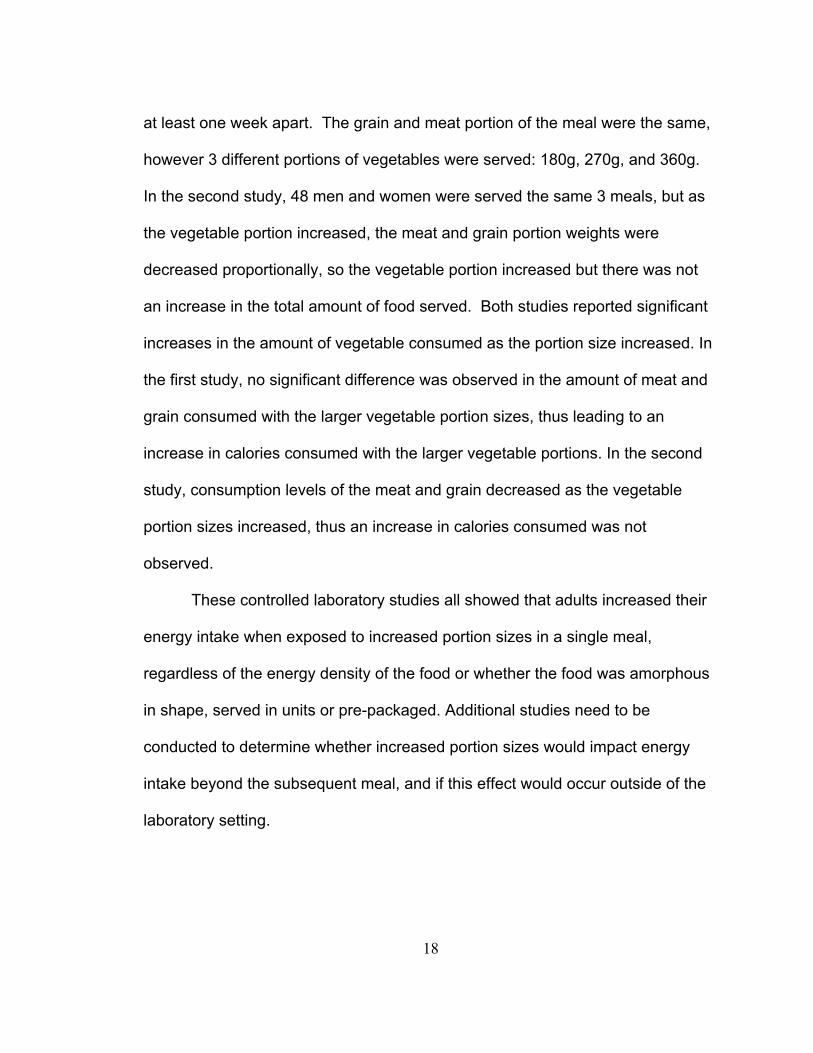
18
at least one week apart. The grain and meat portion of the meal were the same,
however 3 different portions of vegetables were served: 180g, 270g, and 360g.
In the second study, 48 men and women were served the same 3 meals, but as
the vegetable portion increased, the meat and grain portion weights were
decreased proportionally, so the vegetable portion increased but there was not
an increase in the total amount of food served. Both studies reported significant
increases in the amount of vegetable consumed as the portion size increased. In
the first study, no significant difference was observed in the amount of meat and
grain consumed with the larger vegetable portion sizes, thus leading to an
increase in calories consumed with the larger vegetable portions. In the second
study, consumption levels of the meat and grain decreased as the vegetable
portion sizes increased, thus an increase in calories consumed was not
observed.
These controlled laboratory studies all showed that adults increased their
energy intake when exposed to increased portion sizes in a single meal,
regardless of the energy density of the food or whether the food was amorphous
in shape, served in units or pre-packaged. Additional studies need to be
conducted to determine whether increased portion sizes would impact energy
intake beyond the subsequent meal, and if this effect would occur outside of the
laboratory setting.

19
Increased Portion Sizes – Lab Based – Multiple Days
To determine if a portion size effect would be sustained beyond a single
meal or if compensatory mechanisms would reduce intake in subsequent meals
Rolls, Roe, Meengs (2006)59 conducted an additional study. In a within subject
randomized crossover study, 32 men and women ate breakfast, lunch, and
dinner in the laboratory and were provided snacks to be consumed mid-morning,
mid-afternoon and evening away from the lab for 2 consecutive days in each of 3
weeks. Each week participants were provided the same meal, but the portion
sizes varied from 100%, 150% and 200% of baseline amount. Hunger and
fullness ratings were collected after each meal. As with individual meals, portion
sizes had a significant impact on energy intake over the 2 days (P<0.0001).
When served the 150% portion, energy intake increased 16% and when served
the 200% portion, energy intake increased 26%. No difference in the amount
consumed between the 2 days was observed. Fullness ratings increased
significantly from the 100% to 150% servings (P<0.0004) but no significant
differences were observed between the 150% and 200% servings.
An examination of 7-day food diaries found that energy intake on a
particular day had a significant influence on the amount consumed 2 days later,
suggesting a delayed compensatory adjustment.75 To test whether the sustained
increased energy intake would be maintained beyond the 2 days or if
compensatory mechanisms would lower intake after 2 days, Rolls, Roe and
Meengs (2007)61 conducted an longer-term study to examine the impact of large
20
portion sizes on energy intake over 11 days. This study used a crossover design
similar to their previous study (Rolls, Roe, Meengs 2006).59 All meals, snacks
and drinks were provided for 27 participants over the course of 2, 11-
consecutive-day periods, separated by a washout period of 2 weeks. The same
foods were provided for each 11-day period, however during 1 period,
participants received baseline portion sizes and during the second period they
received portion sizes 50% larger. Increasing the portion sizes resulted in a
significant increase in energy intake over the 11 days (P<0.0001), with an
average daily calorie increase of 423 calories. The larger portion sizes led to a
25% increase in daily energy intake for women and a 14% increase for men. The
increased consumption was sustained throughout the entire 11 days of the study
resulting in an average cumulative increase of 4,636 calories, thus contradicting
the compensatory adjustment at 2 days suggested by De Castro (1995).
Both studies showed a sustained increase in energy intake, however
participants were required to eat 3 meals a day in a laboratory setting at set
times.59,61 Participants were not able to delay or eliminate a subsequent meal or
choose a lighter, less energy dense meal to compensate, therefore, measuring
potential physical compensation mechanisms that may occur in a naturalistic
setting was not possible.
Similar findings were found in a randomized within-subject crossover
design study in the United Kingdom (UK).63 In this study 43 men and women
were housed at a University over two 4-day periods. Each test condition was

21
separated by 3 weeks. Participants received all meals and snacks during the
study. During 1 condition, participants were served standard portions and during
the other condition they were served “large” portions, based on commercially
available units of the same food designed to feed 2-3 people. Participants chose
the menu items during the first period and then were provided different portions
of the same items during the second period. Different serving dishes were used
to mask the difference in portion sizes. Mean energy intake was significantly
larger during the “large” portion size period (p=0.020). Energy intake increased
by 17% for men and 10% for women when compared to the standard period.
Kelly et al. (2009) also reported sustained energy intake over the 4 test days
supporting the findings of Rolls, Roe and Meengs (2006)59 and Rolls, Roe and
Meengs (2007).61
Increased Portion Size - Naturalistic Environment – Single Occasion
A number of studies have been conducted to examine whether increased
portion sizes would impact energy intake in a naturalistic environment.52,57,58
Dilberti et al. (2004)57 conducted a between subjects parallel group design
experiment in a university cafeteria. Food intake was recorded for customers who
purchased a baked pasta dish. The baked pasta dish was served 10 times over
the course of 5 months. The standard (100%) portion was served 5 times and the
large (150%) portion was served 5 times. Study weeks were separated by at
least 2 weeks and the portion size served each week was determined randomly.

22
Customers (n=180) who purchased the pasta dish and completed a survey were
included in the study. When the large portion of the pasta was served, customers
consumed 43% more energy from the entrée and 25% more energy from the
entire meal including side dishes. Despite differences in entrée size, ratings of
portion size appropriateness did not change between the customers who
purchased the standard and the large entrée size.
Two experiments were conducted at a movie theater to examine if
external cues such as the size of a container could influence how much a person
eats. In the first study52 customers (n=161) attending the movie were given
coupons for a free popcorn and soda and were randomly provided either a
medium (120g) or a large (240g) bucket of popcorn. Buckets were collected after
the movie and 151 people completed a survey regarding the popcorn. Customers
who rated the popcorn unfavorably ate 61% more in a large bucket than a
medium bucket. Those who rated the popcorn favorably consumed 49% more in
the large bucket than the medium bucket. In this study, taste differences in the
popcorn were measured but not manipulated. In 2004, this experiment was
repeated, however this time the taste of the popcorn was manipulated by
providing some study participants fresh popcorn and others 14-day-old stale
popcorn.58 One hundred fifty eight moviegoers were randomly assigned to
receive either a large bucket of fresh popcorn, a medium bucket of fresh
popcorn, a large bucket of 14-day-old stale popcorn, or a medium bucket of 14-
day-old stale popcorn. Of the fresh popcorn, participants who received a large

23
bucket ate 45.3% more popcorn than those who received the medium bucket.
Even when survey data indicated participants disliked the stale popcorn, they still
ate 33% more from the large bucket compared to the medium bucket.
Not only did these studies show that increased portion sizes positively
impacted energy intake, they show a greater increase in energy intake than in
laboratory settings. This may be due to other environmental factors or social
cues that encourage increased consumption.
Increased Portion Sizes - Naturalistic Environment – Multiple Days
Although laboratory experiments have shown a sustained energy intake
for up to 11 days, the 3 previous naturalistic studies52,57,58 only examined the
impact of large portion sizes on a single eating episode. Two studies among
adults62,65 have examined energy intake over longer periods of time in a
naturalistic setting. These studies also examined changes in participant weight.
The first study examined the effects of small or large portion-sized lunches on
energy intake over 4 weeks.62 In a randomized crossover design, 19 women
received either a large or small lunch 5 times per week for 4 weeks, then after a
2-week washout period, received the opposite condition meals for an additional 4
weeks. Meals consisted of a main dish (sandwich or salad), side (fruit, veg,
chips, bread), a dessert (cookie or bar) and a drink (water, diet Coke, or Sprite).
Small lunches averaged 767 calories and large lunches averaged 1528 calories.

24
Height and weight were measured at baseline and immediately after the
completion of each of the 4-week study periods. Dietary assessment was
measured after each lunch via a self-administered questionnaire where
participants estimated the portion eaten using a visual analog scale. They also
recorded any additional food items consumed for lunch. Two 24-hour dietary
recalls were completed on random days during each 4-week intervention period.
Physical activity was also assessed.
Findings showed that the average reported intake for the small lunch was
687 calories and 1,019 calories for the large lunch. Total daily calorie intake also
differed. During the small lunch intervention period average daily intake was
1875 calories, whereas during the large lunch intervention period daily intake
increased to 2153 calories. Researchers noted that this 278-calories/day
increase could result in a 0.72 kg increase in participant weight over 20 days if
not compensated for at a later time. They saw a 0.06+ 1.03 kg weight gain during
the small lunch period and a 0.64 + 1.16 kg gain during the large lunch period.
A more recent study examined the effects of large portion sizes in a free-
living environment over a 6-month period.65 In a randomized controlled trial at a
large metropolitan medical center with over 2,000 full-time employees, 233 adult
participants, with a mean BMI of 29.8 were randomized to 1 of 4 lunch
conditions; 400 calories (n=57); 800 calories (n=59), 1,600 calories (n=56); and
control (n=61). Lunch was provided Monday through Friday for the participants in
the 400, 800 and 1,600 calories groups. Fifteen different boxed lunch menus

25
were developed and similar foods were included in all calorie conditions. No
lunch was provided for the control group participants.
Height and weight were measured and energy intake was assessed by 3
unannounced 24-hour dietary recalls at baseline, 1 month, 3 months and 6
months for a total of 12 recalls per person throughout the study. Physical activity
was measured at baseline and at 6 months. Energy intake from lunch was
significantly higher in the 800 and 1,600 calories groups (p<0.0001) than the
lower calories group. Total energy intake for the 1,600 calories group was
significantly higher than the 800 and 400 calories groups. The participants in the
1,600 calories group also showed significant weight gain during the 6-month
study, whereas the 400 and 800 calories groups did not.
Both of these studies have a number of strengths including their long-term
duration; naturalistic settings and that they examined body weight to see if long-
term exposure to large portion sizes leads to weight gain. While there is some
error inherent with a 24-hour recall, these studies are better able to examine
potential compensatory mechanisms because they are only manipulating 1 meal
and are then able to examine any self-directed alterations to subsequent meals.
Reduced-portion Sizes - Lab and Naturalistic Environments
Relatively few studies have examined the effect of reduced-portion sizes
on energy intake among adults. Rolls, Roe & Meengs (2006)75 investigated the
impact of providing meals with reduced-portion sizes and reduced energy density

26
to study participants over 2 days. Reductions in both portion size and reductions
in energy density independently decreased energy intake. This reduction in
energy intake was sustained over the course of the full 2 days.
Freedman and Brochado (2010)76 examined the effects of reducing
portion sizes on food intake and plate waste in a University all-you-can–eat-
cafeteria setting. Over the course of the study researchers measured student
intake of French fries purchased at the cafeteria. French fries were originally
served in bags weighing 88 g. Each week the bags were reduced by 15 g and
ended at 44 g. Bags were pre-weighed to ensure consistent weights.
Researchers counted the number of bags taken by each person, 1, 2, or 3 or
more. When diners were finished eating, bags and uneaten fries were collected.
Uneaten French fries were placed in separate containers based on how many
bags of French fries were taken. Findings showed that as the portion size of
French fries was reduced, consumption levels and plate waste also decreased.
This study has limitations however, because it was unable to determine if diners
returned to get additional French fries during the meal or compensated with
increased intake of other meal components.
A 3-part field experiment conducted in a Chinese fast food restaurant
offered adult customers the ability to downsize portions of starchy side dishes.77
While less than 1% spontaneously asked for reduced-portions, 23% accepted
reduced-portions when offered in two conditions, either for no discount in price or
in exchange for a 25¢ discount. In the second part of the study, reduced size

27
portions were offered. In the third part, the plates of 263 consumers were
weighed at the end of the meal. No significant difference was found in the
amount of leftovers, despite the difference in initial portion sizes. Consumers who
downsized their side dishes consumed less energy than those who did not.
Customer surveys indicated that those who selected the reduced-portion did so
to reduce calories.
Increasing portion sizes has consistently led to increased caloric
consumption and decreasing portion sizes led to decreased caloric consumption.
Reducing restaurant portion sizes may be an effective way to increase the
healthfulness of restaurant meals and reduce obesity rates, but it needs to be
feasible and economical for restaurants to offer reduce portion sizes.
Practicality of Reduced Sized Restaurant Portions
Restaurant profit margins are key to determining which menu items are
served.78 A survey by the National Restaurant Association79 found that 72% of
the respondents were more likely to choose restaurants with healthy menu
options. These findings were confirmed by a report from the Hudson Institute,80
which found that between 2006 and 2011, sales of lower-calorie foods and
beverages outperformed higher calorie items. Restaurants offering more low
calorie items saw increased sales, growth in customer traffic and an increase in
servings sold compared with restaurants selling fewer lower-calorie items.
Customers offered reduced-portion sizes were willing to downsize their meals to

28
reduce calories.77 Several restaurants attempted to offer reduced size menu
items in the past with mixed results,81 however; recently several restaurant
chains (Noodles and Co. and Pei Wei) have begun to offer both small and large
menu portions.82,83
Although the demand for lower calorie menu items could be met via
reduced-portion items, limited research exists on the practicality of offering
reduced-portion sizes of entrees in restaurant settings. A recent study84
conducted structured interviews with 18 restaurant owners (representing over
350 restaurants) to determine interest in and ability to offer reduced size portions
as part of a county wide voluntary recognition program. Owners noted that
customer demand is central in menu planning and many did not feel that there
was a demand among their customers for reduced size portions. Many were
already offering multiple portion sizes for items such as soups, sandwiches, and
salads, but only 8 offered reduced size entrees. Owners expressed concern
regarding logistical challenges, additional training, increased costs associated
with smaller sized products and reduced revenue. Recognizing these concerns,
researchers noted that the program would be possible with technical assistance
provided to restaurants to address challenges with food preparation and
presentation. Despite the concerns of restaurant owners, offering reduced-
portion sizes may be a more feasible option for locally-owned or independent
restaurants than menu labeling, which one study found to be very time
consuming and costly for independent restaurants.85

29
To date no studies have examined the impact of offering reduced-portion
menu items on restaurant logistics and costs, however 2 studies86,87 investigated
the impact on restaurant sales with the addition of reduced size entrees to the
menus. Both showed that consumers purchased the reduced size entrees, but
sales of additional items differed between the studies. Vermeer et al. (2011)86
introduced small portion sizes (roughly 2/3 of existing size) in addition to the
regular-sized portions in 17 workplace cafeterias in the Netherlands. These were
divided into two different conditions, proportional pricing or value-size pricing. An
additional 8 cafeterias served as controls. Study participants (n=308) completed
a series of questionnaires assessing demographic characteristics, and
measuring eating behavior at specific times during the study. At the end,
frequency of purchasing the reduced size entrees was measured and whether
the participants ate more or less than usual when they purchased the reduced
size entree. Findings showed that the proportion of small meal sales in relation to
the large meal sales was around 10% regardless of pricing condition and were
most often purchased by women. Sales of fried snacks were also measured to
see if the consumers purchasing the reduced size entrees were compensating
with additional food. Compensation was not observed, however survey data
indicated that almost 20% of the individuals who purchased reduced size entrees
often or always purchased additional food items.
An analysis was completed using sales data at a Midwest restaurant that
introduced half portions in addition to the regular-sized portions for a 2-month

30
period.87 Sales were compared to the same months of the previous year.
Findings showed that while sales of the full size entrees decreased by 297
entrees, sales of half size entrees increased by 949 entrees. Sales of salads also
increased by 116.5%, resulting in a net sales increase of almost $7,000.
These limited studies suggest that reduced-portion sizes may be
beneficial for restaurants as well as customers. Additional research is necessary
to analyze the level of customer support for reduced size menu portions and the
logistical and financial impact on restaurants choosing to offer reduced size
portion items.
Food Waste
A recent report by the Natural Resources Defense Council (2012)88 found
that 40% of the food grown in the US is wasted. A similar report generated by the
Food and Agriculture Organization (FAO)89 of the United Nations found that
globally about 1/3 of food produced is lost or wasted.
Food waste can occur at 5 different points throughout the supply chain
including production losses at the farm level, losses in post-harvest handling and
storage, processing and packaging losses, distribution and retail losses and
consumer losses both at home and away from home.88,89 In less-developed
countries, greater losses are found at the agricultural level, while in wealthier,
more developed countries, such as the US, the greatest point of loss is at the
consumer level.89,90

31
Food waste impacts citizens on many levels. The US Environmental
Protection Agency,91 notes that reducing the amount of food waste would
produce significant social, economic and environmental benefits.
Nearly 49 million Americans are living in food insecure households.92 This
represents 14.5 % of all households in America.93 A study by Hall et al., 2009,94
analyzed NHANES data and estimated that 150 trillion calories are lost annually.
Gunders et al (2012)88 used this estimate and calculated that reducing food
losses by just 15 percent would result in enough food to feed more than 25
million Americans every year.
Food waste also results in wasted economic resources. Buzby et al.
(2012)95 utilized USDA ERS Loss Adjusted Food Availability data to estimate the
amount and value of loss for over 200 foods. The calculated value of the food
wasted in the US in 2008 retailed for $165.6 billion dollars. This equates to a
$390 loss per person each year.
In addition to monetary losses, resources such as energy, water, fertilizer
and pesticides, human labor and land are wasted. It is estimated that 25% of
freshwater usage95 and 300 million barrels of oil94 are lost in the US in production
of wasted food.
Additionally, food waste increases the production of greenhouse gases. In
2011, more than 36 million tons of food waste was generated, but only an
estimated 4% was composted.94 The remaining 96% was deposited in landfills.94
Food waste is the largest component of municipal solid waste in the US and

32
when it decomposes in landfills, it produces about 34% of US methane
emissions.96 Methane has 21 times the global warming potential of carbon
dioxide.97
Reduced restaurant portion sizes – Food waste reduction
Large restaurant portion sizes have been identified as a key source of
food waste in restaurants and other food service environments.88 Restaurant
diners leave around 17% of their meal uneaten and around 55% of these
potential leftovers are thrown away.98
Three years ago the National Restaurant Association joined with the
Grocery Manufacturers Association and the Food Marketing Institute to form the
Food Waste Reduction Alliance.99 According to a study conducted by the FWRA
to examine where waste is generated “post-agriculture to fork”, restaurants
generate 37% of post-agricultural waste.100 FWRA has developed 3 goals
regarding food waste reduction based on the US Food Waste Recovery
Hierarchy,91 which identifies the different levels of food waste reduction from the
most preferred (source reduction) to the least preferred (incineration or landfill).
Goal 1 is to lower the amount of food waste generated. Goal 2 is to increase the
amount of food donated to individuals in need and goal 3 is to recycle
unavoidable food waste rather than sending it to landfills.100 LeanPath,101 a
company designed to help food service organizations identify and eliminate
waste, recommends reviewing portion sizes as the first step in reducing post-

33
consumer food waste in foodservice environments.102 While reducing portion
sizes is recommended as a means to decrease waste, few studies have
documented the amount of waste reduction obtained by reducing portion sizes in
restaurant settings. Freedman et al. (2010)76 showed that by reducing the portion
size of French fries in a college cafeteria, waste of French fries decreased. The
removal of trays from cafeterias has been shown to reduce both the amount of
food selected and the amount wasted.103 Thus, reduced portion sizes may help
restaurants reduce the amount of food waste generated and decrease the
amount of food waste needing to be recycled, but more research is needed to
document the amount of waste reduction.
Summary
During the past 30 years as Americans have increased their consumption
of FAFH. Concurrent with this is a rise in the obesity rate.6,7,8 Numerous studies
have shown that FAFH is often high in calories and nutrients of concern,
including total fat, saturated fat, cholesterol and sodium.19,20,21 Portion sizes of
restaurant meals have also increased since the 1970’s.22
In the past few years, numerous regulatory approaches have been
introduced to assist consumers in making healthier choices at
restaurants.31,32,33,34 Recently, legislation requiring nationwide menu labeling has
been passed.30 While these nationwide laws have not yet been implemented, a
number of cities and counties have passed menu-labeling laws.35,36,37 Although

34
one recent study has shown that consumers in these areas are utilizing the menu
labels to make healthier menu choices,40 results of studies examining the
nutritional quality of purchases are mixed.41,42,43,44,45,46
Studies in both laboratory-based settings and naturalistic settings have
shown that increased portion sizes lead to increased energy
consumption.52,53,54,55,56,57,58,59,61,62,63,64,65 A recent report also indicated that large
restaurant portion sizes might lead to increased food waste.88 Reduced
restaurant portion sizes may be an effective means to decrease the intake of
calories and nutrients of concern and decrease the amount of food wasted,
however relatively few studies have examined the impact of reducing portion
sizes in a restaurant setting.

35
References:
1. 2014 Restaurant Industry Pocket Factbook. National Restaurant Association. http://www.restaurant.org/Downloads/PDFs/News-Research/research/Factbook2014_LetterSize.pdf. Accessed May 22, 2014.
2. Food-at-home and away-from-home expenditures in the United States, 1960-2012. USDA, Economic Research Service, Food Expenditure Series. 2014.
3. Flexible Consumer Behavior Survey. U. S. Department of Agriculture. http://ers.usda.gov/topics/food-choices-health/food-consumption-demand/food-consumption/flexible-consumer-behavior-survey.aspx#.U2hD3OZdXwM. Last updated: Feb. 04, 2014. Accessed July 31, 2014.
4. Body Mass Index. Center for Disease Control and Prevention. www.cdc.gov/healthyweight/assessing/bmi/index.html. Last reviewed: July 1, 2014. Accessed July 31, 2014.
5. About BMI for Children and Teens. Center for Disease Control and Prevention. http://www.cdc.gov/healthyweight/assessing/bmi/ childrens_bmi/about_childrens_bmi.html. Page last reviewed: July 11, 2014. Accessed July 31, 2014.
6. Ogden CL, Carroll MD, Kit BK, Flegal KM. Prevalence of childhood and adult obesity in the United States, 2011-2012. JAMA. 2014;311(8):806–14.
7. Adolescent and School Health. Childhood Obesity Facts. Center for Disease Control and Prevention. http://www.cdc.gov/healthyyouth/obesity /facts.htm. Page last reviewed: February 27, 2014. Accessed June 4, 2014.
8. National Center for Health Statistics. NCHS Fact Sheet. NCHS Obesity Data. Page last updated: June 4, 2014. Center for Disease Control and Prevention. http://www.cdc.gov/nchs/data/factsheets/factsheet_ obesity.htm. Accessed June 3, 2014.
9. Fact Sheet. Obesity and Cancer Risk. National Cancer Institute. http://www.cancer.gov/cancertopics/factsheet/Risk/obesity. Accessed June 3, 2014.

36
10. NHLBI Obesity Education Initiative Expert Panel on the Identification, Evaluation, and Treatment of Obesity in Adults (US). Clinical Guidelines on the Identification, Evaluation, and Treatment of Overweight and Obesity in Adults: The Evidence Report. Bethesda (MD): National Heart, Lung, and Blood Institute; 1998 Sep. Chapter 2, Overweight and Obesity: Background. http://www.ncbi.nlm.nih.gov/books/NBK1995/. Accessed June 3, 2014.
11. Finkelstein EA, Trogdon JG, Cohen JW, Dietz W. Annual medical spending attributable to obesity: payer-and service-specific estimates. Health Aff (Millwood). 2009;28(5):w822–31.
12. McCrory MA, Fuss PJ, Hayes, Vinken AG, Greenberg AS, Roberts SB. Overeating in America: Association between Restaurant Food Consumption and Body Fatness in Healthy Adult Men and Women Ages 19 to 80. Obesity. 1999;7(6):564-571.
13. Guthrie JF, Lin B-H, Frazao E. Role of Food Prepared Away from Home in the American Diet, 1977-78 versus 1994-96: Changes and Consequences. J Nutr Educ Behav. 2002;34(3):140–150.
14. Bowman SA, Vinyard BT. Fast Food Consumption of U.S. Adults: Impact on Energy and Nutrient Intakes and Overweight Status. J Am Coll Nutr. 2004;23(2):163-8.
15. Kant AK, Graubard BI. Eating out in America, 1987–2000: trends and nutritional correlates. Prev Med (Baltim). 2004;38(2):243–249.
16. Beydoun MA, Powell LM, Wang Y. Reduced away-from-home food expenditure and better nutrition knowledge and belief can improve quality of dietary intake among US adults. Public Health Nutrition. 2009;12(3):369-381.
17. Mancino L, Todd J, Lin B-H. Separating what we eat from where: Measuring the effect of food away from home on diet quality. Food Policy. 2009;34(6):557–562.
18. Todd JE, Mancino L, Lin B-H. The Impact of Food Away from Home on Adult Diet Quality. ERR-90, US Department of Agriculture, Economic Research Service, February 2010.
19. Wu HW, Sturm R. What ’ s on the menu ? A review of the nutritional content of US chain restaurant menus. Public Health Nutrition. 2012;16(1):87–96.

37
20. Wu HW, Sturm R. Changes in the Energy and Sodium Content of Main Entrées in US Chain Restaurants from 2010 to 2011. J Acad Nutr Diet. 2014;114(2):209–19.
21. Auchincloss AH, Leonberg BL, Glanz K, Bellitz S, Ricchezza A, Jervis A.
Nutritional value of meals at full-service restaurant chains. J Nutr Educ Behav. 2014;46(1):75–81.
22. Young LR, Nestle M. The contribution of expanding portion sizes to the
US obesity epidemic. Am J Public Health. 2002;92(2):246–9.
23. Nielsen SJ. Patterns and Trends in Food Portion Sizes, 1977-1998. JAMA. 2003;289(4):450.
24. Piernas C, Popkin BM. Food portion patterns and trends among U.S.
children and the relationship to total eating occasion size, 1977-2006. J Nutr. 2011;141(6):1159–64.
25. Matthiessen J, Fagt S, Billtoft-Jensen A, Beck AM, Ovesen L. Size makes
a difference. Public Health Nutr. 2003;6(1):65-72.
26. Church S. Trends in portion sizes in the UK – A preliminary review of published information. Report to the Food Standards Agency. 2008. http://multimedia.food.gov.uk/multimedia/pdfs/reviewportions.pdf. Accessed June 13, 2014.
27. Steenhuis IHM, Leeuwis FH, Vermeer WM. Small, medium, large or
supersize: trends in food portion sizes in The Netherlands. Public Health Nutr. 2010;13(6):852–7.
28. USDA. Center for Nutrition Policy and Promotion. Healthy Eating Index
2005. http://www.cnpp.usda.gov/publications/hei/healthyeatingindex2005factsheet.pdf. Accessed May 17, 2014.
29. Dietary Guidelines for Americans 2010. U.S. Department of Agriculture. U.S. Department of Health and Human Services.
30. U.S. House of Representatives. Public Law 111 – 148. 2010:1–906.
31. Philadelphia City Code. Title 6-308. 2008.

38
32. New York City Health Code. Section 81.08. A Regulation to Phase Out Artificial Trans Fat In New York City Food Service Establishments. http://www.nyc.gov/html/doh/downloads/pdf/cardio/cardio-transfat-bro.pdf. Accessed June 5, 2014.
33. Los Angeles City Planning. Ordinance No. 180103. http://cityplanning.lacity.org/Code_Studies/Misc/FastFoodInterim. Accessed June 2, 2014.
34. Santa Clara County Nutrition Standards 2012. http://www.sccgov.org/sites/sccphd/en-us/Newsandevents/Documents/ Nutrition%20Standards/Nutrition_Standards_NEW_july2012_v3.pdf. Accessed June 4, 2014.
35. Cardozo MA. Federal appeals court upholds New York City’s landmark health code provision requiring certain chain restaurants to post calorie information on menus and menu boards. Press Release. 2009. http://www.nyc.gov/html/law/downloads/pdf/Calorie_Case%20_%20Appeals_Win.pdf. Accessed June 8, 2014
36. Philadelphia Department of Public Health. A Guide to Menu Labeling Requirements at Food Establishments in Philadelphia; Understanding Philadelphia’s Menu Labeling Law. October 2009. http://www.phila.gov/health/pdfs/MenuLabelinguideFINAL2010-27.pdf. Accessed June 11, 2013.
37. King County Public Health Department. Nutrition Labeling in King County. http://www.kingcounty.gov/healthservices/health/nutrition/healthyeating/menu.aspx. Accessed June 10, 2014.
38. U.S. Department of Health and Human Services, U.S. Food and Drug Administration. Food Labeling; Nutrition Labeling of Standard Menu Items in Restaurants and Similar Retail Food Establishments; Proposed Rule . Federal Register, Volume 76, Issue 66; 2011.
39. Stein K. A national approach to restaurant menu labeling: the Patient Protection and Affordable Health Care Act, Section 4205. Journal of the American Dietetic Association. 2010;110(9):1280–6, 1288–9.
40. Lee-Kwan SH, Pan L, Maynard L, Kumar G, Park S. Restaurant menu labeling use among adults - 17 States, 2012. MMWR Morb Mortal Wkly Rep. 2014;63(27):581–4.
41. Elbel B, Kersh R, Brescoll VL, Dixon LB. Calorie labeling and food choices: a first look at the effects on low-income people in New York City. Health Aff (Millwood). 2009;28(6):w1110–21.

39
42. Pulos E, Leng K. Evaluation of a voluntary menu-labeling program in full-service restaurants. Am J Public Health. 2010;100(6):1035–9.
43. Finkelstein E a, Strombotne KL, Chan NL, Krieger J. Mandatory menu labeling in one fast-food chain in King County, Washington. Am J Prev Med. 2011;40(2):122–7.
44. Dumanovsky T, Huang CY, Nonas CA, Matte TD, Bassett MT, Silver LD. Changes in energy content of lunchtime purchases from fast food restaurants after introduction of calorie labeling: cross sectional customer surveys. BMJ. 2011;343(jul26_1):d4464.
45. Bollinger B, Leslie P, Sorensen A. Calorie Posting in Chain Restaurants. 2010. Available at: http://www.nber.org/papers/w15648. Accessed June 18, 2014.
46. Auchincloss AH, Mallya GG, Leonberg BL, Ricchezza A, Glanz K, Schwarz DF. Customer responses to mandatory menu labeling at full-service restaurants. Am J Prev Med. 2013;45(6):710–9.
47. Bruemmer B, Krieger J, Saelens BE, Chan N. Energy, saturated fat, and sodium were lower in entrées at chain restaurants at 18 months compared with 6 months following the implementation of mandatory menu labeling regulation in King County, Washington. J Acad Nutr Diet. 2012;112(8):1169–76.
48. Elbel B. Consumer estimation of recommended and actual calories at fast food restaurants. Obesity (Silver Spring). 2011;19(10):1971–8.
49. Roberto CA, Larsen PD, Agnew H, Baik J, Brownell KD. Evaluating the impact of menu labeling on food choices and intake. Am J Public Health. 2010;100(2):312–8.
50. Tandon PS, Zhou C, Chan NL, et al. The impact of menu labeling on fast-food purchases for children and parents. Am J Prev Med. 2011;41(4):434–8.
51. Britt JW, Frandsen K, Leng K, Evans D, Pulos E. Feasibility of voluntary menu labeling among locally owned restaurants. Health Promot Pract. 2011;12(1):18–24.
52. Wansink B, Park S. At the movies: how external cues and perceived taste impact consumption volume. Food Qual Prefer. 2001;12(1):69–74.

40
53. Rolls BJ, Morris EL, Roe LS. Portion size of food affects energy intake in normal-weight and overweight men and women. Am J Clin Nutr. 2002.;76:1207-1213.
54. Rolls BJ, Roe LS, Meengs JS, Wall DE. Increasing the portion size of a sandwich increases energy intake. J Am Diet Assoc. 2004;104(3):367–72.
55. Rolls BJ, Roe LS, Kral TVE, Meengs JS, Wall DE. Increasing the portion size of a packaged snack increases energy intake in men and women. Appetite. 2004;42(1):63–9.
56. Levitsky DA, Youn T. The More Food Young Adults Are Served, the More They Overeat. J Nutr. 2004;134(10):2546–2549.
57. Diliberti N, Bordi PL, Conklin MT, Roe LS, Rolls BJ. Increased portion size leads to increased energy intake in a restaurant meal. Obes Res. 2004;12(3):562-8.
58. Wansink B, Kim J. Bad popcorn in big buckets: portion size can influence intake as much as taste. J Nutr Educ Behav. 37(5):242–5.
59. Rolls BJ, Roe LS, Meengs JS. Larger portion sizes lead to a sustained increase in energy intake over 2 days. J Am Diet Assoc. 2006;106(4):543–9.
60. Geier AB, Rozin P, Doros G. Unit bias. A new heuristic that helps explain the effect of portion size on food intake. Psychol Sci. 2006;17(6):521–5.
61. Rolls BJ, Roe LS, Meengs JS. The effect of large portion sizes on energy intake is sustained for 11 days. Obesity (Silver Spring). 2007;15(6):1535–43.
62. Jeffery RW, Rydell S, Dunn CL, et al. Effects of portion size on chronic energy intake. Int J Behav Nutr Phys Act. 2007;4(1):27.
63. Kelly MT, Wallace JMW, Robson PJ, et al. Increased portion size leads to a sustained increase in energy intake over 4 d in normal-weight and overweight men and women. Br J Nutr. 2009;102(3):470–7.
64. Rolls BJ, Roe LS, Meengs JS. Portion size can be used strategically to increase vegetable consumption in adults. Am J Clin Nutr. 2010;91(4):913–22.
65. French SA, Mitchell NR, Wolfson J, et al. Portion size effects on weight gain in a free living setting. Obesity (Silver Spring). 2014.

41
66. Fisher J, Rolls BJ, Birch LL. Children’s bite size and intake of an entree are greater with large portions than with age-appropriate or self-selected portions. Am J Clin Nutr. 2003;77(5):1164–1170.
67. Fisher JO. Effects of Age on Children’s Intake of Large and Self-selected Food Portions. Obesity. 2007;15(2):403-412.
68. Fisher JO, Arreola A, Birch LL, Rolls BJ. Portion size effects on daily energy intake in low-income Hispanic and African American children and their mothers. Am J Clin Nutr. 2007;86(6):1709–1716.
69. Fisher JO, Liu Y, Birch LL, Rolls BJ. Effects of portion size and energy density on young children’s intake at a meal. Am J Clin Nutr. 2007;86(1):174–179.
70. Fisher JO, Kral TVE. Super-size me: Portion size effects on young children’s eating. Physiol Behav. 2008;94(1):39–47.
71. Looney SM, Raynor H a. Impact of portion size and energy density on snack intake in preschool-aged children. J Am Diet Assoc. 2011;111(3):414–8.
72. Savage JS, Haisfield L, Fisher JO, Marini M, Birch LL. Do children eat less at meals when allowed to serve themselves? Am J Clin Nutr. 2012;96(1):36–43.
73. Smith L, Conroy K, Wen H, Humphries D. Portion size variably affects food intake of 6-year-old and 4-year-old children in Kunming, China. Appetite. 2013;69:31-38.
74. Geier AB, Rozin P, Doros G. Unit bias. A new heuristic that helps explain the effect of portion size on food intake. Psychol Sci. 2006;17(6):521–5.
75. Rolls BJ, Roe LS, Meengs JS. Reductions in portion size and energy density of foods are additive and lead to sustained decreases in energy intake. Am J Clin Nutr. 2006;83(1):11–17.
76. Freedman MR, Brochado C. Reducing portion size reduces food intake and plate waste. Obesity (Silver Spring). 2010;18(9):1864–6.
77. Schwartz J, Riis J, Elbel B, Ariely D. Inviting consumers to downsize fast-food portions significantly reduces calorie consumption. Health Aff (Millwood). 2012;31(2):399–407.

42
78. Glanz K, Resnicow K, Seymour J, et al. How major restaurant chains plan their menus: the role of profit, demand, and health. Am J Prev Med. 2007;32(5):383–8.
79. 2014 Restaurant Industry Pocket Factbook. National Restaurant Association. http://www.restaurant.org/Downloads/PDFs/News-Research/research/Factbook2014_LetterSize.pdf. Accessed May 22, 2014.
80. Lower Calorie Foods It’s Just Good Business. Obesity Solutions Initiative. Feb. 2013. Hudson Institute. https://s3.amazonaws.com/media.hudson.org/files/publications/lower_calorie_foods.pdf. Accessed June 2, 2014.
81. Bloom J. American Wasteland. Cambridge, MA: Perseus Book Group;2010:130-131.
82. Pei Wei Restaurant. http://www.peiwei.com/index.aspx. Accessed June 20, 2014.
83. Noodles and Company. http://www.noodles.com/food/. Accessed June 20, 2014.
84. Gase L, Dunning L, Kuo T, Simon P, Fielding JE. Restaurant owners’ perspectives on a voluntary program to recognize restaurants for offering reduced-size portions, Los Angeles County, 2012. Prev Chronic Dis. 2014;11:E44.
85. Britt JW, Frandsen K, Leng K, Evans D, Pulos E. Feasibility of voluntary menu labeling among locally owned restaurants. Health Promot Pract. 2011;12(1):18–24.
86. Vermeer WM, Steenhuis IHM, Leeuwis FH, Heymans MW, Seidell JC. Small portion sizes in worksite cafeterias: do they help consumers to reduce their food intake? Int J Obes (Lond). 2011;35(9):1200–7.
87. Ram Rao, Brian Wansink, Sanjay Jain. Commentaries and Rejoinder to “Marketing of Vice Goods: A Strategic Analysis of the Package Size Decision” by Sanjay Jain. Marketing Science. 2012 ;31(1):52-58.
88. Gunders D. Wasted : How America Is Losing Up to 40 Percent of Its Food from Farm to Fork to Landfill. Natural Resources Defense Council 2012;(august).

43
89. Gustavsson J, Cederberg C, Sorensson U, van Otterdiijk R, Meybeck A. Global Food Losses and Food Waste: Extent, Causes, and Prevention. Food and Agriculture Organization of the United Nations. Rome 2011.
90. Parfitt J, Barthel M, Macnaughton S. Food waste within food supply chains: quantification and potential for change to 2050. Philos Trans R Soc Lond B Biol Sci. 2010;365(1554):3065–81.
91. Reducing Food Waste for Businesses. United States Environmental Protection Agency. http://www.epa.gov/foodrecovery/. Page last updated on 3/10/2014. Accessed June 20, 2014.
92. Hunger and Poverty Statistics. Feeding America. http://feedingamerica.org/hunger-in-america/hunger-facts/hunger-and-poverty-statistics.aspx. Accessed June 21, 2014.
93. Coleman-Jensen, A, Nord M., Singh A, Household Food Security in the US in 2012. Economic Research Service (ERS), US Department of Agriculture. 2013.
94. Hall KD, Guo J, Dore M, Chow CC. The progressive increase of food waste in America and its environmental impact. Sorensen TIA, ed. PLoS One. 2009;4(11):e7940.
95. Buzby JC, Heyman J. Total and per capita value of food loss in the United States. Food Policy. 2012;37:561-570.
96. Municipal solid Waste in The United States: 2009 Facts and Figures. U.S. Environmental Protection Agency, Office of Solid Waste. December 2010.
97. Environmental Protection Agency. Overview of Greenhouse Gases. http://epa.gov/climatechange/ghgemissions/gases/ch4.html. Accessed July 2, 2014.
98. Bloom J. American Wasteland. Cambridge, MA: Perseus Book Group;2010:125.
99. Food Waste Reduction Alliance. www.foodwastealliance.org. Accessed July 1, 2014.
100. Best Practices & Emerging Solutions Toolkit. Food Waste Reduction Alliance. Spring 2014;1.
101. LeanPath Food Waste Prevention. www.leanpath.com. Accessed July 2, 2014.

44
102. A Short Guide to Food Waste Management Best Practices. LeanPath. http://www.leanpath.com/docs/Waste_Guide_o.pdf. Accessed July 2, 2014.
103. The Business and Cultural Acceptance Case for Trayless Dining. Aramark. July 2008. http://www.aramarkhighered.com/assets/docs/ whitepapers/ARAMARK%20Trayless%20Dining%20July%202008% 20FINAL.PDF. Accessed July 30, 2014.

45
Chapter 2: Objective and Hypotheses
Objective
The primary objective of this study was to determine the impact of offering
flexible portion-sized items in 2 food service environments on consumer
acceptance, consumption, plate waste and business profitability.
Patterson Dental Hypotheses
1. Customers will select reduced-size portions and sales of reduced-portions
will make up at least 10% of total entrée sales.
2. Consumption of reduced-portion size entrees will be associated with
decreased intake of calories and selected nutrients as compared to
baseline.
3. Consumption of reduced-portion size entrees will be associated with
decreased plate waste.
TCC Hypotheses
1. Customers will select reduced-size portions and sales of reduced-portions
will make up at least 10% of total entrée sales.
2. Consumption of reduced-portion size entrees will be associated with
decreased intake of calories and selected nutrients as compared to
consumption of full-size entrees during the post phase.

46
3. Consumption of reduced-portion size entrees will be associated with
decreased pate waste.
Research Question
1. This study will explore the impact of offering reduced size portions on
business profitability.

47
Chapter 3: Material and Methods Overview Methods and results will be presented separately for the 2 food service
environments; Patterson Dental and the Town and Country Club in the
Minneapolis/St. Paul metropolitan area. Patterson Dental is a business cafeteria
that serves # employees. Roughly 125-200 employees dine in the cafeteria daily.
Employees can choose from the entrée of the day, cold and hot sandwiches,
soup or salad bar. Entrees, full sandwiches and the large salad bar are priced at
$3.00 per meal. The small salad bar, soup bowl and half sandwich are priced at
$1.50 each. Employees can pay by cash or can pre-purchase discounted meal
tickets worth $3.00 each. Reduced-sized entrees, priced at $1.50, were
introduced 5 weeks into the study and were available for all meals during the last
7 weeks of the study.
The Town and Country Club is a private golf club with over 500 members.
Members pay an annual fee to join the club. To encourage members and their
families to visit the club regularly, $250 is credited to their account quarterly to
cover dining expenses. This money is lost if the member does not use it within
the quarter. Many members dine in the restaurant on a frequent basis. Each
month the chef creates a new menu and includes a number of appetizers,
desserts and entrees such as steaks, fish and pasta, which range in price from
$18 - $32. Additionally, a monthly bar menu is created, which includes small

48
plates and appetizers, which range in price from $7 – 15. Each time they dine,
members receive both menus as well as a list of 2 or 3 daily specials. Prior to the
intervention, reduced-size portions existed for a single entrée. The filet mignon
had been available in 4 oz, 6 oz and 8 oz serving sizes for one year prior to the
start of the study. During the intervention period, reduced-size portions of 5
additional entrees and 1 appetizer were added to the menu. The newly added
reduced-size entrees were priced at $15-$17 and the appetizer at $5.
Patterson Dental Materials and Methods
Planning/Schedule
Prior to the start of the study, researchers regularly met with the cafeteria
manager to provide a study overview and discuss the introduction of reduced-
portion sized entrees, survey development, protocols and plate waste data
collection. A plate waste data collection schedule was set up to include a variety
of different types of entrees served. It was intended to include identical entrees
served in both the pre and post-phase of the study. Due to menu changes that
occurred throughout the study, only 6 entrees were available in both the pre-
phase and the post-phase of the study. All entrees during the post-intervention
period were available in both the full and reduced-portion sizes.

49
Subjects
Survey and food consumption data were collected from Patterson Dental
employees (>18 years) from April to July 2013. Employees were asked to
complete an online survey prior to collection of baseline food consumption data
and at the end of the study to collect information on patronage, cafeteria
satisfaction, menu items ordered and the health consciousness of the
employees. Plate waste data were collected from employees who purchased
lunch in the employee cafeteria. No compensation was provided for participation.
The University of Minnesota Institutional Review Board reviewed this study and
confirmed that the study met the criteria for exempt status, category 2:
surveys/interviews, observation of public behavior.
Experimental Schedule
Invitations to complete the survey were sent via internal e-mail from the
cafeteria manager to all employees prior to collecting baseline food consumption
data and at the end of the study. Plate waste and consumption data were
collected over the course of 12 weeks. (Table 1) Baseline data were collected
over 5 weeks prior to the introduction of the reduced-size entrée items.
Experimental data were collected over an additional 7 weeks after the
introduction of the reduced-sized entrée. Sales data were collected for all days
within the 12-week period.

50
Surveys
Surveys were created by a marketing consultant on the research team,
who has worked extensively as a marketer in the packaged foods and food
service industry. Survey questions were developed through a series of meetings
with the kitchen manager and the research team. Learning objectives were
developed, which guided the question development. The research team reviewed
each survey and any necessary adjustments were made. The Patterson Dental
human resources department then reviewed and approved the surveys. Upon
final approval, the surveys were sent via internal email by the cafeteria manager
with an invitation and a consent form from the University of Minnesota to all on-
site employees prior to the start of baseline data collection and at the completion
of the study.
The first survey (Appendix 1) assessed age and gender, frequency of
cafeteria use, cafeteria satisfaction, purchasing history, menu item satisfaction,
the importance of cafeteria menu attributes and frequency of healthful behaviors.
The second survey (Appendix 2) included the same questions, but also included
the half-size entrée as a menu item selection.
Customers were asked to note their age range and gender. Frequency of
cafeteria use was determined by having participants choose between 0 and 10
for how many days they purchased lunch at the cafeteria during the past 2
weeks. To assess cafeteria satisfaction, participants were asked to rate a
number of cafeteria qualities on a scale from 1 (not at all satisfied) to 5

51
(completely satisfied). Customers were also asked to indicate which menu items
they purchased during the past 2 weeks and check the number of times they
purchased that menu item on a scale of 1 to 10. Customers were also asked to
rate satisfaction of their purchases during the past 2 weeks on a scale of 1 (not at
all satisfied) to 5 (completely satisfied). They were asked if they noticed any
changes in the foods offered in the previous 2 weeks and if so to specify. They
were asked to rate on a scale of 1 (not important at all) to 5 (extremely important)
a number of possible needs, such as convenience and price, with respect to how
important the needs are at lunch. Lastly, participants were asked to rate how
often they follow a number of healthful behaviors on a scale of 1 (never) to 5
(always).
Plate Waste Collection Protocol
Prior to the start of the study, the research team met with the cafeteria
manager on multiple occasions to discuss the study and set up a data collection
protocol. Before baseline data collection, the plate waste data collection protocol
was pilot tested on April 4, 2013. During this pilot day, standard portion sizes of
the entrée were served. Plate waste was collected for all employees dining in the
cafeteria. As inefficiencies were identified in the protocol, modifications were
made to the original procedure. The modified data collection protocol (Appendix
3) was used to train 4 undergraduate research assistants prior to assisting with
data collection. Additional training was given at the cafeteria by the primary

52
researcher, who was onsite on all plate waste measurement days. The
researchers consistently used the data collection protocol throughout this study.
Plates:
All menu items were served on standardized paper or Styrofoam plates.
Different plates and bowls were used for each menu item including large and
reduced-entrees, full and half sandwiches and full and half salads. Full-sized
entrées were served on a three-section Styrofoam plate; large sandwiches on a
one section Styrofoam plate; large salads on a large green patterned paper plate.
Half-size sandwiches and salads were served on small paper plates with
distinctly different patterns and when introduced, the half-sized entrees were
served on smaller 3 section paper plates. Fifteen samples of each plate type
were weighed and averaged to establish uniform mean plate weights.
Plates were pre-counted prior to the lunch service and were handed out
by staff as meals were purchased. The remaining plates were recounted at the
completion of the lunch service to determine the number of each menu item sold.
Average Serving Sizes
Standardized serving utensils were used to dish each menu item to
ensure consistent serving sizes. To establish the serving weights for each entrée
component, 15 samples of each item were weighed and recorded on a serving
weight data collection form (Appendix 4). Mean serving sizes were calculated for

53
each entrée item. Cold sides were not pre-plated so customers could choose
their own portion size, therefore cold sides were not included in this analysis.
Signage
With the introduction of reduced-size portions, a sign identifying the
reduced-portion size entrée and price was placed at the hot food station with a
plated reduced-portion entrée. This was done to inform employees that the
reduced-portion size entrees were available and to display the difference in size
from the usual full servings.
Lunch process
Employees entered the cafeteria from a single entrance. Prior to entering
the cafeteria, employees collected silverware, napkins, trays and a beverage.
Coffee, tea and water were available free of charge. Sodas were available for
purchase via vending machines. Once the employees entered the cafeteria, they
proceeded through the tray line. Two stations were set up in the cafeteria line –
one for hot foods and the other for cold or hot sandwiches. Employees who
chose the salad bar also went to the sandwich station to obtain a salad bar plate
from the cafeteria staff. They then proceeded to the self-serve salad bar to make
their salad selections. Once employees ordered their food, they paid at the cash
register either by cash or by pre-paid meal ticket. For certain meals, hot foods
were plated at the cafeteria line and cold food, such as a side salad, were

54
available in a separate self-serve line. Once customers received their hot food
and paid for their meal, they proceeded to the self-serve line to dish their cold
sides.
At the completion of lunch, all food and paper waste and recyclables were
brought to a single waste station. Silverware and glasses were placed on a
nearby counter at the dishwashing station.
Waste Collection
Throughout the lunch service a research assistant was positioned at the
waste station. The researcher collected all plates and bowels including waste for
each employee and placed them on a rolling cart stationed at the waste
collection area. Multiple plates from one employee were stacked to ensure they
were recorded together. Cracker and condiment wrappers were kept on plates to
account for intake.
Plate Waste Measurement
The primary researcher was stationed in the back of the kitchen at a
weight station. Plates and food waste area were transferred from the waste
collection area via a rolling cart to the weigh station. At the weigh station, two
digital scales were tared to zero. Plate waste was determined by weighing each
plate collected. Plate waste measurements were recorded on a data collection
record sheet. (Appendix 5) If a plate appeared empty, plate waste was recorded

55
as zero. If waste was present on the plate, the plate was weighed initially and
that weight was recorded. Any remaining entrée waste was removed from the
plate and the plate was weighed a second time with only the starch and
vegetable remaining. This was recorded as sides only. If a starch was present, it
was removed and the plate was weighed a third time and the vegetable only
weight was recorded.
The amount wasted for each of the menu components was calculated as
such:
Total Plate Waste Weight – Sides only = Main entrée waste
Sides only – Vegetable only = Starch waste
Vegetable only – Plate weight = Vegetable waste
Determining Plate Waste – Special Considerations
Any peels, bones or parts of food not normally consumed that remained
on the plate were removed and not included in the plate waste calculations.
Condiments such as ketchup or mustard that were not part of the served entrée
were wiped from the plate or food items were removed from the condiment-filled
plate and placed on an empty plate for weighing. Food items, such as French
fries, covered in condiments were wiped to remove condiments.

56
Amount Consumed
The amount consumed for each employee was determined by subtracting
the plate waste of a particular item from the average serving weight. For
example, if the average serving size of lasagna is 250 g and the plate waste for a
particular sample of lasagna is 30 g, then 250g – 30g = 220 g consumed. Plate
waste was calculated for each meal component on the plate.
Nutritional Analysis
Recipes were obtained from the Cafeteria Manager and were entered into
the Nutrition Data System for Research, NDSR ©2013. Nutritional analysis was
done to identify the energy and nutrient content of the served portion. (Table 2)
Nutrients analyzed included key nutrients of concern linked to obesity and other
chronic diseases, such as fat, saturated fat, cholesterol and sodium. Other
nutrients analyzed included common shortfall nutrients, such as calcium, fiber,
and potassium and iron.104 Analysis was conducted for each plated menu item
based on mean serving weight, which was calculated from 15 sample weights of
each menu item.
Management Interview
The primary researcher and the marketing consultant interviewed the
cafeteria manager after the completion of the study. Interview questions were
developed by the business consultant to assess the process of adding reduced-

57
portion sizes to the menu. (Appendix 6) Questions asked about any challenges
the cafeteria faced adding the reduced-portion sizes, customer feedback, and the
impact on their business operations. Interviews were transcribed, reviewed, and
summarized by the marketing consultant
Statistical analysis
All data were analyzed using SAS version 9.3 or 9.4 (Cary, NC), with
comparisons made at α = 0.05. Test of equal proportions were conducted for
each menu item to determine if there were an equal proportion of customers
purchasing the entrée during the pre and post phase. This was done to ensure
that the individuals choosing the half portion items were individuals who had
previously purchased the full size entrée.
The tests of equal proportions (Table 3) yielded 5 menu entrees with a
relatively equal number of employees purchasing the entrée in the pre condition
when only the full portion was available (pre-phase) and the post condition where
both the full and reduced size entrée were available (post-phase). One entrée,
the Chicken Parmesan, had a significantly greater proportion (p = 0.028) of
employees purchase the entrée in the post-phase when compared to the pre-
phase. Therefore, it is not included in the calorie and nutrient analysis.
T-tests were performed to determine the difference between energy
consumption, nutrient intake and food waste for the aggregate of the 5 meals
offered during the pre phase and the aggregate of the 5 meals offered during the
58
post phase of the study. Chi – squared tests were performed to determine the
difference between the demographics of pre survey participants and post survey
participants. Chi squared tests were also performed to determine demographic
differences between reduced-portion buyers and non-buyers and to determine
differences in survey data between reduced-portion buyers and non-buyers.

59
Table 1 Patterson Dental plate waste collection schedule
Condition Date* Day of Week Entrée Served
Pre - Only Full Size Entrees
Available
4/4/13 Thurs. Meatloaf, Scalloped Potatoes, Green Beans 4/9/13 Tues. Spaghetti with Meat Sauce, Side Salad 4/16/13 Tues. Pork Loin, Mac and Cheese, Asparagus 5/2/13 Thurs. Chicken or Vegetable Lasagna, Side Salad 5/3/13 Fri. Chopped Steak, Mashed Potatoes, Veggies
Post - Full and Half
Size Entrees
Available
5/8/13 Wed. Meatloaf, Scalloped Potatoes, Green Beans 5/13/13 Mon. Spaghetti with Meat Sauce, Side Salad 5/20/13 Mon. Pork Loin, Mac and Cheese, Asparagus 6/5/13 Wed. Chicken or Vegetable Lasagna, Side Salad 6/6/13 Thurs. Chopped Steak, Mashed Potatoes, Veggies
*Data collected on additional days, but dates where pre and post plate waste data were available and met test of equal proportions were listed.

60
Table 2 Patterson Dental nutritional content of mean full and half portion entrée serving size*
*Based on collection day when both sizes were both entrée sizes were available
Entrée F = Full size H = Half size
Kcal Fat (g)
Chol (mg)
Na (mg)
Sat FA (g)
Fiber (g)
Ca (mg)
K (mg)
Fe (mg)
Pork Loin F Pork Loin H
579 306
29.9 10.5
137 75
752 414
13 7.2
3.5 1.9
335 190
824 430
3.5 1.8
Chopped Steak F Chopped Steak H
646 322
40.9 20.6
167 81
1405 685
19 9.8
4.7 2.4
168 83
1157 565
6 3.1
Lasagna F Lasagna H
551 262
34.4 16
118 53
806 363
21.6 9.7
3.2 1.4
511 230
308 138
1.8 0.8
Meatloaf F Meatloaf H
707 342
42.7 21.5
236 116
599 312
18.6 9.6
6.3 3.3
271 143
1228 642
6.5 3.3
Spaghetti F Spaghetti H
675 377
23.7 13.7
66 39
1208 689
7.9 4.6
6.4 3.5
73 42
795 459
5.8 3.3

61
Table 3 Patterson Dental test of equal proportions Entree Entrée/
Total Proportion Full Only
Entrée/ Total
Proportion Full & Half
P-Value
Meatloaf 111/157 0.707 104/166 0.627 0.125
Spaghetti 106/189 0.561 136/215 0.632 0.142 Pork Loin 103/173 0.595 131/210 0.624 0.570 Lasagna 113/180 0.628 132/203 0.650 0.647 Chopped Steak 117/170 0.688 124/191 0.649 0.432
Ckn. Parmesan 109/192 0.634 155/210 0.738 0.028*
* Significant at P < 0.05

62
Town and Country Club Materials and Methods
Planning/Schedule
Prior to the start of the study, the researchers met with the chef and
assistant club manager on numerous occasions to discuss the different aspects
of the study including which menu items to offer in reduced-portions, survey
development, plate waste collection protocols and to set up a schedule for plate
waste data collection. All entrees with the exception of the vegetarian option
were available in full and reduced sizes during the post-intervention period. Data
collection days were set up for Thursday, Friday and Saturday, as entrée sales
were higher on these days.
Subjects Survey and food consumption data were collected from Town and Country
Club members (>18 years) from April to June 2013. Only club members who
completed a survey questionnaire or purchased dinner in the restaurant on data
collection days were included in the study. Members were asked to complete an
online survey prior to collection of baseline food consumption data and at the end
of the study to assess purchases in the past 3 weeks, the likelihood of ordering in
the next 3 weeks and participation in healthy behaviors. Plate waste data were
collected from all diners at a table, where at least one person ordered one of the
test menu items. No compensation was provided for participation. The University
of Minnesota Institutional Review Board reviewed this study and confirmed that

63
the study met the criteria for exempt status, category 2: surveys/interviews,
observation of public behavior.
Experimental Schedule
Surveys invitations were sent via internal e-mail from the club manager to
all club members prior to collecting baseline food consumption data and at the
end of the study. Plate waste and consumption data were collected on
Thursdays, Fridays and Saturdays over the course of 7 weeks. Three weeks of
baseline data were collected prior to the introduction of the reduced-size entrées.
Plate waste data were collected for an additional 4 weeks after the introduction of
the reduced-sized entrées. Sales data were collected for all days within the 7-
week period.
Surveys
Surveys were developed by a marketing consultant on the research team,
who has worked extensively as a marketer in the packaged foods and food
service industry. Survey questions were developed through a series of meetings
with the chef and assistant club manager and the research team. Learning
objectives were developed, which guided the development of survey questions.
The research team reviewed each survey and any necessary adjustments were
made. The Club membership committee and management then reviewed and
approved the surveys. Once final approval was obtained from all parties, the
surveys were sent via internal e-mail from the cafeteria manager to all on-site

64
employees prior to the start of baseline data collection and at the completion of
the study.
Invitations to complete an online survey were sent by club management to
all club members prior to the start of baseline data collection and at the
completion of the study. The first survey (Appendix 7) collected data on age
range and gender, purchases during the previous 3 weeks, likelihood of
purchasing full and reduced-size menu items in the next 3 weeks, and frequency
of healthful behaviors. The second survey (Appendix 8) included the same
questions, but also included the half-size entrée as menu item selections for both
the past 3 weeks and the next 3 weeks.
Survey participants indicated which menu items they purchased in the
past 3 weeks by checking 1 of 3 choices: have not purchased, not sure or have
purchased. Likelihood of purchasing specific menu items in the upcoming 3
weeks was indicated by checking 1 of 5 choices ranging from “definitely would
not buy” to “definitely would buy”. Lastly, participants were asked to rate how
often they follow a number of healthy behaviors on a scale of 1 (never) to 5
(always).
Plate Waste Collection Protocol
Prior to the start of the study, the research team met with the chef and
assistant club manager on multiple occasions to discuss the study and develop a
plate waste collection protocol. Before baseline data were collected, a pilot day

65
occurred on April 12, 2013. During this pilot day, standard portion sizes of the
entrée were served. Plate waste data were collected for members dining in the
restaurant. As inefficiencies were identified in the protocol, modifications were
made to the original procedure. The modified data collection protocol was used
to train 4 undergraduate research assistants prior to assisting with data
collection. Additional training was given at the restaurant by the primary
researcher, who was onsite and working alongside research assistants on all but
the last 3 plate waste measurement days. Researchers consistently used the
data collection protocol throughout this study.
Meal Process
As members entered the restaurant they were seated in one of three
dining rooms; a formal dining room, a bar room with counter seating as well as
booths and tables, or a more casual dining area. Each member received 2
menus, a bar menu containing appetizers and more casual items and an entrée
menu containing the main entrees, salads and desserts. All diners could choose
items from either menu. When additional reduced-portion size menu items were
introduced, updated menus were printed. These updated menus replaced the
previous menus and included both the full and the reduced-portion size items on
the menu.

66
After diners placed their orders with their server, the server went to the
drink station, a separate room off of the kitchen to pour drinks for service at the
table. In the same room, servers also prepared a breadbasket for the table.
Bread was kept in warming drawers and each server individually cut a set
number of pieces for each table, based on the number of diners. Servers then
delivered drinks and the breadbasket to the table. After meals were prepared and
assembled, the server delivered the plates to the table.
At the end of the meal, plates were collected from the dining areas by
either the server or staff clearing tables and brought to the dishwashing area.
Food and paper waste were thrown away and empty plates, glasses and
silverware were placed on the dishwashing counter to be washed.
Data collection
Table number and customer demographic information were collected from
servers as each table was seated and recorded by the researchers on a data
collection sheet (Appendix 9). Information provided included the table number,
number of diners in the party, gender and estimated age range. Information was
collected for all tables where at least one diner ordered one of the test items.
Plate waste measurements for all diners at the table over 18 were also recorded
on the same data collection sheet.

67
Waste Collection
A weigh station was set up between the prep station and the dishwashing
station. On each data collection day, at least 2 researchers were present to
weigh plate waste. As plates were collected at the end of the meal and brought to
the dishwashing area, researchers collected the plates and waste prior to being
emptied. Table numbers and meal information was obtained from the server or
staff clearing tables and were recorded on the data collection sheet for each
plate.
Plate Waste Measurement
Prior to delivery to the customer, the full plate of food was weighed. The
pre-weight was recorded and table number and customer demographic data
were obtained from the server and recorded.
At the completion of the meal, the finished plates were collected from the
table and brought directly to the researchers. Plates were weighed and final
weight was recorded. The scale was tarred to the weight of an empty cardboard
boat. Each menu component was placed in a boat and weighed separately.
Waste weights for each of the menu components were recorded.
Amount Consumed
The amount consumed for each diner was determined by subtracting the
plate waste of a particular item from the average serving weight. For example, if

68
the average serving size of halibut is 200 g and the plate waste for a particular
sample of halibut is 30 g, then 200g – 30g = 170 g consumed. Consumption
amounts for each of the meal components were then added to give a total
consumption amount. Plate waste for each meal component was added to give a
total waste amount.
Nutritional Analysis
Recipes were obtained from the Chef and were entered into the Nutrition
Data System for Research, NDSR ©2013. Nutritional analysis was used to
identify the energy and nutrient content of the served portion. (Table 5) Nutrients
analyzed included key nutrients of concern linked to obesity and chronic disease,
such as fat, saturated fat, cholesterol and sodium. Other nutrients analyzed
included common shortfall nutrients, such as calcium, fiber, potassium and iron.
Analysis was conducted for each plated menu item based on mean serving
weight, calculated from 15 sample weights.
Nutritional Analysis – Special Considerations
It was not possible to calculate the nutrient content of the red wine
reduction sauce with NDSR, therefore researchers consulted with a Chef who is
also Registered Dietitian. Based on his recommendations, the nutrient content
was calculated in NDSR for the full 2 cup serving size based on the TCC chef’s

69
recipe and the calories attributed to the alcohol were subtracted. This procedure
was used because reducing the red wine burns off the alcohol.
Management Team Interview
The Chef and Assistant Country Club Manager were interviewed after the
completion of the study by the primary researcher and business consultant.
Interview questions were developed by the business consultant to assess the
process of adding reduced-portion sizes to the menu. (Figure 6) Questions were
asked about any challenges the cafeteria faced when adding the reduced-portion
sizes, customer feedback, and the impact on business operations. Interview
transcripts were reviewed by the consultant and summarized.
Statistical Analysis
All data were analyzed using SAS version 9.3 or 9.4 (Cary, NC), with
comparisons made at α = 0.05. T-tests were performed to determine the
difference between energy consumption, nutrient intake and food waste for the 7
reduced-portion entrees (half halibut, half salmon, half walleye, half lamb, 6 oz.
strip steak, 4 oz. filet mignon and 6 oz. filet mignon) and the 6 full-sized entrees
(halibut, salmon, walleye, lamb, 12 oz. strip steak and 8 oz. filet mignon) offered
during the post phase of the study. Chi – squared tests were performed to
determine the difference between the demographic characteristics of pre survey
participants and post survey participants. Chi squared tests were also performed

70
to determine differences in demographic characteristics between reduced-portion
buyers and non-buyers and to determine differences in survey responses
between reduced-portion buyers and non-buyers.

71
Table 4 – TCC entrée components*
Meat Vegetable Starch Filet Mignon Spring
Vegetables Roasted New Potatoes
Strip Steak Asparagus Caramelized Onion Mashed
Potatoes Halibut Spring
Vegetables Roasted New Potatoes
Walleye Carrot Batons Spring Vegetable Risotto Salmon Garlic Spinach Spring Vegetable Risotto Lamb Chops Smashed Peas Spring Vegetable Risotto

72
Table 5 TCC nutritional content of mean full and half portion entrée serving size including sides
Entrée F = Full Portion H = Half
Kcal Fat (g)
Chol (mg)
Na (mg)
Sat FA (g)
Fiber (g)
Ca2+ (mg)
K (mg)
Fe (mg)
Portion Halibut F Halibut H
647 301
37.9 18.3
171 78
1647 777
20.1 9.8
5.5 2.6
71 33
1850 830
2.7 1.3
Walleye F Walleye H
963 517
55.3 29.9
375 192
1590 987
32.7 17.3
4.7 2.6
372 189
1583 814
8.4 4.3
Salmon F Salmon H
612 320
27.9 14.2
148 69
1679 929
11.3 6.2
4.1 2.4
200 113
1620 793
6 3.2
Lamb Chops F Lamb Chops H
1308 692
102.5 43.5
139 73
1049 652
23.5 12.5
10 5.5
124 65.5
1195 629
6.2 3.3
Strip Steak F Strip Steak H
1189 600
74.9 37.8
321 161
2411 1219
35.3 17.9
7.2 3.7
220 112
1934 1090
7.7 3.9
4 oz. Filet 6 oz. Filet 8 oz. Filet
363 653 746
18.9 35.3 38.9
96 160 196
999 1924 2078
9.1 17.5 18.8
2.3 4.9 4.9
45 78 92
944 1671 1968
4.0 6.5 8.2
73
Chapter 4: Results
Patterson Results
Nutrient Intake and Plate Waste
Calorie and nutrient intakes, summarized in Table 6, were significantly
lower for the combined 5 entrees during the post-phase when both full and half
size entrees were served compared to the pre-phase. The number of calories
consumed decreased from a mean of 695 during the pre-phase period to 555
during the post-phase period (p<0.0001). Nutrients of concern, including total fat,
saturated fat, cholesterol and sodium were also significantly lower during the
post-phase period (all at p<0.0001). In addition to the decreased intake of
nutrients of concern, decreased intakes of shortfall nutrients, such as fiber,
calcium, potassium and iron, were also observed (all at p<0.0001, except for
potassium at p<0.0005).
A significant decrease in plate waste was also observed during the post-
phase. Plate waste decreased from 45.5 g in the pre-phase to 29.7 g in the post
phase (p<0.0001).
Sales
Sales of reduced-portion entrees were lowest (5.3% of total entrée sales)
during the first week they were whereas sales were greater than 10% in several
subsequent weeks (Table 7). According to the cafeteria manager, some

74
confusion may have existed among cafeteria patrons regarding the use of pre-
paid meal tickets to pay for reduced-portion size entrees during the first week
they were offered. . Sales of reduced-portion entrees increased during the next 5
weeks ranging from 8.2% to 12.8% of weekly entrée sales.
Demographic Characteristics of Survey Participants
Survey participant demographic data by pre- and post-phase are
summarized in Table 8. No significant differences were observed in participants’
gender. The initial survey included 25 men and 25 women and the final survey
included 22 men and 19 women (p=0.728). The majority of participants for both
surveys were equally distributed between the age ranges of 25 to 34 and 55 to
64 years. No significant differences were found between the ages of the survey
participants by pre- versus post-phase (p=0.850).
Post-phase surveys were also analyzed to determine if there were any
differences in demographic characteristics between the individuals who indicated
they purchased a reduced-portion entrée and those who indicated they did not
purchase a reduced-portion entrée. (Table 9) No significant differences were
observed for age (p=0.890) or gender (p=0.322).
Survey Responses
The post-phase survey response rate was between 33-50%. Responses
were analyzed to determine whether responses differed between individuals who

75
indicated that they purchased the reduced-portion entrees and those who did not.
(Table 10) Responses to the question regarding the importance of certain needs
at lunch were pooled for those who responded with a 4 or 5 on a scale from 1
(not at all satisfied) to 5 (completely satisfied). No significant differences were
observed between the reduced-portion purchasers (half-portion buyers) and non-
purchasers (non-buyers) on convenience/accessibility (p=0.361), quality of
food/taste appeal (p=0.832), price/value (p=0.345), appetite satisfaction
(p=1.000), and environmental impact (p=0.175). Most (92.9%) respondents who
were half-portion buyers indicated that they were satisfied regarding the
health/nutrition of cafeteria options compared to non-buyers where only 69.4%
indicated they were satisfied (p=0.081).
Participants were asked how often they participated in a variety of
healthful behaviors with responses of “most of the time” or “always” pooled. No
significant difference were found between the reduced-portion purchasers and
non-purchasers on how often they indicated they eat balanced meals (p=0.114),
eat more fruit, vegetables and/or whole grain foods (p=0.363), limit portion sizes
to avoid overeating (p=0.860), avoid fat, cholesterol, salt, and/or sugar (p=0.278),
exercise vigorously multiple times each week (0.723), walk/take the stairs as
often as I can (p=0.412), follow a diet to lose weight (p=0.243), watch intake of
certain foods because of a health condition (p=0.345) and watch food intake to
manage weight (p=0.278).

76
Summary of Interview Results
The Cafeteria Manager felt that the addition of the reduced-size portions
was successful for selected entrees, both from a financial standpoint and from a
customer satisfaction standpoint. The manager indicated that the Patterson
cafeteria, a company-subsidized operation, observed reductions in costs.
Offering reduced-size portions allowed for preparation of less food, knowing that
a portion of their employees may choose the reduced-portion; thereby reducing
costs as well as waste. According to the manager, customer feedback indicated
that they enjoyed the addition of reduced-size entrées as it provided them with
greater flexibility to reduce intake or choose to pair a reduced-size entrée portion
with other menu items, such as a side salad or a bowl of soup. Based on
observations, the manager felt that the reduced-portion entrees appealed to
employees, who were more health conscious at all ages and women in particular.
The cafeteria continued to offer reduced-portion-sizes for select entrees after the
completion of the study.

77
Table 6 Patterson Dental calorie and nutrient intake by pre-phase (only full portions available) and post-phase (full and reduced-portions available)
Pre-Phase Mean (SE)
(n=521)
Post-Phase Mean (SE)
(n=603) P value1
Nutrient Calories 629 (4) 555 (5) <0.0001 Fat (g) 34 (0.4) 29.7 (0.4) <0.0001 Saturated Fat (g) 16.1 (0.2) 13.9 (0.2) <0.0001 Cholesterol (mg) 141 (2.4) 122 (2.3) <0.0001 Na (mg) 955 (13) 849 (13) <0.0001 Fiber (g) 4.6 (0.1) 4.1 (0.7) <0.0001 Calcium (mg) 291 (8.4) 238 (6.1) <0.0001 Potassium (mg) 796 (13.8) 728 (13.4) <0.0005 Iron (mg) 4.4 (0.1) 4.0 (0.1) <0.0001
1P-value for differences in nutrient intakes between pre-phase (only full size available) and post-phase (full and half size available) according to T- tests (P<0.05). Table 7 Patterson Dental percent reduced-portion entrée sales by week
Total Entrée Sales
Total Reduced-
portion Sales % Reduced-
portion Sales
Week 1 Post 569 30 5.3 Week 2 Post 519 60 11.6 Week 3 Post 633 81 12.8 Week 4 Post 436 36 8.3 Week 5 Post 746 61 8.2 Week 6 Post 603 65 10.8
Source: Cafeteria Sales Reports

78
Table 8 Patterson Dental demographic characteristics for respondents by survey phase
Pre-Phase
Survey (n=54)
Post-Phase Survey (n=50)
P-value1
Age # (%) # (%) 0.850 <25 years old 2 (3.8) 4 (8.0) 25-34 years old 12 (22.6) 11 (22) 35-44 years old 13 (24.5) 11 (22) 45-54 years old 12 (22.6) 13 (26) 55-64 years old 13 (24.5) 11 (22) 65 years or older 1 (1.9) 0 (0) Gender 0.728 Female 25 (50) 19 (46.3) Male 25 (50) 22 (53.7)
1P-value for differences between demographic characteristics for those responding to the pre-phase versus post-phase survey, according to chi square tests (P<0.05). Table 9 Patterson Dental demographic characteristics for post survey respondents by half portion buyer or non-buyer
Half Portion Buyers (n=14)
Non-Half Portion
Buyers (n=36) P-value1
Age n (%) n (%) 0.890 <25 years old 2 (14.3) 2 (5.6) 25-34 years old 3 (21.4) 8 (22.2) 35-44 years old 3 (21.4) 8 (22.2) 45-54 years old 3 (21.4) 10 (27.8) 55-64 years old 3 (21.4) 8 (22.2) 65 years or older 0 (0) 0 (0) Gender 0.322 Female 7 (58.3) 12 (41.4) Male 5 (41.7) 17 (58.6)
1P-value for differences in demographic characteristics between half portion buyers and non-buyers by pre- and post-phase, according to chi square tests (P<0.05).
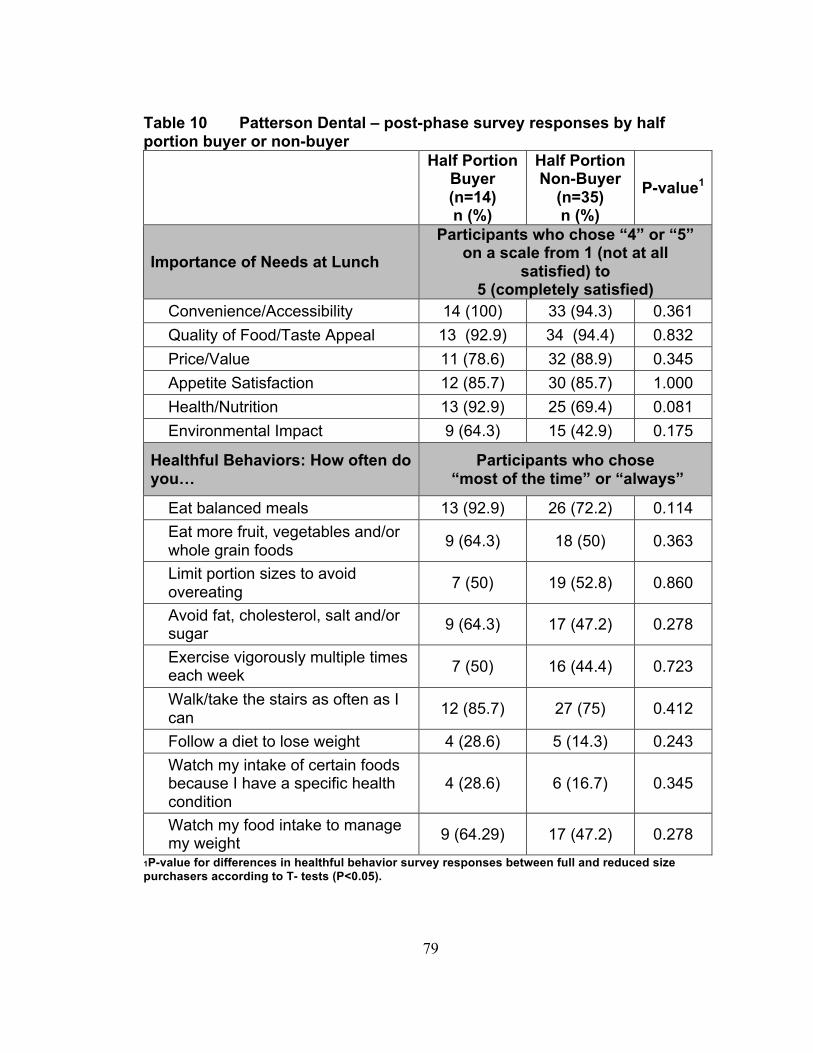
79
Table 10 Patterson Dental – post-phase survey responses by half portion buyer or non-buyer
Half Portion Buyer (n=14) n (%)
Half Portion Non-Buyer
(n=35) n (%)
P-value1
Importance of Needs at Lunch Participants who chose “4” or “5”
on a scale from 1 (not at all satisfied) to
5 (completely satisfied) Convenience/Accessibility 14 (100) 33 (94.3) 0.361 Quality of Food/Taste Appeal 13 (92.9) 34 (94.4) 0.832 Price/Value 11 (78.6) 32 (88.9) 0.345 Appetite Satisfaction 12 (85.7) 30 (85.7) 1.000 Health/Nutrition 13 (92.9) 25 (69.4) 0.081 Environmental Impact 9 (64.3) 15 (42.9) 0.175
Healthful Behaviors: How often do you…
Participants who chose “most of the time” or “always”
Eat balanced meals 13 (92.9) 26 (72.2) 0.114 Eat more fruit, vegetables and/or whole grain foods 9 (64.3) 18 (50) 0.363
Limit portion sizes to avoid overeating 7 (50) 19 (52.8) 0.860
Avoid fat, cholesterol, salt and/or sugar 9 (64.3) 17 (47.2) 0.278
Exercise vigorously multiple times each week 7 (50) 16 (44.4) 0.723
Walk/take the stairs as often as I can 12 (85.7) 27 (75) 0.412
Follow a diet to lose weight 4 (28.6) 5 (14.3) 0.243 Watch my intake of certain foods because I have a specific health condition
4 (28.6) 6 (16.7) 0.345
Watch my food intake to manage my weight 9 (64.29) 17 (47.2) 0.278
1P-value for differences in healthful behavior survey responses between full and reduced size purchasers according to T- tests (P<0.05).

80
TCC Results
Nutrient Intake and Plate Waste
Calorie and nutrient intakes were compared for individuals who purchased
full size entrées (n=90) and those who purchased a reduced size entrée (n=95)
during the post-phase of the study. (Table 11) The number of calories consumed
was significantly reduced for those who purchased a reduced-portion entrée
compared to those who purchased a full-size entree. Calories consumed
decreased from a mean of 695 to 393 (p<0.0001). Nutrients of concern,
including total fat, saturated fat, cholesterol and sodium all decreased
significantly compared to those who purchased a full-portion entree. In addition to
the decreased intake of nutrients of concern, decreased intakes of shortfall
nutrients, such as fiber, calcium, potassium and iron, were observed between
groups.
Plate waste was also reduced for the group that purchased the reduced-
size entrees compared to full-size entrée purchasers. Plate waste decreased
from a mean of 2.7 oz. for full-size entrée purchasers to 1.6 oz. for reduced-size
purchasers (p<0.0051).
Sales
During the pre-phase of the study, only one entrée, filet mignon, was
available in multiple portion sizes; 4 oz., 6 oz., and 8 oz. Sales of the 4 oz. and 6
oz. filet mignon, made up between 6.0 and 13.3 percent of total weekly entrée

81
sales. (Table 12) The introduction of 5 additional reduced-portion entrees,
increased the percentage of total entrée sales attributable to reduced-portion
entrees to 31.3% the week of the introduction, 18.8% the second week post
introduction and 26.0% and 29.4% the following weeks.
Demographic Characteristics of Survey Participants
Survey participant demographic data by study phase are summarized in
Table 13. No significant differences were observed for participant’s gender. The
initial survey included 87 men and 109 women and the final survey included 48
men and 76 women (p=0.32). Participants of both surveys ranged in age from 25
to over 65 years. No significant differences were found between the ages of the
survey participants for both phases (p=0.94).
Post-phase survey data were also analyzed to determine if there were any
differences in demographic characteristics between the individuals who indicated
they purchased a reduced-portion entrée and those who indicated that they did
not purchase a reduced-portion entrée. (Table 14) No significant differences in
age (p=0.70) or gender (p=0.29) were found.
Survey Responses
Survey data were also analyzed regarding responses to the question
asking about how often participants engaged in healthful behaviors. (Table 15)
Responses of “most of the time” or “always” were pooled. No significant

82
difference were found between the reduced-portion purchasers and non-
purchasers for how often they indicated they eat balanced meals (p=0.609), eat
more fruit, vegetables and/or whole grain foods (p=0.748), avoid fat, cholesterol,
salt, and/or sugar (p=0.160), exercise vigorously multiple times each week
(0.080), walk/take the stairs as often as I can (p=0.234), follow a diet to lose
weight (p=0.695), and watch food intake to manage weight (p=0.644).
Significant differences were observed for those who indicated that they
limit portion sizes to avoid overeating by reduced-portion purchasers versus non-
reduced-portion purchasers. More than 86% of individuals who indicated they
purchased a reduced size entrée said they limit portion sizes “most of the time”
or always compared to 71% of non-purchasers (p=0.037). Significant differences
were also seen between those who indicated that they watch their intake of
certain foods because of a specific health condition. Roughly 41% of the non-
purchasers selected “most of the time” or “always” compared to only 13.6% of
the reduced-size purchasers (p=0.022).
Summary of Interview Results
Although some initial challenges were experienced from staff getting used
to the introduction of reduced-size portions, both the Chef and Assistant Club
Manager felt the addition of reduced-portion entrees was successful, both
financially and based on feedback from their members. According to the Chef
“we are making 55-60% of the price of a full portion…and when you sell items at

83
a higher margin, you can’t lose on that.” They indicated that they had received
positive feedback from customers regarding the addition of the reduced-portion
entrees to the menu. The club’s dining committee, made up of club members has
asked the club to continue offering reduced-portion sizes. The Chef felt that the
reduced-portions appealed to 2 different segments of their membership, older
members and younger members, who ate at the club multiple times per week.

84
Table 11 TCC calorie and nutrient intake by full and reduced size portion for entrees purchased in post phase*
1P-value for differences in nutrient intakes between full and reduced size purchasers according to T- tests (P<0.05). *Includes Halibut, Walleye, Salmon, Lamb, Strip Steak, and Filet Mignon (does not include specials or other menu items not available in full and reduced sizes). Table 12 TCC Sales – number and percent of reduced-portion sized entrees prior and post intervention
Full
Sized Meals
Reduced-portion Meals
Total Meals
Reduced-portion
Time relative to menu change n % Three weeks prior 79 5 84 6.0 Two weeks prior 65 10 75 13.3 One week prior 99 12 111 10.8 Week of menu change 57 26 83 31.3 First week post 91 21 112 18.8 Second week post 91 32 123 26.0 Third week post 77 32 109 29.4
Source: Observed choice data
Full Size (n=90)
Mean (SE)
Reduced Size (n=95)
Mean (SE) P-value1
Nutrient Calories 695 (24.4) 393 (14.3) <0.0001 Fat (g) 40.3 (2.1) 21.8 (0.9) <0.0001 Saturated Fat (g) 18.4 (0.9) 10.9 (0.5) <0.0001 Cholesterol 187 (9.3) 108 (4.7) <0.0001 Na (mg) 1,396 (43) 934 (42.2) <0.0001 Fiber 4.4 (0.2) 2.6 (0.1) <0.0001 Calcium (mg) 168 (11.3) 82 (5.5) <0.0001 Potassium (mg) 1,397 (38.6) 863 (35.4) <0.0001 Iron (mg) 5.1 (0.2) 3.2 (0.2) <0.0001

85
Table 13 TCC demographic characteristics for respondents by survey phase
Pre-phase
Survey (n=212) n (%)
Post-phase Survey (n=134) n (%)
P-value1
Age 0.94 <25 years old 0 (0) 0 (0) 25-34 years old 12 (6.1) 7 (5.7) 35-44 years old 45 (22.7) 33 (26.6) 45-54 years old 62 (31.3) 35 (28.2) 55-64 years old 52 (26.3) 33 (26.6) 65 years or older 27 (13.6) 16 (12.9) Gender 0.32 Female 109 (55.6) 76 (61.3) Male 87 (44.4) 48 (38.7)
1P-value for differences in demographic characteristics between pre-phase and post-phase survey participants, according to chi square tests (P<0.05). Table 14 TCC demographic characteristics for post-phase survey respondents by half portion buyer or non-buyer
Half Portion Buyers (n=66) n (%)
Non-Half Portion Buyers (n=59) n (%)
P-value1
Age 0.29 <25 years old 0 (0) 0 (0) 25-34 years old 5 (7.6) 3 (5.1) 35-44 years old 14 (21.2) 19 (32.2) 45-54 years old 22 (33.3) 13 (22) 55-64 years old 19 (28.8) 14 (23.7) 65 years or older 6 (9.1) 10 (17) Gender 0.70 Female 38 (59.4) 37 (62.7) Male 26 (40.5) 22 (37.3)
1P-value for differences in demographic characteristics between post-phase half portion buyers and non-buyers, according to chi square tests (P<0.05).

86
Table 15 TCC post survey healthy behavior responses of “most of the time or always” by half portion buyer or non-buyer
Half Portion Buyer (n=66)
Half Portion Non-Buyer
(n=59) P-value1
Healthful Behaviors: How often do you… n (%) n (%)
Eat balanced meals 61 (92.4) 53 (89.8) 0.609 Eat more fruit, vegetables and/or whole grain foods 53 (80.3) 46 (78) 0.748
Limit portion sizes to avoid overeating 57 (86.4) 42 (71.2) 0.037*
Avoid fat, cholesterol, salt and/or sugar 32 (48.5) 36 (61) 0.160
Exercise vigorously multiple times each week 37 (56.1) 42 (71.2) 0.080
Walk/take the stairs as often as I can 53 (80.3) 42 (71.2) 0.234
Follow a diet to lose weight 20 (30.3) 16 (27.1) 0.695 Watch my intake of certain foods because I have a specific health condition
9 (13.6) 18 (30.5) 0.022*
Watch my food intake to manage my weight 44 (66.7) 37 (62.7) 0.644
1P-value for healthful behavior survey responses between full and reduced size purchasers according to T- tests (P<0.05). *Significant at P<0.05.

87
Chapter 5: Discussion
This study found that a subgroup of customers at both Patterson Dental
and the TCC selected the reduced-portion menu items with sales ranging from
10% to 30% across both food service environments. Both energy and nutrient
intakes decreased and food waste was reduced. Interview results with food
service managers indicated that the introduction of reduced-portion size entrees
was profitable for both locations.
Selection of Reduced-Portion Menu Items
Reduced-portion entrée sales began slowly at Patterson Dental. During
the first week the reduced-portion entrées were available, customers were
confused as to how they could use their pre-paid $3.00 meal ticket to purchase
the $1.50 reduced-size meal. After assurances from the cafeteria manager that
they could use the ticket to cover 2 meals, sales of reduced-portion entrees
averaged 10.3% of total entrée sales over the next 5 weeks. Reduced-portion
entrée sales at TCC made up an even greater percentage of total entrée sales
compared to Patterson. Sales of reduced-portion entrees increased from an
average of 10% initially to 26.4% of total entrée sales after the additional
reduced-portion entrees were added to the menu. In both locations, the
hypothesis that sales of reduced-portion entrées would exceed 10% of total sales
was accepted. In a similar study in the Netherlands, reduced-portion entrees

88
made up roughly 10% of total entrée sales.86 More research is needed to
determine whether this level of selection is great enough to impact overall intake
and waste.
Two factors were not examined in this study, which may have impacted
the percentage of individuals selecting the reduced-portion entrees. Numerous
studies have shown that the eating behavior of others can be used to determine
what is normal or appropriate within a community or peer group and can
influence an individual’s food selection and food intake. 105,106,107,108 This study
did not examine social norms, however the individual selection of either full or
reduced-portion entrees may have been influenced by the choice of other diners
at the table or the choice of the co-worker in front of them in the cafeteria line and
thus impacted the percentage of reduced-portion entrée sales. Additionally, a
study by MB Schwartz,109 found that the inclusion of a verbal prompt, such as
“Would you like fruit or juice with your lunch?” increased the percentage of youth
selecting fruit or juice as part of their school lunch from 60% to 90%. This study
did not include the use of a verbal prompt by either site, however it is possible
that the use of a verbal prompt may have increased reduced-portion entrée sales
beyond what was found in this study.
The difference in the percentage of reduced-portion sales between the 2
locations may be attributable to a number of factors. Increased familiarity is one
factor that motivates food choices of consumers.110 Because reduced-portion
sizes were available for the filet mignon prior to the start of the study at the TCC,

89
these consumers may have been more familiar with the concept of multiple
portion sizes than customers at Patterson Dental. Increased familiarity may have
increased their likelihood of ordering the reduced-portion meals. Reduced-portion
meals were offered at dinner at the TCC and at lunch at Patterson Dental.
Differences in customer expectations of usual amounts to consume at lunch and
dinner may have influenced the percentage of reduced-portion meal sales. The
difference between the price of the full portion entrée and the reduced-portion
may also have affected sales. A savings of $8-9 per meal at TCC may influence
a consumer to purchase a reduced-portion entrée more than a savings of $1.50
at Patterson. Additionally, age differences between the customers at the 2
locations could have affected sales. TCC survey respondents who indicated they
purchased the reduced-portion entrée tended to be older. Almost 70% were over
45 years of age and 9% were 65 years or older compared to roughly 43% over
45 years and no respondents 65 years or older at Patterson Dental.
Effects on Energy and Nutrition Intakes
The selection of reduced-portion entrees resulted in decreased caloric
consumption and intake of selected nutrients at both locations. Consumers who
selected the reduced-portion entrees consumed fewer calories. These findings
are consistent with those of Rolls et al. (2006),75 Freedman and Brochado
(2010),76 and Schwartz (2012),77 where decreased energy intake was observed
with reduced-portion sizes compared to larger portion sizes. Additionally,

90
individuals in the current study who consumed the reduced-portion sized entrees
had lower intakes of fat, saturated fat, cholesterol and sodium compared to those
who consumed the regular portion-sized entrées. Since most chain restaurant
entrees exceed USDA guidelines for calories, total fat, sodium and saturated
fat,19,20,21 reducing portion sizes may help consumers meet USDA
recommendation for intakes of these nutrients and energy. These benefits may
be offset somewhat by the decrease in common shortfall nutrients such as fiber,
calcium, potassium and iron. Adults, who consumed a meal away from home,
consumed fewer fruits, vegetables, dairy and whole grains, compared to those
who consumed a meal at home.18 Reducing the portion size of the meal does not
alter the original nutrient density of the meal, so reducing the size of a meal
already low in fruits, vegetables, dairy or whole grains, will either make no
change or have a negative effect. To limit any negative impact of reduced-portion
sizes on shortfall nutrients and food group intakes, the amounts of fruits,
vegetables, dairy and whole grains should be increased prior to down-sizing
entrees.
Effects on Subsequent Food Intake
Reduced energy and nutrient intakes were observed for reduced-portion
buyers in the current study, but data on consumption of other menu items, such
as a side salad or dessert were not collected. A previous study found that salad
sales increased with the introduction of reduced-portions.87 Another showed that

91
approximately 20% of reduced-portion buyers also purchased additional menu
items.86 The current study was able to collect data on some additional menu
purchases, however it was limited to certain items. At Patterson Dental,
purchases of side salads or soup was recorded, however it was not possible to
determine which individuals purchased cookies, as these items were often not
consumed in the dining room. At TCC, data were collected for the entire dining
table, including side salads, appetizers and desserts. While data on side salads
sales could be analyzed, many menu items such as appetizers and desserts
were often shared. Without direct observation, the amount of these items each
individual at the table consumed could not determined.
Effects on Plate Waste
Like Freedman and Brochado (2010),76 reductions in plate waste were
also observed for customers who purchased the reduced-portion entrees
compared to the full portion entrees at both Patterson and TCC. The plate waste
generated by reduced-portion purchasers was reduced by approximately 35% at
Patterson Dental and 40% at the TCC compared to full size purchasers.
Reduced food waste can result in decreased food costs and waste disposal
costs. Decreased food waste also limits the production of greenhouse gases as
less food ends up in landfills. Additional studies are needed to quantify the
impact of reduced-portion entrees on the total waste of a food service
establishment.

92
Effects on Business Profitability
The impact of introducing reduced-portion entrees on business profitability
was explored through follow-up interviews with the management teams at each
location. Both management teams found the change to be profitable, either
through reductions in costs or through increased profit margins and restaurant
traffic. Both locations have continued to offer reduced-portion entrees beyond the
completion of the study. Wansink87 also observed that the introduction of
reduced-portion sized entrees led to an increase in monthly sales over the same
months from the previous year.
Characteristics of Reduced-Portion Buyers
Vermeer et al. found that women were more inclined to purchase reduced-
portion entrées than men, which is consistent with the findings in the current
study. Close to 60% of reduced-portion entrees at both at Patterson Dental and
the TCC were women. Other studies have found women to be more health
conscious than men. Women are also more likely than men to utilize menu
labeling to choose healthier menu options.111 At the TCC many older individuals
purchased the reduced-portion entrees.
Reduced-portion buyers at Patterson Dental who completed surveys
appeared to be no more health conscious than non-buyers. No significant
differences were observed between buyers and non-buyers for perceived
importance of needs at lunch and frequency of engaging in healthful behaviors.

93
However at TCC, significant differences existed in the frequency with which
customers reported engaging in several healthful behaviors. Those who
purchased the reduced-portion items were more likely to limit portion sizes to
avoid overeating than individuals who did not purchase the reduced items.
However those who purchased full size menu items were more likely to watch
their intake of certain foods because of a health condition. It is unclear from this
study, why these individuals with health conditions did not choose to purchase a
reduced-portion entrée. More research is needed to determine motivation for
selecting the reduced-portion menu items.
Restaurant Feasibility
Increased sales and profits are the main considerations most restaurants
make when determining what items to include on their menu.78 Restaurant
customers want food to taste good, but they also want healthier options.1
Healthier options can be difficult to find at some restaurants or may not meet
taste preferences of consumers.21 Reduced-portion size entrees may be an
alternative that provides both taste and healthier menu options. Because
reducing the portion size does not impact the flavor profile of the entrée, it may
appeal to more consumers.
A previous study interviewed 18 restaurant owners regarding the feasibility
of offering reduced-size menu items.84 The owners expressed concerns
regarding logistical challenges, additional training, increased costs associated

94
with smaller sized products and reduced revenues. The management teams at
both Patterson Dental and the TCC indicated that the process of adding the
reduced-portion entrees required some additional work initially to ensure the staff
was fully trained and to determine specifications for the amount of food to
prepare. After a short transition period, they believed the process was relatively
easy. While introducing reduced-portions was successful at Patterson Dental and
the TCC, other types of food service environments may have different issues
regarding the feasibility of adding reduced-portions to their menus. A recent
study identified additional risks with reduced-portions.112 Value perception may
be impaired if customers do not feel that they are receiving a good value for their
money. Reduced-portion sizes may reduce meal enjoyment by customers, which
may harm repeat business. Reduced-portions could impact the cost of goods
purchased if the reduction exceeds any volume discount offered by suppliers.
The study also identified 10 marketing and behavioral economic approaches that
could be employed to counter the identified risks. These included changing the
default to a smaller portion, changing packaging/plate size, making smaller
portions easier to find, adding additional small sized options to the menu, and
using linear pricing. Some of these methods were utilized in the current study;
including using smaller serving plates for the reduced sized items and adding
additional small sized menu items. These methods may have positively
influenced the results of this study.

95
Strengths and Limitations
The strengths of this study are in its novelty. Limited studies have
measured the impact of reduced-portion sized entrees on sales, nutrient intake,
and plate waste in food service settings. Two studies have examined reduced-
portion sizes in a cafeteria setting76,86 and one examined sales of reduced-
portion items in a restaurant.87 Another strength is that the current study was
conducted in 2 different types of food service environments and similar results
were observed.
This study also had limitations, some of which were due to the constraints
of conducting research in a restaurant setting. Researchers were unable to track
consumption by individual participants due to limitations imposed by food service
management. In addition, the current study was unable to report the impact of
reduced-portions beyond a single meal to determine if smaller portion sizes at a
single meal resulted in an overall decrease in daily caloric intake. Small sample
sizes make the comparison of gender differences difficult to determine. At the
TCC, researchers were stationed in the kitchen and thus were unable to observe
diners consuming the meal, therefore consumption amounts may have been
misreported if diners shared or dropped a portion of the meal. This study was
conducted in a business cafeteria setting and a country club restaurant setting,
both of which have a constant client base. This may limit application of results to
other types of restaurants. Further research is necessary to confirm these results
in other types of dining establishments.

96
Conclusions and Implications for Future Research
The results of this study suggest that a portion of restaurant customers will
purchase reduced-size menu items if given the opportunity. The customers who
purchased the reduced-portion entrées consumed fewer calories, decreased
their intake of both nutrients of concern as well as a number of shortfall nutrients,
and had decreased plate waste compared to those who purchased the full
portion entrée.
Further research into reduced-portion sizes should examine the impact of
adding reduced-portion sizes into different types of restaurants, such as family
style, quick service, chain restaurants and independent restaurants. Because
both of the settings in the current study had an existing customer base, additional
studies should also examine the motives for restaurant selection and determine if
the addition of reduced-portion sizes to a restaurant’s menu impacts the
customer’s restaurant selection.
The current study did not examine the impact of purchasing reduced-
portion size entrees on sales and intake of other menu items. Additionally, since
studies have shown that increased portion sizes at a single meal can increase
consumption at subsequent meals55,59,61,63, future studies should examine the
effect of reduced-portion sizes on the consumption of other menu items and
consumption at subsequent meals.
Plate waste was significantly reduced for reduced-portion buyers
compared to non-buyers, however the impact of this change on total food waste

97
generated by the food service environment was not measured in the current
study. Additional studies should be done to quantify the effects on total food
waste.

98
References:
1. 2014 Restaurant Industry Pocket Factbook. National Restaurant Association. http://www.restaurant.org/Downloads/PDFs/News-Research/research/Factbook2014_LetterSize.pdf. Accessed May 22, 2014.
2. Food-at-home and away-from-home expenditures in the United States, 1960-2012. USDA, Economic Research Service, Food Expenditure Series. 2014.
3. Flexible Consumer Behavior Survey. U. S. Department of Agriculture. http://ers.usda.gov/topics/food-choices-health/food-consumption-demand/food-consumption/flexible-consumer-behavior-survey.aspx#.U2hD3OZdXwM. Last updated: Feb. 04, 2014. Accessed July 31, 2014.
4. Body Mass Index. Center for Disease Control and Prevention. www.cdc.gov/healthyweight/assessing/bmi/index.html. Last reviewed: July 1, 2014. Accessed July 31, 2014.
5. About BMI for Children and Teens. Center for Disease Control and Prevention. http://www.cdc.gov/healthyweight/assessing/bmi/ childrens_bmi/ about_childrens_bmi.html. Page last reviewed: July 11, 2014. Accessed July 31, 2014.
6. Ogden CL, Carroll MD, Kit BK, Flegal KM. Prevalence of childhood and adult obesity in the United States, 2011-2012. JAMA. 2014;311(8):806–14.
7. Adolescent and School Health. Childhood Obesity Facts. Center for Disease Control and Prevention. http://www.cdc.gov/healthyyouth/obesity /facts.htm. Page last reviewed: February 27, 2014. Accessed June 4, 2014.
8. National Center for Health Statistics. NCHS Fact Sheet. NCHS Obesity Data. Page last updated: June 4, 2014. Center for Disease Control and Prevention. http://www.cdc.gov/nchs/data/factsheets/factsheet_ obesity.htm. Accessed June 3, 2014.
9. Fact Sheet. Obesity and Cancer Risk. National Cancer Institute. http://www.cancer.gov/cancertopics/factsheet/Risk/obesity. Accessed June 3, 2014.

99
10. NHLBI Obesity Education Initiative Expert Panel on the Identification, Evaluation, and Treatment of Obesity in Adults (US). Clinical Guidelines on the Identification, Evaluation, and Treatment of Overweight and Obesity in Adults: The Evidence Report. Bethesda (MD): National Heart, Lung, and Blood Institute; 1998 Sep. Chapter 2, Overweight and Obesity: Background. http://www.ncbi.nlm.nih.gov/books/NBK1995/. Accessed June 3, 2014.
11. Finkelstein EA, Trogdon JG, Cohen JW, Dietz W. Annual medical spending attributable to obesity: payer-and service-specific estimates. Health Aff (Millwood). 2009;28(5):w822–31.
12. McCrory MA, Fuss PJ, Hayes, Vinken AG, Greenberg AS, Roberts SB. Overeating in America: Association between Restaurant Food Consumption and Body Fatness in Healthy Adult Men and Women Ages 19 to 80. Obesity. 1999;7(6):564-571.
13. Guthrie JF, Lin B-H, Frazao E. Role of Food Prepared Away from Home in the American Diet, 1977-78 versus 1994-96: Changes and Consequences. J Nutr Educ Behav. 2002;34(3):140–150.
14. Bowman SA, Vinyard BT. Fast Food Consumption of U.S. Adults: Impact on Energy and Nutrient Intakes and Overweight Status. J Am Coll Nutr. 2004;23(2):163-8.
15. Kant AK, Graubard BI. Eating out in America, 1987–2000: trends and nutritional correlates. Prev Med (Baltim). 2004;38(2):243–249.
16. Beydoun MA, Powell LM, Wang Y. Reduced away-from-home food expenditure and better nutrition knowledge and belief can improve quality of dietary intake among US adults. Public Health Nutrition. 2009;12(3):369-381.
17. Mancino L, Todd J, Lin B-H. Separating what we eat from where: Measuring the effect of food away from home on diet quality. Food Policy. 2009;34(6):557–562.
18. Todd JE, Mancino L, Lin B-H. The Impact of Food Away from Home on Adult Diet Quality. ERR-90, US Department of Agriculture, Economic Research Service, February 2010.
19. Wu HW, Sturm R. What ’ s on the menu ? A review of the nutritional content of US chain restaurant menus. 2012;16(1):87–96.

100
20. Wu HW, Sturm R. Changes in the Energy and Sodium Content of Main Entrées in US Chain Restaurants from 2010 to 2011. J Acad Nutr Diet. 2014;114(2):209–19.
21. Auchincloss AH, Leonberg BL, Glanz K, Bellitz S, Ricchezza A, Jervis A.
Nutritional value of meals at full-service restaurant chains. J Nutr Educ Behav. 2014;46(1):75–81.
22. Young LR, Nestle M. The contribution of expanding portion sizes to the
US obesity epidemic. Am J Public Health. 2002;92(2):246–9.
23. Nielsen SJ. Patterns and Trends in Food Portion Sizes, 1977-1998. JAMA. 2003;289(4):450.
24. Piernas C, Popkin BM. Food portion patterns and trends among U.S.
children and the relationship to total eating occasion size, 1977-2006. J Nutr. 2011;141(6):1159–64.
25. Matthiessen J, Fagt S, Billtoft-Jensen A, Beck AM, Ovesen L. Size makes
a difference. Public Health Nutr. 2003;6(1):65-72.
26. Church S. Trends in portion sizes in the UK – A preliminary review of published information. Report to the Food Standards Agency. 2008. http://multimedia.food.gov.uk/multimedia/pdfs/reviewportions.pdf. Accessed June 6, 2014.
27. Steenhuis IHM, Leeuwis FH, Vermeer WM. Small, medium, large or
supersize: trends in food portion sizes in The Netherlands. Public Health Nutr. 2010;13(6):852–7.
28. USDA. Center for Nutrition Policy and Promotion. Healthy Eating Index
2005. http://www.cnpp.usda.gov/publications/hei/healthyeatingindex2005factsheet.pdf. Accessed May 17, 2014.
29. Dietary Guidelines for Americans 2010. U.S. Department of Agriculture. U.S. Department of Health and Human Services.
30. U.S. House of Representatives. Public Law 111 – 148 . 2010:1–906.
31. Philadelphia City Code. Title 6-308. 2008.

101
32. New York City Health Code. Section 81.08. A Regulation to Phase Out Artificial Trans Fat In New York City Food Service Establishments. http://www.nyc.gov/html/doh/downloads/pdf/cardio/cardio-transfat-bro.pdf. Accessed June 14, 2014.
33. Los Angeles City Planning. Ordinance No. 180103. http://cityplanning.lacity.org/Code_Studies/Misc/FastFoodInterim. Accessed June 10, 2014.
34. Santa Clara County Nutrition Standards 2012. http://www.sccgov.org/sites/sccphd/en-us/Newsandevents/Documents/ Nutrition%20Standards/Nutrition_Standards_NEW_july2012_v3.pdf. Accessed June 4, 2014.
35. Cardozo MA. Federal appeals court upholds New York City’s landmark health code provision requiring certain chain restaurants to post calorie information on menus and menu boards. Press Release. 2009. http://www.nyc.gov/html/law/downloads/pdf/Calorie_Case%20_%20Appeals_Win.pdf. Accessed June 8, 2014.
36. Philadelphia Department of Public Health. A Guide to Menu Labeling Requirements at Food Establishments in Philadelphia; Understanding Philadelphia’s Menu Labeling Law. October 2009. http://www.phila.gov/health/pdfs/MenuLabelinguideFINAL2010-27.pdf. Accessed June 11, 2013.
37. King County Public Health Department. Nutrition Labeling in King County. http://www.kingcounty.gov/healthservices/health/nutrition/healthyeating/menu.aspx. Accessed June 10, 2014.
38. U.S. Department of Health and Human Services, U.S. Food and Drug Administration. Food Labeling; Nutrition Labeling of Standard Menu Items in Restaurants and Similar Retail Food Establishments; Proposed Rule. Federal Register, Volume 76, Issue 66; 2011.
39. Stein K. A national approach to restaurant menu labeling: the Patient Protection and Affordable Health Care Act, Section 4205. Journal of the American Dietetic Association. 2010;110(9):1280–6, 1288–9.
40. Lee-Kwan SH, Pan L, Maynard L, Kumar G, Park S. Restaurant menu labeling use among adults - 17 States, 2012. MMWR Morb Mortal Wkly Rep. 2014;63(27):581–4.
41. Elbel B, Kersh R, Brescoll VL, Dixon LB. Calorie labeling and food choices: a first look at the effects on low-income people in New York City. Health Aff (Millwood). 2009;28(6):w1110–21.

102
42. Pulos E, Leng K. Evaluation of a voluntary menu-labeling program in full-service restaurants. Am J Public Health. 2010;100(6):1035–9.
43. Finkelstein E a, Strombotne KL, Chan NL, Krieger J. Mandatory menu labeling in one fast-food chain in King County, Washington. Am J Prev Med. 2011;40(2):122–7.
44. Dumanovsky T, Huang CY, Nonas CA, Matte TD, Bassett MT, Silver LD. Changes in energy content of lunchtime purchases from fast food restaurants after introduction of calorie labeling: cross sectional customer surveys. BMJ. 2011;343(jul26_1):d4464.
45. Bollinger B, Leslie P, Sorensen A. Calorie Posting in Chain Restaurants. 2010. Available at: http://www.nber.org/papers/w15648. Accessed June 18, 2014.
46. Auchincloss AH, Mallya GG, Leonberg BL, Ricchezza A, Glanz K, Schwarz DF. Customer responses to mandatory menu labeling at full-service restaurants. Am J Prev Med. 2013;45(6):710–9.
47. Bruemmer B, Krieger J, Saelens BE, Chan N. Energy, saturated fat, and sodium were lower in entrées at chain restaurants at 18 months compared with 6 months following the implementation of mandatory menu labeling regulation in King County, Washington. J Acad Nutr Diet. 2012;112(8):1169–76.
48. Elbel B. Consumer estimation of recommended and actual calories at fast food restaurants. Obesity (Silver Spring). 2011;19(10):1971–8.
49. Roberto CA, Larsen PD, Agnew H, Baik J, Brownell KD. Evaluating the impact of menu labeling on food choices and intake. Am J Public Health. 2010;100(2):312–8.
50. Tandon PS, Zhou C, Chan NL, et al. The impact of menu labeling on fast-food purchases for children and parents. Am J Prev Med. 2011;41(4):434–8.
51. Britt JW, Frandsen K, Leng K, Evans D, Pulos E. Feasibility of voluntary menu labeling among locally owned restaurants. Health Promot Pract. 2011;12(1):18–24.
52. Wansink B, Park S. At the movies: how external cues and perceived taste impact consumption volume. Food Qual Prefer. 2001;12(1):69–74.

103
53. Rolls BJ, Morris EL, Roe LS. Portion size of food affects energy intake in normal-weight and overweight men and women. Am J Clin Nutr. 2002.;76:1207-1213.
54. Rolls BJ, Roe LS, Meengs JS, Wall DE. Increasing the portion size of a sandwich increases energy intake. J Am Diet Assoc. 2004;104(3):367–72.
55. Rolls BJ, Roe LS, Kral TVE, Meengs JS, Wall DE. Increasing the portion size of a packaged snack increases energy intake in men and women. Appetite. 2004;42(1):63–9.
56. Levitsky DA, Youn T. The More Food Young Adults Are Served, the More They Overeat. J Nutr. 2004;134(10):2546–2549.
57. Diliberti N, Bordi PL, Conklin MT, Roe LS, Rolls BJ. Increased portion size leads to increased energy intake in a restaurant meal. Obes Res. 2004;12(3):562-8.
58. Wansink B, Kim J. Bad popcorn in big buckets: portion size can influence intake as much as taste. J Nutr Educ Behav. 37(5):242–5.
59. Rolls BJ, Roe LS, Meengs JS. Larger portion sizes lead to a sustained increase in energy intake over 2 days. J Am Diet Assoc. 2006;106(4):543–9.
60. Geier AB, Rozin P, Doros G. Unit bias. A new heuristic that helps explain the effect of portion size on food intake. Psychol Sci. 2006;17(6):521–5.
61. Rolls BJ, Roe LS, Meengs JS. The effect of large portion sizes on energy intake is sustained for 11 days. Obesity (Silver Spring). 2007;15(6):1535–43.
62. Jeffery RW, Rydell S, Dunn CL, et al. Effects of portion size on chronic energy intake. Int J Behav Nutr Phys Act. 2007;4(1):27.
63. Kelly MT, Wallace JMW, Robson PJ, et al. Increased portion size leads to a sustained increase in energy intake over 4 d in normal-weight and overweight men and women. Br J Nutr. 2009;102(3):470–7.
64. Rolls BJ, Roe LS, Meengs JS. Portion size can be used strategically to increase vegetable consumption in adults. Am J Clin Nutr. 2010;91(4):913–22.
65. French SA, Mitchell NR, Wolfson J, et al. Portion size effects on weight gain in a free living setting. Obesity (Silver Spring). 2014.

104
66. Fisher J, Rolls BJ, Birch LL. Children’s bite size and intake of an entree are greater with large portions than with age-appropriate or self-selected portions. Am J Clin Nutr. 2003;77(5):1164–1170.
67. Fisher JO. Effects of Age on Children’s Intake of Large and Self-selected Food Portions. Obesity. 2007;15(2):403-412.
68. Fisher JO, Arreola A, Birch LL, Rolls BJ. Portion size effects on daily energy intake in low-income Hispanic and African American children and their mothers. Am J Clin Nutr. 2007;86(6):1709–1716.
69. Fisher JO, Liu Y, Birch LL, Rolls BJ. Effects of portion size and energy density on young children’s intake at a meal. Am J Clin Nutr. 2007;86(1):174–179.
70. Fisher JO, Kral TVE. Super-size me: Portion size effects on young children’s eating. Physiol Behav. 2008;94(1):39–47.
71. Looney SM, Raynor H a. Impact of portion size and energy density on snack intake in preschool-aged children. J Am Diet Assoc. 2011;111(3):414–8.
72. Savage JS, Haisfield L, Fisher JO, Marini M, Birch LL. Do children eat less at meals when allowed to serve themselves? Am J Clin Nutr. 2012;96(1):36–43.
73. Smith L, Conroy K, Wen H, Humphries D. Portion size variably affects food intake of 6-year-old and 4-year-old children in Kunming, China. Appetite. 2013;69:31-38.
74. Geier AB, Rozin P, Doros G. Unit bias. A new heuristic that helps explain the effect of portion size on food intake. Psychol Sci. 2006;17(6):521–5.
75. Rolls BJ, Roe LS, Meengs JS. Reductions in portion size and energy density of foods are additive and lead to sustained decreases in energy intake. Am J Clin Nutr. 2006;83(1):11–17.
76. Freedman MR, Brochado C. Reducing portion size reduces food intake and plate waste. Obesity (Silver Spring). 2010;18(9):1864–6.
77. Schwartz J, Riis J, Elbel B, Ariely D. Inviting consumers to downsize fast-food portions significantly reduces calorie consumption. Health Aff (Millwood). 2012;31(2):399–407.

105
78. Glanz K, Resnicow K, Seymour J, et al. How major restaurant chains plan their menus: the role of profit, demand, and health. Am J Prev Med. 2007;32(5):383–8.
79. 2014 Restaurant Industry Pocket Factbook. National Restaurant Association. http://www.restaurant.org/Downloads/PDFs/News-Research/research/Factbook2014_LetterSize.pdf. Accessed May 22, 2014.
80. Lower Calorie Foods It’s Just Good Business. Obesity Solutions Initiative. Feb. 2013. Hudson Institute. https://s3.amazonaws.com/media.hudson.org/files/publications/lower_calorie_foods.pdf. Accessed June 2, 2014.
81. Bloom J. American Wasteland. Cambridge, MA: Perseus Book Group;2010:130-131.
82. Pei Wei Restaurant. http://www.peiwei.com/index.aspx. Accessed June 20, 2014.
83. Noodles and Company. http://www.noodles.com/food/. Accessed June 20, 2014.
84. Gase L, Dunning L, Kuo T, Simon P, Fielding JE. Restaurant owners’ perspectives on a voluntary program to recognize restaurants for offering reduced-size portions, Los Angeles County, 2012. Prev Chronic Dis. 2014;11:E44.
85. Britt JW, Frandsen K, Leng K, Evans D, Pulos E. Feasibility of voluntary menu labeling among locally owned restaurants. Health Promot Pract. 2011;12(1):18–24.
86. Vermeer WM, Steenhuis IHM, Leeuwis FH, Heymans MW, Seidell JC. Small portion sizes in worksite cafeterias: do they help consumers to reduce their food intake? Int J Obes (Lond). 2011;35(9):1200–7.
87. Ram Rao, Brian Wansink, Sanjay Jain. Commentaries and Rejoinder to “Marketing of Vice Goods: A Strategic Analysis of the Package Size Decision” by Sanjay Jain. Marketing Science. 2012 ;31(1):52-58.
88. Gunders D. Wasted : How America Is Losing Up to 40 Percent of Its Food from Farm to Fork to Landfill. Natural Resources Defense Council 2012;(august).

106
89. Gustavsson J, Cederberg C, Sorensson U, van Otterdiijk R, Meybeck A. Global Food Losses and Food Waste: Extent, Causes, and Prevention. Food and Agriculture Organization of the United Nations. Rome 2011.
90. Parfitt J, Barthel M, Macnaughton S. Food waste within food supply chains: quantification and potential for change to 2050. Philos Trans R Soc Lond B Biol Sci. 2010;365(1554):3065–81.
91. Reducing Food Waste for Businesses. United States Environmental Protection Agency. http://www.epa.gov/foodrecovery/. Page last updated on 3/10/2014. Accessed June 20, 2014.
92. Hunger and Poverty Statistics. Feeding America. http://feedingamerica.org/hunger-in-america/hunger-facts/hunger-and-poverty-statistics.aspx. Accessed June 21, 2014.
93. Coleman-Jensen, A, Nord M., Singh A, Household Food Security in the US in 2012. Economic Research Service (ERS), US Department of Agriculture. 2013.
94. Hall KD, Guo J, Dore M, Chow CC. The progressive increase of food waste in America and its environmental impact. Sorensen TIA, ed. PLoS One. 2009;4(11):e7940.
95. Buzby JC, Heyman J. Total and per capita value of food loss in the United States. Food Policy. 2012;37:561-570.
96. Municipal solid Waste in The United States: 2009 Facts and Figures. U.S. Environmental Protection Agency, Office of Solid Waste. December 2010.
97. Environmental Protection Agency. Overview of Greenhouse Gases. http://epa.gov/climatechange/ghgemissions/gases/ch4.html. Accessed July 2, 2014.
98. Bloom J. American Wasteland. Cambridge, MA: Perseus Book Group;2010:125.
99. Food Waste Reduction Alliance. www.foodwastealliance.org. Accessed July 1, 2014.
100. Best Practices & Emerging Solutions Toolkit. Food Waste Reduction Alliance. Spring 2014;1.
101. LeanPath Food Waste Prevention. www.leanpath.com. Accessed July 2, 2014.
107
102. A Short Guide to Food Waste Management Best Practices. LeanPath. http://www.leanpath.com/docs/Waste_Guide_o.pdf. Accessed July 2, 2014.
103. The Business and Cultural Acceptance Case for Trayless Dining. Aramark. July 2008. http://www.aramarkhighered.com/assets/docs/ whitepapers/ARAMARK%20Trayless%20Dining%20July%202008% 20FINAL.PDF. Accessed July 30, 2014.
104. Moshfegh A, Goldman J, LaComb R. Shortfall Nutrients: What We Eat in America, NHANES. Food Surveys Research Group, USDA/ARS Beltsville Human Nutrition Research Center. June 21, 2012.
105. Herman, C. P., Roth, D. A., & Polivy, J. Effects of the presence of
others on food intake. A normative interpretation. Psychological Bulletin. 2003;129(6):873– 886.
106. Ball K, Jeffrey W, Abbott G, McNaughton SA, Crawford DA. Is
healthy behavior contagious? Associations of social norms with physical activity and healthy eating. The International Journal of Behavioral Nutrition and Physical Activity. 2010;7,86.
107. Prinsen S, de Ridder DT, de Vet E. Eating by example. Effects of
environmental cues on dietary decisions. Appetite. 2013;70:1-5.
108. Cruwys T, Bevelander KE, Hermans RCJ. Social modeling of eating: A review of when and why social influence affects food intake and choice. Appetite. 2015;86:3-18.
109. Schwartz MB. The influence of a verbal prompt on school lunch fruit
consumption. Int J Behav Nutr PHys Act. 2007;4:6.
110. Jaurgui-Lobera I, Bolanos Rios P. What motivates consumer’s food choice? Nutr Hosp. 2011;25(6):1313-1321.
111. Sinclair SE, Cooper M, Mansfield ED. The Influence of Menu
Labeling on Calories Selected or Consumed: A Systematic Review and Meta-Analysis. J Acad Nutr Diet. 2014;114(9):1375-1388.
112. Riis J. Opportunities and barriers for smaller portions in food
service: lessons from marketing and behavioral economics. Int J Obes (Lond). 2014;38 Suppl 1:S19–24.

108
Appendices:
Appendix 1 Patterson Dental Survey 1

109

110
Appendix 2 Patterson Dental Survey 2

111

112
Appendix 3 Patterson Dental Plate Waste Data Collection Protocol Protocol: To assess the amount of consumption and food waste at the level of the individual customer at a food service site. Advanced Preparation:
1. Dress in business casual attire (no jeans) 2. Wear a hat/hairnet as required in kitchen area 3. Follow all kitchen regulations – no eating/no cell phones 4. Set up scales/equipment in designated location in dishwashing area 5. Test scales to ensure accuracy. Place test item on both scales to ensure
same weight measurement from each scale. 6. Set out labeled sample plates as a reference to ensure data is recorded
correctly 7. Weigh and record weights of salad components on Salad Bar sheet 8. Record the number of cookies and fruit set out at beginning of lunch 9. Fill out top of each individual record sheet (One side is ok). Include date,
day of week, name and menu entrée item and sides. 10. Set up rolling carts - One to wastebasket area in dining room and the
other located in the dishwashing area. Process During Lunch Period: At the start of lunch, one person is stationed near the garbage area and one person is stationed in the dishwashing area. Additional staff may assist where needed. Person at Garbage Area:
1. As customers finish eating, the individual stationed near the garbage cans will take the plates and bowls with food waste and place. If an individual has more than one plate or bowl please stack for each Individual on rolling cart. Keep each individual’s plates and bowls together so we can determine total calories consumed.
2. Instruct customers to toss all paper waste and place tray, cup and silverware at the return station. Cracker or condiment wrappers should remain on plates to account for intake.
3. When cart is full, exchange cart with an empty cart. Exchange cart as needed throughout lunch period.
4. Ensure plates are gathered for all customers. Person in Dishwashing Area:
1. Obtain cart filled with plates and bowls. 2. Different menu items will be placed on different colored plates. Place
sample plates with menu item recorded on it nearby for reference.

113
3. Tare each empty scale. 4. Weigh total plate with waste. Record weight on data collection form. 5. Remove main entree item and weigh plate again with sides only. Record
on data collection form. 6. Remove starch side dish and weigh plate again with vegetable only.
Record on data collection form. 7. If plate contains excess ketchup, mustard or sauces or dressings, remove
food items and place on empty plate for weighing. This will account only for menu items. Food items located in the sauce should be wiped off to remove excess sauce. Record that the plate had excess condiments on record sheet.
8. Empty plates should be recorded as -0- food waste in the appropriate box on data sheet.
9. Ensure that if individual has multiple plates, they get recorded together. 10. There are two different types of soup bowls with different weights. They
are labeled on the bottom of the bowl with either a picture or a company name. Please place a check mark by the type of bowl used.
Process After Lunch
1. Clean up work area. Return any items to designated locations 2. Weigh Salad bar items again and record on salad bar form. Once
weighed, place salad bar items on salad cart. 3. Ensure that all data sheets, scales, sample plates are collected and given
to Sarah.

114
Appendix 4 Patterson Dental Serving Size Weights Data Collection Form

115
Appendix 5 Patterson Dental Food Waste Data Collection Form

116
Appendix 6 Patterson Dental and TCC Debriefing Interview Questions
Debriefing Interview
a. Do you feel the portion reductions were a success i. Overall ii. From a business standpoint iii. From any other standpoint.
b. What was successful, and how so. c. What challenges did the changes pose to your operations? d. What did you and your staff learn during the test? e. Did the changes require some getting used to:
i. By staff ii. By customers
f. What feedback have you received from your customers? g. How did your staff feel about the half portions? h. Do half portions work better for some menu items than others?
What general principles have you gained for how they work best? i. What (if any) are your longer term plans for reduced portions j. How would you characterize your experience in conducting the test
with our research team: i. What worked well ii. What didn’t work so well iii. Wishes
k. Do you have any further comments, questions or concerns about the study or how we will be using the findings?

117
Appendix 7 TCC Survey 1

118

119
Appendix 8 TCC Survey 2

120

121
Appendix 9 TCC Food Waste Data Collection Form

122