Proven to Work - Curriculum Associates
12
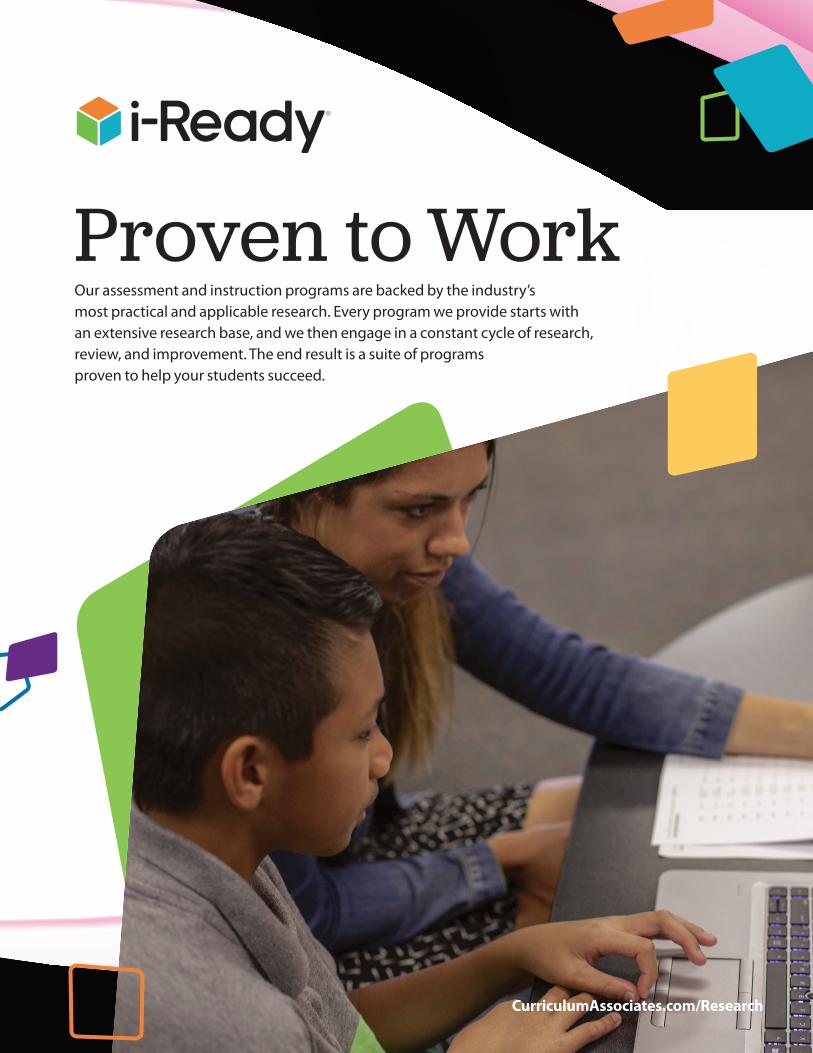
Proven to Work Our assessment and instruction programs are backed by the industry’s most practical and applicable research. Every program we provide starts with an extensive research base, and we then engage in a constant cycle of research, review, and improvement. The end result is a suite of programs proven to help your students succeed. CurriculumAssociates.com/Research
Transcript of Proven to Work - Curriculum Associates
Proven to WorkOur assessment and instruction programs are backed by the industry’s most practical and applicable research. Every program we provide starts with an extensive research base, and we then engage in a constant cycle of research, review, and improvement. The end result is a suite of programs proven to help your students succeed.
CurriculumAssociates.com/Research
© 2019 Curriculum Associates, LLC. All rights reserved. 2 |
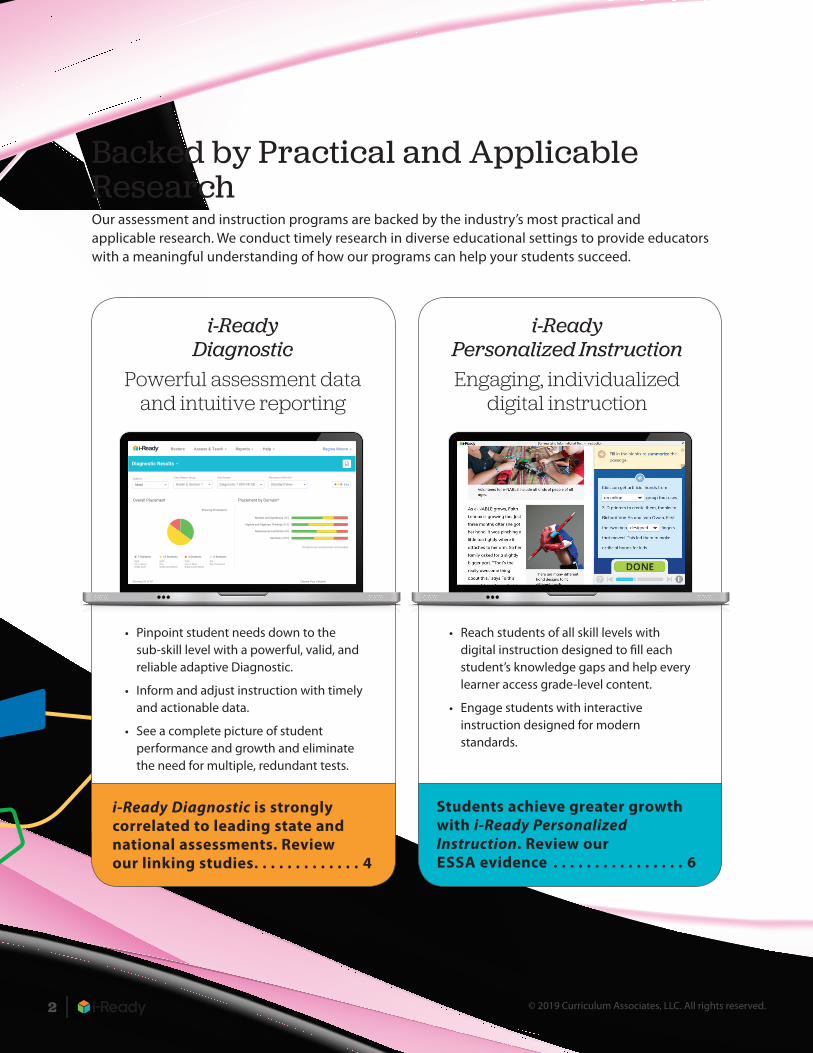
Backed by Practical and Applicable ResearchOur assessment and instruction programs are backed by the industry’s most practical and applicable research. We conduct timely research in diverse educational settings to provide educators with a meaningful understanding of how our programs can help your students succeed.
Student Name
NO ALG MS GEO
DateOverallPlacement
Showing 20 of 20
Tan, Melanie
Sanchez, Abby
Stanton, Geena
Warren, Santino
McDonald, Kal
Vo, Isaiah
Wade, Kiara
Patel, Mia
Ramirez, Gabriella
Bowers, Tara
Lowe, Noah
Baker, Danielle
Singh, Brian
Powell, Elijah
Choi, Isabelle
Ruiz, Justin
Hess, Michael
Malone, Carla
Cochran, Damon
Simmons, Tristan
Late 5
Late 5
Early 5
Mid 5
Early 5
Early 5
Early 5
Early 5
Grade 4
Grade 4
Grade 3
Grade 4
Early 5
Grade 4
Grade 4
Grade 4
Grade 4
Grade 3
Grade 2
Grade 2
Late 5
Grade 3
Mid 5
Early 5
Early 5
Grade 4
Early 5
Grade 4
Mid 5
Grade 4
Grade 3
Grade 4
Grade 4
Grade 4
Grade 3
Grade 4
Grade 4
Grade 3
Grade 2
Grade 3
Mid 5
Early 5
Mid 5
Mid 5
Mid 5
Early 5
Grade 4
Grade 4
Grade 4
Grade 4
Grade 4
Grade 3
Grade 4
Grade 4
Grade 4
Grade 3
Grade 3
Early 5
Grade 3
Grade 2
09/14/18
09/14/18
09/14/18
09/14/18
09/14/18
09/14/18
09/14/18
09/14/18
09/14/18
09/14/18
09/14/18
09/14/18
09/14/18
09/14/18
09/14/18
09/14/18
09/14/18
09/14/18
09/14/18
09/14/18
Choose Your Column:
517
516
512
491
489
484
483
473
472
472
470
463
463
462
459
454
453
440
429
429
Mid 5
Mid 5
Mid 5
Early 5
Early 5
Early 5
Early 5
Grade 4
Grade 4
Grade 4
Grade 4
Grade 4
Grade 4
Grade 4
Grade 4
Grade 4
Grade 4
Grade 3
Grade 2
Grade 2
Grade 3
Mid 5
Early 5
Grade 4
Early 5
Early 5
Early 5
Early 5
Grade 4
Grade 4
Grade 4
Grade 4
Grade 3
Grade 4
Grade 4
Grade 4
Grade 3
Grade 3
Grade 3
Grade 2
Overall Placement Placement by Domain*
Number and Operations (NO)
Algebra and Algebraic Thinking (ALG)
Measurement and Data (MS)
Geometry (GEO)
Class/Report Group
Grade 5, Section 1
Date Range
Diagnostic 1 (09/14/18)
Placement Definition
Standard View Key
7 Students
35%On or Above Grade Level
10 Students
50%One Grade Level Below
3 Students
15%Two or More Grade Levels Below
0 Students
0%Not Completed
Showing All Students
Diagnostic Results PDF
Subject
Math
Placement by Domain
ScaleScore
*Students not completed are not included
14
14
14
18
18
18
18
18
18
18
18
18
18
18
18
18
18
18
20
20
14
14
14
18
18
18
18
18
18
18
18
18
18
18
18
18
18
18
20
20
Typical Growth
20
20
20
29
29
29
29
31
29
29
29
29
29
29
29
29
29
35
41
41
20
20
20
29
29
29
29
31
29
29
29
29
29
29
29
29
29
35
41
41
Stretch Growth
Growth Measures
HelpAssess & TeachRosters Regina MooreReports
i-Ready Diagnostic
Powerful assessment data and intuitive reporting
• Pinpoint student needs down to the sub-skill level with a powerful, valid, and reliable adaptive Diagnostic.
• Inform and adjust instruction with timely and actionable data.
• See a complete picture of student performance and growth and eliminate the need for multiple, redundant tests.
i-Ready Diagnostic is strongly correlated to leading state and national assessments. Review our linking studies . . . . . . . . . . . . . 4
i-Ready Personalized InstructionEngaging, individualized
digital instruction
• Reach students of all skill levels with digital instruction designed to fill each student’s knowledge gaps and help every learner access grade-level content.
• Engage students with interactive instruction designed for modern standards.
Students achieve greater growth with i-Ready Personalized Instruction. Review our ESSA evidence . . . . . . . . . . . . . . . . 6
© 2019 Curriculum Associates, LLC. All rights reserved. CurriculumAssociates.com/Research | 3
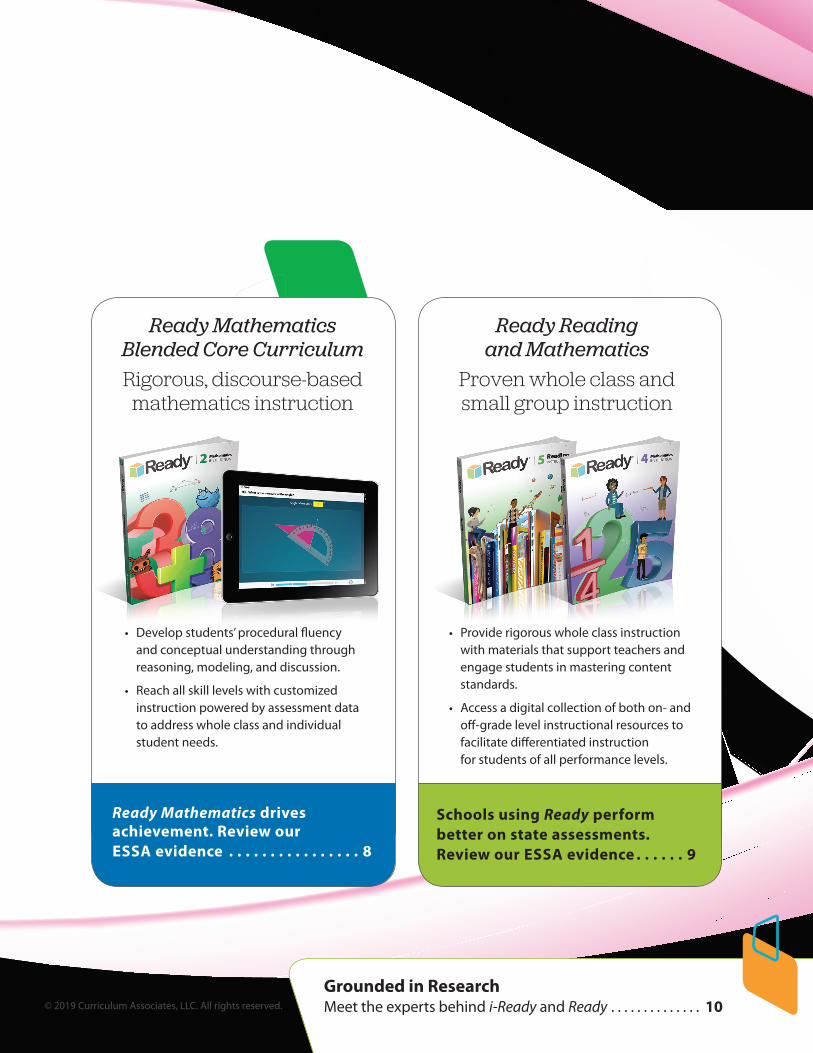
Ready Mathematics Blended Core CurriculumRigorous, discourse-based mathematics instruction
• Develop students’ procedural fluency and conceptual understanding through reasoning, modeling, and discussion.
• Reach all skill levels with customized instruction powered by assessment data to address whole class and individual student needs.
Ready Mathematics drives achievement. Review our ESSA evidence . . . . . . . . . . . . . . . . 8
Ready Reading and Mathematics
Proven whole class and small group instruction
• Provide rigorous whole class instruction with materials that support teachers and engage students in mastering content standards.
• Access a digital collection of both on- and off-grade level instructional resources to facilitate differentiated instruction for students of all performance levels.
Schools using Ready perform better on state assessments. Review our ESSA evidence . . . . . . 9
Grounded in Research Meet the experts behind i-Ready and Ready . . . . . . . . . . . . . . 10
© 2019 Curriculum Associates, LLC. All rights reserved. 4 |
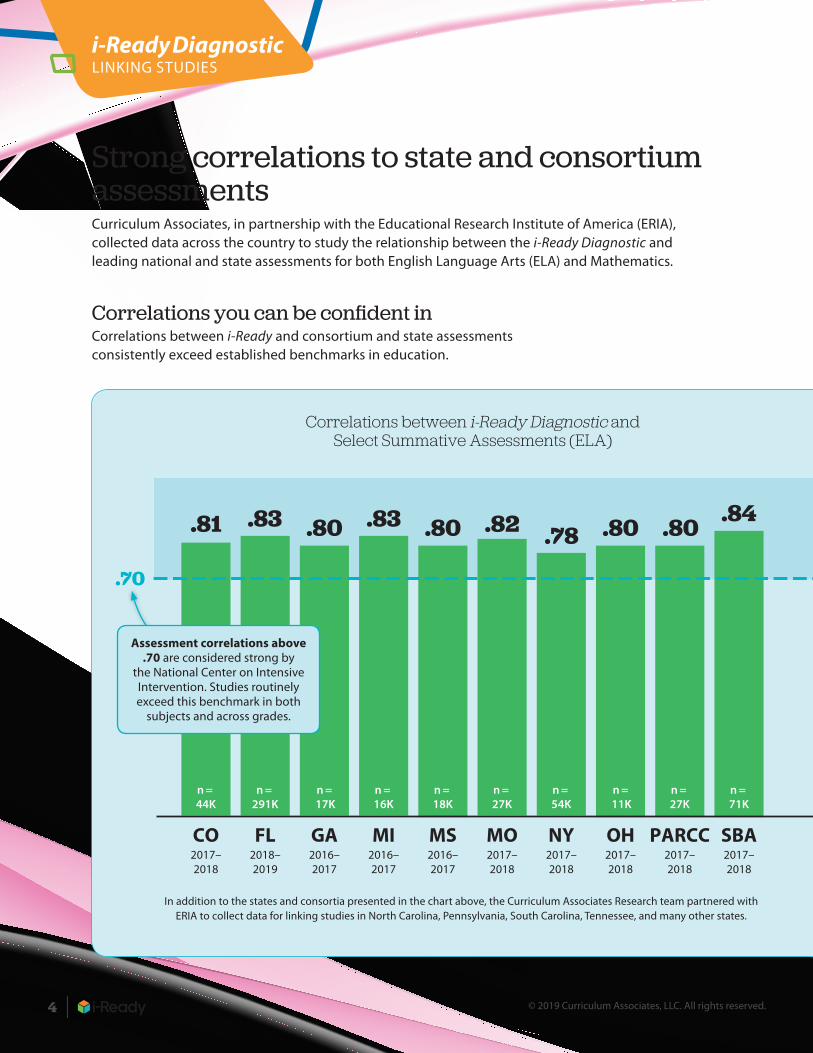
Strong correlations to state and consortium assessmentsCurriculum Associates, in partnership with the Educational Research Institute of America (ERIA), collected data across the country to study the relationship between the i-Ready Diagnostic and leading national and state assessments for both English Language Arts (ELA) and Mathematics.
Correlations you can be confident in Correlations between i-Ready and consortium and state assessments consistently exceed established benchmarks in education.
i-Ready Diagnostic LINKING STUDIES
In addition to the states and consortia presented in the chart above, the Curriculum Associates Research team partnered with ERIA to collect data for linking studies in North Carolina, Pennsylvania, South Carolina, Tennessee, and many other states.
.81.88 .85.84.83
FL2018–2019
n = 291K
.87.81
CO2017–2018
n = 44K
GA
.80
2016–2017
n = 17K
MI
.83
2016–2017
n = 16K
MS
.80
2016–2017
n = 18K
.82.86 .84 .89.84
MO
.82
2017–2018
n = 27K
.78
NY2017–2018
n = 54K
.80
OH2017–2018
n = 11K
.80
PARCC2017–2018
n = 27K
.84
SBA2017–2018
n = 71K
FL2018–2019
n = 286K
CO2017–2018
n = 43K
GA2016–2017
n = 31K
MI2016–2017
n = 18K
MS2016–2017
n = 20K
MO2017–2018
n = 24K
NY2017–2018
n = 54K
OH2017–2018
n = 12K
PARCC2017–2018
n = 30K
SBA2017–2018
n = 76K
.70
Assessment correlations above .70 are considered strong by
the National Center on Intensive Intervention. Studies routinely exceed this benchmark in both
subjects and across grades.
Correlations between i-Ready Diagnostic and Select Summative Assessments (ELA)
© 2019 Curriculum Associates, LLC. All rights reserved. CurriculumAssociates.com/Research | 5
Why correlations matterCorrelations are one of the most commonly used and widely accepted forms of validity evidence. Correlations demonstrate that when students score high on one assessment,
they also tend to score high on the other, and similarly, when students score low on one assessment, they also tend to score low on the other. A high correlation between two
assessments provides evidence that the two assessments are measuring similar constructs.
We chose i-Ready because we wanted everyone in our district to be moving
in the same direction. Now we can say, ‘This is what the child’s needs are.’
—Dr. John Lovato, Assistant Superintendent, CA
.81.88 .85.84.83
FL2018–2019
n = 291K
.87.81
CO2017–2018
n = 44K
GA
.80
2016–2017
n = 17K
MI
.83
2016–2017
n = 16K
MS
.80
2016–2017
n = 18K
.82.86 .84 .89.84
MO
.82
2017–2018
n = 27K
.78
NY2017–2018
n = 54K
.80
OH2017–2018
n = 11K
.80
PARCC2017–2018
n = 27K
.84
SBA2017–2018
n = 71K
FL2018–2019
n = 286K
CO2017–2018
n = 43K
GA2016–2017
n = 31K
MI2016–2017
n = 18K
MS2016–2017
n = 20K
MO2017–2018
n = 24K
NY2017–2018
n = 54K
OH2017–2018
n = 12K
PARCC2017–2018
n = 30K
SBA2017–2018
n = 76K
.70
Our linking research is ongoing. If your state is not listed here, our Research and Efficacy page captures all the latest research: CurriculumAssociates.com/Research.
Correlations between i-Ready Diagnostic and Select Summative Assessments (Mathematics)
© 2019 Curriculum Associates, LLC. All rights reserved. 6 |
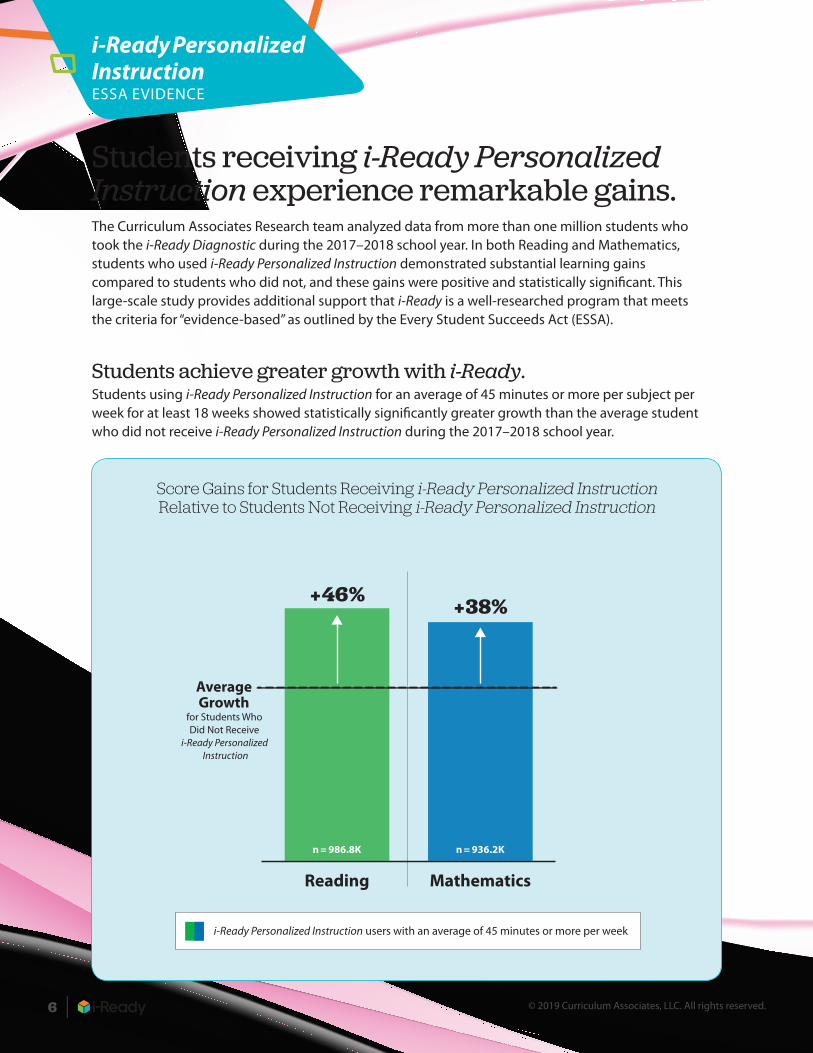
Students receiving i-Ready Personalized Instruction experience remarkable gains.The Curriculum Associates Research team analyzed data from more than one million students who took the i-Ready Diagnostic during the 2017–2018 school year. In both Reading and Mathematics, students who used i-Ready Personalized Instruction demonstrated substantial learning gains compared to students who did not, and these gains were positive and statistically significant. This large-scale study provides additional support that i-Ready is a well-researched program that meets the criteria for “evidence-based” as outlined by the Every Student Succeeds Act (ESSA).
Students achieve greater growth with i-Ready.Students using i-Ready Personalized Instruction for an average of 45 minutes or more per subject per week for at least 18 weeks showed statistically significantly greater growth than the average student who did not receive i-Ready Personalized Instruction during the 2017–2018 school year.
i-Ready Personalized Instruction ESSA EVIDENCE
+46%
Reading Mathematics
Average Growth
for Students Who Did Not Receive
i-Ready Personalized Instruction
+38%
i-Ready Personalized Instruction users with an average of 45 minutes or more per week
n = 986.8K n = 936.2K
Score Gains for Students Receiving i-Ready Personalized Instruction Relative to Students Not Receiving i-Ready Personalized Instruction

© 2019 Curriculum Associates, LLC. All rights reserved. CurriculumAssociates.com/Research | 7
i-Ready accelerates growth for key student groups.Students who are English Learners (EL), students with disabilities (SWD), and students with socioeconomic disadvantages (SED) using i-Ready Personalized Instruction all saw
statistically significantly greater growth than students from the same subgroups who did not have access to the program during the 2017–2018 school year.
Average Growth
for Students Who Did Not Receive
i-Ready Personalized Instruction
i-Ready Personalized Instruction users with an average of 45 minutes or more per week
+53%+35%
+27%
Reading Mathematics
+49%+38% +42%
SWDEL SED SWDEL SED
n = 86.7K n = 62.9K n = 124.1K n = 83.1K n = 61.7K n = 129K
When you start looking at [i-Ready] data and following the trends . . . it’s
revealing. It’s about knowing the truth, and that helps you make better decisions that move schools forward.
—Melinda Chemin, Reading Coach, FL
Score Gains for Key Student Groups Receiving i-Ready Personalized Instruction Relative to Key Student Groups Not Receiving i-Ready Personalized Instruction
© 2019 Curriculum Associates, LLC. All rights reserved. 8 |
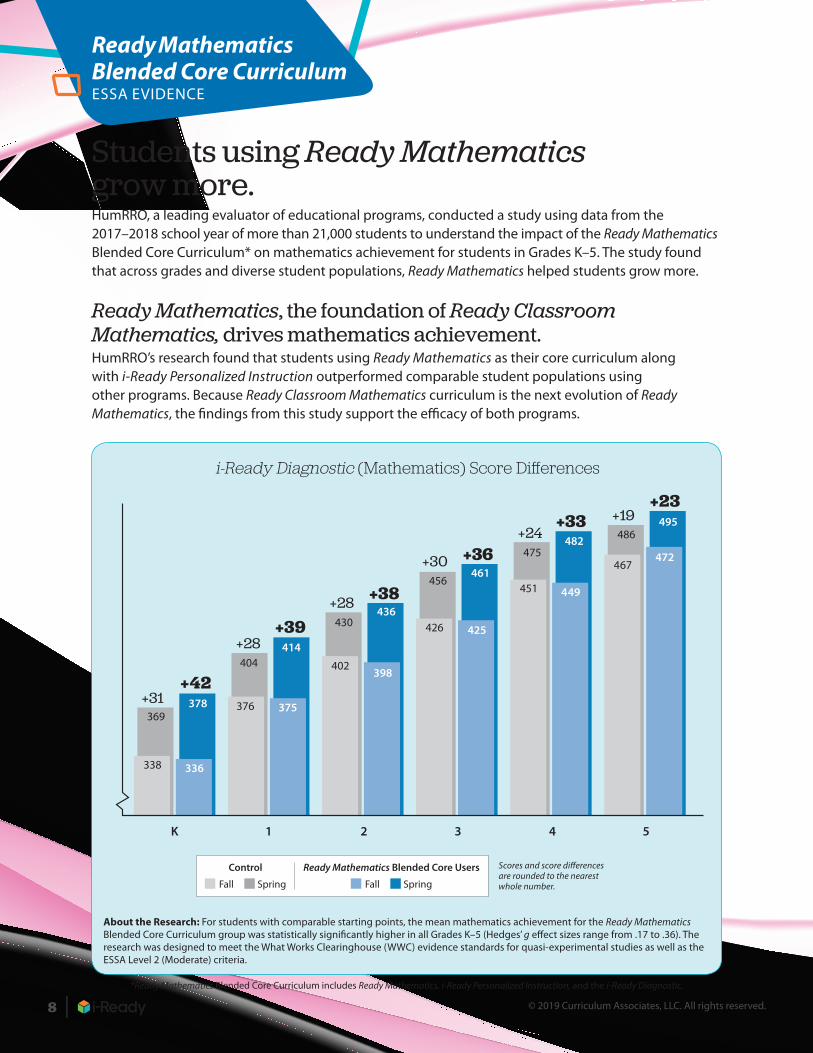
Students using Ready Mathematics grow more.HumRRO, a leading evaluator of educational programs, conducted a study using data from the 2017–2018 school year of more than 21,000 students to understand the impact of the Ready Mathematics Blended Core Curriculum* on mathematics achievement for students in Grades K–5. The study found that across grades and diverse student populations, Ready Mathematics helped students grow more.
Ready Mathematics, the foundation of Ready Classroom Mathematics, drives mathematics achievement. HumRRO’s research found that students using Ready Mathematics as their core curriculum along with i-Ready Personalized Instruction outperformed comparable student populations using other programs. Because Ready Classroom Mathematics curriculum is the next evolution of Ready Mathematics, the findings from this study support the efficacy of both programs.
Ready Mathematics Blended Core Curriculum ESSA EVIDENCE
338
369
+31
K 1 2 3 4 5
Control
Fall Spring
Ready Mathematics Blended Core Users
Fall Spring
Scores and score differences are rounded to the nearest whole number.
336
378
+42
+39
375
414
376
404
+28
+28
402
430
+38
398
436
+30
426
456
+36
425
461
+24
451
475
+33
449
482
+19
467
486
+23
472
495
i-Ready Diagnostic (Mathematics) Score Differences
*Ready Mathematics Blended Core Curriculum includes Ready Mathematics, i-Ready Personalized Instruction, and the i-Ready Diagnostic.
About the Research: For students with comparable starting points, the mean mathematics achievement for the Ready Mathematics Blended Core Curriculum group was statistically significantly higher in all Grades K–5 (Hedges’ g effect sizes range from .17 to .36). The research was designed to meet the What Works Clearinghouse (WWC) evidence standards for quasi-experimental studies as well as the ESSA Level 2 (Moderate) criteria.
© 2019 Curriculum Associates, LLC. All rights reserved. CurriculumAssociates.com/Research | 9
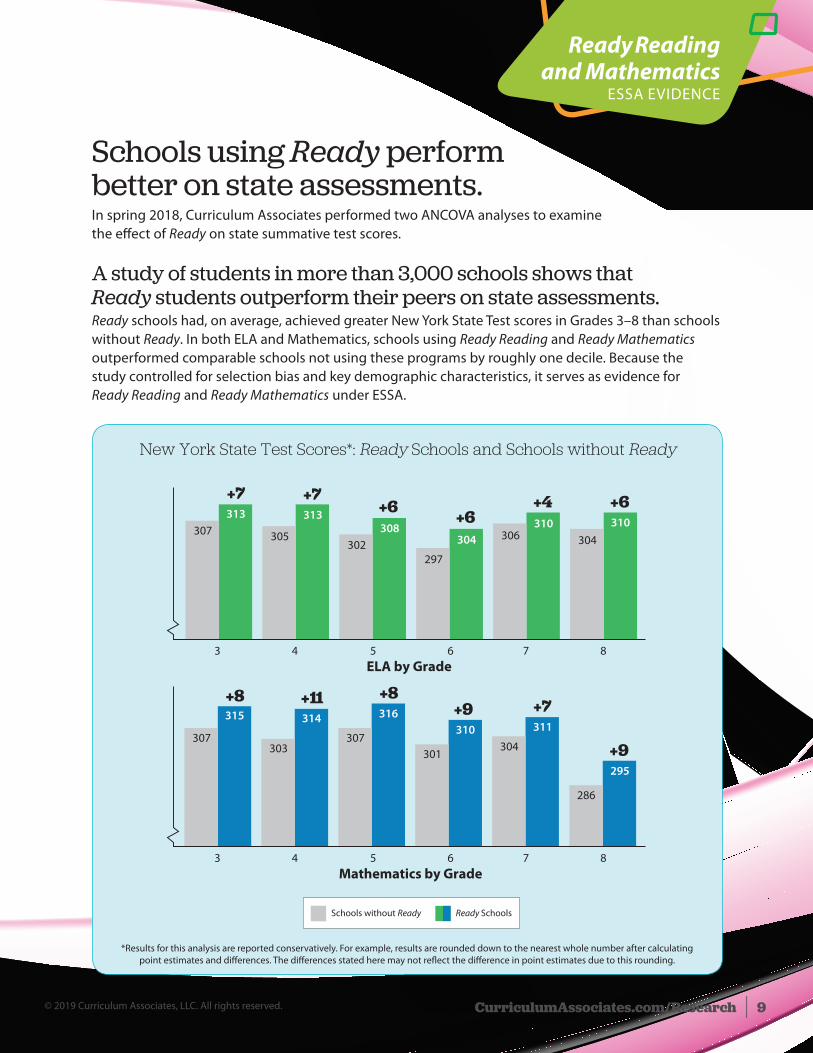
Schools using Ready perform better on state assessments. In spring 2018, Curriculum Associates performed two ANCOVA analyses to examine the effect of Ready on state summative test scores.
A study of students in more than 3,000 schools shows that Ready students outperform their peers on state assessments.Ready schools had, on average, achieved greater New York State Test scores in Grades 3–8 than schools without Ready. In both ELA and Mathematics, schools using Ready Reading and Ready Mathematics outperformed comparable schools not using these programs by roughly one decile. Because the study controlled for selection bias and key demographic characteristics, it serves as evidence for Ready Reading and Ready Mathematics under ESSA.
Ready Reading and Mathematics
ESSA EVIDENCE
Schools without Ready Ready Schools
307
315
+8 +11 +8+9 +7
+9307
316
303
314
301
310304
311
286
295
Mathematics by Grade
+7 +7+6 +6
+6+4307
313
302308
305
313
297
304 306310
304
310
3 4 5 6 7 8
3 4 5 6 7 8
ELA by Grade
*Results for this analysis are reported conservatively. For example, results are rounded down to the nearest whole number after calculating point estimates and differences. The differences stated here may not reflect the difference in point estimates due to this rounding.
New York State Test Scores*: Ready Schools and Schools without Ready
© 2019 Curriculum Associates, LLC. All rights reserved. 10 |
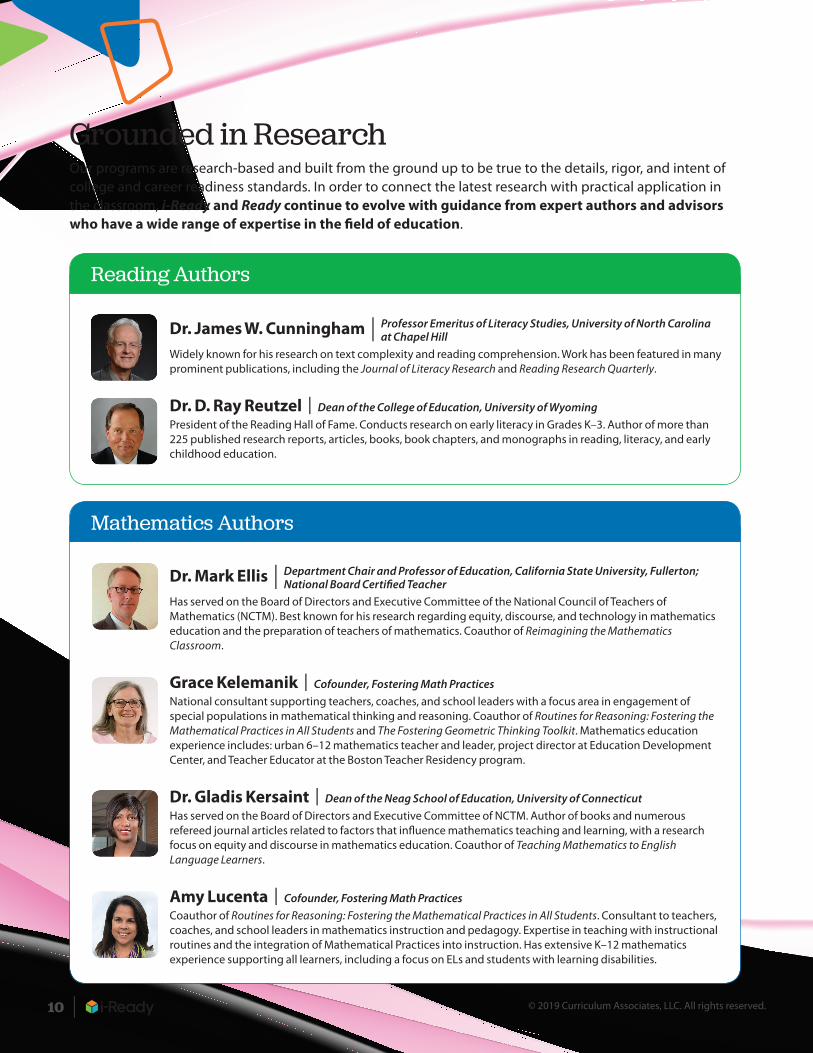
Grounded in ResearchOur programs are research-based and built from the ground up to be true to the details, rigor, and intent of college and career readiness standards. In order to connect the latest research with practical application in the classroom, i-Ready and Ready continue to evolve with guidance from expert authors and advisors who have a wide range of expertise in the field of education.
Reading Authors
Dr. James W. Cunningham | Professor Emeritus of Literacy Studies, University of North Carolina at Chapel Hill
Widely known for his research on text complexity and reading comprehension. Work has been featured in many prominent publications, including the Journal of Literacy Research and Reading Research Quarterly.
Dr. D. Ray Reutzel | Dean of the College of Education, University of Wyoming
President of the Reading Hall of Fame. Conducts research on early literacy in Grades K–3. Author of more than 225 published research reports, articles, books, book chapters, and monographs in reading, literacy, and early childhood education.
Dr. Mark Ellis | Department Chair and Professor of Education, California State University, Fullerton; National Board Certified Teacher
Has served on the Board of Directors and Executive Committee of the National Council of Teachers of Mathematics (NCTM). Best known for his research regarding equity, discourse, and technology in mathematics education and the preparation of teachers of mathematics. Coauthor of Reimagining the Mathematics Classroom.
Grace Kelemanik | Cofounder, Fostering Math Practices
National consultant supporting teachers, coaches, and school leaders with a focus area in engagement of special populations in mathematical thinking and reasoning. Coauthor of Routines for Reasoning: Fostering the Mathematical Practices in All Students and The Fostering Geometric Thinking Toolkit. Mathematics education experience includes: urban 6–12 mathematics teacher and leader, project director at Education Development Center, and Teacher Educator at the Boston Teacher Residency program.
Dr. Gladis Kersaint | Dean of the Neag School of Education, University of Connecticut
Has served on the Board of Directors and Executive Committee of NCTM. Author of books and numerous refereed journal articles related to factors that influence mathematics teaching and learning, with a research focus on equity and discourse in mathematics education. Coauthor of Teaching Mathematics to English Language Learners.
Amy Lucenta | Cofounder, Fostering Math Practices
Coauthor of Routines for Reasoning: Fostering the Mathematical Practices in All Students. Consultant to teachers, coaches, and school leaders in mathematics instruction and pedagogy. Expertise in teaching with instructional routines and the integration of Mathematical Practices into instruction. Has extensive K–12 mathematics experience supporting all learners, including a focus on ELs and students with learning disabilities.
Mathematics Authors
© 2019 Curriculum Associates, LLC. All rights reserved. CurriculumAssociates.com/Research | 11
Efficacy and Technical Advisors
Dr. Allison Atteberry | Assistant Professor, University of Colorado at BoulderConducts research on teacher- and school-level interventions designed to improve the quality of instruction experienced by historically underserved students. Leverages both econometric and statistical approaches to education policy analysis, focusing on what methods and designs constitute compelling evidence of causal effects in quantitative research.
Dr. Henry Braun | Boisi Professor of Education & Public Policy; Director of the Center for the Study of Testing, Evaluation & Education Policy, Boston College
Research expertise includes assessment design, assessment and accountability, international assessment surveys, and outcomes of liberal education. American Educational Research Association honored Braun with the Division D 2018 Robert L. Linn Distinguished Address Award and the Palmer Johnson Award in 1986. National Council on Measurement in Education (NCME) Award for Technical Contributions to Measurement winner in 1999. Elected to the prestigious National Academy of Education in 2017—a collection of more than 200 elite researchers who address education’s most pressing issues.
Dr. Derek Briggs | Professor and Chair of the Research and Evaluation Methodology Program, University of Colorado at Boulder
Recognized expert in the measurement and evaluation of student learning, including in the use of learning progressions as a method for facilitating student-level inferences about growth, and helping bridge the use of test scores for formative and summative purposes. Sits on the technical advisory committee of four large testing programs, including the national PARCC assessment consortium.
Dr. Richard Brown | Founder and CEO, West Coast AnalyticsFormer associate professor, psychometrician, Rossier School of Education of the University of Southern California. Former senior researcher at the National Center for Research on Evaluation, Standards, and Student Testing at UCLA. One of the primary psychometricians for i-Ready Diagnostic since its inception.
Dr. Andrew Ho | Professor of Education, Harvard Graduate School of EducationResearch critiques and clarifies educational accountability metrics, including proficiency, growth, achievement gaps, and value-added. Author, with Dr. Karen Castellano, of A Practitioner’s Guide to Growth Models (2013). Member of the National Assessment Governing Board and a recipient of the Jason Millman Promising Measurement Scholar Award from the National Council on Measurement in Education (NCME).
Dr. Richard Luecht | Professor of Educational Research Methodology, University of North Carolina at GreensboroResearch includes technology integration in assessment, advanced psychometric modeling and estimation, and the application of engineering design principles for formative assessment (i.e., assessment engineering). Designed numerous algorithms and software programs for automated test assembly and devised a computerized adaptive multistage testing framework used by a number of large-scale testing programs.
Dr. Bruce Randel | Founder and CEO, Century AnalyticsProvides consulting and contracting services in research design, research methods, statistical analysis, educational measurement and psychometrics, and reporting. Certified WWC reviewer, expert in designing studies aligned to WWC Standards and Procedures. Provided technical assistance for projects funded through Investing in Innovations, Education Innovation and Research, Supporting Effective Educator Development, the Regional Educational Laboratories, and the Social Innovation Fund.
Dr. Michael Rodriguez | Campbell Leadership Chair and Professor of Quantitative Methods in Education, University of Minnesota
Well known for research on item development and validation and measurement accessibility for individuals with disabilities and multilingual learners. 2005 Albert J. Harris Research Award of the International Reading Association. Chairs the US Department of Defense Advisory Committee on Military Personnel Testing and the National Board of Professional Teaching Standards Technical Advisory Group.
Dr. Edynn Y. Sato | CEO and Chief Research Scientist, Sato Education ConsultingAuthority on student learning, instruction, and assessment, particularly of culturally and linguistically diverse learners and students with disabilities. Served as a chair of the Diversity Issues in Testing Committee for NCME; is a Peer Reviewer of State Assessments for the US Department of Education. Has served as principal investigator or project director on a number of successful federally funded projects and multimillion dollar education contracts that primarily focused on serving the needs of ELs and students with disabilities.
Dr. Martin West | Professor of Education, Harvard Graduate School of EducationFaculty research fellow at the National Bureau of Economic Research. Deputy director of the Harvard Kennedy School’s Program on Education Policy and Governance and executive editor of Education Next, a journal of opinion and research on education policy. Conducts research on the politics of K–12 education in the United States and how education policies affect student learning and non-cognitive development. Worked as senior education policy advisor to the ranking member of the US Senate Committee on Health, Education, Labor, and Pensions in 2014–2015.
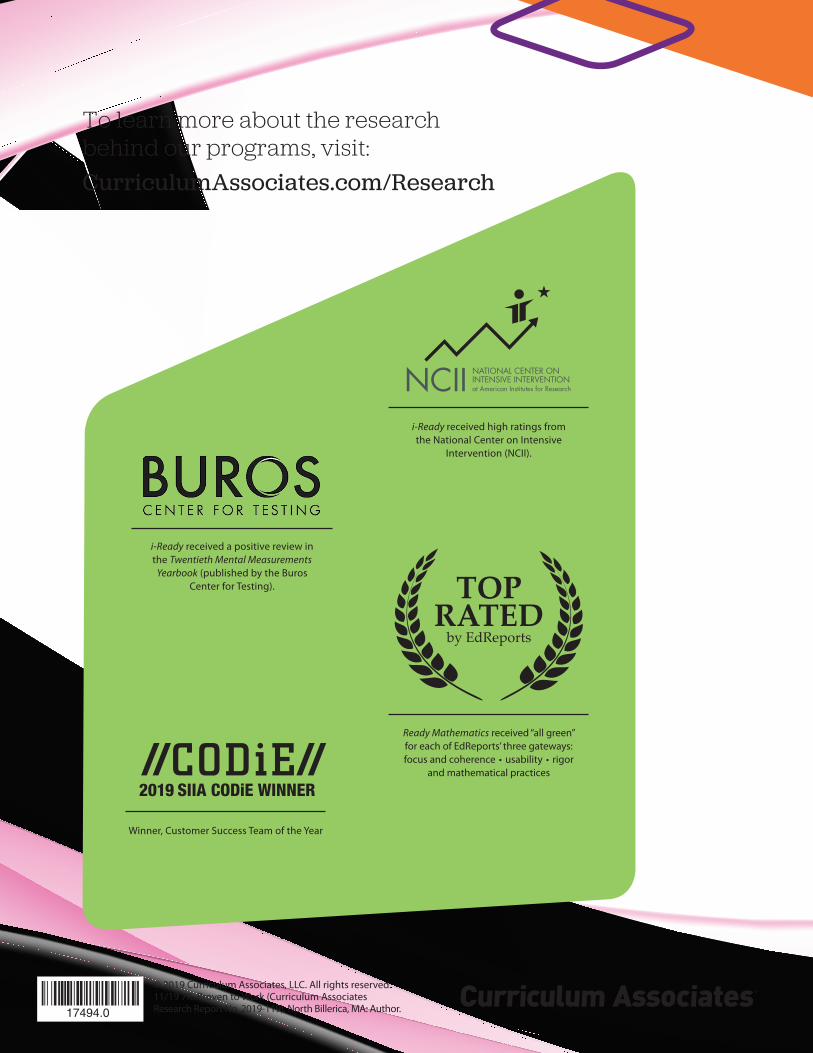
To learn more about the research behind our programs, visit:CurriculumAssociates.com/Research
© 2019 Curriculum Associates, LLC. All rights reserved. 11/19 7K. Proven to Work (Curriculum Associates Research Report No. 2019-119). North Billerica, MA: Author.
i-Ready received a positive review in the Twentieth Mental Measurements
Yearbook (published by the Buros Center for Testing).
i-Ready received high ratings from the National Center on Intensive
Intervention (NCII).
Ready Mathematics received “all green” for each of EdReports’ three gateways: focus and coherence • usability • rigor
and mathematical practices
TOP RATED
by EdReports
Winner, Customer Success Team of the Year