Proven Engagement Strategies to Increase Employee Health ...
34
Craig Hankins Vice President of Digital, UnitedHealthcare Markie Davis Director of Employee Benefits & Risk Management, State of Colorado Tim Johnson Vice President, Business Development, Real Appeal Proven Engagement Strategies to Increase Employee Health, Wellness & Business Performance
Transcript of Proven Engagement Strategies to Increase Employee Health ...

Craig Hankins
Vice President of Digital, UnitedHealthcare
Markie Davis
Director of Employee Benefits & Risk Management, State of Colorado
Tim Johnson
Vice President, Business Development, Real Appeal
Proven Engagement Strategies to Increase Employee Health, Wellness & Business Performance
2
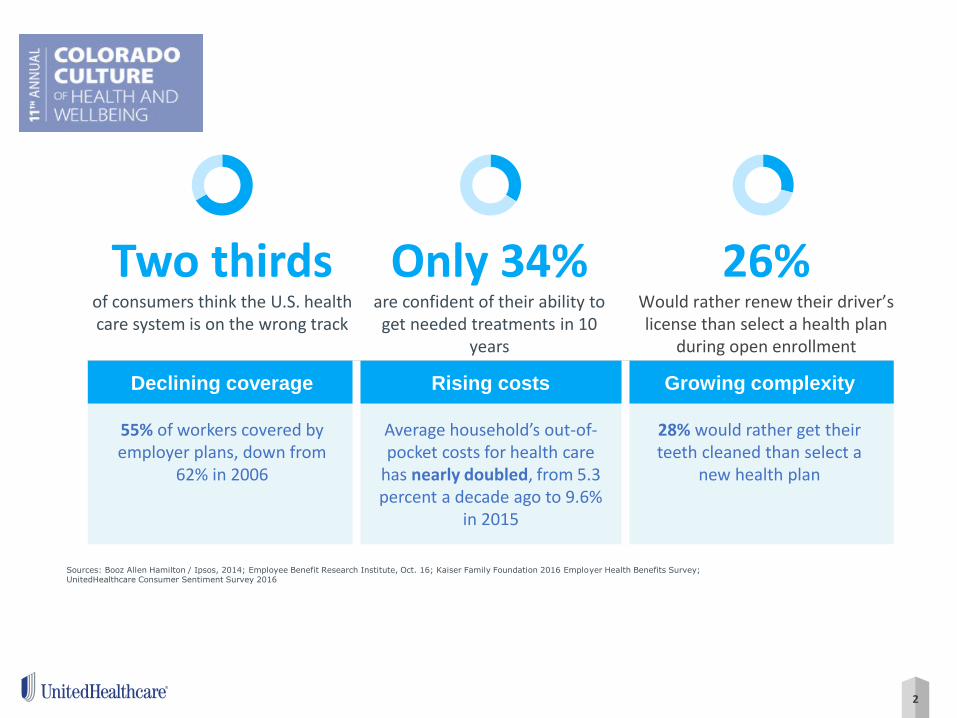
Sources: Booz Allen Hamilton / Ipsos, 2014; Employee Benefit Research Institute, Oct. 16; Kaiser Family Foundation 2016 Employer Health Benefits Survey; UnitedHealthcare Consumer Sentiment Survey 2016
Two thirds of consumers think the U.S. health care system is on the wrong track
Only 34% are confident of their ability to get needed treatments in 10
years
26% Would rather renew their driver’s license than select a health plan
during open enrollment
Declining coverage Rising costs Growing complexity
55% of workers covered by employer plans, down from
62% in 2006
Average household’s out-of-pocket costs for health care
has nearly doubled, from 5.3 percent a decade ago to 9.6%
in 2015
28% would rather get their teeth cleaned than select a
new health plan
3
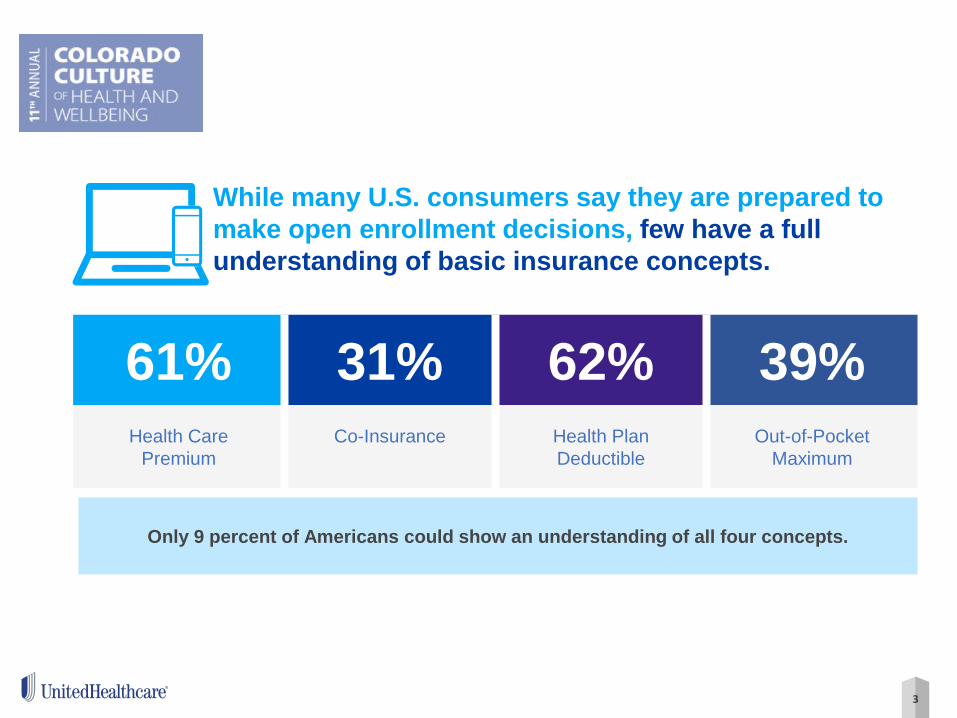
While many U.S. consumers say they are prepared to
make open enrollment decisions, few have a full
understanding of basic insurance concepts.
61% 31% 62% 39%
Health Care
Premium
Co-Insurance Health Plan
Deductible
Out-of-Pocket
Maximum
Only 9 percent of Americans could show an understanding of all four concepts.

4
4
Consumers are increasingly turning to the Internet and mobile technology as a first resource when seeking health care information.
45% Of Americans turn first to consultations
with a primary care physician or nurse,
the only choice that ranked higher
than the internet/mobile.
28% Of Americans use the internet or mobile apps as
their first source to consult for information
about specific health symptoms, conditions,
diseases, or ailments.
5
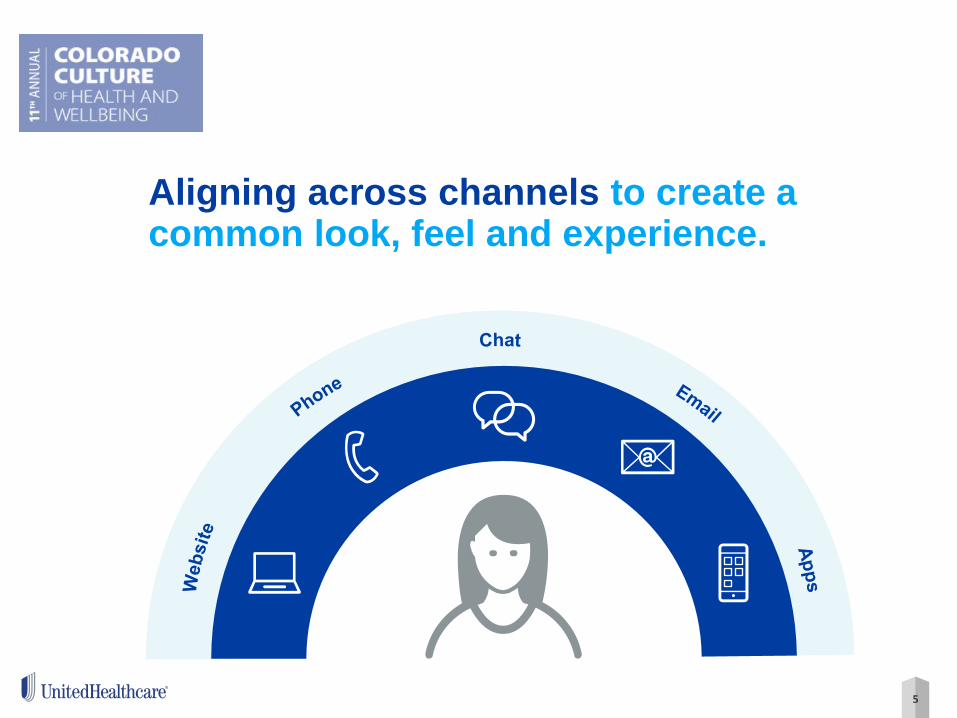
Aligning across channels to create a common look, feel and experience.
6
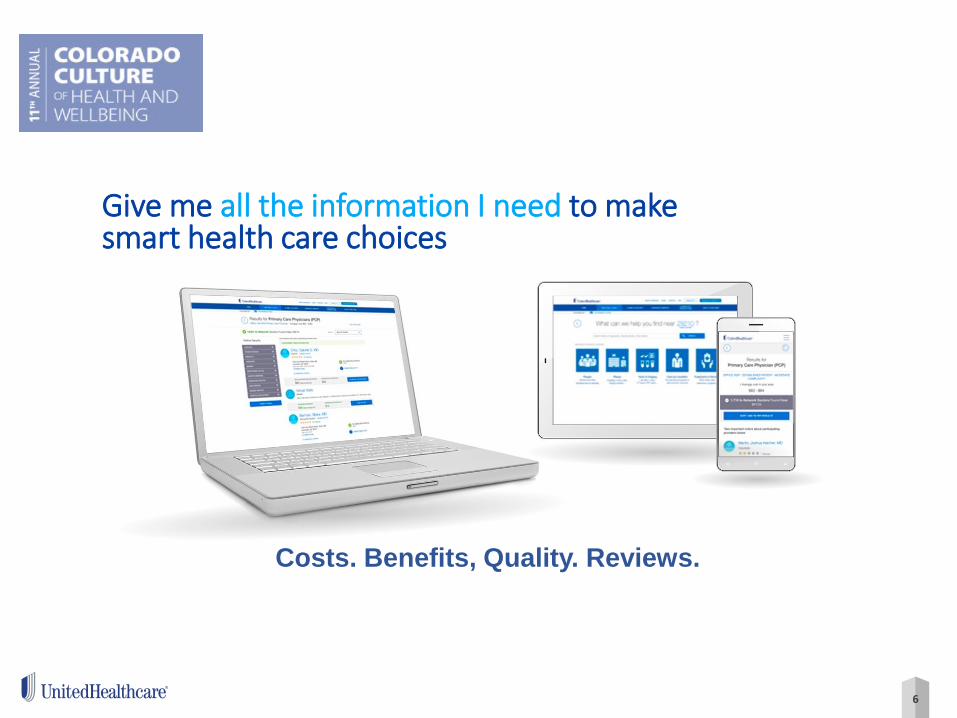
Costs. Benefits, Quality. Reviews.
Give me all the information I need to make smart health care choices
7
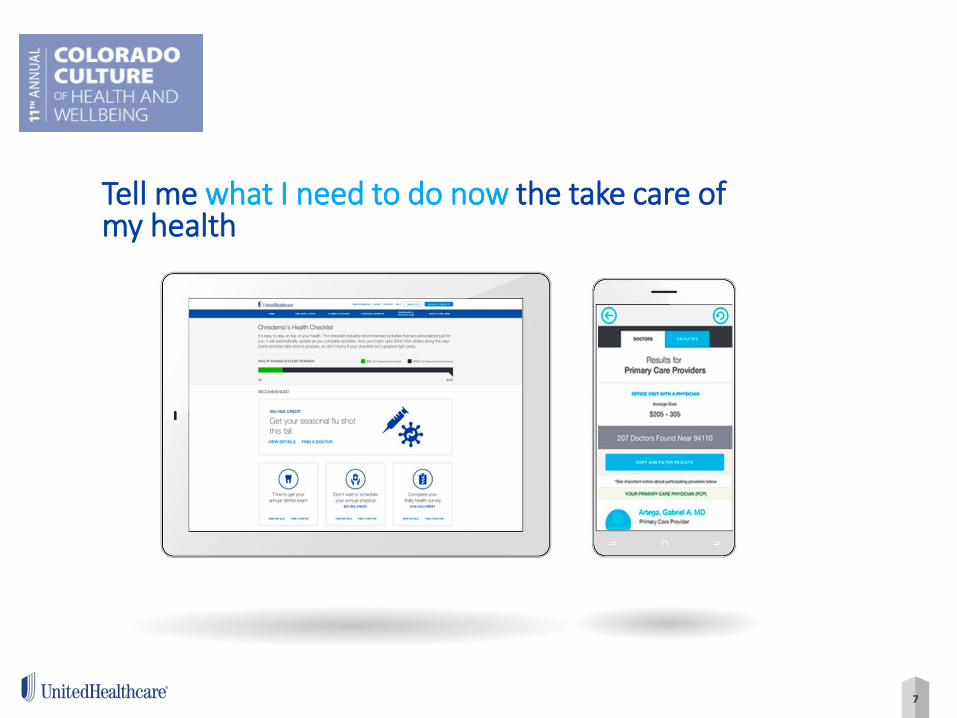
Tell me what I need to do now the take care of my health
7

8
Offer me the help I need when I need it
Support programs.
Recommendations.
Omni-channel.
Care reminders.
8
9
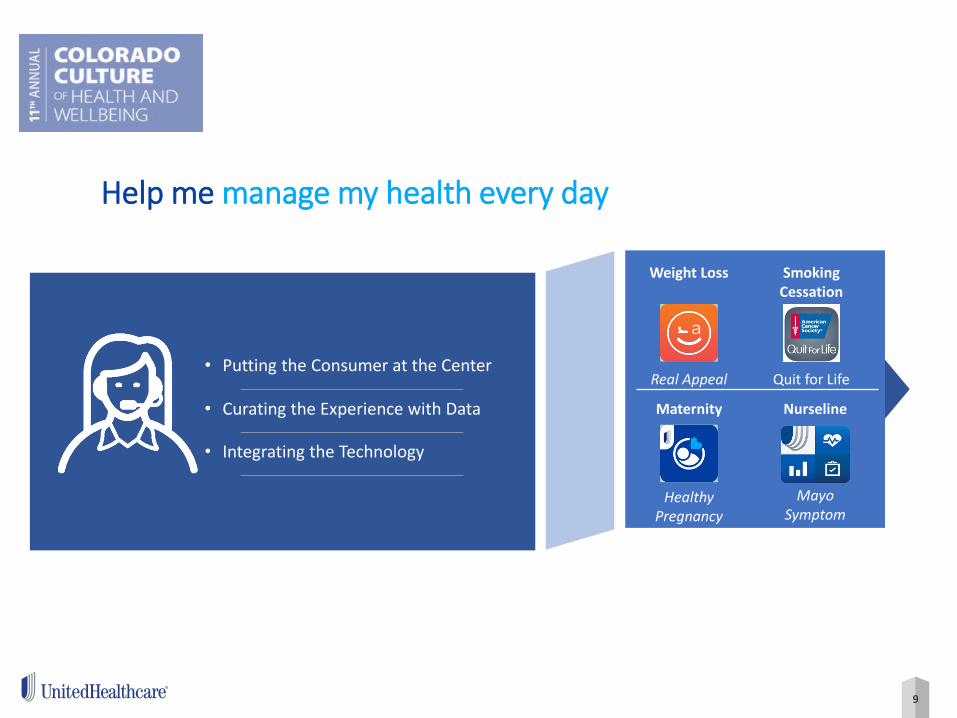
• Putting the Consumer at the Center
• Curating the Experience with Data
• Integrating the Technology
Weight Loss
Real Appeal
Maternity
Healthy Pregnancy
Nurseline
Mayo Symptom
Help me manage my health every day
Quit for Life
Smoking Cessation

10
Plan
Selection
Clinical
Support
Emotional
Health
Complex
Care
Support
Wellness
Pharmacy
Provider
Search
Benefits
and
Claims
Financial
Single Point of Contact.
Predictive Personalization.
Segmentation.
10
Multi-Channel Touchpoints.
Intelligent Routing.
Support me by knowing me, including how I want to interact

11
State of Colorado
Technology and Innovation
12
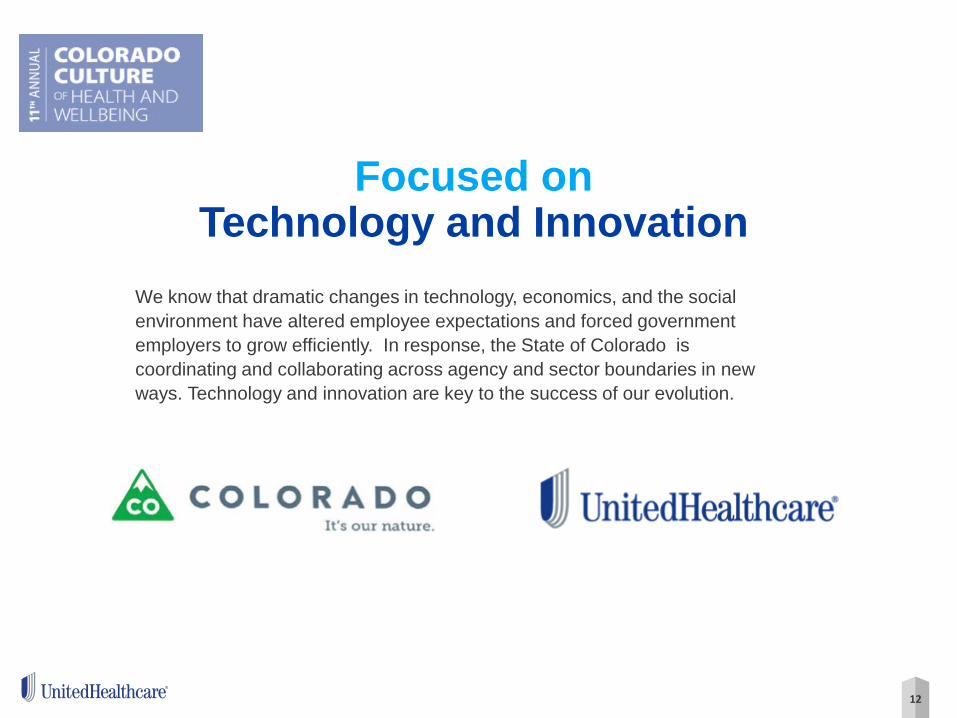
Focused on Technology and Innovation
We know that dramatic changes in technology, economics, and the social
environment have altered employee expectations and forced government
employers to grow efficiently. In response, the State of Colorado is
coordinating and collaborating across agency and sector boundaries in new
ways. Technology and innovation are key to the success of our evolution.
13
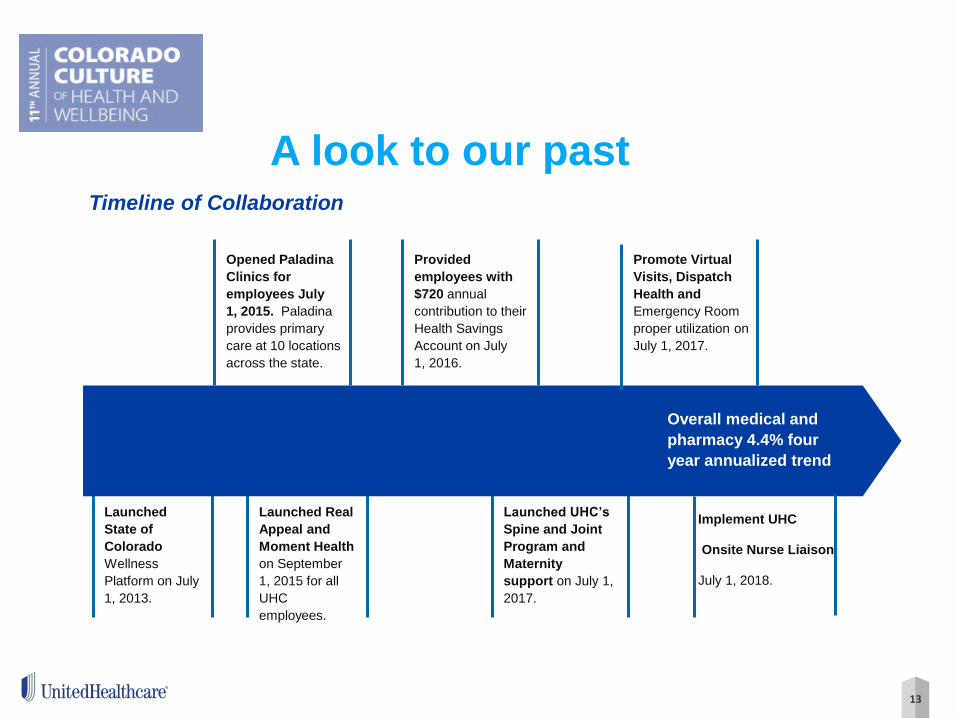
A look to our past Timeline of Collaboration
Opened Paladina
Clinics for
employees July
1, 2015. Paladina
provides primary
care at 10 locations
across the state.
Launched
State of
Colorado
Wellness
Platform on July
1, 2013.
Launched Real
Appeal and
Moment Health
on September
1, 2015 for all
UHC
employees.
Launched UHC’s
Spine and Joint
Program and
Maternity
support on July 1,
2017.
Provided
employees with
$720 annual
contribution to their
Health Savings
Account on July
1, 2016.
Promote Virtual
Visits, Dispatch
Health and
Emergency Room
proper utilization on
July 1, 2017.
Overall medical and
pharmacy 4.4% four
year annualized trend
Implement UHC
Onsite Nurse Liaison
July 1, 2018.
14
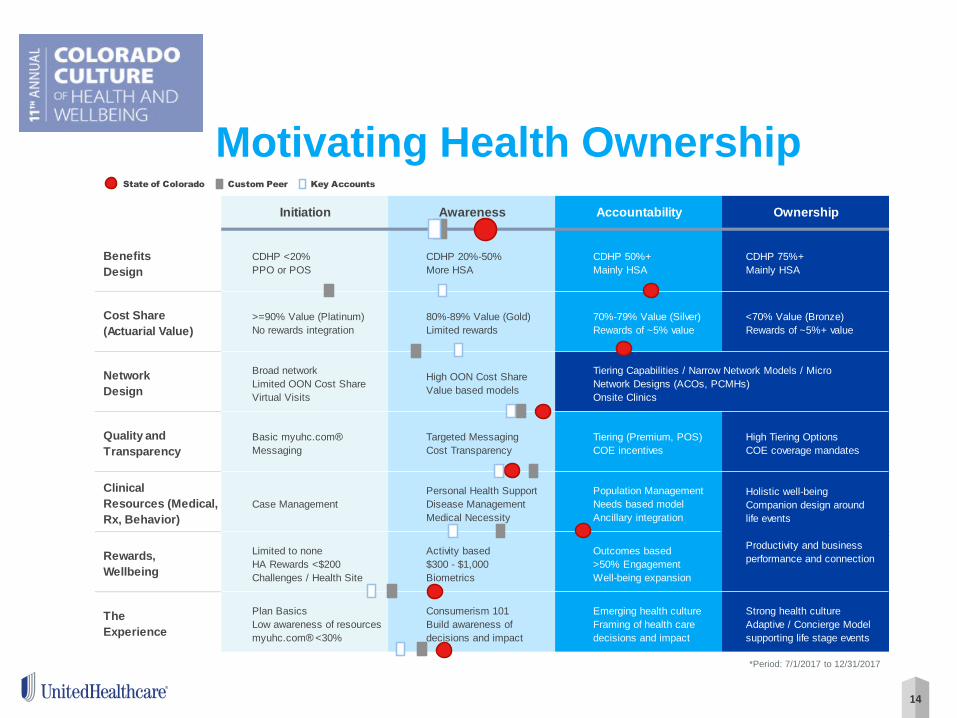
Motivating Health Ownership
Initiation Awareness Accountability Ownership
Benefits
Design
CDHP <20%
PPO or POS
CDHP 20%-50%
More HSA
CDHP 50%+
Mainly HSA
CDHP 75%+
Mainly HSA
Cost Share
(Actuarial Value)
>=90% Value (Platinum)
No rewards integration
80%-89% Value (Gold)
Limited rewards
70%-79% Value (Silver)
Rewards of ~5% value
<70% Value (Bronze)
Rewards of ~5%+ value
Network
Design
Broad network
Limited OON Cost Share
Virtual Visits
High OON Cost Share
Value based models
Quality and
Transparency
Basic myuhc.com®
Messaging
Targeted Messaging
Cost Transparency
Tiering (Premium, POS)
COE incentives
High Tiering Options
COE coverage mandates
Clinical
Resources (Medical,
Rx, Behavior)
Case Management
Personal Health Support
Disease Management
Medical Necessity
Population Management
Needs based model
Ancillary integration
Rewards,
Wellbeing
Limited to none
HA Rewards <$200
Challenges / Health Site
Activity based
$300 - $1,000
Biometrics
Outcomes based
>50% Engagement
Well-being expansion
The
Experience
Plan Basics
Low awareness of resources
myuhc.com® <30%
Consumerism 101
Build awareness of
decisions and impact
Emerging health culture
Framing of health care
decisions and impact
Strong health culture
Adaptive / Concierge Model
supporting life stage events
Holistic well-being
Companion design around
life events
Productivity and business
performance and connection
Tiering Capabilities / Narrow Network Models / Micro
Network Designs (ACOs, PCMHs)
Onsite Clinics
State of Colorado Custom Peer Key Accounts
*Period: 7/1/2017 to 12/31/2017

15
Different Shapes of Innovation
15
Employers can use a variety of innovative approaches to improve the
health of their employees, including:
Employee Wellness
Online and mobile
resources
Value-based care
Integrated care models
16
16
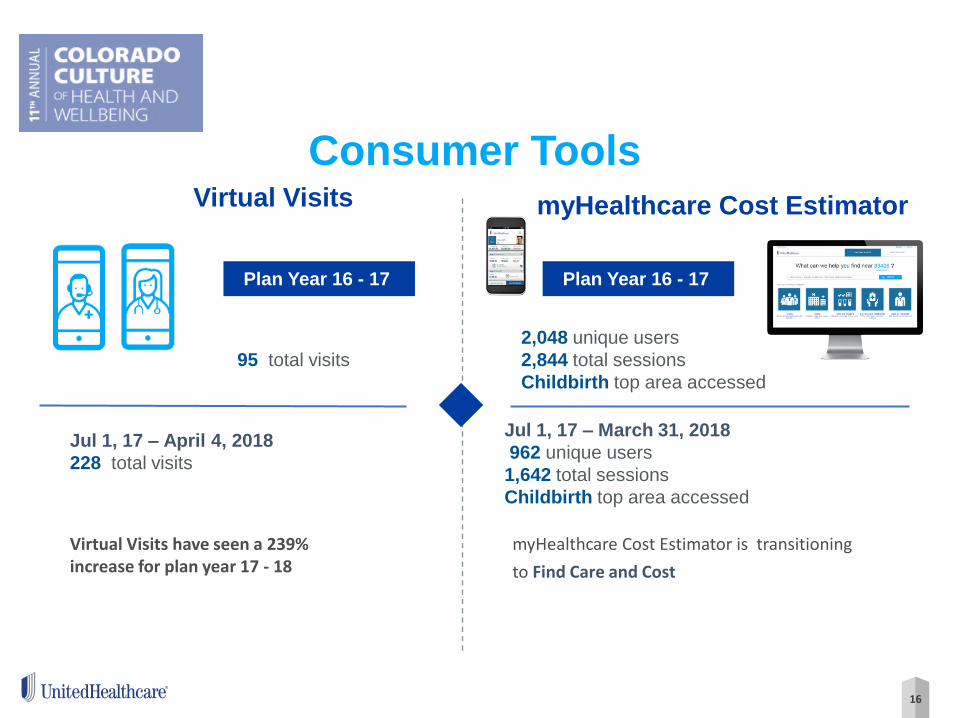
Virtual Visits myHealthcare Cost Estimator
2,048 unique users
2,844 total sessions
Childbirth top area accessed
95 total visits
Pl Year 16 - 17
Plan Year 16 - 17
Jul 1, 17 – April 4, 2018
228 total visits
Plan Year 16 - 17
Jul 1, 17 – March 31, 2018
962 unique users
1,642 total sessions
Childbirth top area accessed
Virtual Visits have seen a 239% increase for plan year 17 - 18
myHealthcare Cost Estimator is transitioning
to Find Care and Cost
Consumer Tools
17
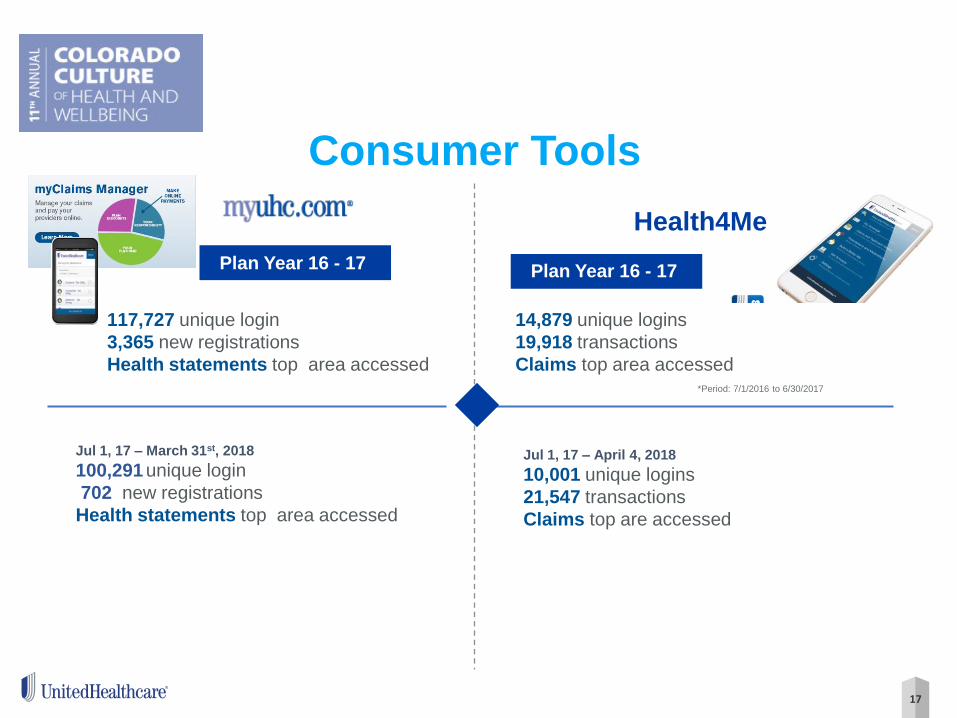
Consumer Tools
Health4Me
14,879 unique logins
19,918 transactions
Claims top area accessed
117,727 unique login
3,365 new registrations
Health statements top area accessed *Period: 7/1/2016 to 6/30/2017
Plan Year 16 - 17
Jul 1, 17 – March 31st, 2018
100,291 unique login
702 new registrations
Health statements top area accessed
Plan Year 16 - 17
Jul 1, 17 – April 4, 2018
10,001 unique logins
21,547 transactions
Claims top are accessed
18
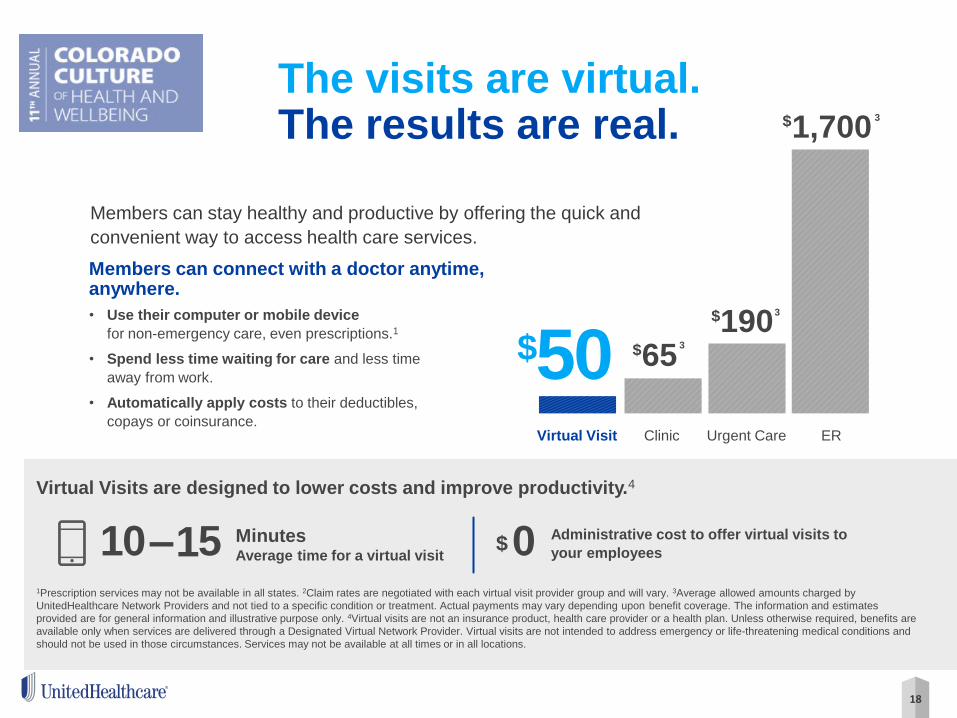
The visits are virtual. The results are real.
Members can stay healthy and productive by offering the quick and
convenient way to access health care services.
Virtual Visit Clinic Urgent Care ER
1,700 $
190 $
65 $ 50 $
3
3
3
Members can connect with a doctor anytime, anywhere.
• Use their computer or mobile device
for non-emergency care, even prescriptions.1
• Spend less time waiting for care and less time
away from work.
• Automatically apply costs to their deductibles,
copays or coinsurance.
Virtual Visits are designed to lower costs and improve productivity.4
1 1Prescription services may not be available in all states. 2Claim rates are negotiated with each virtual visit provider group and will vary. 3Average allowed amounts charged by
UnitedHealthcare Network Providers and not tied to a specific condition or treatment. Actual payments may vary depending upon benefit coverage. The information and estimates
provided are for general information and illustrative purpose only. 4Virtual visits are not an insurance product, health care provider or a health plan. Unless otherwise required, benefits are
available only when services are delivered through a Designated Virtual Network Provider. Virtual visits are not intended to address emergency or life-threatening medical conditions and
should not be used in those circumstances. Services may not be available at all times or in all locations.
Minutes Average time for a virtual visit 0 Administrative cost to offer virtual visits to
your employees $ 0 1 5 –
19
Dispatch Health
On-Demand Health Care, in the Comfort of Your Home or Work.
United Healthcare is committed to providing convenient high-quality
health care at the right time, in the right place, for an affordable
price. That’s why we’ve joined together with DispatchHealth to offer
on-demand health care services.
Mobile medical teams arrive equipped with the latest technology and
tools to treat minor to severe injuries and illnesses in the
convenience of your home or workplace.
Together, we are pioneering health solutions designed for you based
on accessibility and quality of care.
Call, Click, or Tap
the next time you or a loved one needs medical care
OPEN 8 a.m. – 10 p.m. | 7 DAYS A WEEK | 365 DAYS A YEAR | INCLUDING
HOLIDAYS
For more information on specific service areas, download the App or request care online.
Request Care Online
OR CALL US AT 303 500 1518
20
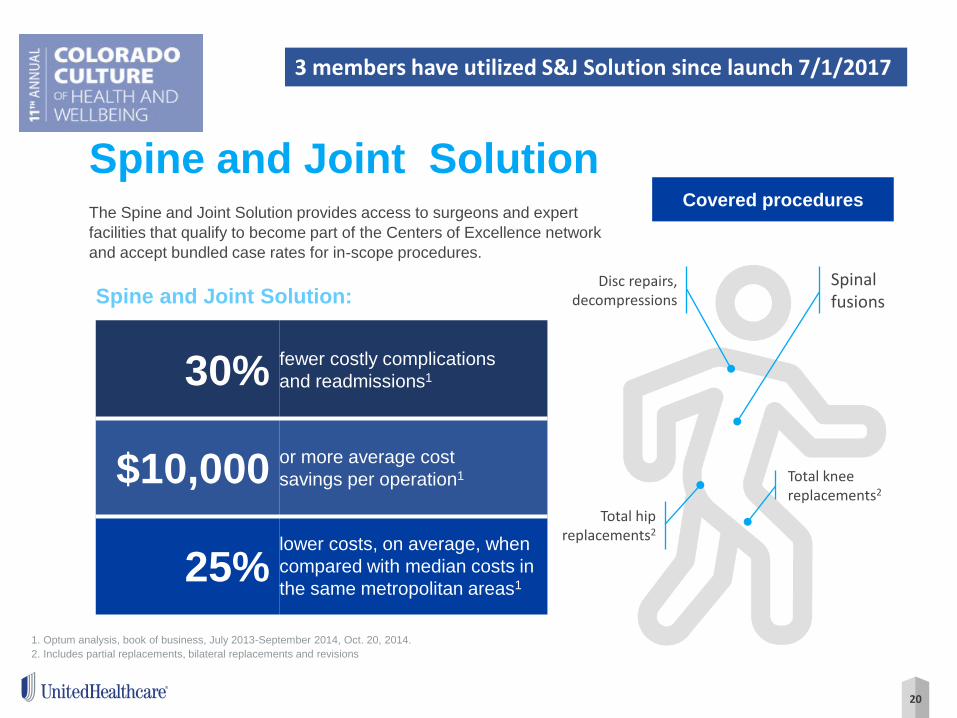
Spine and Joint Solution The Spine and Joint Solution provides access to surgeons and expert
facilities that qualify to become part of the Centers of Excellence network
and accept bundled case rates for in-scope procedures.
Spine and Joint Solution:
30% fewer costly complications
and readmissions1
$10,000 or more average cost
savings per operation1
25% lower costs, on average, when
compared with median costs in
the same metropolitan areas1
1. Optum analysis, book of business, July 2013-September 2014, Oct. 20, 2014.
2. Includes partial replacements, bilateral replacements and revisions
Spinal fusions
Disc repairs, decompressions
Total knee replacements2
Total hip replacements2
Covered procedures
3 members have utilized S&J Solution since launch 7/1/2017

21
Plan Design with Coinsurance Boost
There will continue to be different options for accessing
care with no change to the current level of benefits should
you choose not to utilize the SJS program. Members will
have a third co-insurance tier, offering a higher coverage
for SJS enrollment and COE utilization
Out-of-Network Coverage
No Change
In-Network Coverage
No Change
SJS Enrollment & COE
Utilization
If you enroll in SJS
and use a Center of
Excellence you may be
eligible for a 100%
covered surgery and
travel cost
reimbursement.
In addition, there will be a Travel and lodging
reimbursement for those outside of COE radius.

22
Onsite Nurse coming 7/1/2018
Onsite Nurse Liaison Motivating Health Ownership
Identify member
health risks and
utilization
patterns
Engage
employees in
making better
healthcare
decisions
Provide
coaching and
support for
individuals and
groups
Teach employees
how to navigate
tools and
resources
Provide referrals
to clinical and
community
programs
Plan
interventions
based on
opportunities
identified
23
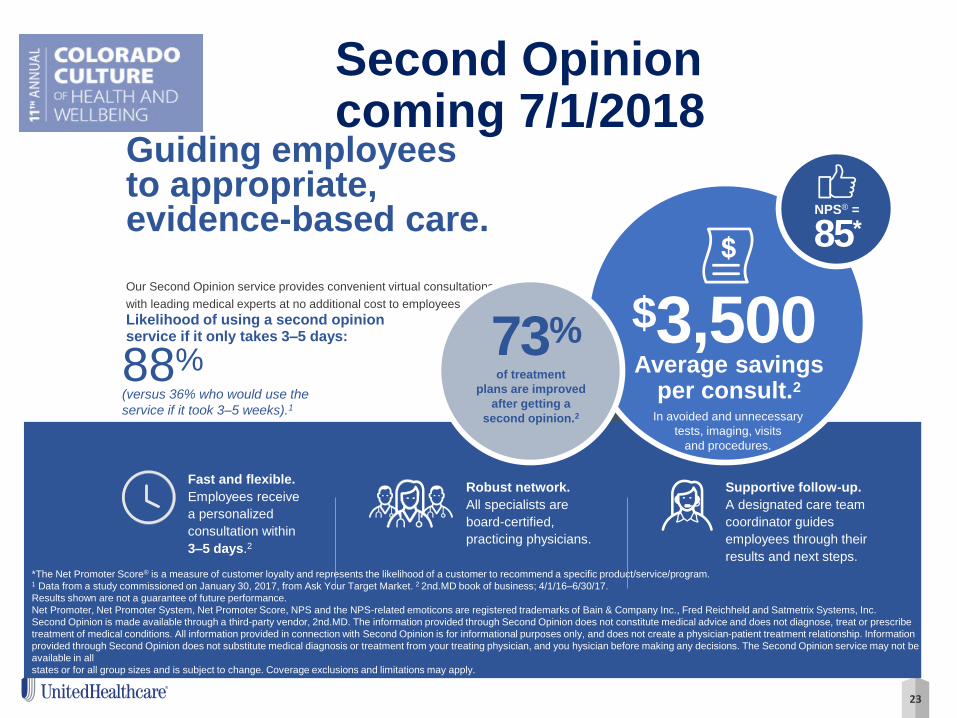
Second Opinion coming 7/1/2018
Guiding employees to appropriate, evidence-based care.
Our Second Opinion service provides convenient virtual consultations
with leading medical experts at no additional cost to employees.
Fast and flexible.
Employees receive
a personalized
consultation within
3–5 days.2
Robust network.
All specialists are
board-certified,
practicing physicians.
Supportive follow-up.
A designated care team
coordinator guides
employees through their
results and next steps.
*The Net Promoter Score® is a measure of customer loyalty and represents the likelihood of a customer to recommend a specific product/service/program. 1 Data from a study commissioned on January 30, 2017, from Ask Your Target Market. 2 2nd.MD book of business; 4/1/16–6/30/17.
Results shown are not a guarantee of future performance.
Net Promoter, Net Promoter System, Net Promoter Score, NPS and the NPS-related emoticons are registered trademarks of Bain & Company Inc., Fred Reichheld and Satmetrix Systems, Inc.
Second Opinion is made available through a third-party vendor, 2nd.MD. The information provided through Second Opinion does not constitute medical advice and does not diagnose, treat or prescribe
treatment of medical conditions. All information provided in connection with Second Opinion is for informational purposes only, and does not create a physician-patient treatment relationship. Information
provided through Second Opinion does not substitute medical diagnosis or treatment from your treating physician, and you hysician before making any decisions. The Second Opinion service may not be
available in all
states or for all group sizes and is subject to change. Coverage exclusions and limitations may apply.
Likelihood of using a second opinion service if it only takes 3–5 days:
88%
(versus 36% who would use the
service if it took 3–5 weeks).1
$3,500
In avoided and unnecessary
tests, imaging, visits
and procedures.
Average savings per consult.2
73% of treatment
plans are improved
after getting a
second opinion.2
85*
NPS® =

24
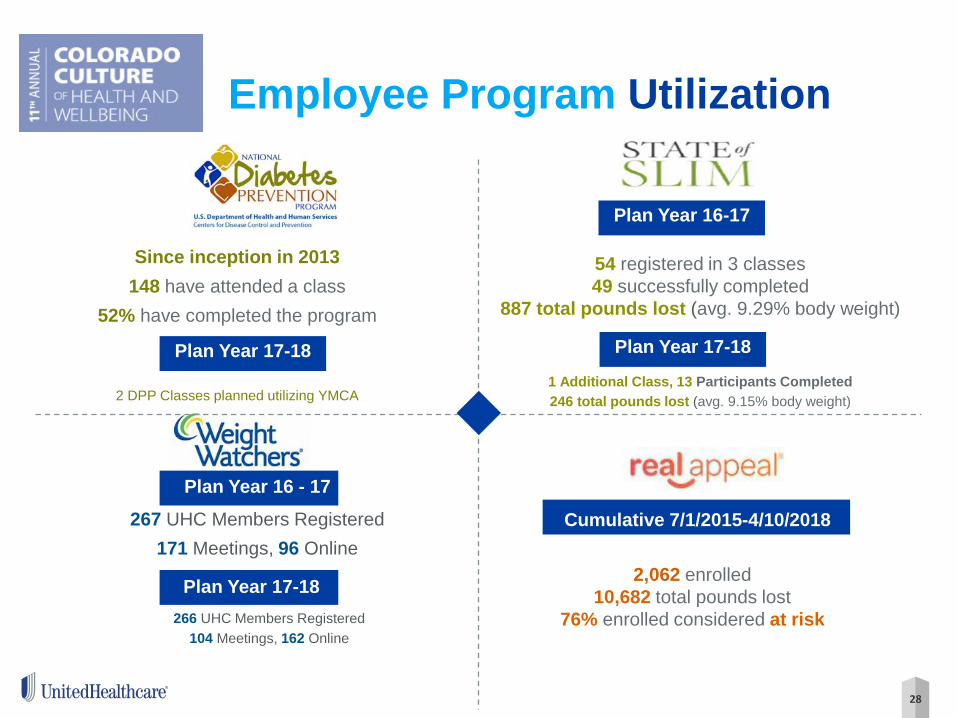
Employee Program Utilization
Launched July 2015
Launched July 2015
Launched 2009 under DPP Launched Fall 2015
Launched 2009* Launched September 2015
Implemented July 2013
Effective July 2015

25
Engaged v/s Non Engaged
25
Engaged Non-Engaged
Members Enrolled 3,520 13,188
Average Employee Age 43.8 45.5
Benefits Utilization 93.4% 87.6%
Claims Risk Score 1.327 1.473
Net Paid PMPM $274 $338
Paid PMPM (CC) $47 $96
Premium Utilization 43.0% 34.2%
ER Visits Per 1k 88.1 153.2
Urgent Care Per 1k 53.4 62.0
Admissions per 1k 33.8 39.1
Activation 63.6% 53.8%
Network Utilization 98.8% 98.2%
Fin
ancia
ls
Utiliz
ation
D
em
ogra
phic
s

26
Employee Program Utilization
26,414 Employees have an account
(UHC, Kaiser, Other) 971 Health Surveys completed
313 members checked into 16,117
Rally Missions
Since Rally become available in 2015, 2,591 members have registered. There have been 10,738 missions
users in the past 21 months.
Plan Year 16 - 17 Plan Year 16 - 17

27
Employee Program Utilization
407 Registrants
62% Average Attending 3+ classes
76% Overall Satisfaction rating
Plan Year 16 - 17
Pan Year 16 - 17
2,333 Enrolled as of July 1, 2017
29% Increase from previous year
486 Registrants
94% of high risk members have engaged
2,976 Enrolled as of March 1, 2018
97% of high risk individuals engage w/Paladina
18% lower gross claim costs for Paladina members
Plan Year 17 - 18
Plan Year 16 - 17
Plan Year 17 - 18
28
Cumulative 7/1/2015-4/10/2018
Employee Program Utilization
267 UHC Members Registered
171 Meetings, 96 Online
2,062 enrolled
10,682 total pounds lost
76% enrolled considered at risk
Plan Year 16 - 17
54 registered in 3 classes
49 successfully completed
887 total pounds lost (avg. 9.29% body weight)
1 Additional Class, 13 Participants Completed
246 total pounds lost (avg. 9.15% body weight)
Plan Year 16-17
266 UHC Members Registered
104 Meetings, 162 Online
Since inception in 2013
148 have attended a class
52% have completed the program
2 DPP Classes planned utilizing YMCA
Plan Year 17-18 Plan Year 17-18
Plan Year 17-18

Real Appeal delivers engagement & weight loss
10 lbs.
46%
82%
245,000 + enrolled participants*
average pounds lost per participant*
lost at least 5% of body weight*
lost weight*
1 Million pounds lost
A new approach to weight loss and preventing chronic disease
*Real Appeal Book of Business, results through December 2016; 4-session attendance meets CDC definition of “active participant”, Cohort represents participants at-risk, in program 26+ weeks, attend 4+ ILIs
87% participants at-risk
20 years of weight loss research
Live Coaching support
Engaging entertainment
+
+
=
29
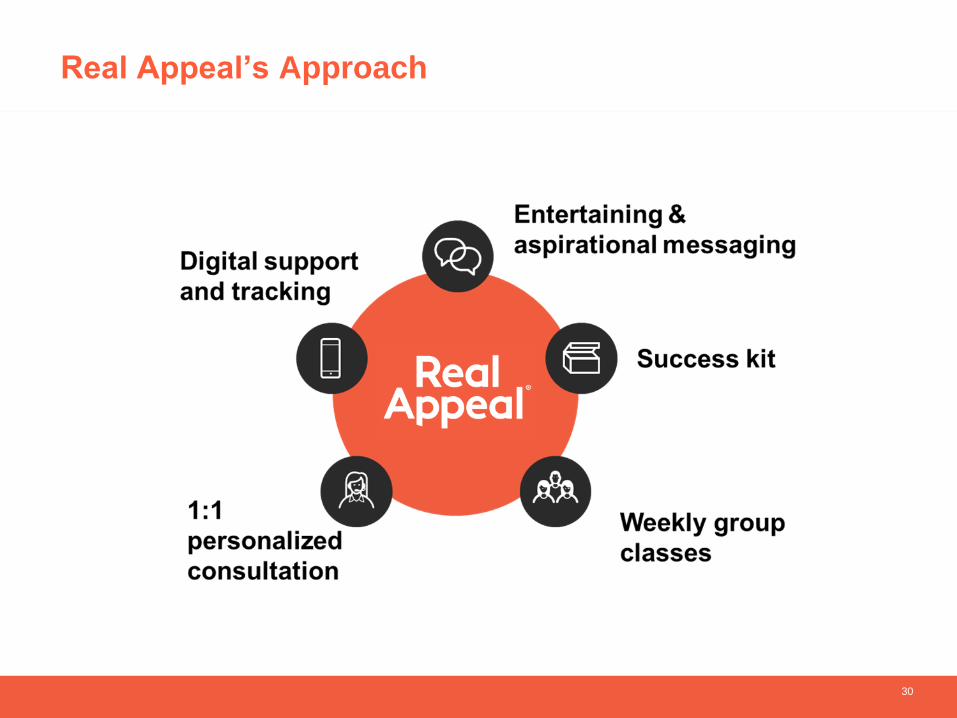
Online
coaching Success
Kit
Digital
tools
Real Appeal’s Approach
30
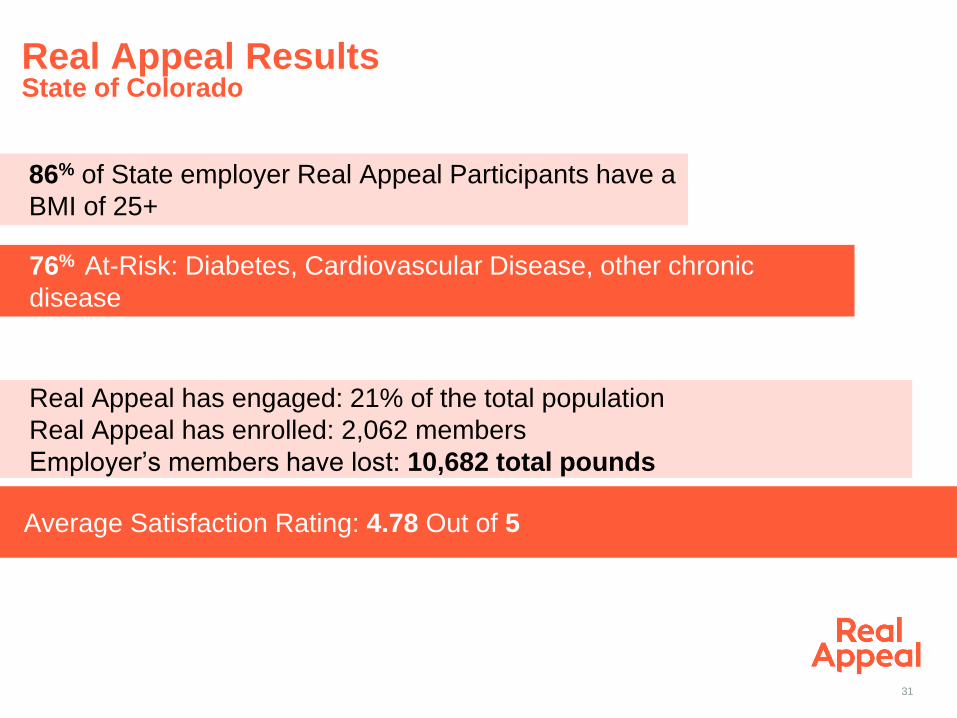
Real Appeal Results State of Colorado
86% of State employer Real Appeal Participants have a
BMI of 25+
76% At-Risk: Diabetes, Cardiovascular Disease, other chronic
disease
Real Appeal has engaged: 21% of the total population
Real Appeal has enrolled: 2,062 members
Employer’s members have lost: 10,682 total pounds
Average Satisfaction Rating: 4.78 Out of 5
31

Exceeding Real Appeal’s BOB expectations
32

33
Real Appeal Medical Cost Savings
Participant Year One Results
Source: 12 Month Medical Cost Savings Observed from Real Appeal Intensive Lifestyle Interventions, January 2018
• Study demonstrates that Real Appeal helps employers achieve medical
cost savings as soon as the first year.
• 1:1 ROI achieved within program Year 1.
• Cost savings increased with engagement.

34
Questions