Proven Energy-Saving Technologies for Commercial Properties
170
NREL is a national laboratory of the U.S. Department of Energy Office of Energy Efficiency & Renewable Energy Operated by the Alliance for Sustainable Energy, LLC This report is available at no cost from the National Renewable Energy Laboratory (NREL) at www.nrel.gov/publications. Contract No. DE-AC36-08GO28308 Proven Energy-Saving Technologies for Commercial Properties September 1, 2014 — December 15, 2014 S. Hackel, J. Kramer, J. Li, M. Lord, G. Marsicek, A. Petersen, S. Schuetter, and J. Sippel Energy Center of Wisconsin Madison, Wisconsin NREL Technical Monitor: Adam Hirsch Subcontract Report NREL/SR-5500-63807 March 2015
Transcript of Proven Energy-Saving Technologies for Commercial Properties

NREL is a national laboratory of the U.S. Department of Energy Office of Energy Efficiency & Renewable Energy Operated by the Alliance for Sustainable Energy, LLC
This report is available at no cost from the National Renewable Energy Laboratory (NREL) at www.nrel.gov/publications.
Contract No. DE-AC36-08GO28308
Proven Energy-Saving Technologies for Commercial Properties September 1, 2014 — December 15, 2014 S. Hackel, J. Kramer, J. Li, M. Lord, G. Marsicek, A. Petersen, S. Schuetter, and J. Sippel Energy Center of Wisconsin Madison, Wisconsin
NREL Technical Monitor: Adam Hirsch
Subcontract Report NREL/SR-5500-63807 March 2015

NREL is a national laboratory of the U.S. Department of Energy Office of Energy Efficiency & Renewable Energy Operated by the Alliance for Sustainable Energy, LLC
This report is available at no cost from the National Renewable Energy Laboratory (NREL) at www.nrel.gov/publications.
Contract No. DE-AC36-08GO28308
National Renewable Energy Laboratory 15013 Denver West Parkway Golden, CO 80401 303-275-3000 • www.nrel.gov
Proven Energy-Saving Technologies for Commercial Properties September 1, 2014 — December 15, 2014
S. Hackel, J. Kramer, J. Li, M. Lord, G. Marsicek, A. Petersen, S. Schuetter, and J. Sippel Energy Center of Wisconsin Madison, Wisconsin
NREL Technical Monitor: Adam Hirsch Prepared under Subcontract No. KLDJ-1-40370-01
Subcontract Report NREL/SR-5500-63807 March 2015

NOTICE
This report was prepared as an account of work sponsored by an agency of the United States government. Neither the United States government nor any agency thereof, nor any of their employees, makes any warranty, express or implied, or assumes any legal liability or responsibility for the accuracy, completeness, or usefulness of any information, apparatus, product, or process disclosed, or represents that its use would not infringe privately owned rights. Reference herein to any specific commercial product, process, or service by trade name, trademark, manufacturer, or otherwise does not necessarily constitute or imply its endorsement, recommendation, or favoring by the United States government or any agency thereof. The views and opinions of authors expressed herein do not necessarily state or reflect those of the United States government or any agency thereof.
This report is available at no cost from the National Renewable Energy Laboratory (NREL) at www.nrel.gov/publications.
Available electronically at http://www.osti.gov/scitech
Available for a processing fee to U.S. Department of Energy and its contractors, in paper, from:
U.S. Department of Energy Office of Scientific and Technical Information P.O. Box 62 Oak Ridge, TN 37831-0062 phone: 865.576.8401 fax: 865.576.5728 email: mailto:[email protected]
Available for sale to the public, in paper, from:
U.S. Department of Commerce National Technical Information Service 5285 Port Royal Road Springfield, VA 22161 phone: 800.553.6847 fax: 703.605.6900 email: [email protected] online ordering: http://www.ntis.gov/help/ordermethods.aspx
Cover Photos: (left to right) photo by Pat Corkery, NREL 16416, photo from SunEdison, NREL 17423, photo by Pat Corkery, NREL 16560, photo by Dennis Schroeder, NREL 17613, photo by Dean Armstrong, NREL 17436, photo by Pat Corkery, NREL 17721.
NREL prints on paper that contains recycled content.

iii
This report is available at no cost from the National Renewable Energy Laboratory (NREL) at www.nrel.gov/publications.
Acknowledgments This project was made possible with American Recovery and Reinvestment Act of 2009 Funds. The authors would like to thank Arah Schuur and Glenn Schatz of the U.S. Department of Energy Building Technologies Office for supporting this project.
The authors also wish to acknowledge the Western Cooling Efficiency Center, the University of Washington Integrated Design Lab, Noresco, the Alliance for a Sustainable Colorado, PAE Engineers, and the Bullitt Foundation for their expertise and work on this project. Rois Langner of the National Renewable Energy Laboratory also provided her expertise.
Thanks are also due to Ren Anderson of Eigen Energy and to Ron Judkoff, Daniel Studer, and Lieko Earle (all of the National Renewable Energy Laboratory) for reviewing this report and providing helpful feedback.
iv
This report is available at no cost from the National Renewable Energy Laboratory (NREL) at www.nrel.gov/publications.
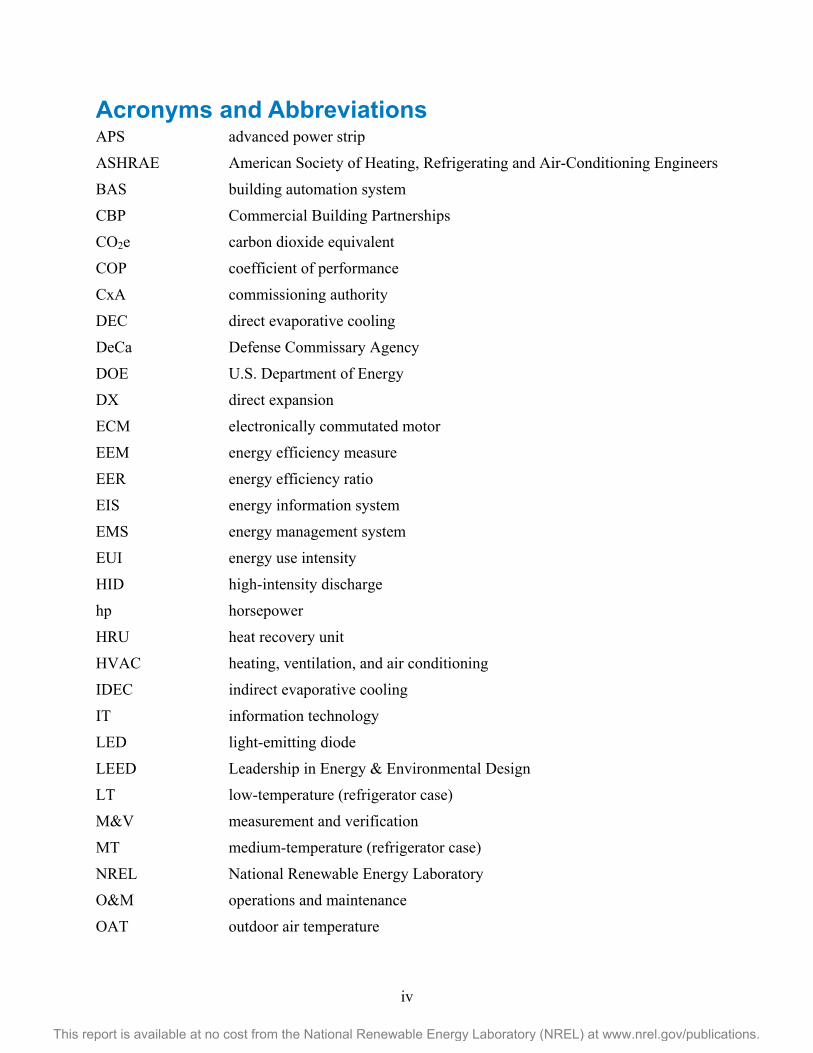
Acronyms and Abbreviations APS advanced power strip
ASHRAE American Society of Heating, Refrigerating and Air-Conditioning Engineers
BAS building automation system
CBP Commercial Building Partnerships
CO2e carbon dioxide equivalent
COP coefficient of performance
CxA commissioning authority
DEC direct evaporative cooling
DeCa Defense Commissary Agency
DOE U.S. Department of Energy
DX direct expansion
ECM electronically commutated motor
EEM energy efficiency measure
EER energy efficiency ratio
EIS energy information system
EMS energy management system
EUI energy use intensity
HID high-intensity discharge
hp horsepower
HRU heat recovery unit
HVAC heating, ventilation, and air conditioning
IDEC indirect evaporative cooling
IT information technology
LED light-emitting diode
LEED Leadership in Energy & Environmental Design
LT low-temperature (refrigerator case)
M&V measurement and verification
MT medium-temperature (refrigerator case)
NREL National Renewable Energy Laboratory
O&M operations and maintenance
OAT outdoor air temperature

v
This report is available at no cost from the National Renewable Energy Laboratory (NREL) at www.nrel.gov/publications.
PSC permanent split capacitor
RTU rooftop unit
SP shaded pole
UL Underwriters Laboratories
VAV variable air volume
VFD variable frequency drive
VRF variable refrigerant flow
w.c. water column
wg water gauge
vi
This report is available at no cost from the National Renewable Energy Laboratory (NREL) at www.nrel.gov/publications.
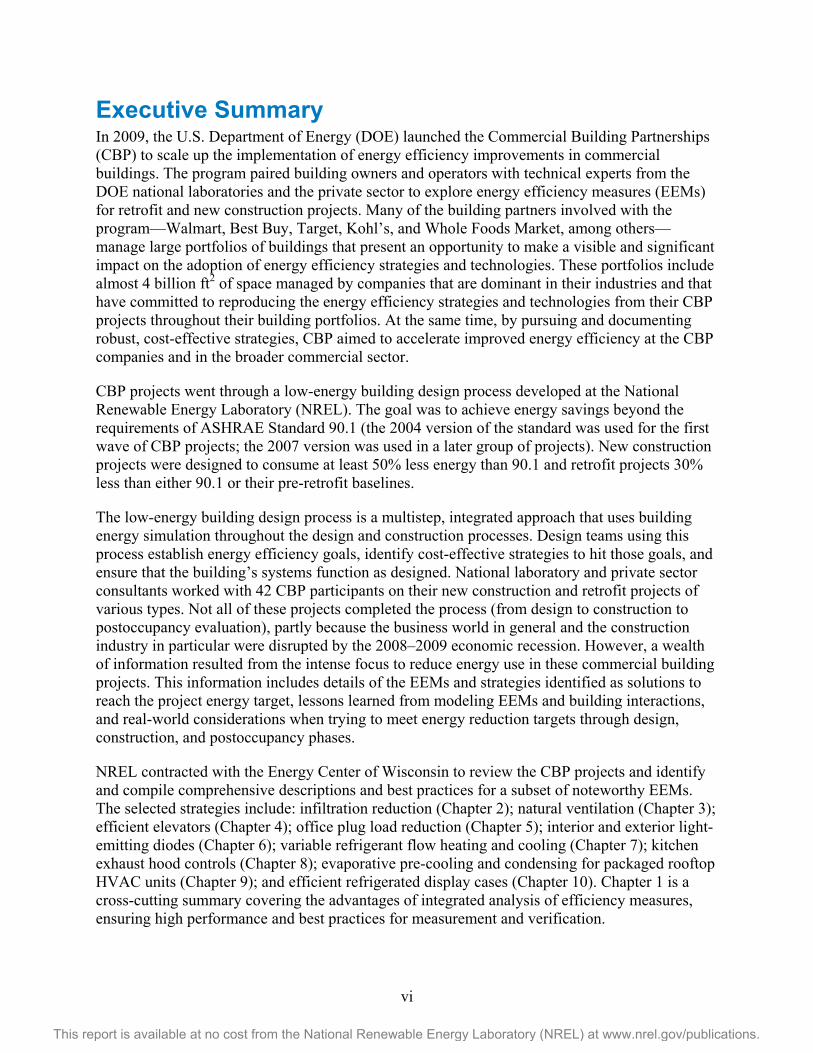
Executive Summary In 2009, the U.S. Department of Energy (DOE) launched the Commercial Building Partnerships (CBP) to scale up the implementation of energy efficiency improvements in commercial buildings. The program paired building owners and operators with technical experts from the DOE national laboratories and the private sector to explore energy efficiency measures (EEMs) for retrofit and new construction projects. Many of the building partners involved with the program—Walmart, Best Buy, Target, Kohl’s, and Whole Foods Market, among others—manage large portfolios of buildings that present an opportunity to make a visible and significant impact on the adoption of energy efficiency strategies and technologies. These portfolios include almost 4 billion ft2 of space managed by companies that are dominant in their industries and that have committed to reproducing the energy efficiency strategies and technologies from their CBP projects throughout their building portfolios. At the same time, by pursuing and documenting robust, cost-effective strategies, CBP aimed to accelerate improved energy efficiency at the CBP companies and in the broader commercial sector.
CBP projects went through a low-energy building design process developed at the National Renewable Energy Laboratory (NREL). The goal was to achieve energy savings beyond the requirements of ASHRAE Standard 90.1 (the 2004 version of the standard was used for the first wave of CBP projects; the 2007 version was used in a later group of projects). New construction projects were designed to consume at least 50% less energy than 90.1 and retrofit projects 30% less than either 90.1 or their pre-retrofit baselines.
The low-energy building design process is a multistep, integrated approach that uses building energy simulation throughout the design and construction processes. Design teams using this process establish energy efficiency goals, identify cost-effective strategies to hit those goals, and ensure that the building’s systems function as designed. National laboratory and private sector consultants worked with 42 CBP participants on their new construction and retrofit projects of various types. Not all of these projects completed the process (from design to construction to postoccupancy evaluation), partly because the business world in general and the construction industry in particular were disrupted by the 2008–2009 economic recession. However, a wealth of information resulted from the intense focus to reduce energy use in these commercial building projects. This information includes details of the EEMs and strategies identified as solutions to reach the project energy target, lessons learned from modeling EEMs and building interactions, and real-world considerations when trying to meet energy reduction targets through design, construction, and postoccupancy phases.
NREL contracted with the Energy Center of Wisconsin to review the CBP projects and identify and compile comprehensive descriptions and best practices for a subset of noteworthy EEMs. The selected strategies include: infiltration reduction (Chapter 2); natural ventilation (Chapter 3); efficient elevators (Chapter 4); office plug load reduction (Chapter 5); interior and exterior light-emitting diodes (Chapter 6); variable refrigerant flow heating and cooling (Chapter 7); kitchen exhaust hood controls (Chapter 8); evaporative pre-cooling and condensing for packaged rooftop HVAC units (Chapter 9); and efficient refrigerated display cases (Chapter 10). Chapter 1 is a cross-cutting summary covering the advantages of integrated analysis of efficiency measures, ensuring high performance and best practices for measurement and verification.

vii
This report is available at no cost from the National Renewable Energy Laboratory (NREL) at www.nrel.gov/publications.
Table of Contents Chapter 1. The Commercial Building Partnerships Overview ........................................................... 1
1.1 Introduction ...................................................................................................................................... 1 1.2 Energy Efficiency Measures ............................................................................................................ 2 1.3 Bundling Energy Efficiency Measures ............................................................................................ 3
1.3.1 Reduce the Size of HVAC Equipment by Reducing Loads .............................................. 4 1.3.2 Save HVAC Energy With Efficient Refrigeration ............................................................ 4 1.3.3 Reduce Space Requirements by Choosing Efficient Systems .......................................... 4 1.3.4 Obtain Flexibility in Control by Choosing Light-Emitting Diodes .................................. 5 1.3.5 Improve Natural Ventilation by Reducing Infiltration ...................................................... 5
1.4 Ensuring High Performance ............................................................................................................. 6 1.4.1 Commissioning ................................................................................................................. 6 1.4.2 Predesign Phase ................................................................................................................. 6 1.4.3 Design Phase ..................................................................................................................... 6 1.4.4 Preconstruction Phase ....................................................................................................... 6 1.4.5 Construction Phase ............................................................................................................ 6 1.4.6 Occupancy and Operation Phase ....................................................................................... 7
1.5 Measurement and Verification ......................................................................................................... 7 1.5.1 Roles ................................................................................................................................. 8 1.5.2 Detailed Methodology ....................................................................................................... 8 1.5.3 Data Points and Instrumentation ..................................................................................... 10 1.5.4 Data Management ........................................................................................................... 10
1.6 References and Other Resources.................................................................................................... 11 Chapter 2. Infiltration Reduction ........................................................................................................ 13
2.1 Description ..................................................................................................................................... 13 2.2 Strategy .......................................................................................................................................... 13
2.2.1 New Construction ........................................................................................................... 14 2.2.2 Existing Buildings ........................................................................................................... 14 2.2.3 Real-World Considerations ............................................................................................. 16 2.2.4 Financial Incentives ........................................................................................................ 16
2.3 Project Results ............................................................................................................................... 17 2.4 Modeling Infiltration Reduction Savings ....................................................................................... 18
2.4.1 OpenStudio Guidance ..................................................................................................... 18 2.5 Ensuring Performance .................................................................................................................... 18
2.5.1 Installation ....................................................................................................................... 18 2.5.2 Commissioning ............................................................................................................... 19 2.5.3 Operation ......................................................................................................................... 19 2.5.4 Occupant Behavior .......................................................................................................... 19
2.6 Measurement and Verification ....................................................................................................... 19 2.6.1 Recommended Monitoring Points ................................................................................... 19 2.6.2 Detailed Procedures for Measuring Infiltration Rates..................................................... 20 2.6.3 Guidance for Analysis ..................................................................................................... 22
2.7 References and Resources .............................................................................................................. 23 Chapter 3. Natural Ventilation ............................................................................................................ 25
3.1 Description ..................................................................................................................................... 25 3.2 Benefits of Natural Ventilation ...................................................................................................... 25 3.3 Design Strategies ........................................................................................................................... 26
3.3.1 Wind-Driven Ventilation ................................................................................................ 26 3.3.2 Buoyancy-Driven Ventilation ......................................................................................... 28 3.3.3 Controls for Natural Ventilation Systems ....................................................................... 28
viii
This report is available at no cost from the National Renewable Energy Laboratory (NREL) at www.nrel.gov/publications.
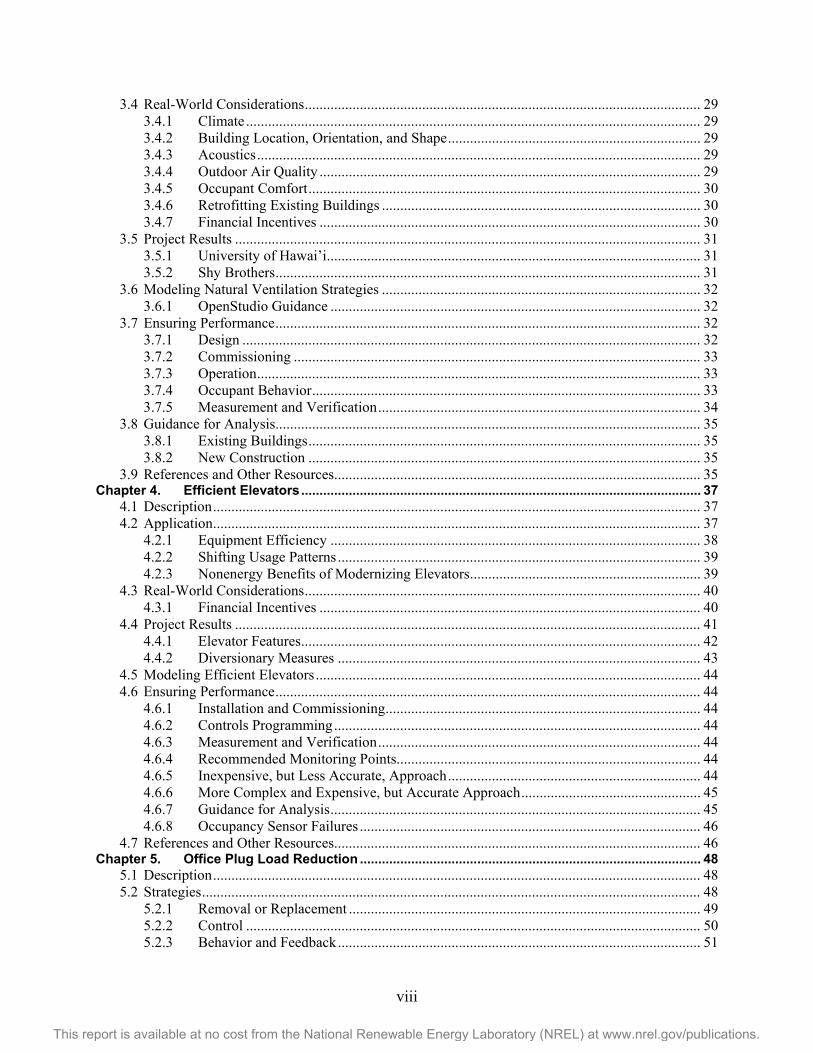
3.4 Real-World Considerations ............................................................................................................ 29 3.4.1 Climate ............................................................................................................................ 29 3.4.2 Building Location, Orientation, and Shape ..................................................................... 29 3.4.3 Acoustics ......................................................................................................................... 29 3.4.4 Outdoor Air Quality ........................................................................................................ 29 3.4.5 Occupant Comfort ........................................................................................................... 30 3.4.6 Retrofitting Existing Buildings ....................................................................................... 30 3.4.7 Financial Incentives ........................................................................................................ 30
3.5 Project Results ............................................................................................................................... 31 3.5.1 University of Hawai’i ...................................................................................................... 31 3.5.2 Shy Brothers .................................................................................................................... 31
3.6 Modeling Natural Ventilation Strategies ....................................................................................... 32 3.6.1 OpenStudio Guidance ..................................................................................................... 32
3.7 Ensuring Performance .................................................................................................................... 32 3.7.1 Design ............................................................................................................................. 32 3.7.2 Commissioning ............................................................................................................... 33 3.7.3 Operation ......................................................................................................................... 33 3.7.4 Occupant Behavior .......................................................................................................... 33 3.7.5 Measurement and Verification ........................................................................................ 34
3.8 Guidance for Analysis.................................................................................................................... 35 3.8.1 Existing Buildings ........................................................................................................... 35 3.8.2 New Construction ........................................................................................................... 35
3.9 References and Other Resources.................................................................................................... 35 Chapter 4. Efficient Elevators ............................................................................................................. 37
4.1 Description ..................................................................................................................................... 37 4.2 Application ..................................................................................................................................... 37
4.2.1 Equipment Efficiency ..................................................................................................... 38 4.2.2 Shifting Usage Patterns ................................................................................................... 39 4.2.3 Nonenergy Benefits of Modernizing Elevators ............................................................... 39
4.3 Real-World Considerations ............................................................................................................ 40 4.3.1 Financial Incentives ........................................................................................................ 40
4.4 Project Results ............................................................................................................................... 41 4.4.1 Elevator Features ............................................................................................................. 42 4.4.2 Diversionary Measures ................................................................................................... 43
4.5 Modeling Efficient Elevators ......................................................................................................... 44 4.6 Ensuring Performance .................................................................................................................... 44
4.6.1 Installation and Commissioning ...................................................................................... 44 4.6.2 Controls Programming .................................................................................................... 44 4.6.3 Measurement and Verification ........................................................................................ 44 4.6.4 Recommended Monitoring Points ................................................................................... 44 4.6.5 Inexpensive, but Less Accurate, Approach ..................................................................... 44 4.6.6 More Complex and Expensive, but Accurate Approach ................................................. 45 4.6.7 Guidance for Analysis ..................................................................................................... 45 4.6.8 Occupancy Sensor Failures ............................................................................................. 46
4.7 References and Other Resources.................................................................................................... 46 Chapter 5. Office Plug Load Reduction ............................................................................................. 48
5.1 Description ..................................................................................................................................... 48 5.2 Strategies ........................................................................................................................................ 48
5.2.1 Removal or Replacement ................................................................................................ 49 5.2.2 Control ............................................................................................................................ 50 5.2.3 Behavior and Feedback ................................................................................................... 51
ix
This report is available at no cost from the National Renewable Energy Laboratory (NREL) at www.nrel.gov/publications.
5.2.4 Real World Considerations ............................................................................................. 52 5.3 Project Results ............................................................................................................................... 53 5.4 Lessons Learned From Commercial Building Partnerships Projects ............................................. 54 5.5 Modeling of Plug Load Savings .................................................................................................... 55
5.5.1 OpenStudio Guidance ..................................................................................................... 55 5.6 Ensuring Performance .................................................................................................................... 55
5.6.1 Installation ....................................................................................................................... 55 5.6.2 Commissioning ............................................................................................................... 56 5.6.3 Controls Programming .................................................................................................... 56 5.6.4 Operation ......................................................................................................................... 56 5.6.5 Occupant Behavior .......................................................................................................... 57 5.6.6 Measurement and Verification ........................................................................................ 57 5.6.7 Inexpensive, but Less Accurate, Approach ..................................................................... 57 5.6.8 More Complex and Expensive, but Accurate Approach ................................................. 57 5.6.9 Guidance for Analysis ..................................................................................................... 59
5.7 References and Other Resources.................................................................................................... 60 Chapter 6. Interior and Exterior Light-Emitting Diodes ................................................................... 61
6.1 Description ..................................................................................................................................... 61 6.2 Application ..................................................................................................................................... 62
6.2.1 Internal Light-Emitting Diodes ....................................................................................... 62 6.2.2 Outdoor Light-Emitting Diode Applications .................................................................. 64
6.3 Real World Considerations ............................................................................................................ 66 6.3.1 Financial Incentives ........................................................................................................ 67
6.4 Project Results ............................................................................................................................... 67 6.5 Modeling Light-Emitting Diodes ................................................................................................... 69
6.5.1 Interior Light-Emitting Diodes ....................................................................................... 69 6.5.2 Exterior ........................................................................................................................... 69
6.6 Ensuring Performance .................................................................................................................... 69 6.6.2 Measurement and Verification ........................................................................................ 71 6.6.3 Recommended Monitoring Points ................................................................................... 71 6.6.4 Inexpensive, but Less Accurate, Approach ..................................................................... 71 6.6.5 More Complex and Expensive, but Accurate Approach ................................................. 72 6.6.6 Guidance for Analysis ..................................................................................................... 72 6.6.7 Best Practices for Addressing Operational Problems ..................................................... 73
6.7 References and Other Resources.................................................................................................... 73 Chapter 7. Variable Refrigerant Flow ................................................................................................. 75
7.1 Description ..................................................................................................................................... 75 7.2 Outdoor Unit (Condensing Unit) ................................................................................................... 75 7.3 Indoor Units (Fan Coils) ................................................................................................................ 76
7.3.1 Refrigerant ...................................................................................................................... 76 7.4 Heat Recovery Unit........................................................................................................................ 76 7.5 Energy Benefits .............................................................................................................................. 77 7.6 Nonenergy Benefits ....................................................................................................................... 78 7.7 Application ..................................................................................................................................... 78
7.7.1 Buildings With Diverse Heating and Cooling Loads ...................................................... 79 7.7.2 Building Retrofits With Limited Forced-Air-Based Retrofit Options ............................ 79 7.7.3 Buildings With Space Constraints .................................................................................. 79
7.8 Real-World Considerations ............................................................................................................ 79 7.9 Financial Incentives ....................................................................................................................... 80 7.10 Project Results ......................................................................................................................... 80
7.10.1 Alliance Center ............................................................................................................... 80

x
This report is available at no cost from the National Renewable Energy Laboratory (NREL) at www.nrel.gov/publications.
7.10.2 Multitenant Office ........................................................................................................... 81 7.11 Modeling Variable Refrigerant Flow Savings ......................................................................... 82
7.11.1 OpenStudio Guidance ..................................................................................................... 83 7.12 Ensuring Performance ............................................................................................................. 83
7.12.1 Installation ....................................................................................................................... 83 7.12.2 Commissioning ............................................................................................................... 83 7.12.3 Controls Programming .................................................................................................... 83 7.12.4 Operation ......................................................................................................................... 84 7.12.5 Occupant Behavior .......................................................................................................... 84
7.13 Measurement and Verification ................................................................................................ 84 7.13.1 Recommended Monitoring Points ................................................................................... 85 7.13.2 Guidance for Analysis ..................................................................................................... 85
7.14 References and Other Resources ............................................................................................. 86 Chapter 8. Kitchen Exhaust Hood Controls ...................................................................................... 88
8.1 Description ..................................................................................................................................... 88 8.2 Application ..................................................................................................................................... 88
8.2.1 Controlling Exhaust Hood Only ..................................................................................... 90 8.2.2 Controlling Exhaust Hood and Makeup Air ................................................................... 90
8.3 Real-World Considerations ............................................................................................................ 91 8.4 Code Requirements ........................................................................................................................ 92 8.5 Financial Incentives ....................................................................................................................... 92 8.6 Project Results ............................................................................................................................... 93 8.7 Modeling Kitchen Exhaust Hood Controls .................................................................................... 95 8.8 Ensuring Performance .................................................................................................................... 95
8.8.1 Installation ....................................................................................................................... 95 8.8.2 Commissioning ............................................................................................................... 95 8.8.3 Controls Programming .................................................................................................... 96 8.8.4 Operation ......................................................................................................................... 96 8.8.5 Occupant Behavior .......................................................................................................... 96
8.9 Measurement and Verification ....................................................................................................... 97 8.9.1 Recommended Monitoring Points ................................................................................... 97 8.9.2 Guidance for Analysis ..................................................................................................... 97 8.9.3 Best Practices for Addressing Operational Problems ..................................................... 98
8.10 References and Other Resources ............................................................................................. 98 Chapter 9. Evaporative Precooling and Condensing for Packaged Rooftop HVAC Units ......... 100
9.1 Description ................................................................................................................................... 100 9.2 Application ................................................................................................................................... 100
9.2.1 Technology Overview ................................................................................................... 100 9.2.2 Common Application: Packaged Rooftop Units ........................................................... 105
9.3 Real-World Considerations .......................................................................................................... 105 9.3.1 Climate and Water ........................................................................................................ 105 9.3.2 Utility Rates .................................................................................................................. 106 9.3.3 Equipment ..................................................................................................................... 106
9.4 Financial Incentives ..................................................................................................................... 107 9.5 Project Results ............................................................................................................................. 107 9.6 Modeling Evaporative Rooftop Savings ...................................................................................... 108
9.6.1 OpenStudio Guidance ................................................................................................... 108 9.6.2 Western Cooling Efficiency Center Model guidance ................................................... 108
9.7 Ensuring Performance .................................................................................................................. 108 9.7.1 Installation ..................................................................................................................... 108 9.7.2 Commissioning ............................................................................................................. 108

xi
This report is available at no cost from the National Renewable Energy Laboratory (NREL) at www.nrel.gov/publications.
9.7.3 Controls Programming .................................................................................................. 109 9.7.4 Operation ....................................................................................................................... 109
9.8 Measurement and Verification ..................................................................................................... 110 9.8.1 Recommended Monitoring Points ................................................................................. 110 9.8.2 Guidance and Analysis .................................................................................................. 110
9.9 Best Practices for Addressing Operational Problems .................................................................. 111 9.10 References and Other Resources ........................................................................................... 112
Chapter 10. High-Performance Refrigeration Cases ........................................................................ 113 10.1 Description ............................................................................................................................ 113 10.2 Components of High-Performance Refrigeration Cases ....................................................... 115
10.2.1 Anti-Sweat Heater Controls .......................................................................................... 115 10.2.2 Electronically Commutated Evaporator Fan Motors .................................................... 116 10.2.3 Light-Emitting Diodes .................................................................................................. 116 10.2.4 Doors or Night Curtains on Open Cases ....................................................................... 116
10.3 Real-World Considerations ................................................................................................... 117 10.3.1 Anti-Sweat Heater Control ............................................................................................ 117 10.3.2 Night Curtain and Permanent Doors ............................................................................. 117 10.3.3 Code Requirements ....................................................................................................... 118
10.4 Financial Incentives ............................................................................................................... 119 10.5 Project Results ....................................................................................................................... 120
10.5.1 Walmart Supercenter Retrofit ....................................................................................... 120 10.5.2 Lackland Air Force Base ............................................................................................... 120
10.6 Modeling High-Performance Refrigerated Display Cases .................................................... 121 10.6.1 OpenStudio Guidance ................................................................................................... 121
10.7 Ensuring Performance ........................................................................................................... 122 10.7.1 Installation ..................................................................................................................... 122
10.8 Commissioning ...................................................................................................................... 122 10.8.1 Controls Programming .................................................................................................. 123 10.8.2 Operation ....................................................................................................................... 124 10.8.3 Occupant Behavior ........................................................................................................ 124
10.9 Measurement and Verification .............................................................................................. 124 10.9.1 Recommended Monitoring Points ................................................................................. 124 10.9.2 Inexpensive, but Less Accurate, Approach ................................................................... 124 10.9.3 More Complex and Expensive, but Accurate Approach ............................................... 125 10.9.4 Guidance for Analysis ................................................................................................... 125
10.10 Best Practices for Addressing Operational Problems ............................................................ 126 10.11 References and Other Resources ........................................................................................... 127
Appendix A: Airflows, Water Flows, and Temperatures ..................................................................... 129 Appendix B: Detailed EnergyPlus Guidance ........................................................................................ 131

xii
This report is available at no cost from the National Renewable Energy Laboratory (NREL) at www.nrel.gov/publications.
List of Figures Figure 1. Infiltration is unconditioned air that enters the building from a variety of paths. ............. 13 Figure 2. Testing for air leaks with a smoke pencil ............................................................................... 15 Figure 3. Testing for air leaks with thermal imaging ............................................................................. 15 Figure 4. Applying weather stripping to a window ................................................................................ 16 Figure 5. Alliance Center .......................................................................................................................... 17 Figure 6. Fan pressure test using a blower door ................................................................................... 21 Figure 7. Airflow paths used in natural ventilation, including single-sided and cross-flow
ventilation ............................................................................................................................................ 27 Figure 8. Operable clerestory windows at the Lussier Community Education Center in Madison,
Wisconsin ............................................................................................................................................ 27 Figure 9. Operable windows cool the stairway at the Bullitt Center ................................................... 28 Figure 10. Passive ventilation design for Shy Brothers cow barn....................................................... 31 Figure 11. Efficient gearless hoist elevator with open stair versus conventional design ................ 39 Figure 12. Bullitt Center ............................................................................................................................ 42 Figure 13. Bullitt Center irresistible stairway ......................................................................................... 43 Figure 14. Smart outlets can monitor equipment power consumption and automatically turn
equipment off when not in use .......................................................................................................... 50 Figure 15. Energy dashboard provides building occupants with information on energy use ......... 52 Figure 16. Alliance Center in Denver, Colorado..................................................................................... 53 Figure 17. Temporary metering of a plug load device .......................................................................... 58 Figure 18. Exterior LED lamp ................................................................................................................... 61 Figure 19. LED-illuminated refrigerated display cases ......................................................................... 62 Figure 20. High bay LED in a warehouse ................................................................................................ 63 Figure 21. LEDs illuminate surface parking lot in Madison, Wisconsin .............................................. 65 Figure 22. VRF system .............................................................................................................................. 75 Figure 23. Two types of VRF indoor units .............................................................................................. 76 Figure 24. Heat recovery unit ................................................................................................................... 77 Figure 25. Alliance Center ........................................................................................................................ 81 Figure 26. University Crossing ................................................................................................................ 82 Figure 27. Typical airflow savings potential for commercial kitchen exhaust hood ......................... 88 Figure 28. Controlling exhaust and make-up air fan energy use ......................................................... 91 Figure 29. Fan energy savings with respect to fan power and hours of operation ........................... 91 Figure 30. Crowne Plaza Hotel ................................................................................................................. 94 Figure 31. Munters RTU with Evaporcool evaporative condensing installed ................................... 101 Figure 32. RTU with DualCool hybrid system installed, which includes evaporative precooling
and evaporative condensing ........................................................................................................... 102 Figure 33. Psychrometric chart plotting a hybrid evaporative cooling process .............................. 103 Figure 34. Major components and process flows in a hybrid evaporative precooled DX RTU ...... 104 Figure 35. Direct evaporative media with algae buildup ..................................................................... 106 Figure 36. Electricity consumption by end use in a typical grocery store ....................................... 113 Figure 37. Components in high-performance display cases .............................................................. 115 Figure 38. Night curtains keep cool air in the case. ............................................................................ 117 Figure 39. Night curtains cover a refrigerated produce case ............................................................. 118

xiii
This report is available at no cost from the National Renewable Energy Laboratory (NREL) at www.nrel.gov/publications.
List of Tables Table 1. Infiltration Reduction Typical Annual Energy and Cost Savings .......................................... 14 Table 2. Infiltration Reduction for the Alliance Center Renovation ..................................................... 18 Table 3. Natural Ventilation Potential Annual Energy and Cost Savings in a Temperate Climate ... 26 Table 4. Ventilation and Cooling for the Kuykendal Hall Retrofit ........................................................ 31 Table 5. Passive Ventilation for Shy Brothers Cow Barn New Construction ..................................... 32 Table 6. Natural Ventilation Implementation Team Members and Responsibilities........................... 33 Table 7. Efficient Elevators Potential Annual Energy and Cost Savings ............................................ 37 Table 8. Elevator Modes and Conservation Options ............................................................................. 38 Table 9. Efficient Elevator in the Bullitt Center ...................................................................................... 42 Table 10. Estimated Annual Savings From Plug Load Control Strategies ......................................... 49 Table 11. Plug Load Reduction in the Alliance Center Renovation ..................................................... 54 Table 12. Typical Annual Energy and Cost Savings for Internal LED Applications ........................... 62 Table 13. Typical Annual Energy and Cost Savings for External LED Applications ......................... 65 Table 14. LED Fixtures for the Centennial, Colorado, Walmart ............................................................ 68 Table 15. Haslet/Fort Worth Walmart Supercenter New Construction Parking Lot LEDs ................. 68 Table 16. VRF Typical Annual Energy and Cost Savings ..................................................................... 78 Table 17. VRF System in the Alliance Center Renovation .................................................................... 81 Table 18. University Crossing Office Building VRF System ................................................................. 82 Table 19. Kitchen Exhaust Hood Controls Typical Annual Energy and Cost Savings With
Respect to Fan Power ........................................................................................................................ 89 Table 20. Kitchen Hood Exhaust Controls at Lackland Air Force Base Commissary ....................... 93 Table 21. Crowne Plaza Hotel Renovation .............................................................................................. 94 Table 22. Possible Performance Values Expected for an Evaporative Precooling System ............ 105 Table 23. Evaporative Cooling for Centennial Walmart Retrofit ........................................................ 107 Table 24. High-Performance Refrigeration Cases Typical Annual Energy and Cost Savings ........ 114 Table 25. Refrigeration System for Centennial Walmart Supercenter ............................................... 120 Table 26. Case Doors for Lackland Air Force Base Commissary Renovation ................................. 121 Table 27. Typical Inputs for Elevators With Hydraulic and Traction Motors .................................... 137 Table 28. Typical Lighting Power Densities for Big-Box Stores and Warehouses .......................... 141 Table 29. Typical Breakdown of Input Power Used To Light and Heat a Space Depending on
Light Type .......................................................................................................................................... 142 Table 30. Total Cooling Capacity Function of Temperature Curves (x = WB, y = DB) ..................... 150 Table 31. Total Cooling Capacity Function of Flow Fraction Curve .................................................. 150 Table 32. Energy Input Ratio Modifier Function of Temperature Curve (x = WB, y = DB) ............... 151 Table 33. Energy Input Ratio Modifier Function of Flow Fraction Curve .......................................... 151 Table 34. Typical Cooling Capacity Based on Case Configuration ................................................... 153 Table 35. Operating Fan Power per Unit Length Inputs ...................................................................... 154 Table 36. Installed Case Lighting Power per Unit Length Inputs ....................................................... 154 Table 37. Typical Freezer and Cooler Anti-Sweat Heater Power per Door (Including Frame Heat) 155 Table 38. Typical Case Credit Fraction Values for Open and Closed Cases .................................... 155

1
This report is available at no cost from the National Renewable Energy Laboratory (NREL) at www.nrel.gov/publications.
Chapter 1. The Commercial Building Partnerships Overview
1.1 Introduction In 2009, the U.S. Department of Energy (DOE) launched the Commercial Building Partnerships (CBP) to scale up the implementation of energy efficiency improvements in commercial buildings. The program paired building owners and operators with technical experts from the DOE national laboratories and the private sector to explore energy efficiency measures (EEMs) for retrofit and new construction projects. Many of the building partners involved with the program—Walmart, Best Buy, Target, Kohl’s, and Whole Foods Market, among others—manage large portfolios of buildings that present an opportunity to make a visible and significant impact on the adoption of energy efficiency strategies and technologies. These portfolios include almost 4 billion ft2 of space managed by companies that are dominant in their industries and that have committed to reproducing the energy efficiency strategies and technologies from their CBP projects throughout their building portfolios. At the same time, by pursuing and documenting robust, cost-effective strategies, CBP aimed to accelerate improved energy efficiency at the CBP companies and in the broader commercial sector.
CBP projects went through a low-energy building design process (Torcellini, Hayter, and Judkoff, 1999; Hirsch et al., 2014) developed at the National Renewable Energy Laboratory (NREL). The goal was to achieve energy savings beyond the requirements of ASHRAE Standard 90.1 (the 2004 version of the standard was used for a first wave of CBP projects; the 2007 version was used in a later group of projects). New construction projects were designed to consume at least 50% less energy than 90.1 and retrofit projects 30% less than either 90.1 or their pre-retrofit baselines.
Low-energy building design is a multistep, integrated approach that uses building energy simulation throughout the design and construction processes. Design teams using this approach establish energy efficiency goals, identify cost-effective strategies to reach these goals, and ensure that the building systems function as designed. NREL, Pacific Northwest National Laboratory, Lawrence Berkeley National Laboratory, and private sector consultants worked with 42 CBP participants on 54 new construction and retrofit projects. The buildings represented a microcosm of commercial building types—from big-box retail stores to multitenant office buildings; from supermarkets to university classrooms; from a creamery to a warehouse. Some projects did not complete the process (from design to construction to postoccupancy evaluation), partly because the construction industry was disrupted by the 2008–2009 economic recession. However, a wealth of information resulted from the intense focus to reduce energy use in these commercial building projects. This information includes details about the EEMs and strategies identified as solutions to reach the project energy target, lessons learned from modeling EEMs and building interactions, and real-world considerations for reaching energy reduction targets through design, construction, and postoccupancy phases.
NREL contracted with the Energy Center of Wisconsin to review the CBP projects and identify and compile comprehensive details and best practices for 10 EEMs. The resulting compilation is presented in nine chapters (interior and exterior light-emitting diode [LED] applications are combined in one chapter), each of which includes:

2
This report is available at no cost from the National Renewable Energy Laboratory (NREL) at www.nrel.gov/publications.
• A general description of the EEM
• Applications for the EEM
• Estimated annual savings
• Real-world considerations
• Potential financial incentives
• Brief case study of a CBP project (including lessons learned)
• Recommendations for ensuring performance
• Guidance for measurement and verification (M&V)
• Guidance for modeling the EEM
• Other sources and references.
The objective of each chapter is to provide the information that building owners and developers (and their design consultants) need about these technologies when retrofitting their existing buildings or developing new buildings. Each EEM described is market proven but is not yet standard practice. The CBP projects provided living laboratories for these EEMs, and the vignettes draw on lessons learned to provide guidance and best practices for the next generation of projects.
1.2 Energy Efficiency Measures To achieve the high, whole-building, energy savings targets established for CBP projects, design teams explored EEMs in all building systems:
• Envelope
• Lighting—both interior and exterior
• Heating, ventilation, and air conditioning (HVAC) systems
• Internal plug and process loads
• Building configuration
• Refrigeration.
The Energy Center of Wisconsin’s challenges were to (1) distill the information generated from all the CBP projects; and (2) identify EEMs to spotlight within the various building systems and diverse commercial building types. Energy Center of Wisconsin staff reviewed documents and drawings submitted for each CBP project, cataloged the EEMs that were modeled, and categorized them by the building system energy use they were intended to address. Questions asked in determining which EEMs to spotlight included:
• Did the EEM have significant savings potential?
• Is the EEM already standard practice?
3
This report is available at no cost from the National Renewable Energy Laboratory (NREL) at www.nrel.gov/publications.
• How far through the full process (design, construction, and postoccupancy evaluation) was the EEM carried?
• Are modeling or analysis data available for the EEM?
• Does the EEM need more exposure to become acceptable in the marketplace?
The final list of EEMs to spotlight included the following technologies and strategies:
• Infiltration reduction
• Natural ventilation
• Efficient elevators
• Office plug load reduction
• LED fixtures (interior and exterior)
• Variable refrigerant flow (VRF) systems
• Kitchen exhaust hood controls
• Evaporative precooling rooftop units (RTUs)
• High-performance refrigeration cases.
The CBP projects reviewed for background information on these EEMs included big-box retail stores, supermarkets, multitenant office buildings, a dairy farm, a warehouse, and an educational building.
1.3 Bundling Energy Efficiency Measures Standard practice in commercial building design and retrofit projects is to select individual EEMs based on an economic performance that deliver a return on the investment within 2–5 years. Although the EEMs spotlighted are presented individually, the ambitious energy savings targets in the CBP program encouraged the design teams to take an integrated approach and look at the business case for EEMs as a bundle. This approach can make the economics work for an entire package, including EEMs that would not be economically feasible if analyzed individually, and increase energy savings.
First, understanding the impact of EEM interactions on the energy savings potential from each EEM (and the resulting total savings) is important. Many EEMs, such as improving heating efficiency and adding insulation, cause other EEMs to save less energy; for example, as the level of insulation improves, an efficient boiler saves less energy than it otherwise would. Yet together, the entire building still uses less energy than if only one EEM were implemented. Some EEMs can have the opposite effect, such as using exhaust energy recovery to reduce HVAC size and allow a building owner to afford more efficient HVAC equipment (saving additional energy). Considering how an EEM interacts with other building components and corresponding design decisions is also important. For example, glazing properties influence the view and level of daylight to the interior, which directly affect the occupants and influence the decisions the interior designer and electrical engineer or lighting designer make.

4
This report is available at no cost from the National Renewable Energy Laboratory (NREL) at www.nrel.gov/publications.
The integrated design process was an important component of the CBP program. The project teams used a low-energy building design process developed by the national laboratories, and all disciplines were involved throughout all phases of design and construction. This type of integration identifies synergies (see Section 1.3.1 through Section 1.3.5), mitigates interferences, and helps to ensure building performance because the parties that construct, commission, and operate the building can participate in the earlier stages of design. For example, the M&V consultant who was involved at the end of the project to measure savings for CBP was also invited to key design discussions from the earliest stages, even predesign in some cases.
Many EEMs explored in these CBP projects interacted with other building components (and other EEMs). The integrated design process was extremely valuable in these cases and identified circumstances in which EEM bundles could offer greater savings.
A few examples of these interactions follow.
1.3.1 Reduce the Size of HVAC Equipment by Reducing Loads Many EEMs reduce the internal loads in a building: LED fixtures, efficient elevators, and office plug load reduction all reduce the amount of heat emitted in a building. This increases the need for heating in the heating season; however, the much bigger reduction in cooling during the cooling season leads to net energy savings in most commercial buildings. These savings are climate dependent. One study in the Midwest showed a savings of 1.13 times the savings from reduced lighting and equipment usage alone (Hackel and Schuetter 2013). In cooling-dominant climates such as the southern United States, these savings are generally even higher.
1.3.2 Save HVAC Energy With Efficient Refrigeration A supermarket demonstrates complex interactions between refrigeration system components and the HVAC system. These interactions are intensified by the fact that many refrigerated display cases are left open to the ambient conditions of the space (in fact, placing doors on refrigerated cases has perhaps the biggest impact on HVAC). CBP project teams accounted for this interaction by using whole-building energy modeling to include HVAC energy when analyzing refrigeration system design. In general, EEMs that significantly reduce refrigerated case energy usage tend to increase HVAC energy needed for cooling (and to a lesser extent dehumidification) and decrease energy for heating. In colder climates with significant economizer capability, the negative impact on cooling and dehumidification was substantially lower. Space cooling with HVAC equipment is always more efficient because it needs to cool air only to meet the sales floor set point rather than the low temperatures required for food preservation. In any case, when high-performance cases are coupled with cooling EEMs, they tend to increase the savings from those EEMs. When such cases are coupled with heating EEMs, they tend to decrease the savings from those EEMs, even though the net effect is beneficial.
1.3.3 Reduce Space Requirements by Choosing Efficient Systems Though some efficient equipment (such as energy recovery) requires additional space, lower energy use and smaller size are sometimes linked in some building components. This can either free more space for rent in a leased building, or decrease construction costs because the building can be constructed smaller. Three of the 10 EEMs highlighted in the CBP vignettes decrease system sizes in this way. VRF systems trade large duct runs for refrigerant lines that are a couple

5
This report is available at no cost from the National Renewable Energy Laboratory (NREL) at www.nrel.gov/publications.
of inches in diameter. Efficient traction elevators can eliminate the space needed for an elevator machine room, as well as construction costs for a hydraulic pit. Finally, strategies aimed at reducing plug loads in offices usually also allow those office spaces to shrink: Sharing more printers and kitchenettes, using flat screens, and eliminating workstation-based peripheral equipment are just a few examples.
Building space comes with significant costs: rentable square footage can yield $10–$50/ft2/year, and reducing building size can save hundreds of dollars in upfront cost per square foot. These cost savings should be included in life cycle costing exercises early in the design process, so the owner can understand the full financial impact of choosing these efficient systems. Furthermore, the negative cost impact needs to be accounted for if, at some point later in the design process, the team attempts to remove the EEMs that helped to reduce the building size.
1.3.4 Obtain Flexibility in Control by Choosing Light-Emitting Diodes When a design team chooses to implement LEDs in an interior setting, implementing more aggressive lighting controls becomes significantly easier. LEDs are inherently dimmable and quick starting, in stark contrast to high-intensity discharge (HID) or high-bay fluorescent lighting. CBP projects that installed interior LED fixtures were able to implement more control over their lighting, saving additional energy (Scheib et al. 2014).
Adding controls can dramatically increase the savings from just installing efficient fixtures. In a metastudy of these types of controls Williams et al. (2012) demonstrated approximately 28% additional lighting savings when daylighting-related dimming control was added to big-box or warehouse retail stores. The same study showed additional savings of 35%–60% for tuning the light levels (either locally or across the entire facility) after installation, which is generally easy with a dimmable system. Occupancy control tends to be easier to implement with the rapid on/off operation of LEDs; savings vary significantly depending on application.
1.3.5 Improve Natural Ventilation by Reducing Infiltration Taking advantage of natural ventilation by installing operable windows in any commercial building can be a challenging endeavor. In this design scenario, configuring the building so that air flows in the desired path, and at the desired rate, can be difficult. Several CBP project teams explored this approach. Most of these projects also focused on having a tightly sealed envelope to reduce infiltration. These goals may at first seem contradictory—having open windows while trying to seal the building—but the two EEMs work together in multiple ways. First, a well-sealed envelope makes it easier to drive airflow where it is wanted, and to avoid having air flowing into or out of construction assemblies where it is not wanted. In tall buildings that experience a buoyancy-driven stack effect (or that use atria or chimneys to drive stack effect) this reduction in unwanted airflows is especially important. Also, all naturally ventilated buildings operate at times with windows closed. In this scenario, well-sealed walls and roofs and selected operable windows that close and seal tightly are important. The amount of air leakage when windows are closed can be as important as the thermal properties of the glazing and frame.

6
This report is available at no cost from the National Renewable Energy Laboratory (NREL) at www.nrel.gov/publications.
1.4 Ensuring High Performance The process of meeting the high energy savings targets established by CBP does not end once the building has been constructed or renovated. Commissioning and M&V are necessary to ensure the building performs as designed.
1.4.1 Commissioning The goal of commissioning is to meet the Owner’s Project Requirements, ensuring that building performance meets the design intent. This is most readily achieved by starting commissioning early in design and continuing it through into building occupancy. This ongoing commissioning facilitates integrated design by emphasizing that the owner, design team, contractor, and commissioning agent have important roles to play. The best practice for the commissioning agent is to be an independent third party and be a commissioning authority (CxA). The commissioning process follows these steps (ASHRAE 2013):
1.4.2 Predesign Phase 1. Conduct a kickoff meeting (all).
2. Develop Owner’s Project Requirements (all).
3. Develop commissioning process’ scope and budget (commissioning agent).
4. Develop commissioning plan—define roles and responsibilities, communication processes, checklists, training, and issues or nonconformance logs (commissioning agent).
1.4.3 Design Phase 1. Develop Basis of Design document (all).
2. Conduct technical peer reviews—during Schematic Design, Design Development, and Construction Document phases (design team and commissioning agent).
3. Update commissioning plan (commissioning agent).
4. Develop construction checklists (commissioning agent).
5. Write commissioning agent reports—at the end of Schematic Design, Design Development, and Construction Document phases (commissioning agent).
6. Develop a systems manual—includes Owner’s Project Requirements, Basis of Design, operations and maintenance (O&M) manuals, training manuals, reports, and other key documents (commissioning agent).
1.4.4 Preconstruction Phase 1. Prebid conference—review commissioning agent’s specifications (design team and
commissioning agent).
2. Evaluate the enclosure—review bids (design team and commissioning agent).
1.4.5 Construction Phase 1. Update documents as needed (commissioning agent).
2. Review submittals—5%–10% sampling minimum (commissioning agent and contractor).

7
This report is available at no cost from the National Renewable Energy Laboratory (NREL) at www.nrel.gov/publications.
3. Verify completion of construction checklists (commissioning agent and contractor).
4. Performance testing (commissioning agent and contractor).
5. Preconstruction and preinstallation meetings (commissioning agent and contractor).
6. Site visits—periodic documentation of compliance, three to five minimum (architect, commissioning agent, and contractor).
7. Verify training (commissioning agent and contractor).
8. Close out documents—update documents as needed (commissioning agent).
1.4.6 Occupancy and Operation Phase 1. Provide ongoing guidance, follow-up, and warranty service (commissioning agent).
2. Conduct an occupancy and operations planning meeting—commissioning agent attends a meeting with property management (commissioning agent).
3. Conduct a warranty period walk-through—10 months after substantial completion (commissioning agent).
4. Write the final commissioning report (commissioning agent).
1.5 Measurement and Verification M&V is an important step in ensuring that EEMs have been installed and are operating correctly so that they provide expected energy savings. This is especially true for many of the innovative EEMs considered by CBP project teams. M&V is most effective when it is integrated into the broader commissioning process, including ongoing commissioning. The goals of M&V are to ensure that energy performance and occupant comfort expectations set during the design process are met, and to provide feedback to help diagnose and address issues when savings or comfort expectations are not met. This process provides owners and facility managers with information about their facility operation, as well as specific actions to optimize performance. Finally, M&V may be required as part of performance-based contracts that finance EEMs using a part of the cash flow provided by energy savings. This guide provides an overview of key steps to developing an effective M&V plan.
References provide an overview of techniques for measuring and verifying results of EEMs at a whole-building and a building component level, at varying levels of accuracy and cost. The International Performance Measurement and Verification Protocol addresses M&V at a high level (DOE 2002). ASHRAE Guideline 14 goes into more technical depth and provides further application guidance (ASHRAE 2002), and also provides information regarding cost and uncertainty of different measurement techniques. It is supplemented by ASHRAE’s Performance Measurement Protocols for Commercial Buildings (ASHRAE 2012). The Federal Energy Management Program’s Metering Best Practices is specific to federal agency performance contracts (Sullivan et al. 2011).
In general, when EEMs can be isolated, energy savings are verified by measuring energy consumption, and by using those measurements to estimate the difference in energy use with and without an EEM. M&V can be performed through a variety of techniques; however, each method involves the same general steps:

8
This report is available at no cost from the National Renewable Energy Laboratory (NREL) at www.nrel.gov/publications.
1. Prepare an M&V plan.
2. Select an option, which is discussed in more depth below.
3. Design, install, and test any instrumentation equipment needed for collecting data.
4. Measure energy consumption before the EEM is implemented.
5. Measure energy consumption after the EEM is implemented.
6. Normalize the before and after data to the same set of operating conditions, such as to the same weather conditions or occupancy patterns.
7. Calculate the energy savings as the difference between the normalized before and after data.
8. Report energy savings and any discrepancies, along with potential corrective actions.
1.5.1 Roles The M&V effort, like commissioning, is most successful when all team members work closely together. Each has the following roles and responsibilities:
• Design team—ensure that equipment required by the M&V plan is included in the design.
• Contractor—install and calibrate measurement instruments.
• Controls engineer—ensure that instruments are connected to the building automation system (BAS) and are operating.
• Commissioning agent—verify the installation and functionality of sensors and verify calibration.
• Energy analyst—compile and analyze data to verify performance.
• O&M staff—support the M&V effort by collecting data and reporting any issues.
An effective M&V system is not a trivial component to design and install in a building. According to one Bullitt Center designer: “Some people look at submetering as a single item to simply procure, but it’s really more of a full system that needs to be fully thought through—who is going to use it, how are they going to use it… It needs to be developed and designed.” When developing an M&V system, remember that generating a lot of data may not be useful if the data cannot be analyzed to provide useful feedback on building performance.
1.5.2 Detailed Methodology Specific methodology for the M&V plan must be selected based on the building scenario and measure type, as well as the budget available to perform the verification. The three primary methodologies are (ASHRAE 2002):
1. Whole-building metering:
A. Uses a main building-wide meter, often involving monthly utility bill data
B. Low cost and low complexity, but cannot diagnose an individual system’s energy consumption.
9
This report is available at no cost from the National Renewable Energy Laboratory (NREL) at www.nrel.gov/publications.
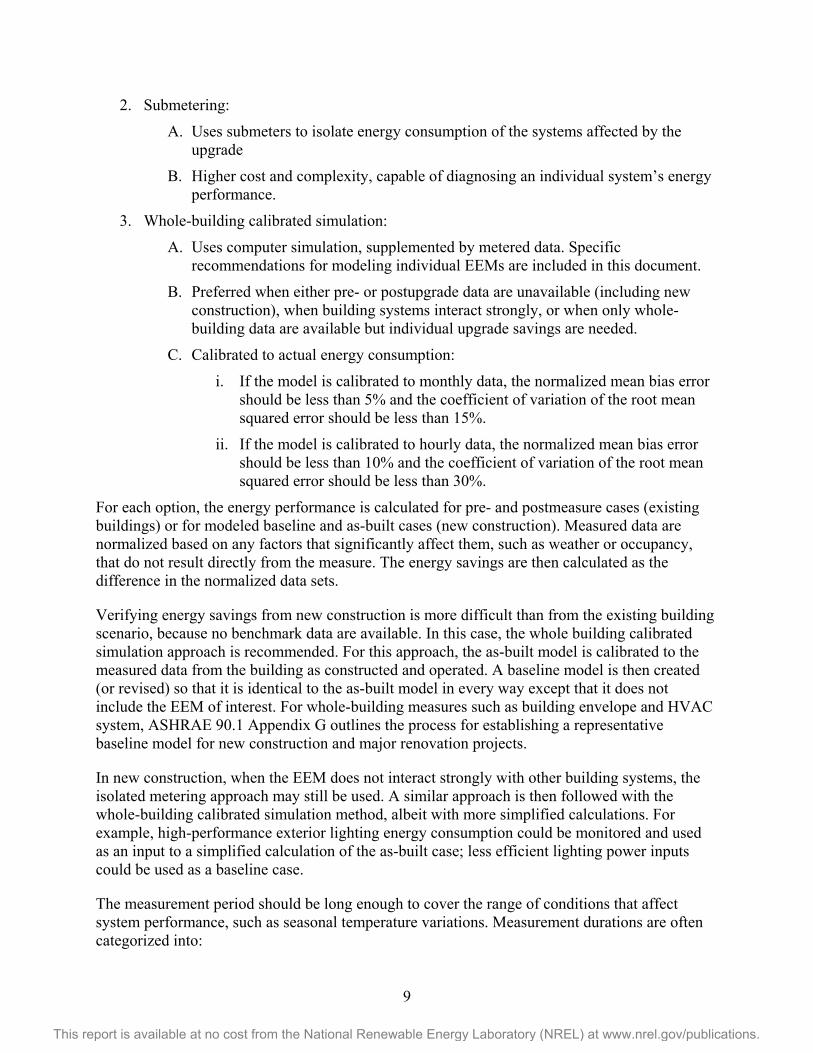
2. Submetering:
A. Uses submeters to isolate energy consumption of the systems affected by the upgrade
B. Higher cost and complexity, capable of diagnosing an individual system’s energy performance.
3. Whole-building calibrated simulation:
A. Uses computer simulation, supplemented by metered data. Specific recommendations for modeling individual EEMs are included in this document.
B. Preferred when either pre- or postupgrade data are unavailable (including new construction), when building systems interact strongly, or when only whole-building data are available but individual upgrade savings are needed.
C. Calibrated to actual energy consumption:
i. If the model is calibrated to monthly data, the normalized mean bias error should be less than 5% and the coefficient of variation of the root mean squared error should be less than 15%.
ii. If the model is calibrated to hourly data, the normalized mean bias error should be less than 10% and the coefficient of variation of the root mean squared error should be less than 30%.
For each option, the energy performance is calculated for pre- and postmeasure cases (existing buildings) or for modeled baseline and as-built cases (new construction). Measured data are normalized based on any factors that significantly affect them, such as weather or occupancy, that do not result directly from the measure. The energy savings are then calculated as the difference in the normalized data sets.
Verifying energy savings from new construction is more difficult than from the existing building scenario, because no benchmark data are available. In this case, the whole building calibrated simulation approach is recommended. For this approach, the as-built model is calibrated to the measured data from the building as constructed and operated. A baseline model is then created (or revised) so that it is identical to the as-built model in every way except that it does not include the EEM of interest. For whole-building measures such as building envelope and HVAC system, ASHRAE 90.1 Appendix G outlines the process for establishing a representative baseline model for new construction and major renovation projects.
In new construction, when the EEM does not interact strongly with other building systems, the isolated metering approach may still be used. A similar approach is then followed with the whole-building calibrated simulation method, albeit with more simplified calculations. For example, high-performance exterior lighting energy consumption could be monitored and used as an input to a simplified calculation of the as-built case; less efficient lighting power inputs could be used as a baseline case.
The measurement period should be long enough to cover the range of conditions that affect system performance, such as seasonal temperature variations. Measurement durations are often categorized into:
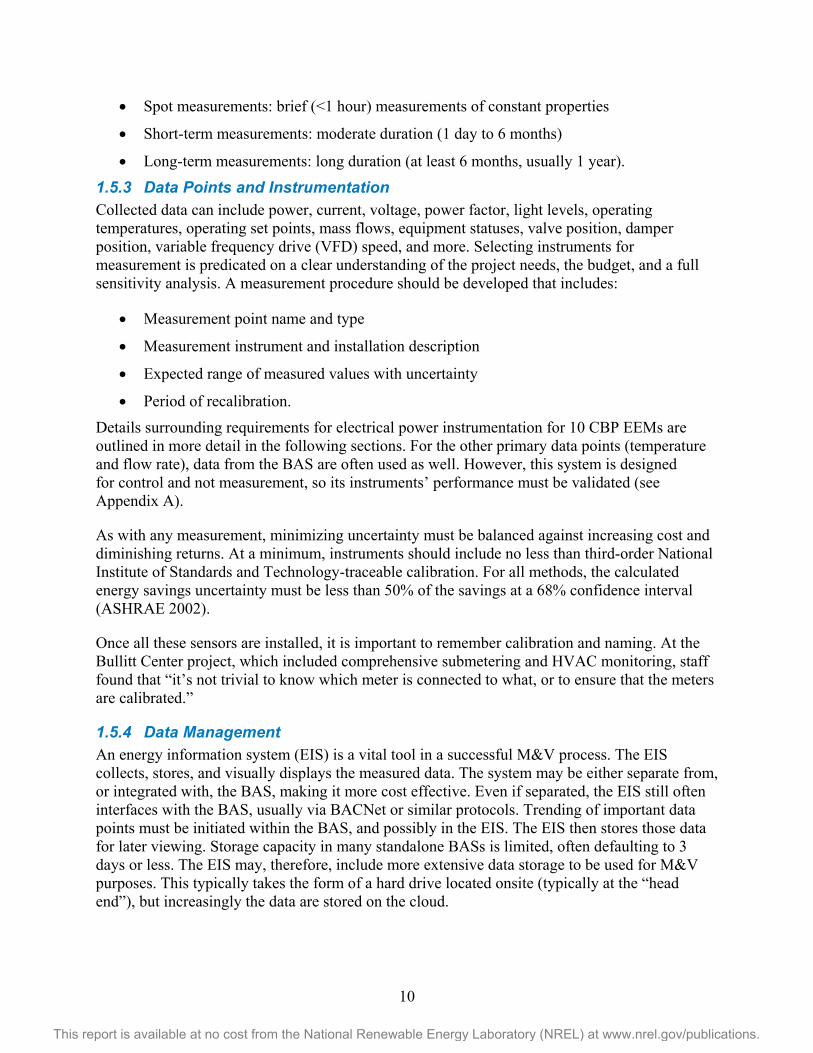
10
This report is available at no cost from the National Renewable Energy Laboratory (NREL) at www.nrel.gov/publications.
• Spot measurements: brief (<1 hour) measurements of constant properties
• Short-term measurements: moderate duration (1 day to 6 months)
• Long-term measurements: long duration (at least 6 months, usually 1 year).
1.5.3 Data Points and Instrumentation Collected data can include power, current, voltage, power factor, light levels, operating temperatures, operating set points, mass flows, equipment statuses, valve position, damper position, variable frequency drive (VFD) speed, and more. Selecting instruments for measurement is predicated on a clear understanding of the project needs, the budget, and a full sensitivity analysis. A measurement procedure should be developed that includes:
• Measurement point name and type
• Measurement instrument and installation description
• Expected range of measured values with uncertainty
• Period of recalibration.
Details surrounding requirements for electrical power instrumentation for 10 CBP EEMs are outlined in more detail in the following sections. For the other primary data points (temperature and flow rate), data from the BAS are often used as well. However, this system is designed for control and not measurement, so its instruments’ performance must be validated (see Appendix A).
As with any measurement, minimizing uncertainty must be balanced against increasing cost and diminishing returns. At a minimum, instruments should include no less than third-order National Institute of Standards and Technology-traceable calibration. For all methods, the calculated energy savings uncertainty must be less than 50% of the savings at a 68% confidence interval (ASHRAE 2002).
Once all these sensors are installed, it is important to remember calibration and naming. At the Bullitt Center project, which included comprehensive submetering and HVAC monitoring, staff found that “it’s not trivial to know which meter is connected to what, or to ensure that the meters are calibrated.”
1.5.4 Data Management An energy information system (EIS) is a vital tool in a successful M&V process. The EIS collects, stores, and visually displays the measured data. The system may be either separate from, or integrated with, the BAS, making it more cost effective. Even if separated, the EIS still often interfaces with the BAS, usually via BACNet or similar protocols. Trending of important data points must be initiated within the BAS, and possibly in the EIS. The EIS then stores those data for later viewing. Storage capacity in many standalone BASs is limited, often defaulting to 3 days or less. The EIS may, therefore, include more extensive data storage to be used for M&V purposes. This typically takes the form of a hard drive located onsite (typically at the “head end”), but increasingly the data are stored on the cloud.

11
This report is available at no cost from the National Renewable Energy Laboratory (NREL) at www.nrel.gov/publications.
In any case, a user interface is required to view the data. This software can be integrated with the BAS, but many of these interfaces are not designed for effective energy management and trending. A good EIS should, therefore, include a user interface specifically designed for visualizing and analyzing data, in an easy-to-use way. It should allow for raw data download, customized reports, and easy time scaling. The required level of automated intelligence within the EIS depends on the skill of the people looking at the data:
• Analytical depth for more technically sophisticated personnel
• Simple summary plots for less sophisticated personnel
• Fault detection and diagnostic plots tailored to the levels of sophistication desired.
For more sophisticated visual and analytical functionality, more software may be added. In this configuration, an EIS could provide storage, compilation, and categorization; the additional interface would provide analysis and fault detection.
Consistent, descriptive naming conventions and clear mapping of measurement points are important throughout the entire process from predesign to postoccupancy, and from the meter to the EIS. This minimizes confusion about what the data points represent.
Remote (Internet) access is also important for EIS users. However, public access systems, such as a dashboard with impressive aesthetic qualities—though helpful for education and outreach—are not necessary for the M&V process, because they are typically not designed for analysis and data visualization. The EIS interface can also be made available to provide feedback to building occupants, but this approach should be designed with an understanding of the limitations of staff to understand what the interface contains.
Throughout this process, clear and concise summaries and visual displays that are meaningful to stakeholders are critical. Without them, the M&V effort can fall short, just as it is nearing its completion.
Portraits of the nine EEMs featured in this report follow below; Appendix B describes the details of their energy modeling.
1.6 References and Other Resources ASHRAE (2013). ANSI/ASHRAE/IES Standard 202-2013 – Commissioning Process for Buildings and Systems. Atlanta, GA: American Society of Heating, Refrigerating and Air-Conditioning Engineers.
ASHRAE (2002). ASHRAE Guideline 14: Measurement of Energy and Demand Savings. American Society of Heating, Refrigerating and Air-Conditioning Engineers, 2002. Accessed March 2015: https://gaia.lbl.gov/people/ryin/public/Ashrae_guideline14-2002_Measurement%20of%20Energy%20and%20Demand%20Saving%20.pdf.
ASHRAE (2012). Performance Measurement Protocols for Commercial Buildings: Best Practices Guide. Atlanta, GA: American Society of Heating, Refrigerating and Air-Conditioning Engineers.

12
This report is available at no cost from the National Renewable Energy Laboratory (NREL) at www.nrel.gov/publications.
Hackel, S.; Schuetter, S. (2013). Commissioning for Optimal Savings from Daylight Controls. Energy Center of Wisconsin report 264-1. Madison, WI: Energy Center of Wisconsin. Accessed March 2015: www.ecw.org/mndaylighting.
Hirsch, A.; Deru, M.; Langner, R.; et al. (2014). Results and Lessons Learned From the DOE Commercial Building Partnerships. Golden, CO: National Renewable Laboratory.
IPMVP (2002).International Performance Measurement and Verification Protocol: Concepts and Options for Determining Energy and Water Savings. Volume I. Work performed by International Performance Management & Verification Protocol Committee. Washington, DC: U.S. Department of Energy. Accessed March 2015: http://www.nrel.gov/docs/fy02osti/31505.pdf.
Scheib, J.; McIntyre, M.; Hirsch, A. (2014). A Retail Lighting Guide: Six Steps to Energy Savings. Golden, CO: National Renewable Energy Laboratory.
Sullivan, G.P.; Hunt, W.D.; Pugh, R.; Sandusky, W.F.; Koehler, T.M.; Boyd, B.K. (2011). Metering Best Practices: A Guide to Achieving Utility Resource Efficiency. Washington, D.C.: U.S. Department of Energy. Accessed March 2015: http://www1.eere.energy.gov/femp/pdfs/mbpg.pdf.
Torcellini, P.; Hayter, S.; Judkoff, R. (1999). “Low-energy Building Design – The Process and a Case Study.” ASHRAE Transactions 105 (2): 802-810.
Williams, A.; Atkinson, B.; Garbesi, K.; Page, E.; Rubinstein, F. (2012). “Lighting Controls in Commercial Buildings.” The Journal of the Illuminating Engineering Society of North America (8:3), 161–180.

13
This report is available at no cost from the National Renewable Energy Laboratory (NREL) at www.nrel.gov/publications.
Chapter 2. Infiltration Reduction 2.1 Description A building enclosure, including roof, walls, and windows, is designed to protect occupants from the elements: hot and cold, rain and snow, sunlight and wind. Put another way, the building enclosure keeps the outside out, providing comfortable spaces to live and work. Infiltration is the uncontrolled movement of unconditioned air through a building enclosure.
Figure 1 shows the infiltration process through a building envelope. Infiltration increases the heating and cooling energy requirements of commercial buildings, and degrades occupant comfort.
Figure 1. Infiltration is unconditioned air that enters the building from a variety of paths.
(Courtesy Jason Sippel, Energy Center of Wisconsin)
Several research studies have measured infiltration rates of new and old commercial buildings (Emmerich and Persily 2005), and reported high levels of infiltration in all vintages, climate zones, and building types. New and existing commercial buildings can be improved significantly by reducing excess infiltration rates.
2.2 Strategy Infiltration reduction is applicable to new and existing commercial buildings across all building types. The potential energy savings for infiltration reduction vary based on building type, climate, and HVAC system. Table 1 provides two examples and associated savings; the examples illustrate the potential range of savings, but project-specific circumstances could lead to savings outside this range. These results are climate dependent.
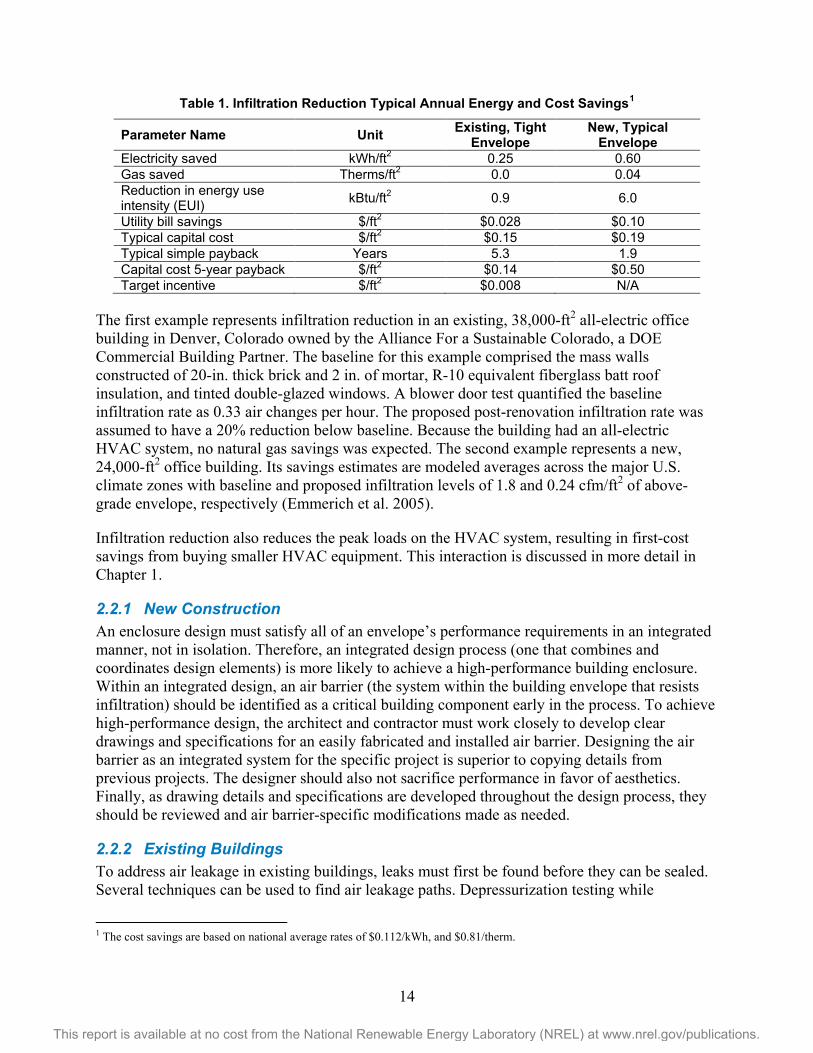
14
This report is available at no cost from the National Renewable Energy Laboratory (NREL) at www.nrel.gov/publications.
Table 1. Infiltration Reduction Typical Annual Energy and Cost Savings1
Parameter Name Unit Existing, Tight Envelope
New, Typical Envelope
Electricity saved kWh/ft2 0.25 0.60 Gas saved Therms/ft2 0.0 0.04 Reduction in energy use intensity (EUI) kBtu/ft2 0.9 6.0
Utility bill savings $/ft2 $0.028 $0.10 Typical capital cost $/ft2 $0.15 $0.19 Typical simple payback Years 5.3 1.9 Capital cost 5-year payback $/ft2 $0.14 $0.50 Target incentive $/ft2 $0.008 N/A
The first example represents infiltration reduction in an existing, 38,000-ft2 all-electric office building in Denver, Colorado owned by the Alliance For a Sustainable Colorado, a DOE Commercial Building Partner. The baseline for this example comprised the mass walls constructed of 20-in. thick brick and 2 in. of mortar, R-10 equivalent fiberglass batt roof insulation, and tinted double-glazed windows. A blower door test quantified the baseline infiltration rate as 0.33 air changes per hour. The proposed post-renovation infiltration rate was assumed to have a 20% reduction below baseline. Because the building had an all-electric HVAC system, no natural gas savings was expected. The second example represents a new, 24,000-ft2 office building. Its savings estimates are modeled averages across the major U.S. climate zones with baseline and proposed infiltration levels of 1.8 and 0.24 cfm/ft2 of above-grade envelope, respectively (Emmerich et al. 2005).
Infiltration reduction also reduces the peak loads on the HVAC system, resulting in first-cost savings from buying smaller HVAC equipment. This interaction is discussed in more detail in Chapter 1.
2.2.1 New Construction An enclosure design must satisfy all of an envelope’s performance requirements in an integrated manner, not in isolation. Therefore, an integrated design process (one that combines and coordinates design elements) is more likely to achieve a high-performance building enclosure. Within an integrated design, an air barrier (the system within the building envelope that resists infiltration) should be identified as a critical building component early in the process. To achieve high-performance design, the architect and contractor must work closely to develop clear drawings and specifications for an easily fabricated and installed air barrier. Designing the air barrier as an integrated system for the specific project is superior to copying details from previous projects. The designer should also not sacrifice performance in favor of aesthetics. Finally, as drawing details and specifications are developed throughout the design process, they should be reviewed and air barrier-specific modifications made as needed.
2.2.2 Existing Buildings To address air leakage in existing buildings, leaks must first be found before they can be sealed. Several techniques can be used to find air leakage paths. Depressurization testing while
1 The cost savings are based on national average rates of $0.112/kWh, and $0.81/therm.

15
This report is available at no cost from the National Renewable Energy Laboratory (NREL) at www.nrel.gov/publications.
simultaneously using a smoke pencil (see Figure 2) or infrared thermography2 (see Figure 3) is the most effective. Other methods include visual inspection, or use of the blower door, smoke pencil, and infrared thermography independently.
Figure 2. Testing for air leaks with a smoke pencil
(Courtesy bob.instituteforsustainability.org.uk)
Figure 3. Testing for air leaks with thermal imaging (Courtesy thermalimaging.ie)
Once found, air leaks should be sealed in the following order, starting with the most important:
1. Top: attics, roof/wall intersections, HVAC equipment penetrations, cases, ducts in unconditioned spaces, roof penetrations, plenums
2. Bottom: soffits, access doors, vents, penetrations, slab/wall intersection
2 There are some limitations to using infrared for effective detection of infiltration. For best sensitivity it should be done early in the morning when temperatures and solar gain effects have stabilized. It also needs to be cold enough outside that the impacts of infiltration can be seen with the infrared camera.

16
This report is available at no cost from the National Renewable Energy Laboratory (NREL) at www.nrel.gov/publications.
3. Vertical shafts: stairwell, penetrations, elevator rooms, service shafts
4. Outside walls: weather stripping for windows and doors, penetrations, exhaust and supply fans, electrical receptacles
5. Compartments: garages, mechanical and electrical rooms, generator room, shipping docks.
Various materials can be used to seal air leaks. These include one-component polyurethane foam sealant, two-component polyurethane foam insulating air seal kits, weather stripping, caulk, and air seal/fire stop systems (Tratt 2014). For ducts, mastic is much more effective than duct tape. Duct tape (sometimes called temporary tape by weatherization personnel) may fail over time. Figure 4 shows weather stripping being applied to a window.
Figure 4. Applying weather stripping to a window
(Courtesy cornerflex.com)
2.2.3 Real-World Considerations Infiltration reduction has the biggest energy impact in cold climates, and diminishing returns in increasingly warmer climates. However, in warmer climates that are also humid, infiltration reduction can reduce moisture and its damage to materials.
Infiltration reduction is a passive measure; therefore, it requires low maintenance and has virtually no operational costs.
Finally, a significant reduction in infiltration can degrade indoor air quality if proper mechanical ventilation is not provided to the space. Balanced ventilation systems are most optimal, except in buildings with fume hoods (laboratories, hospitals, and commercial cooking facilities, for example).
2.2.4 Financial Incentives State and utility energy efficiency programs may provide incentives for reducing infiltration in new and existing buildings. Contact the local utility or statewide program for information on available incentives or rebates. The Database of State Incentives for Renewables and Efficiency

17
This report is available at no cost from the National Renewable Energy Laboratory (NREL) at www.nrel.gov/publications.
(www.dsire.org) provides an up-to-date comprehensive listing of opportunities. A few examples are provided here:
National Grid (Gas)—Commercial Energy Efficiency Rebate Programs (New York State). Offers rebates under custom projects that could include air and duct sealing up to 50% of the overall cost, depending on the savings.
Alliant Energy Iowa commercial efficiency rebates program. Offers rebates on building sealing, including weather stripping, caulking, and window filming at 70% of project cost up to a maximum of $1,500.
NorthWestern Energy (Gas) – Commercial Energy Efficiency Rebate Program (Montana). Offers a rebate on duct sealing and insulation of $1.50/ft2.
2.3 Project Results The Alliance Center is the headquarters for the Alliance for Sustainable Colorado and sustainability-focused tenant/partner organizations. The Alliance participated in the CBP program to analyze EEMs for renovating its 100-year-old warehouse building. The Alliance envisions a living example of collaboration and sustainability at work. A significant part of the building is cooperative office and collaboration space (not held by a specific tenant).
The Alliance Center building is six stories and was built in 1908. Its envelope consists of 20-in. thick brick walls with an additional 2 in. of mortar. The roof had been upgraded to R-10 fiberglass batt insulation, and the windows had been replaced with double-paned windows with aluminum frames. The building uses a direct expansion (DX), packaged variable air volume (VAV) system (8 energy efficiency ratio [EER]) for cooling, and electric resistance radiant panels for heating. The building has no access to natural gas.
Figure 5. Alliance Center (Courtesy the Alliance for Sustainable Colorado)

18
This report is available at no cost from the National Renewable Energy Laboratory (NREL) at www.nrel.gov/publications.
One of the EEMs explored for the renovation was infiltration reduction. A blower door test of the existing building measured an infiltration rate of 0.33 air changes per hour. The project team then modeled an assumed 20% reduction to this baseline value using EnergyPlus (see Table 2).
Table 2. Infiltration Reduction for the Alliance Center Renovation
Project Alliance Center Renovation—Denver, Colorado Building size 38,500 ft2
Project description Renovation of a 100-year-old warehouse building into an energy-efficient, multitenant office building
Infiltration reduction Reduce infiltration by 20% Expected/measured annual energy savings 9,669 kWh Expected/realized annual energy cost savings $522 EEM cost $5,700 Reduction in EUI 0.87 kBtu/ft2 Simple payback 10.9 years Annual carbon emissions avoided 6.7 metric tons CO2e3 The building was relatively airtight to begin with, so the economics of this EEM were not favorable in this particular case. Also, the major blower door test finding was that the windows were in need of replacement. However, historic preservation requirements further hindered consideration of this measure; therefore, infiltration reduction was not pursued.
2.4 Modeling Infiltration Reduction Savings Properly capturing infiltration (or building airtightness) is important to the overall accuracy of any building model. Gowri et al. (2009) is a good source for detailed guidance in modeling infiltration. It outlines a methodology for analyzing infiltration in EnergyPlus™. It recommends using the DOE-2 infiltration methodology within EnergyPlus for the most accurate results, because this method accounts for varying infiltration rates by building height. It recommends reasonable infiltration rates for baseline and high-performance envelope cases, and provides guidance for schedules. More detailed guidance for modeling infiltration in EnergyPlus is provided in Appendix B.
2.4.1 OpenStudio Guidance OpenStudio supports infiltration modeling; several ASHRAE Standard baseline infiltration rates are available as defaults. The EnergyPlus guidance can then be followed to adjust the detailed inputs. Furthermore, the Building Component Library (https://bcl.nrel.gov/) contains a few packaged infiltration EEMs that are ready to be integrated directly into an OpenStudio model. The components include Advanced Energy Design Guide-compliant infiltration reductions and measures for setting a new infiltration rate or reducing infiltration rate by a percentage.
2.5 Ensuring Performance 2.5.1 Installation The contractor should develop a schedule that allows sufficient time to develop and review shop drawings, fabricate custom components, and assemble a field mockup. The field mockup is a 3 Greenhouse gas reductions are given in terms of carbon dioxide equivalent (CO2e). For electricity, 0.000692 metric tons of CO2e are assumed to be avoided for each kWh saved. For natural gas, 0.006418 metric tons CO2e are assumed to be avoided per therm of natural gas saved.

19
This report is available at no cost from the National Renewable Energy Laboratory (NREL) at www.nrel.gov/publications.
useful tool for educating construction personnel, and for identifying construction issues early. Construction personnel should be educated about the air barrier, its construction, and the reasons for its importance. Architects, or CxAs working on their behalf, should inspect the wall systems during construction (Persily 1993). Both the commissioning agent and the architect should review at least 5%–10% of the submittals for accuracy (Lough 2012).
2.5.2 Commissioning As building designs become more complex and materials more varied (and innovative), commissioning of building envelopes becomes increasingly important. Commissioning by a CxA, preferably an independent agent with experience in envelope commissioning, is superior to commissioning by the architect who designed the building. The commissioning agent could also be a building enclosure CxA or building enclosure specialist. Performance testing should include a blower door test to measure the as-built infiltration levels of the building enclosure (NIBS, 2012; ASTM, 2012). More information on general commissioning can be found in Chapter 1.
2.5.3 Operation O&M documents should include:
• Glazing system inspection schedules: In particular, inspections should look for system degradation that would lead to increased infiltration, such as cracks.
• Performance criteria for replacement parts and repairs
• Schedules for routine cleaning and maintenance.
2.5.4 Occupant Behavior One of the biggest benefits of this passive, static measure is that infiltration reduction requires minimal occupant interaction. Building occupants should, however, be trained to close doors and operate windows. Informational signage may be strategically placed to remind building occupants to close doors and windows as they are used and when outside conditions are unfavorable for natural ventilation.
2.6 Measurement and Verification Measuring and verifying achieved energy savings are integral to reducing energy use in buildings. Chapter 1 provides an in-depth discussion of the process and its components. Because infiltration reduction is complex and interacts strongly with other building components, whole-building calibrated simulation is often used to verify this measure. A blower door test from before and after infiltration reduction may be used to inform this model.
2.6.1 Recommended Monitoring Points Infiltration reduction can only be directly measured with expensive tracer gas measurements. A less expensive approach is to use blower door testing, combined with airflow modeling within building simulation software. Once the infiltration levels are known, the energy savings must be calculated. Infiltration reduction is different from a typical EEM (e.g., efficient lighting), because to verify its energy savings, its impact on the entire HVAC system must be measured. In the most comprehensive (and expensive) case, total HVAC system performance is determined through numerous measurements. Specific monitoring points for this verification depend on the

20
This report is available at no cost from the National Renewable Energy Laboratory (NREL) at www.nrel.gov/publications.
type of HVAC system, but are likely to include cooling electrical power, fan and pump power, and natural gas consumption for heating. The electrical power submetering should meet the following criteria:
• Ability to measure and log real electrical power for an extended time. This offers a more accurate picture of energy use compared to a meter that provides only instantaneous readings.
• Sampling interval of 30 seconds
• Designed for the type of circuit to be metered (e.g., 480 Volt, 20 amp, 60 Hertz)
• Ability to accurately meter loads; rated to meet the load per phase (e.g., 0–80,000 Watts)
• Internal clock that timestamps each data point
• Underwriters Laboratories (UL) listing
• Compatibility with the BAS.
Appendix A provides more specifics about temperature and flow rate measurement.
If infiltration reduction is implemented on an existing building, these measurements should be taken both before and after the implementation. If the building is new construction, these measurements can be taken after construction only; calibrated simulation can then be used to determine verified savings.
Because seasonal temperature variations influence infiltration reduction impact, the monitoring period should be at least 1 year. Conducting spot measurements of the infiltration rate is also useful, where building type and size allow, to compare with design intent (and to establish a baseline in existing buildings).
2.6.2 Detailed Procedures for Measuring Infiltration Rates Infiltration rates are measured using a fan pressurization test. It is required in certain jurisdictions, such as the City of Seattle, where the Bullitt Center project was located. During the test, a fan induces a range of artificial pressure differences across the building envelope, up to 75 Pascals. The airflow rates through the fan are then measured at each pressure. ASTM Standard E779 outlines the testing protocol in more detail. The test is valid on single-zone buildings. Multiple-zone buildings can be turned into single-zone buildings by opening interior doors; however, pressure differences within the zones should be confirmed to be low by measurements before the test can be considered valid. High winds and large indoor-outdoor temperature differences substantially compromise measurement reliability.
The fan pressurization test requires equipment (a fan, blower, or HVAC system) to move large volumes of air, pressure-measuring device (manometer with ±5% accuracy), airflow measuring system (±5% accuracy), and a temperature-measuring device (±1°C accuracy). A photo of a doorway set up for a fan pressure test using a blower door is shown in Figure 6.

21
This report is available at no cost from the National Renewable Energy Laboratory (NREL) at www.nrel.gov/publications.
Figure 6. Fan pressure test using a blower door
(Photo by David Saum, NREL, 06238) The basic steps of the test procedure are:
1. Open all interconnecting doors and determine that pressures of interior spaces are within ±10%.
2. Do not adjust HVAC balancing dampers or registers.
3. Observe the general state of the building envelope.
4. Measure the indoor and outdoor air temperature (OAT) at the beginning and end of the test. If the absolute value of the difference between the indoor temperature and the OAT multiplied by the building height is greater than 1200 ft-oF, the test is invalid.
5. Install the air-moving equipment and pressure-measuring device.
6. Measure the pressure at zero flow at the beginning and end of the test.
7. In increments of 5–10 Pa, induce pressure differences from 10 to 60 Pa.
8. At each pressure difference, measure the airflow rate for at least 10 seconds or until steady values are achieved.
9. Repeat the measurement for depressurization.
10. Find the elevation of the building above sea level.
Once the test data are collected, the standard outlines the analysis that must be completed to determine the building envelope’s flow coefficient, pressure exponent, leakage area, and associated confidence limits. A written report should summarize the results. Many blower doors now come with computerized capabilities to run the test and perform the analysis.

22
This report is available at no cost from the National Renewable Energy Laboratory (NREL) at www.nrel.gov/publications.
2.6.3 Guidance for Analysis If pressure tests are conducted on an existing building before and after infiltration reduction, and utility bills are available for both periods, basic weather normalization and regression analysis can be used to verify energy savings.
For new construction projects, for existing buildings where data before the retrofit are not available, or for projects where no pressure testing was performed, calibrated simulation is needed. This calibrated simulation, combined with the submetered HVAC data described in Section 2.6.1, can be used to determine the infiltration levels. An experienced energy modeler should use the gathered data to update inputs associated with an annual computer simulation of the building’s energy performance. Information about the building’s occupancy schedule, actual weather data and designed envelope, lighting, ancillary HVAC equipment, and controls should be gathered from BAS data, occupant and operator interviews, and design documents to confirm model inputs. Remaining unknown model inputs, such as infiltration rates, are then adjusted such that the simulation predictions match the actual monthly or annual energy performance within acceptable tolerance levels. More details are provided for existing buildings and new construction, below.
2.6.3.1 Existing Buildings For existing buildings, the energy savings are determined within the model by comparing the building’s energy performance before and after the renovation. The gathered data are first used to calibrate the before- and after-renovation versions of the whole-building energy model. Once calibrated, the energy performance data are then normalized by salient factors, such as assuming the same occupancy schedule and typical weather conditions. Once normalized, the energy savings from infiltration reduction are determined by taking the difference between energy consumption from before and after the retrofit.
2.6.3.2 New Construction For new construction projects, the energy savings calculation is less clearly defined, because no measured baseline data are available for comparison. A relevant energy code or standard is typically used in these situations to define baseline model inputs. The 2012 International Energy Conservation Code outlines one compliance path for infiltration levels as having a whole-building infiltration rate of 0.40 cfm/ft2 of wall area at a reference pressure difference of 0.3 in. wg. This infiltration rate is defined at an elevated reference pressure pressure differential and must be converted to account for different conditions for use within an energy model. (Appendix B provides more detail.) The proposed model should use measured values of infiltration through pressurization tests whenever possible. Both the baseline and the proposed system models should then be normalized using the same occupancy schedules and typical weather conditions. Once normalized, the energy savings from the infiltration reduction are determined by taking the difference between energy consumption of the model with the baseline and proposed infiltration rates.
23
This report is available at no cost from the National Renewable Energy Laboratory (NREL) at www.nrel.gov/publications.
2.7 References and Resources Air Barrier Association of America: Accessed March 2015: www.airbarrier.org
ASHRAE (2010). ANSI/ASHRAE/IES Standard 90.1, Energy Standard for Buildings Except Low-Rise Residential Buildings. Atlanta, GA: American Society of Heating, Refrigerating and Air-Conditioning Engineers.
ASHRAE (2014). ANSI/ASHRAE/IES/USGBC Standard 189.1-2014, Standard for the Design of High-Performance Green Buildings. Atlanta, GA: American Society of Heating, Refrigerating and Air-Conditioning Engineers.
ASTM (2012). ASTM E2813-12: Standard Practice for Building Enclosure Commissioning. Accessed March 2015: http://www.astm.org/Standards/E2813.htm.
ASTM (2012). ASTM E2813-12: Standard Practice for Building Enclosure Commissioning. ASTM International. Accessed March 2015: http://www.astm.org/Standards/E2813.htm.
DOE (2013). “Building America Case Study: Predicting Envelope Leakage in Attached Dwellings.” DOE/GO-102013-4061. Washington, DC: U.S. Department of Energy. Accessed March 2015: http://www.nrel.gov/docs/fy14osti/60149.pdf.
Emmerich, S.; McDowell, T.; Anis, W. (2005). Investigation of the Impact of Commercial Building Envelope Airtightness on HVAC Energy Use. NISTIR 7238. Washington, D.C.: U.S. Department of Energy.
Emmerich, S.; McDowell, T; Anis, W. (2005). Investigation of the Impact of Commercial Building Envelope Airtightness on HVAC Energy Use, NISTIR 7238.
Emmerich, S.J.; Persily, A.K. (2005). Airtightness of Commercial Buildings in the U.S. Gaithersburg, MD: Building and Fire Research Laboratory, National Institute of Standards and Technology. Accessed March 2015: http://web.mit.edu/cron/project/concrete-sustainability-hub/Literature%20Review/Building%20Energy/Infiltration/2005041_Emmerich_AIVC_Airgtightness.pdf.
Gowri, K.; Winiarski, D.; Jarnagin, R. (2009). Infiltration Modeling Guidelines for Commercial Building Energy Analysis. PNNL-18898. Richland, WA: Pacific Northwest National Laboratory. Accessed March 2015: http://ibpsa-boston.com/minutes/IBPSAboston-presentations_2011-09-16_Gowri.pdf.
ICC (2012). International Energy Conservation Code. Washington, D.C.: International Code Council. Similar to ASHRAE 90.1-2010 with an additional performance test compliance path. Acceptable are those that have a building-level tested infiltration rates of 0.4 cfm/ft2 at 0.3 in. wg.
Lough, M.J. (2012). Building Enclosure Commissioning: An Introduction. AIA Best Practices. Accessed March 2015: http://www.aia.org/aiaucmp/groups/secure/documents/pdf/aiab096758.pdf.

24
This report is available at no cost from the National Renewable Energy Laboratory (NREL) at www.nrel.gov/publications.
NIBS (2012). NIBS Guideline 3-2012: Building Enclosure Commissioning Process BECx. National Institute of Building Sciences. Accessed March 2015: https://www.wbdg.org/ccb/NIBS/nibs_gl3.pdf.
Persily, A. (1993). Envelope Design Guidelines for Federal Office Buildings: Thermal Integrity and Airtightness. NISTIR 4821. Work Performed by U.S. Department of Commerce, Gaithersburg, MD. Washington, DC: General Services Administration. Accessed March 2015: http://wbdg.org/ccb/GSAMAN/nist4821.pdf.
Sherman, M.H.; Modera, M.P. (1986). “Comparison of Measured and Predicted Infiltration Using the LBL Infiltration Model.” Trechsel, H.R.; Lagus, P.L., eds. in Measured Air Leakage of Buildings. Philadelphia, PA: ASTM, 1986; pp. 325–347. This paper has an excellent description of the theory and equations behind both the Sherman and Grimsrud leakage and infiltration models.
Tratt, S. (2014). “Air Sealing Existing Buildings for Energy Savings.” ABAA Conference presentation, 2014. Accessed March 2015: http://www.airbarrier.org/conference/Steve%20Tratt%20-%20Air%20Sealing%20Existing%20Bldgs%20for%20Energy%20Savings.pdf.
Zhivov, A.; Bailey, D.; Herron, D. (2012). U.S. Army Corps of Engineers – Air Leakage Test Protocol for Building Envelopes. Version 3. U.S. Army Corps of Engineers. Accessed March 2015: https://www.wbdg.org/pdfs/usace_airleakagetestprotocol.pdf.

25
This report is available at no cost from the National Renewable Energy Laboratory (NREL) at www.nrel.gov/publications.
Chapter 3. Natural Ventilation 3.1 Description Fresh outside air is introduced into commercial buildings to improve indoor air quality by diluting odors and chemicals in the conditioned space. Outside air can also be used for cooling, especially in temperate climates. In most U.S. commercial buildings, ventilation air and cooling are supplied by mechanical means. Before the 20th century, however, natural means were used to ventilate buildings and maintain cool indoor comfort levels during the summer.
The growing concern with building energy use, the rise of the green building movement, and the goal of achieving net zero energy buildings have renewed interest in using natural ventilation strategies to save energy and improve indoor air quality. Natural ventilation relies on nonmechanical means to provide supplemental cooling when outdoor conditions are favorable and enough outdoor air is available to partially meet ventilation air requirements. In its simplest form, it involves opening windows to bring outside air into the building. More sophisticated strategies involve siting and shaping the building to take advantage of the prevailing wind direction, employing controls that open and close windows based on outdoor conditions, and controls linking the heating and cooling operation to the position of the windows.
The driving forces behind natural ventilation are wind and temperature-induced buoyancy. Wind-driven ventilation takes advantage of the pressure differences at openings to move air through the building; buoyancy-driven ventilation relies on density differences (hot air is less dense) to move warm air up and out of the building.
3.2 Benefits of Natural Ventilation Some compelling reasons for designing buildings to take advantage of natural ventilation follow (Melton 2014):
• Occupant satisfaction—being able to open a window and feel a breeze is psychologically satisfying; occupants express greater satisfaction with their spaces when they have this option.
• Indoor air quality—large amounts of outside air can contribute to overall occupant satisfaction.
• Energy savings—in some locations where natural ventilation is possible year-round (temperate climates where summer highs rarely exceed 75°F and winter lows don’t reach freezing), energy savings can be substantial. In the temperate climate of the United Kingdom, the cofounder of Breathing Buildings cites savings of 10%–30% on fan energy alone. Even in climates that are not optimal, energy and air quality benefits make natural ventilation an appealing strategy.
Table 3 provides two examples showing potential savings4 for implementing natural ventilation in a temperate climate. These results are highly climate dependent. Example A is an educational building in the Pacific Northwest, assuming a 10% reduction in energy use. Example B is an office building, also in the Pacific Northwest, that achieves 30% reduction in energy use. The
4 The cost savings are based on national average rates of $0.112/kWh, and $0.81/therm.

26
This report is available at no cost from the National Renewable Energy Laboratory (NREL) at www.nrel.gov/publications.
energy use baseline was taken from the 2003 Commercial Buildings Energy Consumption Survey.
Table 3. Natural Ventilation Potential Annual Energy and Cost Savings in a Temperate Climate
Parameter Unit Example A Example B Electricity saved kWh/ft2 1.07 4.38 Gas saved Therms/ft2 0.0 0.0 EUI saved kBtu/ft2 3.7 14.9 Utility bill savings $/ft2 $0.12 $0.49 Typical capital cost $/ ft2 Project specific Typical simple payback Years Project specific Capital cost 5-year payback $/ft2 $0.60 $2.45 Target incentive $/ft2 NA NA
3.3 Design Strategies Natural ventilation can be used in commercial, agricultural, and residential buildings. Design strategies can address:
• Building cooling needs—replace or dilute warm indoor air with cooler outdoor air when conditions are favorable to cool building interiors, including nighttime cooling to reduce daytime cooling loads.
• Personal thermal comfort—air flowing over the human body increases the evaporation rate from the skin and enhances heat extraction, so moving air over occupants keeps them cool.
• Air quality—provide some or all of the outside air needed to meet ventilation standards.
To be effective, strategies must be integrated early in the building design process.
Naturally ventilated buildings must overcome two intrinsic design issues: driving airflow and limitations imposed by extreme OATs. In many climates and building types, conventional comfort thresholds cannot be achieved year-round with natural ventilation alone, requiring the use of a supplementary mechanical HVAC system (mixed mode), which uses energy to meet the building’s comfort and ventilation requirements. Minimizing solar and internal heat gains (through control of lighting and other loads) can help maintain comfort thresholds throughout the day, extending the viability of natural ventilation. Once a building design is optimized for natural ventilation, conventional air conditioning can operate only when conditions require it, saving additional energy.
3.3.1 Wind-Driven Ventilation The two basic types of wind-driven ventilation design are described in Section 3.3.1.1 and Section 3.3.1.2.
3.3.1.1 Single-Sided Ventilation Creating an opening on one side of the space allows air to flow in through the lower part of the opening, move around the space, and subsequently flow out of the upper part of the same

27
This report is available at no cost from the National Renewable Energy Laboratory (NREL) at www.nrel.gov/publications.
opening. This strategy is not optimal for moving air, because the ventilating air does not penetrate the space deeply, so resulting ventilation rates are lower than for other strategies.
3.3.1.2 Cross Ventilation Creating openings on opposite sides of the space allows air to flow in on one side and out from the other side. The openings can be on the same vertical plane or they can be offset to take advantage of buoyancy. Care must be taken to ensure a uniform and comfortable temperature distribution across the building floor plate.
Figure 7 illustrates airflow paths of natural ventilation.
Figure 7. Airflow paths used in natural ventilation, including
single-sided and cross-flow ventilation
(Courtesy Jason Sippel, Energy Center of Wisconsin)
Figure 8. Operable clerestory windows at the Lussier Community
Education Center in Madison, Wisconsin
(Courtesy Rebecca Sadler, Energy Center of Wisconsin)

28
This report is available at no cost from the National Renewable Energy Laboratory (NREL) at www.nrel.gov/publications.
3.3.2 Buoyancy-Driven Ventilation Several methods can be used to exploit the lower density of warmer air.
3.3.2.1 Clerestory or Skylights Low-level intakes paired with high-level exhaust increases a designer’s ability to direct airflows within a space. When buoyancy is used to induce airflow, it becomes self-regulating through increased dependence on internal temperatures and decreased reliance on wind-driven flows.
3.3.2.2 Solar Chimney A vertical shaft can be employed to absorb solar heat. Hot air rises through the chimney and exits at the top, while cool air is drawn into the building at the base of the chimney.
3.3.2.3 Atrium An attractive, multiuse space may be designed to function as a chimney by allowing warm air to rise out of the space. The multipurpose nature of an atrium poses limitations on its optimal use for ventilation.
Figure 9. Operable windows cool the stairway at the Bullitt Center
(Courtesy Nic Lehoux)
3.3.3 Controls for Natural Ventilation Systems Several strategies can be used to manage natural ventilation systems and provide occupants with cues for adjusting systems over which they have control.
Natural ventilation strategies were deployed in several CBP projects. At the Bullitt Center in Seattle, operable windows on each floor facilitate cross ventilation and natural cooling. The windows can be operated by the tenants but are also controlled by the BAS. The BAS senses the indoor and outdoor conditions and opens and closes the windows automatically, depending on whether the outdoor conditions are favorable. In summer, the BAS opens the windows at night to cool the building. This precooling is carried into the next day, offsetting some of the cooling demands during hotter daytime hours.
29
This report is available at no cost from the National Renewable Energy Laboratory (NREL) at www.nrel.gov/publications.
3.3.3.1 Informational Control Systems (Such as Red/Green Light Systems) These systems inform occupants when the BAS senses that windows should be closed or opened using a visual display, often through a central light that turns red or green. This information would ideally bring occupant behavior into better alignment with model expectations and “optimal” operation.
3.3.3.2 Automated Window Controls These systems manage airflow automatically, according to specific algorithms to control indoor conditions. They may enhance or moderate the effects of manually controlled windows.
3.3.3.3 HVAC Override Controls These systems typically employ window switches to disable or scale back HVAC system operation when windows are opened. They can potentially move indoor conditions to more closely align with a naturally ventilated building.
3.4 Real-World Considerations The success of natural ventilation systems depends on climate, building design, and technology, and considerably on occupant behavior.
3.4.1 Climate Relying solely on natural ventilation for summertime cooling is optimal only in climates where the summer outdoor temperature seldom exceeds thermal comfort limits (75°F). In climates where natural ventilation alone is not optimal, it can be integrated with mechanical cooling. Hybrid ventilation (integrating natural and mechanical ventilation) generally requires comprehensive airflow modeling early in the building design process to ensure that the building design, ventilation strategy, ventilation controls, and operating procedures are integrated successfully.
3.4.2 Building Location, Orientation, and Shape To optimize wind-driven ventilation, the building should be oriented relative to the site topography and prevailing (but variable) wind direction. Other issues include wind speed and building shape.
3.4.3 Acoustics Outdoor noise can be a significant barrier to implementing natural ventilation strategies. Solutions include locating ventilation inlets and occupied spaces with operable windows away from noise sources (opening onto a courtyard, for example rather than a busy street).
3.4.4 Outdoor Air Quality Outdoor air quality is sometimes unacceptable because of high pollen counts, smog, or high particulate levels. Occupants should be alerted to these conditions so that they keep windows closed during these times. To further decrease infiltration of poor-quality air, operable windows and ventilation inlets should be positioned to avoid vehicle fumes.

30
This report is available at no cost from the National Renewable Energy Laboratory (NREL) at www.nrel.gov/publications.
3.4.5 Occupant Comfort Designing a naturally or mechanically ventilated space that is comfortable for everyone is impossible. With natural ventilation, though, occupants must understand how the system works and have as much control as possible in adjusting the system for their comfort levels. Designers may strive to mitigate temperature swings and minimize cold drafts, but ultimately, occupant engagement will ensure that the system is successful.
Putting control in occupants’ hands involves:
• Flexible dress codes
• Flexible attitudes
• Adjustable shades
• Ceiling fans
• Desk fans.
ASHRAE Standard 55-2013, Thermal Environmental Conditions for Human Occupancy Standard EN15251 provides guidance for evaluating the applicability of natural ventilation strategies for a given project. These guidelines consider the influence of outdoor conditions to create a variable indoor comfort range dependent on seasonal temperatures. When paired with the ability of occupants to control their own environment, the space thermal comfort thresholds may be more lenient than conventional temperature ranges.
3.4.6 Retrofitting Existing Buildings Wind-driven or buoyancy-induced ventilation may require a particular building orientation, geometry, or interior layout that buildings constructed between the 1950s and 1990s may not have. Because these buildings were designed to use mechanical ventilation, they have deep floor plans that do not lend themselves easily to natural ventilation strategies. Possible solutions include introducing an atrium, providing some spaces with operable windows, and implementing controls that turn off the HVAC system in offices with operable windows. Older buildings that were designed before mechanical air conditioning was available are likely to feature natural ventilation strategies; those systems can be restored to full functionality with some diligence and engineering.
3.4.7 Financial Incentives Few, if any, state or utility programs specifically target natural ventilation design strategies. This measure could qualify for incentives as a “custom” EEM in new construction programs. Some examples include:
New York State Energy Research and Development Authority New Construction Program. Funding is available for technical assistance, commissioning services, prequalified measures, custom electric EEMs, whole-building design, and Leadership in Energy & Environmental Design (LEED) projects. Incentives are based on the predicted energy performance of the building design.

31
This report is available at no cost from the National Renewable Energy Laboratory (NREL) at www.nrel.gov/publications.
ComEd New Construction Program. Financial incentives and technical assistance are available to encourage design teams and building owners to surpass current standard practices and exceed energy code requirements. The program includes comprehensive energy modeling services, which describe the relationships between building systems and energy-efficient technologies to help building owners and design teams with the decision-making process before design documents are complete.
Mass Save New Construction Program. Technical assistance services are available to assess the savings potential of a high-efficiency design compared to the minimum requirements of the state building code. Incentives are available for window system and other measures.
3.5 Project Results 3.5.1 University of Hawai’i Retrofit of Kuykendall Hall on the campus of the University of Hawai’i at Mānoa was the focus of the university’s participation in the CBP program. Kuykendal Hall is a 1960s-era building with two wings: a four-story wing with classrooms and a seven-story office tower. The retrofit design included use of prevailing winds to assist with ventilation and cooling (see Table 4).
Table 4. Ventilation and Cooling for the Kuykendal Hall Retrofit
Project Retrofit of Kuykendal Hall Building size 86,000 ft2
Natural ventilation
Operable windows with actuators (automated closure before dehumidification) in the classrooms and offices. automated louvers and sound attenuated natural ventilation intake boxes in classroom wing, sound attenuated natural ventilation intake boxes in office tower.
3.5.2 Shy Brothers The Shy Brothers Farm in Westport, Massachusetts, produces artisanal cheeses. The owners participated in the CBP program for the design and analysis of EEMs for a new dairy barn and a major renovation of an existing barn. The new barn, constructed to accommodate 120 head of cattle, was designed to be a net-zero energy building using natural ventilation (see Figure 10 and Table 5).
Figure 10. Passive ventilation design for Shy Brothers cow barn
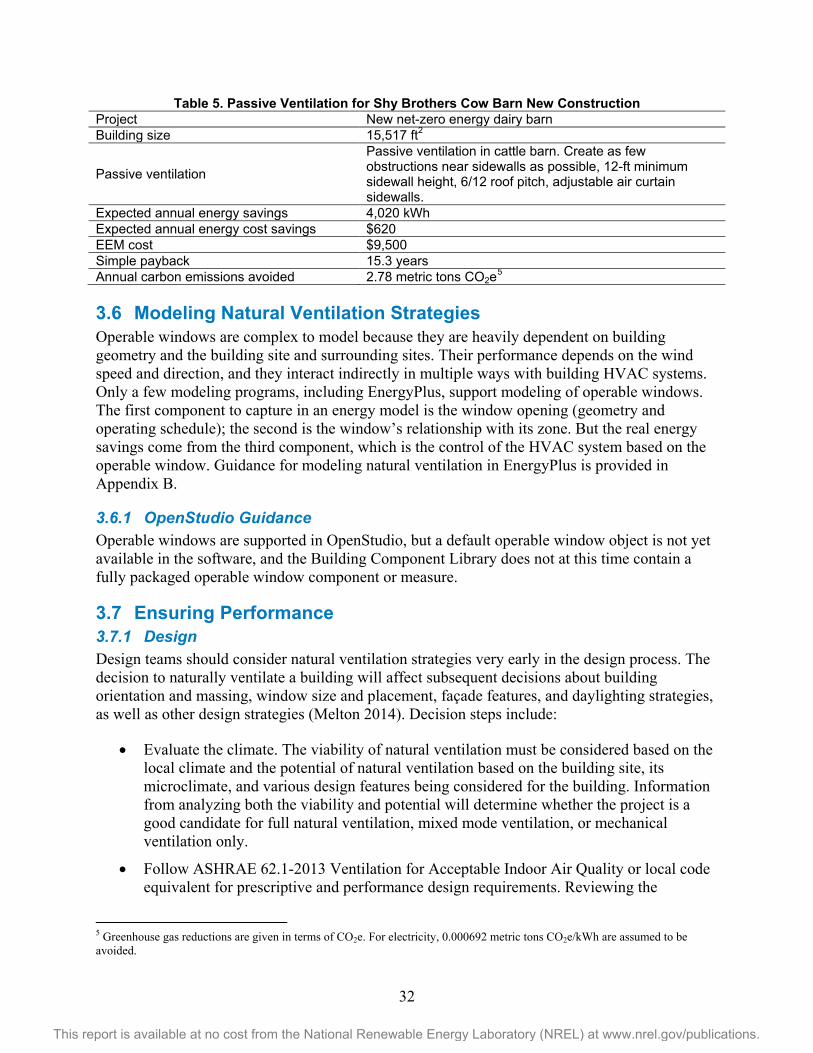
32
This report is available at no cost from the National Renewable Energy Laboratory (NREL) at www.nrel.gov/publications.
Table 5. Passive Ventilation for Shy Brothers Cow Barn New Construction Project New net-zero energy dairy barn Building size 15,517 ft2
Passive ventilation
Passive ventilation in cattle barn. Create as few obstructions near sidewalls as possible, 12-ft minimum sidewall height, 6/12 roof pitch, adjustable air curtain sidewalls.
Expected annual energy savings 4,020 kWh Expected annual energy cost savings $620 EEM cost $9,500 Simple payback 15.3 years Annual carbon emissions avoided 2.78 metric tons CO2e5 3.6 Modeling Natural Ventilation Strategies Operable windows are complex to model because they are heavily dependent on building geometry and the building site and surrounding sites. Their performance depends on the wind speed and direction, and they interact indirectly in multiple ways with building HVAC systems. Only a few modeling programs, including EnergyPlus, support modeling of operable windows. The first component to capture in an energy model is the window opening (geometry and operating schedule); the second is the window’s relationship with its zone. But the real energy savings come from the third component, which is the control of the HVAC system based on the operable window. Guidance for modeling natural ventilation in EnergyPlus is provided in Appendix B.
3.6.1 OpenStudio Guidance Operable windows are supported in OpenStudio, but a default operable window object is not yet available in the software, and the Building Component Library does not at this time contain a fully packaged operable window component or measure.
3.7 Ensuring Performance 3.7.1 Design Design teams should consider natural ventilation strategies very early in the design process. The decision to naturally ventilate a building will affect subsequent decisions about building orientation and massing, window size and placement, façade features, and daylighting strategies, as well as other design strategies (Melton 2014). Decision steps include:
• Evaluate the climate. The viability of natural ventilation must be considered based on the local climate and the potential of natural ventilation based on the building site, its microclimate, and various design features being considered for the building. Information from analyzing both the viability and potential will determine whether the project is a good candidate for full natural ventilation, mixed mode ventilation, or mechanical ventilation only.
• Follow ASHRAE 62.1-2013 Ventilation for Acceptable Indoor Air Quality or local code equivalent for prescriptive and performance design requirements. Reviewing the
5 Greenhouse gas reductions are given in terms of CO2e. For electricity, 0.000692 metric tons CO2e/kWh are assumed to be avoided.

33
This report is available at no cost from the National Renewable Energy Laboratory (NREL) at www.nrel.gov/publications.
compulsory requirements early on in the design process will help simplify the integration of system components.
• Determine sensors and controls needs. If the design team decides to implement natural or mixed mode ventilation, any required sensors or automated systems for controlling windows, fans, and other components will affect the budget and should be determined early on.
3.7.2 Commissioning See Chapter 1 for information about the general commissioning process.
CxAs ensure that any automated systems controlling the natural ventilation system operate according to requirements. They:
• Ensure that mechanical ventilation is only being supplied when needed (i.e., not when windows are open).
• Calibrate carbon dioxide sensors, if used, and confirm that the system provides adequate ventilation. This is especially important when minimum prescriptive ventilation opening requirements cannot be met.
3.7.3 Operation The facility manager monitors automated systems to ensure they respond properly to climate conditions, and conducts routine maintenance of window opening switches/sensors and any other installed control features. In nonautomated or user-controlled systems, a feedback method should be established, such as occupant comfort surveys and periodic education sessions for occupants to help better understand and optimize the use of natural ventilation.
The facility manager and building manager should devise a policy to incorporate window closure with building security procedures.
3.7.4 Occupant Behavior In naturally ventilated (or mixed mode) buildings, occupants are key to the successful operation of the system. The design team, building manager, and facility manager can help ensure that occupants understand and use the system appropriately. Table 6 summarizes each party’s responsibilities.
Table 6. Natural Ventilation Implementation Team Members and Responsibilities
Team Member Responsibility Design team and/or management
• Explain natural ventilation strategies to occupants early in the design phase of the building.
Facility manager and/or building manager, with assistance from the BAS
• Communicate with occupants to set expectations for adjusting comfort levels (adjusting shades, opening windows, using fans).
• Alert occupants to weather conditions requiring adjustment of the natural ventilation system (e.g., optimal temperature for opening windows, high pollen or pollution levels requiring windows to be closed). This can be accomplished through a red/green light system, or automated messaging such as email notification. Other, more energy-focused controls turn off air conditioning when outdoor conditions are ideal for natural ventilation, encouraging occupants to open windows for conditioning.

34
This report is available at no cost from the National Renewable Energy Laboratory (NREL) at www.nrel.gov/publications.
Management
• Devise a policy that encourages the use of windows and outline who is responsible for opening windows and when.
• Provide ongoing education about the energy and indoor environmental quality benefits of window use.
• Provide a flexible work environment. Devise dress code policies that allow users to adapt to seasonal climates and/or extend the range of comfort in naturally ventilated spaces.
Occupants • Take control of their comfort. 3.7.5 Measurement and Verification Measuring and verifying achieved energy savings are integral to reducing energy use in buildings. (See Chapter 1 for information about the general M&V process.) Because natural ventilation is complex and interacts strongly with other building components, whole-building calibrated simulation is often used to verify this measure’s effectiveness.
3.7.5.1 Recommended Monitoring Points To verify energy savings from natural ventilation, its impact on the entire HVAC system must be measured. In the most comprehensive (and expensive) case, total HVAC system performance is measured through a variety of points. Specific monitoring points for this verification depend on the type of HVAC system, but are likely to include OAT and relative humidity, window contact status (open or closed), cooling electrical power, fan and pump power, and gas usage for heating. The electrical power submetering should meet the following criteria:
• Ability to measure and log real electrical power for an extended time. This offers a more accurate picture of energy use compared to a meter that provides only instantaneous readings.
• Sampling interval of 30 seconds
• Designed for the type of circuit to be metered (e.g., 480 Volt, 20 amp, 60 Hertz)
• Ability to accurately meter loads; rated to meet the load per phase (e.g., 0–80000 Watts)
• Internal clock that timestamps each data point
• UL listing
• Compatibility with the BAS.
Appendix A includes more specifics about temperature and flow rate measurement.
In an existing building, these measurements should be taken both before and after the natural ventilation is implemented. In a new building, these measurements can be taken after construction only; calibrated simulation can then be used to determine verified savings.
Because seasonal temperature variations influence the natural ventilation impact, the monitoring period should be at least 1 year.
35
This report is available at no cost from the National Renewable Energy Laboratory (NREL) at www.nrel.gov/publications.
3.8 Guidance for Analysis If utility bills or submetered HVAC equipment energy use data are available from both before and after natural ventilation is implemented, basic weather normalization and regression analysis can be used to verify energy savings. This simplified analysis has significant sources of error because many assumptions, including identical occupancy patterns between the monitoring periods, must be made.
For new construction projects or existing buildings that have no pre-retrofit data available, calibrated simulation is needed. An experienced energy modeler should use the gathered data to update inputs associated with an annual computer simulation of the building’s energy performance. Additional information about the building’s occupancy schedule, historical weather data, designed envelope, lighting and ancillary HVAC equipment, and controls should be gathered from BAS data, occupant and operator interviews, and design documents to confirm model inputs. Remaining unknown model inputs, such as infiltration rates, are then adjusted so that the simulation predictions match the actual monthly or annual energy performance data. The energy performance from natural ventilation may be predicted by using postconstruction data to calibrate the energy model.
3.8.1 Existing Buildings For existing buildings, the energy savings are determined within the model by comparing the building’s energy performance both before and after the renovation. The gathered data are first used to calibrate the pre- and postrenovation cases of the whole-building model. Once calibrated, the energy performance data from both before and after the renovation are then normalized by factors that affect their performance, such as assuming the same occupancy schedule and typical weather conditions. Once normalized, the energy savings from natural ventilation is determined by taking the difference between energy consumption before and after the retrofit.
3.8.2 New Construction For new construction projects, the model’s proposed case is created and calibrated to the building’s measured energy performance. However, the energy savings calculation is less clearly defined, because no measured baseline data are available. For mixed mode and natural ventilation-only systems, ASHRAE 90.1 Appendix G outlines the energy modeling process for establishing baseline HVAC systems and associated inputs for new construction projects, though aa more typical regional or building type-specific baseline may be justified. Alternatively, for mixed mode ventilation, the baseline may be defined as the mechanical HVAC system without natural ventilation controls.
The baseline and proposed system models should then be normalized using the same occupancy schedules and typical weather conditions. Once normalized, the energy savings from natural ventilation are determined by taking the difference between energy consumption of the two models.
3.9 References and Other Resources A natural choice: lessons learned from low carbon buildings with natural ventilation. The Carbon Trust, 2012. Accessed March 2015: http://www.carbontrust.com/media/81365/ctg048-a-natural-choice-natural-ventilation.pdf.

36
This report is available at no cost from the National Renewable Energy Laboratory (NREL) at www.nrel.gov/publications.
ASHRAE (2013). Standard 55-2013—Thermal Environmental Conditions for Human Occupancy. Atlanta, GA: American Society of Heating, Refrigerating and Air-Conditioning Engineers. Accessed March 2015: http://www.techstreet.com/ashrae/products/1868610.
Borgeson, S. (2008). Occupant Control of Windows: Accounting for Human Behavior in Building Simulation. Berkeley, CA: University of California Center for the Built Environment. Accessed March 2015: http://www.cbe.berkeley.edu/research/window-behavior.htm.
Comité Européen de Normalisation (2007). Standard EN 15251–2007: Indoor environmental input parameters for design and assessment of energy performance of buildings addressing indoor air quality, thermal environment, lighting and acoustics. Accessed March 2015: https://www.cen.eu/Pages/default.aspx.
Emmerich, S.J.; Dols, W.S.; Axley, J.W. (2001). Natural Ventilation Review and Plan for Design and Analysis Tools. Boulder, CO: Architectural Energy Corporation.
Melton, P. (2014). “Natural Ventilation: The Nine Biggest Obstacles and How Project Teams Are Beating Them.” Environmental Building News (23:8). Accessed March 2015: https://www2.buildinggreen.com/article/natural-ventilation-nine-biggest-obstacles-and-how-project-teams-are-beating-them.
Natural ventilation in non-domestic buildings: CIBSE Applications Manual AM10. London, England: The Chartered Institution of Building Services Engineers, 2005.

37
This report is available at no cost from the National Renewable Energy Laboratory (NREL) at www.nrel.gov/publications.
Chapter 4. Efficient Elevators 4.1 Description Elevators are estimated to account for up to 5% of a building’s annual energy use (Kamm 2006). Choosing newer, commercially available efficient elevators can result in decades-long energy savings.
An elevator in a typical commercial building uses about 7,600 kWh/year (Kwatra 2013), and in a typical office building it uses about 5,800 kWh/ year6 (McKenney 2010).
Traditionally, elevators have used hydraulic, geared traction, or gearless traction systems, depending on building height. Buildings with fewer than seven or eight floors have typically used hydraulic elevators; these represent 75% of installed elevators in the United States.7 Medium-rise buildings (with 8 to 24 floors) have used geared traction, and buildings with more than 24 floors have used gearless traction (McKenney 2010). Newer elevator designs feature more efficient gearless traction systems with regenerative drives and numerous other efficient components.
Table 7 shows the energy savings values8 for a new energy-efficient elevator compared to the ASHRAE standard 90.1-2007 baseline, which addresses motor efficiency (and not elevators, specifically).9
Table 7. Efficient Elevators Potential Annual Energy and Cost Savings
Parameter Name Unit Example (low-rise office, new construction)
Electricity saved kWh/floor (6-floor office) 744 Gas saved kBtu/floor (6-floor office) NA Reduction in EUI kBtu/ft2 0.31 Utility bill savings $/floor (6-floor office) $48 Typical capital cost $/floor Not available Typical simple payback years Not available Capital cost 5-year payback $/floor Not available Target incentive $/floor Not available
4.2 Application Elevators are generally replaced on a 20- to 30-year cycle (McKenney 2010), meaning that decisions about elevator efficiency will affect building energy use for decades. Options for reducing elevator energy use fall into two general categories: improving elevator energy efficiency (equipment) and reducing elevator use (behavior).
6 The estimate was taken from an EIA report from 2006 titled 2003 Commercial Building Energy Consumption Survey, DOE/EIA. 7 About 50% of these, however, are in buildings with only a few floors, so the elevators are not used very much. Many of these were put in to comply with the Americans with Disabilities Act (noted in Kamm 2006, from communication with Rory Smith of ThyssenKrupp). 8 The cost savings are based on national average rates of $0.112/kWh, and $0.81/therm. 9 The values in the table are taken from an unpublished case study of the Bullitt Center drafted as part of the CBP program. Although the authors stated ASHRAE 90.1-2007 was used as the baseline, the standard addresses motor, not elevator, efficiency.

38
This report is available at no cost from the National Renewable Energy Laboratory (NREL) at www.nrel.gov/publications.
4.2.1 Equipment Efficiency The relevant factors affecting elevator energy use include:
• Efficiency of the motor and drive components
• Volume of use (number of trips and weight of payloads)
• Efficiency of components that remain powered on when the elevator is not in use
• Ability to go into a standby mode10 when not used for some time.
Elevator efficiency has improved over the years so that even within each drive class (hydraulic, geared traction, or gearless traction) the most efficient elevator uses 30%–40% less energy than the least efficient (Sachs 2005). Modern efficient elevators use combinations of advanced motor and drive technologies such as variable-voltage VFDs, gearless permanent magnet motors, and regenerative drives (Zogg 2009). They also include efficiency improvements in other components, such as machinery, lighting, fans, and associated controls, and decrease the need for mechanical cooling to condition the mechanical room. Furthermore, choosing new traction systems over older hydraulic systems also opens up the possibility of using regenerative drives.
Regenerative drives allow the elevator to generate electricity whenever it is braking (lifting a load lighter than the counterbalance weight or lowering a load heavier than the counterbalance weight). The regenerative drive can generate usable electricity equal to about 25% of the overall energy used by the elevator system (KONE 2013). Elevators with regenerative drives can be 70%–75% more efficient than hydraulic systems, and 50%–60% more efficient than traction two-speed drive systems (KONE 2013; Otis 2014).
The three modes of elevator energy use and estimates for the U.S. elevator population (Zogg 2009) are listed in Table 8.
Table 8. Elevator Modes and Conservation Options
Mode Load (kW)
Hours/year
Energy Use/year (kWh) Options To Conserve
In use 10 300 3,000 Upgrade drive/reduce use
Ready 0.5 7,146 3,573 Efficient lighting/controls for fans and lights/occupancy sensors
Standby 0.25 1,314 329 Efficient lighting/controls for fans and lights/occupancy sensors
Elevator efficiency can be increased further when packages include LED fixtures and occupancy sensors that can put the elevator in standby mode when it is not in use. As shown in Table 8, elevators are in ready mode but not in use nearly all the time. Standby mode uses half the energy that ready mode does; thus, converting more of that time to standby mode would save energy. Adjustments in usage patterns and improvement in component efficiencies may be needed to maximize energy savings.
10 ASHRAE 90.1-2010 includes a section specific to elevators that requires de-energizing lighting and ventilation during standby mode when the elevator is unoccupied with doors closed for more than 15 minutes. Jurisdictions adhering to this standard will require this feature in new elevator installations.
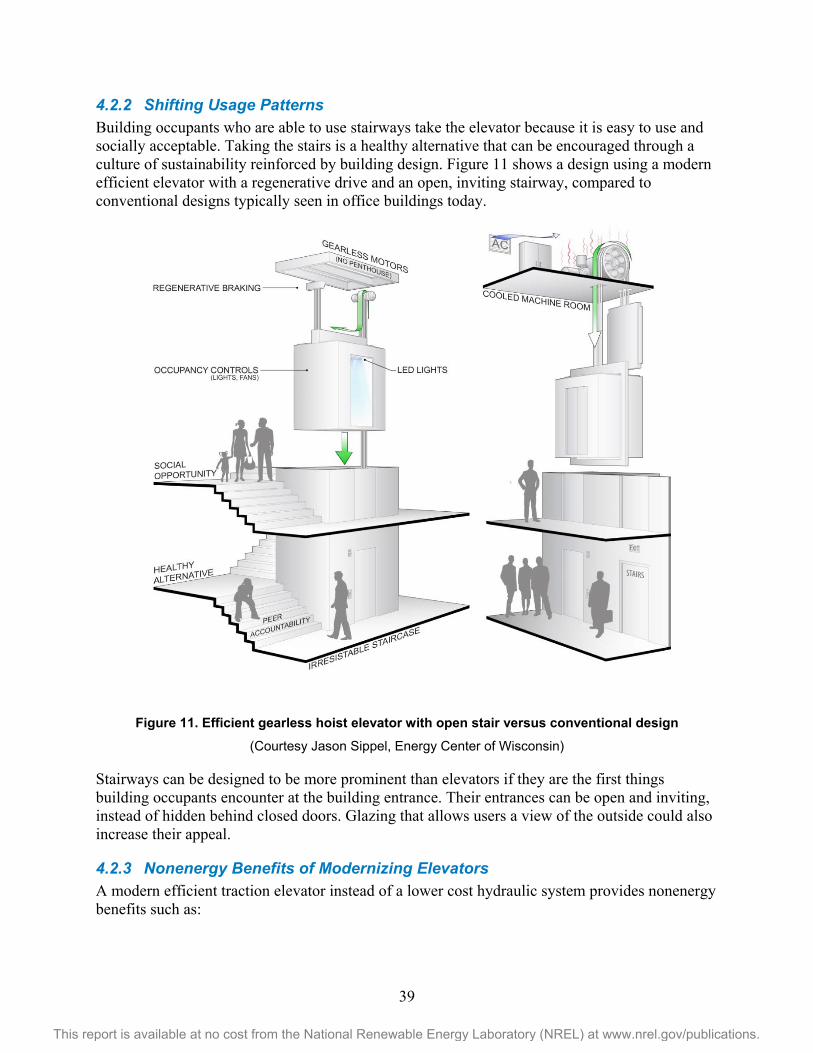
39
This report is available at no cost from the National Renewable Energy Laboratory (NREL) at www.nrel.gov/publications.
4.2.2 Shifting Usage Patterns Building occupants who are able to use stairways take the elevator because it is easy to use and socially acceptable. Taking the stairs is a healthy alternative that can be encouraged through a culture of sustainability reinforced by building design. Figure 11 shows a design using a modern efficient elevator with a regenerative drive and an open, inviting stairway, compared to conventional designs typically seen in office buildings today.
Figure 11. Efficient gearless hoist elevator with open stair versus conventional design
(Courtesy Jason Sippel, Energy Center of Wisconsin)
Stairways can be designed to be more prominent than elevators if they are the first things building occupants encounter at the building entrance. Their entrances can be open and inviting, instead of hidden behind closed doors. Glazing that allows users a view of the outside could also increase their appeal.
4.2.3 Nonenergy Benefits of Modernizing Elevators A modern efficient traction elevator instead of a lower cost hydraulic system provides nonenergy benefits such as:

40
This report is available at no cost from the National Renewable Energy Laboratory (NREL) at www.nrel.gov/publications.
• Avoided need for a control room (typically placed on the roof or taking up usable building space)
• Reduced maintenance
• Improved rider experience (lower noise, less vibration, shorter cycle time)
• Improved options for use of space near the elevator controls due to reduced noise
• Avoided need for hydraulic fluid and constant fluid heating.
4.2.3.1 Low-Rise Office Building Efficient elevators with regenerative drives promise great savings when replacing traditional hydraulic systems used in low-rise office buildings. Manufacturers claim the new systems are 70%–75% more efficient than hydraulic systems.
4.3 Real-World Considerations Multiple established elevator manufacturers use proven technologies in a competitive market for efficient and regenerative drive elevators.
Actual energy savings achieved for elevators is highly dependent on users. As described in Section 4.2.2, stairways could be designed to be more inviting; however, the effectiveness of strategies to modify usage patterns is difficult to predict and is likely very situation specific (i.e., dependent on age, fitness level and inclination of the occupants, the stairwell design, and the number of floors people usually need to travel).
4.3.1 Financial Incentives Few, if any, state or utility programs specifically target efficient elevator purchase. In some locations, this measure could qualify for financial incentives as a “custom” EEM. Examples include:
Hawaii State Commercial Energy Efficiency Rebate Program. Provides incentives for custom efficiency projects based on projected energy and demand savings for new construction and retrofit projects. Projects are evaluated case-by-case and require preapproval.
Illinois ComEd - Smart Ideas for Business Efficiency Program. Provides incentives for custom efficiency projects of up to $0.07/kWh saved annually.
Duke Energy Smart Saver Incentive Program (North Carolina). Provides incentives for custom efficiency projects of up to 75% of the incremental cost. The projects must be preapproved and have a payback period of more than 1 year.

41
This report is available at no cost from the National Renewable Energy Laboratory (NREL) at www.nrel.gov/publications.
4.4 Project Results Developers of the new Bullitt Center in Seattle, Washington, participated in the CBP program. The building design included an efficient elevator with a regenerative drive as part of its plan to be designated a Living Building through the International Living Future Institute’s Living Building Challenge. Figure 12 shows the Bullitt Center building.
The Bullitt Center found a creative way to acquire incentives for its unique energy-saving measures. It partnered with the local utility, Seattle City Light, on a novel variation of a traditional power purchase agreement. The heart of the Metered Energy Efficiency Purchase Agreement is a metering system that estimates the energy savings from the Bullitt Center’s energy efficiency features relative to a dynamic baseline, and the utility pays for the amount of electricity it doesn’t have to deliver because of these improvements. The building investors, not the building owner, sell the efficiency to the utility, and the investor makes rental payments to the owner to use the building as a host for efficiency generation (as a wind power company might pay farmers to put wind turbines on their land). The 20-year purchase agreement treats efficiency like power generated from more traditional sources. It gives the building investor incentives to maintain or increase the efficiency of the building, and the utility remains financially whole despite delivering less electricity to the building. For simplicity, the energy generated from the Bullitt Center’s solar roof is not included in this agreement.

42
This report is available at no cost from the National Renewable Energy Laboratory (NREL) at www.nrel.gov/publications.
Figure 12. Bullitt Center
(Courtesy Nic Lehoux) The building design made the elevator less prominent and required that tenants use a key card to access it. The building also includes a prominently displayed “irresistible stairway,” which offers an attractive design, artwork, and views of the city. Cost information about the elevator and stairway was not available (see Table 9).
Table 9. Efficient Elevator in the Bullitt Center
Category Value Building size (ft2) 50,070 ft2
Project description 6-story commercial office building, new construction project seeking Living Building status
Energy-efficient regenerative elevator Regenerative elevator as part of a suite of EEMs Expected annual energy savings (kWh) 4,461 Expected annual energy cost savings $290 Expected reduction in EUI (kBtu/ft2) 0.31 Annual carbon emissions avoided 3 metric tons CO2e11
4.4.1 Elevator Features The Bullitt Center deployed a modern energy-efficient elevator to serve the six-story office building. In addition to using a regenerative drive system, the elevator also includes an auto-off technology that initiated standby mode during inactive periods (McManus 2012).
11 Greenhouse gas reductions are given in terms of CO2e. For electricity, 0.000692 metric tons CO2e/kWh are assumed to be avoided. For natural gas, 0.006418 metric tons CO2e/therm are assumed to be avoided.
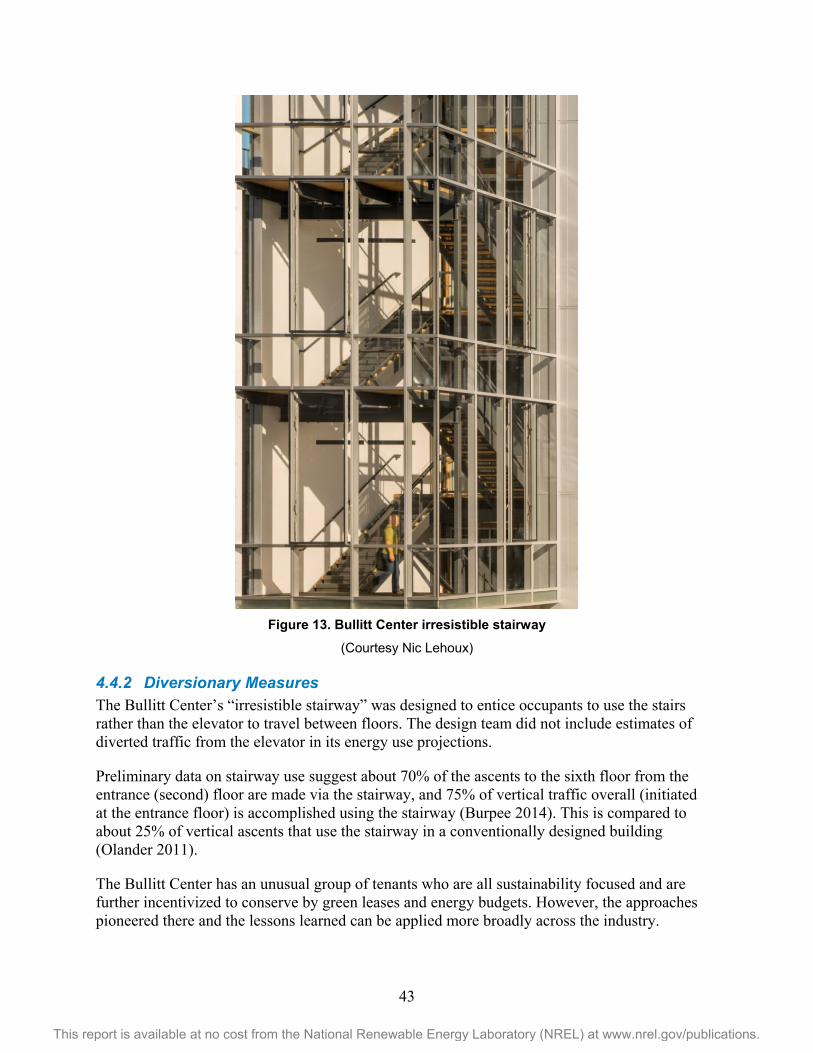
43
This report is available at no cost from the National Renewable Energy Laboratory (NREL) at www.nrel.gov/publications.
Figure 13. Bullitt Center irresistible stairway
(Courtesy Nic Lehoux) 4.4.2 Diversionary Measures The Bullitt Center’s “irresistible stairway” was designed to entice occupants to use the stairs rather than the elevator to travel between floors. The design team did not include estimates of diverted traffic from the elevator in its energy use projections.
Preliminary data on stairway use suggest about 70% of the ascents to the sixth floor from the entrance (second) floor are made via the stairway, and 75% of vertical traffic overall (initiated at the entrance floor) is accomplished using the stairway (Burpee 2014). This is compared to about 25% of vertical ascents that use the stairway in a conventionally designed building (Olander 2011).
The Bullitt Center has an unusual group of tenants who are all sustainability focused and are further incentivized to conserve by green leases and energy budgets. However, the approaches pioneered there and the lessons learned can be applied more broadly across the industry.

44
This report is available at no cost from the National Renewable Energy Laboratory (NREL) at www.nrel.gov/publications.
4.5 Modeling Efficient Elevators Elevators use about 3%–5% of electrical energy in a typical building, but they are often overlooked in energy modeling (ASHRAE 2010). Thus, considering elevators in the building energy model, especially for taller buildings or healthcare applications, is important. In addition to their primary power consumption, they typically add heat, which must be removed by the HVAC system. Elevator power includes the elevator motor and associated lights, fans, and controls.
If multiple elevators in a building have roughly similar usage patterns, they can be modeled as a single elevator. The power input for the modeled elevator would equal the sum of the values for the real elevators. Guidance for modeling elevators in EnergyPlus is provided in Appendix B.
4.6 Ensuring Performance 4.6.1 Installation and Commissioning Elevator installation and commissioning are specialized practices performed by licensed installers who are often affiliated with the manufacturers. Chapter 1 provides information about the general commissioning process.
4.6.2 Controls Programming The building owner and engineer should consider the parameters for control settings (such as putting fans and lights into sleep mode when not in use) and discuss these with the installer for proper programming. Facilities staff should monitor these controls to ensure they continue to function correctly over time.
4.6.3 Measurement and Verification Because elevators are somewhat isolated from other building systems, an isolated metering approach is often used to verify efficient elevator energy savings. Because elevators can affect HVAC energy consumption, a more comprehensive M&V approach should also include whole-building calibrated simulation.
4.6.4 Recommended Monitoring Points If multiple elevators in a building have the same setup, only a few need to be metered. Understanding the energy consumption of elevator carriages involves evaluating power input to the following components: motor, fan, lighting, and associated controls. Elevator components are typically on their own dedicated electrical circuits, simplifying the metering process.
4.6.5 Inexpensive, but Less Accurate, Approach Current transducers installed on individual electrical circuits serving elevators enable continuous monitoring of the electricity current. The voltage and power factor of these circuits should be spot checked during installation, and occasionally thereafter, to confirm their values. Estimates of electrical power and energy may then be calculated from the measured current, as well as spot (one-time) measurements of voltage and power factor.

45
This report is available at no cost from the National Renewable Energy Laboratory (NREL) at www.nrel.gov/publications.
4.6.6 More Complex and Expensive, but Accurate Approach Power meters installed on individual electrical circuits serving elevators enable direct monitoring of real electrical power. This method is more costly and time-consuming to install, but is more accurate because it accounts for the full waveforms of the electrical power. Real power meters should meet the following criteria:
• Sampling interval of 30 seconds
• Designed for the type of circuit to be metered (e.g., 480 Volt, 30 amp, 60 Hertz)
• Ability to accurately meter loads; rated to meet the load per phase (e.g., 0–10,000 Watts)
• Internal clock that timestamps each data point
• UL listing
• Compatibility with the BAS.
4.6.7 Guidance for Analysis Chapter 1 provides information about data management for M&V efforts. Analyzing the data and determining verified energy savings involves different approaches for existing and new construction projects.
4.6.7.1 Existing Buildings For existing buildings, energy performance both before and after replacing the elevators may be measured explicitly. Energy use is then normalized by factors that affect energy performance, such as changes in hours of operation and building occupant density. Once energy use is normalized, the energy savings from this EEM is determined by taking the difference between energy consumption before and after the strategy was initiated.
4.6.7.2 New Construction For new construction projects, the energy performance baseline is less clearly defined, because no measured baseline data are available for comparison; therefore, a theoretical baseline energy consumption must be estimated from other available data. One potential source of baseline information is an existing building used by the people who will be occupying the new building. For the existing building to be a good baseline case, it must be generally the same type of facility and have the same number of floors, because elevator usage varies greatly among different building types. It must also have an elevator system design that is still common today and that could have been implemented in the new building. The elevator power in the baseline building can be monitored before completion of the new construction project. An alternative, and somewhat simpler, option is to develop a baseline energy model by combining manufacturer data for “standard” efficiency elevators with site-specific assumptions about usage patterns.
If possible, energy use should be normalized using the same hours of operation and building occupant density. Once energy use is normalized, the energy savings from using efficient elevators are determined by taking the difference between the energy consumption of the baseline system and that of the efficient system.

46
This report is available at no cost from the National Renewable Energy Laboratory (NREL) at www.nrel.gov/publications.
4.6.8 Occupancy Sensor Failures If the elevator usage appears high during unoccupied periods, the first item to check is how the lights and fans are controlled. If the lights are controlled by occupancy sensors, the sensor function should be verified. Occupancy sensors fail in the “on” mode, meaning that the lights controlled by them will remain on if the sensors faulty.
4.7 References and Other Resources ASHRAE (2012). Standard 90.1-2010 User’s Manual. Atlanta, GA: American Society of Heating, Refrigerating and Air-Conditioning Engineers. Accessed March 2015: https://www.ashrae.org/resources--publications/bookstore/standard-90-1-document-history#2010UM.
Deru, M.; Field, F.; Studer, D.; Benne, K.; Griffith, B.; Torcellini, P.; Liu, B.; Halverson, M.; Winiarski, D.; Rosenberg, M.; Yazdanian, M.; Huang, J.; Crawley, D. (2011). U.S. Department of Energy Commercial Reference Building Models of the National Building Stock. NREL/TP-5500-46861. Golden, CO: National Renewable Energy Laboratory. Accessed March 2015: http://www.nrel.gov/docs/fy11osti/46861.pdf.
DOE (2014). Database of State Incentives for Renewables and Efficiency. Washington, DC: U.S. Department of Energy. Accessed March 2015: http://www.dsireusa.org.
“Gen2: All you need is a hoistway.” Otis Elevator Company, 2014. Accessed March 2015: http://www.otis.com/site/us/OT_DL_Documents/OT_DL_DownloadCenter/Gen2%C2%AE%20-%20Product%20Information/Gen2_brochure_2014.pdf.
Kamm, K. (2006). Going Up? New Technologies Raise Elevator Efficiency. ER-06-2, E Source.
Kwatra, S.; Amann, J.; Sachs, H. (2013). Miscellaneous Energy Loads in Buildings. Report Number A133. American Council for an Energy Efficient Economy. Accessed March 2015: http://www.aceee.org/sites/default/files/publications/researchreports/a133.pdf.
Lichtman, F. One Step to Combat Obesity: Make Stairs More Attractive. NPR News, 2014. Accessed March 2015: http://breakthroughs.kera.org/npr_pull_post_type/one-step-to-combat-obesity-make-stairs-more-attractive/.
Living Building Challenge. International Living Future Institute, 2015. http://living-future.org/lbc.
McKenney, K.; Guernsey, M.; Ponoum, R.; Rosenfeld, J. (2010). Commercial Miscellaneous Electric Loads: Energy Consumption Characterization and Savings Potential in 2008 by Building Type. Final report by TIAX LLC, Lexington, MA. Washington, DC: U.S. Department of Energy Building Technologies Program. Accessed March 2015: http://www.zeroenergycbc.org/pdf/2010-05-26%20TIAX%20CMELs%20Final%20Report.pdf.
McManus, L. (2012). “KONE Plays a Part in Making the Bullitt Center 100% Carbon-Neutral.” People Flow Magazine. Accessed March 2015: http://www.kone.com/shared/people-flow-magazine/2012-2/files/assets/basic-html/page9.html.

47
This report is available at no cost from the National Renewable Energy Laboratory (NREL) at www.nrel.gov/publications.
Olander, E.; Eves, F. (2011). “Elevator Availability and Its Impact on Stair Use in a Workplace.” Journal of Environmental Psychology (31), 200–206.
Options for Elevators: KONE Eco-efficientTM Solutions. KONE, Inc., 2013. Accessed March 2015: http://cdn.kone.com/www.kone.us/Images/kone-eco-efficient-solutions-for-elevators.pdf?v=2.
Sachs, H.M. (2005). Opportunities for Elevator Energy Efficiency Improvements. Washington, DC: American Council for an Energy-Efficient Economy. Accessed March 2015: https://www.aceee.org/files/pdf/white-paper/elevators2005.pdf.
Sniderman, D. (2012). Energy Efficient Elevator Technologies. American Society of Mechanical Engineers. Accessed March 2015: https://www.asme.org/engineering-topics/articles/elevators/energy-efficient-elevator-technologies.
Zogg, R.; Goetzler, W.; Ahlfeldt, C.; Hiraiwa, H.; Sathe, A.; Sutherland, T. (2009). Energy Savings Potential and RD&D Opportunities for Commercial Building Appliances. Work Performed by Navigant Consulting, Inc., Chicago, IL. Washington, DC: US Department of Energy, Building Technologies Program. Accessed March 2015: http://apps1.eere.energy.gov/buildings/publications/pdfs/corporate/commercial_appliances_report_12-09.pdf.

48
This report is available at no cost from the National Renewable Energy Laboratory (NREL) at www.nrel.gov/publications.
Chapter 5. Office Plug Load Reduction 5.1 Description Plug loads make up approximately 28% of all the energy used in office buildings in the United States (McKenney 2010). Plug loads in an office are made up of a wide variety of devices. The biggest energy users are (in descending order): computers, monitors, printers, vending machines, multifunction devices, TVs, microwaves, coffee makers, and copiers.
The number of these devices and their energy usage are expected to grow rapidly, but most energy codes and other requirements do not significantly regulate these plug loads. Even as commercial buildings become more efficient, through either high-performance design or energy retrofits, plug loads pose an increasing challenge to achieving energy performance targets. To address this challenge, several plug load reduction strategies can be effective in office buildings. Several participants in the CBP program considered some type of plug load control strategy for their buildings with office space.12
5.2 Strategies Office plug load reduction strategies are applicable to nearly every commercial building, because even buildings that are not primarily offices (including warehouses, hospital, and retail stores) have office spaces with office equipment. These strategies13 fall into three categories:
• Removing or replacing old or duplicative equipment
• Using office-wide and/or local control strategies
• Actionable feedback on individual plug load energy use.
Table 10 shows a range of estimated savings14 possible from implementing a mix of plug load control strategies. Replacing computers and monitors with ENERGY STAR® equipment and implementing some additional power management yielded savings of approximately 0.7 kWh/ft2/year. Annual savings increased to 2.5 kWh/ft2 when a more substantial control plan that included providing feedback to users to encourage behavior modification accompanied the equipment replacement. These values are a significant fraction of building electricity load, considering that most buildings use 10–15 kWh/ft2/year.
12 Two of these projects were the Bullitt Center in Seattle and the Alliance Center in Denver. 13 These strategies do not address energy use from information technology equipment in server rooms. For more information on managing server room equipment energy use, see Assessing and Reducing Plug and Process Loads in Office Buildings, NREL (2013) or Managing Your Office Equipment Plug Load, New Buildings Institute (2012). 14 The cost savings are based on national average rates of $0.112/kWh, and $0.81/therm.

49
This report is available at no cost from the National Renewable Energy Laboratory (NREL) at www.nrel.gov/publications.
Table 10. Estimated Annual Savings From Plug Load Control Strategies
Parameter Name Unit Basic Strategies Advanced Strategies Electricity saved kWh/ft2 0.65 2.5 Gas saved15 Therms/ft2 0 0 Reduction in EUI kBtu/ft2 2.2 8.5 Utility bill savings $/ft2 $0.074 $0.28 Typical capital cost $/ft2 $0.48 $1.25 Typical simple payback Years 6.1 4.5 Capital cost 5-year payback $/ft2 $0.37 $1.40 Target incentive $/ft2 $0.11 Not applicable
5.2.1 Removal or Replacement The simplest avenue for reducing plug load usage is to remove unnecessary energy-using equipment, or replace it with equipment that uses less energy. For example:
• Reducing redundant equipment that can be shared (e.g., printers, refrigerators)
• Replacing inefficient equipment
• Instituting a targeted procurement policy and switching to:
o ENERGY STAR equipment
o Laptop computers (instead of desktop models)
o Inkjet printers (instead of laser printers)
o LED task lights
o Noncooled water fountains
o Larger (and fewer) refrigerators (no mini-refrigerators)
o Voice-over Internet Protocol (VoIP) phones
o Mini-desktop computers
o LED TVs.
• Selecting electronics and kitchen equipment with low parasitic load. Alternatively, adding a timer to the device.
15 Gas use could increase slightly for buildings with gas-based zone heating; the examples chosen for this table did not have this feature.

50
This report is available at no cost from the National Renewable Energy Laboratory (NREL) at www.nrel.gov/publications.
5.2.2 Control Control strategies for reducing plug load energy use can be implemented office wide and locally on individual devices. These strategies are designed to control the equipment so that it uses energy when needed and powers down or turns off when not in use. They are implemented via power management systems and using timers and/or smart strips to turn equipment off.
5.2.2.1 Office-Wide Strategies Controls can be implemented globally across an entire office. Strategies that fit into this category include:
• Network-level computer power settings • Timers at the circuit level • Security system-based computer or equipment settings • Retuning of HVAC to eliminate space heaters or fans being used for comfort.
Figure 14. Smart outlets can monitor equipment power consumption and automatically turn equipment off when not in use
(Courtesy www.thinkecoinc.com/)
CBP project teams focused on removal and replacement strategies for reducing plug load energy use. These strategies included:
• Purchasing ENERGY STAR equipment, • Adopting ENERGY STAR purchasing policies • Using only liquid crystal display flat-screen monitors
Replacing all desktop computers with laptops and removing all personal printers, faxes, and scanners from the office (relying solely on centralized, networked equipment) are options that can extend energy savings; however, the cost implications of replacing existing equipment with laptops and impact on operations of using shared centralized equipment should be considered.

51
This report is available at no cost from the National Renewable Energy Laboratory (NREL) at www.nrel.gov/publications.
5.2.2.2 Local and Device-Level Strategies Controls can be implemented on individual pieces of equipment. Strategies that fit into this category include:
• Plugging equipment into advanced power strips APSs that automatically shut off supply power to unused appliances
• Using timers to turn equipment off
• Employing occupancy sensor-enabled plugs or power strips
• Adjusting individual computer settings
• Reducing monitor brightness (including controlling glare so monitor brightness can be lowered)
• Adjusting individual imaging equipment settings.
Wireless communications and controls with “plug and play” installation make controlling plug load energy use easier in some cases; however, tradeoffs need to be considered. Wireless connectivity requires establishing, verifying, and maintaining a wireless connection. Some wireless devices will require batteries, which need to be maintained.
5.2.3 Behavior and Feedback Providing occupants with behavioral prompts—or even direct training—is one path to reducing plug load consumption. Strategies that fit in this category include:
• Power meter distribution (loan power meters to departments or individuals)
• Plug-load champion/sustainability officer training
• Behavior campaign/training
• Competitions
• Efficient procurement
• Active training with feedback
• Office-wide policy on personal devices
• Permanent building performance M&V
• Plug load audits.
CBP project teams applied office-wide and local control strategies to manage plug load energy use. The Bullitt Center in Seattle and the Alliance Center in Denver use centrally configured APSs to manage many local devices. These APSs have both load-sensing and scheduling capabilities and allow occupants to monitor their plug load energy use via a Web-based dashboard.

52
This report is available at no cost from the National Renewable Energy Laboratory (NREL) at www.nrel.gov/publications.
Figure 15. Energy dashboard provides building occupants with information on energy use (Bullitt Center dashboard: http://www.bullittcenter.org/building/dashboard/)
5.2.4 Real World Considerations Plug load control strategies succeed when building owners, tenants and occupants (or their representatives) are fully involved in their selection and implementation. These strategies must account for occupant values, business requirements, flexibility, and building operation protocols.
5.2.4.1 Best Practices for Implementing Plug Load Control Strategies Reducing plug load energy use is as much about planning and implementing a process as it is about implementing technologies. A successful process includes:
• Establishing a “plug load champion”
• Institutionalizing plug load measures
• Benchmarking equipment and operations. This includes performing a walk-through audit, developing a metering plan, and selecting a plug load power meter.
• Developing a business case for addressing plug loads
• Identifying occupants’ true needs
• Meeting needs efficiently
• Reducing or eliminating energy use during nonbusiness hours
• Addressing unique plug loads
• Promoting occupant awareness
• Including plug load control in the design phase of a new construction project.

53
This report is available at no cost from the National Renewable Energy Laboratory (NREL) at www.nrel.gov/publications.
See NREL (2013).
5.2.4.2 Financial Incentives Reducing plug load energy use has become a focus of energy-saving efforts in recent years. Rebates are available from some utilities for the purchase of APSs, but widespread programs and incentives are not yet available.
5.3 Project Results The Alliance Center (Figure 16 and Table 11) is the headquarters for the Alliance for Sustainable Colorado and sustainability-focused tenant/partner organizations. The Alliance participated in the CBP program to analyze EEMs for renovating its 100-year-old warehouse building. The Alliance envisions a living example of collaboration and sustainability at work. A significant part of the building is cooperative office and collaboration space, and is not held by any one tenant.
Figure 16. Alliance Center in Denver, Colorado
(Courtesy Alliance for Sustainable Colorado)
Simple payback for the Alliance Center’s approach is quite long because the Alliance took an aggressive and thorough approach, employing basic smart procurement and power management as well as more advanced submetering, plug load control, and feedback mechanisms to maximize savings. The more basic measures can be expected to pay back in less than 5 years. The more advanced plug load automation can still be costly in what is a nascent market. Payback can also be improved by considering the impact of efficient plug loads on other systems (see Chapter 1). If the mechanical engineer, for example, accounts for a significant reduction in plug loads, there is potential to reduce the size and cost of HVAC equipment. Additionally, efficient plug load strategies will often save overall floor space in office design.

54
This report is available at no cost from the National Renewable Energy Laboratory (NREL) at www.nrel.gov/publications.
Table 11. Plug Load Reduction in the Alliance Center Renovation
Project Alliance Center Renovation, Denver, Colorado Building size (ft2) 38,000
Project description Renovation of a 100-year-old warehouse building into an energy efficient, multitenant office building
Plug load reduction
• Lease includes plug load standards; for example: - No space heaters allowed - All new equipment must be ENERGY STAR - Equipment must be turned off at night
• Plug loads are submetered; feedback is provided • Specific plug loads are monitored and turned off at night • Shared equipment is purchased and managed centrally
Expected annual energy savings 43,700 kWh Expected annual energy cost savings $4,789 EEM cost $47,500 Reduction in EUI (kBtu/ft2) 3.9 kBtu/ft2/yr Cost of conserved energy $0.11/kWh Simple payback 10 years Annual carbon emissions avoided 30 metric tons CO2e16 5.4 Lessons Learned From Commercial Building Partnerships
Projects Several CBP projects addressed plug load in their EEM analyses. The lessons learned from these projects include:
• Consider nonenergy impacts (benefits and drawbacks) of plug load strategies. A big-box retailer identified a potential for significant savings in replacing desktop computers with laptops, but did not implement this strategy because it wasn’t a good fit with its operations. For some businesses, though, this strategy could be a benefit, enabling employees to work from home or take their computers with them when they travel.
• Employ green leases in multitenant buildings to ensure tenants help meet overall energy performance goals. A green lease is an agreement between the building owners and tenants that obligates both parties to minimize environmental impact.17 Tenants at the Bullitt Center in Seattle and the Alliance Center in Denver sign green leases.
• Regular communication with tenants is critical to achieving goals, even with green leases. At the Alliance Center, building manager Jason Page remarked, “A lot of occupant engagement has been helpful…working alongside tenants, talking to them, listening to them.”
• Concerns about cybersecurity can be a hurdle for implementation of submetering, dashboards, or even some network-based plug load management programs. To mitigate these issues, owners and operators should engage information technology (IT) personnel early in the planning of measurement and feedback mechanisms. Strategies will vary
16 Greenhouse gas reductions are given in terms of CO2e. For electricity, 0.000692 metric tons CO2e/kWh are assumed to be avoided. For natural gas, 0.006418 metric tons CO2e/therm are assumed to be avoided. 17 The Green Lease Library is a collaborative, open-source collection of green lease language and information available for anyone who needs help getting started.
55
This report is available at no cost from the National Renewable Energy Laboratory (NREL) at www.nrel.gov/publications.
from owner to owner, but generally the concerns can be overcome with this type of communication.
5.5 Modeling of Plug Load Savings Plug load energy consumption in energy models must be accurately represented to capture its impact on HVAC system loads, the overall energy consumption of the building, and the business case for EEMs to reduce plug and process load energy consumption. Plug loads for offices can be represented by modeling individual devices and their respective wattages: each monitor, personal computer, copier, etc. But this approach is generally not worth the time invested (unless the office is small, or equipment is repetitive from space to space), and most office models can be accurately represented with a plug load density, in W/ft2. Guidance for modeling plug loads in EnergyPlus is provided in Appendix B.
5.5.1 OpenStudio Guidance Plug loads are supported in OpenStudio; a variety of ASHRAE Standard baseline plug load densities are available as a default. Furthermore, the Building Component Library contains many individual plug load devices, as well as packaged plug load measures, all of which are ready to be integrated directly into an OpenStudio model. The components include office and medical plug load devices, from personal computers to vending machines to magnetic resonance imaging machines. The measures include Advanced Energy Design Guide-compliant plug load levels, as well as measures for reducing plug loads by percentage, and reducing plug load usage during unoccupied periods.
5.6 Ensuring Performance Ensuring that plug load management strategies remain in place and continue to be effective requires management involvement and oversight. In many cases for measures that are not “hard-wired,” a designated plug load champion or some other individual will need to verify that the solutions are still being employed and are working according to design.
5.6.1 Installation 1. The electrical engineer designs hard-wired controls as well as hard-wired monitoring and
control into the electrical power design of the project.
2. Procurement and IT staff coordinate with hardware and software manufacturers and/or vendors to ensure that plug load control technology installation meets product specifications.
3. IT staff coordinate implementation of computer power management and ensures that settings persist. IT staff also coordinates any security access required for all measures.
4. Procurement and IT staff institutionalize an energy-efficient equipment purchasing policy, including products such as coffee makers brought in by third-party vendors.
5. Office management keeps occupants informed about plug load management strategies and oversees implementation of any behavior change efforts, and ensures no negative impact on workers’ productivity.

56
This report is available at no cost from the National Renewable Energy Laboratory (NREL) at www.nrel.gov/publications.
6. The plug load champion works with management to keep staff on task to reduce plug loads. The plug load champion may also need to monitor any M&V or feedback data available, or ensure that the feedback is being seen by pertinent building occupants.
5.6.2 Commissioning See Chapter 1 for information about the general commissioning process.
Commissioning authorities should ensure that all technical plug load reduction strategies operate according to requirements, submetering is in place, data points are correctly labeled, and the labels are transferred into the data management program.
5.6.3 Controls Programming IT administrators have many controls options, including network and local controls. IT staff should coordinate with management and occupants to ensure that local control settings (power management, APSs, and sensors) are adjusted to work habits and schedules. IT staff monitor local controls to ensure they persist over time (specifically the status of personal computers throughout the day—on, off, sleep, hibernate, etc.). IT staff cannot assume that users won’t adjust them.
5.6.4 Operation Plug load devices and the EEMs employed to reduce their energy usage do not fall into the traditional realm of building operations the way HVAC or lighting do. Most likely a designated plug load champion, a staff person, or IT staff member (and not facility operations staff member) will verify periodically that the measures are operating properly.
Multitenant buildings pose a unique challenge to ensuring plug load reduction measures are implemented and maintained. Some creative methods may be needed.
• Green leases. Require tenants to follow guidelines such as shutting down all equipment at night (when the office is not occupied), minimizing the use of space heaters, and purchasing ENERGY STAR office equipment. The strategy could include an energy budget based on the average use in the building with a monetary bonus or penalty for using less than or more than the baseline.
• Plug load management policy. Formalize plug load energy use reduction through a building management policy that minimizes or eliminates individual tenants’ use of coffee makers, fans, heaters, mini-refrigerators, decorative lighting, etc. The building manager needs to provide for adequate shared resources (including effective heating and cooling) to meet equivalent comfort and convenience needs.
• Provide tenants with equipment guidelines for energy-efficient workstations, kitchen, and copy room equipment, and APSs to meter, monitor and manage energy use.
• Offer shared resources—printers, copiers, kitchen facilities.
• Implement rigorous M&V procedures that include submetering and use of wireless communicating power strips and other technology to allow for nighttime power management throughout the whole building. Provide usage feedback to tenants.

57
This report is available at no cost from the National Renewable Energy Laboratory (NREL) at www.nrel.gov/publications.
5.6.5 Occupant Behavior Reducing plug load energy use is more connected to occupant behavior than many other energy improvement strategies. Ensuring success means actively including and engaging with building occupants and equipment users. Steps may include:
• Management communicates the importance of plug load energy reduction strategies and their outcomes to occupants. Employee awareness of these efforts can be ensured through:
o Informational letters
o Emails
o Signage
o Videos
o Periodic reminders or updates.
• Management develops and implements training necessary for occupants to understand and interact with the EEMs.
• Plug load champion serves as primary source of communication for occupants, routing issues to the proper individual(s) for resolution and—at a high level—generally ensuring EEMs are effective without causing loss of productivity.
5.6.6 Measurement and Verification See Chapter 1 for information about the general M&V process. An isolated metering approach is often used to verify plug load energy savings. However, because reduced plug loads can affect HVAC energy consumption, a more accurate, but more expensive, approach would also include whole-building calibrated simulation.
5.6.6.1 Recommended Monitoring Points Developing an M&V plan for plug load devices involves specifying measurements at the deepest level of granularity allowed in the budget. Clever design can accomplish this efficiently; for example, if every workstation has the same setup, few stations need to be metered.
5.6.7 Inexpensive, but Less Accurate, Approach This approach involves continually measuring electrical current over the entire M&V period by installing current transducers on individual electrical circuits serving plug loads. Voltage and power factor of these circuits must be spot checked during installation, and occasionally thereafter, to confirm their values. Current measurements may be substituted for real power measurements of basic electronics (computers, TVs, resistance heat, etc.), because their voltage and power factors change very little over time. Electrical power and energy may be calculated from the current data and spot (one-time) measurements of voltage and power factor.
5.6.8 More Complex and Expensive, but Accurate Approach This approach involves continually measuring real electrical power by installing power meters on individual electrical circuits serving plug loads. This method is more resource intensive, but

58
This report is available at no cost from the National Renewable Energy Laboratory (NREL) at www.nrel.gov/publications.
more accurate because it accounts for the full waveforms of the electrical power. Real power meters should meet the following criteria:
• Ability to measure and log 1 week of electrical power (Watts) data. This offers a more accurate picture of energy use compared to a meter that provides only instantaneous readings.
• Sampling interval of 30 seconds
• Designed for the type of circuit to be metered (e.g., 120 Volt, 15 amp, 60 Hertz)
• Ability to accurately meter loads; rated to meet the load per phase (e.g., 0–1800 Watts)
• External display
• Internal clock that timestamps each data point
• UL listing
• Ability to download stored data.
5.6.8.1 Short-Term Metering If long-term or permanent metering is not possible, short-term metering can be deployed to determine plug load energy usage for a given period of time (see Figure 17). This is typically done by installing a plug pass-through power meter on individual devices between the device and the wall outlet for some period of time (at least 2–3 weeks is recommended to account for diversity in occupancy).
Figure 17. Temporary metering of a plug load device
(Courtesy Scott Schuetter, Energy Center of Wisconsin) When installing temporary metering, follow these steps:
1. Assure the users that the purpose of the metering effort is to gather data about the building’s energy performance, and not to monitor their personal or business activities.
2. Wait until nonbusiness hours to install the meter if it is likely to disrupt business operations.

59
This report is available at no cost from the National Renewable Energy Laboratory (NREL) at www.nrel.gov/publications.
3. Install any necessary computer software to configure the meter and download the measured data later for analysis, if applicable.
4. If possible, set up the meter to measure electrical power at a sampling interval of 30 seconds. However, intervals as long as 15 minutes are acceptable. Clear the memory on the meter before installation and go through any other initial setup, such as setting the date and time.
5. Power down and unplug the device to be metered, plug the device into the meter, plug the meter into an outlet, and power on the device.
6. Meter the device all day, every day for at least 1 entire work week. Time and budget permitting, meter for longer periods for more accurate annual energy use estimates and to capture seasonal use patterns.
7. Download the metered data for analysis. Calculate the average load during business and nonbusiness hours. Web-enabled software is becoming available that automates these latter stages, but older devices have limited data analysis capabilities.
5.6.9 Guidance for Analysis See Chapter 1 for more information about data management for M&V efforts.
5.6.9.1 Existing Buildings For existing buildings, energy performance both before and after initiating plug load reduction strategies may be measured explicitly. The energy from both periods is then normalized by factors that affect their performance, such as changes in occupancy patterns, number or type of plug load devices, and variations in the number or frequency of occupants using a piece of equipment. Once normalized, the energy savings from plug load reduction strategies are determined by taking the difference between energy consumption both before and after the strategy was initiated.
5.6.9.2 New Construction For new construction projects, the energy savings calculation is less clearly defined, because no measured baseline data are available for comparison. Simple spreadsheet models can be used to approximate the theoretical energy consumption of a baseline case versus the measured case. This method must account for both plug load power and operating schedule. One source for baseline plug load power is COMNET’s Commercial Buildings Energy Modeling Guidelines and Procedures (COMNET 2013). Another source is any existing facilities or operations that the building owner or tenant has (generally for new construction the occupants will be moving or expanding from existing facilities). The plug loads of these facilities can be monitored before the new construction project is completed, and the monitored data from these facilities can be used to establish the before-upgrade condition for the energy savings calculation. NREL used this strategy for its Research Support Facility. This successfully reduced plug loads in the new space, and provided a robust method for tracking the savings from its old operations to new operations.

60
This report is available at no cost from the National Renewable Energy Laboratory (NREL) at www.nrel.gov/publications.
5.7 References and Other Resources Commercial Energy Services Network MGP Manual: Modeling Guidelines & Procedures. Commercial Energy Services Network, 2013. Accessed March 2015: http://comnet.org/download-pdfs-mgp-manual.
Green Lease Library. Accessed November 2014: http://www.greenleaselibrary.com/.
Lobato, C.; Pless, S.; Sheppy, M.; Torcellini, P. (2011). “Reducing Plug and Process Loads for a Large Scale, Low Energy Office Building: NREL’s Research Support Facility.” Preprint. Presented at the ASHRAE Winter Conference, Jan. 29-Feb. 2, 2011; 13 pp. Accessed March 2015: http://www.nrel.gov/sustainable_nrel/pdfs/49002.pdf.
McKenney, K.; Guernsey, M.; Ponoum, R.; Rosenfeld, J. (2010). Commercial Miscellaneous Electric Loads: Energy Consumption Characterization and Savings Potential in 2008 by Building Type. Final report prepared by TIAX LLC, Lexington, MA. Washington, DC: U.S. Department of Energy Building Technologies Program, 2010. Accessed March 2015: http://www.zeroenergycbc.org/pdf/2010-05-26%20TIAX%20CMELs%20Final%20Report.pdf.
Plug Load Best Practices Guide: Managing Your Office Equipment Plug Load. New Buildings Institute, 2013. Accessed March 2015: http://newbuildings.org/plug-load-best-practices-guide.
Lobato, C.; Sheppy, M.; Brackney, L.; Pless, S.; Torcellini, P. (2012). Selecting a Control Strategy for Plug and Process Loads. Golden, CO: National Renewable Energy Laboratory, 2012. NREL/TP-5500-51708. Accessed March 2015: http://www.nrel.gov/docs/fy12osti/51708.pdf.
Sheppy, M.; Lobato, C.; Pless, S.; Polese, L.G.; Torcellini, P. (2013). “Assessing and Reducing Plug and Process Loads in Office Buildings.” Golden, CO: National Renewable Energy Laboratory. NREL/FS-5500-54175. Accessed March 2015: http://www.nrel.gov/docs/fy13osti/54175.pdf
Snell, E. Plugging the Plug Load Data Hole. E-Source, 2014. Accessed March 2015: http://esource.com/.
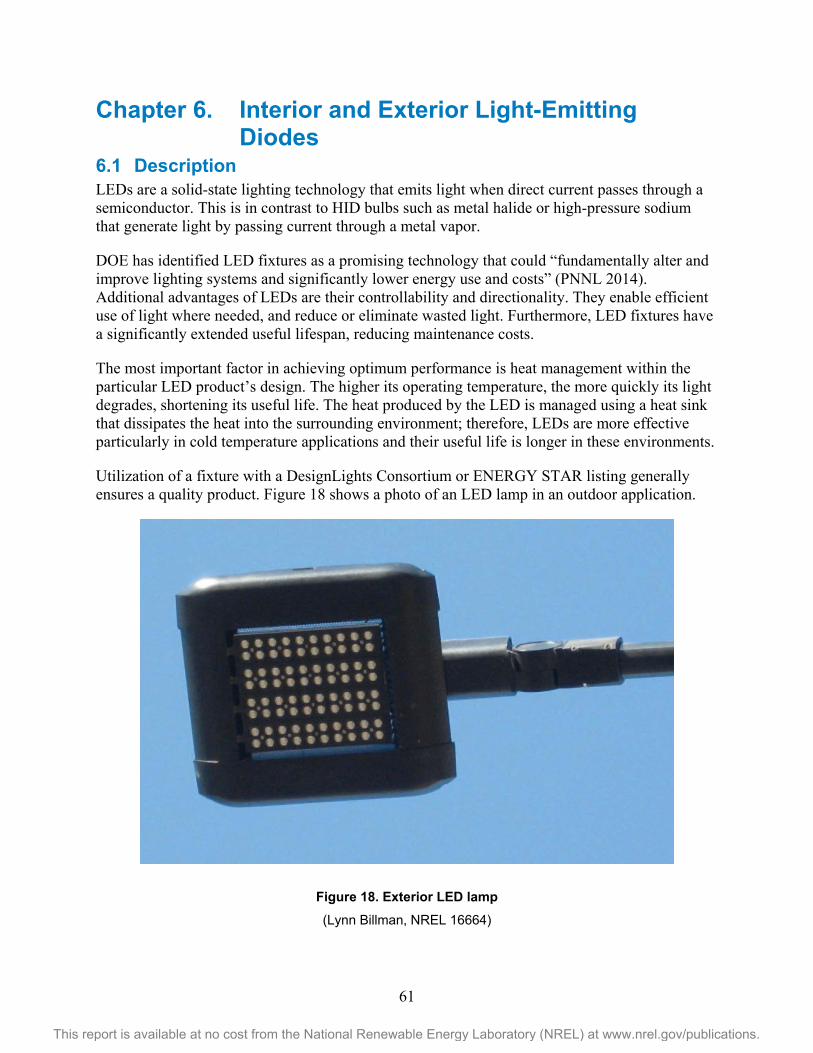
61
This report is available at no cost from the National Renewable Energy Laboratory (NREL) at www.nrel.gov/publications.
Chapter 6. Interior and Exterior Light-Emitting Diodes
6.1 Description LEDs are a solid-state lighting technology that emits light when direct current passes through a semiconductor. This is in contrast to HID bulbs such as metal halide or high-pressure sodium that generate light by passing current through a metal vapor.
DOE has identified LED fixtures as a promising technology that could “fundamentally alter and improve lighting systems and significantly lower energy use and costs” (PNNL 2014). Additional advantages of LEDs are their controllability and directionality. They enable efficient use of light where needed, and reduce or eliminate wasted light. Furthermore, LED fixtures have a significantly extended useful lifespan, reducing maintenance costs.
The most important factor in achieving optimum performance is heat management within the particular LED product’s design. The higher its operating temperature, the more quickly its light degrades, shortening its useful life. The heat produced by the LED is managed using a heat sink that dissipates the heat into the surrounding environment; therefore, LEDs are more effective particularly in cold temperature applications and their useful life is longer in these environments.
Utilization of a fixture with a DesignLights Consortium or ENERGY STAR listing generally ensures a quality product. Figure 18 shows a photo of an LED lamp in an outdoor application.
Figure 18. Exterior LED lamp
(Lynn Billman, NREL 16664)

62
This report is available at no cost from the National Renewable Energy Laboratory (NREL) at www.nrel.gov/publications.
6.2 Application 6.2.1 Internal Light-Emitting Diodes Nearly every lighting application in commercial buildings, including task lighting and overhead lighting, can be retrofitted with LED fixtures. LEDs are particularly well suited to high-bay overhead applications such as in big-box retail stores, warehouses, and manufacturing facilities. Their long useful life and inherent dimmability contribute to their success in high-bay applications, especially when utilizing daylighting strategies.
Typical costs18 and potential energy savings for high-bay applications differ depending on the lighting technology the LED replaces. Typical values for LED replacement of fluorescent and HID fixtures are shown in Table 12. The fluorescent to LED case includes a cost benefit for maintenance reduction using a group relamping methodology; fluorescent lamps have substantially shorter lives than LED luminaires, and replacement is costly in large, high-bay spaces. This cost should be taken into account when considering paybacks. Additionally, the economics of replacing fluorescent fixtures with LEDs improve substantially when controls are incorporated into the lighting design.
Table 12. Typical Annual Energy and Cost Savings for Internal LED Applications
Parameter Unit Fluorescent to LED HID to LED Electricity saved kWh/ft2 0.25 2.2 Reduction in EUI kBtu/ft2 0.9 7.5 Utility bill savings $/ft2 $0.028 $0.25 Typical capital cost $/ft2 $0.37 $0.48 Typical simple payback Years 13.2 1.9 Capital cost for 5-year payback $/ft2 $0.14 $1.23 Target incentive $/ft2 $0.23 n/a
Figure 19. LED-illuminated refrigerated display cases
(Pat Corkery, NREL 15789)
18 The cost savings are based on national average rates of $0.112/kWh, and $0.81/therm, assuming 6,500 annual operating hours.

63
This report is available at no cost from the National Renewable Energy Laboratory (NREL) at www.nrel.gov/publications.
6.2.1.1 Supermarkets or Big-Box Stores LEDs can be used throughout a grocery store and other big-box retail stores. LED fixtures offers several advantages:
• Reduced interruption to normal operation because of extended lifespan
• Better capability of directing the light so it illuminates only what needs to be illuminated
• Easily adapted to lighting reduction control strategies, increasing rather than decreasing fixture lifespan
• Less light-induced deterioration of products (food and fabric) compared to incandescent or fluorescent lamps, because LEDs emit little infrared or ultraviolet light
Unlike fluorescent lamps, LEDs become more efficient in cold temperatures, making them an ideal selection for refrigerated display cases. Additional benefits include:
• Reduced stray light and glare, allowing shoppers to focus on the merchandise
• Wide dimming range allowing integration with controls for increased energy savings; long life reduces maintenance and lamp disposal costs.
Figure 20. High bay LED in a warehouse
(Courtesy Adam McMillen, Energy Center of Wisconsin) 6.2.1.2 Warehouse/Cold Storage High Bay Lighting Storage areas that are designed to be kept at cold temperatures offer a unique and cost-effective opportunity for LEDs. To date, the mainstay of industrial lighting have been traditional HID and high-intensity fluorescent lighting fixtures. HID performs well in a cold environment but energy consumption is more than double that required by LED for equal light output. High-intensity fluorescents suffer from lumen depreciation in cold environments, contributing to reduced operational efficiency, whereas LED fixtures performance improves in colder temperatures. LEDs emit minimal heat, can be cycled on and off frequently without an impact on the longevity of the lamp, and, when turned on, instantly return to full light intensity. LEDs’ longer life

64
This report is available at no cost from the National Renewable Energy Laboratory (NREL) at www.nrel.gov/publications.
translates into operational savings for the building owner. The savings are even greater when coupled with control strategies that turn on lights only when a building or room is occupied.
Warehouse environments, even when not used for cold storage, remain an ideal application for LED fixtures because of their typically long hours of operation inherent to the facility type which are the norm even when coupled with automatic shutoff controls. Savings from the reduced power required by LED over fluorescent are quickly magnified by the long hours of operation and lighting reduction controls. Savings are further enhanced with the lack of lamp disposal costs and lower maintenance costs compared to fluorescents. Where facility downtime related to lamp replacement or fixture maintenance is operationally costly, the cost advantages of LED increase.
6.2.2 Outdoor Light-Emitting Diode Applications LEDs can also be used for most exterior lighting applications including signage, street lighting, and parking lot and roadway lighting. LEDs are particularly applicable in hard-to-reach lighting applications where conducting maintenance is difficult, because of their extended useful lifespan compared to conventional lighting sources.
LEDs in parking lots provide numerous benefits over more-prevalent HID technologies. Benefits may include reduced maintenance because of longer life,19 better light coverage and quality, improved focus of light on the ground, reducing light pollution, and compatibility with sensors and other controls. Figure 21 shows a parking lot with LED fixtures. The lot is adjacent to numerous houses (visible in the background), but even though the lot is well lighted, very little light reaches those properties.
Some examples of projects using LEDs for parking lot lighting are detailed in Table 13. Example A describes savings CBP program participants estimated over an ASHRAE 90.1-2007 baseline20 for a new construction project. Example B describes savings for a retrofit project over the previous parking lot HID lighting. In this case, the pre-retrofit lighting was actually more efficient than the ASHRAE baseline, so savings estimates are smaller. Example B is further described in Section 6.2.2.1.
19 LED-based products have the potential to achieve useful lifetimes meeting or exceeding those of traditional lighting technologies. However, the life and reliability of products currently on the market varies greatly (PNNL 2014). 20 More recent versions of the ASHRAE 90.1 standards have become more stringent, so savings estimates against baselines using the newer standards would show lower predicted savings.

65
This report is available at no cost from the National Renewable Energy Laboratory (NREL) at www.nrel.gov/publications.
Figure 21. LEDs illuminate surface parking lot in Madison, Wisconsin (Courtesy Rebecca Sadler, Energy Center of Wisconsin)
Table 13. Typical Annual Energy and Cost Savings for External LED Applications
Parameter Name Unit Example A—Retail
Store New Construction
Example B—Retail Store Existing
Building Electricity saved kWh/ft2 1.61 0.58 Gas saved therms/ft2 0 0 Reduction in EUI kBtu/ft2 5.5 2.0 Utility bill savings21 $/ft2 $0.18 $0.07 Typical capital cost $/ft2 $0.10 $0.41 Typical simple payback years 0.9 6.2 Capital cost 5-year payback $/ft2 $0.90 $0.33 Target incentive $/ft2 $0 $0.081 Number of Fixtures number 90 87
6.2.2.1 Walmart Store Parking Lot Retrofit Walmart examined the option of upgrading the parking lot lighting to use LED fixtures for an existing store that is open 24 hours per day as part of their CBP retrofit pilot project. The project involved replacing 50, 1,000-Watt HID lamps with 87 LED fixtures of less than 300 Watts, each using the same locations. The LED replacements exceed Illuminating Engineering Society of North America RP-20 minimum light levels for parking areas, and power consumption for
21 The cost savings are based on national average rates of $0.112/kWh, and $0.81/therm. Area values used for calculations in this table were taken from CBP project documentation, which used building square footage, whereas parking lot square footage would be more appropriate for this EEM.

66
This report is available at no cost from the National Renewable Energy Laboratory (NREL) at www.nrel.gov/publications.
parking lot lighting will be reduced from 70 kW to 25.5 kW. The lights are on an average of 11 hours per day over the entire year, and are controlled to dim by 40% from midnight to 4 a.m. to save extra energy. The predicted energy savings (over the current parking lot lighting system) are 124,390 kWh/year and the simple payback on investment is about 6 years.
6.2.2.2 Pittsburgh Health Center Parking Lot Pittsburgh Health Center, a healthcare facility in Contra Costa County, California, installed LED parking lot lights with bilevel settings and occupancy sensors (Energy Upgrade California 2012). The system replaced high-pressure sodium lamps that provided poor lighting quality because their lack of uniformity left areas darker than recommended by the Illuminating Engineering Society of North America and poor color temperature (a method of describing the color characteristics of light) resulting from the orange-tinted color produced by the lamp. The facility replaced 157, 250-Watt fixtures with 70 bilevel LED fixtures. The bilevel controls provide high light output at 137 Watts when they detect motion, or lower output at 33 Watts when the area is unoccupied. The facility is open during normal business hours, but also holds appointments two evenings per week and has regular evening seminars. Bilevel lighting with occupancy sensors allowed the facility to maximize public safety perception (it was never fully dark) and save energy by dimming during periods when the area is unoccupied. The facility owners predicted energy savings of 187,800 kWh through a combination of the fixtures (173,400 kWh savings) and controls (14,400 kWh savings). With rebates from the utility, the owners predicted a 2.2-year simple payback.
6.3 Real World Considerations LED technology is developing rapidly, so it takes some effort to match the right product with the given application. The performance of new products must be verified before being applied to a project. DesignLights Consortium and ENERGYSTAR provide lists of products that meet agreed upon standards for quality and efficiency.
Retailers often have additional considerations beyond energy efficiency when making lighting decisions. One issue is whether an EEM will affect customer experience or make the property look less welcoming, especially if it appears dimmer than neighboring properties that may be lit above recommended levels. For example, a retailer may object to any dimming controls and motion sensors on parking lot lights because of user perceptions of reduced security.
The lighting power and quantity of fixtures needed in two similarly sized parking areas can vary because each has unique characteristics. Lower reflectance surfaces of parking lots (e.g., asphalt versus concrete) may mean equivalent light density will not always result in the same perceived brightness for the lighted area (Myer 2011). However, in the case of a retrofit application where LEDs replace high-pressure sodium lights, the improved color temperature has a stronger influence on the perceived brightness than the surface reflectance. A photometric evaluation of any new installation that considers color temperature will increase the likelihood of a successful design.
For existing facilities, proposed retrofit EEMs need to be compared against current equipment when evaluating energy savings potential to give owners actionable information. Also, retrofit EEMs should each be evaluated and specified individually rather than as a group of required measures. This procurement method allows for competitive bidding and selective cost cutting if

67
This report is available at no cost from the National Renewable Energy Laboratory (NREL) at www.nrel.gov/publications.
Walmart replaced 48, 100-Watt metal halide fixtures with 96, 12-Watt LED fixtures in the produce area of its store. To determine the baseline interior lighting energy consumption, a calibrated existing building model was created. Additionally, a proposed model was created from the adjusted baseline model that implemented the lighting change. Performance was verified on a whole-building and an EEM level. Spot power measurements of electrical circuits using a three-phase power meter of National Institutes for Standards and Technology-traceable calibration were taken both before and after the retrofit. Cooling and heating energy savings were also determined using the existing building and proposed building model. Because the lighting was on 24/7, the data needed no trending. This EEM resulted in $2,742 of measured savings.
required. If a lighting EEM will cause a store to exceed its initial construction budget, it may be rejected regardless of how quickly it pays for itself.
6.3.1 Financial Incentives Many state and utility energy efficiency programs provide incentives for LED retrofits as well as incentives for LEDs in new construction. See www.dsire.org for a comprehensive listing. Some examples of program incentives include:
Energy Trust of Oregon
• Refrigeration case lighting retrofit: $20/linear foot
• Refrigeration case lighting new: $10/linear foot
• Cash incentives for retrofit of fluorescent to LED fixtures: $25–$45 per fixture
• Cash incentives for bulbs: $15–$25 per LED bulb.
SMUD
• LED fixtures: $25–$325 depending on technology they replace
• Custom project incentives: $0.10–$0.13/kWh; up to 30% of project cost or $150,000, whichever is less.
ComEd. Incentive: $0.50/Watt reduced.
Dayton Power and Light—Business and Government Energy Efficiency Rebate Program (Ohio). Pays rebates of $50–$200 per fixture for exterior LED fixtures.
Rocky Mountain Power—Wattsmart Business (Idaho). Pays rebates of $100–$400 per fixture for outdoor or roadway LED fixtures.
6.4 Project Results Walmart participated in DOE’s CBP to develop and implement solutions for its existing stores that would reduce energy consumption by at least 30%. Walmart retrofitted its Centennial, Colorado, Supercenter with a suite of EEMs that included interior and exterior LED fixtures (see Table 14).
Walmart’s lighting retrofit involved replacing both selected interior and exterior lighting with LEDs, installing lighting controls, and reducing light levels in particular areas. The EEM for each application (e.g., canopy, produce, garden center, parking lot) was modeled both

68
This report is available at no cost from the National Renewable Energy Laboratory (NREL) at www.nrel.gov/publications.
individually and as a bundle. The simple payback for the entire bundle of LED lighting retrofit measures was 2-½ years.
Table 14. LED Fixtures for the Centennial, Colorado, Walmart
Project Walmart Retrofit, Centennial, Colorado Building size 213,000 ft2 Project description Energy efficiency retrofit of a big-box store Project EEMs All LED EEMs (bundled)
Light reduction, LED fixtures (interior and exterior), controls
Expected annual energy savings versus pre-retrofit consumption (kWh)
285,941
Expected annual energy cost savings $24,120 Simple payback 2.5-years Annual carbon emissions avoided22 198 metric tons CO2e Walmart also developed plans for a new store in Fort Worth, Texas as part of CBP, although the project did not proceed to construction. This project included identification of, and recommendations for, potential EEMs in the new store. Use of parking lot LEDs was a measure that was explored. Table 15 provides details on the predicted savings.
Table 15. Haslet/Fort Worth Walmart Supercenter New Construction Parking Lot LEDs
Project Walmart Supercenter in Fort Worth Building size 191,572 ft2 Project description New construction of parking lot for a big-box store
Parking lot LED fixtures Install 90 LED parking lot fixtures for a total of 20.4 kW. Illuminate a parking lot while reducing lighting power from 93.7 kW.
Baseline used for comparison ASHRAE 90.1-2007 code compliance Expected annual energy savings 307,948 kWh Expected annual energy cost savings $21,556 Simple payback 0.9 years Annual carbon emissions avoided 213 metric tons CO2e23
Use of controls and motion sensors to dim unoccupied parts of the parking lot were predicted to provide additional savings but were not considered due to a possible negative effect on customer experience. Although energy modeling of parking lot LEDs promised significant potential savings and a less than 1 year simple payback, the parking lot LED fixtures were not installed because including them would have exceeded the project construction budget.
22 Greenhouse gas reductions are given in terms of CO2e. For electricity, 0.000692 metric tons CO2e/kWh are assumed to be avoided. For natural gas, 0.006418 metric tons CO2e/therm are assumed to be avoided. 23 Greenhouse gas reductions are given in terms of CO2e. For electricity, 0.000692 metric tons CO2e/kWh are assumed to be avoided. For natural gas, 0.006418 metric tons CO2e/therm are assumed to be avoided.

69
This report is available at no cost from the National Renewable Energy Laboratory (NREL) at www.nrel.gov/publications.
6.5 Modeling Light-Emitting Diodes Guidance for modeling interior and exterior LEDs in EnergyPlus is provided in Appendix B.
6.5.1 Interior Light-Emitting Diodes Lighting often consumes the most electricity of any end use in big-box retail and warehouse buildings, so in modeling these systems it is important the lighting power and schedule are as accurate as possible. When modeling LEDs, each light in a space does not have to be modeled individually, but can often be modeled according to the space’s lighting power density.24 Lighting power density can be specified space by space, or determined for the entire building. One benefit of LED fixtures is they can dim easily, which makes them ideal for task tuning and daylighting control. Controls such as task tuning (adjusting light levels to the specific task and/or working environment), occupancy sensors, and time clocks can be modeled by modifying the lighting schedule within the model; daylighting should be handled separately in most modeling software by a daylighting algorithm, and not the schedule.
6.5.2 Exterior Exterior lighting plays an important role in the overall energy consumption of a building. Because lighting is important to the branding of many stores (signs, façade lighting, etc.), effective design must take advantage of reducing lighting level and utilizing high efficiency lights in an effort to maintain the branding while reducing the lighting energy consumption. This report discusses how to accurately model the exterior lighting of a building. For exterior areas such as parking lots, an overall lighting power value is modeled (measured in Watts) and controlled using a schedule. Efforts should be taken to reduce the overall power (use more efficient lights) or to reduce the lighting level or time the lights operate. Modeling can assist with determining the energy and cost savings from various designs.
6.6 Ensuring Performance Selection of a quality lighting product is very important. Standards for LED fixtures products25 are still being developed, and the nascent nature of the industry is leading to rapid product evolution. For these reasons, luminaire quality should be verified through product certifications, where possible. Check lists from either DesignLights Consortium or ENERGYSTAR for verified LED performance and quality. Technology is advancing so quickly that by the time one generation of products is certified, manufacturers have new ones ready for consideration. If a nonlisted or noncertified product is being considered for a project, the specification cut sheets should be compared to DesignLights Consortium requirements for those product types or to similar products from that company that have been previously approved.
6.6.1.1 Installation Selecting a contractor who is qualified to do the job, and has experience with the systems being installed, is important. A contractor’s familiarity with the particular type of LED fixtures
24 In practice, in most phases of building design and renovation, it is practical to model lighting according to the wattage installed per area; this leads to the Watts/Area method in EnergyPlus described in this section. LightingLevel is also a possible choice, in which just the total wattage for the lighting is entered. This may be available for more detailed, research-oriented projects. Additionally, the Technology Performance Exchange (http://www.TPEx.org) from NREL contains specific LED luminaires that can be inserted into simulation models; in this instance the wattage of those luminaires would be used rather than the Watts/Area. 25 Standards Development for Solid-State Lighting: http://www1.eere.energy.gov/buildings/ssl/standards.html.

70
This report is available at no cost from the National Renewable Energy Laboratory (NREL) at www.nrel.gov/publications.
(interior or exterior), for example, will generally result in an installation that performs as anticipated and provides the expected savings.
Electrical contractors are generally in charge of installation of LED fixtures; the manufacturer may provide some assistance. Contractors should be aware of the installation criteria for the specified product, and follow all manufacturers’ instructions, because LEDs vary considerably by type. If the contractor is selecting the fixture based on a specification, he or she should consider the following lessons learned:
• Use the lists noted above to ensure LED quality. Alternatively, many utility and state energy efficiency programs publish lists of acceptable LED products.
• The contractor should not assume that LED photometrics will match those from conventional fixtures; custom photometric calculations should be completed.
• In a retrofit case, where fixture location cannot be changed, photometrics should be completed and LEDs sourced that provide just enough light to meet design intent.
Contractors should also keep the following in mind when installing the fixtures:
• Fixture locations should be coordinated on the jobsite with furniture, ductwork, shelving/racking, and all other interior finishes; the location should be adjusted if a fixture will be partially blocked or cause glare.
• Where daylight is provided, often by skylights or clerestories, contractors should circuit fixtures into groups of similar daylight availability (or distance from fenestration).
6.6.1.2 Commissioning See Chapter 1 for information about the general commissioning process. Where LEDs are part of a comprehensive high-performance lighting system, the project’s CxA should include review and testing of lighting in the scope. The CxA should compare the design documents or manufacturer’s instructions for installation with the actual installation to ensure it was done properly. This includes comparing the model number of fixtures delivered to the site to ensure they match those in the design submittal.
Where a fixture selection is based on equivalency to a specification (rather than having a designer select one specific fixture), the CxA should compare to those specifications as part of the design review. Key elements to check include the product’s useful life, color temperature, color rendering index, lumen output, efficacy (lumens/Watt), and drive current.
6.6.1.3 Controls Programming The electrical engineer must specify the sequence of operations, priority of control strategies (e.g., occupancy and daylighting), and operational parameters (e.g., occupancy or vacancy mode, time-out periods, sensitivity), when applicable. Occupancy sensors are commonly ultrasonic, microphonic, infrared, or a combination of technologies. Also, the sensor must be properly located and of the right type for the application. The engineer is responsible to select the right sensor type, with assistance from the contractor. The engineer and contractor are responsible for installing the control device in the proper location. Coordination between design and construction teams is critical to ensuring a properly functioning system. Verifying proper control
71
This report is available at no cost from the National Renewable Energy Laboratory (NREL) at www.nrel.gov/publications.
placement and functionality should also be included in the scope of the commissioning authority. The placement and programming of controls should be re-evaluated after a period of use (e.g., 6 months) to ensure they are working acceptably for the space. The facility manager should note any required changes to be completed by either the electrical contractor or lighting controls technician, depending on the complexity of the lighting control system. Manufacturers of more complex systems often offer service packages to handle this type of requirement.
6.6.1.4 Operation Facility managers should ensure that lighting is operated as intended. They should be observant of how people interact with the system—specifically controls—and note conflicts, issues, and substandard performance. LED fixtures should also be cleaned as part of a maintenance schedule; at least once approximately every 5 years is reasonable.
In facilities with long hours of operation, LED fixtures will reach their end-of-life operation in a 5–10 year timespan. To extend the useful operation timespan, facility managers can coordinate an LED installation that has the capability to provide more illuminance than required. To maintain energy savings, the initial light level would be reduced to the minimum required light level. Once the light level noticeably depreciates, the facility manager would then increase the fixture to a higher output, such that the target light level is maintained. This process continues over an extended time, so maintaining operational continuity with maintenance staff is essential to successfully implement this strategy.
6.6.1.5 Occupant Behavior Occupants should not have significant interaction with the LED fixtures, but will inevitably interact with the associated lighting controls for internal LEDs. Building management needs to ensure that occupants understand how and why lighting controls work. A process should also be included for adjusting the controls as occupants request, so that occupants do not simply deactivate the controls.
6.6.2 Measurement and Verification See Chapter 1 for information about the general M&V process. An isolated metering approach is often used to verify interior lighting energy savings. However, because lights can affect HVAC energy consumption, a more accurate, but more expensive, approach would also include whole-building calibrated simulation.
6.6.3 Recommended Monitoring Points If a series of interior lighting circuits have the same setup, only a few need to be metered.
6.6.4 Inexpensive, but Less Accurate, Approach This approach involves continually measuring electricity current throughout the M&V period by installing current transducers on individual electrical circuits serving interior lights. Voltage and power factor of these circuits must be spot checked during installation, and occasionally thereafter, to confirm their values. Electrical power and energy may then be calculated from the measured current, as well as spot (one-time) measurements of voltage and power factor.
72
This report is available at no cost from the National Renewable Energy Laboratory (NREL) at www.nrel.gov/publications.
6.6.5 More Complex and Expensive, but Accurate Approach This approach involves continuously and permanently measuring real electrical power by installing power meters on individual electrical circuits serving interior lighting. This method is more costly, slightly more convenient, and more accurate, because it accounts for the full waveforms of the electrical power. Real power meters should meet the following criteria:
• Sampling interval of 30 seconds
• Designed for the type of circuit to be metered (e.g., 208 Volt, 20 amp, 60 Hertz)
• Ability to accurately meter loads; rated to meet the load per phase (e.g., 0–3600 Watts)
• Internal clock that timestamps each data point
• UL listing
• Compatibility with the BAS.
6.6.6 Guidance for Analysis Chapter 1 provides information on data management for M&V efforts. Analyzing the data, and determining verified energy savings, involves different approaches for existing and new construction projects.
6.6.6.1 Existing Buildings For existing buildings, energy performance both before and after replacing the light fixtures may be measured explicitly. The energy savings from both periods are then normalized by factors that affect their performance, such as changes in hours of operation and daylight levels if the system has daylight controls. Once normalized, the energy savings from this energy conservation strategy are determined by taking the difference between energy consumption both before and after the strategy was initiated.
6.6.6.2 New Construction For new construction projects, the energy savings calculation is less clearly defined, because no measured baseline data are available for comparison. Calculations can be used to approximate the theoretical energy consumption of a baseline case versus the measured case. One source of baseline information is any existing facilities or operations that the building owner or tenant currently occupies (generally for new construction the occupants move or expand from existing facilities). For the building to be a good baseline case, the existing building must be generally the same type of facility as lighting power density varies greatly among different building types. The lighting power of these facilities can be monitored before the new construction project is completed, and the monitored data from these facilities can be used to establish the before-upgrade condition for the energy savings calculation.
A simpler option is to look at the energy code the new building must comply with. Building energy codes require a specific lighting power density, W/ft2, depending on building type as well as a variety of lighting controls such as occupancy and daylighting controls. A calculation assuming this lighting power density throughout the entire building and a corresponding level of controls provides an appropriate baseline case to compare against the measured case.

73
This report is available at no cost from the National Renewable Energy Laboratory (NREL) at www.nrel.gov/publications.
The baseline and upgraded system models should be normalized using the same hours of operation and daylight levels (if applicable). Once normalized, the energy savings from the LED fixtures are determined by taking the difference between energy consumption of the theoretical baseline and actual system with controls.
6.6.7 Best Practices for Addressing Operational Problems If the lights are on longer than expected, the first item to check is how the lights are controlled. If a time clock is used, its set points must be accurate and the lights must be connected to the BAS. If the lights are controlled by occupancy sensors or photosensors, their functioning needs to be verified. When occupancy sensors and photosensors fail, the lights will remain on at all times. Maintenance staff should regularly check that lights are not on when they should not be, indicating failed controls. Further problems can be caused by faulty bulbs or ballasts.
6.7 References and Other Resources Caliper Application Summary Report 22: LED MR16 Lamps. Prepared by Pacific Northwest National Laboratory, Richland, WA. Washington, DC: U.S. Department of Energy, Solid-State Lighting Program, 2014. Accessed March 2015: http://apps1.eere.energy.gov/buildings/publications/pdfs/ssl/caliper_22_summary.pdf.
Energy Savings Forecast of Solid-State Lighting in General Illumination Applications. Prepared by Navigant Consulting, Chicago, IL. Washington, DC: U.S. Department of Energy, 2014. Accessed March 2015: http://apps1.eere.energy.gov/buildings/publications/pdfs/ssl/energysavingsforecast14.pdf
LED Application Series: Outdoor Area Lighting. PNNL-SA-60645. Prepared by Pacific Northwest National Laboratory, Richland, WA. Washington, DC: U.S. Department of Energy Building Technologies Program, 2008. Accessed March 2015: http://apps1.eere.energy.gov/buildings/publications/pdfs/alliances/outdoor_area_lighting.pdf.
LEDs and bi-level controls deliver healthy 87% energy savings at the Contra Costa County Pittsburg Health Center parking lot. Energy Upgrade California: Energy Technology Assistance Program, 2012. Accessed March 2015: http://www1.eere.energy.gov/buildings/ssl/standards.html.
Myer, M.; Kinzey, B.; Curry, K. (2011). Demonstration Assessment of Light-Emitting Diode (LED) Parking Lot Lighting in Leavenworth, KS. Washington, DC: U.S. Department of Energy.
Scheib, J. (2011). A Retail Lighting Guide: Six Steps to Energy Savings. Draft Report. Golden, CO: National Renewable Energy Laboratory.
Solid-State Lighting: Early Lessons Learned on the Way to Market, Washington, DC: U.S. Department of Energy, Solid-State Lighting Program, 2014. Accessed March 2015: http://apps1.eere.energy.gov/buildings/publications/pdfs/ssl/ssl_lessons-learned_2014.pdf.
“Solid State Lighting: Standards Development for Solid-State Lighting.” U.S. Department of Energy, 2014. Accessed March 2015: http://www1.eere.energy.gov/buildings/ssl/standards.html.

74
This report is available at no cost from the National Renewable Energy Laboratory (NREL) at www.nrel.gov/publications.
“SSL Pricing and Efficacy Trend Analysis for Utility Program Planning.” U.S. Department of Energy, Solid-State Lighting Program, 2013. Accessed March 2015: http://www1.eere.energy.gov/buildings/ssl/trend-analysis.html
Standard 90.1-2010 User’s Manual. American Society of Heating, Refrigerating and Air-Conditioning Engineers, 2010. Accessed March 2015: https://www.ashrae.org/resources--publications/bookstore/standard-90-1-document-history#2010UM.

75
This report is available at no cost from the National Renewable Energy Laboratory (NREL) at www.nrel.gov/publications.
Chapter 7. Variable Refrigerant Flow 7.1 Description VRF systems use air- or water-source heat pumps, commonly called condensing units, to provide space heating and cooling to a building’s conditioned areas. VRF systems can condition multiple zones in a building, each of which may have different heating and cooling needs. Using sophisticated control technologies, VRF systems can modulate the amount of refrigerant sent to each zone independently and in tune with diverse and changing space conditioning loads, thereby increasing energy savings. The key components of a VRF system are the outdoor unit, indoor unit, refrigerant, and heat recovery unit (HRU). An additional, separate system, also called a dedicated outdoor air system, is needed to serve the ventilation requirements of the spaces. VRF systems save energy in four primary ways:
• Distribution of heating/cooling using refrigerant instead of air
• Variable-speed compressors and fans
• Zone-level heating and cooling, meaning they provide only the needed heating and cooling without reheat
• In some systems, recovery of heat from cooling zones to heating zones.
Figure 22. VRF system
(Courtesy Cherie Williams, Energy Center of Wisconsin)
7.2 Outdoor Unit (Condensing Unit) The main heating and cooling plant of a VRF system is usually an air- or water-source heat pump. Ground-source (or “geothermal”) systems have also proven effective, especially in colder

76
This report is available at no cost from the National Renewable Energy Laboratory (NREL) at www.nrel.gov/publications.
climates, though in limited applications so far. The outdoor unit exchanges heat with the outdoor environment (or water), either by expelling heat (when cooling) or absorbing heat (while heating). Heat is exchanged with the outdoor environment using a heat exchanger filled with refrigerant, which is then pumped throughout the building to one of many indoor units. Variable-speed compressors are used so that lower compressor speeds can be used during part-load conditions, saving additional energy.
7.3 Indoor Units (Fan Coils) Refrigerant from an outdoor unit is pumped to one of many indoor units. These act as evaporators when in cooling mode and condensers when in heating mode, and heat and cool a building zone. Indoor evaporator units control the amount of heat being dumped to (or collected from) a space using linear or electronic expansion valves. Indoor evaporator units exchange heat between the refrigerant and the ambient air by blowing air over the unit’s evaporator coil. During the heat exchange, the refrigerant either condenses (when in heating mode) or evaporates (when in cooling mode). Refrigerant returns to an intermediary HRU or directly to the outdoor unit, where it is subsequently reheated or recooled.
Figure 23. Two types of VRF indoor units
(Courtesy Scott Schuetter, Energy Center of Wisconsin)
7.3.1 Refrigerant VRFs currently use R-410A refrigerant, which has a higher thermal capacity than water or air. This means that a smaller volume of vapor or liquid refrigerant is required to move the same amount of heat. This results in more efficient transfer of heat to and from zones than through air or water distribution. R-410A is a non-ozone-depleting compound; however, it has a high global warming potential, so it must be properly collected and disposed. Refrigerants used in space conditioning are updated over time as better compounds are developed.
7.4 Heat Recovery Unit An HRU allows thermal energy to move between several individual zones that are colocated on the same main refrigerant loop. For example, an HRU might extract heat from the refrigerant returning from a cooled zone, such as an interior conference room, to heat refrigerant leaving for a different zone that is currently in heating mode, such as an exterior open office. By reusing the heat that can be extracted locally, HRUs can reduce the size of the overall heating and cooling
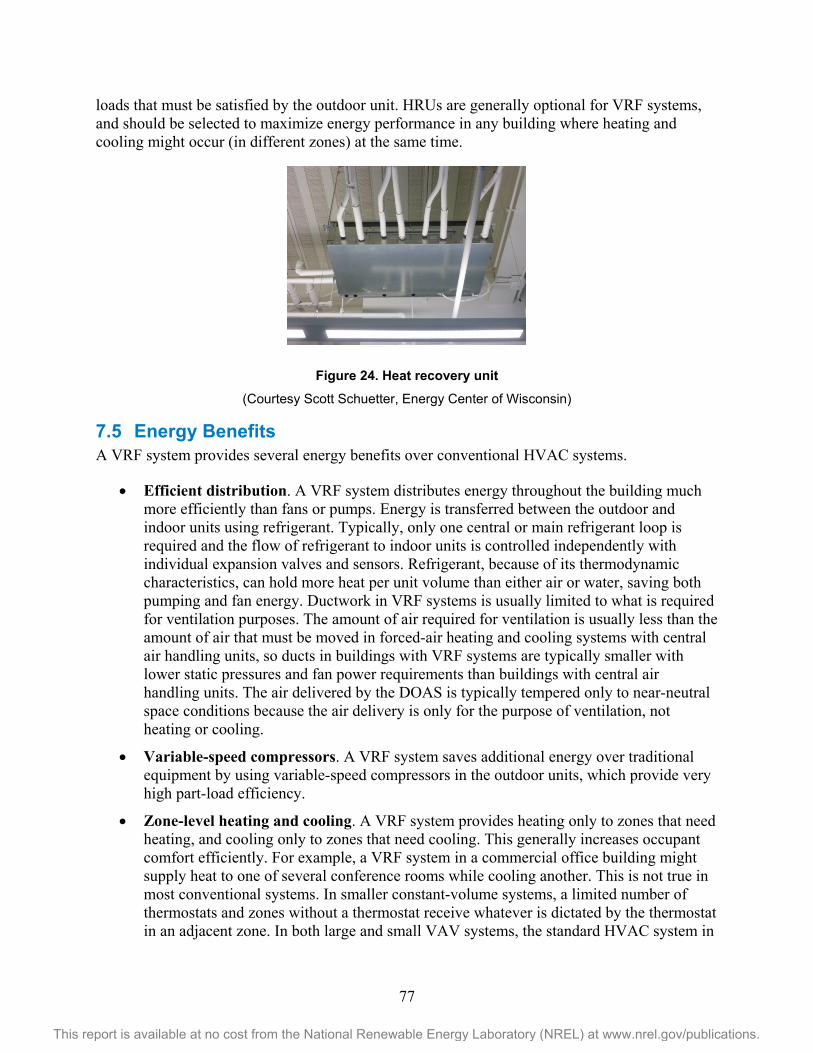
77
This report is available at no cost from the National Renewable Energy Laboratory (NREL) at www.nrel.gov/publications.
loads that must be satisfied by the outdoor unit. HRUs are generally optional for VRF systems, and should be selected to maximize energy performance in any building where heating and cooling might occur (in different zones) at the same time.
Figure 24. Heat recovery unit
(Courtesy Scott Schuetter, Energy Center of Wisconsin) 7.5 Energy Benefits A VRF system provides several energy benefits over conventional HVAC systems.
• Efficient distribution. A VRF system distributes energy throughout the building much more efficiently than fans or pumps. Energy is transferred between the outdoor and indoor units using refrigerant. Typically, only one central or main refrigerant loop is required and the flow of refrigerant to indoor units is controlled independently with individual expansion valves and sensors. Refrigerant, because of its thermodynamic characteristics, can hold more heat per unit volume than either air or water, saving both pumping and fan energy. Ductwork in VRF systems is usually limited to what is required for ventilation purposes. The amount of air required for ventilation is usually less than the amount of air that must be moved in forced-air heating and cooling systems with central air handling units, so ducts in buildings with VRF systems are typically smaller with lower static pressures and fan power requirements than buildings with central air handling units. The air delivered by the DOAS is typically tempered only to near-neutral space conditions because the air delivery is only for the purpose of ventilation, not heating or cooling.
• Variable-speed compressors. A VRF system saves additional energy over traditional equipment by using variable-speed compressors in the outdoor units, which provide very high part-load efficiency.
• Zone-level heating and cooling. A VRF system provides heating only to zones that need heating, and cooling only to zones that need cooling. This generally increases occupant comfort efficiently. For example, a VRF system in a commercial office building might supply heat to one of several conference rooms while cooling another. This is not true in most conventional systems. In smaller constant-volume systems, a limited number of thermostats and zones without a thermostat receive whatever is dictated by the thermostat in an adjacent zone. In both large and small VAV systems, the standard HVAC system in

78
This report is available at no cost from the National Renewable Energy Laboratory (NREL) at www.nrel.gov/publications.
commercial buildings, every zone is provided with cooling, and air modulation and reheat are used to provide comfort in each zone. VAV systems thus provide significantly more cooling—and in turn, reheating—than is needed for comfort. VRF systems (as well as other heat pump-based systems) avoid this by providing fan coils at each zone that provide heating or cooling only, directly to the zone.
• Heat recovery. VRF systems are outfitted with HRUs, which can collect heat returning from a cooled zone to help heat refrigerant being sent to a heated zone (and vice versa). An additional means of heat recovery may be realized by adding energy recovery ventilation, such as an enthalpy wheel, to the requisite dedicated outdoor air system.
7.6 Nonenergy Benefits VRF systems can offer improved comfort over traditional systems. Because terminal units are controlled independently using individual sensors and expansion valves, the temperature in each zone can be held within a narrow temperature band. They create relatively little noise, because the indoor and outdoor units are typically quieter than their alternatives, especially when running in part-load conditions.
7.7 Application VRF systems are applicable in new and existing commercial buildings. They are most effective in buildings with diverse heating and cooling loads, buildings with limited central forced-air-based retrofit options, and buildings with space constraints. Table 16 provides two examples and associated savings for choosing VRF. 26 The first example represents an air-source VRF system upgrade to a 38,000-ft2 all-electric office building in Denver, Colorado that was evaluated as part of a CBP retrofit project but ultimately not selected for implementation. The baseline for this example was the packaged VAV system with DX cooling and electric resistance radiant heating panels. The second example represents a ground-source VRF system upgrade to a new, 85,000-ft2 office building in Madison, Wisconsin. The baseline for this example was a packaged VAV system with DX cooling and hot water boilers. These examples illustrate the potential range of savings for VRF systems. Project-specific circumstances could lead to savings outside of this range; these results are highly climate dependent.
Table 16. VRF Typical Annual Energy and Cost Savings
Parameter Name Unit Air Source VRF Ground Source VRF Electricity saved kWh/ft2 1.80 0.56 Gas saved Therms/ft2 0.0 0.45 Reduction in EUI kBtu/ft2 6.15 46.7 Utility bill savings $/ft2 $0.20 $0.42 Typical capital cost $/ft2 $2.00 $5.00 Typical simple payback Years 9.9 11.8 Capital cost 5-year payback $/ft2 $1.01 $2.12 Target incentive $/ft2 $0.99 $2.88
The ground-source VRF system saves considerably more energy than the air-source VRF system, but at higher first cost and with longer payback periods. Because the cost of natural gas
26 The cost savings are based on national average rates of $0.112/kWh, and $0.81/therm.
79
This report is available at no cost from the National Renewable Energy Laboratory (NREL) at www.nrel.gov/publications.
is lower than that of electricity per unit of energy, VRF is less favorable when upgrading from natural gas heating instead of from electric heating.
7.7.1 Buildings With Diverse Heating and Cooling Loads Commercial office buildings can have spaces with different heating or cooling needs. For example, a building with a data center or server room as well as office space may need to supply cooling to the data center or server room while heating the offices. VRF systems can simultaneously heat and cool different building zones.
7.7.2 Building Retrofits With Limited Forced-Air-Based Retrofit Options Options for adding new heating and cooling capabilities to historic buildings can be limited. For example, adding additional ductwork might be cost prohibitive, or conflict with the building owner’s need to preserve as much of the historic character of the building as possible. VRF might be an option in these circumstances, because installing refrigerant lines is often less intrusive than adding ductwork, or even plumbing for a hydronic system.
7.7.3 Buildings With Space Constraints Individual VRF units are generally compact, requiring less space than other heating and cooling equipment. Units can be wheeled into mechanical rooms through a single door. Refrigerant lines are smaller in diameter than ductwork, so they require less space during and after installation.
7.8 Real-World Considerations Air-source VRF systems perform best in mild climates, because they lose capacity at low ambient temperatures and must be supplemented by an auxiliary heat source. In colder climates, this often necessitates a supplementary heater to the outdoor units. Often this is done with gas-fired equipment, requiring a natural gas connection and its associated cost. Alternatively, the system can be upgraded to water or ground source, thereby saving even more energy, but at significant additional first cost. Although ground-source VRF systems are highly efficient, the required land for the ground heat exchanger, even for vertical borefields, is subject to space constraints at urban sites.
The cost of VRF systems can be relatively high compared to conventional alternatives. However, for some renovation projects that need additional heating and cooling capacity but are constrained for space, VRF systems may be less expensive than conventional systems. The small space requirement of VRF can also allow a new construction project to reduce its floor-to-floor height, thereby saving substantial first costs for the building structure and finishes.
A VRF system’s small space requirements can also increase a building’s usable square footage, thereby increasing the revenue a building owner receives in rent (Thornton 2012). Its modularity also makes it easier to assign utility costs to various tenants (Amarnath 2008).
ANSI/ASHRAE Standard 15 “Safety Standard for Refrigeration Systems” requires that the refrigerant charge be low enough that it does not suffocate an occupant in the smallest room if the entire charge were to leak into that room. Systems can be designed such that one fan coil unit serves multiple rooms via ducting, thereby meeting the standard (Goetzler 2007). In addition, R-410A refrigerant has a 100-year global warming potential, exceeding 2,000 times that of carbon

80
This report is available at no cost from the National Renewable Energy Laboratory (NREL) at www.nrel.gov/publications.
dioxide. Therefore, these systems must be carefully installed and maintained, and their refrigerant properly collected and disposed, to minimize leakage into the atmosphere.
7.9 Financial Incentives Because a VRF system is innovative and provides project-specific energy savings, it typically qualifies for financial incentives as a “custom” EEM. The available incentives from these programs would depend on a project-specific energy savings calculation, and scale based on an incentive per energy savings ($0.10/kWh saved). Few if any state or utility programs specifically target VRF systems in their prescriptive incentive offerings. Programs in which VRF may qualify for rebates include:
MidAmerican Energy Electric Commercial Energy Advantage Rebate Program (Illinois). Pays equal to 25% of the incremental cost of the project or an amount that will buy down the payback period to 25% of the project’s useful life, whichever is greater, not to exceed 60% of the eligible project cost.
Massachusetts MassSAVE Custom Measures - New Construction/Major Renovation and Replacing Failed Equipment. Pays up to 75% of the initial cost of installed equipment.
Cheyenne Light, Fuel and Power Commercial and Industrial Electric Custom Rebates (Wyoming). Buys down energy-efficient upgrades to a 2-year payback, or up to one-half of the incremental cost of the equipment, whichever is less.
7.10 Project Results 7.10.1 Alliance Center The Alliance Center is the headquarters for the Alliance for Sustainable Colorado and sustainability-focused tenant/partner organizations. The Alliance participated in the CBP program to analyze EEMs for renovating its 100-year-old warehouse building. The Alliance envisions a living example of collaboration and sustainability at work. A significant part of the building is cooperative office and collaboration space (not held by a specific tenant) (see Figure 25).
The office building is six stories and is located in Denver, Colorado. The building’s HVAC system was nearing the end of its useful life in 2009, when CBP began. The HVAC system to be replaced was a DX, packaged VAV system (8 EER) for cooling, and electric resistance radiant panels for heating. One of the EEMs explored for the renovation was installing a VRF system (see Table 17).

81
This report is available at no cost from the National Renewable Energy Laboratory (NREL) at www.nrel.gov/publications.
Figure 25. Alliance Center
(Courtesy Alliance for Sustainable Colorado)
Table 17. VRF System in the Alliance Center Renovation
Project Alliance Center Renovation—Denver, Colorado Building size 38,500 ft2
Project description Renovation of a 100-year-old warehouse building into an energy-efficient multitenant office building
VRF Replace old HVAC system with VRF Expected annual energy savings 69,419 kWh Expected annual energy cost savings $9,839 EEM cost $95,000 Reduction in EUI 6.15 kBtu/ft2 Simple payback 9.9 years Annual carbon emissions avoided 48.0 metric tons CO2e27 The project team analyzed upgrading the HVAC equipment to an air-source VRF system with associated dedicated outdoor air system. The analysis showed substantial energy savings; however, the upgrade was deemed too expensive relative to the non-profit’s limited budget for the renovation and was not pursued.
7.10.2 Multitenant Office Another example using VRF was its inclusion in a new three-story office building in Madison, Wisconsin. The building, which has achieved LEED Platinum designation for shell and core, was completed in 2013, and houses a tenant office and outpatient healthcare space (see Figure 26).
The building owners decided to install an innovative VRF system that is tied to a geothermal bore-field to serve the building’s heating and cooling needs. The system’s rated heating efficiency is 4.5 coefficient of performance (COP) and its rated cooling efficiency is 13.3 EER. For comparison, an air-source heat pump system with similar capacity would have a rated heating efficiency of 3.3 COP and a rated cooling efficiency of 10.8 EER. A separate dedicated 27 Greenhouse gas reductions are given in terms of CO2e. For electricity, 0.000692 metric tons CO2e/kWh are assumed to be avoided. For natural gas, 0.006418 metric tons CO2e/therm are assumed to be avoided. Further, no refrigerant leakage contribution is assumed.
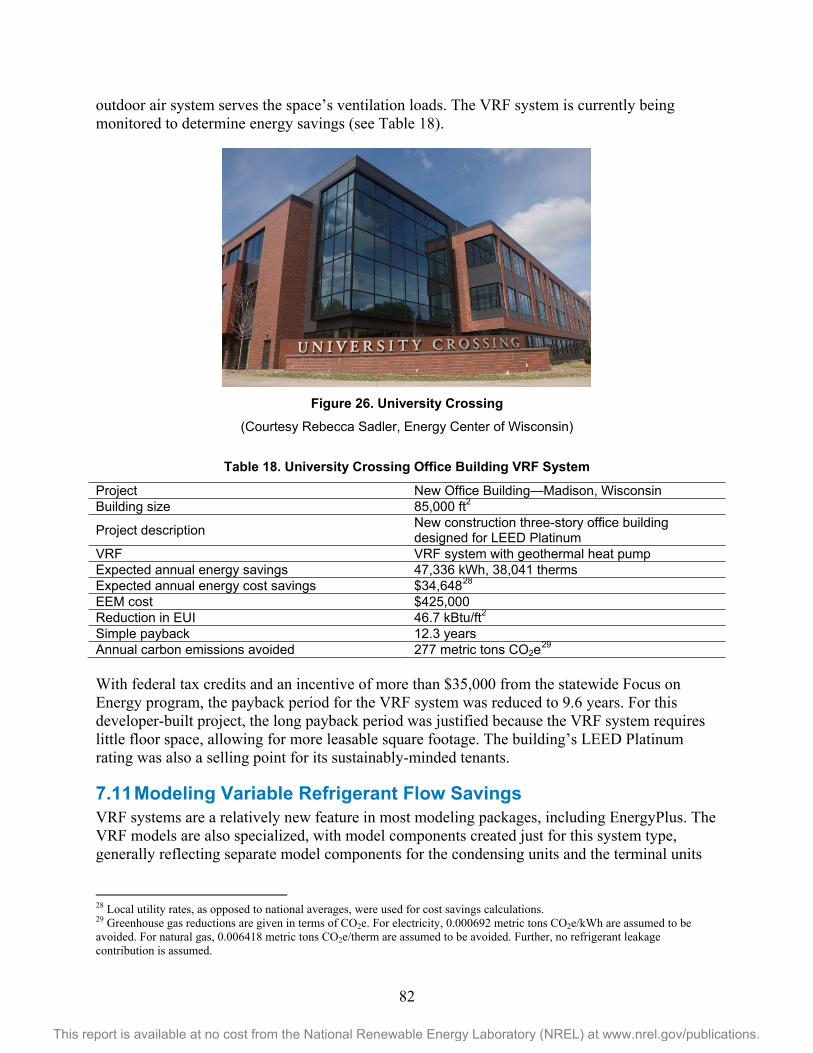
82
This report is available at no cost from the National Renewable Energy Laboratory (NREL) at www.nrel.gov/publications.
outdoor air system serves the space’s ventilation loads. The VRF system is currently being monitored to determine energy savings (see Table 18).
Figure 26. University Crossing
(Courtesy Rebecca Sadler, Energy Center of Wisconsin)
Table 18. University Crossing Office Building VRF System
Project New Office Building—Madison, Wisconsin Building size 85,000 ft2
Project description New construction three-story office building designed for LEED Platinum
VRF VRF system with geothermal heat pump Expected annual energy savings 47,336 kWh, 38,041 therms Expected annual energy cost savings $34,64828 EEM cost $425,000 Reduction in EUI 46.7 kBtu/ft2 Simple payback 12.3 years Annual carbon emissions avoided 277 metric tons CO2e29 With federal tax credits and an incentive of more than $35,000 from the statewide Focus on Energy program, the payback period for the VRF system was reduced to 9.6 years. For this developer-built project, the long payback period was justified because the VRF system requires little floor space, allowing for more leasable square footage. The building’s LEED Platinum rating was also a selling point for its sustainably-minded tenants.
7.11 Modeling Variable Refrigerant Flow Savings VRF systems are a relatively new feature in most modeling packages, including EnergyPlus. The VRF models are also specialized, with model components created just for this system type, generally reflecting separate model components for the condensing units and the terminal units
28 Local utility rates, as opposed to national averages, were used for cost savings calculations. 29 Greenhouse gas reductions are given in terms of CO2e. For electricity, 0.000692 metric tons CO2e/kWh are assumed to be avoided. For natural gas, 0.006418 metric tons CO2e/therm are assumed to be avoided. Further, no refrigerant leakage contribution is assumed.

83
This report is available at no cost from the National Renewable Energy Laboratory (NREL) at www.nrel.gov/publications.
in each zone. A dedicated outdoor air system typically must be modeled separately for outdoor air. Guidance for modeling VRF in EnergyPlus is provided in Appendix B.
7.11.1 OpenStudio Guidance VRF is supported in OpenStudio; a default VRF System object is available to represent the condensing unit, and a VRF Terminal object is available to represent the zone unit. Currently, the Building Component Library does not contain a fully packaged VRF measure.
7.12 Ensuring Performance 7.12.1 Installation Refrigerant leaks can be eliminated during installation. The contractor should ensure that all joints are brazed with no flared fittings. Headers and splitters that are specific to the VRF system being installed should be used that do not require flaring or changing wall thicknesses. Contractors should pressure test each refrigerant circuit. Refrigerant leaks can be further minimized through proper training, such as how to pressure test refrigerant circuits (Goetzler 2007). Proprietary components instead of secondary market components and continuous tubing also limit potential leak sites (Thornton 2012).
Indoor units require condensate drains with access to a water collection system (Amarnath 2008).
7.12.2 Commissioning Basic commissioning of VRF systems is simplified by the prevalence of standard configurations and electronic controls (Goetzler 2007). However, as with any complicated HVAC system, ensuring that the system is performing optimally takes more time. Care should be taken to achieve a seamless transition between heating and cooling modes, and to not oscillate too frequently from one mode to another (Thornton 2012). Additional commissioning efforts should concentrate on ensuring that the supplemental heating system used to heat the mechanical room housing the outdoor units does not prematurely activate. This is critical, because unnecessary energy consumption by this low-efficiency supplemental system can eat into the savings provided by the VRF. Finally, zones with perimeter heating may be simultaneously heated and cooled. This issue can be diagnosed by looking for high electricity consumption in the milder fall and spring seasons (Hicks 2014), in addition to any functional testing that can be done immediately following installation. Although VRF systems are difficult to optimize, once they are commissioned they tend to work well with little additional oversight. Chapter 1 provides additional information about the general commissioning process.
7.12.3 Controls Programming VRF systems come with factory-packaged controls that predominately use two low-voltage control wires. Simple controls include operation mode, temperature control, and fan speed. These controls support quick startup and configuration. Complex controls include scheduling and diagnostics, as well as control of the refrigeration management associated with HRUs. The systems can be capable of communicating over the Internet with open protocols, but controls are very manufacturer-specific, so capabilities should be checked with the manufacturer before purchase. Specific control components for VRF systems (ASHRAE 2012) are described here.

84
This report is available at no cost from the National Renewable Energy Laboratory (NREL) at www.nrel.gov/publications.
• Integral equipment controls. These controls optimize VRF system performance by sensing both refrigerant and air, then controlling compressor speed, fan speed, and discharge temperatures accordingly.
• Local system controls. These control the indoor units by sensing return air temperature, then turning them on or off accordingly. Also included is control over set points, setbacks, scheduling, cooling modes, and heating modes, as well as the fan coil.
• Central system controls. These control and optimize groups of zones, including seasonal scheduling, additional diagnostics, optimized startup, and setbacks.
• Remote system monitoring and controls. These enable system access through Web-based access licenses of manufacturer software tools.
• Gateway controls. These include integration between the VRF manufacturer and third-party systems via open protocols such as BACnet, Modbus, and LonWorks.
Additional programming is likely necessary, especially if the VRF system is to be coupled with a third-party or open source BAS or energy management system.
Finally, VRF systems can have difficulty reheating from temperature setbacks during unoccupied periods, so allowing longer warmup periods to compensate is highly recommended (Amarnath 2008). Many systems are installed with no temperature setback, which reduces their energy-saving capability.
7.12.4 Operation Because VRF systems are relatively new to the United States, institutional costs arise in training O&M staff. However, because VRF systems constitute a sizable fraction of HVAC systems (24%) in some markets outside the United States, O&M concerns are likely not a substantial barrier to further implementation (Thornton 2012).
The maintenance costs and lifetime of VRF systems are similar to other traditional zone-based systems. Maintenance, therefore, includes changing filters and cleaning coils; the compressors require minimal maintenance (Thornton 2012). The larger number of compressors does result in a higher likelihood of a given compressor failing. However, compressor redundancy means that the building can remain occupied while repairs are undertaken (Goetzler 2007), and compressors are generally centrally located for relatively easy maintenance.
7.12.5 Occupant Behavior Few occupant behaviors affect the performance of VRF systems. The low noise, individual controllability, and effective temperature control should result in higher occupant satisfaction and productivity (Amarnath 2008).
7.13 Measurement and Verification Because this EEM is complex and interacts strongly with other building systems, the whole-building calibrated simulation method is recommended to verify VRF systems.

85
This report is available at no cost from the National Renewable Energy Laboratory (NREL) at www.nrel.gov/publications.
7.13.1 Recommended Monitoring Points Developing an M&V plan for VRF systems involves specifying measurements for a large number of data points. These data are coupled with calibrated simulation as discussed below. For recommended monitored data, a comparison of energy performance of a VRF and ground-source heat pump system at ASHRAE headquarters in Atlanta serves as a good outline (Southard 2014). The monitoring points for the VRF system include:
• Operating mode (off/heat/cool)
• Zone temperature
• Discharge temperature for each fan coil unit
• Power consumption of the fan coil units and compressors
• Dedicated outdoor air system
o Supply flow rate
o Supply air temperature
o Return air temperature and humidity
o Fan power.
The electrical power submetering should meet the following criteria:
• Ability to measure and log real electrical power for an extended period of time. This offers a more accurate picture of energy use compared to a meter that provides only instantaneous readings.
• Sampling interval of 30 seconds
• Designed for the type of circuit to be metered (e.g., 480 Volt, 20 amp, 60 Hertz)
• Ability to accurately meter loads; rated to meet the load per phase (e.g., 0–80,000 Watts)
• Internal clock that timestamps each data point
• UL listing
• Compatibility with the BAS.
Because seasonal temperature variations influence VRF system performance, the monitoring period should be at least 1 year. Appendix A provides more specifics about temperature and flow rate measurement.
7.13.2 Guidance for Analysis Calibrated simulation is recommended for analyzing the as-built energy savings of VRF systems. An experienced energy modeler should use the monitored data to update inputs associated with an annual computer simulation of the building’s energy performance. Additional information about the building’s occupancy schedule, actual weather data and designed envelope, lighting and ancillary HVAC equipment, and controls should be gathered from BAS data and occupant/operator interviews to confirm model inputs. Remaining unknown model inputs are then adjusted such that the simulation predictions match the actual monthly or hourly energy

86
This report is available at no cost from the National Renewable Energy Laboratory (NREL) at www.nrel.gov/publications.
performance of the building; hourly calibration yields the highest level of accuracy. By using postconstruction data to calibrate the energy model, the energy performance from VRF systems may be precisely predicted. However, the energy savings associated with the system requires a baseline system for comparison. The baseline is different depending on whether the project is an existing building or new construction.
7.13.2.1 Existing Buildings For existing buildings, the energy savings are determined within the model by comparing the VRF energy performance to the energy performance of the HVAC system before the renovation. One caveat is for HVAC systems that are at the end of their useful life; in this instance, the project team should consider whether a new construction baseline is more appropriate. Similar instruments to the ones used to measure the VRF system can be used to monitor the previous HVAC system’s energy performance. The gathered data are then used to calibrate a baseline case of the whole-building model. Once calibrated, the energy performance from both before and after the renovation is then normalized by factors that affect their performance, such as assuming the same occupancy schedule and typical weather conditions. Once normalized, the energy savings from the VRF system are determined by taking the difference between energy consumption both before and after the renovation.
7.13.2.2 New Construction For new construction projects, the energy savings calculation is less clearly defined, because no measured data are available for comparison. ASHRAE 90.1 Appendix G outlines the energy modeling process for establishing baseline HVAC systems and associated inputs for new construction projects, though a more typical regional or building type-specific baseline may be justified. Both the baseline and VRF system models should be normalized using the same occupancy schedules and typical weather conditions. Once normalized, the energy savings from the VRF system are determined by taking the difference between energy consumption of the theoretical baseline and the actual VRF system.
The previously described submetered HVAC equipment data will indicate to building operators and commissioning agents whether any HVAC control issues or other items need corrective action. However, these data must be summarized in an easily digestible form that facility staff can readily understand. Chapter 1 provides specific guidance for this.
7.14 References and Other Resources Air-Conditioning, Heating, and Refrigeration Institute. Accessed March 2015: http://www.ahrinet.org/site/1/Home.
Amarnath, A.; Blatt, M. (2008). “Variable Refrigerant Flow: An Emerging Air Conditioner and Heat Pump Technology.” 2008 ACEEE Summer Study on Energy Efficiency in Buildings. Washington, DC: American Council for an Energy-Efficient Economy. Accessed March 2015: https://www.aceee.org/files/proceedings/2008/data/papers/3_228.pdf.
ASHRAE 90.1-2010. American Society of Heating, Refrigerating and Air-Conditioning Engineers, 2010. Sections of this standard outline minimum cooling (Table 6.8.1I) and heating efficiencies (Table 6.8.1J), as well fan power limitations (6.5.3.1). Additionally, VRF units with

87
This report is available at no cost from the National Renewable Energy Laboratory (NREL) at www.nrel.gov/publications.
cooling capacities less than 4.5 tons must have economizer or meet higher minimum efficiency. (6.5.1)
“Chapter 18: Variable-Refrigerant-Flow Systems.” 2012 ASHRAE Handbook – HVAC Systems and Equipment. American Society of Heating, Refrigerating and Air-Conditioning Engineers, 2012. Accessed March 2015: https://www.ashrae.org/resources--publications/description-of-the-2012-ashrae-handbook-hvac-systems-and-equipment.
“Measure Summary Report: Variable Refrigerant Flow.” EES Consulting, 2011. Accessed March 2015: http://www.bpa.gov/EE/Technology/EE-emerging-technologies/Projects-Reports-Archives/Documents/BPA_VRF_Measure_Report_Final_R1.pdf. This report summarizes the available Northwest-specific energy efficiency data and information on VRF systems. The report analyzes technical energy savings potential for VRF systems. It includes savings and cost information from a case study, a review of savings estimates supplied in the existing literature and a range of cost estimates.
Goetzler, W. (2007). “Variable Refrigerant Flow Systems.” ASHRAE Journal, 49:4, 24–31.
Hicks, A.K.; Morner, S.; Mueller, E. (2014). Evaluation of Advanced HVAC Technologies. Madison, WI: Wisconsin Focus on Energy EERD.
eQUEST Energy Modeling Guide for LG Multi V. Document No. VRF-TG-BK-001-US 012G03. LG, 2010. Accessed March 2015: http://www.lg-vrf.com/Assets/VRF-TG-BK-001-US-012G03_eQUEST_Building_Energy_Modeling_Guide_for_LG%20Multi_V_20120703095059.pdf.
Raustad, R. (2013). “Computer Modeling VRF Heat Pumps in Commercial Buildings Using EnergyPlus.” Prepared for ASHRAE Annual Meeting, June 2013. Orlando, FL: University of Central Florida, 8 pp. Accessed March 2015: http://www.osti.gov/scitech/servlets/purl/1093845.
Southard, L.E.; Xiaobing, L.; Spitler, J.D. "Performance of HVAC Systems at ASHRAE HQ." ASHRAE Journal (56:9), 2014; pp.14-24. https://www.ashrae.org/resources--publications/periodicals/ashrae-journal/features/performance-of-hvac-systems-at-ashrae-hq.
Thornton, B.; Wagner, A. (2012). Variable Refrigerant Flow Systems. Prepared by Pacific Northwest National Laboratory, Richland, WA. Washington, DC: General Services Administration. Accessed March 2015: http://www.gsa.gov/portal/mediaId/197399/fileName/GPG_Variable_Refrigerant_Flow_12-2012.action.

88
This report is available at no cost from the National Renewable Energy Laboratory (NREL) at www.nrel.gov/publications.
Chapter 8. Kitchen Exhaust Hood Controls 8.1 Description Exhaust hood airflow is a major contributor to energy use in commercial kitchens. Typically, an exhaust hood is turned on at the beginning of the workday and runs at full speed until it is turned off at the end of the day. A makeup air unit linked to the exhaust hood will also run at full speed during these hours of operation to resupply semiconditioned outdoor air to replace the air being exhausted. Running both fans continuously at full speed wastes substantial energy because the need for exhaust air fluctuates based on cooking load.
A solution to this problem is exhaust hood control, which varies the exhaust fan airflow based on cooking load, using VFDs to modulate fan speed. The exhaust hood controls can similarly regulate the speed of the makeup air unit fan supplying outdoor air to the kitchen hood. Controlling fan speed results in fan energy savings, and heating and cooling savings if the makeup air unit is also controlled. Figure 27 shows the savings possible from controlling kitchen exhaust hoods.
Figure 27. Typical airflow savings potential for commercial kitchen exhaust hood30
8.2 Application Controls for exhaust hoods can be implemented in most commercial kitchens, including supermarkets, restaurants, cafeterias, fast food restaurants, and hotels.
The two options for determining when to vary the exhaust fan speed are to: (1) use a temperature sensor in the exhaust hood to ramp the air volume up or down depending on the temperature of the exhaust gas; and (2) use an optic sensor to determine the amount of smoke in the exhaust airstream. For best results, use both a temperature and an optic sensor.
30 Assumes 30% minimum fan speed and 26% fan speed reduction (Fisher 2013).
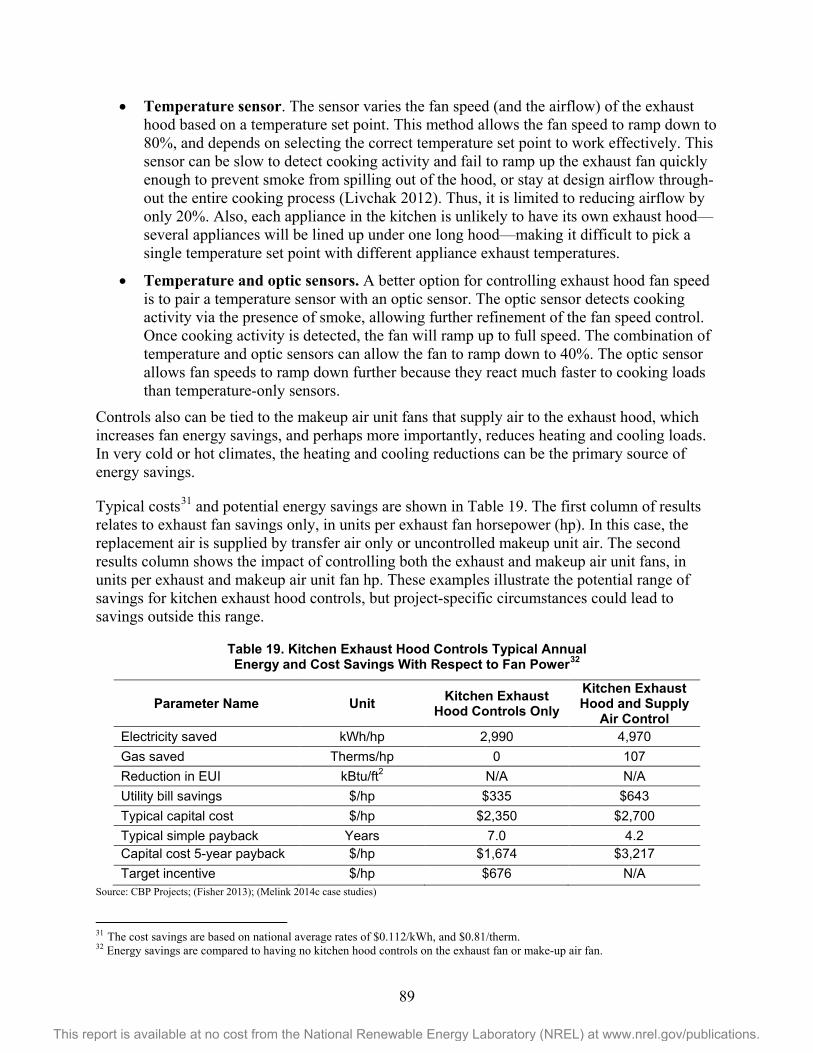
89
This report is available at no cost from the National Renewable Energy Laboratory (NREL) at www.nrel.gov/publications.
• Temperature sensor. The sensor varies the fan speed (and the airflow) of the exhaust hood based on a temperature set point. This method allows the fan speed to ramp down to 80%, and depends on selecting the correct temperature set point to work effectively. This sensor can be slow to detect cooking activity and fail to ramp up the exhaust fan quickly enough to prevent smoke from spilling out of the hood, or stay at design airflow through-out the entire cooking process (Livchak 2012). Thus, it is limited to reducing airflow by only 20%. Also, each appliance in the kitchen is unlikely to have its own exhaust hood—several appliances will be lined up under one long hood—making it difficult to pick a single temperature set point with different appliance exhaust temperatures.
• Temperature and optic sensors. A better option for controlling exhaust hood fan speed is to pair a temperature sensor with an optic sensor. The optic sensor detects cooking activity via the presence of smoke, allowing further refinement of the fan speed control. Once cooking activity is detected, the fan will ramp up to full speed. The combination of temperature and optic sensors can allow the fan to ramp down to 40%. The optic sensor allows fan speeds to ramp down further because they react much faster to cooking loads than temperature-only sensors.
Controls also can be tied to the makeup air unit fans that supply air to the exhaust hood, which increases fan energy savings, and perhaps more importantly, reduces heating and cooling loads. In very cold or hot climates, the heating and cooling reductions can be the primary source of energy savings.
Typical costs31 and potential energy savings are shown in Table 19. The first column of results relates to exhaust fan savings only, in units per exhaust fan horsepower (hp). In this case, the replacement air is supplied by transfer air only or uncontrolled makeup unit air. The second results column shows the impact of controlling both the exhaust and makeup air unit fans, in units per exhaust and makeup air unit fan hp. These examples illustrate the potential range of savings for kitchen exhaust hood controls, but project-specific circumstances could lead to savings outside this range.
Table 19. Kitchen Exhaust Hood Controls Typical Annual Energy and Cost Savings With Respect to Fan Power32
Parameter Name Unit Kitchen Exhaust Hood Controls Only
Kitchen Exhaust Hood and Supply
Air Control Electricity saved kWh/hp 2,990 4,970 Gas saved Therms/hp 0 107 Reduction in EUI kBtu/ft2 N/A N/A Utility bill savings $/hp $335 $643 Typical capital cost $/hp $2,350 $2,700 Typical simple payback Years 7.0 4.2 Capital cost 5-year payback $/hp $1,674 $3,217 Target incentive $/hp $676 N/A
Source: CBP Projects; (Fisher 2013); (Melink 2014c case studies)
31 The cost savings are based on national average rates of $0.112/kWh, and $0.81/therm. 32 Energy savings are compared to having no kitchen hood controls on the exhaust fan or make-up air fan.

90
This report is available at no cost from the National Renewable Energy Laboratory (NREL) at www.nrel.gov/publications.
8.2.1 Controlling Exhaust Hood Only Controlling only the exhaust hood is possible if a make-up air unit is not used for replacement air. Air that is exhausted from the kitchen must be replaced by an equal volume of outside air. Typically, the kitchen will be slightly negatively pressurized so that kitchen odors do not enter adjacent rooms. A negatively pressurized kitchen also allows air to transfer naturally from adjacent rooms to the kitchen and replace the air exhausted from the kitchen, potentially negating the need for a makeup air unit. Using naturally transferred air, often from a dining area, to replace air exhausted from the kitchen is a common strategy. Using air that is already being conditioned does not add heating or cooling loads to the building, but other issues make this strategy challenging:
• The transfer air must meet the ventilation requirements for the space it supplies, such as a dining room. Energy codes, such as ASHRAE 90.1 (2010) and IECC (2012), require demand controlled ventilation in dining rooms.
• Using transfer air from a space that has demand controlled ventilation can cause air balancing issues (AEC 2009). If a kitchen exhaust hood receives all its replacement air from transfer air, the controls are often not tied to the supply air handling unit. So, unless the occupancy schedule in the dining room closely matches the kitchen cooking schedule, either too little or too much outdoor air is supplied to the kitchen exhaust hood.
• The transfer air must flow into the kitchen at a low velocity to prevent cooking effluent from escaping the exhaust hood. This low air velocity is accomplished by using a large opening between the space providing the transfer air and the kitchen.
• If the air handling units serving the transfer air space are in economizer mode, they may operate at higher than design velocities. A final challenge is that high air velocities can cause hot food to cool too quickly.
8.2.2 Controlling Exhaust Hood and Makeup Air Typically, transfer air is used only to supply some of the replacement air needed: 80% often comes from a make-up air unit (AEC 2009). Figure 28 shows such a system, with both temperature and optic sensors for optimal control. The make-up air unit uses unconditioned outdoor air, which must be conditioned before it is supplied to the space, resulting in higher heating and cooling loads. The makeup air units serve only the kitchen exhaust hood, easily allowing the fan speed to be adjusted using a VFD tied to the exhaust hood controls. This strategy does not result in under- or overventilation, and significantly reduces heating and cooling loads.

91
This report is available at no cost from the National Renewable Energy Laboratory (NREL) at www.nrel.gov/publications.
Figure 28. Controlling exhaust and make-up air fan energy use
(Courtesy Jason Sippel, Energy Center of Wisconsin) 8.3 Real-World Considerations Energy savings from controlling exhaust hoods depend largely on fan power, hours of operation, and geographical location. The cost effectiveness of kitchen exhaust hood controls increases proportionally to the size of the fan because the systems are typically quoted on a cost per hood and not a cost per fan power basis (SPEED 2013). Kitchen exhaust hood controls are typically cheaper in new construction than in retrofit because the installation is less complex. Figure 29 illustrates that a cafeteria operating 16 hours per day will see a much quicker payback than a restaurant serving only dinner, because the exhaust hood fan is running for more hours each day.
Figure 29. Fan energy savings with respect to fan power and hours of operation

92
This report is available at no cost from the National Renewable Energy Laboratory (NREL) at www.nrel.gov/publications.
Savings are higher in cold climates, assuming the makeup air unit is tied to the kitchen exhaust hood controls. Reducing the amount of unconditioned makeup air supplied to the kitchen in a climate with both cold winters and hot summers, such as Minnesota, significantly reduces heating load in the winter and cooling load in the summer. In temperate climates such as parts of California that have minimal heating or cooling load, overall savings are lower.
Nonenergy benefits. This EEM typically results in lower kitchen noise because the fan is not running at full power all the time. Varying the speed on the kitchen exhaust hood fan and makeup air fan can also extend the life of the equipment, because it is used less heavily. Starting and stopping motors gently with a VFD reduces wear over switching the fan on and off to full speed. It can also reduce the number of filters on makeup air units that need to be cleaned or replaced (Focus on Energy 2009).
8.4 Code Requirements Energy codes are beginning to address controls for kitchen exhaust hoods. ASHRAE 90.1-2010 requires that kitchens with exhaust airflow exceeding 5,000 cfm meet one of the following conditions:
• Use less than 50% transfer air
• Have variable speed exhaust fans and temperature/optic controls
• Employ exhaust heat recovery (not typically implemented though).
Generally, variable-speed fans on the exhaust hood and makeup air unit are the most cost-effective, reliable method for complying with ASHRAE 90.1 (2010). Although using transfer air to replace exhaust air can save heating and cooling energy, it can be challenging for several reasons (see Section 8.2.1). Exhaust heat recovery is more expensive than variable-speed fans and can be dangerous if grease builds up in the hood, so it is typically not implemented (DOE 2012).
ASHRAE 90.1 2010 requires controlling at least 75% of the exhaust air with a demand ventilation system that reduces airflow rates for the exhaust and makeup air systems up to 50% (DOE 2012). Temperature sensors alone will not achieve these targets, meaning the code indirectly requires both temperature and optic sensors.
More aggressive control—exceeding ASHRAE 90.1 2010—is possible. For additional energy savings, 100% of exhaust air can be controlled and fan speeds can ramp down below 50% (30%–40%) without hurting performance (Melink 2014b).
8.5 Financial Incentives Many state and utility energy efficiency programs provide incentives for installing exhaust hood controls. Incentives are available for new systems and for adding controls to existing systems. These programs have incentives for temperature sensors alone and for both temperature and optic sensors.

93
This report is available at no cost from the National Renewable Energy Laboratory (NREL) at www.nrel.gov/publications.
Wisconsin Focus on Energy
• Exhaust temperature sensing only with a new or existing system—$200 or $250/hp
• Makeup air unit tied to kitchen exhaust hood temperature sensing only controls—$50/hp
• Exhaust temperature and optic sensing with new or existing system—$600 or $700/hp
• Makeup air unit tied to kitchen exhaust hood temperature and optic sensing controls with new or existing system—$80 or $100/hp.
Peoples Gas Prescriptive Rebate Program. Installation of new or retrofit exhaust hood controls—$650/hp.
Pacific Gas & Electric Food Service Rebates. Exhaust hood control system installed on new or existing hood and make-up air system—$350/hp.
8.6 Project Results Lackland Air Force Base near San Antonio, Texas, has embarked on a renovation of its commissary, a supermarket managed by the Defense Commissary Agency (DeCA) (Table 20). The CBP program provided technical assistance to DeCA during the design process to analyze EEMs that could be incorporated into the renovation. The renovation includes replacing the product refrigeration system and HVAC equipment that was reaching the end of its life. One measure that DeCA considered was kitchen exhaust hood control.
Table 20. Kitchen Hood Exhaust Controls at Lackland Air Force Base Commissary
Project Commissary Renovation Building size 123,711 ft2 Project description DeCA Lackland Air Force Base in San Antonio, Texas
Kitchen exhaust hood controls
Kitchen exhaust hood control using temperature and optic sensors. Temperature sensor adjusts exhaust speed linearly with temperature. Optic sensors turns exhaust fan to full speed if smoke is detected. The kitchen hood controls were tied to the makeup air unit that supplied replacement air for the kitchen hood, but not transfer air. Transfer air accounted for 30% of replacement air supplied to the kitchen hood. The total controlled exhaust and make-up fan power was 3.08 hp.
Expected annual energy savings 15,527 kWh; 298 therms Expected annual energy cost savings $1,148 ($1,980 using national average utility costs)33 EEM cost $12,000–$15,000 Reduction in EUI (kBtu/ft2) 0.669 kBtu/ft2 Energy cost rate for this project $0.0622/kWh, $0.6121/therm
Simple payback 10–13 years (6.1–7.6 years using national average utility costs)34
Annual carbon emissions avoided 12.7 metric tons CO2e35
33 The cost savings are based on national average rates of $0.112/kWh, and $0.81/therm. 34 The simple payback period is based on national average rates of $0.112/kWh, and $0.81/therm. 35 Greenhouse gas reductions are given in terms of CO2e. For electricity, 0.000692 metric tons CO2e/kWh are assumed to be avoided. For natural gas, 0.006418 metric tons CO2e/therm are assumed to be avoided.

94
This report is available at no cost from the National Renewable Energy Laboratory (NREL) at www.nrel.gov/publications.
Despite the real energy benefits of this EEM, as well as the nonenergy benefits, DeCA determined that it was cost prohibitive in this application because the exhaust and make-up air fans controlled were small. Kitchen hood controls are more cost effective for larger fans, because the first cost does not scale proportionately to fan size. Transfer air was not controlled and made up 30% of the replacement air. If a larger percentage of replacement air was supplied by the controlled make-up air unit, the measure would show larger savings. Finally, the energy cost rate for this project is lower than the national average rate. Using the national average utility rate, this project has a much more reasonable simple payback period of about approximately 7 years. As in all cases, economic evaluation should be done on a case-by-case basis and include consideration of other energy retrofit opportunities and incentives that can lead to more favorable return on investment.
The Crowne Plaza near Reagan National Airport in Washington, D.C., embarked on a renovation of its 14-story, full service hotel with a restaurant (Figure 30 and Table 21). The CBP program provided technical assistance to Crowne Plaza to analyze EEMs that could be incorporated into the renovation. The goal was to reduce energy consumption by at least 30% versus requirements set by ASHRAE 90.1 2004. One EEM that Crowne Plaza considered was kitchen exhaust hood control.
Figure 30. Crowne Plaza Hotel
(DOE 2013)
Table 21. Crowne Plaza Hotel Renovation
Project Crowne Plaza Building size 144,000 ft2 Project description Crowne Plaza Hotel in Washington, D.C. Expected annual energy savings 70,000 kWh Expected annual energy cost savings $5,300 EEM cost $9,000 Reduction in EUI (kBtu/ft2) 1.7 kBtu/ft2 Energy cost rate for this project $0.0761/kWh Simple payback 1.7 years Annual carbon emissions avoided 48.4 metric tons CO2e
36
36 For electricity, 0.000692 metric tons CO2e/kWh are assumed to be avoided. For natural gas, 0.006418 metric tons CO2e/therm are assumed to be avoided.

95
This report is available at no cost from the National Renewable Energy Laboratory (NREL) at www.nrel.gov/publications.
8.7 Modeling Kitchen Exhaust Hood Controls Kitchen exhaust hoods are generally modeled as basic room exhaust fans (differentiating them from system exhaust because they are often not in the same air handling unit. When advanced controls are implemented in a kitchen exhaust fan, its schedule should be modified accordingly. Generally the exhaust control should also be tied directly to make-up air control; this tie should also be included in the model. Guidance for modeling kitchen exhaust hoods in EnergyPlus is provided in Appendix B.
8.8 Ensuring Performance 8.8.1 Installation Controls for kitchen exhaust hoods and make-up air units can be installed in new construction projects or as a retrofit improvement.
• Contractor or equipment manufacturer installs the controls.
• If multiple exhaust hoods are tied to one exhaust fan, each exhaust hood needs its own damper to regulate airflow. If dampers are not installed and properly balanced, the exhaust fan will ramp up to full speed if any one of the hoods is in cooking mode (even if another hood controlled by that same exhaust fan is off or idle, resulting in lower energy savings [Livchak 2012]).
• VFDs should be located in an area where temperatures are always 14o–122oF. There should be 5 in. of clearance on the top and bottom and 1 in. of clearance on the sides to achieve adequate cooling. The VFD should not be located where it will be contaminated with dirt, grease, or water (Melink 2014a).
• Install a temperature sensor in the exhaust duct. For an average temperature reading, put the tip of the sensor in the center of the exhaust duct. Temperature sensors should be placed where they are easily accessible, and not near light bulbs (which produce heat).
• Place optic sensor in location with easy access. The optic sensor should be located in the center of the kitchen hood so it can detect most of the smoke that passes through the exhaust hood.
8.8.2 Commissioning See Chapter 1 for information about the general commissioning process.
• A commissioning agent, independent of the installing contractor, should verify that the kitchen hood exhaust controls operate as expected. This person should:
o Design a comprehensive functional test to verify all elements of the control sequence. The sequence should include a check or checks when no cooking is occurring, to ensure that fan speeds modulate. If fans continue to operate at full load check the optic sensor to see if it is clean, and check the programming and set point temperature sensors.
o Verify capture and containment visually by observing smoke or steam produced by actual cooking, or simulated cooking (e.g., steam).

96
This report is available at no cost from the National Renewable Energy Laboratory (NREL) at www.nrel.gov/publications.
o After occupancy, monitor the kitchen fan power over the course of a day to see if the controls work as expected.
o If multiple exhaust hoods are tied to one exhaust fan, it should rarely be at 100% design power because it is unlikely that all the hoods would require full loading at the same time. If this occurs, check to see if dampers are balanced in accordance with the UL 710 standard (Livchak 2012).
8.8.3 Controls Programming The installing contractor should be responsible to program the controls for the hood, fans, and make-up air units (though the manufacturer may provide some assistance). The commissioning agent should be responsible only to verify that controls are working correctly.
Proper controls programming is critical to maximize energy savings. The maximum ramp-down speed depends on the type of controls installed. If a temperature-only control is installed, the maximum turn down should be 80% of design (Livchak 2012). If temperature and optic sensors are installed, then the maximum turn down can be as low as 30% of design. A minimum speed below 30% causes too much stress on the fan motors and can cause smoke to roll out of the hood before the optic sensor detects it (Melink 2014b). The difference in the turn down is due to the optic sensor’s ability to ramp up the fan speed more quickly than the temperature sensor when smoke is detected.
If the temperature sensor set point is too low, the fan will be at full speed the majority of the time, and little energy savings will result. If the temperature sensor set point is set too high, the fan speed may be too low and the exhaust hood may not capture all the smoke. An optimal set point depends on the appliance the exhaust hood serves. For instance, a charbroiler will typically produce a higher duct temperature than an open-vat fryer, so they should not be controlled using the same temperature set point. A kitchen space temperature sensor should be used to reset the exhaust temperature sensor. If the kitchen space has no temperature sensor, the exhaust temperature sensor should be reset in the winter and summer to account for different room temperature set points (winter is typically conditioned to 72°F; summer is typically conditioned to 75°F) (Livchak 2012).
8.8.4 Operation Either the kitchen staff or building maintenance staff needs to clean the exhaust hood optic sensors at least once every other week. If the optic sensors accumulate grease, they will stop working properly and the fan will run at full speed, rendering the controls useless. The temperature sensors need to be cleaned less frequently.
8.8.5 Occupant Behavior Maintenance staff should be trained to operate the exhaust hood, make-up air unit, and controls. They must then train kitchen staff on how the exhaust hood controls work, and why they are there (to save energy). If kitchen staff does not understand how or why controls work, they may override the sensors.
• The system should alert maintenance staff if the override button is activated, so they can determine why, and potentially reset the system.

97
This report is available at no cost from the National Renewable Energy Laboratory (NREL) at www.nrel.gov/publications.
• Kitchen staff should inform maintenance staff if they notice the fans not ramping down during idle times. Kitchen staff should be able to sense fan speed based on the noise level.
8.9 Measurement and Verification Measuring and verifying achieved energy savings are integral to reducing energy use in buildings. (See Chapter 1 for information about the general M&V process.) Because the kitchen hood is relatively isolated from other building systems, an isolated metering approach is often used to verify its exhaust control energy savings. However, kitchen hood exhaust controls can affect HVAC energy consumption, so a more accurate, but more expensive, approach also includes whole-building calibrated simulation.
8.9.1 Recommended Monitoring Points Ideally, the kitchen exhaust and make-up air unit fan power should be monitored to ensure that motors are modulating properly to save energy (kitchen staff can help by being aware of fan noise levels). If the fan is at full power most of the time, the kitchen hood controls likely need to be adjusted. Real power meters should meet the following criteria:
• Sampling interval of 30 seconds
• Designed for the type of circuit to be metered (e.g., 480 Volt, 20 amp, 60 Hertz)
• Ability to accurately meter loads; rated to meet the load per phase (e.g., 0–3600 Watts)
• Internal clock that timestamps each data point
• UL listing
• Compatibility with the BAS.
If the make-up air unit is also connected to controls, the impact on heating and cooling energy should also be considered, though it is not easily measured directly (because measuring airflow as a variation in outdoor air properties is difficult). To estimate cooling and heating energy savings, the make-up air unit power measurements can be used to determine the average reduction in flow rate (via fan laws); this is then multiplied by the difference in enthalpy between outside air and supply air (as well as air density) to get energy savings (Food Service Technology Center 2014). (Appendix A provides more specifics about temperature and flow rate measurement.)
8.9.2 Guidance for Analysis 8.9.2.1 Existing Buildings For existing buildings, energy performance both before and after initiating the kitchen exhaust hood control strategies may be measured explicitly. The energy from both periods is then normalized by factors that affect their performance, such as changes in cooking patterns or number and type meals being cooked. Once normalized, the energy savings from this strategy is determined by taking the difference between energy consumption both before and after the strategy was initiated.
98
This report is available at no cost from the National Renewable Energy Laboratory (NREL) at www.nrel.gov/publications.
8.9.2.2 New Construction For new construction projects, the energy savings calculation is less clearly defined, because no measured data is available for comparison. Calculations—generally simple spreadsheet models—can be used to approximate the theoretical energy consumption of a baseline case versus the measured case. Sources include any existing facilities or operations that the building owner or tenant has (generally, for new construction the occupants will be moving or expanding from existing facilities). The exhaust fans and make-up air units of these facilities can be monitored before completion of the new construction project, and the monitored data from these facilities can be used to establish the conditions in the absence of advanced controls for the energy savings calculation.
Both the baseline and upgraded system models should be normalized using the same cooking schedules and typical weather conditions. Once normalized, the energy savings from the exhaust hood control system are determined by taking the difference between energy consumption of the theoretical baseline and actual system with controls.
8.9.3 Best Practices for Addressing Operational Problems If the fan is found to be operating at near full speed, the first item to check is if the optic sensor needs to be cleaned. The second item to check is that the temperature sensor is at the right set points. If the set point is too low, the fan will run at all times (see Section 7.8.2 for more details).
As an added safety factor, kitchen staff should monitor and note if smoke seems to be escaping from the kitchen hoods. If the kitchen hoods are obviously not capturing smoke as intended, the temperature set point should be reduced.
8.10 References and Other Resources ANSI/ASHRAE/IES Standard 90.1-2010: Kitchen Exhaust. U.S. Department of Energy, 2012. Accessed March 2015: http://www.energycodes.gov/sites/default/files/documents/cn_kitchen_exhaust.pdf. “Demand Control Kitchen Ventilation.” State Partnership for Energy Efficient Demonstrations, 2013. Accessed March 2015: http://wcec.ucdavis.edu/wp-content/uploads/2013/07/Case-Study-DCKV_Compilation_Web.pdf. Demand Control Ventilation for Commercial Kitchen Hoods. Southern California Edison, 2009. Accessed March 2015: http://www.melinkcorp.com/pdf/Case-Studies/Southern%20Cal%20Edison_com_kitch_hoods_final_report.pdf. Design Guide 3: Improving Commercial Kitchen Ventilation System Performance Integrating Kitchen Exhaust Systems with Building HVAC. Southern California Edison, 2009. Accessed March 2015: http://www.fishnick.com/ventilation/designguides/CKV_Design_Guide_3_072209.pdf.

99
This report is available at no cost from the National Renewable Energy Laboratory (NREL) at www.nrel.gov/publications.
Fisher, D.; Karas, A.; Swierczyna, R. (2013). “Future of DCV for Commercial Kitchens.” ASHRAE Journal 55:2. Accessed March 2015: https://ashrae.org/resources--publications/periodicals/ashrae-journal/features/future-of-dcv-for-commercial-kitchens. “Intelli-Hood: Case Studies.” Melink Corporation, 2014a. Accessed March 2015: http://www.melinkcorp.com/Products-and-Services/Kitchen-Ventilation-Controls/Case-Studies.aspx. “Intelli-Hood: Installation Manual.” Revision 130711. Melink Corporation, 2014b. Accessed March 2015: http://www.melinkcorp.com/pdf/Intelli-Hood/Melink%20NextGen%20(IH3)%20Installation_Manual_07-11-2013-1.pdf. “Intelli-Hood: Operation Manual.” Revision 130925. Melink Corporation, 2014c. Accessed March 2015: http://www.melinkcorp.com/pdf/IH3%20Operations%20and%20Maintenance%20Manual.pdf. “Kitchen Ventilation Controls: Variable-Volume Control Ventilation Saves Energy, Money.” Focus on Energy, 2009. Accessed March 2015: https://focusonenergy.com/sites/default/files/kitchenventilation_factsheet.pdf. Livchak, A.; Sandusky, J.; Schrock, D. (2012). “Demand-Controlled Ventilation for Commercial Kitchens.” ASHRAE Journal 54:11, 8 pp. Accessed March 2015: http://www.haltoncompany.com/halton/usa/cms.nsf/files/126C845CF5848CB0C2257ADB0064E93A/$file/036-049_schrock.pdf. “Outdoor Air Load Calculator.” Food Service Technology Center, 2014. Accessed March 2015: http://www.fishnick.com/ventilation/oalc/. Variable-Frequency Drives. Total Resource Efficiency Education, 2011. Accessed March 2015: http://members.questline.com/presentations/20111025ecovavariablefreqdrives.pdf.

100
This report is available at no cost from the National Renewable Energy Laboratory (NREL) at www.nrel.gov/publications.
Chapter 9. Evaporative Precooling and Condensing for Packaged Rooftop HVAC Units
9.1 Description One factor driving energy cost in commercial buildings is peak electricity demand, much of which comes from cooling. Under normal conditions, peak demand occurs on hot days in the midafternoon and early evening, when the building cooling load is at its maximum. Methods to reduce peak energy demand from cooling include reducing the cooling load and increasing the cooling equipment efficiency. Evaporative cooling strategies can be used to target both opportunities. Successful evaporative precooling decreases the ventilation cooling load on the RTU’s evaporator coil. Evaporative condensing increases the efficiency of cooling equipment.
9.2 Application 9.2.1 Technology Overview Evaporative cooling is a well-understood, efficient method for meeting cooling loads in arid climates. Nearly everyone has experienced evaporative cooling; namely, the cool feeling experienced when leaving the shower or swimming pool, caused by the endothermic evaporation process. This same effect can be applied to cool air; it has been used for centuries in some hot, arid climates.
The evaporation of water into dry air decreases temperature. Because water has a high enthalpy of vaporization, the evaporative cooling process is much more efficient than typical mechanical cooling that uses air-cooled DX systems (air conditioning). However, evaporative cooling effectiveness, and therefore cooling capacity, varies with the outdoor air conditions, primarily wet bulb temperature. The wet bulb temperature is the lowest possible temperature achievable by evaporative cooling (when the air has reached 100% saturation). As relative humidity decreases (less water vapor present in the air), the temperature difference between the wet bulb and dry bulb temperatures increases. The greater the difference between wet bulb and dry bulb temperatures, the more effective evaporative cooling is compared to more traditional air-cooled DX systems. Thus, the potential benefit of evaporative cooling will be greater in arid climates than in humid climates.
Nearly all commercial buildings employ mechanical cooling instead of relying on evaporative cooling alone. But by using evaporative precooling, the high efficiency and peak reduction advantages of evaporative cooling can be harnessed in combination with the performance of a traditional DX cycle (Dirkes 2011).
The two types of evaporative cooling are direct and indirect. Direct evaporative cooling (DEC) evaporates water into the air, increasing its humidity and decreasing its temperature. The lowest achievable temperature from DEC is defined by the following equation:
𝑇𝑙𝑙𝑙𝑙𝑙𝑙𝑙𝑙𝑙𝑙 = 𝑇𝑑𝑙𝑑𝑑𝑑𝑙𝑑 − ��𝑇𝑑𝑙𝑑𝑑𝑑𝑙𝑑 − 𝑇𝑤𝑙𝑤𝑑𝑑𝑙𝑑�𝜀� Where,

101
This report is available at no cost from the National Renewable Energy Laboratory (NREL) at www.nrel.gov/publications.
Tleavingair is the temperature of the evaporatively cooled air.
Tdrybulb and Twetbulb, respectively, are the dry bulb and wet bulb temperatures of the ambient air entering the evaporative cooler.
𝜀 is the effectiveness of the evaporative cooling process. Typically, an effectiveness of 80% is achievable.
As previously mentioned, lower wet bulb temperatures (lower humidity) allows for lower leaving air temperatures (assuming constant effectiveness and dry bulb temperature).
The second type of evaporative cooling is indirect evaporative cooling (IDEC), which uses two airstreams: the primary stream, which is used for ventilation air, and the secondary airstream, which is cooled using DEC. A heat exchange process occurs between the primary and secondary airstreams. The secondary airstream (now humid and cool) lowers the temperature of the primary airstream without increasing its humidity.
Evaporative cooling is applied in two ways with a traditional DX RTU; evaporative condensing and evaporative precooling. The first method, evaporative condensing, uses DEC, which cools the outdoor air via the evaporation of water into the air, decreasing its temperature and increasing its humidity. This cooler, more humid air is then used to cool the condenser of a DX RTU, thereby increasing the cycle’s efficiency. The second method, evaporative precooling, uses IDEC to precool the ventilation air. IDEC uses an indirect heat exchange process between the ambient air and either a secondary, scavenger airstream that is evaporatively cooled or a coil in the ventilation airstream carrying evaporatively cooled sump water from the DEC process serving the condenser. In this way, the temperature of the air used for ventilation can be decreased without increasing its humidity. Evaporative precooling and evaporative condensing can also be combined into a hybrid evaporative cooling system with DEC providing evaporative condensing while IDEC precools the ventilation air. Figure 31 shows a DEC design for evaporative condensing. Figure 32 shows a hybrid evaporative precooling system.
Figure 31. Munters RTU with Evaporcool evaporative condensing installed
(Rois Langner, NREL)

102
This report is available at no cost from the National Renewable Energy Laboratory (NREL) at www.nrel.gov/publications.
Figure 32. RTU with DualCool hybrid system installed, which includes evaporative precooling and evaporative condensing
(Courtesy Integrated Comfort, Inc.) Figure 33 plots an example of a hybrid evaporative cooled DX system (evaporative precooling and evaporative condensing) on a psychrometric chart. This system uses scavenger air or a DEC secondary airstream to cool the ventilation air. The scavenger air also cools the condenser (DEC). The system states are defined below.
• State 1 is incoming outdoor air at 90°F dry bulb temperature and 30% relative humidity, representative of a hot, arid climate.
• Some incoming outdoor air is evaporatively cooled (DEC) to state 4. This is the scavenger or secondary air stream. During this process, the air experiences an increase in humidity and decrease in dry bulb temperature.
• The remainder of the incoming air is the primary airstream. The primary air could be mixed with return air if present. In this example, there is no return air. The primary airstream is sensibly cooled by the scavenger air stream (state 1 to state 2). This is the IDEC process.
• The heat extracted from the primary airstream is used increase the dry bulb temperature of the scavenger airstream (state 4 to state 5).
• The secondary air is used to cool the condenser (because state 5 is cooler than state 1). The secondary airstream exits the condenser at state 6. This increases the efficiency of the DX cycle.
• The primary airstream is further cooled and dehumidified by the DX coil (state 2 to state 3). Without evaporative cooling of the ventilation air (state 1 to state 2), the DX cycle would have cooled the ventilation air from state 1 to state 3, increasing the energy consumption of the system.

103
This report is available at no cost from the National Renewable Energy Laboratory (NREL) at www.nrel.gov/publications.
Figure 33. Psychrometric chart plotting a hybrid evaporative cooling process
Figure 34 depicts an RTU using a hybrid evaporatively cooled process. The DX cycle is outlined in orange while the evaporative cooling system is outlined in dark blue. This hybrid system differs from the one seen in Figure 33 in that it uses sump water for IDEC of the ventilation air. The following letters correspond to key functions in the hybrid evaporative system in Figure 34.
A. Incoming outdoor air (hot, dry) is blown across the evaporative media, decreasing the dry bulb temperature and increasing the relative humidity of the air.
B. The cooler, more humid air is blown across the condenser, increasing the efficiency of the DX cycle (compared to using hot outdoor air that was not DEC).
C. The water not absorbed by the incoming outdoor air collects below the evaporative media. This water is cooler and is pumped to D.
D. The cooler water from the evaporative media sump is pumped through a heat exchanger, which cools incoming air for ventilation without increasing its humidity. This is the IDEC process.
E. The IDEC cooled ventilation air is then further cooled and dehumidified by the DX evaporator coil.
F. The conditioned air can be supplied to the space for cooling.

104
This report is available at no cost from the National Renewable Energy Laboratory (NREL) at www.nrel.gov/publications.
Figure 34. Major components and process flows in a hybrid evaporative precooled DX RTU
(Courtesy Western Cooling Efficiency Center, University of California, Davis) An evaporative cooler greatly reduces the ventilation cooling load that must be met by the DX cycle. It also can increase the economizing window, or the amount of time that outside air can be used to cool the building. For example, if the maximum temperature of the economizing window is 70°F without evaporative cooling, adding evaporative precooling to the maximum economizing window might increase the temperature to 80°F. This increase in the economizing window can lead to significant energy savings. When mechanical cooling is needed, evaporative condensing additionally improves the DX cycle’s efficiency. Annual energy savings vary based on application, but can be as high as 50% when operating optimally (Felts 1998).
Table 22 provides two examples and associated savings for hybrid evaporative precooled systems. The first example represents a hybrid evaporative cooled DX RTU system on a 213,000-ft2 retail store in Centennial, Colorado. This store featured evaporative precooling on approximately one-third of the total DX RTU cooling capacity. The baseline for this example was rooftop units without evaporative precooling (for more detail on this project see Section 9.5). The second example features a 38,000-ft2 office building located in Denver, Colorado. This building features hybrid evaporative precooling. The baseline system is DX RTUs, which do not feature evaporative precooling. Both examples are based on CBP program projects. These results are climate dependent; owners in humid locations should not expect similar results. Installation
A
D
E B
F C

105
This report is available at no cost from the National Renewable Energy Laboratory (NREL) at www.nrel.gov/publications.
and system design also plays a significant role in the energy savings realized. Furthermore, evaporative condensing systems (nonhybrid) may see different results.
Table 22. Possible Performance Values Expected for an Evaporative Precooling System
Parameter Name Unit Retail Store With
Hybrid Evaporative Precooling
Office Building With Hybrid Evaporative
Precooling Electricity saved kWh/ft2 0.23 0.49 Gas saved Therms/ft2 N/A N/A Reduction in EUI kBtu/ft2 0.8 1.66 Utility bill savings37 $/ft2 0.03 0.05 Typical capital cost $/ft2 0.21 0.34 Typical simple payback Years 7.9 6.3 Capital cost 5-year payback $/ft2 0.13 0.27 Target incentive $/ft2 0.08 0.07
9.2.2 Common Application: Packaged Rooftop Units Evaporative cooling can be installed on any packaged cooling system, either retrofit or new. Typical buildings that use such units are retail stores or small- to medium-size office spaces; however, they can also be found in small data centers (often for telecom applications), and a variety of other locations. Any space that uses a packaged rooftop DX cycle is a candidate for evaporative cooling (condensing or hybrid), especially if the space has large cooling loads.
The two mainstream markets for evaporative precooling are: (1) integrated units, where the RTU comes complete with evaporative cooling; and (2) an add-on kit sold for retrofit applications, where the evaporative cooler can be attached to an existing RTU.
9.3 Real-World Considerations Prospective users need to remember that evaporative cooling is used to assist the RTU and increase the overall system efficiency, but DX cooling provides most of the system’s cooling capacity.
9.3.1 Climate and Water Climate is the largest consideration for use of evaporative cooling; the greatest benefits accrue in hot, arid climates. Humid and most marine climates have fewer hours with dry enough conditions for evaporative cooling to have an impact. Some designs avoid this problem by using exhaust air from the building as a secondary airstream to be evaporatively cooled. The building exhaust air will have a lower humidity ratio than the outdoor air.
The most effective climates for evaporative cooling are arid. Unfortunately, in these same areas water consumption is often a concern. Water consumption will vary depending on the weather, size, and operation of the system but should be considered when evaluating different systems.
Water purity should also be considered. Impure water can cause scaling and other problems that can hinder heat transfer. Water may need to be treated to reduce or slow the buildup of deposits, such as calcium (scaling) or algae, on heat transfer media. Figure 35 shows direct evaporative 37 The cost savings are based on national average rates of $0.112/kWh, and $0.81/therm.

106
This report is available at no cost from the National Renewable Energy Laboratory (NREL) at www.nrel.gov/publications.
media with algae buildup (Corradini et al. 2012). Some systems use a bleed valve to control the amount of minerals in the evaporative system sump water. These valves must be set to the manufacturer’s recommendation for proper operation.
Figure 35. Direct evaporative media with algae buildup (Courtesy Antonio Corradini, AESC, Inc.)
Routine maintenance of the HVAC system can determine if action should be taken to remove any deposits on the direct evaporative media. The final consideration with water is freeze protection. If the evaporative cooling system is installed in a climate with freeze potential, such as Colorado, the water lines for the evaporative cooler must be blown out before winter to prevent freezing and pumps must be drained to avoid damage.
9.3.2 Utility Rates The utility rate structure can also play a role in the benefits users will receive from an evaporative cooled RTU. Customers of utilities with high peak demand charges will see the greatest economic benefit as compared to customers of utilities with flat-rate structures. High electricity rates also increase the savings.
9.3.3 Equipment Adding evaporative cooling to an RTU system increases fan and pump power consumption. Placing an IDEC coil in the outdoor airstream will increase the pressure drop across the supply fan, increasing energy consumption. The authors recommend that the system be rebalanced after the evaporative cooling equipment is installed, to ensure that the correct amount of airflow is being supplied. Also, if an exhaust fan is used to move the secondary stream of air for IDEC, fan energy consumption will be further increased. If IDEC is accomplished using sump water, this extra fan energy will not be present but pumping energy will be needed to move the water. These additional areas of energy consumption must be subtracted from the energy savings achieved by precooling the supply air and condenser air.

107
This report is available at no cost from the National Renewable Energy Laboratory (NREL) at www.nrel.gov/publications.
9.4 Financial Incentives Energy efficiency program incentives that apply specifically to evaporative precooling are not common. In arid climates, where evaporative precooling is most effective, it may qualify for rebates under the category of custom efficiency incentives. Programs offering rebates that may cover evaporative precooling include:
SRP Custom Business Solutions equipment rebates (Arizona). Pays $0.11/kWh for the first year of electricity savings, up to 50% of the incremental cost of custom efficiency projects.
Xcel Energy Colorado—Business Energy Efficiency Rebate Programs. Pays $400/kW reduced for custom efficiency projects.
Austin Energy—Commercial Energy Management Rebate Program (Texas). Pays up to $350/kW reduced for custom efficiency projects.
9.5 Project Results Walmart partnered with DOE to implement energy-saving solutions during the retrofit of its Centennial, Colorado, store as part of CBP. The partnership included M&V of numerous EEMs, including hybrid evaporative cooling (evaporative precooling and evaporative condensing). This store is 213,000 ft2 and was monitored before and after construction, to determine the realized energy savings. Table 23 provides more details about this building and the impact of evaporative precooling.
Table 23. Evaporative Cooling for Centennial Walmart Retrofit
Project Walmart Retrofit, Centennial, Colorado Climate zone 5B (dry) Building size 213,000 ft2
Project description Retrofit to a Walmart Supercenter. Included in the CBP Program
Evaporative cooling
Installed evaporative cooling on six 20-ton RTUs (building has 38 total RTUs with a combined capacity of 360 tons). Evaporative cooling installed on 120 tons of the total 360 tons of cooling capacity.
Evaporative cooling design and operation Hybrid system featuring evaporative precooling (from sump water) and evaporative condensing. Precooling enabled when OAT exceeds 66°F and disabled when OAT is below 64°F.
Expected annual energy savings 49,918 kWh Expected annual energy cost savings $7,511
Water consumption For all six evaporative units, the total water consumption averaged about 50,000 gal/month from July-September 2013.
Water cost The commercial water for Centennial, Colorado, is $2.95/1000 gal. Water usage by the evaporative cooling units would amount to roughly $150/month during the summer.
Reduction in EUI 0.8 kBtu/ft2 Simple payback 7.9 years Annual carbon emissions avoided 34.5 metric tons CO2e38
38 Greenhouse gas reductions are given in terms of CO2e. For electricity, 0.000692 metric tons CO2e/kWh is assumed to be avoided. For natural gas, reductions are assumed to be 0.006418 metric tons CO2e/therm avoided.

108
This report is available at no cost from the National Renewable Energy Laboratory (NREL) at www.nrel.gov/publications.
9.6 Modeling Evaporative Rooftop Savings Evaporative cooling is an effective way to reduce the peak power demand and increase RTU efficiency. The popularity of combining evaporative cooling and DX RTUs is relatively recent and thus does not yet have a well-defined modeling path. This guide will outline how to implement evaporative condensing and evaporative precooling (using sump water). The modeling approach for a hybrid system using scavenger air in EnergyPlus is not clear at this time. The Western Cooling Efficiency Center at the University of California-Davis is developing a tool for modeling more evaporative precooled RTU configurations (condenser cooled and hybrid methods). Guidance for modeling evaporative cooling in EnergyPlus is provided in Appendix B.
9.6.1 OpenStudio Guidance Evaporative precooling is supported in OpenStudio as well. The Building Component Library contains a packaged direct-indirect evaporative cooling measure (for a 100% outdoor air unit) that is ready to integrate directly into an OpenStudio model. It includes direct precooling of the ventilation air, plus an energy recovery wheel and the corresponding capability to deliver evaporative cooling indirectly via the return air path.
9.6.2 Western Cooling Efficiency Center Model guidance The Western Cooling Efficiency Center is currently developing a valuable tool for modeling and evaluating evaporative precooling systems.
9.7 Ensuring Performance 9.7.1 Installation
• Evaporative precooled systems can be installed in two ways: (1) they can be retrofit to an existing RTU following guidance from the manufacturer; and (2) packaged units for new construction can be installed in similar fashion to a traditional RTU.
• In either case, water lines must be run to the RTU to supply water for evaporative cooling.
• The installing contractor should check water spray and ensure that the spray coats the evaporative medium evenly. In the process of installing an evaporative retrofit at a Target store, for example, the commissioning agent found that about half of the water spraying out of one of the systems simply landed on the roof, leading to wasted water, reduced effectiveness, and potential premature roof damage. Fortunately the problem was discovered and corrected.
9.7.2 Commissioning See Chapter 1 for information about the general commissioning process.
• After installation, all operational aspects of the evaporative cooler should be checked. This includes verifying that the unit is pumping water and evaporatively cooling the air.
• If the installation includes evaporative cooling for the condenser coil only, the evaporative condensing should occur only when the RTU is operating.

109
This report is available at no cost from the National Renewable Energy Laboratory (NREL) at www.nrel.gov/publications.
• If the installation precools the incoming ventilation air, a full functional performance test should be included to verify the control sequences for the ventilation air.
• An ongoing or continuous commissioning plan should ensure that the cooler operates at the right times; for example, at the hottest outdoor air conditions. Previous case studies have shown that the evaporative coolers often did not operate during the hottest outdoor air conditions (Felts 1998).
• A water treatment system should be installed or the bleed valve should be set according to the manufacturer’s recommendation. This will help maintain mineral concentrations at an acceptable level that will slow the buildup of deposits on the evaporative media and avoid wasting water.
9.7.3 Controls Programming Controls and designs of these systems vary widely. Unfortunately, the manufacturers of evaporatively cooled systems implement control strategies at the factory, and often are not involved in installation. The control strategy or implementation of the technology is often not correct, and jeopardizes much or all of the energy savings. The fact that the unit operates and adds moisture to the pads does not mean it operates efficiently or correctly (Woolley 2014). To ensure proper operation, the unit should be measured and verified after installation to verify that the unit is realizing expected energy savings, as discussed below. Lessons learned from operation of these systems include:
• Overall building control HVAC should optimize the evaporative cooling process. The first step is to use the evaporative cooling of ventilation air whenever possible. Opportunities may arise to eliminate DX cycle cooling when OATs are favorable (economizing).
• The control system should focus on using the evaporative cooling as much as possible. This may include reducing the operation of other cooling systems to allow for the higher efficiency evaporative precooled system to meet more of the load.
• Manufacturers should provide an optimum ambient temperature range of operation for the evaporative cooling units; the controls contractor should ensure that these temperature limits are explicitly included in the sequence. A minimum ambient temperature in which the evaporative cooler operates, such as 60°–65°F, should also be stipulated. Below this, the benefits of evaporative cooling are negated by the extra fan and pump energy.
• If possible, the manufacturer should be involved in the operational strategy and installation of the unit. The controls set at the factory may not be optimal: the manufacturer can help optimize the control strategy for a particular installation.
9.7.4 Operation The building’s facility manager is responsible for ensuring the following:
• The evaporative cooler turns on in conjunction with the RTU at appropriate times.
• Water is treated properly, if necessary, before it reaches the RTU.
• The pads are cleaned regularly.
110
This report is available at no cost from the National Renewable Energy Laboratory (NREL) at www.nrel.gov/publications.
• Lines are blown out before freezing weather conditions (if installed in a cold climate).
• The unit is reactivated for the cooling season.
9.8 Measurement and Verification Measuring and verifying achieved energy savings are integral to reducing energy use in buildings. (See Chapter 1 for information about the general M&V process.) Because the RTU is relatively isolated from other building systems (e.g., lighting and plug loads), an isolated metering approach of the HVAC system is often used to verify energy savings.
9.8.1 Recommended Monitoring Points The power consumption of the RTU should be recorded; this requires measurements of the fan and compressor power. The evaporative cooling system’s pump should also be monitored. Real power meters are recommended for measuring the power consumption, and should meet the following criteria:
• Sampling interval of 30 seconds
• Designed for the type of circuit to be metered (e.g., 480 Volt, 20 amp, 60 Hertz)
• Ability to accurately meter loads; sized to meet the load per phase (e.g., 0–10,000 Watts)
• Internal clock that timestamps each data point
• UL listing
• Compatibility with the BAS.
If installing multiple real power meters is cost prohibitive, another approach is to use one real power meter to monitor the entire RTU, and then use a digital on/off monitoring device for the evaporative pump. This device indicates when the evaporative system is operating.
The authors recommend that the outdoor air dry bulb and wet bulb temperatures be measured. For evaporative condensing, no measurements need to be taken, except for determining when the system is operating (which can be achieved by a real power meter or a digital on/off monitoring device). If the system appears to underperform, temperature sensors can be added to measure the temperature of the air leaving the evaporative pad. This allows the evaporative effectiveness to be calculated. Likewise, for a hybrid system (indirect precooling of the ventilation air and condenser cooling), the temperature of the primary ventilation air after the indirect evaporative cooling process can be measured if problems are suspected. With these data, the direct and indirect effectiveness of the evaporative system can be calculated. In addition, the water consumption should be monitored using a water meter. (Appendix A provides more specifics about temperature and flow rate measurement.)
9.8.2 Guidance and Analysis 9.8.2.1 Existing Buildings For existing buildings, energy performance both before and after installing the evaporative precooling system may be measured explicitly. The energy from both periods is then normalized by factors that affect their performance, such as changes in weather conditions or changes in indoor temperature set points or building loads. Once normalized, the energy savings from this

111
This report is available at no cost from the National Renewable Energy Laboratory (NREL) at www.nrel.gov/publications.
strategy are determined by taking the difference between energy consumption both before and after the strategy was initiated.
9.8.2.2 New Construction For new construction projects, the energy savings calculation is less clearly defined, because no measured data are available for comparison. Calculations—generally simple spreadsheet models—can be used to approximate the theoretical energy consumption of a baseline case versus the measured case. Sources include any existing facilities or operations that the building owner or tenant has (generally for new construction the occupants will be moving or expanding from existing facilities). The HVAC system (RTUs without evaporative precooling) of these facilities can be monitored before completion of the new construction project, and the monitored data from these facilities can be used to establish the before-upgrade condition for the energy savings calculation.
Both the baseline and upgraded system models should be normalized using the same typical weather conditions, building set point schedules, and building loading/occupancy profiles. Once normalized, the energy savings from the evaporative precooling system are determined by taking the difference between energy consumption of the theoretical baseline and actual system with evaporative precooling.
9.9 Best Practices for Addressing Operational Problems If the evaporative precooler does not yield expected energy savings, troubleshooting should begin at the unit. First, determine if water is being pumped to the unit and sprayed for the evaporative cooling process. For example, a Walmart store that participated in the CBP program reported that the evaporative precooler’s water pump was unplugged and no water was being used. The condition of the heat exchangers should also be evaluated to determine if an excessive buildup of deposits reduces heat transfer.
Walmart completed a major retrofit to an existing store in Centennial, Colorado in 2013 as part of CBP. Before the retrofit, the store was equipped with conventional cooling systems (DX cycle). The retrofit included adding evaporative precooling to a portion of the building’s RTUs. The M&V process was used to ensure that the evaporative precooling mode was enabled when the OAT exceeded 66°F and disabled when the OAT is below 64°F. During evaporative precooling operation, the supply and DX condenser fans should run continually, as well as the water pump (to keep evaporative media wet). Validation was undertaken regarding cooling load control sequences, compressor staging, damper position, and fan speed. Energy models were used to validate and determine the energy savings from the evaporative precooling system. A direct comparison of actual energy consumption between the RTUs, both with and without evaporative precooling, would not have been valid because of the wide variety of loads met by the units. Several issues were uncovered during the M&V process. For example, an issue with enabling the evaporative precooling mode was discovered. This was caused by solar radiation heating temperature sensors located on the east side of each RTU. The solution was to install a solar radiation shield. Another problem discovered was a sump pump’s relay power being unplugged, effectively disabling the evaporative precooling.

112
This report is available at no cost from the National Renewable Energy Laboratory (NREL) at www.nrel.gov/publications.
If the RTU’s mechanical operation appears to be acceptable, its control logic can also have a large impact on the operation. The precooling unit should only operate while the RTU is running. It should also have a set point that is lower than the RTU, so the evaporative precooling cycle is used first, in an attempt to reduce the amount of time the DX cycle RTU is used. It should also be confirmed to be operating at the hottest times of the year, when peak cooling and building peak demand are likely to happen.
9.10 References and Other Resources Corradini, A.; Johnson, K.; Karasawa, A. (2012). Evaporative Retrofit Components For Roof Top Packaged Air-Conditioning Units. Pacific Gas & Electric's Emerging Technologies Program. Accessed March 2015: http://www.etcc-ca.com/sites/default/files/reports/ET12PGE3181_12_21_2012.pdf.
Dirkes, J. Personal Communication, 2014.
Dirkes, J.; Hoffman, R. (2011). “Energy Simulation Results for Indirect Evaporative-Assisted DX Cooling Systems.” ASHRAE Transactions 117:1, 8 pp.
Felts, D.; Jump, D.A. (1998). Energy Savings From Indirect Evaporative Pre-Cooling: Control Strategies and Commissioning. American Council for an Energy Efficient Economy. Accessed March 2015: http://www.aceee.org/files/proceedings/1998/data/papers/0312.PDF.
“Texas Austin Energy - Commercial Energy Management Rebate Program.” Database of State Incentives for Renewables & Efficiency, 2014. Accessed November 11, 2014: http://www.dsireusa.org/incentives/incentive.cfm?Incentive_Code=TX32F&re=0&ee=1.
Woolley, J. Notes from Presentation on Evaporative Precooling. Western Cooling Efficiency Center, 2014.

113
This report is available at no cost from the National Renewable Energy Laboratory (NREL) at www.nrel.gov/publications.
Chapter 10. High-Performance Refrigeration Cases 10.1 Description Grocery stores use a significant amount of refrigeration equipment, including compressors, condensers, display cases, walk-in coolers, and walk-in freezers. This equipment accounts for about 60% of grocery store electricity consumption. Because of this high electricity demand, a typical grocery store’s average energy costs are higher than almost all other building types at $4/ft2 (Bendewald 2013).
Figure 36. Electricity consumption by end use in a typical grocery store
(Source: Bendewald 2013)
Several technologies can be applied to refrigerator display cases to improve their energy performance, including:
• LEDs • Electronically commutated motors (ECMs) for evaporator fans • Anti-sweat heater controls • Permanent doors on open dairy, deli, and beverage cases • Night curtains for meat and produce open cases.
Although the information contained in this chapter pertains specifically to refrigerated display cases, many of these EEMs can also be applied to walk-in coolers and freezers.
Energy savings from high-performance refrigerator display cases vary depending on the temperature of the cases. Because low-temperature (LT) cases have a larger cooling load, any EEM that reduces the heat produced inside the cases, such as turning off anti-sweat heaters or reducing lighting and motor power, saves more energy than similar EEMs applied to medium-temperature (MT) cases. Additionally, replacing shaded pole (SP) motors with ECMs will result in greater energy savings than replacing permanent split capacitor (PSC) motors with ECMs. Table 24 shows typical costs and savings39 for EEMs on refrigerated display cases. The data are presented per linear foot of display case.
39 The cost savings are based on national average rates of $0.112/kWh, and $0.8/therm.

114
This report is available at no cost from the National Renewable Energy Laboratory (NREL) at www.nrel.gov/publications.
Table 24. High-Performance Refrigeration Cases Typical Annual Energy and Cost Savings
Decrease Anti-Sweat Heater Usage Close Open Cases EC Motors LED Fixtures
Parameter Name Unit MT Cases
LT Cases
Night Curtain
Permanent Door
Compared to PSC Motors
Compared to SP Motors
MT Cases
LT Cases
Electricity saved kWh/ft 57 206 315 1,708 33 189 112 190 Gas saved therms/ft 0 0 0 0 0 0 0 0
Reduction in EUI kBtu/ft2 N/A N/A N/A N/A N/A N/A N/A N/A Utility bill savings $/ft $6 $23 $35 $191 $4 $21 $13 $21
Typical capital cost $/ft $25 $25 $30 $0 (NC) $600 (retrofit)40 $20 $46 $63 $63
Typical simple payback years 3.9 1.1 0.9 0 (NC)
3.1 (retrofit)40 5.4 2.2 5 3
Capital cost 5-year payback $/ft $32 $115 $176 $956 $18 $106 63 106
Target incentive $/ft N/A N/A N/A N/A $1.5 N/A N/A N/A Sources: (Tobin, 2006); (Friedrich, 2011) (Navigant Consulting, 2013)
40 The “permanent door” column shows two typical capital costs and paybacks because the costs are different for new construction or retrofit projects when adding doors to MT open display cases. The two numbers in these fields are for new construction and retrofit applications, respectively.
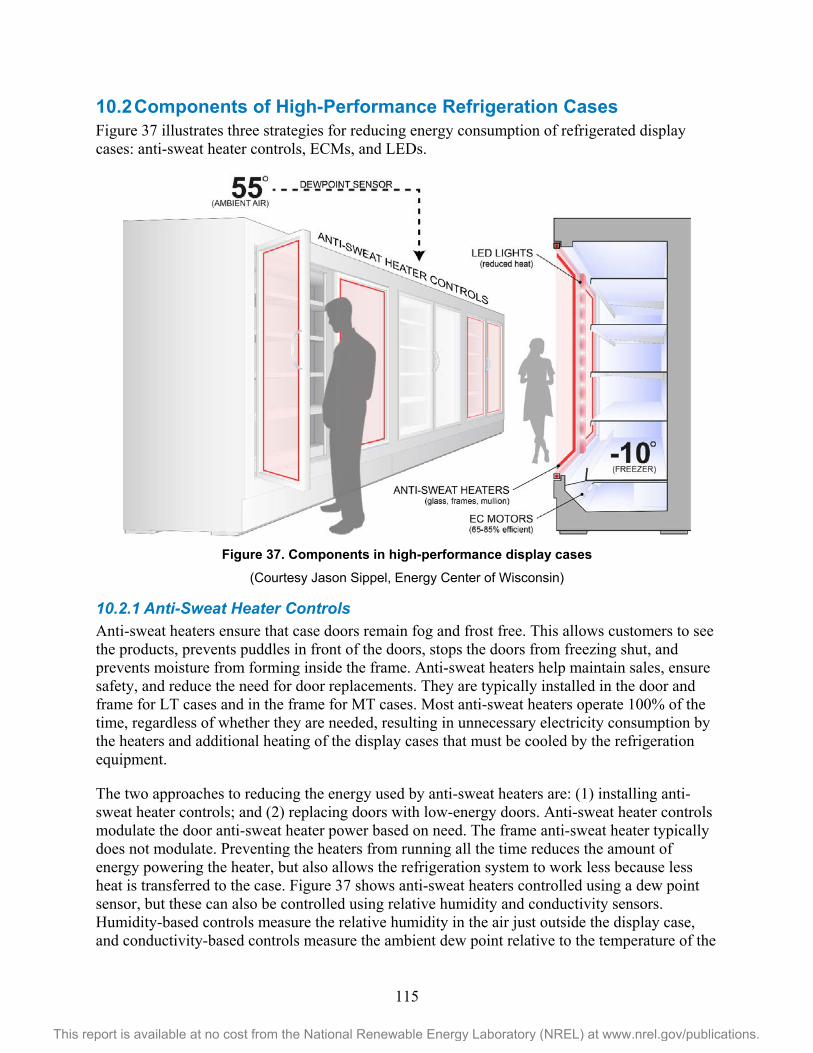
115
This report is available at no cost from the National Renewable Energy Laboratory (NREL) at www.nrel.gov/publications.
10.2 Components of High-Performance Refrigeration Cases Figure 37 illustrates three strategies for reducing energy consumption of refrigerated display cases: anti-sweat heater controls, ECMs, and LEDs.
Figure 37. Components in high-performance display cases
(Courtesy Jason Sippel, Energy Center of Wisconsin) 10.2.1 Anti-Sweat Heater Controls Anti-sweat heaters ensure that case doors remain fog and frost free. This allows customers to see the products, prevents puddles in front of the doors, stops the doors from freezing shut, and prevents moisture from forming inside the frame. Anti-sweat heaters help maintain sales, ensure safety, and reduce the need for door replacements. They are typically installed in the door and frame for LT cases and in the frame for MT cases. Most anti-sweat heaters operate 100% of the time, regardless of whether they are needed, resulting in unnecessary electricity consumption by the heaters and additional heating of the display cases that must be cooled by the refrigeration equipment.
The two approaches to reducing the energy used by anti-sweat heaters are: (1) installing anti-sweat heater controls; and (2) replacing doors with low-energy doors. Anti-sweat heater controls modulate the door anti-sweat heater power based on need. The frame anti-sweat heater typically does not modulate. Preventing the heaters from running all the time reduces the amount of energy powering the heater, but also allows the refrigeration system to work less because less heat is transferred to the case. Figure 37 shows anti-sweat heaters controlled using a dew point sensor, but these can also be controlled using relative humidity and conductivity sensors. Humidity-based controls measure the relative humidity in the air just outside the display case, and conductivity-based controls measure the ambient dew point relative to the temperature of the

116
This report is available at no cost from the National Renewable Energy Laboratory (NREL) at www.nrel.gov/publications.
inner glass pane. These controls reduce anti-sweat heater energy use in MT cases by approximately 74% and by 46% for LT cases (Bendewald 2013). On average, conductivity-based controls using a dew point sensor typically reduce anti-sweat heater energy by 15% more than humidity based controls (SAG 2014). Although anti-sweat heater controls may be available based on relative humidity, dew point control provides better control and is the direction the industry is headed.
High-performance refrigeration display cases have either no-energy doors or low-energy doors with anti-sweat heater controls. Installing low- or no-energy doors on MT and LT cases significantly reduces or completely eliminates the need for anti-sweat heaters on the glass. The frame heat is reduced but not eliminated, ensuring the gaskets remain malleable and condensation does not form on the framing.
In humid climates, using a desiccant dehumidifier to reduce store relative humidity can also reduce the need for long anti-sweat heater runtimes.
10.2.2 Electronically Commutated Evaporator Fan Motors ECMs use less electrical energy than either PSC or SP motors. In general ECMs are 65%–80% efficient compared to 50%–60% for PSC and 18% for SP motors (Wellington 2014). They also save cooling energy because they reduce the amount of waste heat that is added to the refrigerator case. Improved evaporator fan motors provide significant savings because they never turn off for MT cases and turn off only during defrost cycles (approximately 1 hour per day) for LT cases.
10.2.3 Light-Emitting Diodes LED fixtures are particularly well suited for refrigerated display cases because they produce less heat than typical fluorescent lights, thus reducing the refrigeration load. Also, unlike fluorescent lights, LED performance does not degrade in cold environments. LED fixtures can be controlled using an occupancy sensor. Although most refrigerated display case lighting is programmed to turn off when the store closes, occupancy sensors can also shut off refrigerator display case lighting when the store has low occupancy and activate it when a shopper approaches the refrigerated aisles.
10.2.4 Doors or Night Curtains on Open Cases Certain types of display cases are often left open to the warm store environment. This results in significant infiltration heat gains, increasing energy consumption. Closing open cases with night curtains or by installing doors saves considerable energy. Night curtains can either manually or automatically cover open cases when the store is closed. Automatic night curtains have a higher first cost but manual night curtains must be pulled down manually once the store closes, which is an added operational cost. Also, manual night curtains are less likely to be closed for most a store’s nonoperating hours. Night curtains reduce refrigeration load by approximately 12% and compressor power consumption by 9% (Bendewald 2013). Figure 38 depicts the benefits of night
While participating in the CBP program, the DeCA Lackland project team learned that when LED fixtures replace fluorescent lights in display cases in a retrofit situation, the anti-sweat heaters have to work harder because less heat is created by the lights. Overall energy savings still increase.

117
This report is available at no cost from the National Renewable Energy Laboratory (NREL) at www.nrel.gov/publications.
curtains. With a night curtain in place, cool refrigerated air recirculates in the case instead of escaping into the warm environment. When deploying night curtains, the defrost frequency and duration should be reduced.
Figure 38. Night curtains keep cool air in the case.
(Courtesy Jason Sippel, Energy Center of Wisconsin) A more permanent solution that greatly reduces energy use is to install doors on open cases. Although this is more cost intensive than manual night curtains, doors are more effective because the open cases are closed at all times, except when a customer opens them or they are being stocked. Adding doors to open cases reduces the refrigeration load on the case by approximately 65%, which lowers power consumption of the compressor by 87% (Bendewald 2013). Door retrofits add cost to a project; however, new closed cases are typically similar in price to open cases such that there is no cost premium.
10.3 Real-World Considerations 10.3.1 Anti-Sweat Heater Control Anti-sweat heater controls can increase the amount of time required for fog to fade off the doors when doors are opened. However, when implemented properly, these controls can ensure that fog is mitigated and energy savings realized. Savings from anti-sweat heaters also vary based on climate. In dry areas, such as Colorado, anti-sweat heater controls have greater savings because the relative humidity is naturally lower in the store. In humid regions, savings are lower.
10.3.2 Night Curtain and Permanent Doors Beyond energy savings, permanent doors on open cases contribute to occupant comfort by preventing cold air from spilling into the aisles. This EEM also reduces the temperature variation in open cases, resulting in higher product quality and uniformity. Concern that closed cases will

118
This report is available at no cost from the National Renewable Energy Laboratory (NREL) at www.nrel.gov/publications.
minimize impulse purchases and negatively influence sales is the main reason given for not installing doors on open cases. Supermarkets have very low profit margins, so much so that often store owners reject any EEM that might negatively influence sales, even if it has an acceptable payback period. Although utility cost savings associated with energy directly add to a supermarket’s profit, more store owners are likely to choose night curtains over doors, so cases remain open while customers are in the store.
A recent study tested the assumption that cases with doors reduce sales. In this study, two large supermarkets located in the midwestern United States received new display cases. One store received a new display case with doors that replaced an old open case. The second store received a new open display case that replaced an old open display case. The same products were kept in the new display cases and they were arranged in the same manner. Sales increased by 27% in the store with the new case with doors and 29% in the store with the new open case. Both stores saw a significant increase in sales, but an insignificant difference based on whether the case was open or closed (Becker 2010).
Figure 39. Night curtains cover a refrigerated produce case
(Pat Corkery, NREL)
10.3.3 Code Requirements Energy codes are beginning to address refrigerator display cases for the first time. ASHRAE 90.1-2013 requires refrigerator display cases to:
The refrigeration design team for DeCA Lackland concluded that adding doors to open display cases makes the store look cleaner and more organized and that the retrofitted open cases resemble new display cases. This design team has also worked with supermarket managers who did not want to install doors because of the concern about sales. Stores such as Whole Foods Market tend to be more concerned about adding doors to their open cases, because their product displays are part of the shopping experience and are designed to entice shoppers to buy products they may not have on their shopping lists. However, Whole Foods Market, a Commercial Building Partner, is also putting doors on previously open refrigerated cases.

119
This report is available at no cost from the National Renewable Energy Laboratory (NREL) at www.nrel.gov/publications.
• Install anti-sweat heater control (either humidity or condensation control are acceptable).
• Terminate the defrost cycle in LT cases using a temperature sensor instead of a time limit default.
• Either:
o Automatically shut off display case lights during nonbusiness hours OR
o Install motion sensors on each display case that reduces light level by at least 50% after 3 minutes of vacancy.
Refrigerated display case lighting power allowances, evaporator fan type, and night curtains are not discussed in ASHRAE 90.1-2013. However, the maximum daily energy consumption of different types of reach-in refrigerated display cases is specified for the whole case, based on total display area or volume, in Table 6.1.1-13 of 90.1-2013, taken from the Code of Federal Regulations (DOE 2012).
10.4 Financial Incentives Many state and utility energy efficiency programs provide incentives for retrofitting or replacing commercial refrigeration equipment. Incentives provided by energy efficiency programs include:
New York State Energy Research and Development Authority Existing Facilities Program
• Controls on existing anti-sweat heater—$100/unit
• Night curtains for open coolers—$3/linear ft
• ECMs—$85/motor.
Wisconsin Focus on Energy
• Anti-sweat heater controls—$40/door
• Efficient reach-in case doors—$50 or $100/door for freezers; $10/door for coolers
• LED case lighting—$25/door for LED fixtures only, $35/door for LEDs with occupancy controls
• Night curtains for open coolers—$9/linear ft
• ECMs—$30/motor.
Pacific Gas & Electric Company
• Anti-sweat heater controls—$25/linear ft
• Efficient doors—$100/door
• Night curtains for open coolers—$3.50/linear ft
• ECMs—$35/motor.
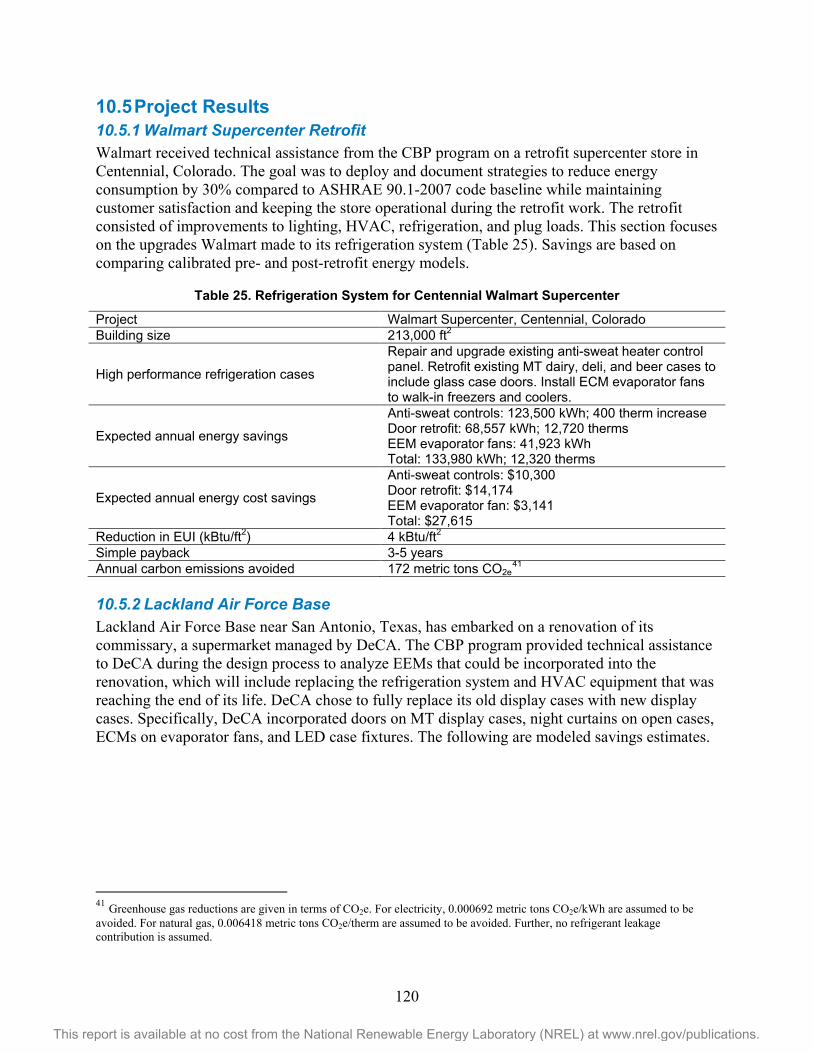
120
This report is available at no cost from the National Renewable Energy Laboratory (NREL) at www.nrel.gov/publications.
10.5 Project Results 10.5.1 Walmart Supercenter Retrofit Walmart received technical assistance from the CBP program on a retrofit supercenter store in Centennial, Colorado. The goal was to deploy and document strategies to reduce energy consumption by 30% compared to ASHRAE 90.1-2007 code baseline while maintaining customer satisfaction and keeping the store operational during the retrofit work. The retrofit consisted of improvements to lighting, HVAC, refrigeration, and plug loads. This section focuses on the upgrades Walmart made to its refrigeration system (Table 25). Savings are based on comparing calibrated pre- and post-retrofit energy models.
Table 25. Refrigeration System for Centennial Walmart Supercenter
Project Walmart Supercenter, Centennial, Colorado Building size 213,000 ft2
High performance refrigeration cases
Repair and upgrade existing anti-sweat heater control panel. Retrofit existing MT dairy, deli, and beer cases to include glass case doors. Install ECM evaporator fans to walk-in freezers and coolers.
Expected annual energy savings
Anti-sweat controls: 123,500 kWh; 400 therm increase Door retrofit: 68,557 kWh; 12,720 therms EEM evaporator fans: 41,923 kWh Total: 133,980 kWh; 12,320 therms
Expected annual energy cost savings
Anti-sweat controls: $10,300 Door retrofit: $14,174 EEM evaporator fan: $3,141 Total: $27,615
Reduction in EUI (kBtu/ft2) 4 kBtu/ft2 Simple payback 3-5 years Annual carbon emissions avoided 172 metric tons CO2e
41
10.5.2 Lackland Air Force Base Lackland Air Force Base near San Antonio, Texas, has embarked on a renovation of its commissary, a supermarket managed by DeCA. The CBP program provided technical assistance to DeCA during the design process to analyze EEMs that could be incorporated into the renovation, which will include replacing the refrigeration system and HVAC equipment that was reaching the end of its life. DeCA chose to fully replace its old display cases with new display cases. Specifically, DeCA incorporated doors on MT display cases, night curtains on open cases, ECMs on evaporator fans, and LED case fixtures. The following are modeled savings estimates.
41 Greenhouse gas reductions are given in terms of CO2e. For electricity, 0.000692 metric tons CO2e/kWh are assumed to be avoided. For natural gas, 0.006418 metric tons CO2e/therm are assumed to be avoided. Further, no refrigerant leakage contribution is assumed.
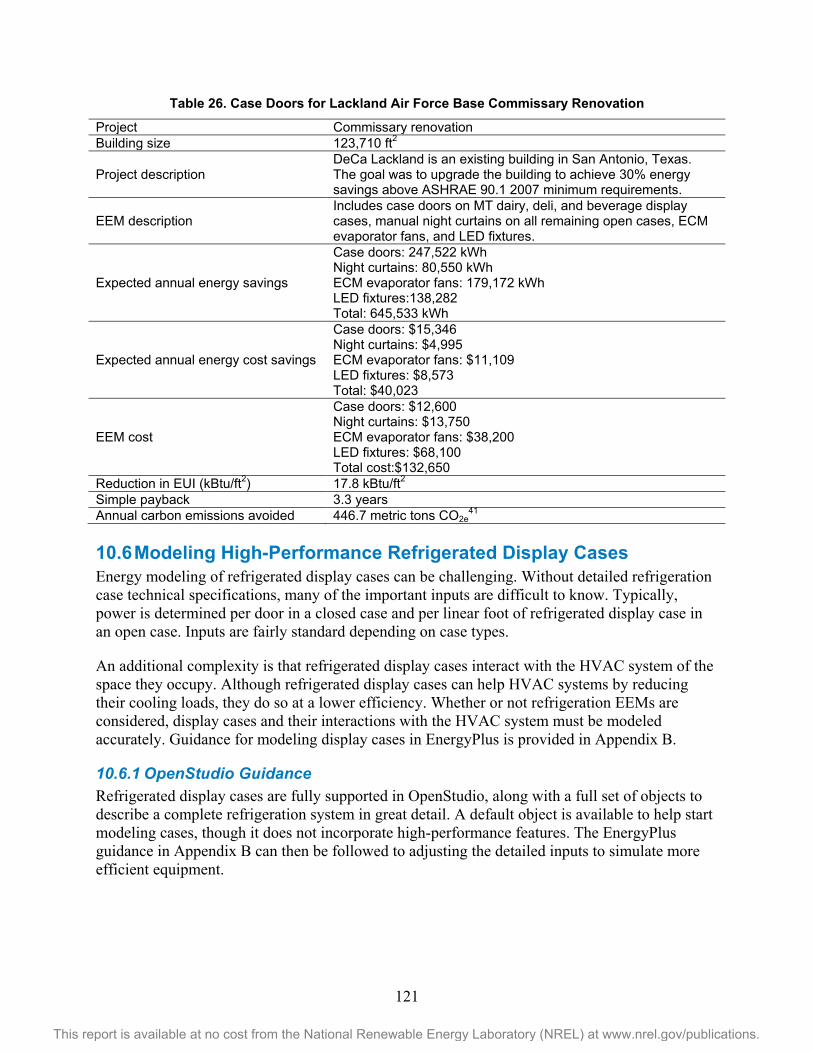
121
This report is available at no cost from the National Renewable Energy Laboratory (NREL) at www.nrel.gov/publications.
Table 26. Case Doors for Lackland Air Force Base Commissary Renovation
Project Commissary renovation Building size 123,710 ft2
Project description DeCa Lackland is an existing building in San Antonio, Texas. The goal was to upgrade the building to achieve 30% energy savings above ASHRAE 90.1 2007 minimum requirements.
EEM description Includes case doors on MT dairy, deli, and beverage display cases, manual night curtains on all remaining open cases, ECM evaporator fans, and LED fixtures.
Expected annual energy savings
Case doors: 247,522 kWh Night curtains: 80,550 kWh ECM evaporator fans: 179,172 kWh LED fixtures:138,282 Total: 645,533 kWh
Expected annual energy cost savings
Case doors: $15,346 Night curtains: $4,995 ECM evaporator fans: $11,109 LED fixtures: $8,573 Total: $40,023
EEM cost
Case doors: $12,600 Night curtains: $13,750 ECM evaporator fans: $38,200 LED fixtures: $68,100 Total cost:$132,650
Reduction in EUI (kBtu/ft2) 17.8 kBtu/ft2 Simple payback 3.3 years Annual carbon emissions avoided 446.7 metric tons CO2e
41 10.6 Modeling High-Performance Refrigerated Display Cases Energy modeling of refrigerated display cases can be challenging. Without detailed refrigeration case technical specifications, many of the important inputs are difficult to know. Typically, power is determined per door in a closed case and per linear foot of refrigerated display case in an open case. Inputs are fairly standard depending on case types.
An additional complexity is that refrigerated display cases interact with the HVAC system of the space they occupy. Although refrigerated display cases can help HVAC systems by reducing their cooling loads, they do so at a lower efficiency. Whether or not refrigeration EEMs are considered, display cases and their interactions with the HVAC system must be modeled accurately. Guidance for modeling display cases in EnergyPlus is provided in Appendix B.
10.6.1 OpenStudio Guidance Refrigerated display cases are fully supported in OpenStudio, along with a full set of objects to describe a complete refrigeration system in great detail. A default object is available to help start modeling cases, though it does not incorporate high-performance features. The EnergyPlus guidance in Appendix B can then be followed to adjusting the detailed inputs to simulate more efficient equipment.

122
This report is available at no cost from the National Renewable Energy Laboratory (NREL) at www.nrel.gov/publications.
10.7 Ensuring Performance 10.7.1 Installation The display case manufacturer (for new construction) or the refrigeration technician (for retrofit applications) is responsible to ensure the performance of EEMs that reduce energy use in refrigerated display cases
10.7.1.1 New Construction The display case manufacturer provides energy efficiency options such as LED fixtures, ECMs, anti-sweat heater controls, doors, and night curtains in new products. The display case is shipped as a single unit.
10.7.1.2 Existing Buildings The refrigeration technician needs to:
• Adjust the expansion valve in the case of a door retrofit to allow for higher evaporator temperature and maintain the proper case and product operating temperatures.
• Define the basis for controlling an anti-sweat heater—relative humidity or dew point temperature—that determines the set point and controller output (Royal 2013).
• Identify sensor placement and determine whether (and how) they will be monitored for failure.
o If an anti-sweat heater is controlled by a dew point sensor, place the sensor outside the case.
o Place the dew point sensor near the top of the case, so cold air from the case does not affect the reading.
o Avoid placing the sensor in a wet or dirty area, and keep it away from a heat source or direct path of HVAC returns.
o Place the door frame temperature sensor in the bottom horizontal section of the door frame in the center door in the case, because this is typically the coldest place (Emerson 2010). For maximum savings, each case should have its own anti-sweat heater control with set points adjusted to case temperature.
• Update the design documents to account for any changes.
10.8 Commissioning See Chapter 1 for information about the general commissioning process.
Refrigerated display case equipment is not commonly commissioned, but this should be included in the project and carried out through the first year of operation.
The commissioning agent or facility manager verifies that the anti-sweat heater controls are functioning properly (taken from Royal 2013):

123
This report is available at no cost from the National Renewable Energy Laboratory (NREL) at www.nrel.gov/publications.
1. Anti-sweat heater sensors drift and are often out of calibration. Verify the sensors are reading the correct values by using an independent sensor and document the ambient temperature and relative humidity to make sure they are within the design conditions.
2. Turn the heater off using the controller and verify that this did not affect the lights or fans.
3. Verify the controller output matches the output specified in the basis of design at each set point.
4. Confirm that the control strategy removes frost from door by turning the anti-sweat heater on for an hour and checking to see that there is no frost on the door.
The commissioning agent or facility manager verifies that doors and night curtains are working properly.
1. Check that the doors close and seal properly.
2. Ensure that night curtains were installed where specified and are not damaged.
3. Inspect the interior of a refrigerated display case for ice formation as its presence could indicate air leakage (Royal 2013).
10.8.1 Controls Programming The commissioning agent or contractor is responsible to program the anti-sweat heater controls.
• Program the anti-sweat heater with respect to the store’s design dry bulb temperature and relative humidity. If the design dry bulb temperature or relative humidity changes, recalibrate the anti-sweat heaters.
• Anti-sweat heaters can be controlled via:
o Relative humidity controller. If the relative humidity of the air outside the display case is low, the need for anti-sweat heaters is diminished. Relative humidity sensors measure the relative humidity and turn the anti-sweat heaters down or off at low relative humidity. Typically the anti-sweat heaters are programmed to run at maximum power when the relative humidity exceeds 55% and turn off when the relative humidity is below 35%. When the relative humidity is between these values, it should modulate on and off proportionately to the relative humidity (Coburn 2000). These relative humidity set points should be evaluated and tested for each anti-sweat heater application.
o Condensate controller. If the case door temperature is below the dew point of the store, condensation will occur. A dew point sensor measures the dew point of the surrounding air and a temperature sensor measures the temperature of the door frame. Condensate controllers are programmed to ensure the case door is constantly hotter than the dew point. To determine the appropriate offset between the door temperature and the dew point, experimentation should be done. The lower the offset, the higher the energy savings. Begin with a low offset and increase the offset until good performance is achieved (CPC 2005).

124
This report is available at no cost from the National Renewable Energy Laboratory (NREL) at www.nrel.gov/publications.
10.8.2 Operation Maintenance staff is responsible to:
• Clean and calibrate humidity or dew point temperature sensors that control anti-sweat heaters.
• Check the display cases for proper door operation and sealing.
• Keep all door gaskets clean and functional.
• Check the case temperature settings.
• Check the refrigerant charge regularly.
• Clean the fan blades annually.
• Clean the condenser and evaporator coils.
• Put night curtains down when the store closes.
10.8.3 Occupant Behavior Few occupant behaviors affect the performance of high-performance refrigerated display cases. Becker (2010) demonstrated that doors on refrigerator display cases did not significantly impact product sales.
10.9 Measurement and Verification Measuring and verifying achieved energy savings are integral to reducing energy use in buildings. (See Chapter 1 for information about the general M&V process.) Because refrigerated display cases are relatively isolated from other building systems, an isolated metering approach is often used to verify refrigerator display case energy savings. However, because these cases can affect HVAC energy consumption, a more accurate, but more expensive, approach would also include whole-building calibrated simulation.
10.9.1 Recommended Monitoring Points Developing an M&V plan for refrigerator display cases involves specifying measurements at the most disaggregated level allowed for in the budget. For example, if multiple display cases are of the same type, only a few need to be metered. Understanding the energy consumption of high-performance display cases involves evaporator and condenser fans, display lighting, anti-sweat heater, and compressor power. Because refrigerated display cases are typically on their own electrical circuits, the circuits associated with the above end uses may be monitored to simplify the process.
10.9.2 Inexpensive, but Less Accurate, Approach This approach involves continuously measuring electrical current throughout the M&V period by installing current transducers on electrical circuits serving display cases. The voltage and power factor of these circuits should be spot checked during installation, and occasionally thereafter, to confirm their values. Electric power and energy may then be calculated from the measured current, as well as spot (one-time) measurements of voltage and power factor.
125
This report is available at no cost from the National Renewable Energy Laboratory (NREL) at www.nrel.gov/publications.
10.9.3 More Complex and Expensive, but Accurate Approach This approach involves continously measuring real electrical power permanently by installing power meters on individual electrical circuits serving display cases. This method is more costly and more accurate, because it accounts for the full waveforms of the electrical power. Real power meters should meet the following criteria:
• Sampling interval of 30 seconds
• Designed for the type of circuit to be metered (e.g., 208 Volt, 20 amp, 60 Hertz)
• Ability to accurately meter loads; rated to meet the load per phase (e.g., 0–3600 Watts)
• Internal clock that timestamps each data point
• UL listing
• Compatibility with the BAS.
Adding night curtains or permanent doors to open display cases is a more complicated EEM to quantify, because the energy savings results from reduced refrigeration energy to cool the display cases, as well as reduced HVAC load to condition the space. Thus, an energy model should be used to accurately portray these savings. The accuracy of the energy model would benefit from measuring the compressor and condenser fan power. If measuring both is too expensive, the compressor power more accurately portrays the reduction in refrigerator load.
10.9.4 Guidance for Analysis Metered data accumulate quickly, and simply collecting data does not provide facility managers the information needed to identify and correct performance issues. A method of managing and analyzing the data is essential to complete the M&V process. (See Chapter 1 for more information about data management for M&V efforts.)
Analyzing the data to verify energy savings involves different approaches for existing and new construction projects.
10.9.4.1 Existing Buildings For existing buildings, energy performance both before and after installing high-performance refrigerated display cases may be measured explicitly. The energy from both periods is then normalized by factors that affect their performance, such as changes in the number or type of display cases or building occupancy. Changes in building occupancy could be measured using grocery sales. Once normalized, the energy savings from this strategy is determined by taking the difference between energy consumption both before and after the strategy was initiated.
10.9.4.2 New Construction For new construction projects, the energy savings calculation is less clearly defined, because no measured baseline data are available for comparison. Calculations can be used to approximate the theoretical energy consumption of a baseline case versus the measured case. This calculation would be difficult, because refrigerated display case energy is interactive and clear refrigeration baseline requirements are just beginning to be defined in the ASHRAE 90.1 2013 energy code, which is not yet widely implemented. An energy model, whether a simple spreadsheet or

126
This report is available at no cost from the National Renewable Energy Laboratory (NREL) at www.nrel.gov/publications.
complex whole building approach, would need to be created that reflected a baseline with T8 lights, anti-sweat heaters with no controls, and SP motors. In the baseline case, MT display cases would not have doors or night curtains. Another source of baseline information is any existing facilities or operations that the building owner or tenant has (generally for new construction the occupants will be moving or expanding from existing facilities). The refrigeration energy of these facilities can be monitored before completion of the new construction project, and the monitored data from these facilities can be used to establish the before-upgrade condition for the energy savings calculation.
The baseline and upgraded system models should be normalized using the same occupancy schedules and typical weather conditions (in the case of whole-building simulation). Once normalized, the energy savings from the refrigeration EEMs are determined by taking the difference between energy consumption of the theoretical baseline and actual system with controls.
10.10 Best Practices for Addressing Operational Problems If the anti-sweat heater operates at maximum power most of the time, the controls should be checked to see if they can be modulated. If a relative humidity control is used, the anti-sweat heaters should be checked to see if they are programmed to operate in a reduced operation mode when the measured relative humidity is below the design relative humidity. During this reduced operation mode, the anti-sweat heaters should modulate on and off proportionately with respect to the measured relative humidity. If anti-condensate controls are used, the offset between the indoor dew point and the case door temperature should be checked to see if it can be lowered without degrading anti-sweat heater performance (see Section 10.8.1 for more details). If night curtains are installed and compressor power does not decrease at night, they should be checked to ensure they are being used.
Walmart did a major retrofit to its store in Centennial, Colorado, as part of CBP. The retrofit involved adding controls and sensors to turn off or reduce anti-sweat heater power based on dew point temperature. The retrofit also included installing doors on MT refrigerator display cases. These doors included LED lights and anti-sweat heater controls. A calibrated existing building model was created to determine the baseline anti-sweat heater, compressor, and condenser fan power. A proposed model was also created from the adjusted baseline model that implemented the EEMs. Performance was verified on a whole-building and an EEM level. M&V involved measuring power of the compressor, condenser, and anti-sweat heater circuit. Heater power as a function of space dew point was then determined, and used to verify that controls were working properly. This correlation was also used as an input into an energy model to predict energy savings. Because putting permanent doors on open display cases impacts other systems, the proposed whole-building energy model was used to verify the savings. Modeling inputs were updated with monitored power data from the refrigeration compressors and condensers both before and after the retrofit. Walmart operated 24/7 before and after the retrofit and an annual energy analysis using the same weather data was used. Overall, the refrigeration retrofits alone resulted in $27,615 of annual energy savings, with an expected simple payback of 3-5 years.

127
This report is available at no cost from the National Renewable Energy Laboratory (NREL) at www.nrel.gov/publications.
10.11 References and Other Resources Barry, R.; Dendy, J.; Goldberg, M.; Kuiken, T. (2010). Business Programs: Deemed Savings Manual V1.0. Public Service Commission of Wisconsin. Accessed March 2015: https://focusonenergy.com/sites/default/files/bpdeemedsavingsmanuav10_evaluationreport.pdf.
Bendewald, M.; Adams, E.G.; Franconi, E.; Chan, C.; Torbert, R.; Tupper, K.; Hendron, R.; Leach, M.; Shekhar, D.; Pless, S.; Krepchin, I.; Hamilton, L.; Stephens, A.; Gilligan, D.; Birr, D.; Lockhart, N.; Donahue, P.; Priebe, J.; Ellis, P.; Kocker, P.; Stahl, B.; Berger, B.; Coca, S. (2013). Advanced Energy Retrofit Guide for Grocery Stores. Washington, D.C.: U.S. Department of Energy. Accessed March 2015: https://buildingdata.energy.gov/cbrd/resource/16.
Coburn, B.; Faramarzi, R.; Sarhadian, R. (2000). A Study of Energy Efficient Solutions for Anti-Sweat Heaters. Southern California Edison. Accessed March 2015: https://www.sce.com/NR/rdonlyres/B1F7A3B4-719D-4CBB-87EB E27F7CE7ECE0/0/Anti_Sweat_Heater_Report.pdf.
DOE (2012). Commercial Refrigeration Equipment energy conservation standards specified in the Code of Federal Regulations 10 CFR 431.66. Accessed March 2015: http://www1.eere.energy.gov/buildings/appliance_standards/product.aspx/productid/52 Washington, D.C.: U.S. Department of Energy.
“Installation Instructions: ICON Anti-Condensate Controller System.” Computer Process Controls, 2005. Accessed March 2015: http://icemeister.net/files/controllers/CPC/Manuals/0264703Rev4.pdf.
Friedrich, M.; Muellendore, E. (2011). Vertical Refrigerated Case, Medium Temperature: Open to Closed (Retrofit). Work Paper PECIREF_PGE604, Revision 0. PECI. Accessed March 2015: http://rtf.nwcouncil.org/meetings/2011/0830/WP_PECIREF_CA%20DRAFT.pdf.
Howell, R.H. (1993). “Calculation of Humidity Effects on Energy Requirements of Refrigerated Display Cases.” ASHRAE Transactions 99:1, 679–693.
Guide for Retrofitting of Open Refrigerated Display Cases with Doors. Prepared by Navigant Consulting, Chicago, IL. Washington, DC: U.S. Department of Energy, 2013. Accessed March 2015: http://www1.eere.energy.gov/buildings/commercial/pdfs/cbea_open_case_retrofit_guide.pdf.
Illinois Statewide Technical Reference Manual for Energy Efficiency, Version 3.0. SAG, 2014. Accessed March 2015: http://ilsagfiles.org/SAG_files/Technical_Reference_Manual/Version_3/Final_Draft/Illinois_Statewide_TRM_Effective_060114_Version_3%200_021414_Final_Clean.pdf.
Royal, R. (2013). Refrigeration Commissioning Guide for Commercial and Industrial Systems. American Society of Heating, Refrigerating and Air-Conditioning Engineers. Accessed March 2015: http://refcx.ashrae.org/.

128
This report is available at no cost from the National Renewable Energy Laboratory (NREL) at www.nrel.gov/publications.
“Technical Bulletin: Installation Instructions: Control Link ACC Anti-Condensate Controller System.” Emerson Climate Technologies, 2010. Accessed March 2015: http://www.emersonclimate.com/Documents/Control%20Link/026-4703.pdf.
Tobin, M. (2006). Energy Savings Report. Puget Sound Energy. Accessed March 2015: http://www.bpa.gov/EE/NewsEvents/presentations/Documents/BrownBag_Kingston_Thriftway_Report.pdf.
“What are some applications of ECM Motors?” Wellington, 2014. Accessed March 2015: http://www.wdtl.com/ec_faq_answers.php#Whataresomeapplications.

129
This report is available at no cost from the National Renewable Energy Laboratory (NREL) at www.nrel.gov/publications.
Appendix A: Airflows, Water Flows, and Temperatures Airflow in a Duct Airflow measurements often use BAS meters instead of additional instrumentation. The BAS equipment should meet the following specifications:
• Use a flow station consisting of thermal dispersion measurement probes, installed across a grid at no more than 6-in. spacing in both dimensions.
• The flow measurement station should be placed in a straight duct section, at least 10 diameters downstream of elbows or fittings if possible. Flow straighteners can be used, but should result in a maximum of 0.1 in. w.c.
• Install probes perpendicular to the direction of flow.
• The accuracy of airflow velocity measurements should be ±2% at rated flows, and ±10% at the minimum flow.
• Total airflow is calculated from average velocity multiplied by duct cross sectional area
• If measuring outdoor air, consider separate measurements of minimum flow and economizer flow intakes, for increased accuracy.
• For further increase in accuracy, conduct a field calibration of sensor measurement (possible only if duct configuration is optimal).
• An alternative method for one-time airflow measurement is to supply make-up air through a flow measurement device (e.g. a blower with integral manufacturer-calibrated flow measurement capability). Adjusting the measured make-up air volume until static duct pressures match normal operating conditions yields normal airflow.
Water Flow in a Pipe • If BAS flow data are available, they can be validated by making spot measurements with
an ultrasonic flow meter.
• If BAS data are not available, short-term flow measurements can be made using an ultrasonic flow meter. If variable flow rates must be monitored over time, a flow meter can be installed inline in the pipe system.
• Inline flow meters are available in a variety of types, including nutating disk, turbine, and magnetic field. The selection of a metering device depends on pipe size, fluid composition, accuracy, cost, and other factors. The suggested accuracy target for flow metering is 2% of full scale.
• Flow metering devices should be connected to the BAS or an independent system that can record output, which may be a pulse stream, an analog voltage, or digital values. The averaging and recording interval should be 1 minute or shorter; selection depends on expected variability in system flow rate.
• Metering data may require correction for temperature, density, and for specific fluid properties if the fluid is not pure water.
130
This report is available at no cost from the National Renewable Energy Laboratory (NREL) at www.nrel.gov/publications.
Air Temperature in a Duct • If BAS duct temperature data are available, they can be validated using one-time
measurements with a digital thermometer.
• Data can be validated using a traverse of the duct at the location of the BAS measurement device on a 2- to 6-in. grid in both dimensions. The measurement device should be accurate within 1.5°F.
• If temperatures are highly stratified across the duct section at the BAS temperature measurement location, or if there is no BAS system, a location should be selected where duct temperature is relatively uniform, with a target of 10°F maximum variation across the duct section.
• If a new duct air temperature station is to be installed, it should include at least four measurement elements, and ideally one element for every 6 × 6 in. grid section. Temperature measurement can use thermocouples, thermistors, or other devices, connected to an appropriate measurement and recording system. Averaging and recording period should be no longer than 1 minute.
Water Temperature in a Pipe • If water temperature is available in a BAS, it can be validated with a one-time
measurement. Validation ideally consists of measuring the temperature of water drawn from the system near the BAS measurement point. If this cannot be done, external pipe temperature measurement near the BAS measurement point can be used. The external temperature probe should be clamped to the pipe and insulated, and the measurement made while water is flowing in the system, but in any case the resulting measurement is slightly biased toward room temperature.
• When no BAS data are available, temperature can be measured using external pipe temperature or internal fluid temperature by installing a well or probe in the system. Externally measured temperatures should be corrected for the bias toward room temperature.
• Water temperature measurement devices may be thermocouples, thermistors, or other devices, connected to an appropriate measurement and recording system, and should have an accuracy of 1.5°F or better. Where temperature difference is important in calculating energy delivery, two measurement probes can be matched or calibrated against each other to reduce uncertainty in the measured difference, or two calibrated thermocouples can be wired to directly measure temperature differences.

131
This report is available at no cost from the National Renewable Energy Laboratory (NREL) at www.nrel.gov/publications.
Appendix B: Detailed EnergyPlus Guidance Infiltration Reduction In EnergyPlus, the ZoneInfiltration:DesignFlowRate object is used to model the infiltration into a building. This models the unintended airflow into a building through cracks and exterior doors, and around windows. EnergyPlus has the option to use a more complicated airflow network calculation to determine the infiltration for a building based on pressure differentials; however, a simple approach based on air change rate is sufficient for most models. The true infiltration rate for an existing building can be determined using a fan pressurization test, as described in the Measurement and Verification section of the Infiltration Reduction chapter. For new construction, ASHRAE 90.1 provides recommended values for baseline infiltration levels. Guidance for targets for high-performance envelopes is given below.
The ZoneInfiltration:DesignFlowRate object uses the following equation to calculate the infiltration at any given time step, as a function of temperature, wind speed, and building schedule. Each input is a required field in EnergyPlus and is discussed in the following section.
𝐼𝐼𝐼𝐼𝐼𝐼𝐼𝐼𝐼𝐼𝐼𝐼 = �𝐼𝑑𝑙𝑑𝑙𝑙𝑙�(𝐹𝑑𝑠ℎ𝑙𝑑𝑑𝑙𝑙)[𝐴 + 𝐵|(𝑇𝑧𝑧𝑙𝑙 − 𝑇𝑧𝑑𝑑)| + 𝐶(𝑊𝐼𝐼𝑊𝑊𝑊𝑊𝑊𝑊) + 𝐷(𝑊𝐼𝐼𝑊𝑊𝑊𝑊𝑊𝑊2)] Recommended EnergyPlus Inputs When modeling infiltration in EnergyPlus, the following guidance can be used for each input field. The most important inputs are in bold.
ZoneInfiltration:DesignFlowRate Object Schedule Name: This field specifies the schedule to be used for infiltration rate. This enables the user to adjust the infiltration level at different times of the year or day. The authors recommend that when HVAC systems are in operation the schedule be set to 0.25 and when not in operation that the schedule be 1.
Design Flow Rate Calculation Method. This specifies which method is used to calculate the design volumetric flow rate for infiltration. The available options are:
• Flow/Zone: Specify the volumetric flow rate for infiltration.
• Flow/Area: Specify the volumetric flow rate for infiltration per zone floor area.
• Flow/ExteriorArea: Specify the volumetric flow rate for infiltration per exterior zone surface area.
• Flow/ExteriorWallArea: Specify the volumetric flow rate for the infiltration per exterior wall surface area; this is generally the best choice.
• AirChanges/Hour: Specify the number of times the zone’s air volume is fully changed via infiltration each hour.
Assuming that Flow/ExteriorWallArea is chosen, the following values can be used (in lieu of a measured value). A reasonable baseline value is 0.2016 cfm/ft2 for above-grade exterior wall surface area, at a reference wind speed of 10 mph (Gowri 2009). Target values for higher

132
This report is available at no cost from the National Renewable Energy Laboratory (NREL) at www.nrel.gov/publications.
performing envelopes could be 0.045 cfm/ft2 (ASHRAE standard 189.1-2009), or 0.028 cfm/ft2 (U.S. Army Corps of Engineers, 2012) for a more advanced envelope.
Constant Term Coefficient (A): 0
Temperature Term Coefficient (B): 0
Velocity Term Coefficient (C): 0.224
Velocity Squared Term Coefficient (D): 0
Recommended EnergyPlus Outputs EnergyPlus has several output values for infiltration. These are primarily zone-by-zone values to track the energy flows related to infiltration. Key outputs would be Total Heat Losses and Gains, as well as zone infiltration Air Changes Per Hour. These values can be checked by comparing the estimated air changes to what is expected for a typical space. Additionally, if infiltration is reduced (or modified) by a measure, the HVAC end uses (heating energy, cooling energy, fan energy) in the Summary Reports should show a change, depending on climate (in cold climates, focus on the heating energy; in hot and/or humid climates, focus on the cooling energy).
Natural Ventilation The primary goal of CBP is to save energy; therefore, the following guidance is based on building models in which HVAC control is in place to accommodate operable windows, actively saving energy in the HVAC system.
Two primary groups are available for modeling natural ventilation via operable windows in EnergyPlus:
• ZoneVentilation: a simpler group allowing for an opening (an operable window, for example) to be made from a zone to the outside, and the outside airflow through that opening estimated each hour.
• AirflowNetwork:Multizone: a more complex multizone, multiopening airflow model. In this approach, a group of objects allows the airflow between multiple zones, as well as to and from the outside (via either cracks or openings such as windows).
AirflowNetwork:Multizone should be used when natural ventilation airflow quantities are critical to the model, or if understanding complex wind interactions, the airflow between zones, the pressure relationships between ductwork and operable windows, or other detailed pressure relationships, is important. But basic space types with operable windows can be estimated reasonably well using the simpler, and quicker, ZoneVentilation group, so the following guidance focuses on that object. After this, guidance is given for advancing this approach toward the AirflowNetwork approach. Only one of the two approaches can be implemented in a system.
Similarly, two levels of complexity are available for modeling the interaction of the HVAC system with natural ventilation.

133
This report is available at no cost from the National Renewable Energy Laboratory (NREL) at www.nrel.gov/publications.
• AvailabilityManager:HybridVentilation: an object dedicated to modeling of the hybrid ventilation approach, this object allows a set of simple rules to be used to determine whether natural or mechanical ventilation is used. If natural ventilation is used, the airside HVAC is shut off.
• EnergyManagementSystem (EMS): a group of objects that allows customized control sequences to be programmed for modeling building automation.
AvailabilityManager:HybridVentilation can be used only with systems that use an AirLoopHVAC object; each AirLoopHVAC object has one such manager. The manager can also be tied to a zone system, if an AirLoopHVAC system is not present. If a system cannot be adequately modeled by the availability manager, the EMS approach can be used.
As mentioned, this complete hybrid ventilation approach assumes control of the HVAC system to save energy; if the modeler does not wish to model this energy savings, the natural ventilation objects should still be modeled, but the HVAC control objects can be omitted.
Recommended EnergyPlus Inputs When modeling hybrid ventilation using the ZoneVentilation and HybridVentilation objects, the following guidance can be used for each input field. The most important inputs are in bold.
ZoneVentilation:WindandStackOpenArea Object Zone Name: name of the zone where the window is placed
Opening Area: opening area of the window
Opening Area Fraction Schedule Name: name of a schedule with all values equal to 1
Opening Effectiveness: Autocalculate
Effective Angle: azimuth angle of the opening
Height Difference: this value is difficult to estimate. Modelers can consult ASHRAE Fundamentals Chapter 16 for assistance. Simplified rules of thumb include:
• Low-rise buildings: the difference from the window midpoint to the ceiling height
• Taller buildings with standard openings: difference between window midpoint and 50% building height
• Taller buildings with design elements aiding natural ventilation (relief vents, chimneys, etc.): difference between window midpoint and 75% building height.
Discharge Coefficient for Opening: Autocalculate
Minimum Indoor Temperature: if a room cools because a window is open, the minimum temperature allowable at which point occupants would shut windows
Maximum Indoor Temperature: if a room heats because a window is open, the maximum temperature allowable at which point occupants would shut windows

134
This report is available at no cost from the National Renewable Energy Laboratory (NREL) at www.nrel.gov/publications.
Minimum Outdoor Temperature Schedule Name: name of a schedule with minimum outdoor temperatures at which occupants would likely open windows (the value should change seasonally; e.g., a cooler temperature threshold may be used in summer)
Maximum Outdoor Temperature Schedule Name: name of a schedule with maximum outdoor temperatures at which occupants would likely open windows (the value could change seasonally; e.g., occupants may respond differently in the shoulder seasons than the summer)
Maximum Wind Speed: 1,000 ft/min (2,000 ft/min if windows are sheltered from wind)
Other EnergyPlus inputs for this object, which are of minimal importance, include Name, Minimum Indoor Temperature Schedule Name, Maximum Indoor Temperature Schedule Name, Delta Temperature, Delta Temperature Schedule Name, Minimum Outdoor Temperature, and Maximum Outdoor Temperature.
AvailabilityManager:HybridVentilation object HVAC Air Loop Name: name of the AirLoopHVAC object being controlled
Controlled Zone Name: name of the zone being controlled (enter only if a zone HVAC system is controlled instead of an AirLoopHVAC object)
Ventilation Control Mode Schedule Name: name of a schedule dictating the control type of hybrid ventilation; values of 1 indicate temperature control, values of 3 indicate dew point control. Recommended schedules are either values of 1 all year, or values of 1 all year except humid months (in a humid climate) when values are 3.
Use Weather File Rain Indicators: Yes (No if windows are well sheltered from rain)
Maximum Wind Speed: 1,000 ft/min (2,000 ft/min if windows are sheltered from wind)
Minimum Outdoor Temperature: temperature below which the HVAC system is on, and all windows are assumed always closed (when the control schedule is set to temperature)
Maximum Outdoor Temperature: temperature above which the HVAC system is on, and all windows are assumed always closed (when the control schedule is set to temperature)
Minimum Outdoor Dew point: dew point below which the HVAC system is on, and all windows are assumed always closed (when the control schedule is set to dew point)
Maximum Outdoor Dew point: dew point above which the HVAC system is on, and all windows are assumed always closed (when the control schedule is set to dew point)
Simple Airflow Control Type Schedule Name: name of a schedule with all values equal to 0
ZoneVentilation Object Name: the name of the corresponding zone ventilation object (laid out above)

135
This report is available at no cost from the National Renewable Energy Laboratory (NREL) at www.nrel.gov/publications.
Other EnergyPlus inputs for this object, which are of minimal importance, include Name, Minimum Outdoor Enthalpy, Maximum Outdoor Enthalpy, Minimum Outdoor Ventilation Air Schedule Name, Opening Factor Function of Wind Speed Curve Name, and AirflowNetwork Control Type Schedule Name.
This manager prevents HVAC from operating if natural ventilation is allowed, and prevents windows from being opened if natural ventilation is not allowed. But it does not necessarily guarantee windows are open if natural ventilation is allowed; each window still operates according to the requirements of the ZoneVentilation (or AirflowNetwork:Multizone:Zone object).
If the AvailabilityManager:HybridVentilation object cannot represent the desired control sequence, almost any customized control sequence can be implemented through EnergyPlus’ EMS. The Application Guide for EMS42 can be used to learn how to use EMS; a simple example of using EMS to control hybrid ventilation is also given in the EMSAirflowNetworkOpeningControlByHumidity.idf example file.43
Finally, if the ZoneVentilation object cannot adequately represent a natural ventilation strategy, an AirFlowNetwork can be implemented, with at least an AirflowNetwork:Multizone:Component:DetailedOpening and AirflowNetwork:Multizone:Zone representing each operable window and each corresponding zone, respectively. The HVAC control presented above can remain, but a schedule must be input for AirflowNetwork Control Type Schedule Name in the availability manager.
Recommended EnergyPlus Outputs The energy impact of natural ventilation is complex. If natural ventilation is implemented (and modeled) with the primary goal of improving occupant comfort (which is often done, rightfully so), comfort impacts and the impact on the HVAC system (specifically, whether natural ventilation is saving or costing energy) must be understood.
This same complexity can make it very difficult to determine if hybrid ventilation operates properly simply by viewing summary outputs; most modelers will want to check at least a subset of their zones individually using hourly reports. For a select subset of ZoneVentilation objects, the authors recommend reporting the following:
• Current density volume flow rate
• Total heat loss energy
• Total heat gain energy
• Air inlet temperature.
For the AvailabilityManager:HybridVentilation objects, the authors recommend that users report Control Mode and Control Status.
42 Included with the EnergyPlus installation, in the Documentation folder. 43 Included with the EnergyPlus installation, in the ExampleFiles folder.

136
This report is available at no cost from the National Renewable Energy Laboratory (NREL) at www.nrel.gov/publications.
Efficient Elevators The EnergyPlus object that is used to represent elevators is the ElectricEquipment object. This object represents an electricity load in an interior space. The main inputs are the elevator’s schedule and power consumption. The impact of regenerative elevators can be modeled by simply reducing the power, and the benefit of a well-designed stairwell that attracts more users may be modeled by reducing the elevator schedule. This EnergyPlus object is designed to represent equipment that is inside a building and uses metered electricity (which should be true of most elevators). Although elevators include lights and fans, most of the EnergyPlus guidance in this report focuses on how to model the elevator motor. The elevator lights and fans should be accounted for using the Lights and Fan:ZoneExhaust objects.
Recommended EnergyPlus inputs When modeling regenerative elevators in EnergyPlus, the following guidance can be used for each input field. The most important inputs are in bold.
ElectricEquipment Object Zone or ZoneList: Name of the building zone where the elevator is located. The elevator zone should have its own Fan:ZoneExhaust and Lights object.
Schedule Name: Elevator schedules vary greatly depending on building type, size, and number of floors. The schedule should show little to no elevator usage outside of the building’s operating hours. The elevator schedule includes power from the motor and control, but excludes power from elevator lights and fans (see discussion on modeling lights and fans below). The benefit of increased stairway usage can be modeled by reducing the elevator schedule by approximately 20%–50%. The Bullitt Center operators have found that 70% of trips involved use of stairs, which compares to 17%–26% in a typical office building. This is likely due to the design of the “irresistible” stairs as well as energy-conscious tenants, so 50% may be a slightly aggressive savings estimate. Baseline or typical elevator schedules for different building types can be found in the ASHRAE 90.1 2010 User’s Manual. As an example, an elevator schedule for a typical office building weekday operating from 8 a.m. to 5 p.m. would include:
Until: 07:00, 0,
Until: 08:00, 0.35,
Until: 09:00, 0.69,
Until: 10:00, 0.43,
Until: 11:00, 0.37,
Until: 12:00, 0.43,
Until: 13:00, 0.58,
Until: 14:00, 0.48,

137
This report is available at no cost from the National Renewable Energy Laboratory (NREL) at www.nrel.gov/publications.
Until: 16:00, 0.37,
Until: 17:00, 0.46,
Until: 18:00, 0.62,
Until: 19:00, 0.2,
Until: 20:00, 0.12,
Until: 22:00, 0.04,
Until: 24:00, 0.
Design Level Calculation Method: The method of entering elevator power. EquipmentLevel should be chosen if the specific wattage is known.
Design Level: Equipment wattage (assumes EquipmentLevel was chosen). If site-specific information on elevator motor type is unavailable for a building, the following typical assumptions should be made: Buildings lower than six stories are assumed to use elevators with hydraulic motors. Buildings six stories and higher should be assumed to use traction motor elevators (Kwatra 2013). Use the equation below and inputs from Table 27 to determine the power of the elevator if a specification or submittal is not available. Regenerative elevators have been quoted to reduce elevator energy consumption by approximately 25% (Kwatra 2013). This reduction can be modeled by reducing design power by 25%. Motor power is calculated as:
𝑀𝐼𝐼𝐼𝐼 𝑃𝐼𝑃𝑊𝐼,𝑊𝐼𝐼𝐼𝑊 =𝑊 ∙ 𝑉 ∙ (1 − 𝑂𝐶𝑊)
44.25 ∙ ɳ𝑚
Where,
W is the weight of the car
V is the speed of the car
OCW is the fractional over counter weight
ɳ𝑚 is the mechanical efficiency of the elevator.
Typical values for these parameters are given in Table 27.
Table 27. Typical Inputs for Elevators With Hydraulic and Traction Motors
Recommended Inputs Hydraulic Motors Traction Motors Weight of car, lb (W) 2,500 2,500
Speed of car, ft/min (V) 150 350
Over counter weight, fraction (OCW) 0 0.4 Mechanical efficiency of elevator, fraction (ɳ𝑚) 0.58 0.64 Power using recommended inputs, W 14,610 18,537
Source: Deru 2011
138
This report is available at no cost from the National Renewable Energy Laboratory (NREL) at www.nrel.gov/publications.
Fraction Latent: 0
Fraction Radiant: 0
Fraction Lost: 0.5 for hydraulic elevators, 0.6 for traction elevators
End-Use Subcategory: Elevator
The ElectricEquipment object also includes inputs for Name, Watts per Zone Floor Area, and Watts per Person, which were not pertinent to this measure, so these fields can be left blank.
Elevator lights should be modeled using the Lights object within the elevator’s zone. If modeling lights controlled by an occupancy sensor, a similar schedule to the elevator schedule should be used (the lights typically have at least a 5-min delay before turning off).
Because the elevator fan does not exhaust air from the building (it simply moves it from one space to another within a single thermal zone), the elevator exhaust fan can be modeled simply by using a separate ElectricEquipment object with the Design Level set equal to the fan power. Again, if the fan is controlled using an occupancy sensor, a schedule similar to that for the elevator is appropriate.
Recommended EnergyPlus Outputs The name used in the End-Use Subcategory field (“Elevator” is the suggested name above) can be referenced directly in the End Uses by Subcategory summary table (which is automatically generated after the “Elevator” or any other user-defined end use has been defined in the End-Use Subcategory field.) The table will be located in the Tables output file, which is a CSV file. Elevator energy usage should just a small fraction of building energy usage. Elevators should use minimal energy during unoccupied periods.
Office Plug Loads Use the ElectricEquipment object to represent office plug loads. This object simply represents a single electricity load (or aggregate of several similar loads) in an interior space. The flow of energy from this object is highly flexible. The user can choose whether the load adds heat to the space (for plug loads it does), whether the load is sensible or latent (office plug loads are 100% sensible), and what portion of the load is radiant (this can vary from plug load to plug load). Note that this EnergyPlus object is meant to represent equipment that is inside a building, and uses electricity, which should correspond to any office plug load. If equipment is outside the building or not connected to the main electric utility meter, another object should be used instead.
Recommended EnergyPlus Inputs The important inputs (bold inputs are most important) for plug load energy use in the ElectricEquipment object are:
• Zone or ZoneList
• Schedule Name

139
This report is available at no cost from the National Renewable Energy Laboratory (NREL) at www.nrel.gov/publications.
• Design Level Calculation Method
• Design Level
• Watts per Zone Floor Area
• Fraction Latent
• Fraction Radiant
• Fraction Lost. Specific guidance for each input includes:
• Zone or ZoneList: Name of the building zone where the equipment is located.
• Schedule Name: A schedule name. Assuming that diversity is already taken into account when the plug load Watts are specified (which is generally true), plug load schedules should peak near 100%. Evidence suggests that their value should not change substantially throughout the day (during occupied hours), with only slight reductions (perhaps to 80%) at the very beginning and end of the day, and during lunch. Nighttime and weekend plug loads should be 35%–50% of occupied plug loads.44 Levels would only be below 35% if absolutely no server load exists at the site; levels could be above 50% if a data center (more than a server closet) is part of the load.
• Design Level Calculation Method: The method of entering plug load power. EquipmentLevel should be chosen if the specific wattage is known. Otherwise, Watts/Area should be chosen.
• Design Level: Equipment Wattage, if EquipmentLevel was chosen. A variety of sources are available for the wattage of office equipment; ASHRAE Fundamentals Chapter 18 is one good source. The wattage should not be the peak power draw of the equipment; a load factor must be applied first: for office equipment this can be 15%–40%.
• Watts per Zone Floor Area: The equipment power density in W/ft2, if Watts/Area was chosen. ASHRAE research and various energy modeling best practices suggest an input of between 0.33 W/ft2 and 1.0 W/ft2 for offices. The low end represents larger workstations with laptops only, computer power management, and shared printers. The high end represents smaller workstations with desktop computers, multiple monitors, and some peripherals. The low end is difficult to achieve; NREL’s Research Support Facility was able to achieve 0.46 W/ft2, only because the owner was highly interested and had a focused plan for plug load reduction.
• Fraction Latent: 0
• Fraction Radiant: 0.3, for general office equipment. More specific possible inputs: desktop computers should be 0.1, laptops 0.25, LCD monitors 0.4, and printers 0.3.
• Fraction Lost: 0.
44 This is based on recent measured data from a few actual buildings. This contradicts guidance given in ASHRAE 90.1 Users Manuals and some other energy modeling references, which may not account for the more recent computational needs of offices.

140
This report is available at no cost from the National Renewable Energy Laboratory (NREL) at www.nrel.gov/publications.
Other EnergyPlus inputs for this object, which are of minimal importance, include Name, Watts per Person (needed only if Watts/Person was chosen as the method), and End-Use Subcategory (see outputs section).
Recommended EnergyPlus Outputs Model outputs should be used to check the energy used by plug loads to ensure that it is reasonable and that loads on the building and HVAC system are reasonable. Office plug loads are fairly uniform throughout many building types. If this is the case, reference the Interior Equipment category in the End Uses summary table (summary tables must be printed).
If the energy use of a given zone or piece of equipment is important, the End-Use Subcategory field within the ElectricEquipment object of interest should be set to a descriptive name; this name can then be referenced directly in the End Uses by Subcategory summary table. This is especially useful for a server, large copier, or other such specific, large plug load.
Interior Light-Emitting Diodes The EnergyPlus object that is used for representing interior lights of all types, including LEDs, is the Lights object. The object models lighting power and operation schedule within a space. If lights in a space differ (they’re controlled differently, produce different levels of heat, etc.), more than one Lights object can be used in a space. The object’s important inputs are the lighting power density within the space, the lighting schedule, and the amount of thermal heat the lights add to the space. LED fixtures are beneficial because they reduce lighting power, but this also reduces the amount of heat load to the space, which will impact heating and cooling energy. The Lights object can also specify whether the lights have the ability to be controlled by daylighting, but don’t include any other inputs specific to daylighting. The Daylighting:Controls object is used to determine the daylighting scheme.
Recommended EnergyPlus Inputs The important inputs (highlighted inputs are most important) for lighting power in the Lights object are:
• Schedule name
• Design level calculation method
• Watts per zone floor area
• Return air fraction
• Fraction radiant
• Fraction visible
• Fraction replaceable.
The important input for lighting power in the Daylighting:Controls object is Lighting control type.

141
This report is available at no cost from the National Renewable Energy Laboratory (NREL) at www.nrel.gov/publications.
Lights Object Schedule Name: Lighting schedule vary depending on space type, hours of operation, and controls installed. If an actual schedule is unknown, representative schedules are available by space type in ASHRAE (2010). Lighting schedules, at any time, will rarely have an input of 0 because of emergency lighting. The impact of occupancy sensors should be accounted for in this schedule, but lights dimming because of daylighting should not. An example weekday schedule of a typical warehouse operating from 8 p.m. to 5 p.m. would include:
Until: 07:00, 0.05,
Until: 08:00, 0.4,
Until: 09:00, 0.7,
Until: 12:00, 0.9,
Until: 13:00, 0.8,
Until: 17:00, 0.9,
Until: 18:00, 0.3,
Until: 24:00, 0.05.
Design Level Calculation Method: Watts/Area
Watts per Zone Floor Area: The lighting power density is entered here in units of W/ft2 or W/m2, depending on which unit system is being used in EnergyPlus, if Watts/Area was chosen as the design level calculation method. (See Table 28 for guidance.) A rule of thumb is that LED fixtures can use half the power achieved by fluorescent lights.
Table 28. Typical Lighting Power Densities for Big-Box Stores and Warehouses
Value Range Big-Box Stores Warehouses 100% LED 0.7 W/ft2 0.25 W/ft2 High-performance fluorescent 0.9 W/ft2 0.4 W/ft2 Code minimum (90.1-2010) 1.4 W/ft2 0.66 W/ft2
Heat gains from lights are a combination of return air fraction, fraction radiant, fraction visible, and fraction convected. The fraction convected is calculated using this equation:
Fraction convected = 1- (Return Air Fraction + Fraction Radiant + Fraction Visible)
Return air fraction: 0 (for big-box and retail, where there is rarely dropped-ceiling)
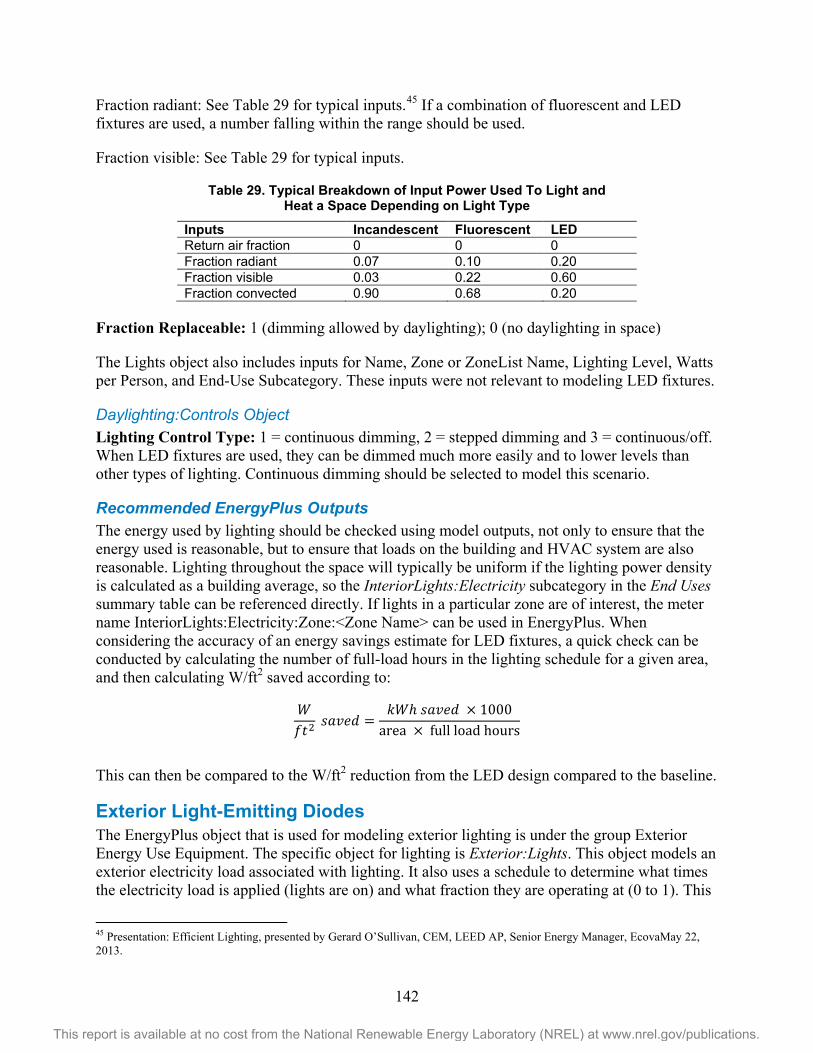
142
This report is available at no cost from the National Renewable Energy Laboratory (NREL) at www.nrel.gov/publications.
Fraction radiant: See Table 29 for typical inputs.45 If a combination of fluorescent and LED fixtures are used, a number falling within the range should be used.
Fraction visible: See Table 29 for typical inputs.
Table 29. Typical Breakdown of Input Power Used To Light and Heat a Space Depending on Light Type
Inputs Incandescent Fluorescent LED Return air fraction 0 0 0 Fraction radiant 0.07 0.10 0.20 Fraction visible 0.03 0.22 0.60 Fraction convected 0.90 0.68 0.20
Fraction Replaceable: 1 (dimming allowed by daylighting); 0 (no daylighting in space)
The Lights object also includes inputs for Name, Zone or ZoneList Name, Lighting Level, Watts per Person, and End-Use Subcategory. These inputs were not relevant to modeling LED fixtures.
Daylighting:Controls Object Lighting Control Type: 1 = continuous dimming, 2 = stepped dimming and 3 = continuous/off. When LED fixtures are used, they can be dimmed much more easily and to lower levels than other types of lighting. Continuous dimming should be selected to model this scenario.
Recommended EnergyPlus Outputs The energy used by lighting should be checked using model outputs, not only to ensure that the energy used is reasonable, but to ensure that loads on the building and HVAC system are also reasonable. Lighting throughout the space will typically be uniform if the lighting power density is calculated as a building average, so the InteriorLights:Electricity subcategory in the End Uses summary table can be referenced directly. If lights in a particular zone are of interest, the meter name InteriorLights:Electricity:Zone:<Zone Name> can be used in EnergyPlus. When considering the accuracy of an energy savings estimate for LED fixtures, a quick check can be conducted by calculating the number of full-load hours in the lighting schedule for a given area, and then calculating W/ft2 saved according to:
𝑊𝐼𝐼2
𝑊𝐼𝑠𝑊𝑊 =𝑘𝑊ℎ 𝑊𝐼𝑠𝑊𝑊 × 1000
area × full load hours
This can then be compared to the W/ft2 reduction from the LED design compared to the baseline.
Exterior Light-Emitting Diodes The EnergyPlus object that is used for modeling exterior lighting is under the group Exterior Energy Use Equipment. The specific object for lighting is Exterior:Lights. This object models an exterior electricity load associated with lighting. It also uses a schedule to determine what times the electricity load is applied (lights are on) and what fraction they are operating at (0 to 1). This
45 Presentation: Efficient Lighting, presented by Gerard O’Sullivan, CEM, LEED AP, Senior Energy Manager, EcovaMay 22, 2013.

143
This report is available at no cost from the National Renewable Energy Laboratory (NREL) at www.nrel.gov/publications.
object does not consider any heat loads from the lighting. In EnergyPlus, the impact of thermal gains from exterior lights is disregarded.
Recommended EnergyPlus Inputs When modeling exterior lighting in EnergyPlus, the following guidance can be used for each input field. The most important inputs are in bold.
Exterior:Lights Object Schedule Name: This field specifies the name of the schedule and the schedule to be used to model the lighting. The schedule dictates when the lighting operates, and can specify seasonal and hourly operation as well as the fractional level of design the at which lights will function.
For retail exterior lighting (parking and façade):
4:00 to 8:00—1
8:00 to 16:00—0
16:00 to 24:00—1
24:00 to 4:00—0.5.
This schedule should not be for the entire year; if daylight hours are shorter or longer, the schedule should be adjusted to avoid lighting during daylight hours.
Design Level: The total wattage that the lights consume at design conditions (full operation). The proposed LED fixtures value is:
𝐷𝑊𝑊𝐼𝐷𝐼 𝐿𝑊𝑠𝑊𝐼 [𝑊] = 0.04 �𝑊 𝐼𝐼2� � × 𝑃𝐼𝐼𝑘𝐼𝐼𝐷𝐿𝐼𝐼𝐴𝐼𝑊𝐼 [𝐼𝐼2]
This value is determined by reducing the ASHRAE 90.1 baseline parking lot lighting power density by 60%, which is the approximate reduction that can be seen by using LED fixtures. (The ASHRAE 90.1 baseline for zone 3, uncovered parking areas is 0.1 W/ft2.)
For façade lighting, the ASHRAE baseline lighting power density is 3.75 W/ft of illuminated wall. The proposed LED fixtures design level for façade lighting is:
𝐷𝑊𝑊𝐼𝐷𝐼 𝐿𝑊𝑠𝑊𝐼 [𝑊] = 1.5 �𝑊 𝐼𝐼� � × 𝑊𝐼𝐼𝐼𝐿𝑊𝐼𝐷𝐼ℎ [𝐼𝐼]
Baseline lighting power densities for areas not covered in this report can be found in ASHRAE 90.1. As previously mentioned, a general approximation for the reduction in lighting power density by converting to LED fixtures is 60% of the baseline value.
Control Option: This field has two options that dictate how the lights are controlled: (1) the ScheduleNameOnly option, which forces the lights to operate as specified in the Schedule Name field; and (2) the AstronomicalClock, which turns the exterior lights off during daylight hours. This option overrides the schedule specified in the Schedule Name field by turning the lighting
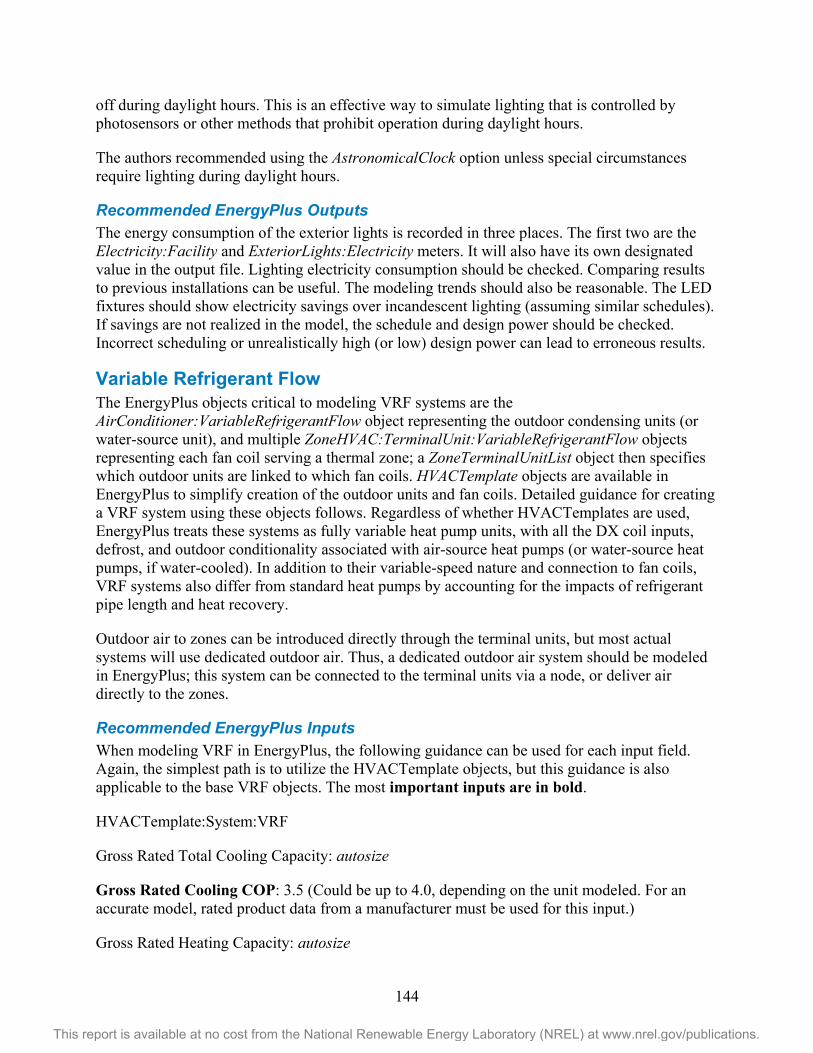
144
This report is available at no cost from the National Renewable Energy Laboratory (NREL) at www.nrel.gov/publications.
off during daylight hours. This is an effective way to simulate lighting that is controlled by photosensors or other methods that prohibit operation during daylight hours.
The authors recommended using the AstronomicalClock option unless special circumstances require lighting during daylight hours.
Recommended EnergyPlus Outputs The energy consumption of the exterior lights is recorded in three places. The first two are the Electricity:Facility and ExteriorLights:Electricity meters. It will also have its own designated value in the output file. Lighting electricity consumption should be checked. Comparing results to previous installations can be useful. The modeling trends should also be reasonable. The LED fixtures should show electricity savings over incandescent lighting (assuming similar schedules). If savings are not realized in the model, the schedule and design power should be checked. Incorrect scheduling or unrealistically high (or low) design power can lead to erroneous results.
Variable Refrigerant Flow The EnergyPlus objects critical to modeling VRF systems are the AirConditioner:VariableRefrigerantFlow object representing the outdoor condensing units (or water-source unit), and multiple ZoneHVAC:TerminalUnit:VariableRefrigerantFlow objects representing each fan coil serving a thermal zone; a ZoneTerminalUnitList object then specifies which outdoor units are linked to which fan coils. HVACTemplate objects are available in EnergyPlus to simplify creation of the outdoor units and fan coils. Detailed guidance for creating a VRF system using these objects follows. Regardless of whether HVACTemplates are used, EnergyPlus treats these systems as fully variable heat pump units, with all the DX coil inputs, defrost, and outdoor conditionality associated with air-source heat pumps (or water-source heat pumps, if water-cooled). In addition to their variable-speed nature and connection to fan coils, VRF systems also differ from standard heat pumps by accounting for the impacts of refrigerant pipe length and heat recovery.
Outdoor air to zones can be introduced directly through the terminal units, but most actual systems will use dedicated outdoor air. Thus, a dedicated outdoor air system should be modeled in EnergyPlus; this system can be connected to the terminal units via a node, or deliver air directly to the zones.
Recommended EnergyPlus Inputs When modeling VRF in EnergyPlus, the following guidance can be used for each input field. Again, the simplest path is to utilize the HVACTemplate objects, but this guidance is also applicable to the base VRF objects. The most important inputs are in bold.
HVACTemplate:System:VRF
Gross Rated Total Cooling Capacity: autosize
Gross Rated Cooling COP: 3.5 (Could be up to 4.0, depending on the unit modeled. For an accurate model, rated product data from a manufacturer must be used for this input.)
Gross Rated Heating Capacity: autosize

145
This report is available at no cost from the National Renewable Energy Laboratory (NREL) at www.nrel.gov/publications.
Rated Heating Capacity Sizing Ratio: 1 (or ratio of heating capacity to cooling capacity of units modeled)
Gross Rated Heating COP: 3.3 (Could be up to 4.0, depending on the unit modeled. For an accurate model, rated product data from a manufacturer must be used for this input.)
Minimum Heat Pump Part-Load Ratio: 0.10
Zone Name for Master Thermostat Location: choose the zone with the largest loads.
Master Thermostat Priority Control Type: MasterThermostatPriority (consult the manufacturer to determine their sequence)
Heat Pump Waste Heat Recovery: Yes (for most systems; No if system is incapable of different zones being in heating and cooling)
Equivalent Piping Length used for Piping Correction Factor in Cooling, and Heating: distance from the condenser to the farthest terminal unit, with added head loss for fittings
Crankcase Heater Power per Compressor: 50 Btu/h
Number of Compressors: 2 (this is actually only for crankcase heater sequence)
Maximum Outdoor Dry-bulb Temperature for Crankcase Heater: 40oF
Defrost Strategy: ReverseCycle (for most systems; modeler should confirm)
Defrost Control: Timed (for most systems; modeler should confirm)
Defrost Time Period Fraction: 0.07
Maximum Outdoor Dry-bulb Temperature for Defrost Operation: 45oF
Condenser Type: AirCooled (unless system is water-cooled, then choose WaterCooled)
Minimum Outdoor Temperature in Heat Recovery Mode: leave blank
Maximum Outdoor Temperature in Heat Recovery Mode: leave blank
Other EnergyPlus inputs for this object, which are of minimal importance, include Name, System Availability Schedule Name, Minimum/Maximum Outdoor Temperature for Heating/Cooling Modes, Thermostat Priority Schedule Name, Vertical Height used for Piping Correction Factor, Ratio of Compressor Size to Total Compressor Capacity, Resistive Defrost Heater Capacity, Water Condenser Volume Flow Rate, Fuel Type, and inputs that would only be needed for evaporatively cooled units (Evaporative Condenser Effectiveness, Evaporative Condenser Air Flow Rate, Evaporative Condenser Pump Rated Power Consumption, Basin Heater Capacity, Basin Heater Setpoint Temperature, Basin Heater Operating Schedule Name)

146
This report is available at no cost from the National Renewable Energy Laboratory (NREL) at www.nrel.gov/publications.
HVACTemplate:Zone:VRF Supply Air Fan Object Type: Fan:OnOff
If the HVACTemplate version is not used, the TerminalUnit object will also require the assignment of a heating coil and a cooling coil, both which must be of type VariableRefrigerantFlow. Because the primary benefit of VRF systems is their part load and ambient unloading performance, these curves should be based on the manufacturer’s performance data whenever possible; other sources include:
• NREL’s Technology Performance Exchange (https://performance.nrel.gov/), which includes performance data for a variety of HVAC equipment types, including VRF (called Ductless Heat Pumps on the site).
• Curves specifically for energy modeling have also been published by LG (2012) and Mitsubishi. And Daikin’s website contains engineering manuals with enough information to create curves.
• A VRF performance map was also tested and published by Raustad (2013).
Finally, if the TerminalUnit object is used, the supply air temperature in heating should be set to 90°F.
Recommended EnergyPlus Outputs The impact of a VRF system on a building energy model is comprehensive—zone temperature/comfort, plant energy use, airflows, ventilation, and fan energy are all affected. Therefore, to ensure quality results, comprehensive outputs, such as those in the summary reports for HVAC systems and end-uses, must be viewed first to check zone temperature and unmet hours, system sizing, VRF unit energy consumption and COP, and ventilation airflows. All these should be compared to the results of any other HVAC system types being modeled for comparison, as well as reasonably expected results.
To verify system operation in more detail, the following outputs should be reported (hourly if feasible) and checked from AirConditioner:VariableRefrigerantFlow:
• VRF Heat Pump Total Cooling Rate
• VRF Heat Pump Total Heating Rate
• VRF Heat Pump Cooling COP and Heating COP
• VRF Heat Pump Cooling Electric Power
• VRF Heat Pump Heating Electric Power.
Ensure that loads are reasonable, and most importantly, that COP is as expected per manufacturer data.
From ZoneHVAC:TerminalUnit:VariableRefrigerantFlow, the primary useful output would be the Zone VRF Air Terminal Total Heating Rate and Zone VRF Air Terminal Total Heating Rate, only for the larger zones that make up the majority of the building load. The general trend of the

147
This report is available at no cost from the National Renewable Energy Laboratory (NREL) at www.nrel.gov/publications.
loads should appear reasonable; the annual load may even be summed to determine if it is reasonable.
Kitchen Exhaust Hoods The EnergyPlus object that is commonly used for representing kitchen exhaust hoods is the Fan:ZoneExhaust object. As the kitchen hood is generally tied to some source of make-up air, an associated ZoneHVAC system is also generally affected. In this example, assuming that the associated system is a VAV make-up air unit, a Fan:VariableVolume object and a Controller:OutdoorAir object also need to be input correctly. Advanced hood controls usually operate by modulating fan speed based on measurements of heat and smoke in the hood. In EnergyPlus these contaminants are not generally modeled directly; instead, the ZoneExhaust fan modulates according to a schedule (impacting zone fan energy) and the VAV make-up air will balance this exhaust air by modulating the incoming outside air (which is where heating and cooling of outside air is impacted). The energy savings from kitchen hood controls are therefore heavily impacted by the choice of schedule. A reasonable schedule is given in the recommended EnergyPlus inputs for Flow Fraction Schedule Name.
Also ensure that in both the Sizing: and AirTerminal: objects for the corresponding make-up air system, the minimum flow rate input is set to less than 1, so the system is allowed to modulate speed. The ZoneExhaust fan also can transfer some of the air from adjacent zones (or from the outside).
Recommended EnergyPlus Inputs When modeling advanced control of kitchen exhaust hoods in EnergyPlus, the following guidance can be used for each input field. The most important inputs are in bold.
Fan:ZoneExhaust Object Availability Schedule Name: an hourly schedule name, with 0 for off, and >0 for on
Fan Total Efficiency: between 65% and 75% is reasonable
Pressure Rise: between 1 and 2 in. w.c.
Maximum Flow Rate: the rated airflow of the hood
Air Inlet Node Name: The node representing the zone the fan is in; this node should be a zone exhaust node in whichever ZoneHVAC:EquipmentConnections object corresponds to the make-up air system.
Flow Fraction Schedule Name: A fractional schedule corresponding to fractional speed of the exhaust hood fan at each hour. According to research (Fischer 2013), an appropriate schedule would result in an average reduction in flow of approximately 26% during occupied hours. An example flow schedule for a kitchen operating from 5 a.m. to 10 p.m. would include:
Until: 05:00, 0,
Until: 07:00, 0.3,

148
This report is available at no cost from the National Renewable Energy Laboratory (NREL) at www.nrel.gov/publications.
Until: 08:00, 0.8,
Until: 10:00, 0.9,
Until: 11:00, 0.5,
Until: 12:00, 0.8,
Until: 13:00, 0.95,
Until: 14:00, 0.75,
Until: 17:00, 0.3,
Until: 18:00, 0.9,
Until: 19:00, 0.95,
Until: 20:00, 0.8,
Until: 22:00, 0.3.
System Availability Manager Coupling Mode: Coupled (assuming it is coupled to a dedicated kitchen make-up air unit as discussed herein; if not, select Decoupled).
Balanced Exhaust Fraction Schedule Name: A fractional schedule specifying the fraction of flow that is balanced by transfer air from outside the kitchen, as opposed to air from a make-up air system in the zone itself. For example, if 60% of the air for the hood is expected to be transferred from a separate dining room HVAC system, and 5% is expected to infiltrate from outside, the fraction that hour would be 0.6 + 0.05 = 0.65.
Other EnergyPlus inputs for this object, which are of minimal importance, include Name, Air Outlet Node Name, End-Use Subcategory, Minimum Zone Temperature Limit Schedule Name
Fan:VariableVolume object (the supply fan in the make-up air system)
Fan Power Minimum Flow Rate Input Method: Fraction
Fan Power Minimum Flow Fraction: 0.25 (must simply be below 1 to show savings from advanced hood controls)
There are several other EnergyPlus inputs for this object, none of which are related to this measure.
Controller:OutdoorAir object (the OA controller on the make-up air system)
The Controller:OutdoorAir object can be used in multiple ways to control outdoor air. In any case, for the outside air to modulate properly in conjunction with the Airloop and associated supply and exhaust fans, this controller should be set so that outdoor air is in some proportion to

149
This report is available at no cost from the National Renewable Energy Laboratory (NREL) at www.nrel.gov/publications.
supply air flow, and not a set airflow rate (e.g., a 5,000-cfm system with 80% outdoor air should be set to 80% outdoor air in the controller, NOT 4,000 cfm). Most make-up air systems use 100% outside air; if this is the case, the inputs chosen should result in an outdoor air fraction of 1.
Recommended EnergyPlus Outputs Advanced kitchen exhaust hood controls save energy at both the exhaust fan and the make-up air unit. Therefore, outputs from both units should be checked to confirm proper reductions in flow and energy. To verify that the exhaust fan is working properly, the following should be reported from the Fan:ZoneExhaust object:
• Fan Electric Power
• Fan Unbalanced Air Mass Flow Rate
• Fan Balanced Air Mass Flow Rate.
To verify that the make-up air saves energy, the Air System Outdoor Air Mass Flow Rate output (for the corresponding outside air controller) should be reported, and confirmed to modulate appropriately. The energy used by this system for cooling, heating, and fan energy should also decrease substantially; this can be viewed in the SystemSummary report that corresponds to the coil type (DX, hot water, etc.) for the system.
Evaporative Precooling Modeling Evaporative Condensing and Evaporative Precooling In EnergyPlus, evaporative precooling of the condenser is modeled using the Coil:Cooling:DX objects. There are a variety of Coil:Cooling:DX objects, each specifying a different type of fan control and equipment configuration. These objects are listed in the following section, with brief descriptions. The Coil:Cooling:DX object handles the modeling of the DX cycle’s condenser and evaporator coils. The Coil:Cooling:DX object can be selected for use with either zone equipment (e.g., ZoneHVAC:PackagedTerminalAirConditioner) or an air loop system.
The DX cooling coil objects can be modeled as either air cooled or evaporatively cooled. If evaporative cooling is chosen, the condenser coil should be modeled as evaporatively cooled. (This does not model indirect evaporative precooling of the ventilation air.) Also, currently, no simple way is known to effectively model a hybrid evaporative precooler in EnergyPlus, where the secondary exhaust air is used to cool the condenser.
Recommended EnergyPlus Inputs When modeling evaporative condensing in EnergyPlus, use the following guidance for each input field. The most important inputs are in bold.
Coil:Cooling:DX object
For modeling evaporative cooling of the condenser coil, any of the following DX system objects can be used:
Coil:Cooling:DX:SingleSpeed—used to represent DX systems with single speed fans

150
This report is available at no cost from the National Renewable Energy Laboratory (NREL) at www.nrel.gov/publications.
Coil:Cooling:DX:TwoSpeed—used to represent DX systems with two speed fans
Coil:Cooling:DX:TwoStageWithHumidityControlMode—used to represent DX systems with two speed fans, plus humidity control for the supply air.
Coil:Cooling:DX:MultiSpeed—used to represent DX systems with multiple speed fans
Coil:Cooling:DX:VariableSpeed—used to represent DX systems with variable-speed fans (recommended for highest performance)
Each condenser coil uses a different fan and control system. This selection should depend on what equipment will be installed in the building. The list above is presented in order of lowest to highest energy performance.
Capacity and energy input ratio curves are required for these coil objects; these curves should be based on the type of coil used and should ideally be obtained from the manufacturer. The following curves can be used if the manufacturer’s data are not available. These curves assume a two-stage system; if a single-stage system is to be modeled, the “High-Speed” curves should be used (Table 30 to Table 33).
Table 30. Total Cooling Capacity Function of Temperature Curves (x = WB, y = DB)
High Speed Low Speed Curve Type Biquadratic Biquadratic Coefficient1 Constant 0.523570956 0.413577204 Coefficient2 x 0.034777768 0.031052138 Coefficient3 x2 Coefficient4 y -0.001915358 0.006951738 Coefficient5 y2 –1.08E-04 -2.13E-04 Coefficient6 x*y Minimum Value of x 9.277777778 9.277777778 Maximum Value of x 26.83333333 26.83333333 Minimum Value of y 15.55555556 15.55555556 Maximum Value of y 44.72222222 44.72222222
Table 31. Total Cooling Capacity Function of Flow Fraction Curve
High Speed Low Speed Curve Type Quadratic Quadratic Coefficient1 Constant 0.768518891 0.694380888 Coefficient2 x 0.231481109 0.305619112 Coefficient3 x2 Minimum Value of x 0.810810811 0.810810811 Maximum Value of x 1.162162162 1.162162162
151
This report is available at no cost from the National Renewable Energy Laboratory (NREL) at www.nrel.gov/publications.
Table 32. Energy Input Ratio Modifier Function of Temperature Curve (x = WB, y = DB)
High Speed Low Speed Curve Type Biquadratic Biquadratic Coefficient1 Constant 0.984651981 1.138853977 Coefficient2 x –0.042854153 –0.045180225 Coefficient3 x2 0.001356227 0.001429841 Coefficient4 y 0.00993408 0.006043717 Coefficient5 y2 0.000639785 0.000674511 Coefficient6 x*y –0.001169011 –0.001232463 Minimum Value of x 9.277777778 9.277777778 Maximum Value of x 26.83333333 26.83333333 Minimum Value of y 15.55555556 15.55555556 Maximum Value of y 44.72222222 44.72222222
Table 33. Energy Input Ratio Modifier Function of Flow Fraction Curve
High Speed Low Speed Curve Type Quadratic Quadratic Coefficient1 Constant 1.191672073 1.254671013 Coefficient2 x –0.191672073 –0.254671013 Coefficient3 x2 Minimum Value of x 0.810810811 0.810810811 Maximum Value of x 1.162162162 1.162162162
Condenser Type: Evaporatively Cooled
High Speed Evaporative Condenser Effectiveness: 0.8 (unless a value is known or suggested by the manufacturer)
High Speed Evaporative Condenser Air Flow Rate: autosize, unless air flow rate is known.
High Speed Evaporative Condenser Pump Rated Power: autosize, unless rated pump power is known.
Low Speed Evaporative Condenser Effectiveness: 0.6 (unless a value is known or suggested by the manufacturer)
Low Speed Evaporative Condenser Air Flow Rate: autosize, unless air flow rate is known.
Low Speed Evaporative Condenser Pump Rated Power: autosize, unless rated pump power is known.
Basin Heater Set Point Temperature: This temperature is not important if the system will be winterized. If it is not winterized, this temperature could be ~35°F.
Modeling of evaporative precooling of the ventilation air is accomplished using the EvaporativeCooler:Indirect:ResearchSpecial object. This object will model precooling of the ventilation air using sump water. It will not accurately model a hybrid system that uses scavenger air.

152
This report is available at no cost from the National Renewable Energy Laboratory (NREL) at www.nrel.gov/publications.
EvaporativeCooler:Indirect:ResearchSpecial Object Cooler Maximum Effectiveness: 0.7 (unless a value is known or suggested by the manufacturer)
Recirculating Water Pump Power Consumption: Use spec sheet for recirculating water pump
Secondary Fan Flow Rate: autosize
Secondary Fan Total Efficiency: 1
Secondary Fan Total Delta Pressure: 0. This causes the fan power to be 0, which is correct for a sump water evaporative precooled system.
Dew point Effectiveness Factor: 0.9
Drift Loss Fraction: 0
Blowdown Concentration Ratio: 3.
Recommended EnergyPlus Outputs To determine the effectiveness or impact of the evaporative precooling and condensing system, a variety of output variables should be considered. First, comparing the energy consumption of the overall HVAC system using summary reports, the evaporative precooling system should show a decrease in cooling end-use energy consumption as compared to the air-cooled. The overall electricity consumption should decrease. The evaporative precooling should reduce the cooling load on the DX evaporator coil and evaporative condensing should increase the overall efficiency of the DX cycle.
To investigate the Coil:Cooling:DX object further, the following outputs should be reported:
• Cooling Coil Total Cooling Rate—total (sensible and latent) cooling rate of the DX evaporator coil.
• Coiling Coil Electric Power—power consumption of the compressor and condenser fans.
• Cooling Coil Condenser Inlet Temperature—temperature of air entering the condenser.
• Cooling Coil Evaporative Condenser Water Volume—water consumption for evaporative precooling of the condenser.
• Coiling Coil Evaporative Condenser Pump Electric Power—power consumption of the water pump.
The listed outputs can also be printed as energy terms (Joules), which is recommended.
High Performance Refrigeration Cases The EnergyPlus object that is used for representing refrigeration display cases is the Refrigeration:Case object. This object models anti-sweat heaters, refrigeration load, evaporator fan motors, and lighting power per length of refrigerated display case. Typically, closed display cases are considered on a per door basis; assume that each door is 2-½ ft long. Higher

153
This report is available at no cost from the National Renewable Energy Laboratory (NREL) at www.nrel.gov/publications.
performing display cases can be modeled by changing the evaporator fan motor power, lighting power, anti-sweat heater control, and cooling capacity (representing the cooling load) to reflect efficiency improvements. Note that the cooling capacity is affected by the case type and will decrease significantly if doors are put on open cases. The object also specifies the percentage of heat from the case’s lights and anti-sweat heaters that add to the display case’s cooling load versus the surrounding space—EnergyPlus assumes 100% of the evaporator fan power is added load to the case.
Recommended EnergyPlus Inputs When modeling high-performance refrigerated display cases in EnergyPlus, the following guidance can be used for each input field. The most important inputs are in bold. For clarification, the “standard” inputs for the case lighting and evaporator fans are to establish the power draw used by the default case arrangement from the manufacturer. These can be lower efficiency equipment such as older generation LEDs or PSC motors. The “operating” inputs are to represent the actual lighting and evaporator fan technologies that are being evaluated by the model. EnergyPlus needs to understand the “standard” power draws to breakdown the case load into internal gains, sensible case credits, and latent case credits. Once it knows the breakdown, EnergyPlus can calculate the actual cooling load of the case for each time step by separately calculating the sensible case credits, latent case credits, and the internal gains, which include the “operating” evaporator fan and lighting power draws in addition to the anti-sweat heaters. In this way, EnergyPlus takes into account the changing cooling load on the case due to varying space conditions (temperature and dew point) as well as the type of equipment used (lighting, evaporator fans and anti-sweat heaters).
Refrigeration:Case Object Rated Ambient Temperature: 75°F
Rated Ambient Relative Humidity: 55%
Rated Total Cooling Capacity per Unit Length: If cooling capacity is unknown, see Table 34 for typical cooling capacity per unit length of refrigerated display case. This input would be adjusted if door retrofits were completed on open cases; typical reduction in cooling capacity is approximately 50%–80% (Navigant Consulting 2013). EnergyPlus also created an idf file with typical refrigerated display cases from various manufacturers located in the DataSets folder titled RefrigerationCasesDataSet.idf. If case type is known, use this reference file for recommended Rated Total Cooling Capacity, Rated Latent Heat Ratio and Rated Runtime Fraction inputs. These are merely recommended best practice values because manufacturers do not provide this information.
Table 34. Typical Cooling Capacity Based on Case Configuration
LT Multishelf Door LT Open Island MT Multishelf Door Produce MT Multishelf Open
130 W/ft 200 W/ft 70 W/ft 300 W/ft 444 Btu/h/ft 683 Btu/h/ft 239 Btu/h/ft 1,024 Btu/h/ft
Source: Zero Zone specification guides and data from Lackland AFB DeCA and Walmart (CBP projects)

154
This report is available at no cost from the National Renewable Energy Laboratory (NREL) at www.nrel.gov/publications.
Rated Latent Heat Ratio: 0.1 for closed cases; 0.3 for open cases
Rated Runtime Fraction46: 0.85
Latent Case Credit Curve Type: DewPointMethod
Latent Case Credit Curve Name: See Howell (1993) for coefficient input for the DewPointMethod. Equation looks like this:
𝐿𝐼𝐼𝑊𝐼𝐼𝐿𝐼𝐼𝐼𝐼 = 𝐼 + 𝑏 ∙ 𝑇𝑑𝑑,𝑙𝑙𝑙 + 𝑐 ∙ 𝑇𝑑𝑑,𝑙𝑙𝑙2 + 𝑊 ∙ 𝑇𝑑𝑑,𝑙𝑙𝑙
3 Standard Case Fan Power per Unit Length: Unless otherwise specified by the manufacturer, fan power per length should be the same as operating case fan power per unit length input. The fan power per length of the default fan technology is provided by the case manufacturer. This default is typically a lower efficiency technology.
Installed (Operating) Case Fan Power per Unit Length: See Table 35for typical inputs depending on motor type. If the model accesses more efficient equipment such as ECMs, the standard and operating case fan power per unit length is different. The manufacturer cut sheets fan power per unit length may be different from those in Table 35.
Table 35. Operating Fan Power per Unit Length Inputs
SP PSC EC LT case 35 W/ft 12.8 W/ft 8.0 W/ft MT case 21 W/ft 7.6 W/ft 4.8 W/ft
Source: Zero zone specification guide and data from Lackland AFB DeCA; (Navigant 2013); (Friedrich 2011) Standard Case Lighting Power per Unit Length: Unless otherwise specified by manufacturer, lighting power per length should be same as installed case lighting power per unit length input.
Installed (Operating) Case Lighting Power per Unit Length: See Table 36 for typical values that adjust the lighting power based on the number of lighting rows in the case. Open display cases typically have two rows of lights. The closed display case equation assumes 5 ft of vertical light on either side of a 2-½-ft wide door in a closed display case.
Table 36. Installed Case Lighting Power per Unit Length Inputs
Baseline (W/ft) Proposed (W/ft) LT case (closed with doors) 93.5(𝐷 + 1) 𝐿⁄ 38.5(𝐷 + 1) 𝐿⁄ LT case (open) 1 row of light 18.7 7.7 LT case (open) n rows of light 18.7𝑁 7.7𝑁 MT case (closed with doors) 76(𝐷 + 1) 𝐿⁄ 38(𝐷 + 1)/𝐿 MT case (open) 1 row of light 15.2 7.6 MT case (open) n rows of light 15.2𝑁 7.6𝑁
Key: N = Rows of Lights; D = Number of Doors; L = Total Length of Display Case Source: Illinois TRM
46 Rated runtime fraction—The ratio of the refrigerated case steady state, operating cooling load at ANSI/AHRI Standard 1200-2010 rated conditions to the rated cooling load. The steady state, operating cooling load excludes the additional capacity manufacturers design into cases to quickly bring down product temperature during stocking or recover from defrost. Case manufacturers do not provide this information and therefore needs to be assumed based on engineering judgment. The rated runtime fraction for refrigerated cases typically ranges from 0.8 to 0.9.

155
This report is available at no cost from the National Renewable Energy Laboratory (NREL) at www.nrel.gov/publications.
Case Lighting Schedule Name: Typically, schedule will show all lights on (=1) during hours of operation and off (=0) when the store is closed. Unless occupancy sensors are installed, all the lights should be on full power during occupied times. This must be scheduled accurately, because the energy savings of LED fixtures increase with increased lighting runtime.
Fraction of Lighting Energy to Case: Recommend to use 1 for closed cases, meaning that 100% of the lighting power is added cooling load; 0.9 for open cases meaning that 10% of the lighting power is not added cooling load on the case and is added heat to the surrounding space.
Case Anti-Sweat Heater Power per Unit Length: If anti-sweat heater power is unknown, see Table 38 for typical values. If door width is unknown, assume 2-½ ft. This anti-sweat heat is assumed for the glass doors and the frame heat.
Table 37. Typical Freezer and Cooler Anti-Sweat Heater Power per Door (Including Frame Heat)
Freezer Cooler Standard Low Energy Standard Low/No Energy
128 W/door 80 W/door 22 W/door 0 W/door Source: Zero zone spec guide and data from Lackland AFB DeCA Minimum Anti-Sweat Heater Power per Unit Length: 0
Anti-Sweat Heater Control Type: Constant method (for baseline) meaning that the anti-sweat does not modulate based on the space conditions; DewpointMethod is used to modulate the anti-sweat power based on the space’s dew point.
Fraction of Anti-Sweat Heater Energy To Case: 1, meaning that 100% of the anti-sweat heat is added cooling load to the case.
Case Credit Fraction Schedule Name: This schedule is used to model night curtains and door case retrofits. (See Table 39 for typical values throughout hours of operation.) The rated capacity of the doored cases already includes the effects of door openings, so if a door retrofit is modeled, adjust this schedule and cooling Rated Total Cooling Capacity per Unit Length. The reduction in Rated Total Cooling Capacity per Unit Length should result in most of the savings for the door retrofit measure. For night curtains, just adjust this schedule.
Table 38. Typical Case Credit Fraction Values for Open and Closed Cases
Operating Times Open Cases Open Cases With Night Curtains Closed Cases
During hours of operation 1.0 1.0 1.0 Store closed 1.0 0.6 0.8
Case Defrost Type: for MT cases this will be OffCycle. LT and IC cases will be Electric.
Case Defrost Schedule Name
Case Defrost Drip-Down Schedule Name
156
This report is available at no cost from the National Renewable Energy Laboratory (NREL) at www.nrel.gov/publications.
Defrost Energy Correction Curve Type: typically a quadratic polynomial curve is sufficient.
Defrost Energy Correction Curve Name
Other EnergyPlus inputs for this object include: Name, Availability Schedule Name, Zone Name, Case Length, Case Operating Temperature, Case Defrost Power Per Unit Length, Under Case HVAC Return Air Fraction, Refrigerated Case Restocking Schedule Name, Design Evaporator Temperature or Bring Inlet Temperature, Average Refrigerant Charge Inventory.
Recommended EnergyPlus Outputs The energy impacts of refrigerated display cases should be checked via the refrigeration energy end-use subcategory. As EEMs are implemented, the modeler should check the impact on this modeled end-use. To verify the system operation in more detail, the following outputs should be reported—recommend hourly—and checked:
• Evaporator total cooling rate
• Zone sensible cooling rate
• Evaporator fan electric power
• Lighting electric power
• Anti-sweat electric energy.
Ensure the loads and energy consumption are reasonable. In a high-performance refrigerated display case proposed model, the fan power, anti-sweat energy, and lighting power should decrease. The total cooling rate should also decrease for a high-performance case.