Prove System Solution - systems.hitchins.net
17
10/20/07 dkh©2004 1 Prove System Solution Derek Hitchins
Transcript of Prove System Solution - systems.hitchins.net

10/20/07 dkh©2004 1
Prove SystemSolution
Derek Hitchins

10/20/07 dkh©2004 2
Design Ratcheting• Far left shows cumulative selection of
e.g., Blue fighter design, using enemy(Red) fighter threat as a dynamicreference
• When Blue fighter design has reachoptimum, Blue fighter becomes seedfor Red fighter cumulative selection
• Process can occur over several stages,with each design leapfrogging itspredecessor
• Obvious dangers of creating non-feasible designs can be anticipated– Insert physical/technological limits into
offspring generation processes
OffspringFighter
Generation
OffspringFighter
Generation
Offspring
fightergeneration
"Seed"fighter
Many-on-manycombat
simulation
Selected
fighter
Enemy
threat
Stable?
Current fighter
Stable?
Selected
enemythreat
Many-on-many
combatsimulation
"Seed"threat
OffspringFighter
Generation
Offspring
FighterGeneration
Offspring
threatgeneration

10/20/07 dkh©2004 3
Using Non-linear Dynamic Simulation• It is possible to update the basic systems engineering
paradigm– To create hundreds, or even thousands of options covering
different:—• vehicle arrangements: how many, what functions…• operational parameters… power, capacity, sensitivity, range,
frequency, etc., etc.…• Support & logistics…• …weapons performance, etc., etc.,
– To search through the resulting massive n-dimensionalsolution space efficiently and…
– To find the optimum (e.g. most cost effective) solution ofall the possible configurations
– To “prove” your solution is the right one.

10/20/07 dkh©2004 4
Using Non-linear Dynamic Simulation• The key is to use genetic algorithmic methods• Establish pseudo-genes to code for parameters in
solution system– i.e., re-create the system solution from a set of genes,
• e.g., Gene A codes for “radar transmitter power”– Gene A can take on a range of values that express as a range of
transmitter powers
• e.g., Gene B codes for “number of weapons type X”– Gene B can take on a range of values corresponding to the
number of X missiles carried, with an upper limit set by capacity
• In each case, as the genes code for more or less, there is aconsequent cost assessment
– E.g., more missiles carried = more cost– E.g. greater missile Ph = less missile firings…

10/20/07 dkh©2004 5
Using Non-linear Dynamic Simulation• Design search starts by randomly generating a set of
gene values• These vary the initial parameters in the Blue Model• These values determine a putative system design
– number of vehicles, weapons, ranges, missile Ph, etc.• This system design solution is sent into combat
against an unaltered, but still dynamic and interactive,Red force.
• The outcome of the conflict is recorded as e.g., thevarious forms of effectiveness provided by thatparticular set of genes
10/20/07 dkh©2004 6
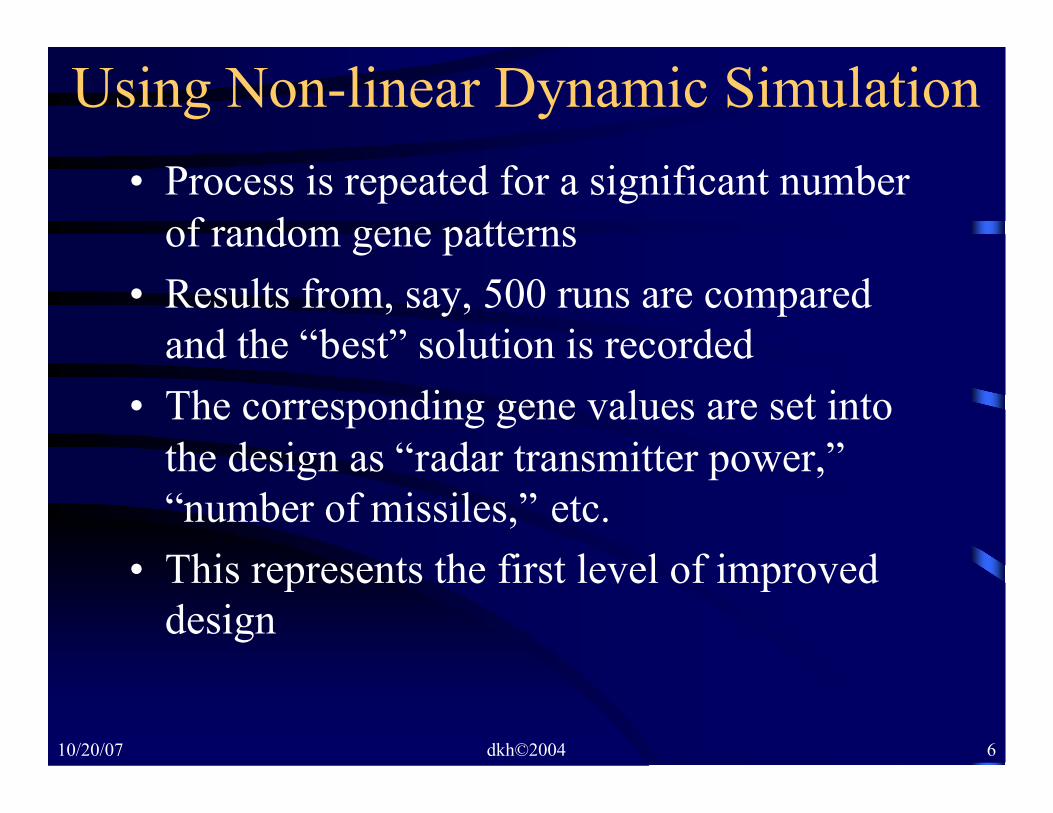
Using Non-linear Dynamic Simulation• Process is repeated for a significant number
of random gene patterns• Results from, say, 500 runs are compared
and the “best” solution is recorded• The corresponding gene values are set into
the design as “radar transmitter power,”“number of missiles,” etc.
• This represents the first level of improveddesign
10/20/07 dkh©2004 7
Using Non-linear Dynamic Simulation
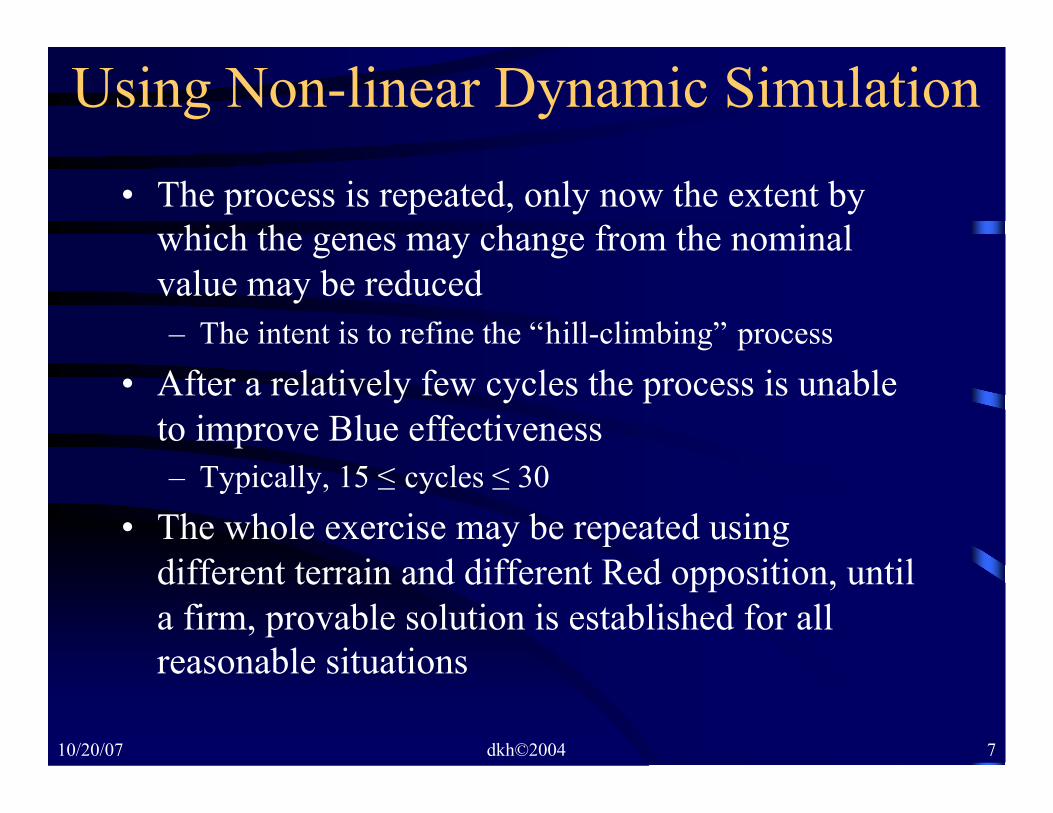
• The process is repeated, only now the extent bywhich the genes may change from the nominalvalue may be reduced– The intent is to refine the “hill-climbing” process
• After a relatively few cycles the process is unableto improve Blue effectiveness– Typically, 15 ≤ cycles ≤ 30
• The whole exercise may be repeated usingdifferent terrain and different Red opposition, untila firm, provable solution is established for allreasonable situations
10/20/07 dkh©2004 8
Dynamic Reference
Genes
Genes
Genes
Genes
Genes
RandomPattern
GeneratorOperationalOperationalEffectivenessEffectivenessMeasurementMeasurement
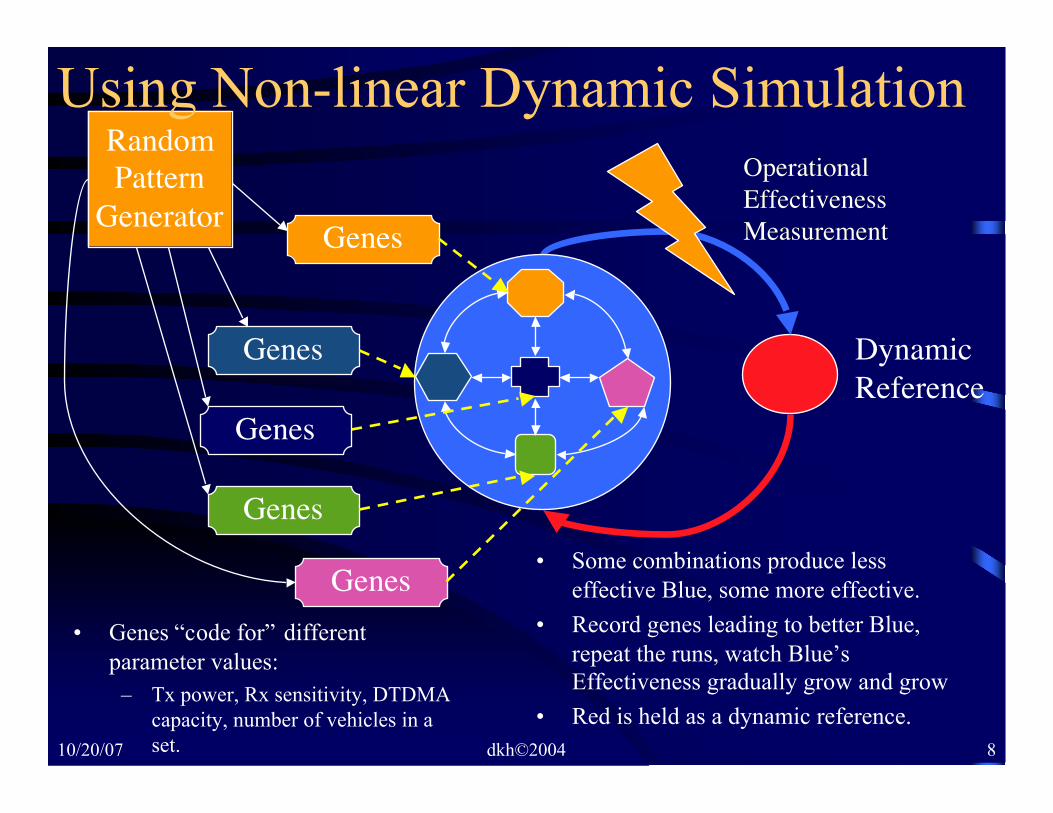
• Genes “code for” differentparameter values:
– Tx power, Rx sensitivity, DTDMAcapacity, number of vehicles in aset.
• Some combinations produce lesseffective Blue, some more effective.
• Record genes leading to better Blue,repeat the runs, watch Blue’sEffectiveness gradually grow and grow
• Red is held as a dynamic reference.
Using Non-linear Dynamic Simulation

10/20/07 dkh©2004 9
Typical Non-Linear Dynamic Simulation
• Following program employs STELLA™– Could use any non-linear dynamic tool
• Such programs look at function andbehaviour, but…
• …lack spatial dimension• Full solution requires bespoke tool with
terrain cover, line-of-sight, obstacles, tracks,etc.
OptimizeOptimizeLF2020LF2020
10/20/07 dkh©2004 10
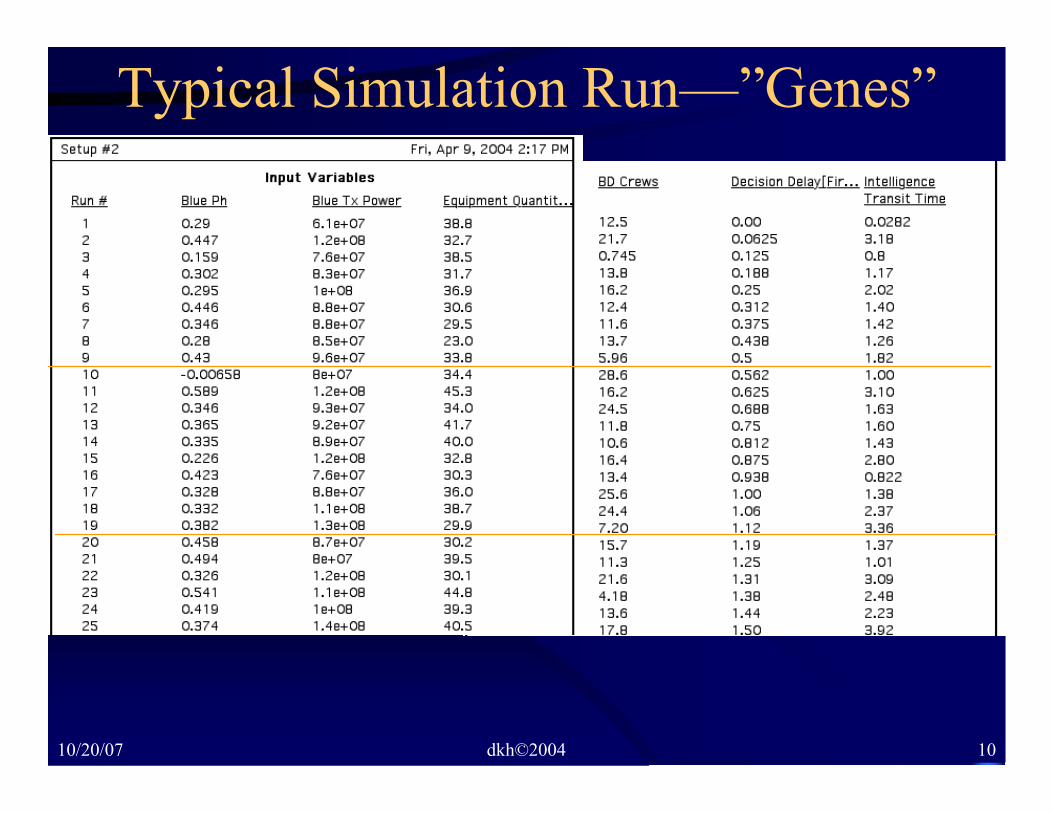
Typical Simulation Run—”Genes”
10/20/07 dkh©2004 11
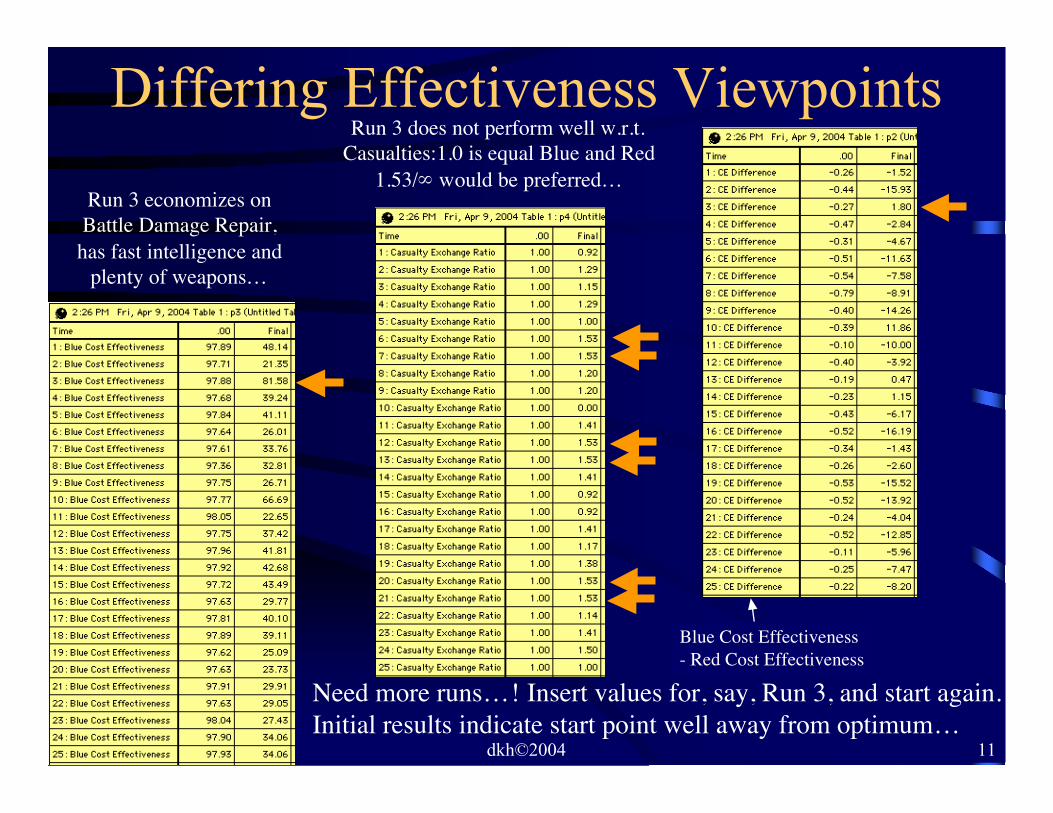
Differing Effectiveness Viewpoints
Run 3 economizes onBattle Damage Repair,has fast intelligence and
plenty of weapons…
Run 3 does not perform well w.r.t.Casualties:1.0 is equal Blue and Red
1.53/∞ would be preferred…
Blue Cost Effectiveness- Red Cost Effectiveness
Need more runs…! Insert values for, say, Run 3, and start again.Initial results indicate start point well away from optimum…
10/20/07 dkh©2004 12
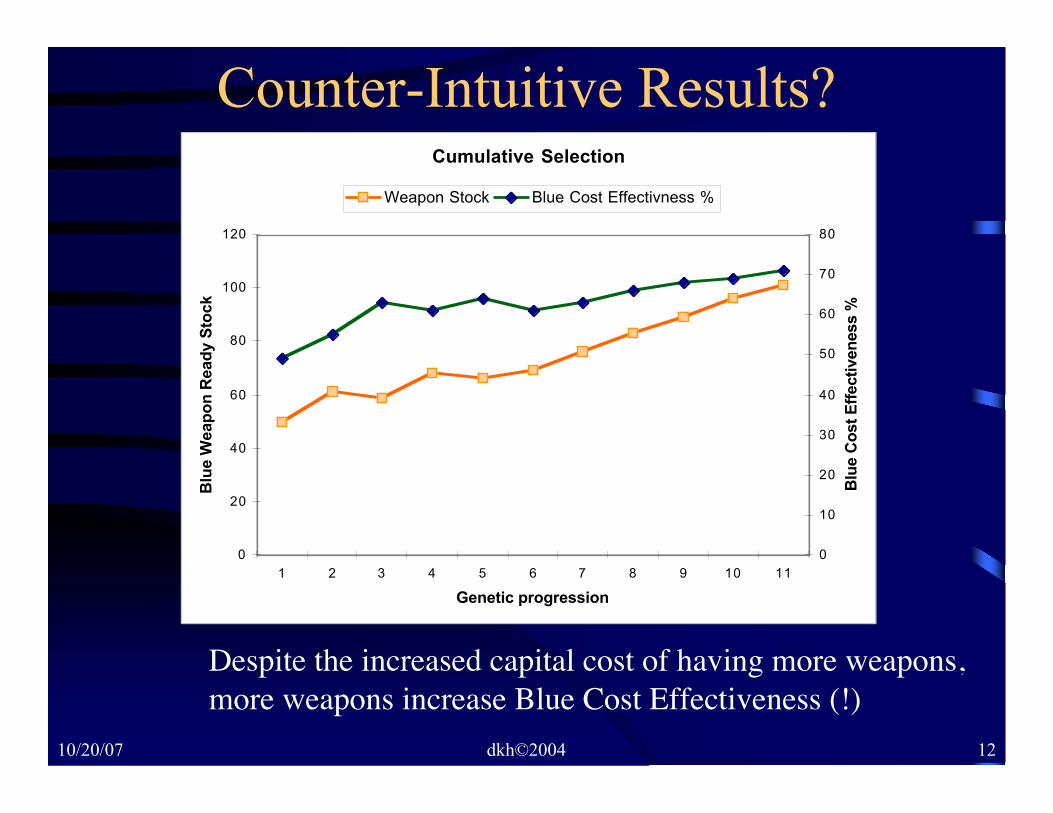
Counter-Intuitive Results?Cumulative Selection
0
20
40
60
80
100
120
1 2 3 4 5 6 7 8 9 10 11
Genetic progression
Blu
e W
eap
on
Read
y S
tock
0
10
20
30
40
50
60
70
80
Blu
e C
ost
Eff
ecti
ven
ess %
Weapon Stock Blue Cost Effectivness %
Despite the increased capital cost of having more weapons,more weapons increase Blue Cost Effectiveness (!)
10/20/07 dkh©2004 13
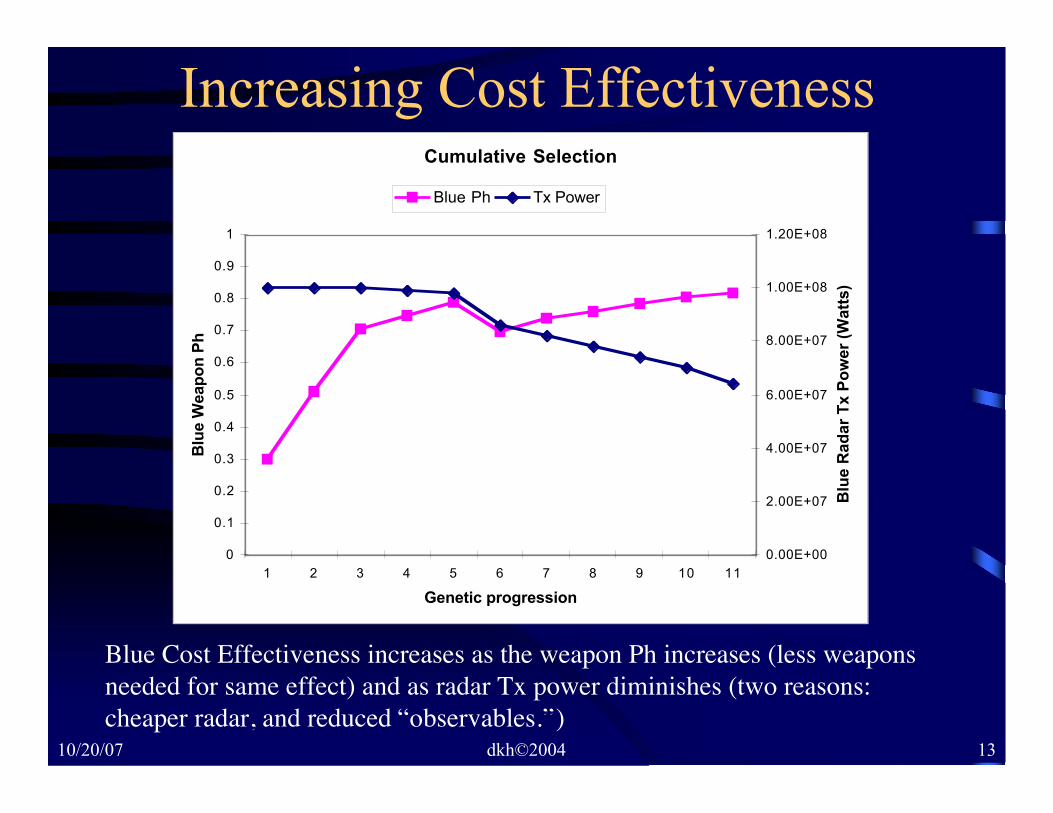
Increasing Cost EffectivenessCumulative Selection
0
0.1
0.2
0.3
0.4
0.5
0.6
0.7
0.8
0.9
1
1 2 3 4 5 6 7 8 9 10 11
Genetic progression
Blu
e W
eap
on
Ph
0.00E+00
2.00E+07
4.00E+07
6.00E+07
8.00E+07
1.00E+08
1.20E+08
Blu
e R
ad
ar
Tx P
ow
er
(Watt
s)
Blue Ph Tx Power
Blue Cost Effectiveness increases as the weapon Ph increases (less weaponsneeded for same effect) and as radar Tx power diminishes (two reasons:cheaper radar, and reduced “observables.”)

10/20/07 dkh©2004 14
Non-linear Dynamic Simulation• Result is a matched set of optimal
parameters—specifications— for Blue, in thesituation represented by the simulation– Great advance on conventional methods
• Matched specs show each subsystem– making best contribution to overall Mission Effectiveness -
however measured– While operating and interacting with other systems under
operational conditions, i.e. organismic synthesis!
• Solution system parameters contribute to optimumsolution
– not too little, not over the top, but…– just right for successful operations
• Determines optimal support, maintenance, logistics, too
10/20/07 dkh©2004 15
Proving You Have Done It…• Had we been able to create a variety of terrains…• …and given that the simulations were reasonable, then…• We would have established
– a systems solution,– a system design to the first level,– a set of research targets– a matched set of specifications for subsystems, and– a test bed upon which the incredulous—and future
contractors—could explore, challenge, and possibly improve,our conclusions
• …and everything can be tracked back to the initialarticle, the TRIAD, and so on…it works!
10/20/07 dkh©2004 16
Applicability of Method• Method used with great success in a variety
of walks of life• Essentially, nothing about the method that is
context or technology dependent• Used for Famine Relief, Reconstruction of
Afghanistan, Global socio-economicforecasting, and many, many more…
Afghanistan Peace OperationsAfghanistan Peace Operations
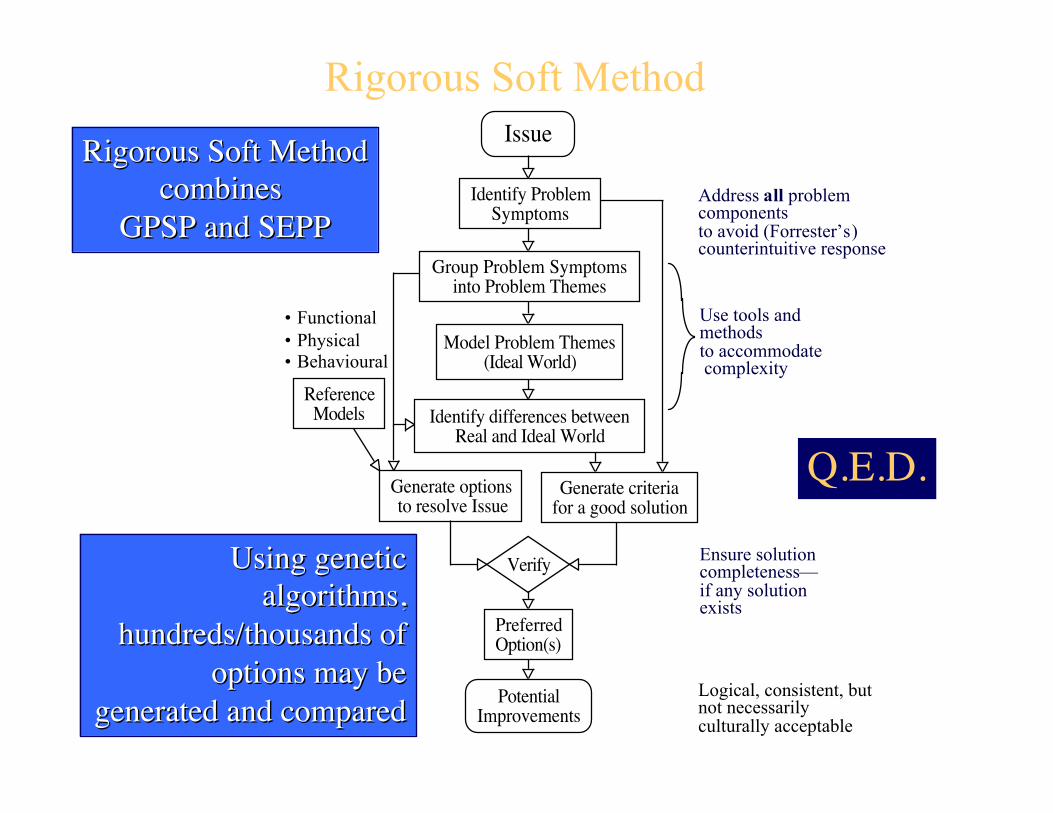
Rigorous Soft MethodIssue
Identify differences betweenReal and Ideal World
Verify
PotentialImprovements
Identify ProblemSymptoms
Group Problem Symptomsinto Problem Themes
Model Problem Themes(Ideal World)
Generate options to resolve Issue
Generate criteriafor a good solution
PreferredOption(s)
ReferenceModels
Address all problemcomponentsto avoid (Forrester’s)counterintuitive response
Use tools and methodsto accommodate complexity
Ensure solutioncompleteness—if any solutionexists
Logical, consistent, butnot necessarilyculturally acceptable
• Functional• Physical• Behavioural
Rigorous Soft MethodRigorous Soft Methodcombines combines
GPSP and SEPPGPSP and SEPP
Using geneticUsing geneticalgorithms,algorithms,
hundreds/thousands ofhundreds/thousands ofoptions may beoptions may be
generated and comparedgenerated and compared
Q.E.D.