Prototyping Review for Exam1 Group work on project › ~tongy › csce572 › lectures ›...
65
Today’s Agenda • Prototyping • Review for Exam1 • Group work on project
Transcript of Prototyping Review for Exam1 Group work on project › ~tongy › csce572 › lectures ›...

Today’s Agenda
• Prototyping
• Review for Exam1
• Group work on project

PrototypingRapid prototyping, sketches, storyboards, mock-ups, etc
(adopted partially from Dr. Bruce Walker)

Important Resource
Glossary
http://www.usabilityfirst.com/glossary/
NN/g Nielsen Norman Group
• https://www.nngroup.com/

Getting started

The dilemma
and expensive!

Prototyping dimensions

Prototyping dimensions
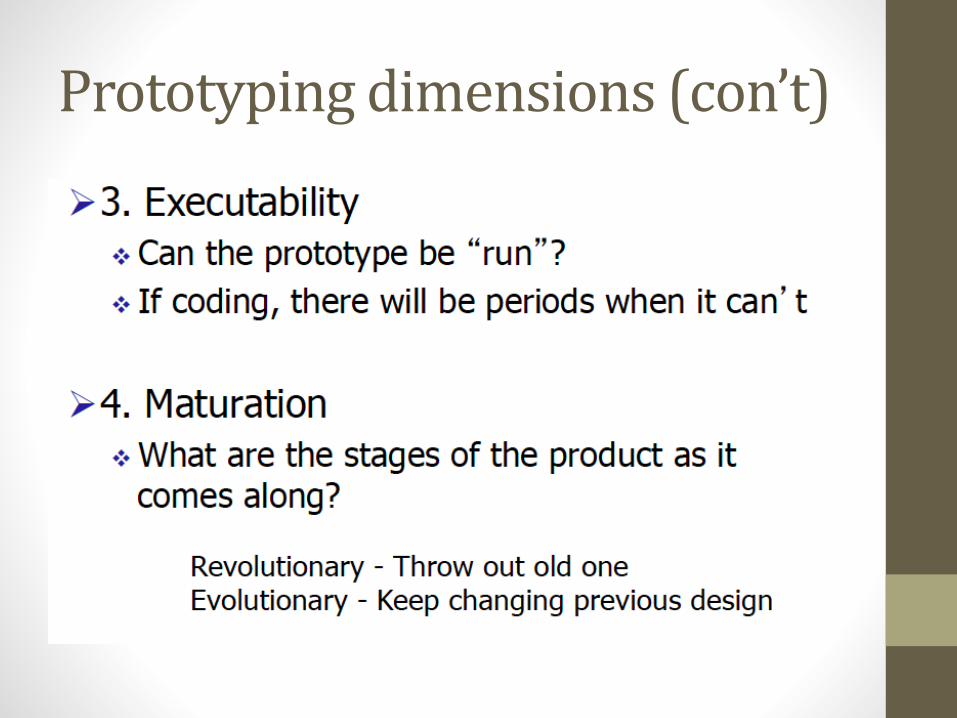
Prototyping dimensions (con’t)
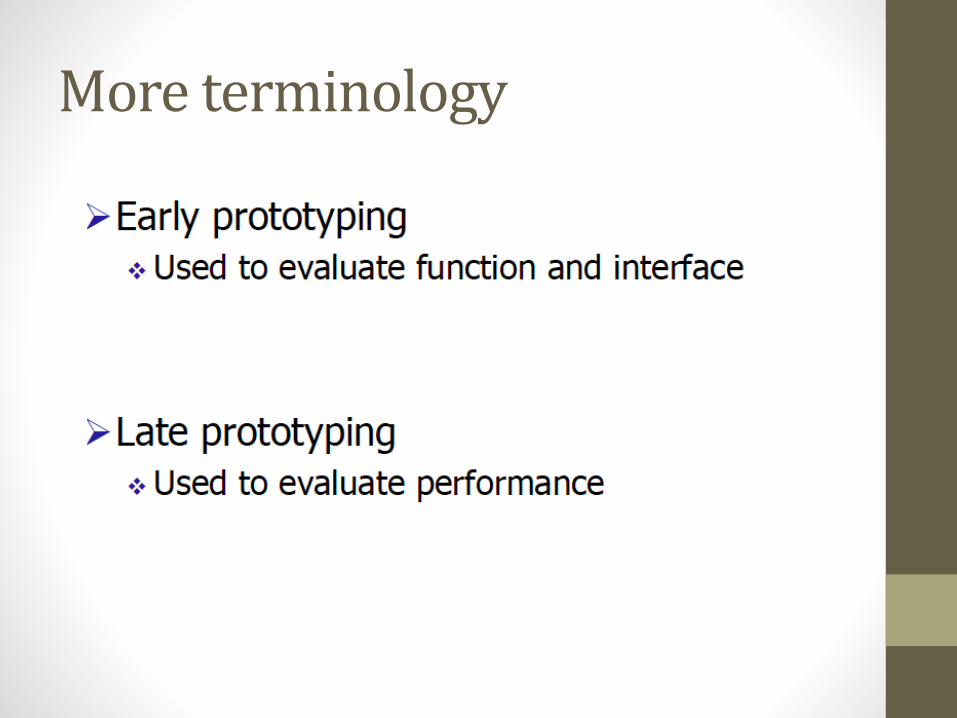
More terminology

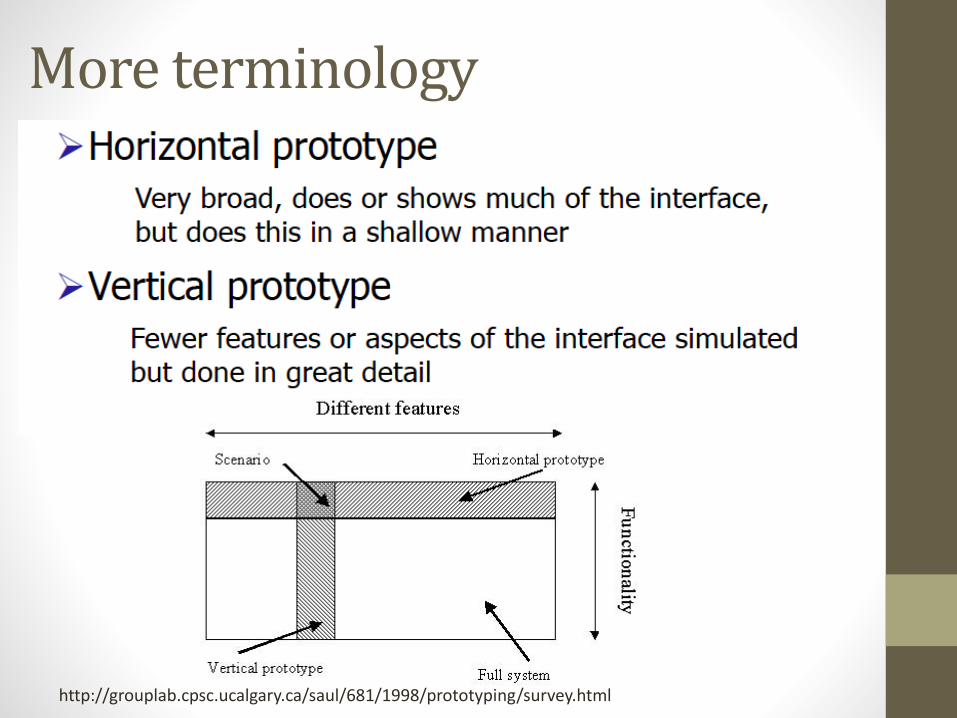
More terminology
How is the prototype close to the final product in terms of • Interactivity• Visuals• Content and commandsby Kara Pernice

More terminology
• Low-fidelity prototype• Paper-based sketches without user interactions
• Focus on functionality
• Less focus on aesthetics
• Early visualization of design alternatives
• Quick to create and easy to change
• High-fidelity prototype• Computer-based with user interactions
• Close to true representation
• More effective to collect performance data
More terminology
http://grouplab.cpsc.ucalgary.ca/saul/681/1998/prototyping/survey.html

Prototyping

PROTOTYPE EXAMPLES/TYPES
I am about to show you many examples….I expect your group to go through multiple rounds of prototype development
1. Start with drawings / sketches
2. Revise, revise, revise
3. Work up to functional website/app prototypes
4. Test
5. Revise
6. etc

1. Flow Chart Prototype

Example of Flow Chart Prototype

2. Wireframes: Screen
“a wireframe is a visual illustration of a web page… to show you where each item should be placed on a page.” Usability.gov

3. Sketches and Mock-Ups

Sketches and Mock-Ups
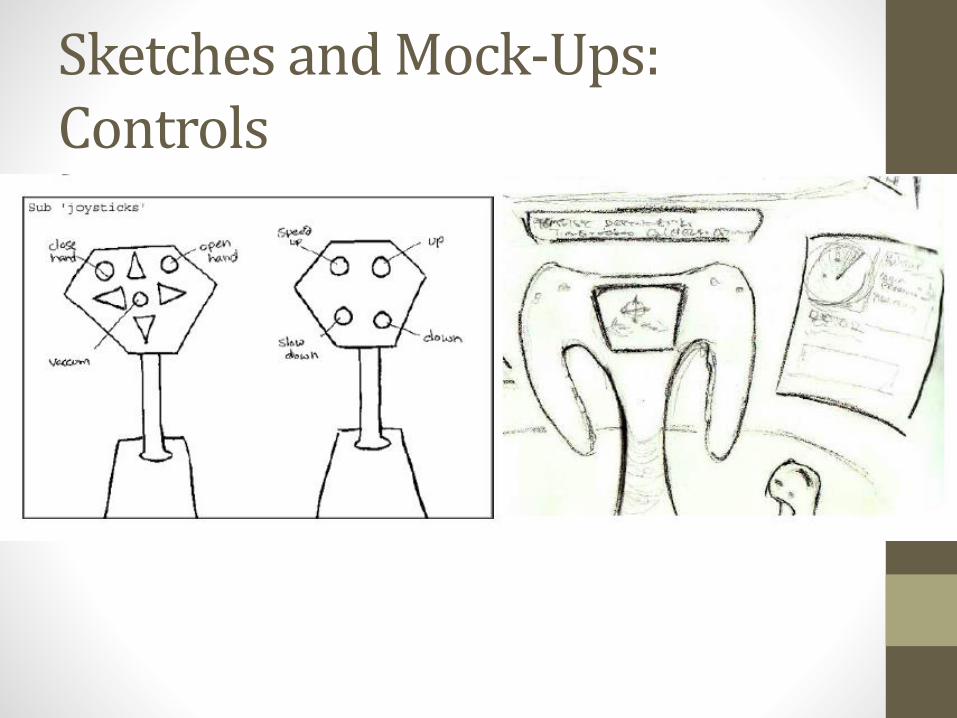
Sketches and Mock-Ups: Controls

Sketches and Mock-Ups: Displays

Physical Mock-Up

Showing users sketches & mock-ups…
• What is benefit of using a not-so-pretty sketch with users?
• Danger in using professional art or design tools?
• Users may over focus on aesthetics, which you don’t care about just yet
• If it is obvious it is a prototype, then user will focus on functionality or “imagine” what final product will do

4. Storyboarding

Storyboard
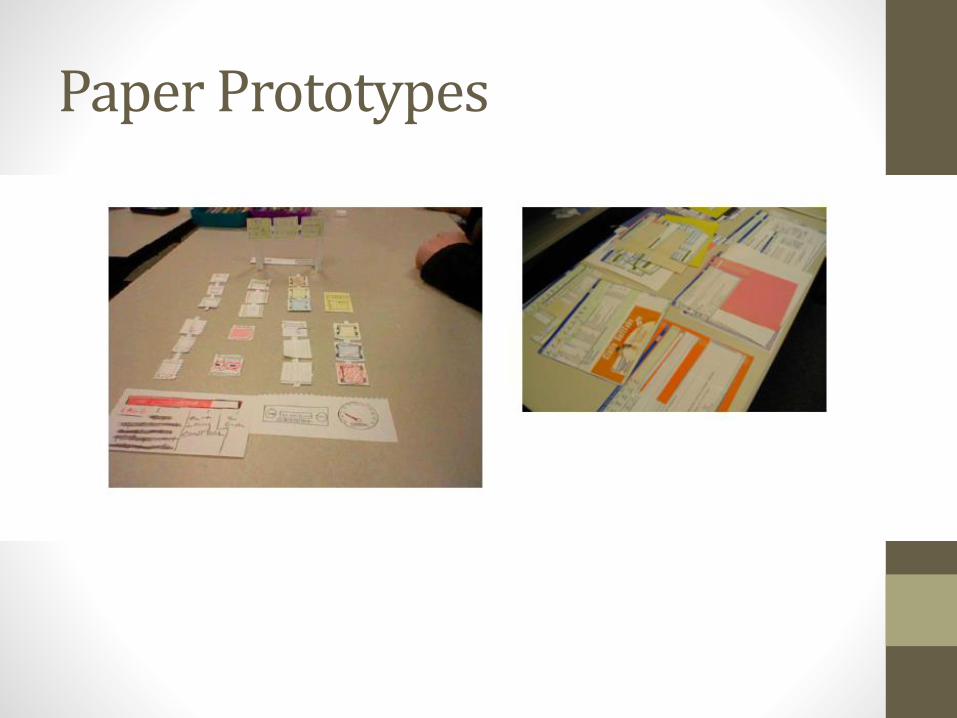
Paper Prototypes
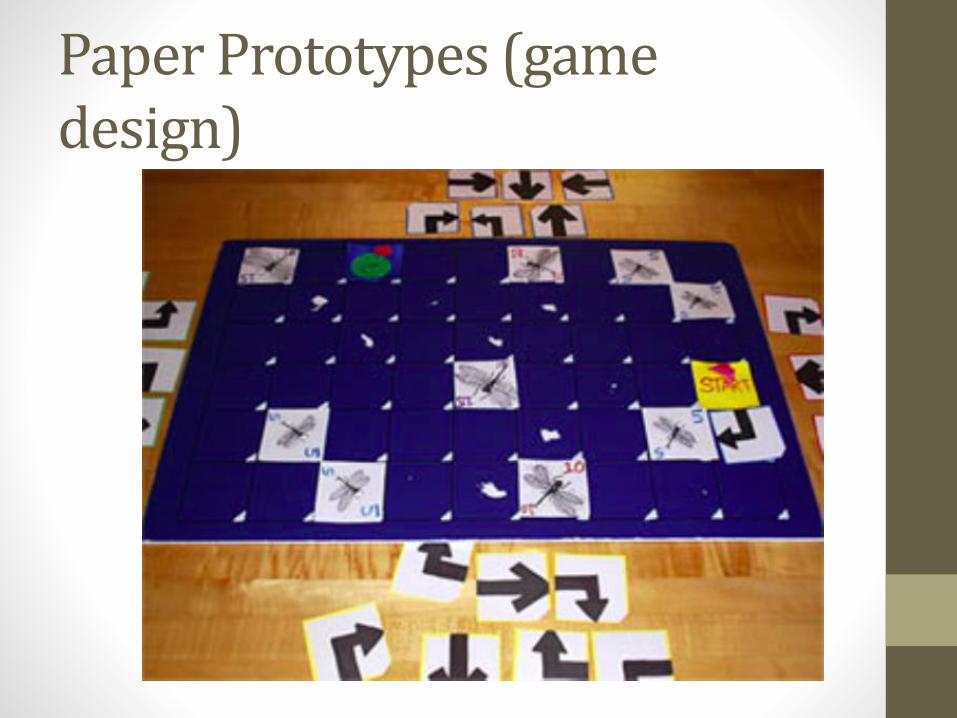
Paper Prototypes (game design)

Paper Prototypes (game design)

Announcement
Exam 1 is scheduled
Monday, September 30, in class
Cover materials until Sep. 25
Most of materials from class lecture notes
You are allowed to bring a single-sided letter-size cheat sheet

Exam 1
Questions in Exam 1 including
• Fill-in-the-blank
• True/false
• Multiple-choice
• Case study
Graduate students will have a different exam.
Make sure you ask for the correct version

What is HCI?• HCI “concerned with the design, evaluation, and
implementation of interactive computing systems for human use".”
• Interaction Design focuses on designing interactive products to support the way people communicate and interact in their everyday and working lives
What is Interactive Design?
Which one is a broader concept?
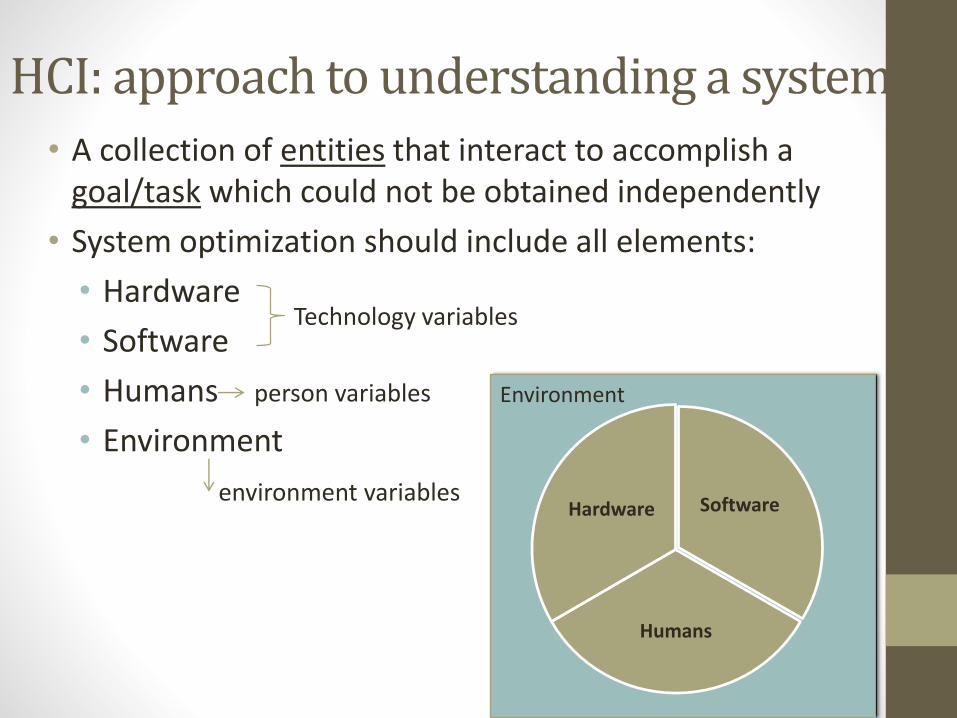
HCI: approach to understanding a system
• A collection of entities that interact to accomplish a goal/task which could not be obtained independently
• System optimization should include all elements:
• Hardware
• Software
• Humans
• Environment
Software
Humans
Hardware
Environment
Technology variables
person variables
environment variables

Goals of HCI – Usability Goals
Usability refers to ensuring that interactive products are:
1. Easy to use (effectiveness)
2. Efficient to use (efficiency)
3. Safe to use (safety)
4. Having good utility (utility)
5. Easy to learn (learnability)
6. Easy to remember how to use (memorability)

Goals of HCI – UX Goals (Table 1.1 ID)
UX goals cover a range of emotions and felt experience
• Desirable aspects
• Satisfying, enjoyable, exciting,
• Helpful, engaging, …
• Undesirable aspects
• Boring, frustrating, unpleasant, …
Most of them are subjective

Fundamental Beliefs
• Things are built to serve people
• Individual differences exist
• For whom do you design?
• Can’t accommodate everyone
• Design influences behavior and well being
• Empirical data will provide the answers

What HCI is Not
• Not just applying checklists and guidelines
• Not using oneself as the model for designing things
• Not just common sense
Interactive Design Process
Four basic activities:
• Establish requirements
• Design alternatives
• Make prototype
• Evaluate
The design process is executed iteratively

Six Design Principles (ID Ch. 1)
1. Visibility – Can I see it?
2. Feedback – What is it doing now?
3. Affordance – How do I use it?
4. Mapping – What is the relationship between things?
5. Constraint – Why can’t I do that?
6. Consistency – I think I have seen this before?

Human Abilities – Auditory System
Sound - A wave of pressure created when an object vibrates
Physical Perceptualamplitude loudness
frequency pitch
waveform complexity timbre
physical location apparent location

Auditory alarms - Designing good alarms
1. Not above danger level for hearing (85-90 dB)
2. Not startle (rise time)
3. Not disrupt understanding of other signals
4. Should be informative (E.g., earcons, voice/speech)
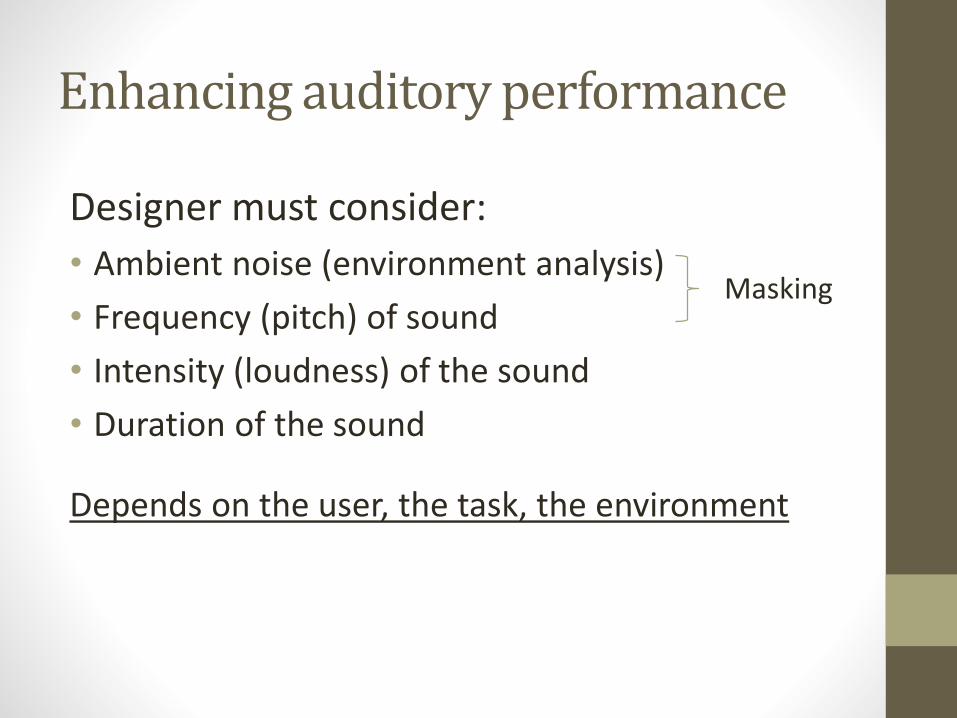
Enhancing auditory performance
Designer must consider:
• Ambient noise (environment analysis)
• Frequency (pitch) of sound
• Intensity (loudness) of the sound
• Duration of the sound
Depends on the user, the task, the environment
Masking

Human Abilities - Vision
Photoreceptors:
• 6.5 M Cones (color vision)
• Mostly at Fovea
• Fewer blue cones at Fovea, mostly red/green
• 100 M Rods (night vision)
• Spread throughout retina
Brightness adaptation
Brightness discrimination

Object Perception
How do we perceive separate features, objects, scenes, etc. in the environment?
• “Bottom up processing”
• Data-driven
• Sensation reaches brain, and then brain makes sense of it
• “Top down processing”
• Cognitive functions inform our sensation
• E.g., walking to refrigerator in middle of night
Features
Groups ofFeatures
Objects
Scenes
Bottom-up
Top-down

Illusory Contours
Perception of an edge where no edge is explicitly present in the stimulus. The perception of the
edge is due to the relations among the features.
Clearly there is more to object perception than just the stimulus features alone.

Figure & Ground Perception
When looking at a visual scene, we tend to see coherent shapes (figures) that are in front of a background area (ground). The figure will be perceived as separate from its
ground.
Factors that Effect Figure-Ground Perception1. Size of Features
2. Symmetry
3. Vertical & Horizontal Layouts
4. Meaningfulness
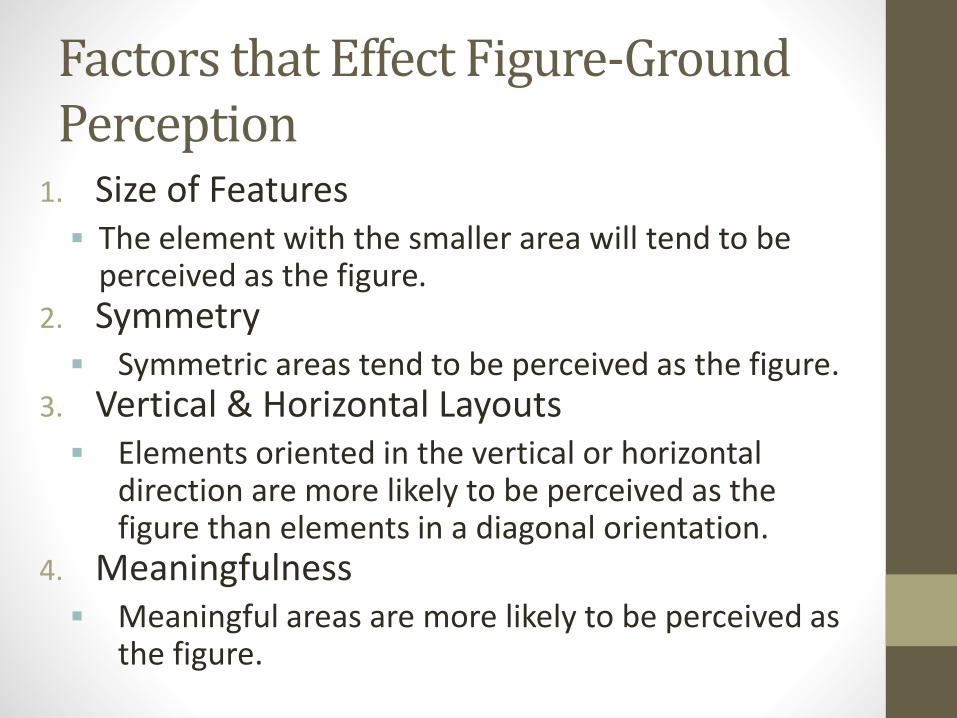
Factors that Effect Figure-Ground Perception
1. Size of Features The element with the smaller area will tend to be
perceived as the figure.2. Symmetry Symmetric areas tend to be perceived as the figure.
3. Vertical & Horizontal Layouts Elements oriented in the vertical or horizontal
direction are more likely to be perceived as the figure than elements in a diagonal orientation.
4. Meaningfulness Meaningful areas are more likely to be perceived as
the figure.

Visual search
• Search time = N x I2
• N = number of items
• I = how much time you spend on each item
• Serial vs. parallel search

Some visual guidelines
1. Large font is good, so is contrast
2. Don’t use too many graphics
• distracting and bad for screen readers
3. Something is important?
• make it “pop” (bottom up processing) to reduce visual search
4. Simple text – easier to read and understand
5. “Color match” when you can (consistency)

Some visual guidelines
6. Never blur pictures
• bad for low vision
7. Blue is hard to read
• less blue cones in fovea
8. Group similar items
9. Use logical visual order – helps with read flow
10. Think about foreground and ground

CognitionNorman’s two general modes: (ID 3.2)
• Experiential cognition
• effortless
• Perceive, act, and react
• Requires a certain level of expertise and engagement
• E.g., driving, reading, conversation
• Reflective cognition and slow thinking
• Mental effort
• Involving attention, judgement, decision making
• New ideas and creativity, e.g., designing, learning, and
writing a paper/book

Human Information Processing -
Attention
• Mental effort
• Selecting sensory channels for further processing
Wickens Model of
Human Information
Processing
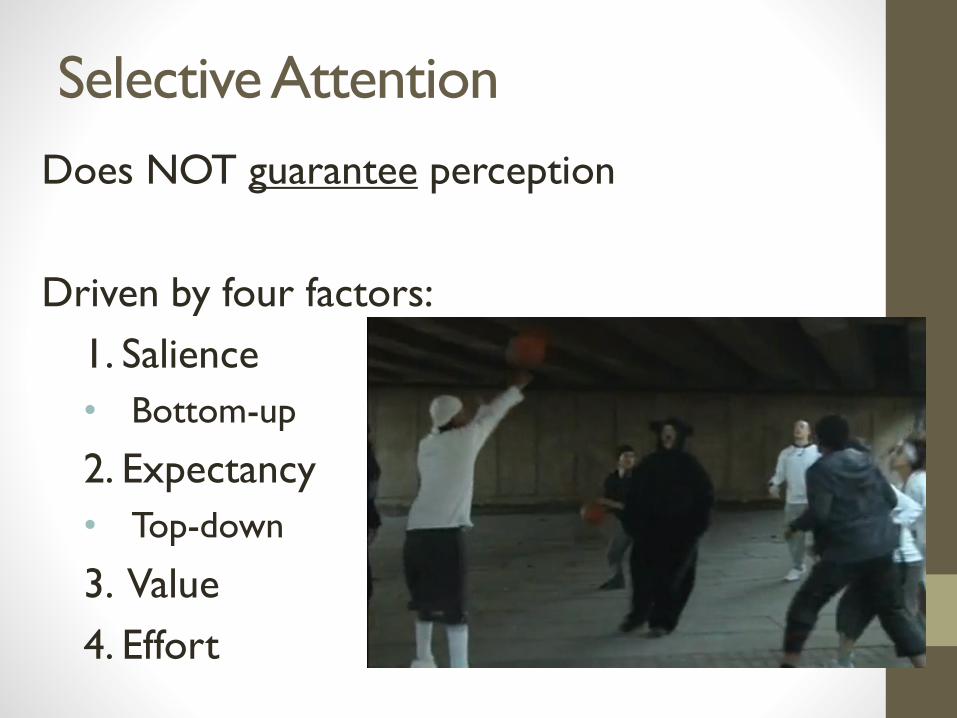
Selective Attention
Does NOT guarantee perception
Driven by four factors:
1. Salience
• Bottom-up
2. Expectancy
• Top-down
3. Value
4. Effort

Design Guidelines - Attention
• Make information salient
• Use techniques like animation, color, underline, ordering, sequencing, and spacing of items to achieve attention
• Avoid cluttering the interface with too much information
• Search engines and forms should use simple and clean interfaces

Human Information Processing -Memory
Working Memory (WM)
• “Think about” or manipulate information
• Temporary storage
Long-term Memory (LTM)
Wickens Model of
Human Information
Processing

Social Security #123 45 678
Working Memory Limitations
Limited capacity: 72 items, 15-20seconds
Chunking is based on
• Familiarity with links between items
• Past experience (LTM)
• Advantageous because
•Increases the amount of information stored in WM
•Aids retention by making use of LTM associations
•Easier to rehearse (and transfer to LTM)
Confusability & Similarity
• Similarity between items in WM increase confusability
• Decay and time more disruptive for similar material
FBICIAUSAvs.
FBI CIA USA

WM: Design Guidelines
Important for group project
1. Minimize working memory load (avoid the user
having to remember)
2. Provide placeholders for sequential tasks (what
steps have been completed? e.g., automated check out)
3. Exploit chunking (meaningful sequences – e.g., 1-800-
438-4357 ; 1-800-GET-HELP)
4. Avoid “0”s (regal member number: 0000000100290978)
5. Consider WM limits in instructions (Before doing X
and Y, do A) (Do A. Then do X and Y)
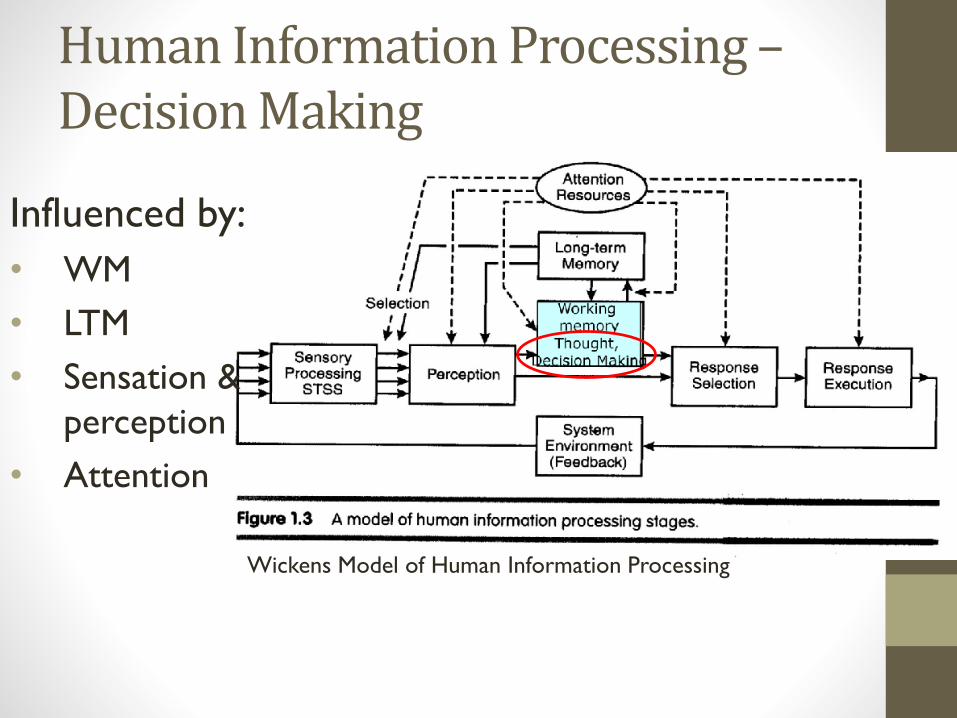
Human Information Processing –Decision Making
Influenced by:
• WM
• LTM
• Sensation &
perception
• Attention
Wickens Model of Human Information Processing

Decision Making
What is a decision making task?
• A choice between alternatives• Example: Course A or Course B?
• Some information available about the choices • Example: Course A: MWF, Course B: TTH
• Time frame longer than a second• Decision making vs choice-reaction• Example: Drop day is in October
• Uncertainty & risks• Example: what type of exams are involved in A

Decision Making
• Three processes or steps• Cues go into working memory• Using cues, we generate hypotheses• Based on cues, and hypotheses, plan and act
• Normative decision models• How people ideally should make decisions• Mathematical assessments of probability
• Issues pertaining to decision making• Cognitive fixation
• Stay fixated on particular hypothesis (chosen for testing)• Stay fixated on particular solution even when not working
• Confirmation bias• Seek cues that confirm; avoid those that disconfirm• Interpret ambiguous evidence as supportive

Improving Decision Making• Redesign the task
• Provide information – not data• Proceduralization (Training)
• Practice normative decision making skills as much as possible
• Automation (Decision support system)• Computers can present many sources of data in
aggregated format• Decision making can be informed by more sources of
information• Computer aids can offload working memory load by
displaying different hypotheses that fit data• Computers can also display all recommended actions
based on data• Give feedback (results of decision) as soon as possible:
clear and diagnostic

Prototyping dimensions
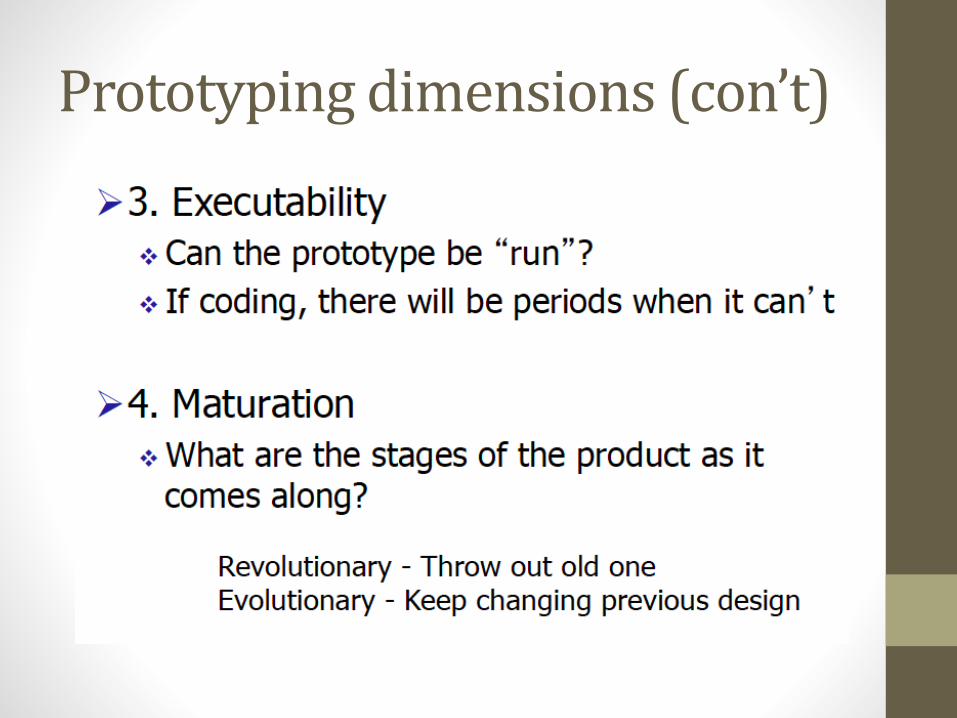
Prototyping dimensions (con’t)

More terminology
• Low-fidelity prototype• Paper-based sketches without user interactions
• Focus on functionality
• Less focus on aesthetics
• Early visualization of design alternatives
• Quick to create and easy to change
• High-fidelity prototype• Computer-based with user interactions
• Close to true representation
• More effective to collect performance data
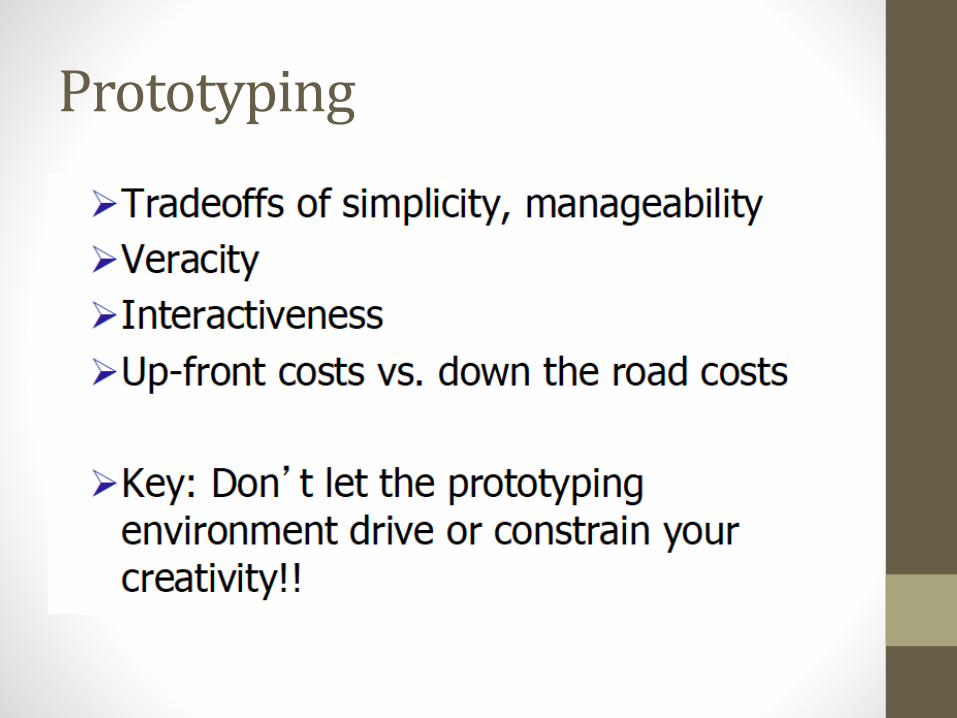
Prototyping