Protocol for camera-trap surveys of mammals at CTFS-ForestGEO ...
15
Protocol for camera-trap surveys of mammals at CTFS-ForestGEO sites Patrick A. Jansen 1 , Tavis D. Forrester 2 & William J. McShea 2 Version 1.1: May 2014 1. Introduction This document outlines procedures for surveying large terrestrial mammals at sites of CTFS-ForestGEO 3 , a global network of large Forest Dynamics Plots (FDPs) in which all trees >1 cm diameter are mapped, tagged, identified and monitored. Large terrestrial mammals – here defined as medium- to large-sized mammals, with a body mass >1 kg that spend at least some portion of their daily cycle on ground – are a key component of tropical forest communities. For CTFS-ForestGEO, large mammals are of special interest because they influence the vital rates of plants in multiple ways, such as through pollination, seed dispersal, seed predation and herbivory, through redistribution of nutrients and physical alteration of the abiotic conditions, and by controlling abundances of natural enemies (Power et al. 1996; Dobson et al. 2006). Large mammals can thus have a strong influence role in the composition and structure of vegetation. The aim of this protocol is to collect data on the identity and relative abundance of large terrestrial mammals that use the FDP and potentially interact with the vegetation that is being monitored, and do this collection in a standardized manner so that comparisons across the CTFS-ForestGEO network are possible. This aim differs from other camera- trap surveys in that we do focus on a distinct area of forest – the FDP and its immediate surroundings – rather than the animal populations in the forest landscape. This protocol outlines a standardized procedure for surveying mammals in and around FDPs using arrays of camera traps. Camera traps photograph mammals as they pass in 1 Centre for Tropical Forest Science, Smithsonian Tropical Research Institute, Box 0843-03092, Ancon, Panamá, República de Panamá. E-mail: [email protected]. 2 Smithsonian Conservation Biology Institute, 1500 Remount Road, Front Royal, VA 22630, USA. 3 Centre for Tropical Forest Science (www.ctfs.si.edu): Forest Global Earth Observatories (www.forestgeo.si.edu) 1/15
Transcript of Protocol for camera-trap surveys of mammals at CTFS-ForestGEO ...
Protocol for camera-trap surveys of mammals at CTFS-ForestGEO sites
Patrick A. Jansen 1, Tavis D. Forrester 2 & William J. McShea 2
Version 1.1: May 2014
1. Introduction
This document outlines procedures for surveying large terrestrial mammals at sites of CTFS-ForestGEO 3, a global network of large Forest Dynamics Plots (FDPs) in which all trees >1 cm diameter are mapped, tagged, identified and monitored. Large terrestrial mammals – here defined as medium- to large-sized mammals, with a body mass >1 kg that spend at least some portion of their daily cycle on ground – are a key component of tropical forest communities. For CTFS-ForestGEO, large mammals are of special interest because they influence the vital rates of plants in multiple ways, such as through pollination, seed dispersal, seed predation and herbivory, through redistribution of nutrients and physical alteration of the abiotic conditions, and by controlling abundances of natural enemies (Power et al. 1996; Dobson et al. 2006). Large mammals can thus have a strong influence role in the composition and structure of vegetation. The aim of this protocol is to collect data on the identity and relative abundance of large terrestrial mammals that use the FDP and potentially interact with the vegetation that is being monitored, and do this collection in a standardized manner so that comparisons across the CTFS-ForestGEO network are possible. This aim differs from other camera-trap surveys in that we do focus on a distinct area of forest – the FDP and its immediate surroundings – rather than the animal populations in the forest landscape. This protocol outlines a standardized procedure for surveying mammals in and around FDPs using arrays of camera traps. Camera traps photograph mammals as they pass in
1 Centre for Tropical Forest Science, Smithsonian Tropical Research Institute, Box 0843-03092, Ancon, Panamá, República de Panamá. E-mail: [email protected].
2 Smithsonian Conservation Biology Institute, 1500 Remount Road, Front Royal, VA 22630, USA. 3 Centre for Tropical Forest Science (www.ctfs.si.edu): Forest Global Earth Observatories
(www.forestgeo.si.edu)
1/15
front of motion-sensitive infra-red sensors, and thus record mammals in a non-invasive manner, independent of the activity patterns and shyness of species. They provide objective observations with photographic evidence that can be archived and verified. Camera traps have become a standard tool for surveying communities of large terrestrial mammals (O'Brien 2008; Tobler et al. 2008; O'Brien et al. 2010). Arrays of camera traps can be considered as sensor networks to detect and monitor variation of mammal relative abundances in space and time (Kays et al. 2011), where the rate and the proportion of points at which species are photographed can be used as indicator for their abundance. Moreover, under certain conditions and assumptions, photographic rates can be used to estimate population densities (Rowcliffe et al. 2008). 4 The method is to deploy camera traps in a systematic grid, in a standardized manner, and without bait. Thus, the cameras are set to capture animals that coincidentally move across the sensor field, which is an important difference from protocols that attempt to maximize encounters with species by placing cameras subjectively at locations of high use by animals (e.g. trails, mineral licks or water holes), or attract animals to the camera location with lure (Rovero, Tobler & Sanderson 2010). The protocol has similarities with the camera-trapping protocol of the Terrestrial Ecology Assessment and Monitoring network (TEAM Network 2011), which was designed for surveying terrestrial mammal communities in tropical forests. The major differences are the frequency (TEAM has annual surveys, we use one-time surveys), the trap density (TEAM deploys one camera per 2 km², we use a 100-fold higher density), and the spatial extent of the survey (TEAM runs camera traps across 120 km², we use just 1 km²). These differences arise from the contrasting goals of the protocols. TEAM aims to monitor landscape-scale changes in large terrestrial mammals of forests throughout the tropics. ForestGEO, in contrast, aims to measure the identity and relative abundance of large terrestrial mammals that use the FDP and potentially interact with the vegetation that is being monitored. This document describes the procedures for implementing this protocol in detail. This is meant to ensure that data are collected in the same way, despite differences across sites and years in field conditions and people. Following these instructions as precisely as possible ensures the comparability of data among years and across sites. Running the survey at a site once will yield a quantitative estimate of the terrestrial large mammal community that interacts with the vegetation that is being monitored in the Forest Dynamics Plots (FDP). In combination with in-depth studies of wildlife–plant interactions, this information can yield a better understanding of vegetation dynamics. Repeating surveys over time will yield quantitative estimates of change of the mammal community. Most changes in the fauna – such as declines due to hunting – have consequences for the tree community which can be evaluated (e.g., Harrison et al. 2013). Running the survey across the network will generate a unique data set that allows for comparative and macro-ecological studies, such as relationships between plant and animal community diversity and biomass across sites with an intact fauna.
4 Note that camera traps cannot reliably detect all mammals due to either small body size or habits (i.e. fossorial, arboreal or volant). Those wishing a complete mammal survey should supplement this protocol with surveys specifically targeting these other groups.
2/15
2. Sampling design and planning
2.1. Sampling design
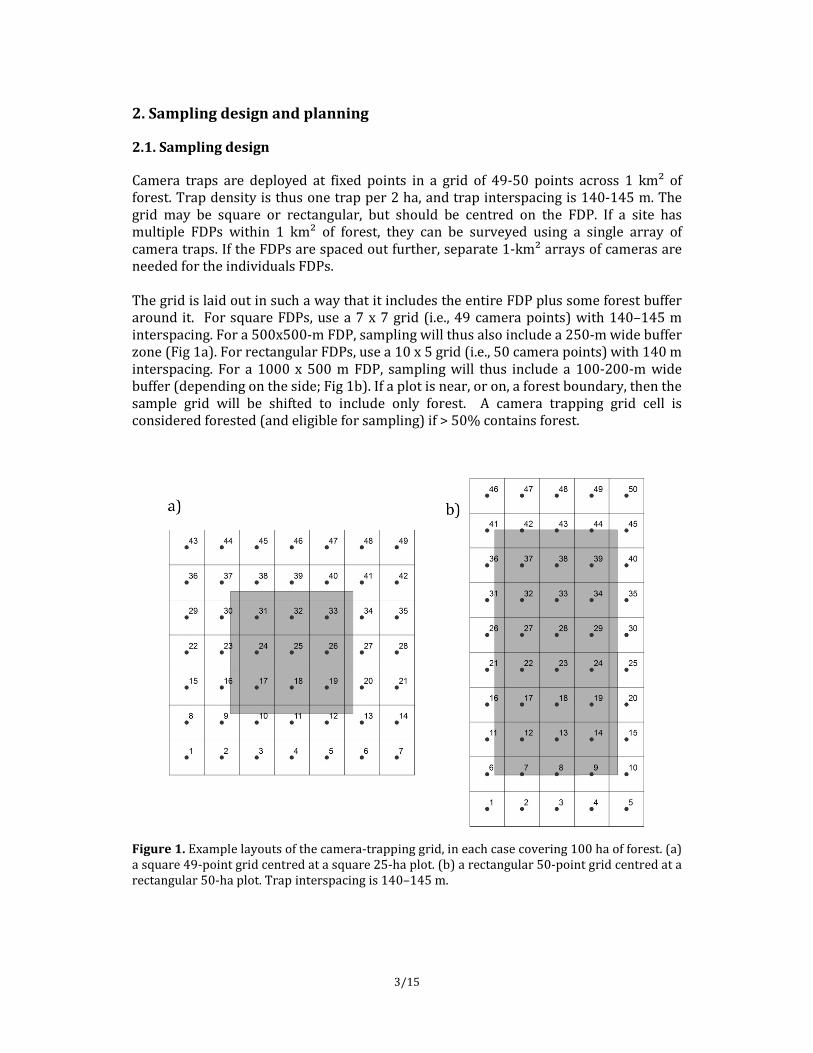
Camera traps are deployed at fixed points in a grid of 49-50 points across 1 km² of forest. Trap density is thus one trap per 2 ha, and trap interspacing is 140-145 m. The grid may be square or rectangular, but should be centred on the FDP. If a site has multiple FDPs within 1 km² of forest, they can be surveyed using a single array of camera traps. If the FDPs are spaced out further, separate 1-km² arrays of cameras are needed for the individuals FDPs. The grid is laid out in such a way that it includes the entire FDP plus some forest buffer around it. For square FDPs, use a 7 x 7 grid (i.e., 49 camera points) with 140–145 m interspacing. For a 500x500-m FDP, sampling will thus also include a 250-m wide buffer zone (Fig 1a). For rectangular FDPs, use a 10 x 5 grid (i.e., 50 camera points) with 140 m interspacing. For a 1000 x 500 m FDP, sampling will thus include a 100-200-m wide buffer (depending on the side; Fig 1b). If a plot is near, or on, a forest boundary, then the sample grid will be shifted to include only forest. A camera trapping grid cell is considered forested (and eligible for sampling) if > 50% contains forest.
Figure 1. Example layouts of the camera-trapping grid, in each case covering 100 ha of forest. (a) a square 49-point grid centred at a square 25-ha plot. (b) a rectangular 50-point grid centred at a rectangular 50-ha plot. Trap interspacing is 140–145 m.
3/15
Target points for sampling are pre-generated in a Geographical Information System, based on spatial data on the boundaries of the FDP and forest cover. This is done by the spatial analyst of CTFS. These points are combined with information on the location of FDP markers, trails, any buildings or roads, elevation, creeks and other features, if available, that aid navigation to produce a map that shows where the target sampling points are located. The spatial information is then loaded onto a GPS receiver. Other map data can be translated into files suitable for Garmin GPS receivers using the software Mapwel 5. Each sampling location is given a unique ID code, with format ‘ABC-1-23’. The element ‘ABC’ is a three-letter code for the CTFS-ForestGEO site, ‘1’ is the number of the camera-trap grid within the sites (most sites will have just one array), and ‘23’ is the two-digit number of the camera trap point within the array. For example, the code ‘BCI-1-42’ refers to the 42nd point of array 1 on Barro Colorado Island. The ID of target points gets the addition “T”, to distinguish it from the actual sampling point.
2.2. Sampling schedule
The survey is done in 2-4 sessions of camera placements, depending on whether 25 or 13 camera traps are available. It is important that deployments within each session are scattered across the survey area. This is achieved by generating a list of sample points in random order, and then grouping sample points into batches. At temperate sites, deployments should happen from late spring until late summer. All terrestrial mammals are active during this time. In tropical dry forest, deployments should happen at the start of the dry season, after the bulk of the heavy rains have ceased. At evergreen tropical sites, deployment should happen during or around the driest season of the year to avoid camera problems related to humidity.
2.3. Equipment
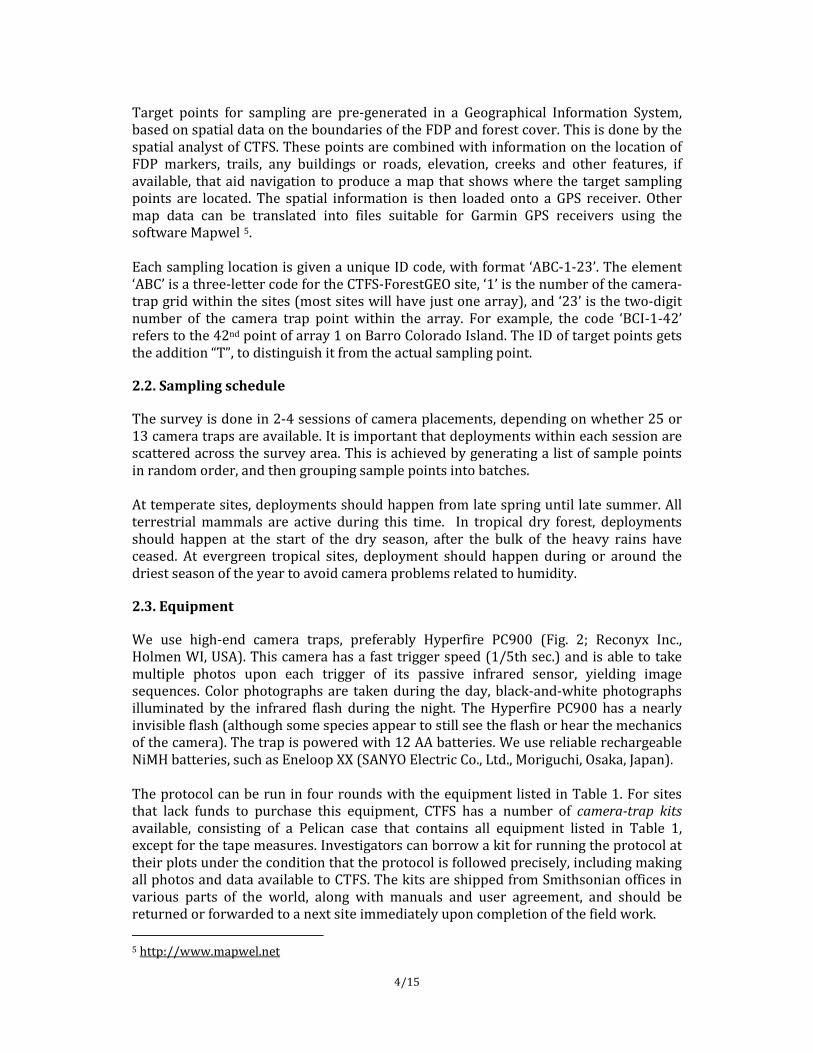
We use high-end camera traps, preferably Hyperfire PC900 (Fig. 2; Reconyx Inc., Holmen WI, USA). This camera has a fast trigger speed (1/5th sec.) and is able to take multiple photos upon each trigger of its passive infrared sensor, yielding image sequences. Color photographs are taken during the day, black-and-white photographs illuminated by the infrared flash during the night. The Hyperfire PC900 has a nearly invisible flash (although some species appear to still see the flash or hear the mechanics of the camera). The trap is powered with 12 AA batteries. We use reliable rechargeable NiMH batteries, such as Eneloop XX (SANYO Electric Co., Ltd., Moriguchi, Osaka, Japan). The protocol can be run in four rounds with the equipment listed in Table 1. For sites that lack funds to purchase this equipment, CTFS has a number of camera-trap kits available, consisting of a Pelican case that contains all equipment listed in Table 1, except for the tape measures. Investigators can borrow a kit for running the protocol at their plots under the condition that the protocol is followed precisely, including making all photos and data available to CTFS. The kits are shipped from Smithsonian offices in various parts of the world, along with manuals and user agreement, and should be returned or forwarded to a next site immediately upon completion of the field work.
5 http://www.mapwel.net
4/15
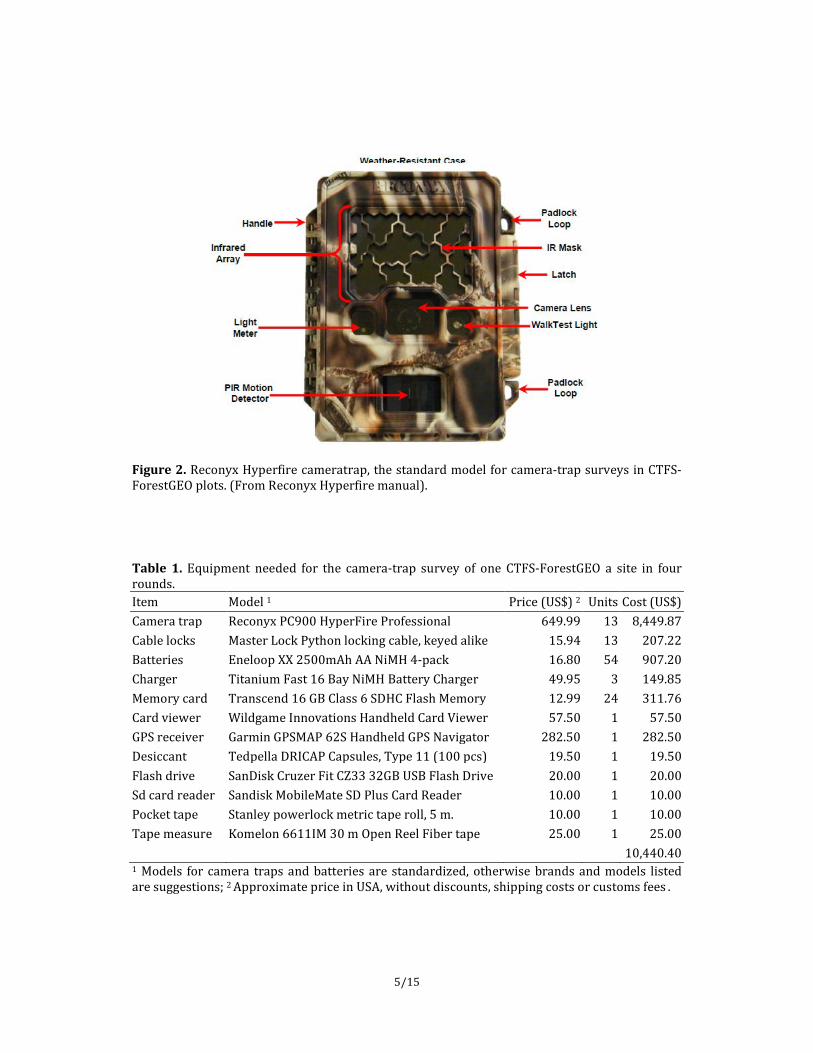
Figure 2. Reconyx Hyperfire cameratrap, the standard model for camera-trap surveys in CTFS-ForestGEO plots. (From Reconyx Hyperfire manual).
Table 1. Equipment needed for the camera-trap survey of one CTFS-ForestGEO a site in four rounds. Item Model 1 Price (US$) 2 Units Cost (US$) Camera trap Reconyx PC900 HyperFire Professional 649.99 13 8,449.87 Cable locks Master Lock Python locking cable, keyed alike 15.94 13 207.22 Batteries Eneloop XX 2500mAh AA NiMH 4-pack 16.80 54 907.20 Charger Titanium Fast 16 Bay NiMH Battery Charger 49.95 3 149.85 Memory card Transcend 16 GB Class 6 SDHC Flash Memory 12.99 24 311.76 Card viewer Wildgame Innovations Handheld Card Viewer 57.50 1 57.50 GPS receiver Garmin GPSMAP 62S Handheld GPS Navigator 282.50 1 282.50 Desiccant Tedpella DRICAP Capsules, Type 11 (100 pcs) 19.50 1 19.50 Flash drive SanDisk Cruzer Fit CZ33 32GB USB Flash Drive 20.00 1 20.00 Sd card reader Sandisk MobileMate SD Plus Card Reader 10.00 1 10.00 Pocket tape Stanley powerlock metric tape roll, 5 m. 10.00 1 10.00 Tape measure Komelon 6611IM 30 m Open Reel Fiber tape 25.00 1 25.00 10,440.40 1 Models for camera traps and batteries are standardized, otherwise brands and models listed are suggestions; 2 Approximate price in USA, without discounts, shipping costs or customs fees .
5/15
2.4. Personnel
A single skilled person – preferably a wildlife ecologist – should oversee all work, manage the equipment, and compile the photographs and data. Field crews should consist of 2 people. Each crew should have one person who received training in deployment of camera traps. An experienced wildlife ecologist should identify the animals on the photographs. GIS skills are needed for compiling the spatial information, generating the sampling design and access plan, preparing data for the GPS receivers, and compiling the spatial information collected during camera deployment (tracks and waypoints). These services will be provided by CTFS.
2.5. Time budget
Compiling the spatial data needed that CTFS needs to develop the design and produce maps will normally take up to one day. Placement, movement and collection of camera traps will take 9–14 days of field work to two persons, depending on the difficulty of the terrain and experience of the field crew. This assumes that a field crew of two persons places at least 6 camera traps per day. In the case of deployment in four sessions of 12-13 points each, the crew needs four times 2-3 days for placement and moving, and 1-2 days for collecting the cameras at the end of the study. Count an additional day for maintenance and battery charging, and this effort is spread over 3 months. Photo processing takes an experienced observer less than 2 minutes per photo sequence when using the tools described in this protocol. Assuming that cameras capture 1-3 sequences of photos daily, total processing time will be 30-40 hours. Actual photo rates vary greatly among sites, depending on abundance and activity of the fauna.
3. Field procedures
3.1. Selection of locations
The field crew will use GPS receivers and the deployment map to navigate to each of the target points selected for the current session. Care must be taken not to step on seedlings, or break foliage while moving through the forest, especially inside the FDP, as to not affect the tree survey. Once the target point is reached, the crew selects a tree for camera deployment in the immediate vicinity (i.e., within a radius of 15 m). A suitable location has (1) a stem with 20-50 cm diameter that is suitable for mounting a camera (thinner stems move in the wind and are too easy to cut to steal the camera, thicker stems cannot be rounded with a single cable lock); (2) a clear view at knee level of ca. 5-10 m in at least one direction (preferable the North to have photographs without backlight). In practice, small game trails and other natural openings in the understory vegetation are best suited for camera deployment. Within the FDP, no modifications of woody vegetation are allowed, but one can move coarse debris to clear the view or tie back woody vegetation close to
6/15
the camera unit; (3) A distance >25 m from rivers (steams allowed) or other water bodies. Important: The crew is limited to selecting sites at the predetermined locations and cannot locate cameras at alternative locations with high animal activity, such as salt licks, water holes and burrows. The coordinates of the actual deployment location are recorded by taking a waypoint with a GPS receiver. The waypoint is named with the location code, using the keypad of the receiver. At least 100 GPS readings must be averaged before the coordinates are saved; they must be accurate enough to relocate the sampling point at subsequent survey years. If the tree has a tag, record the tag number. Outside the FDP, the tree should be marked with a metal tag, so the study can be repeated at the same locations, if possible. For data security reasons, the location data must also be written down on a deployment form (Attachment 1), along with properties of the location.
3.2. Camera deployment
One camera trap is deployed at each point for a minimum of 20 days. With 49-50 sampling points, the total sampling effort will thus amount to >1000 days. ① Camera preparation – Make very sure that the correct date and time are programmed, as described in the Hyperfire manual 6. If your site is in a country with daylight savings time, use the regime that is active at the start of the sampling throughout the study period; do not mix ‘summer time’ and normal time. Program all other settings of the camera traps on a computer using the Reconyx Configuration Software as described in the “Professional Settings” manual 7. This software lets you save settings onto the memory card. When the memory card is inserted into the camera, and the camera is then powered on, the camera will automatically program itself with the specified settings. Each camera is given exactly the same settings (Table 2), except for the ‘label’, which should be set to the unique ID code of the sample point. This code will be saved in the metadata of every photo and will appear in the lower left corner of each photograph taken, so each image is directly linked to a location. If you insert the programmed memory card in the lab, stick a label on the camera to indicate the sampling point for which it was programmed. Likewise, if you insert the programmed memory card in the field, label the memory card with the sampling point. This ensures that the user label matches the sampling point in the field. Note that the camera must be set to take one time-lapse photo every 12 hours. In the event that a camera stops functioning before the end of the deployment, these photos allow users to determine what day it stopped operation and distinguish camera malfunctions from absence of animal activity.
6 Reconyx hyperfire manual: http://images.reconyx.com/file/HyperFireManual.pdf 7 Reconyx Professional Settings User Guide: http://images.reconyx.com/file/Professional%20Settings%20User%20Guide.pdf
7/15
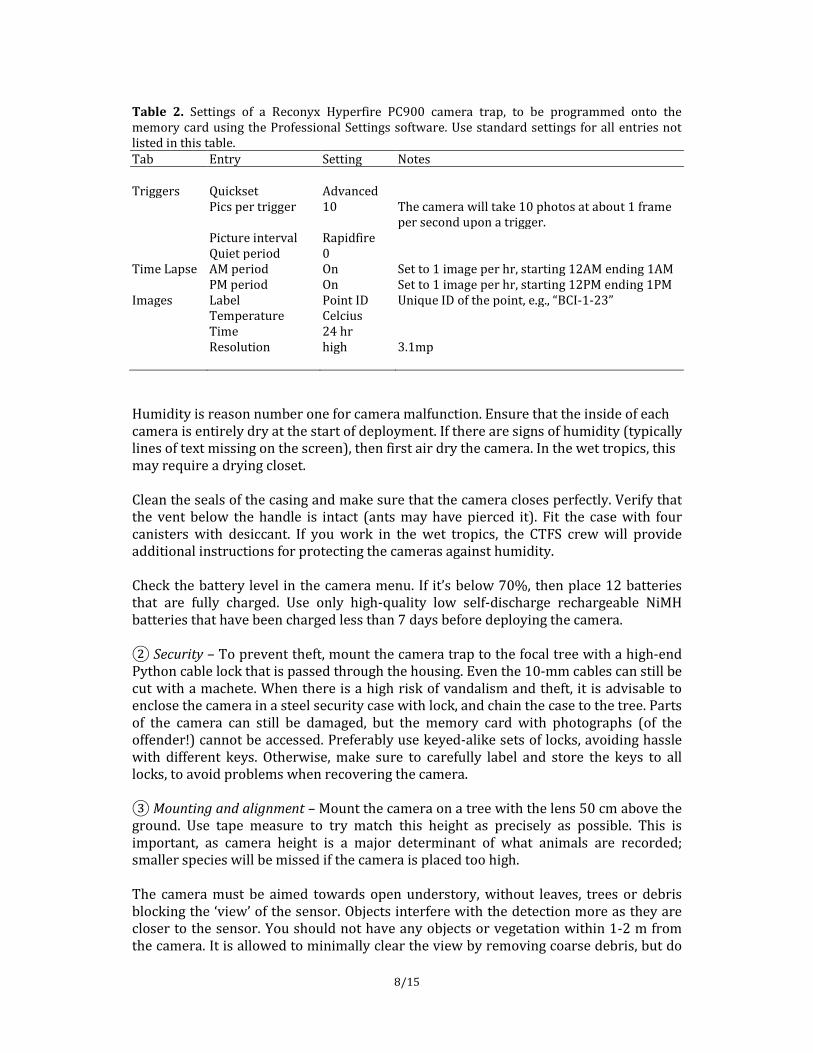
Table 2. Settings of a Reconyx Hyperfire PC900 camera trap, to be programmed onto the memory card using the Professional Settings software. Use standard settings for all entries not listed in this table. Tab Entry Setting Notes Triggers Quickset Advanced Pics per trigger 10 The camera will take 10 photos at about 1 frame
per second upon a trigger. Picture interval Rapidfire Quiet period 0 Time Lapse AM period On Set to 1 image per hr, starting 12AM ending 1AM PM period On Set to 1 image per hr, starting 12PM ending 1PM Images Label Point ID Unique ID of the point, e.g., “BCI-1-23” Temperature Celcius Time 24 hr Resolution high 3.1mp Humidity is reason number one for camera malfunction. Ensure that the inside of each camera is entirely dry at the start of deployment. If there are signs of humidity (typically lines of text missing on the screen), then first air dry the camera. In the wet tropics, this may require a drying closet. Clean the seals of the casing and make sure that the camera closes perfectly. Verify that the vent below the handle is intact (ants may have pierced it). Fit the case with four canisters with desiccant. If you work in the wet tropics, the CTFS crew will provide additional instructions for protecting the cameras against humidity. Check the battery level in the camera menu. If it’s below 70%, then place 12 batteries that are fully charged. Use only high-quality low self-discharge rechargeable NiMH batteries that have been charged less than 7 days before deploying the camera. ② Security – To prevent theft, mount the camera trap to the focal tree with a high-end Python cable lock that is passed through the housing. Even the 10-mm cables can still be cut with a machete. When there is a high risk of vandalism and theft, it is advisable to enclose the camera in a steel security case with lock, and chain the case to the tree. Parts of the camera can still be damaged, but the memory card with photographs (of the offender!) cannot be accessed. Preferably use keyed-alike sets of locks, avoiding hassle with different keys. Otherwise, make sure to carefully label and store the keys to all locks, to avoid problems when recovering the camera. ③ Mounting and alignment – Mount the camera on a tree with the lens 50 cm above the ground. Use tape measure to try match this height as precisely as possible. This is important, as camera height is a major determinant of what animals are recorded; smaller species will be missed if the camera is placed too high. The camera must be aimed towards open understory, without leaves, trees or debris blocking the ‘view’ of the sensor. Objects interfere with the detection more as they are closer to the sensor. You should not have any objects or vegetation within 1-2 m from the camera. It is allowed to minimally clear the view by removing coarse debris, but do
8/15
not remove any live woody vegetation. Herbaceous vegetation can be removed, but do not disturb the soil. Ideally, face the camera North, which yields the clearest images during daytime. The camera must be aligned parallel to the ground, so that the ‘horizon’ is in the centre of the image. The image should include the ground at 1 m front of the camera as well as the distant trees that are visible through the understory. The view can be adjusted by sliding sticks between the tree and the camera. Keep in mind that the motion sensor has two detection bands; one straight ahead and one at a slight downwards angle (Hyperfire Manual Chapter IX) The best way to verify whether the camera trap is well aligned is to check the images created. You can check your set-up with a few steps: turn on the camera, have it take a few pictures, turn it off again, remove the memory card and put it inside a portable image viewer or a regular point-and-shoot camera 8; adjust the alignment of the camera trap, based on what the images show; repeat this procedure until the camera is aligned perfectly. This process takes time, but it is important for standardization that the setup be proper and it is worth the investment, especially for new staff.
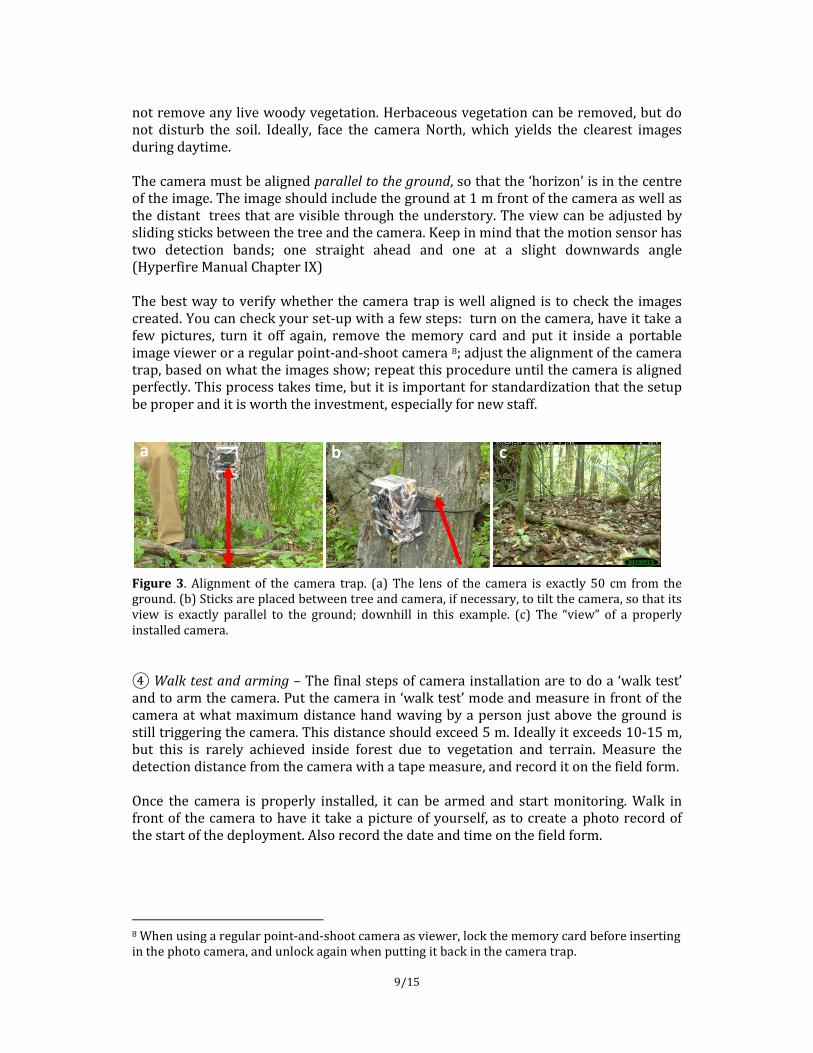
Figure 3. Alignment of the camera trap. (a) The lens of the camera is exactly 50 cm from the ground. (b) Sticks are placed between tree and camera, if necessary, to tilt the camera, so that its view is exactly parallel to the ground; downhill in this example. (c) The “view” of a properly installed camera. ④ Walk test and arming – The final steps of camera installation are to do a ‘walk test’ and to arm the camera. Put the camera in ‘walk test’ mode and measure in front of the camera at what maximum distance hand waving by a person just above the ground is still triggering the camera. This distance should exceed 5 m. Ideally it exceeds 10-15 m, but this is rarely achieved inside forest due to vegetation and terrain. Measure the detection distance from the camera with a tape measure, and record it on the field form. Once the camera is properly installed, it can be armed and start monitoring. Walk in front of the camera to have it take a picture of yourself, as to create a photo record of the start of the deployment. Also record the date and time on the field form.
8 When using a regular point-and-shoot camera as viewer, lock the memory card before inserting in the photo camera, and unlock again when putting it back in the camera trap.
c b a
9/15
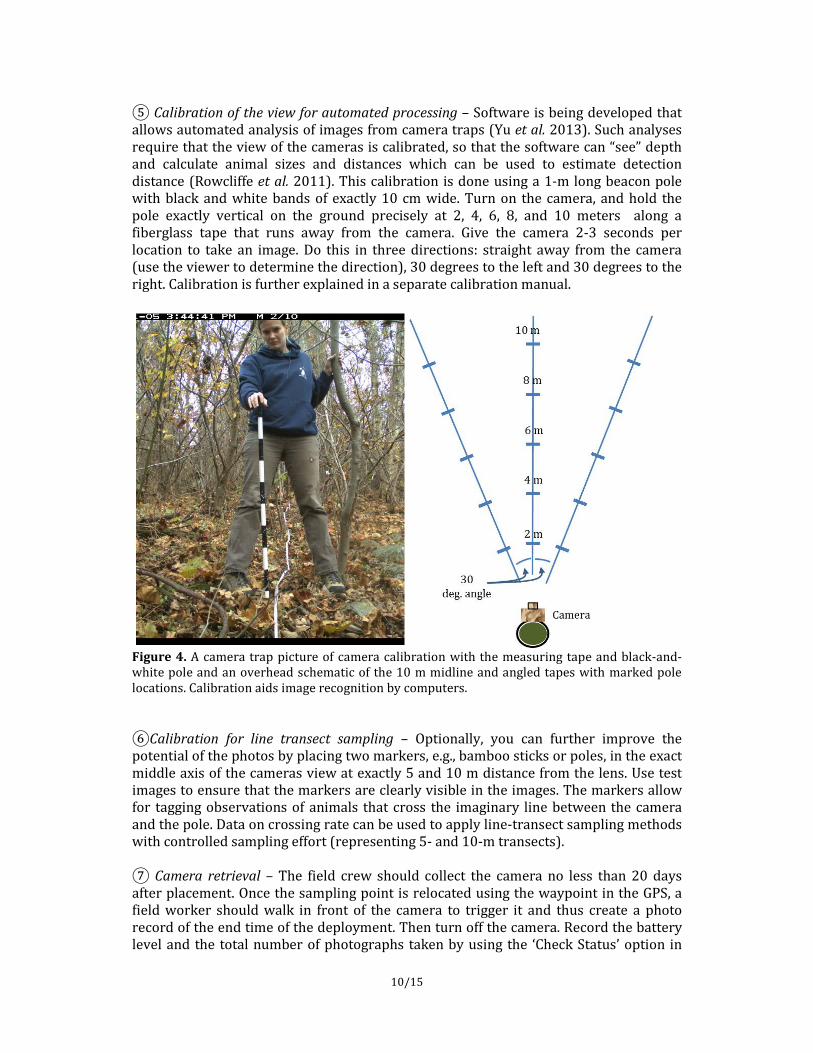
⑤ Calibration of the view for automated processing – Software is being developed that allows automated analysis of images from camera traps (Yu et al. 2013). Such analyses require that the view of the cameras is calibrated, so that the software can “see” depth and calculate animal sizes and distances which can be used to estimate detection distance (Rowcliffe et al. 2011). This calibration is done using a 1-m long beacon pole with black and white bands of exactly 10 cm wide. Turn on the camera, and hold the pole exactly vertical on the ground precisely at 2, 4, 6, 8, and 10 meters along a fiberglass tape that runs away from the camera. Give the camera 2-3 seconds per location to take an image. Do this in three directions: straight away from the camera (use the viewer to determine the direction), 30 degrees to the left and 30 degrees to the right. Calibration is further explained in a separate calibration manual.
Figure 4. A camera trap picture of camera calibration with the measuring tape and black-and-white pole and an overhead schematic of the 10 m midline and angled tapes with marked pole locations. Calibration aids image recognition by computers. ⑥Calibration for line transect sampling – Optionally, you can further improve the potential of the photos by placing two markers, e.g., bamboo sticks or poles, in the exact middle axis of the cameras view at exactly 5 and 10 m distance from the lens. Use test images to ensure that the markers are clearly visible in the images. The markers allow for tagging observations of animals that cross the imaginary line between the camera and the pole. Data on crossing rate can be used to apply line-transect sampling methods with controlled sampling effort (representing 5- and 10-m transects). ⑦ Camera retrieval – The field crew should collect the camera no less than 20 days after placement. Once the sampling point is relocated using the waypoint in the GPS, a field worker should walk in front of the camera to trigger it and thus create a photo record of the end time of the deployment. Then turn off the camera. Record the battery level and the total number of photographs taken by using the ‘Check Status’ option in
10/15
the camera menu, and write this information on the deployment form. Recover the memory card, lock it using the switch on the side of the card, and store it carefully. Wrap the camera for transportation to the next sample point or to the base station. If the camera is being redeployed, clean it and fit a new pre-programmed memory card and – if needed – new batteries (See ①). ⑧Photo backup – Upon return to the lab, copy the entire content of the memory card (which will have multiple folders) onto a hard disk as well as onto a flash memory drive, using a regular card reader. Most recent computers have a built-in SD card reader, eliminating the need of using an external card reader. Create a separate folder that is named according to the sample point ID, and copy all photos from that sample point into the folder. Do not delete any photos or attempt to merge multiple folders into one. ⑨ Camera cleaning and storage – Carefully remove the memory card and the batteries and clean / dry the camera, either for storage or for the next deployment. If you deployed the camera trap in the moist or wet tropics, dry the camera with opened case by placing it in a drying closet, not in A/C, for at least 24 hours.
4. Photo processing and analysis 4.1. Species list and guides
Before processing any photos, make a list of bird and mammal species larger than 100 g that can potentially be recorded by camera traps, using local species lists and/or field guides. Then, all prospective photo analysts should familiarize themselves with the species so they know how to distinguish them, using field guides. Keep in mind that most photographs will be at night and therefore in black and white images. It is important to recognize patterns more than coloration.
4.2. Photo processing
Photos are processed using the ForestGEO CT database 9, an online tool that allows annotating large amounts of images efficiently. This facility provides a separate password-protected database for each project and is hosted in a secured datacentre. The tool ingests photos that are uploaded, and then automatically extracts the metadata from the photos and combines this with information added by the user during the import process. Images are semi-automatically grouped into sequences that represent a single event, i.e., the passage of one or more animals. The user then identifies the animal(s) per sequence rather than per individual photo. The advantage of this approach is that it is no longer necessary to manually determine when an animal is to be considered a new detection on a photo-by-photo basis. A reliable and reasonably fast internet connection (1mbit+) is needed for using this tool. Process photos in an environment that has such a connection. A separate manual is available for photo upload processing (Jansen & Liefting 2012).
9 http://forestgeo.cameratrapping.net
11/15
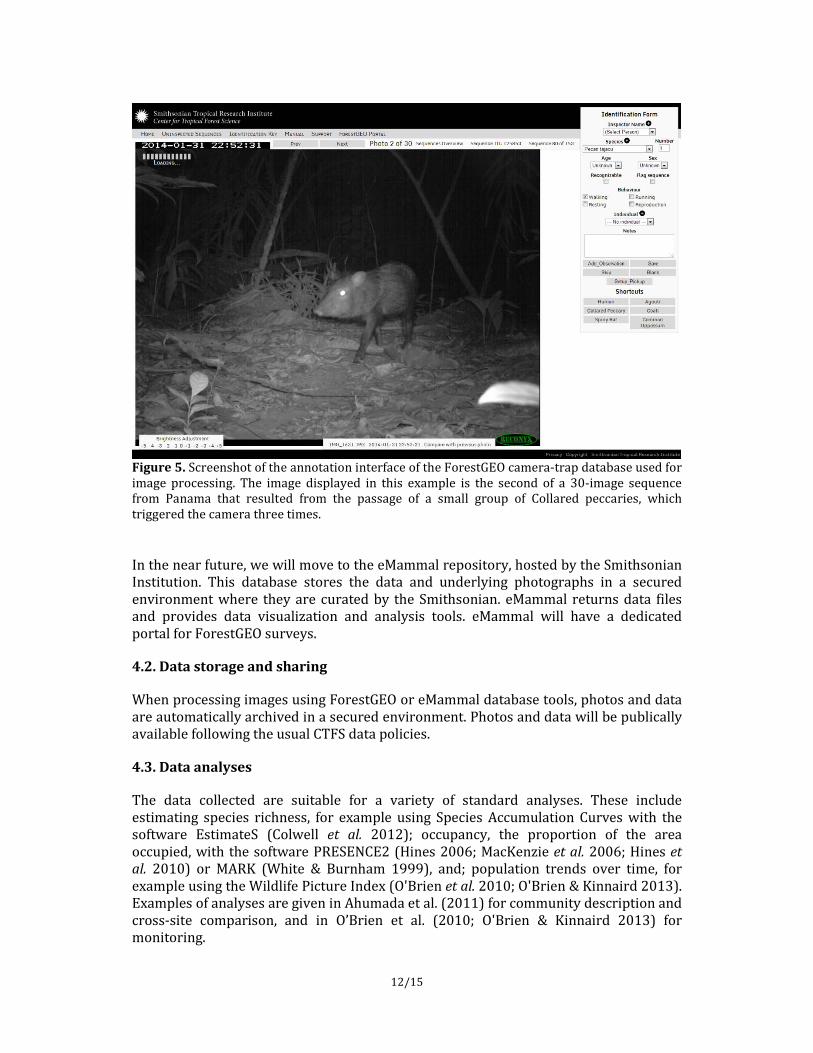
Figure 5. Screenshot of the annotation interface of the ForestGEO camera-trap database used for image processing. The image displayed in this example is the second of a 30-image sequence from Panama that resulted from the passage of a small group of Collared peccaries, which triggered the camera three times. In the near future, we will move to the eMammal repository, hosted by the Smithsonian Institution. This database stores the data and underlying photographs in a secured environment where they are curated by the Smithsonian. eMammal returns data files and provides data visualization and analysis tools. eMammal will have a dedicated portal for ForestGEO surveys.
4.2. Data storage and sharing
When processing images using ForestGEO or eMammal database tools, photos and data are automatically archived in a secured environment. Photos and data will be publically available following the usual CTFS data policies.
4.3. Data analyses
The data collected are suitable for a variety of standard analyses. These include estimating species richness, for example using Species Accumulation Curves with the software EstimateS (Colwell et al. 2012); occupancy, the proportion of the area occupied, with the software PRESENCE2 (Hines 2006; MacKenzie et al. 2006; Hines et al. 2010) or MARK (White & Burnham 1999), and; population trends over time, for example using the Wildlife Picture Index (O'Brien et al. 2010; O'Brien & Kinnaird 2013). Examples of analyses are given in Ahumada et al. (2011) for community description and cross-site comparison, and in O’Brien et al. (2010; O'Brien & Kinnaird 2013) for monitoring.
12/15
5. References
Ahumada, J.A., Silva, C.E., Gajapersad, K., Hallam, C., Hurtado, J., Martin, E., McWilliam, A., Mugerwa, B., O'Brien, T. & Rovero, F. (2011) Community structure and diversity of tropical forest mammals: data from a global camera trap network. Philosophical Transactions of the Royal Society B: Biological Sciences, 366, 2703-2711.
Colwell, R.K., Chao, A., Gotelli, N.J., Lin, S.-Y., Mao, C.X., Chazdon, R.L. & Longino, J.T. (2012) Models and estimators linking individual-based and sample-based rarefaction, extrapolation and comparison of assemblages. Journal of Plant Ecology, 5, 3-21.
Dobson, A., Lodge, D., Alder, J., Cumming, G.S., Keymer, J., McGlade, J., Mooney, H., Rusak, J.A., Sala, O. & Wolters, V. (2006) Habitat loss, trophic collapse, and the decline of ecosystem services. Ecology, 87, 1915-1924.
Harrison, R.D., Tan, S., Plotkin, J.B., Slik, F., Detto, M., Brenes, T., Itoh, A. & Davies, S.J. (2013) Consequences of defaunation for a tropical tree community. Ecology Letters, 16, 687–694.
Hines, J., Nichols, J., Royle, J., MacKenzie, D., Gopalaswamy, A., Kumar, N.S. & Karanth, K. (2010) Tigers on trails: occupancy modeling for cluster sampling. Ecological Applications, 20, 1456-1466.
Hines, J.E. (2006) PRESENCE2: software to estimate patch occupancy and related parameters. U.S. Geological Survey, Patuxent Wildlife Research Center, Laurel, Maryland.
Jansen, P.A. & Liefting, Y. (2012) Camera Trapping Database Manual. Smithsonian Tropical Research Institute, Panama City, Panama.
Kays, R.W., Tilak, S., Kranstauber, B., Jansen, P.A., Carbon, C., Rowcliffe, M., Fountain, C., Eggert, J. & He, Z. (2011) Camera traps as sensor networks for monitoring animal communities. International Journal of Research and Reviews in Wireless Sensor Networks, 1, 19-29.
MacKenzie, D.I., Nichols, J.D., Royle, J.A., Pollock, K.H., Bailey, L.L. & Hines, J.E. (2006) Occupancy estimation and modeling: inferring patterns and dynamics of species occurrence. Academic Press, Burlington, MA.
O'Brien, T. (2008) On the use of automated cameras to estimate species richness for large-and medium-sized rainforest mammals. Animal Conservation, 11, 179-181.
O'Brien, T., Baillie, J., Krueger, L. & Cuke, M. (2010) The Wildlife Picture Index: monitoring top trophic levels. Animal Conservation, 13, 335-343.
O'Brien, T.G. & Kinnaird, M.F. (2013) The Wildlife Picture Index: A biodiversity indicator for top trophic levels. Biodiversity Monitoring and Conservation: Bridging the Gap between Global Commitment and Local Action (eds B. Collen, N. Pettorelli, J. Baillie & S. Durant), pp. 45-70. Wiley-Blackwell, Oxford, UK.
Power, M.E., Tilman, D., Estes, J.A., Menge, B.A., Bond, W.J., Mills, L.S., Daily, G., Castilla, J.C., Lubchenco, J. & Paine, R.T. (1996) Challenges in the quest for keystones. Bioscience, 46, 609-620.
Rovero, F., Tobler, M. & Sanderson, J. (2010) Camera-trapping for inventorying terrestrial vertebrates. Manual on Field Recording Techniques and Protocols for All Taxa Biodiversity Inventories (eds J. Eymann, J. Degreef, C. Häuser, J. Monje, Y. Samyn & D. VandenSpiegel), pp. 100-128. Belgian National Focal Point to the Global Taxonomy Initiative, Brussels.
13/15
Rowcliffe, J.M., Field, J., Turvey, S.T. & Carbone, C. (2008) Estimating animal density using camera traps without the need for individual recognition. Journal of Applied Ecology, 45, 1228-1236.
Rowcliffe, M., Carbone, C., Jansen, P.A., Kays, R.W. & Kranstauber, B. (2011) Quantifying the sensitivity of camera traps:an adapted distance sampling approach. Methods in Ecology and Evolution, 2, 464–476.
TEAM Network (2011) Terrestrial vertebrate protocol: implementation manual, v. 3.1. Tropical Ecology, Assessment and Monitoring Network, Center for Applied Biodiversity Science, Conservation International, Arlington VA.
Tobler, M., Carrillo-Percastegui, S., Leite Pitman, R., Mares, R. & Powell, G. (2008) An evaluation of camera traps for inventorying large-and medium-sized terrestrial rainforest mammals. Animal Conservation, 11, 169-178.
White, G.C. & Burnham, K.P. (1999) Program MARK: survival estimation from populations of marked animals. Bird Study, 46, S120-S139.
Yu, X., Wang, J., Kays, R., Jansen, P.A., Wang, T. & Huang, T. (2013) Automated identification of animal species in camera trap images. EURASIP Journal on Image and Video Processing, 2013, 1-10.
14/15
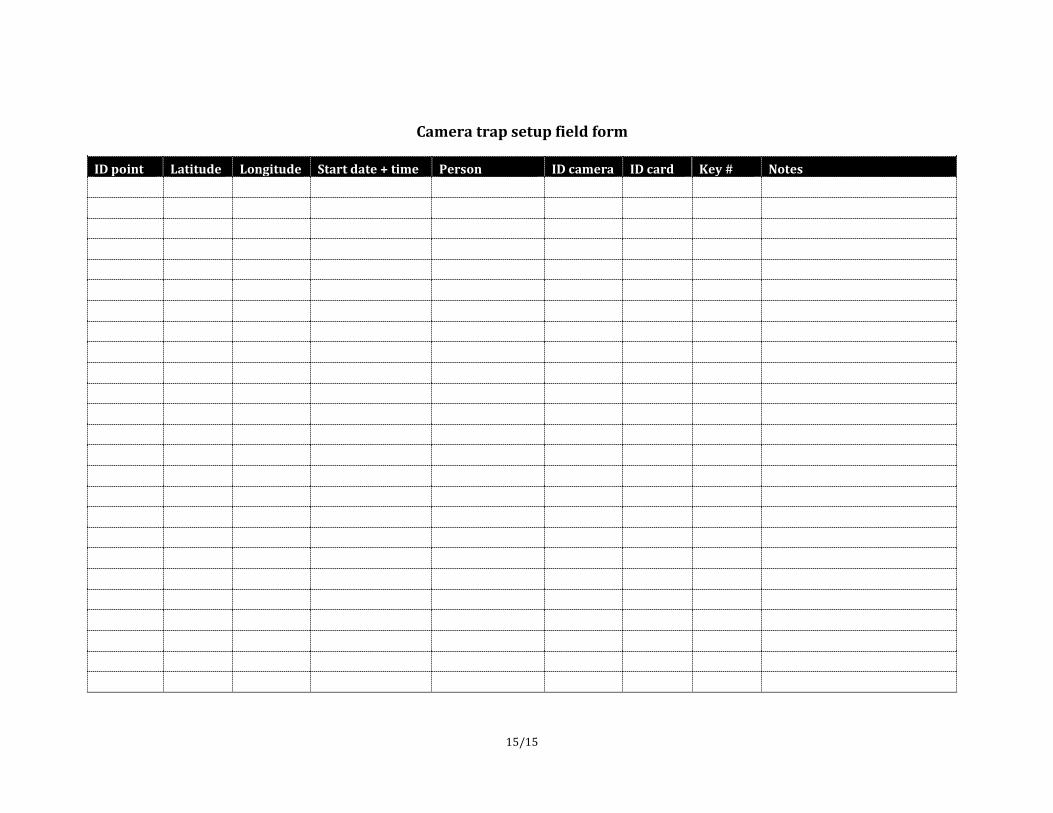
Camera trap setup field form
ID point Latitude Longitude Start date + time Person ID camera ID card Key # Notes
15/15