Single cell functional proteomics for assessing immune response in

Instructions for use
Title Proteomics on environmental response of Pseudomonas putida F1 in soil
Author(s) 森本, 一
Citation 北海道大学. 博士(環境科学) 乙第6908号
Issue Date 2014-03-25
DOI 10.14943/doctoral.r6908
Doc URL http://hdl.handle.net/2115/55578
Type theses (doctoral)
File Information Hajime_Morimoto.pdf
Hokkaido University Collection of Scholarly and Academic Papers : HUSCAP

Proteomics on environmental response of
Pseudomonas putida F1 in soil
Hajime Morimoto
Doctoral thesis
2014
Graduate School of Environment Science
Hokkaido University

Contents
Chapter 1…………………………………………………………………1
General introduction
Chapter 2…………………………………………………………………4
Genome-wide analytical approaches using semi-quantitative
expression proteomics for aromatic hydrocarbon metabolism in
Pseudomonas putida F1
Chapter 3…………………………………………………………………30
Gene expression profiling of Pseudomonas putida F1 after exposure
to aromatic hydrocarbon in soil by using proteome analysis
Chapter 4…………………………………………………………………52
Soil specific expression proteins in Pseudomonas putida F1
References..………………………………………………………………70
Acknowledgement………………………………………………………..83
Abstract in Japanese……………………………………………………...84

1
Chapter 1
General introduction
2
Soils cover almost all the terrestrial area on Earth and have an indispensable ecological
function in the global cycles of carbon, nitrogen and sulfur, and support a many bacterial species.
A single gram of soil has been estimated to contain between 1,000 and 1,000,000 taxa (Torsvik,
et al., 2002, Gans, et al., 2005). The total density may reach 1.5×10¹⁰
bacteria per gram (Torsvik,
et al., 1990, Torsvik & Ovreas, 2002). Soil microbes carry out many important functions in
environment. However, the explicit functional and ecological roles of individual taxa remain
uncertain because soil is a difficult medium for the analysis of bacterial structure and function.
Therefore, the most key questions in microbiology ‘‘who is out there?’’ and ‘‘what are they
doing?’’ are still unanswered for many environments and for many microbial taxa.
In microbiology, the application of post-genomic analyses has been limited mainly to
laboratory studies of pure cultures. The properties of an organism cultivated in the laboratory
may not necessary reflect its activity and physiology in the original environment where factors
such as resource competition, physico-chemical and biological environmental heterogeneity and
predation. (Brock, 1987).
Recently, to understand the structure and function of microbial community, metagenomic
approaches based on direct isolation of nucleic acids from environmental samples have proven
to be powerful tools for comparing and for exploring the microbial community structure (Biddle,
et al., 2008) and metabolic profiling of complex environmental microbial communities (Tringe,
et al., 2005, DeLong, et al., 2006), as well as for predicting novel biomolecules by use of
libraries constructed from isolated nucleic acids (Handelsman, 2004, Daniel, 2005, Ferrer, et al.,
2009). However, metagenomic approaches do not provide information about the expression
levels of the genes. Therefore, the functional role of genes or organisms in environments
remains uncertain.
Microbial functionality can be characterized either by the analysis of mRNA and/or

3
proteins. Major limitations related to the short half-life of mRNA, low correlation between RNA
levels and syntheses of the corresponding proteins have hampered the study of indigenous
microbial communities. The proteome represents the product of global gene expression
(transcription and translation), protein stability, protein processing and turnover. Proteome
analyses therefore extend beyond genomic analyses, which only describe the theoretical
capability of an organism or community by providing a direct measurement.
Metaproteomics studies the collective proteins from all the microorganisms in a
community (Gans, et al., 2005) and provides information about the actual functionality in
relation to metabolic pathways and regulation cascades (Torsvik, et al., 1990, Torsvik & Ovreas,
2002). Therefore, proteomics is an ideal supplement to functional genomics (Torsvik & Ovreas,
2002). The combination of genomics and proteomics should provide the knowledge between
microbial community-structure and soil function.
Although there are studies focusing on the microbial community, there is no reported case
of proteome analysis focused on one species of bacterium in soil environments. In presently, the
metaproteome approach was considered difficult to understand particularly of the role and
lifestyle of one species of bacterium in habitat environments.
In this study, I aimed to understand the environmental response of a soil bacterium
Pseudomonas putida F1 in soil environment using proteome analysis. First, the protein involved
in aromatic hydrocarbon degradation of P. putida F1 was identified in pure liquid culture
(Chapter 2). Second, the proteins involved in the degradation of aromatic hydrocarbon of P.
putida F1 detected in soil, and revealed response to aromatic hydrocarbon in this bacterium
grown in soil (Chapter 3). Finally, in order to understand the environmental response of P.
putida F1 in environmental soil, I identified the specifically expressed proteins in the soils
(Chapter 4).

4
Chapter 2
Genome-wide analytical approaches using semi-quantitative expression proteomics for aromatic
hydrocarbon metabolism in Pseudomonas putida F1

5
2.1 Introduction
Pseudomonas putida is a gram-negative gammaproteobacterium that lives in various
environments and is capable of degrading aromatic compounds. The genomes of 5 P. putida
strains, viz., F1 (GenBank, CP000712.1), KT2440 (Nelson, et al., 2002), GB-1 (GenBank,
CP000926.1), W619 (GenBank, CP000949.1), and S16 (Yu, et al., 2011), have been completely
sequenced. These strains appear to have common pathways for the metabolism of aromatic
compounds, based on analysis of data from the Kyoto Encyclopedia of Genes and Genomes
(KEGG; http://www.genome.jp/) and Microbial Genome Database for comparative analysis
(MBGD; http://mbgd.genome.ad.jp/) (Uchiyama, 2003, Uchiyama, et al., 2010). These include
the catechol (cat genes) and protocatechuate (pca genes) branches of the β-ketoadipate pathway
for benzoate degradation, and the 2-methylcitrate (2-MC) cycle (prp genes) for propanoate
degradation. Of the 5 strains, only the F1 strain of P. putida is known to have the capacity to
degrade toluene, ethylbenzene, benzene, and p-cymene (Parales, et al., 2000, Wu, et al., 2011).
This capacity for degradation of aromatic hydrocarbons results from a 47-kb gene cluster
(named an aromatics degradation island [ADI]), which has probably been inserted into the
chromosome (Fig. 2.1; KEGG, MBGD). The ADI is composed of 42 genes, and is organized
into a tod operon, a sep cluster, and a two-component system for metabolism of toluene,
ethylbenzene, and benzene (Zylstra, et al., 1988, Zylstra & Gibson, 1989, Menn, et al., 1991,
Wang, et al., 1995, Lau, et al., 1997, Phoenix, et al., 2003), and cym and cmt operons for
p-cymene metabolism (Eaton, 1996, Eaton, 1997).
The degradation pathways for toluene, ethylbenzene, benzene, and p-cymene in P. putida
F1 are shown on the basis of the KEGG pathway database (Fig. 2.2). Toluene, ethylbenzene,
and benzene will be degraded via the tod pathway (reaction steps 1 to 7), 2-MC cycle (steps 14
to 19), and β-ketoadipate pathway (steps 8 to 13), and p-cymene in the cym/cmt pathway (steps

6
20 to 27, and 4 to 7). The final metabolites transferred from the aromatic hydrocarbons enter the
tricarboxylic acid (TCA) cycle. Genes encoding the key enzymes for each of the steps in the
degradation process have been assigned by genome analysis. Some of the enzymes involved in
particular steps are present as paralogues and complexes, all of which need to be identified and
their roles understood, in order to fully comprehend a given metabolic pathway.
Proteome analysis has been reported for identified proteins related to metabolic pathways
in bacterial cells, e.g. those involved in the degradation of succinate, benzoate,
p-hydroxybenzoate, phenylacetate, vanilline, phenol, and chlorophenoxy herbicides in P. putida
KT2440 (Santos, et al., 2004, Benndorf, et al., 2006, Kim, et al., 2006, Yun, et al., 2011),
degradation of fluoranthene in Mycobacterium sp. JS14 (Lee, et al., 2007) and of γ-caprolactone
in Rhodococcus erythropolis R138 (Barbey, et al., 2012), and aromatic compounds catabolism
in thermophilic Geobacillus thermodenitrificans NG80-2 (Li, et al., 2012). Generally, in
proteomic analysis, the altered spots on two-dimensional electrophoresis (2-DE) gels are
analyzed and identified by mass spectrometry (MS) (Santos, et al., 2004, Benndorf, et al., 2006,
Kim, et al., 2006, Kurbatov, et al., 2006, Hecker, et al., 2008, Moreno, et al., 2009,
Roma-Rodrigues, et al., 2010, Gong, et al., 2012). This method, however, is not adequate for
identifying all proteins involved in a given pathway, because only those spots that appear
different are analyzed, and thus all the proteins expressed in the cells are not comprehensively
identified.
For more comprehensive proteome analysis, the expressed proteins are identified in slices
of a one-dimensional (1-D) SDS-PAGE gel, cut from top to bottom (Kuwana, et al., 2002,
Mastroleo, et al., 2009, Yun, et al., 2011, Li, et al., 2012), combined with a liquid
chromatography–tandem mass spectrometry (LC–MS/MS). A drawback of this method is that it
is difficult to quantitatively compare expression levels between samples by the number of

7
peptides detected. The methods most appropriate for quantitative analyses of expressed proteins
are isotope-coded affinity-tags (ICAT) (Gygi, et al., 1999), isobaric-tags for relative and
absolute quantitation (iTRAQ) (Ross, et al., 2004)and isotope coded protein labeling (ICPL)
(Schmidt, et al., 2005) which involves labeling of proteins with chemical reagents, as well as
the exponentially modified protein abundance index (emPAI), which is a label-free method and
is the technique most convenient to use (Ishihama, et al., 2005, Shinoda, et al., 2010).
In this study, I performed comprehensive proteome analysis, using a method that combined
1-D SDS-PAGE and nanoLC–MS/MS, and semi-quantitative analysis, using protein content
(PC) calculated from the emPAI, not using raw emPAI value, to delineate the metabolism of
glucose, toluene, ethylbenzene, benzene, p-cymene, and p-cumate. Based on a comparison of
the proteome data set for each substrate, I identified (i) all key enzymes in the degradation
pathway of toluene, ethylbenzene, benzene, p-cymene, and p-cumate, (ii) the proteins involved
in the various metabolic pathways, and (iii) substrate-specific expressed proteins. Moreover, my
results suggest that the approaches I use here are ideal for a primary analysis of the various
physiological characteristics and processes of bacterial cells, which is comparable to a
DNA-array analysis approach.
2.2 Materials and methods
2.2.1 Bacterial strain and growth conditions
P. putida F1 was purchased from ATCC, and was grown on mineral salt medium (18.3 mM
NaHPO4·12H2O, 11.2 mM KH2PO4, 4.8 mM (NH4)2SO4, 0.8 mM MgSO4·7H2O, and 0.3 mM
CaCl2) (Munoz, et al., 2007) supplemented with trace elements (14.9 μM EDTA-2Na, 7.2 μM
FeSO4·7H2O, 0.35 μM ZnSO4·7H2O, 0.15 μM MnCl2·4H2O, 4.9 μM H3BO3, 0.84 μM
CoCl2·6H2O, 0.06 μM CuCl2·2H2O, 0.08 μM NiCl2·6H2O, and 0.14 μM NaMoO4·2H2O), and

8
contained 0.2% (w/v) glucose, 0.1% (v/v) toluene, 0.3% (v/v) ethylbenzene, 0.25% (v/v)
benzene, 0.2% (v/v) p-cymene, or 0.033% (v/v) p-cumate as sole sources of carbon and energy.
Ten milliliters of each of these cultures were incubated at 30°C with vigorous shaking. The
bacteria cells were harvested after 25–35 h of incubation time by centrifugation.
2.2.2 1-D SDS-PAGE and in-gel digestion
Harvested cells were lysed with ReadyPrep Protein Extraction Kit (Bio-Rad, CA, USA).
Proteins (50 μg) were separated using 12.5% SDS-PAGE (90 mm × 85 mm) and stained with
Coomassie. The gel lanes were cut into 60 strips of ~ 1 mm. The gel strips were completely
de-stained with 30% acetonitrile (ACN) in 25 mM NH4HCO3, reduced with 10 mM DTT, and
alkylated with 55 mM iodoacetamide. After these gel strips had been completely dried, in-gel
digestion was performed with 40 μL of sequencing-grade modified trypsin (12.5 μg/mL in 50
mM NH4HCO3), at 37°C overnight. The digested peptides were extracted with 25 mM
NH4HCO3 in 60% ACN, and twice more with 5% formic acid in 70% ACN. The peptide
mixtures were used in LC–MS/MS analysis.
2.2.3 NanoLC–ESI–MS/MS analysis
LC–MS/MS analysis was performed using a LTQ ion-trap MS (Thermo Fisher Scientific,
Yokohama, Japan) coupled with a multidimensional HPLC Paradigm MS2 HPLC (AMR Inc.,
Tokyo, Japan) and a nano-spray electrospray ionization device (Michrom Bioresources Inc., CA,
USA). The tryptic peptides were loaded onto an L-column2 ODS (Chemicals Evaluation &
Research Inst., Tokyo, Japan) packed with C18 modified silica particles (5 μm, 12-nm pore size),
and were separated by a linear gradient of 15–65% buffer B for 40 min, followed by a gradient
of 65–95% buffer B for 1 min (buffer A = 2% methanol and 0.1% formic acid in H2O; buffer B

9
= 90% methanol and 0.1% formic acid in H2O) at a flow rate of 1 μL/min. Peptide spectra were
recorded in a mass range of m/z 450–1800. MS/MS spectra were acquired in data-dependent
scan mode. After the full spectrum scan, 1 MS/MS spectrum of the single most intense peaks
was also collected. The dynamic exclusion features were set as follows: a repeat count of 1
within 30 s, an exclusion duration of 180 s, and an exclusion list size of 50. The obtained
MS/MS data were searched against the P. putida F1 data in NCBI (NC_009512), using the
Mascot program ver. 2.3.01 (Matrix Science, London, UK) on an in-house server to identify
proteins. Search parameters were set as follows: tryptic digest with a maximum of 2 missed
cleavage sites; fixed modifications, carbamidomethyl cysteine; variable modifications,
methionine oxidation; peptide masses, monoisotopic, positive charge (+ 1, + 2, + 3) of peptide;
and mass tolerance of 1.2 Da for the precursor ion and 0.8 Da for product ions. To assess
false-positive identifications, an automatic decoy search was performed against a randomized
database with a default significance threshold of p < 0.05; the false discovery rate at the identity
threshold was below 3.4%.
2.2.4 Protein quantitative analysis
Label-free quantitative analysis of the abundance of the identified proteins was performed
using the emPAI values that are provided by the Mascot program (Ishihama, et al., 2005,
Shinoda, et al., 2010). The emPAI compares the number of observed unique parent ions per
protein with the number of observable peptides per protein. PC in molar percentages within the
cultured was calculated as
PC (mol%) = emPAI / Σ(emPAI) × 100
where Σ(emPAI) is the summation of the emPAI values for all of the identified proteins
(Ishihama, et al., 2005).

10
2.2.5 Clustering analysis
To facilitate the comparison of protein expression profiles, the normalized value, Ni, of
each PC for the different carbon sources series for individual proteins was calculated with the
following equation:
Ni = (Xi – )/ σX
Ni-values ranged from − 2.04 to 2.04. The MultiExperiment Viewer, which is part of the
TM4 Software Suite (Saeed, et al., 2003, Saeed, et al., 2006), was used for figure of merit
(FOM) and K-means clustering (KMC) of the proteomic data sets. The FOM was analyzed for
the optimal number of clusters of the KMC. KMC was only performed for statistically
significant protein expression profiles. For both analyses, sample selection was based on a
selected gene cluster. For the FOM, the parameters were set as: 100 of FOM iterations, calculate
means, 50 of maximum KMC iterations, and Euclidean distance. For KMC, protein expression
profiles were subdivided into 20 clusters, and the Euclidean distance was used as the current
metric, and 50 maximum iterations were calculated.
2.3 Results and discussion
2.3.1 Protein identification and label-free quantitative analysis
Proteins of P. putida F1 cells grown in the presence of glucose, toluene, ethylbenzene,
benzene, p-cymene, or p-cumate were separated by SDS-PAGE, and gels were cut into 60 strips
for in-gel digestion (Fig. 2.3). Each peptide mixture was analyzed by nanoLC–MS/MS for
protein identification.
In cells grown with glucose, toluene, ethylbenzene, benzene, p-cymene and p-cumate, 2022,
1733, 1802, 1801, 2368, and 2314 proteins were identified, respectively, with more than 2
unique peptide-filtering criteria, covering 33.0%–45.1% of the 5250 proteins of P. putida F1. PC

11
was calculated using the emPAI value of the identified protein to compare the level of expressed
proteins. In the protein data sets derived from cells grown on each substrate, 1331 proteins were
present in all data sets, and 2463 of the known P. putida proteins were not identified in any of
these cultures. Proteins specific to glucose, toluene, ethylbenzene, benzene, p-cymene, and
p-cumate-substrate data sets were also identified, numbering 68, 27, 46, 32, 129, and 100,
respectively.
In this analysis, the proteins detected only 1 unique peptide filtering criterion numbered
560, 649, 625, 607, 580, and 511, for the glucose, toluene, ethylbenzene, benzene, p-cymene,
and p-cumate data sets, respectively. These proteins will be candidates for the more
comprehensive analysis of protein expression as related to metabolism.
2.3.2 The metabolic degradation pathway of aromatic hydrocarbons
2.3.2.1 Toluene metabolic pathway
In P. putida F1, toluene, ethylbenzene, and benzene are degraded to acetaldehyde, pyruvate,
and acetyl-CoA via 7 enzymes (Fig. 2.2), which are encoded in the tod operon (Fig. 2.1). In
cells cultured in the presence of toluene, ethylbenzene, and benzene, as expected, the 10 genes
encoding these degradation enzymes were up-regulated (Fig. 2.4), while the expression of an
aromatic hydrocarbon-degradation membrane protein (Pput_2883, TodX), was also observed.
These results delineate the enzymes and genes that catalyze the reaction steps in the
toluene/ethylbenzene/benzene metabolic pathway (Fig. 2.6).
Furthermore, the expression of a response-regulator receiver protein (Pput_2871, TodT)
and a sensor histidine-kinase (Pput_2872, TodS) were specifically found to be up-regulated in
the presence of toluene, ethylbenzene, and benzene (Fig. 2.4). These proteins comprise a

12
two-component system that regulates the expression of the tod operon and proteins involved in
solvent efflux pumps (Pput_2866, 2867, 2868, and 2869, SepRABC) in the sep cluster, which is
located downstream of the tod operon. These results indicate that the tod operon is positively
regulated by TodST (Lau, et al., 1997).
2.3.2.2 Ethylbenzene metabolic pathway
The ethylbenzene degradation pathway also involves a pathway in which propanoate is
catabolized to succinate (Fig. 2.2). The pathway is known as the 2-MC cycle and is widespread
among bacteria, based on sequence analysis of the completed genomes of a number of different
bacteria (Horswill & Escalante-Semerena, 1997, Horswill & Escalante-Semerena, 1999, Bramer
& Steinbuchel, 2001, Claes, et al., 2002, Grimek & Escalante-Semerena, 2004). In P. putida F1,
expression analysis of the 2-MC cycle has not yet been performed. Enzymes involved in the
degradation of propanoate were annotated on the KEGG pathway database (Fig. 2.5).
The 2-MC cycle is driven by the proteins encoding the propanoate utilization operon (prp)
(Horswill & Escalante-Semerena, 1997, Horswill & Escalante-Semerena, 1999, Bramer &
Steinbuchel, 2001). The genome of P. putida F1 also contains the prp operon, which is
composed of Pput_3432, 3433, 3435, 3436 and 3437, and Pput_3431, which is transcribed in
the opposite direction to the prp operon. The proteins encoded by these genes could be
designated as PrpD, PrpF, AcnD, PrpC, PrpB, PrpR and AcnB, respectively, from the ortholog
gene analysis.
In the culture containing ethylbenzene, the expression of all the genes in the prp operon
was clearly up-regulated (Fig. 2.5). It is difficult to assign Pput_3433 (PrpF) and 3433 (AcnD)
proteins to a reaction step in the 2-MC cycle, because the 2-MC cycle itself has not yet been
clearly defined. Pput_3525 and Pput_3345 were also expressed at lower levels in the

13
ethylbenzene culture, as compared to the other cultures. The expression of Pput_1428 and 4567,
which comprise acetyl-CoA synthetase, was up-regulated less in this culture than in the culture
with toluene. The acetyl-CoA synthetase engages in various pathways, such as
glycolysis/gluconeogenesis, pyruvate metabolism, and methane metabolism. Therefore, these
proteins may have little relation to propanoate degradation. Taken together, Pput_3525, 3345,
3435, 3432, 3431, 3436, 3433, and 3434 play a role in the 2-MC cycle, and could be designated
as, FadDx, PrpE, PrpC, PrpD, AcnB, PrpB, PrpF, and AcnD, respectively (Fig. 2.5 and 2.6).
2.3.2.3 p-Cymene and p-cumate metabolic pathway
p-Cymene and p-cumate, which is an intermediate product of p-cymene metabolism, are
finally degraded to isobutyrate, pyruvate, acetaldehyde, and acetyl-CoA via
cis-2-hydroxypenta-2,4-dienoate (Fig. 2.2). The genes involved in the degradation of p-cymene
and p-cumate are located in the cym operon and cmt operon within the ADI (Fig. 2.1). These
genes were assigned to the 11 key enzymes of these pathways (Fig. 2.2). In the cultures utilizing
p-cymene and p-cumate, all genes of the cym and the cmt operons were up-regulated (Fig. 2.4).
The expression of the genes of the cym operon, which is involved in the dissimilation of
p-cymene to p-cumate was also observed in the presence of p-cumate. This result indicates that
the cym and the cmt operons are under the same regulatory control.
The Pput_2900 gene (named as cymE) in the cym operon is not assigned to the key
enzymes of the p-cymene metabolism pathway, and has been defined as propionyl-CoA
synthetase (named as prpE) in the NCBI database. In the presence of ethylbenzene, however,
the Pput_2900 gene was poorly expressed (Fig. 2.5). Therefore, the reaction step in which the
CymE protein is involved is not clear on metabolic map.
The Pput_2887 gene encoding enoyl-CoA hydratase/isomerase (EC:4.2.1.17) and the

14
Pput_2906 gene encoding carboxymethylenebutenolidase (EC:3.1.1.45) were also only slightly
up-regulated, but their functions are unknown.
The Pput_2908 (CymR) protein of the TetR family transcriptional regulators acts as a
repressor to both operons that have p-cymene and p-cumate as effectors (Eaton, 1996), and is
under inducible negative-control. The PC of the CymR protein in cultures, including p-cymene
and p-cumate, was less than those observed with other substrates. This result may indicate that
the expression of the cymR gene is repressed after binding to the effector.
There are 3 pairs of paralogous proteins in the tod and the cmt operons, viz., Pput_2875
(TodG) and Pput_2890 (CmtF) protein (54.5% identity), Pput_2873 (TodH) and Pput_2888
(CmtG) (75.7% identity), and Pput_2874 (TodI) and Pput_2889 (CmtH) (69.4% identity) that
catalyze the same reaction steps, viz. (5), (6), and (7), respectively (see Fig. 2.2). Although these
were paralogous, the expression of Tod and Cmt proteins are strictly controlled by the substrate;
consequently, the paralogues, which were annotated by genome analysis, will be easily assigned
to a key enzyme and function using this comprehensive semi-quantitative method.
In the ADI, expression of Pput_2870, 2885, and 2906, which encode hypothetical proteins,
and Pput_2884 of the LysR family transcriptional regulators, was not observed in the presence
of any of the substrates. This may have resulted from several causes, which may relate to the
detection-sensitivity for the ionized fragment by the mass spectrometer, a low level of protein
expression, a possibility of pseudo-genes, and so on.
Kurbatov et al. reported that when P. putida KT2440 was grown in the presence of phenol,
acetyl-CoA was metabolized via glyoxylate rather than via the TCA cycle, utilizing the end
products of phenol degradation to provide metabolites (oxaloacetate, malate, pyruvate, and
phosphoenolpyruvate) for anabolic pathways (Kurbatov, et al., 2006). In this study, the proteins
involved in the glyoxylate pathway were not observed to be up-regulated during growth in the

15
presence of aromatic compounds, although the end-products are the same as those involved in
the phenol pathway.
2.3.3 Proteins specifically up-regulated in each substrate-culture
The normalized value, Ni, of the 2787 proteins in the combined 6 protein data sets was
calculated and ranged from − 2.04 to 2.04. The protein with a Ni-value of 2.00 or more in each
substrate-culture was defined as a specifically up-regulated protein.
For the glucose culture, 94 of specific proteins were identified. For the toluene culture, 62
specific proteins were identified, but no markedly up-regulated proteins were observed. For the
ethylbenzene culture, among 164 of the specifically up-regulated proteins, PrpF, AcnD, PrpB,
and Pput_3437 (GntR family transcriptional regulator) in the propanoate metabolic pathway
were observed. Pput_2140 (dihydrodipicolinate synthase), Pput_3977 (hypothetical protein),
and Pput_4670 (rare lipoprotein B), of which the functions relevant to ethylbenzene degradation
were not clear, were also up-regulated. For the benzene culture, among 52 specifically
up-regulated proteins, Pput_2058 (aldo/keto reductase), Pput_2406 (sulfatase), and Pput_4346
(β-ketoadipyl CoA thiolase) were identified, in addition to CatA, CatB, CatC, PcaI, PcaJ, and
PcaF.
Among 137 and 109 specifically up-regulated proteins for p-cymene and p-cumate cultures,
respectively, Pput_1022 and 3227 (cold-shock DNA-binding protein) and Pput_3466
(DNA-binding protein HU-beta), and Pput_5222 (DNA-binding protein HU-alpha) were seen.
The relationship between the function of the proteins and p-cymene and p-cumate degradation is
unknown.
Additionally for toluene, ethylbenzene, and benzene cultures, Pput_0580
(N-acetyltransferase), Pput_0581 and 0582 (ethanolamine ammonia-lyase small subunit and

16
large subunit) and Pput_0583 (ethanolamine transporter), and for toluene and ethylbenzene
cultures, Pput_3976 (acetate permease, ActP) and Pput_3977 (hypothetical protein), were also
up-regulated.
Most of the specifically up-regulated proteins have no direct relation to the degradation of
each substrate, but may be related to secondary or tertiary metabolism. Furthermore, the role of
the specifically up-regulated proteins in metabolism would need to be clarified. Nevertheless,
because some of these proteins were markedly increased, it may be possible to use them as
biomarkers for the activity to degrade aromatic hydrocarbons.
2.3.4 K-means clustering of regulated proteins
The expression profiles of 2787 proteins were divided into 20 groups by FOM and KMC
(Fig. 2.7 and Table 2.1). From the analysis, most of the proteins of the tod and the sep operons,
and the two-component system (TodST), were affiliated to groups L, N, O, and Q, the proteins
in the propanoate metabolic pathway to groups I and J, and the proteins in the 3-oxoadipate
pathway to group H. The proteins of the cym and the cmt operons were affiliated to groups E
and F. The proteins up-regulated in the 4 degradation pathways were apparently differentiated
according to their functions. Similarly, it will be possible to cluster the down-regulated and
constitutively expressed proteins by KMC analysis.
In this study, I analyzed the comprehensive expression of the proteomes in cultures using
different substrates by a semi-quantitative method, using PC-values converted from the emPAI
of identified proteins. Our analysis approach has some advantages: firstly, it allows for easier
identification and validation of the proteins involved in the degradation metabolism compared
with 2-DE proteomics. The proteins encoded by key enzyme genes are detected not from the
changed spots and bands on a gel, but from the genomic information derived from a

17
functionally annotated gene. This is supported by the fact that I was able to identify all of the
key enzymes in 4 metabolic pathways (Fig. 2.6), as well as the regulator and transporter
proteins.
Secondly, the expression of proteins can be analyzed by focusing on operons. Generally,
many gene clusters related to metabolic pathways comprise an operon, e.g. besides the operons
investigated in this study, the pha and paa operons for phenylalanine degradation (Jimenez, et
al., 2002, Teufel, et al., 2010), the ure operon for urea degradation, the suc and sdh operons for
the TCA cycle, and the cop, cus, and ars operons for metal resistance (Wu, et al., 2011). This
advantage is supported by the finding that CmtI and CmtAd proteins were either not expressed,
or expressed at low levels, but were estimated to be expressed at much the same levels as that of
other proteins in the cmt operon.
Finally, this approach makes it possible to obtain information regarding expression profiles
of proteins identified genome-wide, and to analyze the differential display proteome between
total cellular proteins. This will correspond to expression analysis via an array approach for
transcriptomics. Sequential analysis during cell growth would also be informative. From
comparison between the proteome data sets of logarithmic and stationary phase cultures of P.
putida F1 in the presence of glucose, 21 and 73 phase-specific proteins, respectively, were
identified. These included Pput_0388 (biotin synthase) and Pput_3906 (capsule polysaccharide
biosynthesis protein) in the log phase, and Pput_3644 (ribosome modulation factor), which is a
stationary phase-specific inhibitor of ribosome functions (Wada, et al., 1995, Wada, et al., 2000),
in stationary phase cultures (data not shown).

18
2.4 Conclusion
In conclusion, in order to obtain a genome-wide understanding of the degradation of
aromatic hydrocarbons in the P. putida F1 strain, I have demonstrated the utility of
semi-quantitative analysis using PC values converted from the emPAI. The main pathways and
many proteins involved in the degradation were identified by comparative expression
proteomics. Moreover, the proteome data set obtained by this analysis can be processed as a
general array-analysis data. Our results suggest that these demonstrated approaches will be ideal
as a primary investigation into the various physiological characteristics of different bacterial
strains.

19
Table 2.1 List of genes in each group divided by K-means clustering of proteome data sets.
Group A Group B Group C Group D Group E Group F Group G Group H Group I Group J Group K Group L Group M Group N Group O Group P Group Q Group R Group S Group T
Pput_0022 Pput_0342 Pput_1118 Pput_0028 Pput_0009 Pput_0023 Pput_0044 Pput_0071 Pput_0013 Pput_0001 Pput_0015 Pput_0106 Pput_0090 Pput_0002 Pput_0043 Pput_0003 Pput_0068 Pput_0119 Pput_0082 Pput_0004
Pput_0040 Pput_0452 Pput_1445 Pput_0501 Pput_0017 Pput_0069 Pput_0060 Pput_0104 Pput_0021 Pput_0074 Pput_0076 Pput_0209 Pput_0110 Pput_0079 Pput_0077 Pput_0027 Pput_0115 Pput_0151 Pput_0143 Pput_0097
Pput_0099 Pput_0745 Pput_2086 Pput_0691 Pput_0120 Pput_0073 Pput_0167 Pput_0324 Pput_0036 Pput_0088 Pput_0177 Pput_0215 Pput_0145 Pput_0086 Pput_0081 Pput_0030 Pput_0138 Pput_0162 Pput_0175 Pput_0137
Pput_0100 Pput_1098 Pput_2342 Pput_0796 Pput_0132 Pput_0101 Pput_0182 Pput_0357 Pput_0067 Pput_0118 Pput_0184 Pput_0301 Pput_0213 Pput_0103 Pput_0083 Pput_0084 Pput_0149 Pput_0339 Pput_0413 Pput_0222
Pput_0135 Pput_1158 Pput_3218 Pput_0851 Pput_0139 Pput_0200 Pput_0220 Pput_0359 Pput_0072 Pput_0131 Pput_0208 Pput_0347 Pput_0265 Pput_0109 Pput_0089 Pput_0129 Pput_0207 Pput_0356 Pput_0437 Pput_0229
Pput_0158 Pput_1235 Pput_3219 Pput_0866 Pput_0183 Pput_0226 Pput_0274 Pput_0411 Pput_0108 Pput_0133 Pput_0210 Pput_0348 Pput_0368 Pput_0111 Pput_0098 Pput_0144 Pput_0228 Pput_0362 Pput_0469 Pput_0260
Pput_0179 Pput_1710 Pput_3941 Pput_0867 Pput_0242 Pput_0239 Pput_0318 Pput_0425 Pput_0124 Pput_0136 Pput_0284 Pput_0412 Pput_0394 Pput_0157 Pput_0128 Pput_0146 Pput_0230 Pput_0381 Pput_0502 Pput_0268
Pput_0261 Pput_1812 Pput_4594 Pput_0885 Pput_0273 Pput_0245 Pput_0337 Pput_0427 Pput_0125 Pput_0150 Pput_0365 Pput_0429 Pput_0440 Pput_0178 Pput_0140 Pput_0173 Pput_0267 Pput_0493 Pput_0512 Pput_0449
Pput_0264 Pput_2310 Pput_0994 Pput_0291 Pput_0248 Pput_0355 Pput_0433 Pput_0163 Pput_0159 Pput_0366 Pput_0456 Pput_0442 Pput_0185 Pput_0141 Pput_0205 Pput_0280 Pput_0504 Pput_0551 Pput_0473
Pput_0316 Pput_2569 Pput_1019 Pput_0432 Pput_0251 Pput_0397 Pput_0507 Pput_0235 Pput_0186 Pput_0367 Pput_0483 Pput_0463 Pput_0211 Pput_0147 Pput_0225 Pput_0314 Pput_0553 Pput_0577 Pput_0475
Pput_0423 Pput_4692 Pput_1070 Pput_0472 Pput_0303 Pput_0444 Pput_0517 Pput_0250 Pput_0199 Pput_0390 Pput_0487 Pput_0562 Pput_0224 Pput_0206 Pput_0259 Pput_0406 Pput_0570 Pput_0636 Pput_0484
Pput_0426 Pput_4742 Pput_1214 Pput_0495 Pput_0305 Pput_0519 Pput_0599 Pput_0279 Pput_0233 Pput_0396 Pput_0494 Pput_0596 Pput_0243 Pput_0240 Pput_0276 Pput_0420 Pput_0622 Pput_0654 Pput_0503
Pput_0447 Pput_5091 Pput_1249 Pput_0497 Pput_0327 Pput_0615 Pput_0645 Pput_0323 Pput_0241 Pput_0409 Pput_0506 Pput_0672 Pput_0257 Pput_0258 Pput_0300 Pput_0431 Pput_0692 Pput_0706 Pput_0510
Pput_0489 Pput_1270 Pput_0556 Pput_0346 Pput_0727 Pput_0665 Pput_0345 Pput_0249 Pput_0421 Pput_0511 Pput_0766 Pput_0262 Pput_0263 Pput_0304 Pput_0476 Pput_0789 Pput_0753 Pput_0641
Pput_0496 Pput_1349 Pput_0646 Pput_0373 Pput_0750 Pput_0720 Pput_0364 Pput_0281 Pput_0430 Pput_0609 Pput_0783 Pput_0275 Pput_0307 Pput_0306 Pput_0478 Pput_0802 Pput_0816 Pput_0687
Pput_0498 Pput_1394 Pput_0653 Pput_0401 Pput_0822 Pput_0739 Pput_0371 Pput_0328 Pput_0436 Pput_0711 Pput_0787 Pput_0277 Pput_0313 Pput_0312 Pput_0481 Pput_0820 Pput_0863 Pput_0705
Pput_0508 Pput_1507 Pput_0778 Pput_0402 Pput_0917 Pput_0806 Pput_0389 Pput_0331 Pput_0453 Pput_0714 Pput_0812 Pput_0278 Pput_0329 Pput_0336 Pput_0488 Pput_0865 Pput_0870 Pput_0725
Pput_0573 Pput_1529 Pput_0873 Pput_0450 Pput_1043 Pput_0918 Pput_0392 Pput_0360 Pput_0455 Pput_0715 Pput_0831 Pput_0309 Pput_0350 Pput_0386 Pput_0490 Pput_0891 Pput_0883 Pput_0755
Pput_0574 Pput_1580 Pput_0875 Pput_0461 Pput_1091 Pput_0924 Pput_0422 Pput_0369 Pput_0480 Pput_0775 Pput_1020 Pput_0310 Pput_0361 Pput_0404 Pput_0514 Pput_0925 Pput_0936 Pput_0756
Pput_0633 Pput_1826 Pput_0903 Pput_0474 Pput_1134 Pput_0928 Pput_0546 Pput_0370 Pput_0491 Pput_0826 Pput_1156 Pput_0343 Pput_0372 Pput_0424 Pput_0516 Pput_0984 Pput_1000 Pput_0793
Pput_0656 Pput_2185 Pput_0972 Pput_0479 Pput_1215 Pput_0930 Pput_0560 Pput_0380 Pput_0500 Pput_0988 Pput_1245 Pput_0344 Pput_0385 Pput_0428 Pput_0518 Pput_0985 Pput_1012 Pput_0795
Pput_0674 Pput_2211 Pput_1031 Pput_0499 Pput_1225 Pput_0995 Pput_0592 Pput_0382 Pput_0515 Pput_1065 Pput_1289 Pput_0349 Pput_0435 Pput_0434 Pput_0589 Pput_0999 Pput_1018 Pput_0804
Pput_0675 Pput_3133 Pput_1037 Pput_0505 Pput_1259 Pput_1084 Pput_0593 Pput_0403 Pput_0527 Pput_1165 Pput_1315 Pput_0363 Pput_0438 Pput_0446 Pput_0668 Pput_1099 Pput_1047 Pput_0840
Pput_0681 Pput_3230 Pput_1122 Pput_0513 Pput_1299 Pput_1102 Pput_0594 Pput_0451 Pput_0549 Pput_1239 Pput_1326 Pput_0383 Pput_0439 Pput_0457 Pput_0894 Pput_1188 Pput_1048 Pput_0843
Pput_0709 Pput_3236 Pput_1175 Pput_0521 Pput_1309 Pput_1108 Pput_0647 Pput_0454 Pput_0583 Pput_1324 Pput_1439 Pput_0400 Pput_0441 Pput_0458 Pput_0952 Pput_1205 Pput_1050 Pput_0993
Pput_0728 Pput_3652 Pput_1194 Pput_0525 Pput_1532 Pput_1257 Pput_0655 Pput_0557 Pput_0597 Pput_1440 Pput_1486 Pput_0407 Pput_0443 Pput_0466 Pput_0992 Pput_1211 Pput_1057 Pput_1128
Pput_0749 Pput_3993 Pput_1203 Pput_0579 Pput_1536 Pput_1295 Pput_0726 Pput_0581 Pput_0598 Pput_1461 Pput_1621 Pput_0445 Pput_0460 Pput_0471 Pput_1015 Pput_1252 Pput_1061 Pput_1251
Pput_0813 Pput_4033 Pput_1280 Pput_0595 Pput_1589 Pput_1338 Pput_0777 Pput_0582 Pput_0606 Pput_1551 Pput_1638 Pput_0482 Pput_0465 Pput_0477 Pput_1024 Pput_1253 Pput_1071 Pput_1316
Pput_0864 Pput_4043 Pput_1284 Pput_0604 Pput_1607 Pput_1388 Pput_0890 Pput_0586 Pput_0623 Pput_1599 Pput_1760 Pput_0528 Pput_0467 Pput_0486 Pput_1109 Pput_1260 Pput_1119 Pput_1424
Pput_0877 Pput_4052 Pput_1307 Pput_0612 Pput_1624 Pput_1413 Pput_0921 Pput_0631 Pput_0634 Pput_2217 Pput_1866 Pput_0542 Pput_0470 Pput_0492 Pput_1155 Pput_1313 Pput_1125 Pput_1434
Pput_0919 Pput_4224 Pput_1330 Pput_0703 Pput_1642 Pput_1546 Pput_0938 Pput_0643 Pput_0640 Pput_2331 Pput_2028 Pput_0547 Pput_0535 Pput_0509 Pput_1171 Pput_1395 Pput_1129 Pput_1457
Pput_0922 Pput_4235 Pput_1334 Pput_0721 Pput_1643 Pput_1553 Pput_0974 Pput_0695 Pput_0644 Pput_2581 Pput_2479 Pput_0548 Pput_0536 Pput_0529 Pput_1179 Pput_1419 Pput_1163 Pput_1489
Pput_0956 Pput_4520 Pput_1336 Pput_0762 Pput_1662 Pput_1610 Pput_0976 Pput_0740 Pput_0663 Pput_2659 Pput_2489 Pput_0580 Pput_0545 Pput_0531 Pput_1186 Pput_1476 Pput_1170 Pput_1530
Pput_0960 Pput_4540 Pput_1398 Pput_0824 Pput_1675 Pput_1708 Pput_1010 Pput_0758 Pput_0664 Pput_2871 Pput_2545 Pput_0587 Pput_0550 Pput_0539 Pput_1191 Pput_1482 Pput_1267 Pput_1552
Pput_1035 Pput_4558 Pput_1415 Pput_0825 Pput_1679 Pput_1746 Pput_1011 Pput_0759 Pput_0666 Pput_2874 Pput_2614 Pput_0590 Pput_0552 Pput_0543 Pput_1294 Pput_1483 Pput_1318 Pput_1565
Pput_1038 Pput_4614 Pput_1458 Pput_0879 Pput_1682 Pput_1759 Pput_1017 Pput_0767 Pput_0722 Pput_2877 Pput_2868 Pput_0603 Pput_0561 Pput_0544 Pput_1344 Pput_1487 Pput_1408 Pput_1602
Pput_1076 Pput_4714 Pput_1510 Pput_0880 Pput_1684 Pput_1778 Pput_1034 Pput_0771 Pput_0772 Pput_3122 Pput_3017 Pput_0616 Pput_0584 Pput_0554 Pput_1432 Pput_1583 Pput_1608 Pput_1652
Pput_1079 Pput_4761 Pput_1554 Pput_0990 Pput_1728 Pput_1870 Pput_1051 Pput_0798 Pput_0780 Pput_3124 Pput_3080 Pput_0617 Pput_0585 Pput_0613 Pput_1451 Pput_1650 Pput_1667 Pput_1666
Pput_1110 Pput_4780 Pput_1613 Pput_1001 Pput_1816 Pput_1871 Pput_1060 Pput_0801 Pput_0792 Pput_3165 Pput_3458 Pput_0619 Pput_0632 Pput_0625 Pput_1452 Pput_1661 Pput_1742 Pput_1689
Pput_1112 Pput_4804 Pput_1627 Pput_1002 Pput_1877 Pput_1884 Pput_1062 Pput_0811 Pput_0809 Pput_3237 Pput_3507 Pput_0620 Pput_0637 Pput_0626 Pput_1453 Pput_1678 Pput_1949 Pput_1690
Pput_1114 Pput_4942 Pput_1636 Pput_1022 Pput_1889 Pput_1942 Pput_1113 Pput_0849 Pput_0862 Pput_3256 Pput_3556 Pput_0621 Pput_0723 Pput_0659 Pput_1477 Pput_1711 Pput_2412 Pput_1801
Pput_1142 Pput_4963 Pput_1687 Pput_1123 Pput_1898 Pput_1947 Pput_1148 Pput_0850 Pput_0940 Pput_3440 Pput_3562 Pput_0635 Pput_0754 Pput_0660 Pput_1484 Pput_1713 Pput_2541 Pput_1804
Pput_1173 Pput_4973 Pput_1699 Pput_1139 Pput_1959 Pput_1978 Pput_1150 Pput_0876 Pput_0943 Pput_3542 Pput_3622 Pput_0662 Pput_0757 Pput_0676 Pput_1535 Pput_1714 Pput_2596 Pput_1820
Pput_1178 Pput_5057 Pput_1723 Pput_1164 Pput_1999 Pput_2034 Pput_1206 Pput_0961 Pput_0953 Pput_3590 Pput_3637 Pput_0702 Pput_0761 Pput_0680 Pput_1585 Pput_1749 Pput_2778 Pput_1976
Pput_1195 Pput_5072 Pput_1815 Pput_1213 Pput_2008 Pput_2050 Pput_1217 Pput_0964 Pput_0957 Pput_3627 Pput_3696 Pput_0718 Pput_0763 Pput_0717 Pput_1630 Pput_1784 Pput_3442 Pput_1995
Pput_1212 Pput_5087 Pput_1822 Pput_1216 Pput_2016 Pput_2053 Pput_1221 Pput_0991 Pput_0978 Pput_3765 Pput_3735 Pput_0738 Pput_0768 Pput_0724 Pput_1663 Pput_1800 Pput_3468 Pput_2091
Pput_1271 Pput_5103 Pput_1823 Pput_1233 Pput_2017 Pput_2054 Pput_1254 Pput_0997 Pput_1097 Pput_3767 Pput_3805 Pput_0746 Pput_0774 Pput_0730 Pput_1718 Pput_1909 Pput_3574 Pput_2594
Pput_1293 Pput_5212 Pput_1831 Pput_1298 Pput_2018 Pput_2055 Pput_1266 Pput_1003 Pput_1104 Pput_3847 Pput_3837 Pput_0760 Pput_0791 Pput_0765 Pput_1745 Pput_1955 Pput_3808 Pput_2764
Pput_1322 Pput_5228 Pput_1845 Pput_1410 Pput_2021 Pput_2058 Pput_1281 Pput_1101 Pput_1126 Pput_3903 Pput_3838 Pput_0770 Pput_0799 Pput_0786 Pput_1802 Pput_1989 Pput_3945 Pput_2765
Pput_1327 Pput_5296 Pput_1858 Pput_1444 Pput_2244 Pput_2144 Pput_1288 Pput_1115 Pput_1137 Pput_3904 Pput_3868 Pput_0779 Pput_0810 Pput_0817 Pput_1825 Pput_2287 Pput_3949 Pput_3324
Pput_1348 Pput_1859 Pput_1471 Pput_2393 Pput_2149 Pput_1290 Pput_1116 Pput_1157 Pput_3908 Pput_3985 Pput_0790 Pput_0868 Pput_0835 Pput_1950 Pput_2559 Pput_4018 Pput_3465
Pput_1382 Pput_1943 Pput_1472 Pput_2418 Pput_2150 Pput_1300 Pput_1147 Pput_1169 Pput_3926 Pput_4075 Pput_0815 Pput_0872 Pput_0848 Pput_1963 Pput_2590 Pput_4047 Pput_3550
Pput_1414 Pput_1957 Pput_1496 Pput_2419 Pput_2216 Pput_1319 Pput_1152 Pput_1222 Pput_3930 Pput_4229 Pput_0869 Pput_0884 Pput_0942 Pput_2002 Pput_2752 Pput_4053 Pput_3603
Pput_1423 Pput_2070 Pput_1509 Pput_2501 Pput_2223 Pput_1333 Pput_1154 Pput_1268 Pput_3943 Pput_4230 Pput_0871 Pput_0886 Pput_0946 Pput_2061 Pput_2755 Pput_4199 Pput_3605
Pput_1430 Pput_2157 Pput_1524 Pput_2547 Pput_2275 Pput_1341 Pput_1172 Pput_1302 Pput_3998 Pput_4233 Pput_0882 Pput_0887 Pput_0958 Pput_2113 Pput_2813 Pput_4287 Pput_3769
Pput_1503 Pput_2249 Pput_1531 Pput_2627 Pput_2371 Pput_1396 Pput_1177 Pput_1306 Pput_4175 Pput_4334 Pput_0888 Pput_0902 Pput_0987 Pput_2205 Pput_3089 Pput_4362 Pput_3770
Pput_1527 Pput_2269 Pput_1577 Pput_2731 Pput_2385 Pput_1406 Pput_1196 Pput_1405 Pput_4289 Pput_4375 Pput_0889 Pput_0927 Pput_0989 Pput_2242 Pput_3109 Pput_4378 Pput_3773
Pput_1628 Pput_2279 Pput_1620 Pput_2779 Pput_2405 Pput_1425 Pput_1198 Pput_1428 Pput_4320 Pput_4415 Pput_0954 Pput_0932 Pput_1013 Pput_2311 Pput_3142 Pput_4592 Pput_3774
Pput_1639 Pput_2303 Pput_1631 Pput_2790 Pput_2406 Pput_1454 Pput_1238 Pput_1435 Pput_4407 Pput_4433 Pput_0979 Pput_0941 Pput_1014 Pput_2329 Pput_3144 Pput_4640 Pput_3901
Pput_1688 Pput_2332 Pput_1640 Pput_2797 Pput_2407 Pput_1460 Pput_1243 Pput_1437 Pput_4425 Pput_4501 Pput_0981 Pput_0948 Pput_1053 Pput_2348 Pput_3146 Pput_4768 Pput_3934
Pput_1732 Pput_2391 Pput_1649 Pput_2798 Pput_2513 Pput_1488 Pput_1310 Pput_1438 Pput_4461 Pput_4579 Pput_1004 Pput_0970 Pput_1056 Pput_2527 Pput_3151 Pput_4833 Pput_3935
Pput_1757 Pput_2396 Pput_1659 Pput_2806 Pput_2519 Pput_1526 Pput_1312 Pput_1442 Pput_4480 Pput_4661 Pput_1025 Pput_0971 Pput_1075 Pput_2558 Pput_3183 Pput_4849 Pput_3942
Pput_1840 Pput_2397 Pput_1676 Pput_2819 Pput_2577 Pput_1549 Pput_1347 Pput_1450 Pput_4648 Pput_4684 Pput_1049 Pput_0973 Pput_1180 Pput_2580 Pput_3197 Pput_4867 Pput_4079
Pput_1868 Pput_2399 Pput_1677 Pput_2844 Pput_2578 Pput_1574 Pput_1370 Pput_1479 Pput_4741 Pput_4737 Pput_1059 Pput_0977 Pput_1226 Pput_2585 Pput_3325 Pput_4958 Pput_4170
Pput_1872 Pput_2443 Pput_1680 Pput_2971 Pput_2691 Pput_1592 Pput_1389 Pput_1485 Pput_4871 Pput_4874 Pput_1111 Pput_0980 Pput_1228 Pput_2763 Pput_3353 Pput_4984 Pput_4187
Pput_1910 Pput_2574 Pput_1700 Pput_2974 Pput_2857 Pput_1654 Pput_1390 Pput_1571 Pput_4899 Pput_4895 Pput_1121 Pput_0982 Pput_1230 Pput_2881 Pput_3357 Pput_5056 Pput_4236
Pput_1930 Pput_2602 Pput_1720 Pput_2994 Pput_2872 Pput_1655 Pput_1392 Pput_1587 Pput_4909 Pput_4944 Pput_1140 Pput_0996 Pput_1236 Pput_2883 Pput_3451 Pput_5114 Pput_4277
Pput_1983 Pput_2636 Pput_1750 Pput_3024 Pput_3039 Pput_1695 Pput_1397 Pput_1593 Pput_5140 Pput_5006 Pput_1162 Pput_1005 Pput_1246 Pput_3222 Pput_3473 Pput_5123 Pput_4291
Pput_1998 Pput_2645 Pput_1789 Pput_3065 Pput_3054 Pput_1719 Pput_1416 Pput_1653 Pput_5181 Pput_1167 Pput_1006 Pput_1250 Pput_3223 Pput_3536 Pput_5198 Pput_4434
Pput_2052 Pput_2684 Pput_1798 Pput_3066 Pput_3123 Pput_1754 Pput_1433 Pput_1665 Pput_5202 Pput_1247 Pput_1023 Pput_1265 Pput_3320 Pput_3653 Pput_5244 Pput_4462
Pput_2074 Pput_2702 Pput_1882 Pput_3068 Pput_3125 Pput_1829 Pput_1446 Pput_1686 Pput_5204 Pput_1255 Pput_1036 Pput_1278 Pput_3467 Pput_3721 Pput_4497
Pput_2083 Pput_2712 Pput_1911 Pput_3084 Pput_3238 Pput_1979 Pput_1494 Pput_1744 Pput_5247 Pput_1262 Pput_1067 Pput_1279 Pput_3552 Pput_3841 Pput_4498
Pput_2104 Pput_2727 Pput_1928 Pput_3178 Pput_3334 Pput_2000 Pput_1500 Pput_1806 Pput_1308 Pput_1072 Pput_1314 Pput_3579 Pput_3892 Pput_4544
Pput_2131 Pput_2784 Pput_1938 Pput_3326 Pput_3367 Pput_2003 Pput_1544 Pput_1808 Pput_1335 Pput_1073 Pput_1325 Pput_3660 Pput_3897 Pput_4612
Pput_2170 Pput_2818 Pput_1973 Pput_3348 Pput_3453 Pput_2004 Pput_1582 Pput_1913 Pput_1340 Pput_1077 Pput_1391 Pput_3802 Pput_3923 Pput_4678
Pput_2214 Pput_2889 Pput_2037 Pput_3527 Pput_3517 Pput_2013 Pput_1590 Pput_1935 Pput_1350 Pput_1078 Pput_1412 Pput_3822 Pput_3925 Pput_4697
Pput_2230 Pput_2890 Pput_2043 Pput_3538 Pput_3576 Pput_2039 Pput_1601 Pput_1952 Pput_1403 Pput_1107 Pput_1429 Pput_3865 Pput_4258 Pput_4698
Pput_2248 Pput_2891 Pput_2072 Pput_3594 Pput_3723 Pput_2042 Pput_1703 Pput_2005 Pput_1480 Pput_1120 Pput_1443 Pput_3928 Pput_4293 Pput_4856
Pput_2264 Pput_2893 Pput_2073 Pput_3644 Pput_3777 Pput_2044 Pput_1741 Pput_2067 Pput_1501 Pput_1127 Pput_1467 Pput_3951 Pput_4338 Pput_4872
Pput_2394 Pput_2895 Pput_2094 Pput_3646 Pput_3831 Pput_2085 Pput_1748 Pput_2257 Pput_1525 Pput_1133 Pput_1475 Pput_3953 Pput_4365 Pput_4900
Pput_2471 Pput_2896 Pput_2095 Pput_3655 Pput_3834 Pput_2110 Pput_1774 Pput_2258 Pput_1548 Pput_1138 Pput_1491 Pput_3959 Pput_4416 Pput_4907
Pput_2493 Pput_2897 Pput_2151 Pput_3717 Pput_4207 Pput_2112 Pput_1775 Pput_2341 Pput_1603 Pput_1144 Pput_1498 Pput_3997 Pput_4450 Pput_4920
Pput_2526 Pput_2900 Pput_2197 Pput_3718 Pput_4268 Pput_2140 Pput_1791 Pput_2388 Pput_1612 Pput_1209 Pput_1499 Pput_4000 Pput_4547 Pput_4929
Pput_2546 Pput_2901 Pput_2219 Pput_3726 Pput_4303 Pput_2143 Pput_1792 Pput_2537 Pput_1656 Pput_1210 Pput_1504 Pput_4152 Pput_4569 Pput_5062
Pput_2607 Pput_2903 Pput_2224 Pput_3797 Pput_4321 Pput_2173 Pput_1796 Pput_2555 Pput_1674 Pput_1234 Pput_1528 Pput_4174 Pput_4599 Pput_5067
Pput_2687 Pput_2904 Pput_2274 Pput_3807 Pput_4336 Pput_2207 Pput_1834 Pput_2573 Pput_1691 Pput_1242 Pput_1547 Pput_4178 Pput_4605 Pput_5210
Pput_2705 Pput_2905 Pput_2280 Pput_3816 Pput_4340 Pput_2220 Pput_1886 Pput_2589 Pput_1693 Pput_1248 Pput_1559 Pput_4208 Pput_4685 Pput_5223
Pput_2724 Pput_2906 Pput_2319 Pput_3909 Pput_4342 Pput_2221 Pput_1907 Pput_2653 Pput_1694 Pput_1297 Pput_1570 Pput_4226 Pput_4743 Pput_5295
Pput_2816 Pput_2952 Pput_2320 Pput_3920 Pput_4343 Pput_2222 Pput_1934 Pput_2774 Pput_1697 Pput_1337 Pput_1581 Pput_4231 Pput_4859 Pput_5297
Pput_2894 Pput_3040 Pput_2352 Pput_3958 Pput_4344 Pput_2228 Pput_2015 Pput_2787 Pput_1712 Pput_1339 Pput_1600 Pput_4243 Pput_4862
Pput_2950 Pput_3052 Pput_2401 Pput_3991 Pput_4346 Pput_2236 Pput_2084 Pput_3083 Pput_1727 Pput_1345 Pput_1604 Pput_4245 Pput_4926
Pput_2960 Pput_3117 Pput_2420 Pput_4054 Pput_4396 Pput_2239 Pput_2141 Pput_3132 Pput_1765 Pput_1351 Pput_1609 Pput_4259 Pput_4952
Pput_3002 Pput_3143 Pput_2622 Pput_4209 Pput_4422 Pput_2268 Pput_2182 Pput_3225 Pput_1783 Pput_1366 Pput_1615 Pput_4278 Pput_4972
Pput_3011 Pput_3207 Pput_2623 Pput_4256 Pput_4427 Pput_2270 Pput_2227 Pput_3228 Pput_1785 Pput_1378 Pput_1617 Pput_4309 Pput_5105
Pput_3038 Pput_3226 Pput_2631 Pput_4275 Pput_4428 Pput_2304 Pput_2323 Pput_3319 Pput_1788 Pput_1436 Pput_1622 Pput_4395 Pput_5119
Pput_3071 Pput_3231 Pput_2649 Pput_4281 Pput_4435 Pput_2322 Pput_2334 Pput_3439 Pput_1790 Pput_1441 Pput_1632 Pput_4399 Pput_5196
Pput_3119 Pput_3262 Pput_2651 Pput_4318 Pput_4478 Pput_2328 Pput_2347 Pput_3460 Pput_1797 Pput_1455 Pput_1651 Pput_4405 Pput_5234
Pput_3152 Pput_3273 Pput_2665 Pput_4393 Pput_4553 Pput_2335 Pput_2444 Pput_3462 Pput_1809 Pput_1462 Pput_1668 Pput_4412 Pput_5282
Pput_3160 Pput_3309 Pput_2722 Pput_4402 Pput_4757 Pput_2337 Pput_2560 Pput_3489 Pput_1819 Pput_1481 Pput_1669 Pput_4479
Pput_3330 Pput_3317 Pput_2725 Pput_4440 Pput_4868 Pput_2343 Pput_2588 Pput_3553 Pput_1828 Pput_1508 Pput_1743 Pput_4481
Pput_3393 Pput_3349 Pput_2803 Pput_4482 Pput_4883 Pput_2356 Pput_2671 Pput_3585 Pput_1835 Pput_1533 Pput_1772 Pput_4518
Pput_3428 Pput_3445 Pput_2810 Pput_4541 Pput_4910 Pput_2359 Pput_2786 Pput_3597 Pput_1885 Pput_1591 Pput_1821 Pput_4576
Pput_3444 Pput_3463 Pput_2814 Pput_4551 Pput_4933 Pput_2389 Pput_2828 Pput_3606 Pput_1891 Pput_1594 Pput_1830 Pput_4577
Pput_3448 Pput_3491 Pput_2839 Pput_4560 Pput_5011 Pput_2392 Pput_3070 Pput_3624 Pput_1936 Pput_1619 Pput_1838 Pput_4578
Pput_3486 Pput_3584 Pput_2887 Pput_4580 Pput_5013 Pput_2429 Pput_3163 Pput_3642 Pput_1991 Pput_1660 Pput_1844 Pput_4589
Pput_3488 Pput_3602 Pput_2888 Pput_4674 Pput_5068 Pput_2539 Pput_3191 Pput_3643 Pput_2009 Pput_1664 Pput_1846 Pput_4597
Pput_3548 Pput_3604 Pput_2892 Pput_4680 Pput_5080 Pput_2544 Pput_3195 Pput_3706 Pput_2010 Pput_1696 Pput_1852 Pput_4615
Pput_3611 Pput_3634 Pput_2898 Pput_4683 Pput_5121 Pput_2562 Pput_3235 Pput_3768 Pput_2025 Pput_1698 Pput_1932 Pput_4669
Pput_3629 Pput_3688 Pput_2899 Pput_4719 Pput_5174 Pput_2563 Pput_3246 Pput_3796 Pput_2032 Pput_1704 Pput_1948 Pput_4759
Pput_3689 Pput_3731 Pput_2902 Pput_4779 Pput_5250 Pput_2568 Pput_3292 Pput_3806 Pput_2065 Pput_1715 Pput_1958 Pput_4760
Pput_3743 Pput_3775 Pput_2968 Pput_4828 Pput_2586 Pput_3345 Pput_3844 Pput_2079 Pput_1721 Pput_1996 Pput_4769
Pput_3745 Pput_3792 Pput_3041 Pput_4919 Pput_2587 Pput_3432 Pput_3857 Pput_2080 Pput_1725 Pput_1997 Pput_4807
Pput_3827 Pput_3823 Pput_3042 Pput_4922 Pput_2591 Pput_3449 Pput_3867 Pput_2081 Pput_1739 Pput_2082 Pput_4815
Pput_3840 Pput_3842 Pput_3048 Pput_4923 Pput_2660 Pput_3528 Pput_3895 Pput_2189 Pput_1753 Pput_2093 Pput_4840
Pput_3855 Pput_3894 Pput_3058 Pput_4925 Pput_2679 Pput_3541 Pput_3905 Pput_2193 Pput_1766 Pput_2097 Pput_4850
Pput_3861 Pput_3984 Pput_3116 Pput_4957 Pput_2686 Pput_3554 Pput_3950 Pput_2229 Pput_1776 Pput_2155 Pput_4853
Pput_3992 Pput_3987 Pput_3118 Pput_5073 Pput_2698 Pput_3598 Pput_4050 Pput_2234 Pput_1777 Pput_2164 Pput_4913
Pput_4089 Pput_4180 Pput_3121 Pput_5215 Pput_2703 Pput_3610 Pput_4062 Pput_2243 Pput_1795 Pput_2179 Pput_4918
Pput_4198 Pput_4201 Pput_3215 Pput_5276 Pput_2711 Pput_3617 Pput_4158 Pput_2247 Pput_1817 Pput_2186 Pput_4949
Pput_4242 Pput_4204 Pput_3227 Pput_2713 Pput_3618 Pput_4173 Pput_2321 Pput_1818 Pput_2212 Pput_4962
Pput_4247 Pput_4219 Pput_3229 Pput_2723 Pput_3641 Pput_4189 Pput_2349 Pput_1833 Pput_2278 Pput_4994
Pput_4254 Pput_4361 Pput_3250 Pput_2735 Pput_3734 Pput_4195 Pput_2358 Pput_1836 Pput_2301 Pput_5082
Pput_4255 Pput_4411 Pput_3274 Pput_2770 Pput_3764 Pput_4197 Pput_2378 Pput_1956 Pput_2318 Pput_5099
Pput_4274 Pput_4476 Pput_3308 Pput_2773 Pput_3789 Pput_4203 Pput_2425 Pput_2041 Pput_2345 Pput_5214
Pput_4406 Pput_4488 Pput_3314 Pput_2783 Pput_3798 Pput_4215 Pput_2473 Pput_2087 Pput_2346 Pput_5218
Pput_4438 Pput_4489 Pput_3340 Pput_2800 Pput_3811 Pput_4227 Pput_2530 Pput_2111 Pput_2375 Pput_5291
Pput_4449 Pput_4530 Pput_3351 Pput_2801 Pput_3851 Pput_4240 Pput_2542 Pput_2181 Pput_2376
Pput_4464 Pput_4531 Pput_3414 Pput_2809 Pput_3884 Pput_4246 Pput_2564 Pput_2307 Pput_2377
Pput_4483 Pput_4535 Pput_3466 Pput_2822 Pput_3929 Pput_4250 Pput_2566 Pput_2524 Pput_2379

20
Group A Group B Group C Group D Group E Group F Group G Group H Group I Group J Group K Group L Group M Group N Group O Group P Group Q Group R Group S Group T
Pput_4549 Pput_4563 Pput_3534 Pput_2856 Pput_3938 Pput_4288 Pput_2567 Pput_2531 Pput_2380
Pput_4555 Pput_4574 Pput_3547 Pput_2862 Pput_3969 Pput_4290 Pput_2575 Pput_2557 Pput_2382
Pput_4572 Pput_4586 Pput_3555 Pput_3009 Pput_3976 Pput_4292 Pput_2579 Pput_2576 Pput_2400
Pput_4600 Pput_4635 Pput_3586 Pput_3014 Pput_3989 Pput_4298 Pput_2710 Pput_2634 Pput_2410
Pput_4601 Pput_4729 Pput_3680 Pput_3073 Pput_4030 Pput_4389 Pput_2751 Pput_2760 Pput_2450
Pput_4603 Pput_4734 Pput_3703 Pput_3079 Pput_4068 Pput_4404 Pput_2758 Pput_2762 Pput_2460
Pput_4657 Pput_4745 Pput_3716 Pput_3090 Pput_4155 Pput_4424 Pput_2775 Pput_2767 Pput_2470
Pput_4668 Pput_4789 Pput_3758 Pput_3101 Pput_4171 Pput_4477 Pput_2799 Pput_2836 Pput_2507
Pput_4677 Pput_4811 Pput_3799 Pput_3128 Pput_4182 Pput_4504 Pput_2808 Pput_2838 Pput_2514
Pput_4706 Pput_4870 Pput_3803 Pput_3176 Pput_4220 Pput_4516 Pput_2824 Pput_2866 Pput_2525
Pput_4767 Pput_4880 Pput_3813 Pput_3181 Pput_4225 Pput_4556 Pput_2863 Pput_2873 Pput_2571
Pput_4770 Pput_4903 Pput_3815 Pput_3184 Pput_4251 Pput_4562 Pput_2867 Pput_2875 Pput_2593
Pput_4818 Pput_5012 Pput_3832 Pput_3194 Pput_4262 Pput_4567 Pput_2869 Pput_2876 Pput_2595
Pput_4898 Pput_5063 Pput_3882 Pput_3200 Pput_4264 Pput_4575 Pput_2880 Pput_2878 Pput_2652
Pput_4940 Pput_5108 Pput_3936 Pput_3202 Pput_4285 Pput_4591 Pput_2882 Pput_2879 Pput_2733
Pput_4961 Pput_5110 Pput_3963 Pput_3245 Pput_4308 Pput_4611 Pput_2908 Pput_3102 Pput_2745
Pput_5020 Pput_5134 Pput_4002 Pput_3252 Pput_4322 Pput_4637 Pput_3013 Pput_3134 Pput_2746
Pput_5064 Pput_5144 Pput_4007 Pput_3255 Pput_4339 Pput_4641 Pput_3062 Pput_3139 Pput_2788
Pput_5095 Pput_5178 Pput_4036 Pput_3258 Pput_4366 Pput_4749 Pput_3138 Pput_3145 Pput_2820
Pput_5124 Pput_5189 Pput_4202 Pput_3263 Pput_4421 Pput_4764 Pput_3161 Pput_3170 Pput_2864
Pput_5132 Pput_5201 Pput_4272 Pput_3270 Pput_4430 Pput_4765 Pput_3164 Pput_3220 Pput_3088
Pput_5141 Pput_5237 Pput_4364 Pput_3271 Pput_4455 Pput_4792 Pput_3172 Pput_3221 Pput_3108
Pput_5143 Pput_4371 Pput_3285 Pput_4493 Pput_4805 Pput_3177 Pput_3233 Pput_3126
Pput_5165 Pput_4409 Pput_3300 Pput_4536 Pput_4817 Pput_3187 Pput_3244 Pput_3193
Pput_5171 Pput_4431 Pput_3302 Pput_4537 Pput_4875 Pput_3189 Pput_3431 Pput_3224
Pput_5208 Pput_4432 Pput_3305 Pput_4538 Pput_4894 Pput_3217 Pput_3443 Pput_3232
Pput_5222 Pput_4494 Pput_3318 Pput_4585 Pput_4902 Pput_3259 Pput_3446 Pput_3260
Pput_5227 Pput_4495 Pput_3346 Pput_4620 Pput_4904 Pput_3327 Pput_3469 Pput_3277
Pput_5253 Pput_4533 Pput_3352 Pput_4655 Pput_4906 Pput_3331 Pput_3478 Pput_3299
Pput_5299 Pput_4588 Pput_3400 Pput_4750 Pput_4970 Pput_3339 Pput_3523 Pput_3315
Pput_5300 Pput_4645 Pput_3433 Pput_4766 Pput_4976 Pput_3341 Pput_3577 Pput_3316
Pput_4662 Pput_3434 Pput_4773 Pput_4983 Pput_3398 Pput_3578 Pput_3399
Pput_4701 Pput_3435 Pput_4774 Pput_5002 Pput_3452 Pput_3582 Pput_3438
Pput_4704 Pput_3436 Pput_4786 Pput_5061 Pput_3461 Pput_3587 Pput_3441
Pput_4758 Pput_3437 Pput_4799 Pput_5081 Pput_3464 Pput_3591 Pput_3454
Pput_4865 Pput_3447 Pput_4812 Pput_5094 Pput_3472 Pput_3593 Pput_3459
Pput_4876 Pput_3477 Pput_4825 Pput_5101 Pput_3502 Pput_3596 Pput_3470
Pput_4884 Pput_3484 Pput_4834 Pput_5111 Pput_3508 Pput_3599 Pput_3481
Pput_4889 Pput_3506 Pput_4858 Pput_5122 Pput_3521 Pput_3609 Pput_3493
Pput_4890 Pput_3525 Pput_4863 Pput_5173 Pput_3522 Pput_3612 Pput_3532
Pput_4924 Pput_3546 Pput_4864 Pput_5175 Pput_3524 Pput_3619 Pput_3539
Pput_4927 Pput_3561 Pput_4877 Pput_5200 Pput_3658 Pput_3628 Pput_3549
Pput_4960 Pput_3589 Pput_4885 Pput_5209 Pput_3659 Pput_3645 Pput_3608
Pput_4993 Pput_3677 Pput_4887 Pput_5220 Pput_3669 Pput_3651 Pput_3615
Pput_5032 Pput_3686 Pput_4935 Pput_5240 Pput_3710 Pput_3724 Pput_3620
Pput_5097 Pput_3693 Pput_4996 Pput_5255 Pput_3714 Pput_3725 Pput_3640
Pput_5145 Pput_3711 Pput_5001 Pput_5288 Pput_3715 Pput_3761 Pput_3656
Pput_5191 Pput_3732 Pput_5075 Pput_5293 Pput_3730 Pput_3771 Pput_3729
Pput_5197 Pput_3740 Pput_5125 Pput_5294 Pput_3738 Pput_3772 Pput_3794
Pput_5213 Pput_3742 Pput_5193 Pput_5298 Pput_3751 Pput_3776 Pput_3804
Pput_5216 Pput_3757 Pput_5195 Pput_5303 Pput_3752 Pput_3783 Pput_3821
Pput_5229 Pput_3759 Pput_5203 Pput_5308 Pput_3756 Pput_3784 Pput_3856
Pput_5241 Pput_3763 Pput_5249 Pput_5309 Pput_3760 Pput_3787 Pput_3858
Pput_3766 Pput_5256 Pput_3780 Pput_3795 Pput_3957
Pput_3814 Pput_5261 Pput_3786 Pput_3800 Pput_3978
Pput_3820 Pput_5274 Pput_3790 Pput_3801 Pput_3986
Pput_3878 Pput_5279 Pput_3793 Pput_3809 Pput_4005
Pput_3887 Pput_5304 Pput_3810 Pput_3812 Pput_4016
Pput_3948 Pput_5305 Pput_3839 Pput_3843 Pput_4055
Pput_3977 Pput_3845 Pput_3849 Pput_4060
Pput_3981 Pput_3860 Pput_3872 Pput_4069
Pput_4004 Pput_3880 Pput_3896 Pput_4071
Pput_4013 Pput_3885 Pput_3922 Pput_4072
Pput_4031 Pput_3888 Pput_3933 Pput_4076
Pput_4040 Pput_3890 Pput_3946 Pput_4091
Pput_4067 Pput_3944 Pput_3947 Pput_4153
Pput_4084 Pput_3962 Pput_3955 Pput_4163
Pput_4154 Pput_3982 Pput_3988 Pput_4165
Pput_4159 Pput_4006 Pput_3994 Pput_4177
Pput_4200 Pput_4026 Pput_3999 Pput_4183
Pput_4232 Pput_4063 Pput_4023 Pput_4185
Pput_4299 Pput_4064 Pput_4073 Pput_4186
Pput_4300 Pput_4080 Pput_4086 Pput_4193
Pput_4302 Pput_4082 Pput_4161 Pput_4216
Pput_4317 Pput_4088 Pput_4167 Pput_4218
Pput_4328 Pput_4131 Pput_4176 Pput_4221
Pput_4331 Pput_4156 Pput_4184 Pput_4252
Pput_4332 Pput_4157 Pput_4188 Pput_4276
Pput_4373 Pput_4160 Pput_4194 Pput_4297
Pput_4417 Pput_4166 Pput_4228 Pput_4325
Pput_4429 Pput_4212 Pput_4237 Pput_4333
Pput_4496 Pput_4217 Pput_4257 Pput_4350
Pput_4517 Pput_4222 Pput_4294 Pput_4353
Pput_4522 Pput_4223 Pput_4295 Pput_4357
Pput_4534 Pput_4234 Pput_4301 Pput_4363
Pput_4564 Pput_4260 Pput_4348 Pput_4372
Pput_4602 Pput_4267 Pput_4351 Pput_4394
Pput_4644 Pput_4337 Pput_4352 Pput_4401
Pput_4670 Pput_4354 Pput_4377 Pput_4436
Pput_4675 Pput_4356 Pput_4379 Pput_4506
Pput_4676 Pput_4374 Pput_4381 Pput_4510
Pput_4689 Pput_4376 Pput_4383 Pput_4542
Pput_4708 Pput_4382 Pput_4385 Pput_4550
Pput_4710 Pput_4387 Pput_4386 Pput_4557
Pput_4724 Pput_4398 Pput_4391 Pput_4593
Pput_4746 Pput_4410 Pput_4392 Pput_4618
Pput_4796 Pput_4423 Pput_4408 Pput_4621
Pput_4800 Pput_4451 Pput_4413 Pput_4623
Pput_4821 Pput_4507 Pput_4414 Pput_4639
Pput_4829 Pput_4508 Pput_4503 Pput_4643
Pput_4845 Pput_4546 Pput_4519 Pput_4651
Pput_4848 Pput_4584 Pput_4532 Pput_4671
Pput_4878 Pput_4596 Pput_4543 Pput_4693
Pput_4886 Pput_4634 Pput_4548 Pput_4705
Pput_4888 Pput_4652 Pput_4561 Pput_4712
Pput_4893 Pput_4656 Pput_4565 Pput_4716
Pput_4911 Pput_4658 Pput_4566 Pput_4717
Pput_4943 Pput_4663 Pput_4573 Pput_4735
Pput_4959 Pput_4665 Pput_4581 Pput_4748
Pput_4982 Pput_4673 Pput_4582 Pput_4754
Pput_5051 Pput_4682 Pput_4583 Pput_4755
Pput_5131 Pput_4686 Pput_4590 Pput_4776
Pput_5155 Pput_4725 Pput_4636 Pput_4781
Pput_5159 Pput_4738 Pput_4659 Pput_4798
Pput_5167 Pput_4771 Pput_4660 Pput_4826
Pput_5170 Pput_4775 Pput_4664 Pput_4836
Pput_5188 Pput_4782 Pput_4694 Pput_4842
Pput_5254 Pput_4787 Pput_4726 Pput_4854
Pput_5265 Pput_4790 Pput_4740 Pput_4866
Pput_5272 Pput_4793 Pput_4747 Pput_4881
Pput_5275 Pput_4795 Pput_4772 Pput_4891
Pput_5306 Pput_4803 Pput_4778 Pput_4928
Pput_4806 Pput_4783 Pput_4930
Pput_4814 Pput_4784 Pput_4947
Pput_4822 Pput_4785 Pput_4948
Pput_4861 Pput_4788 Pput_4974
Pput_4879 Pput_4791 Pput_5000
Pput_4896 Pput_4809 Pput_5024
Pput_4915 Pput_4810 Pput_5037
Pput_4937 Pput_4816 Pput_5059
Pput_4941 Pput_4819 Pput_5060
Pput_4967 Pput_4823 Pput_5078
Pput_4977 Pput_4837 Pput_5088

21
Group A Group B Group C Group D Group E Group F Group G Group H Group I Group J Group K Group L Group M Group N Group O Group P Group Q Group R Group S Group T
Pput_4980 Pput_4838 Pput_5100
Pput_4985 Pput_4873 Pput_5129
Pput_4986 Pput_4908 Pput_5130
Pput_4987 Pput_4914 Pput_5158
Pput_4997 Pput_4931 Pput_5177
Pput_4999 Pput_4936 Pput_5232
Pput_5026 Pput_4950 Pput_5292
Pput_5043 Pput_4951 Pput_5311
Pput_5052 Pput_4968
Pput_5053 Pput_4971
Pput_5089 Pput_4992
Pput_5090 Pput_5007
Pput_5092 Pput_5016
Pput_5106 Pput_5054
Pput_5107 Pput_5071
Pput_5126 Pput_5086
Pput_5137 Pput_5093
Pput_5138 Pput_5104
Pput_5162 Pput_5136
Pput_5168 Pput_5180
Pput_5169 Pput_5192
Pput_5179 Pput_5199
Pput_5183 Pput_5211
Pput_5219 Pput_5246
Pput_5233 Pput_5258
Pput_5243 Pput_5264
Pput_5259
Pput_5260
Pput_5273
Pput_5278

22
Fig.2.1 Genetic map of sep, tod, cmt, and cym operons in aromatics degradation island (AGI) on
the chromosome in P. putida F1. The arrowheads represent the directions of transcription.

23
Fig. 2.2 The metabolic pathway of toluene, ethylbenzene, benzene, and p-cymene in P. putida
F1. The number in parentheses indicates a reaction step and a key enzyme: (1) toluene
dioxygenase (EC:1.14.12.11), (2) cis-benzene glycol dehydrogenase (EC:1.3.1.19), (3) catechol
2,3-dioxygenase (EC:1.13.11.2), (4) 2-hydroxy-6-oxohepta-2,4-dienoate hydrolase (EC:3.7.1.9),
(5) 2-keto-4-pentenoate hydratase (EC:4.2.1.80), (6) 4-hydroxy 2-oxovalerate aldolase
(EC:4.1.3.39), (7) acetaldehyde dehydrogenase (EC:1.2.1.10), (8) catechol 1,2-dioxygenase
(EC:1.13.11.1), (9) muconate cycloisomerase (EC:5.5.1.1), (10) muconolactone isomerase
(EC:5.3.3.4), (11) 3-oxoadipate enol-lactonase (EC:3.1.1.24), (12) 3-oxoacid CoA-transferase
(EC:2.8.3.6), (13) β-ketoadipyl CoA thiolase (EC:2.3.1.174, EC:2.3.1.16), (14) acetyl-CoA
synthetase (EC:6.2.1.1), (15) propionyl-CoA synthetase (EC:6.2.1.17), (16) methylcitrate
synthase (EC:2.3.3.5), (17) 2-methylcitrate dehydratase (EC:4.2.1.79), (18) 2-methylisocitrate

24
dehydratase (EC:4.2.1.99), (19) 2-methylisocitrate lyase (EC:4.1.3.30), (20) p-cymene
monooxygenase (EC:1.14.13.-), (21) p-cumic alcohol dehydrogenase (EC:1.1.1.90), (22)
p-cumic aldehyde dehydrogenase (EC:1.2.1.29), (23) p-cumate 2,3-dioxygenase (EC:1.13.11.-),
(24) 2,3-dihydroxy-2,3-dihydro-p-cumate dehydrogenase (EC:1.3.1.58), (25)
2,3-dihydroxy-p-cumate-3,4-dioxygenase (EC:1.13.11.-), (26) 2-hydroxy-3-carboxy-muconic
semialdehyde decarboxylase (EC:4.1.1.-), and (27) 2-hydroxy-6-oxo-7-methylocta-2,4-dienoate
hydrolase hydrolase (EC:3.7.1.-).

25
Fig. 2.3 SDS-PAGE of proteins of P. putida F1 cells grown with glucose (G), toluene (T),
ethylbenzene (E), benzene (B), p-cymene (Cy) and p-cumate (Cu). Gels were cut into 52-68
slices for in-gel digestion.

26
Fig. 2.4 Protein content values of cellular proteins in the culture with glucose, toluene,
ethylbenzene, benzene, p-cymene, and p-cumate. The aromatics degradation island (ADI).
Arrows indicate the direction of transcription. The numbers in parentheses indicate a reaction
step in Fig. 2.2.

27
Fig. 2.5 Protein content values of cellular proteins in the culture with glucose, toluene,
ethylbenzene, benzene, p-cymene, and p-cumate. The 2-methylcitrate cycle and 3-oxoadipate
pathway. Arrows indicate the direction of transcription. The numbers in parentheses indicate a
reaction step in Fig. 2.2.

28
Fig. 2.6 The metabolic pathway of toluene, ethylbenzene, benzene and p-cymene in P. putida F1.
The metabolites and enzymes responsible for pathways are indicated. Identified proteins in this
study are highlighted with bold letters.
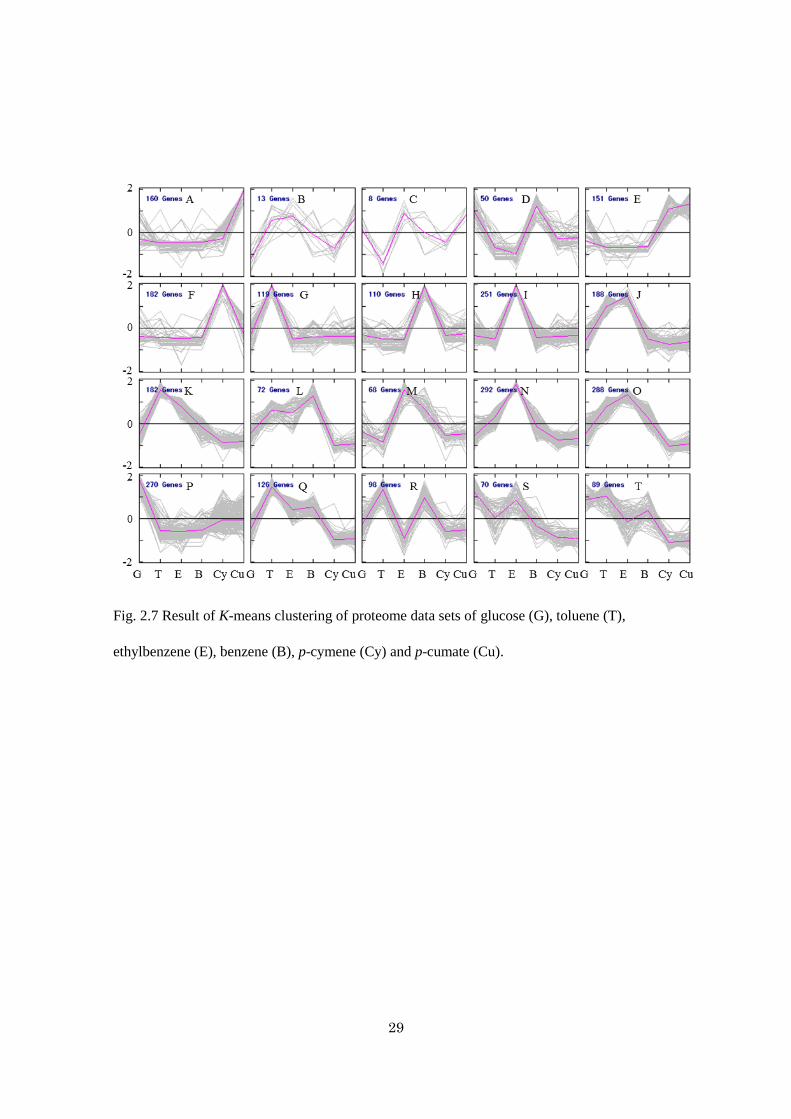
29
Fig. 2.7 Result of K-means clustering of proteome data sets of glucose (G), toluene (T),
ethylbenzene (E), benzene (B), p-cymene (Cy) and p-cumate (Cu).
30
Chapter 3
Gene expression profiling of Pseudomonas putida F1 after exposure to
aromatic hydrocarbon in soil by using proteome analysis

31
3.1 Introduction
Metabolic pathways of bacterial isolates capable of degrading crude oil, agricultural
chemicals, and aromatic hydrocarbons have been intensively investigated. A recent whole
genome bioinformatics analysis identified genes involved in catabolic pathways (Ogata, et al.,
1999, Caspi, et al., 2012). The soil bacterium Pseudomonas putida F1 strain can use toluene,
ethylbenzene, and benzene as sole carbon and energy sources for growth (Gibson, et al., 1968).
The genome of this strain has been completely sequenced (GenBank, CP000712.1). In P. putida
F1, toluene, ethylbenzene, and benzene were degraded to intermediate products such as
tricarboxylic acid (TCA) cycle via the toluene degradation (tod genes) (Zylstra, et al., 1988,
Zylstra & Gibson, 1989), propanoate (prp genes), and β-ketoadipate (pca and cat genes)
pathways. I previously identified key enzymes involved in the degradation of toluene,
ethylbenzene, and benzene in P. putida F1 in liquid media (Fig. 3.1) (Kasahara, et al., 2012).
Additionally, I detected two protein systems (transport and sensor) important in aromatic
hydrocarbon degradation, including the solvent efflux pump system (SepRABC; Pput_2866,
2867, 2868 and 2869) (Phoenix, et al., 2003) and the two-component system (TodST; Pput2872
and Pput_2871), which regulate the toluene degradation pathway (Lau, et al., 1997). However,
it is unclear whether laboratory analyses of the bacterial activity and catabolism accurately
reflect the soil environment (Xu, 2006). Thus, it is important to detect proteins involved in
aromatic hydrocarbon degradation by P. putida F1 in soil formed the complex ecosystem..
Proteomics is a powerful approach that can be used for the large-scale characterization of
the proteins in a cell (Graves & Haystead, 2002, Graham, et al., 2011). Mass
spectrometry-based proteomics is widely used in bacterial sciences (Jimenez, et al., 2002,
Thompson, et al., 2010). Proteomics-based approaches can be used to analyze the function of
indigenous microbial communities in soil environments (Bastida, et al., 2010, Williams, et al.,

32
2010, Wang, et al., 2011, Wu, et al., 2011, Knief, et al., 2012), while no approach is available to
analyze the function of a single bacterial strain in soil environments.
In this study, I identified proteins involved in the degradation of toluene, ethylbenzene, and
benzene by P. putida F1 in soil by using two-dimensional gel electrophoresis (2-DE) or standard
sodium dodecyl sulfate-polyacrylamide gel electrophoresis (SDS-PAGE) combined with liquid
chromatography–tandem mass spectrometry (LC-MS/MS). Proteome analyses revealed that P.
putida F1 responded to aromatic hydrocarbons in the soil in a manner similar to that observed in
liquid media.
3.2 Materials and methods
3.2.1 Bacterial culture conditions in soil
P. putida F1 strain was grown at 30°C for 16 h in 100 mL of mineral salt medium (MSM)
containing 0.2% (w/v) glucose with vigorous shaking shaking (190 rpm) (Munoz, et al., 2007).
The cells were collected by centrifugation at 6,000 ×g for 10 min and washed twice with 100
mL of 0.8% (w/v) NaCl. Finally, cells were suspended in 10 mL of 0.8% NaCl, and diluted to
1.0 x 10⁹ colony-forming unit (CFU) mL
-1. Aliquot (5 ml) of the cell suspension was inoculated
into 50 g of unsterilized garden soil (N: 340 mg L-1
, P2O5: 1350 mg L-1
, K2O: 220 mg L-1
, MgO:
150 mg L-1
, pH 6.2, no. of viable bacterial cells: 1.1 × 10⁷ cells g
-1 soil) (Hokusan, Hokkaido,
Japan) containing 0.2% (w/v) glucose in a petri dish. Soils inoculated were incubated at 30°C
for 3 days. Next, toluene (T), ethylbenzene (E), or benzene (B) were added to the soil at final
concentrations of 0.5% (v/w), 1.5% (v/w), and 1.25% (v/w), respectively, and mixed thoroughly.
The soils were subsequently incubated at 30°C for 18 days. Soil samples were taken at 0, 1, 3, 6,
12, and 18 days. The 0-day sample was collected prior to adding aromatic hydrocarbons. The
moisture content (50%) of the soil samples was gravimetrically controlled using distilled water

33
during incubation. The soil sample was taken from three random locations in the petri dish, and
then these samples were mixed.
3.2.2 Measurement of toluene, ethylbenzene, and benzene degradation in soil
The concentrations of toluene, ethylbenzene, and benzene in the incubated soil was
measured using gas chromatography (GC) (Oldenhuis, et al., 1989). Soil samples incubated
with and without P. putida F1 cells were used for these measurements. To extract toluene,
ethylbenzene, and benzene from the soils, 2 mL of 0.8% NaCl and 2 mL of pentane were added
to 3 g of incubated soils. Next, the mixture was shaken for 24 h at room temperature and
centrifuged at 3,000 ×g for 3 min. The pentane layer was diluted using acetone. The mixture
was analyzed using GC (GC-2014; Shimadzu, Kyoto, Japan) equipped with a flame ionization
detector and a DB-5MS column (length 30 m, internal diameter 0.25 mm: J & W Scientific, CA,
USA). The initial oven temperature was maintained at 50°C for 10 min, and then increased to
250°C at a rate of 5°C min-1
and then held for 60 min. The injector and detector temperatures
were maintained at 250°C. All samples were measured in triplicate.
3.2.3 Viable count of P. putida F1 in inoculated soil
Viable cell numbers of P. putida F1 and indigenous bacteria were determined using the
dilution plate method. The soil inoculated and non-incubated samples were serially diluted in
sterilized water at 105–10
6 and 10
4–10
5 fold, respectively. The soil suspension was inoculated
onto Luria-Bertani (LB) ager (5 g yeast extract L-1
, 10 g tryptone L-1
, 5 g NaCl L-1
, pH 7, and
1.5 wt% agar) plate. Five replicates were prepared in all cases. Bacterial colony-forming units
(CFU) in the samples were counted at 30°C after incubation for 24 h for P. putida F1 and for 7
days for indigenous bacteria.

34
3.2.4 Separation of bacterial cells from soil and protein extraction
Bacterial cells were separated from the soil samples by using Nycodenz density gradient
centrifugation (Rickwood, et al., 1982, Lindahl & Bakken, 1995). A total of 12 g (wet weight)
of incubated soil samples was dispersed in 24 mL of 0.8% NaCl and sonicated for 5 min by
using a sonicator (VS-F100, As One, Tokyo, Japan). Next, 6.5 mL of the soil suspension was
added to 6.5 mL of Nycodenz (density approximately 1.3 g mL-1
) (Axis-Shield PoC AS, Oslo,
Norway). After the samples were centrifuged at 10,000 ×g for 40 min at 4°C, the bacterial cell
layer was collected using a pipette. Collected cells that had been washed with 0.8% NaCl were
lysed using the ReadyPrep Protein Extraction Kit (Total Protein) (Bio-Rad Laboratories,
Hercules, CA, USA). Protein concentration was measured using a Protein Assay Kit (Bio-Rad
Laboratories).
3.2.5 1-D sodium dodecyl sulfate-polyacrylamide gel electrophoresis
Extracted bacterial proteins (50 μg) were separated using 12.5% (v/v) acrylamide gel (90
mm × 85 mm) and stained using Coomassie brilliant blue (CBB).
3.2.6 Two-dimensional gel electrophoresis
Extracted bacterial proteins were separated using 2-DE. An immobiline dry strip (pH 4–7,
18-cm long; GE Healthcare, Uppsala, Sweden) was rehydrated overnight with 5 mL of
rehydration buffer (6 M urea, 2 M thiourea, 2% Triton X-100, 13 mM dithiothreitol (DTT), 1%
Pharmalyte pH 3–10, 25 mM acetic acid, and 0.0025% Orange G) at 20°C. Next, 100 μg of
extracted proteins were applied to the rehydrated dry strip. Isoelectric focusing (IEF) was
carried out at 20°C by using a Coolphorestar IPG-IEF Type-PX (Anatech, Tokyo, Japan), with
the voltage increased in a stepwise manner by using the following parameters: 500 V for 2 h,

35
700 V for 1 h, 1000 V for 1 h, 1500 V for 1 h, 2000 V for 1 h, 2500 V for 1 h, 3000 V for 1 h,
and 3500 V for 10 h. The dry strip was then equilibrated in SDS treatment buffer (6 M urea, 32
mM DTT, 25 mM Tris-HCl [pH 6.8], 2% SDS, 0.0025% bromophenol blue (BPB), and 25%
glycerol) for 30 min at room temperature with gentle shaking. The dry strip was then
equilibrated in alkylating buffer (6 M urea, 240 mM iodoacetamide, 25 mM Tris-HCl [pH 6.8],
2% SDS, 0.0025% BPB, and 25% glycerol) for 15 min. SDS-PAGE was performed using a
12.5% (v/v) acrylamide gel and run at 20 mA per gel by using a electrophoresis system
Coolphorestar SDS-PAGE Dual-200 (Anatech, Tokyo, Japan). The 10–200-kDa PageRulerTM
Unstained Protein Ladder (Fermentas, St. Leon-Rot, Germany) were used as molecular weight
markers. The gel was stained using silver nitrate and the image was captured by scanning with
an Epson scanner GT-S620 (Epson, Tokyo, Japan) at a resolution of 600 dpi. The spot count was
manually determined using ImageJ software version 1.44o (National Institute of Health,
Bethesda, MD, USA) for each gel.
3.2.7 Proteome analysis
Proteome analysis methods were performed as described previously (Kasahara, et al.,
2012). Standard SDS-PAGE gel lanes were cut into 80 strips (~1 mm). CBB-stained gel strips
were destained using 100 μL of 30% acetonitrile (ACN) containing 25 mM NH4HCO3.
Differentially expressed protein spots were excised from the 2-DE gels. Silver-stained spots
were destained using 100 μL of 25 mM NaS2O3 and 15 mM K3Fe(CN)6. Destained gels were
reduced using 10 mM DTT, followed by alkylation with 55 mM iodoacetamide. After the gels
were completely dried, they were digested using 40 μL of sequencing-grade modified trypsin
(12.5 μg/mL in 50 mM NH4HCO3) at 37°C for 16 h. Digested peptides were extracted using 25
mM NH4HCO3 in 60% ACN and washed twice by using 5% formic acid in 70% ACN. Peptide

36
mixtures were used for nano liquid chromatography-electrospray ionization-tandem mass
spectrometry (nanoLC-ESI-MS/MS) analysis.
NanoLC-ESI-MS/MS analysis was conducted using an LTQ ion-trap MS (Thermo Fisher
Scientific, Waltham, MA, USA) coupled with a Paradigm MS2 nano-flow HPLC system (AMR
Inc., Tokyo, Japan) and nano-spray electrospray ionization device (Michrom Bioresources Inc.,
Auburn, CA, USA). The tryptic peptide mixture was loaded onto an L-column2 ODS
(Chemicals Evaluation & Research Inst., Tokyo, Japan) packed with C18-modified silica
particles (5 μm; pore size, 12 nm). The peptide mixture was separated using a linear gradient of
15–65% buffer B for 40 min, followed by a gradient of 65–95% buffer B for 1 min (buffer A =
2% ACN and 0.1% formic acid in H2O; buffer B = 90% ACN and 0.1% formic acid in H2O) at
a flow rate of 1 μL min-1
. Peptide spectra were recorded over a mass range of m/z 450–1800.
MS/MS spectra were acquired in data-dependent scan mode. After the full spectrum scan, one
MS/MS spectrum of the most intense single peaks was also collected. Dynamic exclusion
features were set as follows: a repeat count of one within every 30 s, an exclusion duration of
180 s, and an exclusion list size of 50. MS/MS data were analyzed using the Mascot program
ver. 2.3.01 (Matrix Science, London, UK) against the P. putida F1 data (NC_009512) in NCBI.
Search parameters were set as follows: tryptic digest with a maximum of two missed cleavage
sites; fixed modifications, carbamidomethyl cysteine; variable modifications, methionine
oxidation; peptide masses, monoisotopic, positive charge (+1, +2, +3) of peptide; and mass
tolerance of 1.2 Da for the precursor ion and 0.8 Da for product ions. To determine the
false-positive rate, an automatic decoy search was performed against a randomized database
with a default significance threshold of p < 0.05; the false discovery rate at the identity
threshold was < 5.6%. Proteins with at least two unique peptides were used as filtering criteria.
37
3.2.8 Protein quantitative analysis
Label-free quantitative analyses of identified protein abundance were performed using the
exponentially modified protein abundance index (emPAI) values obtained using the Mascot
program (Ishihama, et al., 2005, Shinoda, et al., 2010). emPAI compares the number of
observed unique parent ions per protein with the number of observable peptides per protein.
Protein content (PC) in the molar fraction percentage was determined using the following
equation:
PC (mol %) = emPAI / Σ(emPAI) × 100,
where Σ(emPAI) is the summation of emPAI values for all identified proteins (Ishihama, et al.,
2005).
3.3 Results and Discussion
3.3.1 Degradation of aromatic hydrocarbons by P. putida F1 in soil
Biodegradation of aromatic hydrocarbons by P. putida F1 in the incubated soil was
measured using GC. The residual concentration of toluene, ethylbenzene, and benzene in the
soil inoculated with P. putida F1 were less than that in the non-inoculated soil (Fig. 3.2). The
decrease in concentration of aromatic hydrocarbons in the non-inoculated soil samples was not
due to the degradation of indigenous bacteria, but by volatilization. For the non-inoculated and
sterilized soil samples, the decrease in aromatic hydrocarbons was similar to that in the
non-inoculated soil sample (data not shown). These results suggest that P. putida F1 degrades
toluene, ethylbenzene, and benzene in soil. In the inoculated soil sample, the concentration of
benzene, toluene, and ethylbenzene decreased to the limit of detection within 3, 12, and 18 days,
respectively (Fig. 3.2). For proteome analyses, sampling times of the incubated soil samples
were determined to be 6, 12, and 18 days.

38
3.3.2 Viable cell number of P. putida F1 in soil
During incubation, the viable cell number of P. putida F1 in all inoculated soil samples was
2.6 × 10⁷ to 9.8 × 10
8 cells g
-1 soil (Table 3.1). Using the Nycodenz gradient method, it is
empirically difficult to collect bacterial cell present at <1 × 10⁷ cells g
-1 soil, while bacterial
cells are easily collected form inoculated soil samples. Viable cell number in the non-inoculated
soil samples was nearly < 1 × 10⁷ cells g
-1 soil. Therefore, the proteins obtained in this study
were derived from inoculated P. putida F1cells.
3.3.3 Two-DE/LC-MS/MS analysis of soil-incubated P. putida F1 proteins
Two-DE gel images of extracted proteins at day 0 (T0, E0, and B0; TEB0) and day 12 (T12,
E12, and B12) in the soil containing toluene, ethylbenzene, and benzene are shown in Fig. 3.3.
A total of 835, 455, 589, and 500 protein spots were detected on the TEB0, T12, E12, and B12
gels, respectively. Protein spots resulting from aromatic hydrocarbon degradation were
predicted on the basis of their theoretical isoelectric points (pI) and molecular weights (MW). A
total of 283 protein spots of the predicted spots and differentially expressed protein spots were
excised from the TEB0, T12, E12, and B12 gels, and 247 proteins were identified using more
than two unique peptide filtering criteria (Table 3.2).
Close-up images of 2-DE gels are shown in Fig. 3.4 which shows detected aromatic
hydrocarbon degradation proteins. Of the 11 proteins included in the tod cluster
(todXFC1C2BADEGIH), nine proteins (TodA, TodC1, TodC2, TodD, TodE, TodF, TodG, TodH,
and TodI) were strongly induced on the T12, E12, and B12 gel compared with TEB0 (Fig. 3.4A).
For TodA, same position spots in TEB0 gel were identified the elongation factor Tu (Pput_0473,
spots number: 24, 182, 183). Of the eight proteins that comprise the propanoate pathway
involved in ethylbenzene degradation (Fig. 3.1), two protein spots (PrpB and PrpF) were

39
detected only on the E12 gel (Fig. 3.4B). Of the seven proteins comprising the β-ketoadipate
pathway involved in benzene degradation (Fig. 3.1), two protein spots (CatA and CatB) were
detected only on the B12 gel (Fig. 3.4C). Although benzene was consumed after three days of
incubation (Fig. 3.2), the key enzymes involved in benzene degradation persisted after 12 days
of incubation. These proteins may be induced by small amounts of benzene below the detection
limit of GC analysis. Enzymes important for the degradation of toluene, ethylbenzene, and
benzene in P. putida F1 grown in soil were detected using 2-DE/LC-MS/MS analysis. Our
results indicate that P. putida F1 degrades aromatic hydrocarbons in soil.
The 2-DE approach is advantageous because it enables comparison of protein expression
profiles and quantification of expression levels (Wilkins, et al., 1998, Curreem, et al., 2012).
However, this approach has some limitations, including that (Wilkins, et al., 1998, Curreem, et
al., 2012): (i) low amounts of proteins are undetectable, (ii) membrane and hydrophobic
proteins are undetectable, (iii) proteins with very high or low pIs and MWs are undetectable,
and (iv) proteins in overlapping spots are difficult to observe. According to the results of 2-DE,
two proteins (TodB and TodX) in the tod cluster, six proteins in the propanoate pathway, and
five proteins in the β-ketoadipate pathway could not be detected. However, TodB protein was
induced at low levels in liquid cultures in the presence of toluene, ethylbenzene, and benzene
(Kasahara, et al., 2012) , while TodX is a hydrophobic membrane protein (Wang, et al., 1995).
Other proteins exhibited pIs of 4–7 and MWs of 15–150 kDa on 2-DE gels. These undetectable
spots could not be located because they were overlapping. It would be difficult to detect all
proteins involved in aromatic hydrocarbon degradation using 2-DE/LC-MS/MS analysis. The
standard SDS-PAGE/LC-MS/MS analysis approach, which involves genome-wide proteome
analysis (Kasahara, et al., 2012) , was applied for these soil samples.

40
3.3.4 Standard SDS-PAGE/LC-MS/MS analysis approach of P. putida F1 proteins
Soils incubated with ethylbenzene were analyzed for day 0 (E0 sample), day 6 (E6 sample),
and day 18 (E18 sample). Extracted proteins were separated using SDS-PAGE (Fig. 3.5). A total
of 1373, 1016, and 1389 proteins were identified in E0, E6, and E18 samples, respectively. PC
values were calculated for the identified proteins based on emPAI. In the E6 and E18 samples,
all key enzymes in the tod cluster and propanoate pathway were up-regulated compared with
those in the E0 sample (Fig. 3.6A and 3.6B). Proteins not detected using 2-DE/LC-MS/MS
analysis were detected using SDS-PAGE/LC-MS/MS analysis. In addition to the key enzymes
involved in the ethylbenzene degradation pathway, the solvent efflux pump system, SepRABC
proteins, and the two-component system, TodST proteins, were identified in the E6 and E18
samples (Kasahara, et al., 2012). These results indicate that P. putida F1 responds to
ethylbenzene in soil in a similar manner as in liquid media experiments.
In the SDS-PAGE/LC-MS/MS analysis, proteins involved in ethylbenzene degradation
were derived from P. putida F1 cells for two reasons. First, for non-inoculated soil with
ethylbenzene, the bacterial layer was not fractionated by Nycodenz gradient centrifugation, and
therefore, the bacterial cellular proteins could not be extracted. Second, in E6 sample, proteins
were analyzed using the Mascot program against the NCBI bacteria database (2012.01.29), and
the key enzyme proteins for ethylbenzene degradation were closely affiliated with P. putida F1.
Extracting proteins from soil is difficult because of the presence of humic substances and
indigenous materials in the soil (Benndorf, et al., 2007, Keiblinger, et al., 2012) as well as
adsorption of proteins to soil particles (Ding & Henrichs, 2002, Taylor & Williams, 2010). To
remove factors inhibiting protein extraction, I fractionated bacterial cells from soil and extracted
cellular proteins. I identified approximately 1260 proteins in P. putida F1. The number of
detected proteins was approximately 70% of the number detected in pure culture (Kasahara, et

41
al., 2012). Of these, the proteins involved in the degradation of aromatic hydrocarbons as well
as other proteins involved in other bioprocesses were subjected to genome-wide analysis by
using bacterial strains in soil. The SDS-PAGE/LC-MS/MS analysis approach allowed the
examination of bacterial response to soil environment.
3.4 Conclusion
Proteins involved in aromatic hydrocarbon degradation of P. putida F1 in soil were
detected using 2-DE/LC-MS/MS and 1-D SDS-PAGE/LC-MS/MS analyses. I showed that P.
putida F1 degraded aromatic hydrocarbons in the soil according to GC and proteome analyses
and clarified that the response to aromatic hydrocarbons of P. putida F1in the soil was the same
as that observed in liquid media. Thus, according to laboratory analysis, the activity and
catabolism in P. putida F1 reflect the soil environment. Metabolism and bioprocessing by a
bacterium in soil can be examined using 1-D SDS-PAGE/LC-MS/MS analysis, which is useful
for understanding the autecology and lifestyle of a bacterium in its natural habitat.

42
Table 3.1 Viable cell number of P. putida F1 in soil during incubation for 18 days.

43
Table 3.2 Proteins identified on the 2-DE gels in TEB0, T12, E12, and B12 samples.
pI MW (kDa) BTE0 T12 E12 B12 BTE0 T12 E12 B12 BTE0 T12 E12 B12
1 Pput_0792 gi|148546038 - hypothetical protein Pput_0792 4.97 64757.64 nd - 654 192 nd - 19.9 5.6 nd - 12 3
2 Pput_3470 gi|148548678 Tig trigger factor 4.84 48429.14 697 - - - 35 - - - 27 - - -
3 Pput_1157 gi|148546400 - OmpA/MotB domain-containing protein 4.95 21402.55 213 - - - 23 - - - 7 - - -
4 Pput_0382 gi|148545637 - malate synthase G 5.64 78199.81 90 - 189 - 3.3 - 7.4 - 2 - 5 -
5 Pput_2061 gi|148547283 katG catalase/peroxidase HPI 5.72 81955.06 81 - 196 - 3.6 - 7.3 - 2 - 5 -
6 Pput_0431 gi|148545683 - putative serine protein kinase, PrkA 5.74 73736.69 216 - 47 - 13.4 - 4.1 - 9 - 2 -
7 Pput_1667 gi|148546905 - dihydrolipoamide dehydrogenase 5.93 49925.1 795 - 671 - 41.6 - 34.3 - 17 - 16 -
8 Pput_4531 gi|148549733 - methy lmalonate-semialdehyde dehydrogenase 5.85 54342.1 230 - 127 - 12.8 - 8.5 - 6 - 4 -
9 Pput_1667 gi|148546905 - dihydrolipoamide dehydrogenase 5.93 49925.1 1340 - 822 - 44.4 - 37.7 - 22 - 18 -
10 Pput_4291 gi|148549497 - protease Do 5.82 47836.16 168 - - - 8.6 - - - 4 - - -
10 Pput_2904 gi|148548116 - aldehyde dehydrogenase 5.89 53135.27 - - 65 - - - 6.3 - - - 2 -
11 Pput_1038 gi|148546281 - arginine deiminase 5.66 46389.67 115 - 880 - 5.3 - 40 - 2 - 21 -
12 Pput_1175 gi|148546418 - extracellular ligand-binding receptor 5.77 37088.09 322 - 373 - 23.7 - 22.9 - 8 - 8 -
13 Pput_1053 gi|148546296 - extracellular solute-binding protein 5.83 43041.93 530 - - - 30.8 - - - 13 - - -
13 Pput_2902 gi|148548114 - oxidoreductase FAD-binding subunit 5.79 38266.35 - - 264 - - - 21.8 - - - 8 -
14 Pput_1668 gi|148546906 sucC succiny l-CoA synthetase subunit beta 5.83 41213.55 869 - 887 599 46.9 - 49.7 35.8 17 - 19 13
15 Pput_5062 gi|148550262 - D-3-phosphoglycerate dehydrogenase 5.93 44311.37 191 - 298 100 10.5 - 19.8 4.9 4 - 7 2
16 Pput_1037 gi|148546280 - ornithine carbamoy ltransferase 5.92 37873.05 411 - 493 359 34.5 - 37.2 27.4 13 - 14 10
17 Pput_4740 gi|148549942 - short-chain dehydrogenase/reductase SDR 5.97 27382.95 92 - - - 7.5 - - - 2 - - -
17 Pput_2895 gi|148548107 - short-chain dehydrogenase/reductase SDR 5.98 27293.13 - - 234 - - - 29 - - - 7 -
18 Pput_2882 gi|148548095 todF alpha/beta hydrolase fold 5.99 30768.73 - 248 496 365 - 28.3 37 36.6 - 8 11 11
19 Pput_2874 gi|148548087 todI acetaldehyde dehydrogenase 5.84 33663.45 - 644 1288 856 - 37.3 54.7 30.7 - 14 20 11
20 Pput_2873 gi|148548086 todH 4-hydroxy -2-ketovalerate aldolase 5.84 38449.34 - 451 555 666 - 29.8 31.5 27.8 - 12 14 12
21 Pput_1668 gi|148546906 sucC succiny l-CoA synthetase subunit beta 5.83 41213.55 559 515 459 202 38.9 30.4 33.8 18 13 10 12 6
22 Pput_4243 gi|148549449 - NADH:flavin oxidoreductase/NADH oxidase 5.63 40473.9 254 - 243 - 17.4 - 17.4 - 5 - 6 -
23 Pput_4428 gi|148549630 aapJ extracellular solute-binding protein 5.54 34016.45 334 542 613 359 31 40.6 51.8 34.5 12 17 18 11
24 Pput_0473 gi|148545725 - elongation factor Tu 5.22 43468.15 415 - - - 31.7 - - - 10 - - -
24 Pput_2878 gi|148548091 TodA FAD-dependent py ridine nucleotide-disulphide oxidoreductase 5.15 42784.29 - - 447 - - - 22.4 - - - 12 -
25 Pput_0512 gi|148545764 - DNA-directed RNA polymerase subunit alpha 4.91 36607.32 307 - 578 - 30.3 - 45 - 15 - 18 -
26 Pput_0894 gi|148546138 - ornithine decarboxy lase 4.97 43482.31 nd - 143 - nd - 10.6 - nd - 4 -
27 Pput_3771 gi|148548977 - 3-isopropy lmalate dehydrogenase 5.03 38800.05 nd - 57 - nd - 7.2 - nd - 2 -
28 Pput_0577 gi|148545827 - inorganic py rophosphatase 4.77 19176.8 255 - - - 30.9 - - - 7 - - -
29 Pput_0097 gi|148545354 trpA tryptophan synthase subunit alpha 5.17 28349.84 75 - - - 10.8 - - - 3 - - -
30 Pput_4079 gi|148549285 - oxidoreductase FAD/NAD(P)-binding subunit 5.22 29690.9 141 - - - 23.9 - - - 8 - - -
31 Pput_3436 gi|148548644 prpB 2-methy lisocitrate lyase 5.33 31792.27 - - 169 - - - 16.6 - - - 5 -
32 Pput_1270 148546513 - phosphoribosy laminoimidazole-succinocarboxamide synthase 5.37 26898.97 354 - - - 35.6 - - - 17 - - -
33 Pput_3521 gi|148548729 - enoy l-CoA hydratase/isomerase 5.43 27650.33 nd - 85 - nd - 7 - nd - 2 -
34 Pput_3469 gi|148548677 clpP ATP-dependent Clp protease proteoly tic subunit 5.53 23499.86 100 - - - 5.6 - - - 4 - - -
34 Pput_2880 gi|148548093 todC2 toluene dioxygenase 5.48 21999.04 - nd 275 982 - nd 20.3 56.7 - nd 5 12
35 Pput_1062 gi|148546305 - keto-hydroxyglutarate-aldolase/keto-deoxy -phosphogluconate aldolase 5.55 24069.44 141 - nd - 21.2 - nd - 5 - nd -
36 nd nd nd nd nd nd nd - nd - nd - nd - nd - nd -
37 Pput_5198 gi|148550398 - acety lglutamate kinase 5.57 31932.92 272 - - - 13.6 - - - 7 - - -
38 Pput_4185 gi|148549391 tsf elongation factor Ts 5.14 30398.88 1272 - - - 49.8 - - - 51 - - -
39 Pput_4591 gi|148549793 - dihydrodipicolinate reductase 5.68 28395.85 123 - 68 - 8.2 - 7.9 - 2 - 2 -
40 Pput_4216 gi|148549422 adk adeny late kinase 5.59 23208.07 94 - 109 - 17.1 - 12.5 - 3 - 2 -
41 Pput_2876 gi|148548089 todE glyoxalase/bleomycin resistance protein/dioxygenase 5.79 32057.92 - 283 282 355 - 16.5 21 19.6 - 4 7 6
42 Pput_4543 gi|148549745 ilvH acetolactate synthase 3 regulatory subunit 5.93 17773.62 57 - nd - 11.7 - nd - 2 - nd -
43 Pput_3777 gi|148548983 ibpA heat shock protein Hsp20 5.94 16127.36 262 - 151 - 45.6 - 32.7 - 7 - 5 -
44 nd nd nd nd nd nd nd - - - nd - - - nd - - -
45 Pput_1669 gi|148546907 - succiny l-CoA synthetase subunit alpha 5.89 30091.57 545 34 nd 47 29.6 3.1 nd 9.5 10 nd 11 2
46 Pput_0755 gi|148546001 - 50S ribosomal protein L25/general stress protein Ctc 5.72 21285.19 321 103 270 75 37.1 11.2 33 9.6 10 2 7 2
47 Pput_1669 gi|148546907 - succiny l-CoA synthetase subunit alpha 5.89 30091.57 56 - 225 - 6.5 - 20.4 - 2 - 8 -
48 nd nd nd nd nd nd nd - - - nd - - - nd - - -
49 nd nd nd nd nd nd nd - - - nd - - - nd - - -
50 Pput_4578 gi|148549780 nusA transcription elongation factor NusA 4.58 54640.39 459 - - - 22.1 - - - 19 - - -
51 Pput_3942 gi|148549148 rpsA 30S ribosomal protein S1 4.82 61517.94 701 - - - 34.8 - - - 32 - - -
52 nd nd nd nd nd nd nd - - - nd - - - nd - - -
53 Pput_5295 gi|148550495 F0F1 ATP synthase subunit beta 4.88 49328.34 69 - - - 4.6 - - - 2 - - -
54 Pput_4005 gi|148549211 - peptidy lproly l isomerase, FKBP-type 4.88 23958.53 327 - - - 34 - - - 10 - - -
55 Pput_0539 gi|148545789 - OmpW family protein 4.91 21941.15 129 - 181 - 15.4 - 23.3 - 3 - 4 -
56 nd nd nd nd nd nd nd - - - nd - - - nd - - -
57 Pput_0936 gi|148546179 - tartrate/fumarate subfamily Fe-S type hydro-lyase alpha subunit 5.19 54673.94 91 - - - 4.1 - - - 2 - - -
58 Pput_2881 gi|148548094 todC1 ring hydroxy lating dioxygenase, alpha subunit 5.27 50911.76 - 335 584 341 - 13.1 22 17.6 - 6 17 8
59 Pput_4497 gi|148549699 - trans-2-enoy l-CoA reductase 5.16 44237.56 121 - - - 10.4 - - - 4 - - -
60 Pput_2764 gi|148547978 - saccharopine dehydrogenase 5.17 45335.06 57 - - - 4.6 - - - 2 - - -
61 Pput_1666 gi|148546904 - dihydrolipoamide succiny ltransferase 5.2 42410.11 94 - - - 7.9 - - - 2 - - -
62 Pput_4383 gi|148549588 - cell division protein FtsA 5.2 44864.36 242 - - - 11.7 - - - 5 - - -
63 Pput_0002 gi|148545261 - DNA polymerase III subunit beta 5.16 40693.32 264 - - - 21 - - - 8 - - -
64 Pput_1442 gi|148546682 - aspartate kinase 5.25 44577.33 262 - - - 24.3 - - - 11 - - -
65 Pput_1748 gi|148546986 - isocitrate lyase 5.39 48631.06 168 - - - 14.7 - - - 7 - - -
66 nd nd nd nd nd nd nd - - - nd - - - nd - - -
67 Pput_1003 gi|148546246 - UDP-N-acety lglucosamine 1-carboxyviny ltransferase 5.35 44944.5 71 - 291 - 7.1 - 14.3 - 3 - 10 -
68 Pput_1057 gi|148546300 - carbohydrate-selective porin OprB 5.43 46777 497 - - - 27.1 - - - 27 - - -
69 Pput_3770 gi|148548976 - aspartate-semialdehyde dehydrogenase 5.46 40645.82 147 - - - 11.4 - - - 4 - - -
70 Pput_4542 gi|148549744 - ketol-acid reductoisomerase 5.48 36347.35 197 - - - 10.7 - - - 3 - - -
71 Pput_4833 gi|148550035 - fructose-1,6-bisphosphate aldolase 5.48 38428.15 309 - 399 - 23.2 - 20.3 - 10 - 13 -
72 Pput_1053 gi|148546296 - extracellular solute-binding protein 5.83 43041.93 102 - - - 8.6 - - - 3 - - -
73 Pput_3574 gi|161936355 - transaldolase B 5.37 34720.93 175 - - - 14.9 - - - 4 - - -
73 Pput_2055 gi|148547277 catA catechol 1,2-dioxygenase 5.14 34243.1 - - - 85 - - - 8.4 - - - 3
74 Pput_4594 gi|148549796 - GrpE protein 4.93 20532.44 92 - - - 11.4 - - - 2 - - -
75 nd nd nd nd nd nd nd - - - nd - - - nd - - -
76 Pput_1125 gi|148545354 - alky l hydroperoxide reductase/ Thiol specific antioxidant/ Mal allergen 5.06 21715.92 146 - - - 18 - - - 3 - - -
77 Pput_1745 gi|148546905 - NADH dehydrogenase subunit B 5.18 25506.7 120 - - - 15.6 - - - 4 - - -
78 Pput_1667 gi|148546370 - dihydrolipoamide dehydrogenase 5.93 49925.1 166 - - - 9.6 - - - 4 - - -
79 Pput_0702 gi|148545948 glyA serine hydroxymethy ltransferase 5.85 44868.96 125 - - - 9.6 - - - 5 - - -
80 nd nd nd nd nd nd nd - - - nd - - - nd - - -
81 Pput_0229 gi|148545485 - 4-aminobuty rate aminotransferase 5.85 44795.52 250 - - - 18.1 - - - 6 - - -
82 Pput_1668 gi|148546906 sucC succiny l-CoA synthetase subunit beta 5.83 41213.55 124 - - - 6.7 - - - 2 - - -
83 Pput_4914 gi|148550116 fructose-1,6-bisphosphatase 5.71 37194.87 245 - - - 24.1 - - - 12 - - -
84 Pput_1949 gi|148547174 - UTP-glucose-1-phosphate uridy ly ltransferase 5.46 30937.79 83 - - - 7.9 - - - 2 - - -
85 Pput_4684 gi|148549886 - iojap-like protein 5.25 17633.72 73 nd - - 10.1 nd - - 3 nd - -
86 Pput_4596 gi|148549798 - ferric uptake regulator family protein 5.43 15189.73 104 80 - - 16.4 14.9 - - 2 2 - -
87 Pput_0879 gi|148546123 ndk nucleoside-diphosphate kinase 5.45 15034.67 166 - - - 25.5 - - - 4 - - -
88 Pput_1235 gi|148546478 oprD outer membrane porin 4.75 43598.4 521 887 466 848 31.8 38 36.1 37.5 14 19 17 20
89 Pput_3651 gi|148548857 - OmpF family protein 4.63 34548.55 439 537 111 573 34 41.9 6.1 38.7 11 16 3 13
90 Pput_1140 gi|148546383 Dcd deoxycy tidine triphosphate deaminase 5.5 21219.56 123 - - - 11.7 - - - 2 - - -
91 Pput_0954 gi|148546197 - superoxide dismutase 5.55 21924.73 54 - - - 7.1 - - - 2 - - -
92 Pput_4958 gi|148550160 - malate dehydrogenase 5.09 45428.55 436 - - - 30.8 - - - 11 - - -
93 Pput_4428 gi|148549630 aapJ extracellular solute-binding protein 5.54 34016.45 91 99 - 161 8.8 10.5 - 15.2 3 3 - 5
94 Pput_4958 gi|148550160 - malate dehydrogenase 5.09 45428.55 nd - - - nd - - - nd - - -
95 nd nd nd nd nd nd nd - - - nd - - - nd - - -
96 Pput_0886 gi|148546130 - Pyrrolo-quinoline quinone 4.74 38015.59 107 - - - 10 - - - 5 - - -
97 Pput_4745 gi|148549947 - extracellular ligand-binding receptor 5.74 37297.97 474 - - - 22 - - - 15 - - -
98 Pput_3651 gi|148548857 - OmpF family protein 4.63 34548.55 - - - 295 - - - 21.5 - - - 8
99 nd nd nd nd nd nd - - - nd - - - nd - - - nd
100 Pput_1235 gi|148546478 oprD outer membrane porin 4.75 43598.4 - - - 167 - - - 18.8 - - - 9
No. of peptidesTheoretical Mascot_score Sequence coverage (%)No. of spots Protein namePput name Accession # Gene

44
101 nd nd nd nd nd nd - - - nd - - - nd - - - nd
102 Pput_4363 gi|148549568 groEL chaperonin GroEL 4.97 56693.68 - - - 233 - - - 9.9 - - - 4
103 Pput_4363 gi|148549568 groEL chaperonin GroEL 4.97 56693.68 - - - 246 - - - 12.3 - - - 7
104 Pput_4363 gi|148549568 groEL chaperonin GroEL 4.97 56693.68 - - - 89 - - - 5.1 - - - 2
105 Pput_5295 gi|148550495 - F0F1 ATP synthase subunit beta 4.88 49328.34 - - - 94 - - - 4.6 - - - 2
106 Pput_5295 gi|148550495 - F0F1 ATP synthase subunit beta 4.88 49328.34 - - - 388 - - - 21.2 - - - 8
107 Pput_1123 gi|148546366 - bacterioferritin 4.74 17960.12 - - - 157 - - - 21.7 - - - 3
108 nd nd nd nd nd nd - - - nd - - - nd - - - nd
109 nd nd nd nd nd nd - - - nd - - - nd - - - nd
110 nd nd nd nd nd nd - - - nd - - - nd - - - nd
111 Pput_5088 gi|148550288 - extracellular solute-binding protein 5.85 37653.22 - - - 73 - - - 6.8 - - - 2
112 Pput_2873 gi|148548086 todH 4-hydroxy -2-ketovalerate aldolase 5.84 38449.34 - 203 219 175 - 17.6 23 14.5 - 6 7 5
113 Pput_2053 gi|148547275 catB muconate and chloromuconate cycloisomerase 5.89 40179.22 - - - 140 - - - 5.4 - - - 2
114 Pput_1175 gi|148546418 - extracellular ligand-binding receptor 5.77 37088.09 - - - 393 - - - 23.2 - - - 9
115 Pput_2053 gi|148547275 catB muconate and chloromuconate cycloisomerase 5.89 40179.22 - - - 256 - - - 12.6 - - - 5
116 nd nd nd nd nd nd - - - nd - - - nd - - - nd
117 nd nd nd nd nd nd - - - nd - - - nd - - - nd
118 nd nd nd nd nd nd - - - nd - - - nd - - - nd
119 Pput_2874 gi|148548087 todI acetaldehyde dehydrogenase 5.84 33663.45 - 372 344 282 - 26.6 20.6 11.1 - 8 6 3
120 Pput_2877 gi|148548090 todD 2,3-dihydroxy -2,3-dihydropheny lpropionate dehydrogenase 5.29 28763.94 - 410 132 223 - 36.4 19.3 32.7 - 12 5 7
121 Pput_4734 gi|148549936 - Ferritin, Dps family protein 4.82 20048.03 - 121 - - - 23.9 - - - 4 - -
122 Pput_2785 gi|148547999 - integral membrane sensor signal transduction histidine kinase nd nd - nd - - - nd - - - nd - -
123 Pput_4745 gi|148549947 - extracellular ligand-binding receptor 5.74 37297.97 - 341 - - - 24.6 - - - 9 - -
124 nd nd nd nd nd nd - nd - - - nd - - - nd - -
125 Pput_2765 gi|148547979 - methy ltransferase type 12 5.52 37387.42 - 40 - - - 5.5 - - - 2 - -
126 Pput_1175 gi|148546418 - extracellular ligand-binding receptor 5.77 37088.09 - 156 - - - 14.6 - - - 5 - -
127 Pput_2881 gi|148548094 todC1 ring hydroxy lating dioxygenase, alpha subunit 5.27 50911.76 - 166 - - - 6.4 - - - 3 - -
128 Pput_3651 gi|148548857 - OmpF family protein 4.63 34548.55 - - 129 - - - 10.8 - - - 3 -
129 Pput_2881 gi|148548094 todC1 ring hydroxy lating dioxygenase, alpha subunit 5.27 50911.76 - - 353 - - - 18.4 - - - 9 -
130 Pput_2898 gi|148548110 - ring hydroxy lating dioxygenase, alpha subunit 5.09 48936.89 - - 489 - - - 29.7 - - - 12 -
131 Pput_2898 gi|148548110 - ring hydroxy lating dioxygenase, alpha subunit 5.09 48936.89 - - 511 - - - 22.1 - - - 10 -
132 Pput_0473 gi|148545725 - elongation factor Tu 5.22 43468.15 - - 2110 - - - 42.8 - - - 77 -
133 Pput_0473 gi|148545725 - elongation factor Tu 5.22 43468.15 - - 248 - - - 22.7 - - - 8 -
134 nd nd nd nd nd nd - - nd - - - nd - - - nd -
135 Pput_4363 gi|148549568 groEL chaperonin GroEL 4.97 56693.68 - - 118 - - - 8.1 - - - 3 -
136 Pput_2881 gi|148548094 todC1 ring hydroxy lating dioxygenase, alpha subunit 5.27 50911.76 - - 869 - - - 34 - - - 27 -
137 Pput_2875 gi|148548088 todG 4-oxalocrotonate decarboxy lase 4.9 28221.78 - - 478 - - - 36.6 - - - 8 -
138 Pput_2890 gi|148548102 - 4-oxalocrotonate decarboxy lase 4.88 28098.63 - - 103 - - - 7.6 - - - 3 -
139 Pput_2878 gi|148548091 todA FAD-dependent py ridine nucleotide-disulphide oxidoreductase 5.15 42784.29 - - 981 - - - 42.2 - - - 16 -
140 Pput_2823 gi|148548037 - azoreductase 4.85 21309.93 - - 289 - - - 36.9 - - - 7 -
141 nd nd nd nd nd nd - - nd - - - nd - - - nd -
142 Pput_3579 gi|148548785 - VacJ family lipoprotein 4.96 22823.67 - - 229 - - - 24.7 - - - 5 -
143 Pput_2881 gi|148548094 todC1 ring hydroxy lating dioxygenase, alpha subunit 5.27 50911.76 - - 707 - - - 18.9 - - - 19 -
144 Pput_2905 gi|148548117 - short-chain dehydrogenase/reductase SDR 5.37 26129.32 - - 450 - - - 22.2 - - - 7 -
145 Pput_2877 gi|148548090 todD 2,3-dihydroxy -2,3-dihydropheny lpropionate dehydrogenase 5.29 28763.94 - - 114 - - - 13.5 - - - 3 -
146 Pput_2880 gi|148548093 todC2 toluene dioxygenase 5.48 21999.04 - - 260 - - - 25.1 - - - 6 -
147 Pput_2876 gi|148548089 todE glyoxalase/bleomycin resistance protein/dioxygenase 5.79 32057.92 - - 88 - - - 10.7 - - - 3 -
148 nd nd nd nd nd nd - - nd - - - nd - - - nd -
149 Pput_2893 gi|148548105 - class II aldolase/adducin family protein 5.7 26158.33 - - 160 - - - 22.2 - - - 5 -
150 Pput_2880 gi|148548093 todC2 toluene dioxygenase 5.48 21999.04 - - 562 - - - 40.1 - - - 9 -
151 Pput_2880 gi|148548093 todC2 toluene dioxygenase 5.48 21999.04 - - 705 - - - 40.1 - - - 10 -
152 Pput_2891 gi|148548103 - alpha/beta hydrolase fold 6.05 32485.86 - - 403 - - - 33 - - - 11 -
153 Pput_2891 gi|148548103 - alpha/beta hydrolase fold 6.05 32485.86 - - 946 - - - 34.4 - - - 15 -
154 Pput_2896 gi|148548108 - glyoxalase/bleomycin resistance protein/dioxygenase 6.09 35343.7 - - 318 - - - 31.1 - - - 9 -
155 Pput_2896 gi|148548108 - glyoxalase/bleomycin resistance protein/dioxygenase 6.09 35343.7 - - 594 - - - 39.7 - - - 13 -
156 Pput_2888 gi|148548100 mhpE2 4-hydroxy -2-ketovalerate aldolase 5.91 38035.07 - - 164 - - - 12.9 - - - 4 -
157 Pput_2888 gi|148548100 mhpE2 4-hydroxy -2-ketovalerate aldolase 5.91 38035.07 - - 375 - - - 25.1 - - - 9 -
158 Pput_0524 gi|148545776 - formate dehydrogenase, beta subunit 5.9 34530.82 - - 68 - - - 9.2 - - - 3 -
159 Pput_2902 gi|148548114 - oxidoreductase FAD-binding subunit 5.79 38266.35 - - 110 - - - 8 - - - 3 -
160 Pput_1932 gi|148547157 - alcohol dehydrogenase 5.5 35401.1 - - 278 - - - 22.3 - - - 6 -
161 Pput_1667 gi|148546905 - dihydrolipoamide dehydrogenase 5.93 49925.1 - - 98 - - - 5 - - - 2 -
162 Pput_2881 gi|148548094 todC1 ring hydroxy lating dioxygenase, alpha subunit 5.27 50911.76 - - 107 - - - 5.1 - - - 2 -
163 Pput_2878 gi|148548091 todA FAD-dependent py ridine nucleotide-disulphide oxidoreductase 5.15 42784.29 - - 673 - - - 21.5 - - - 18 -
164 Pput_1825 gi|148547060 - ATP-dependent Clp protease, ATP-binding subunit clpA 5.59 83286.59 - - 91 - - - 2.8 - - - 2 -
165 Pput_2900 gi|148548112 - propiony l-CoA synthetase 5.73 71373.58 - - 459 - - - 22.2 - - - 17 -
166 Pput_2900 gi|148548112 - propiony l-CoA synthetase 5.73 71373.58 - - 693 - - - 23 - - - 19 -
167 Pput_2904 gi|148548116 - aldehyde dehydrogenase 5.89 53135.27 - - 539 - - - 30 - - - 16 -
168 Pput_2904 gi|148548116 - aldehyde dehydrogenase 5.89 53135.27 - - 989 - - - 37.7 - - - 23 -
169 Pput_1663 gi|148546901 sdhA succinate dehydrogenase flavoprotein subunit 5.83 63408.84 - - 347 - - - 16.6 - - - 9 -
170 Pput_4363 gi|148549568 groEL chaperonin GroEL 4.97 56693.68 - - 347 - - - 19.8 - - - 10 -
171 nd nd nd nd nd nd - - nd - - - nd - - - nd -
172 nd nd nd nd nd nd - - nd - - - nd - - - nd -
173 Pput_2875 gi|148548088 todG 4-oxalocrotonate decarboxy lase 4.9 28221.78 - 592 880 - - 45.9 51.9 - - 13 16 -
174 Pput_2874 gi|148548087 todI acetaldehyde dehydrogenase 5.84 33663.45 - - 110 - - - 7 - - - 2 -
175 Pput_2877 gi|148548090 todD 2,3-dihydroxy -2,3-dihydropheny lpropionate dehydrogenase 5.29 28763.94 - 852 639 806 - 54.9 41.5 41.5 - 16 14 15
176 Pput_0598 gi|148545848 acety l-CoA carboxy lase biotin carboxy l carrier protein subunit 4.95 16175.35 214 - - - 17.6 - - - 6 - - -
177 Pput_3856 gi|148549062 elongation factor P 4.73 21289.72 440 - - - 32.3 - - - 12 - - -
178 Pput_4185 gi|148549391 tsf elongation factor Ts 5.14 30398.88 396 - - - 32.4 - - - 17 - - -
179 Pput_4761 gi|148549963 extracellular solute-binding protein 5.18 33817.29 162 - - - 17.8 - - - 8 - - -
180 Pput_3470 gi|148548678 tig trigger factor 4.84 48429.14 206 - - - 12.1 - - - 5 - - -
181 Pput_4593 gi|148549795 dnaK molecular chaperone DnaK 4.91 65451.97 1435 - 1113 - 38 - 36.3 - 55 - 40 -
182 Pput_0473 gi|148545725 elongation factor Tu 5.22 43468.15 1387 - - - 42.8 - - - 53 - - -
183 Pput_0473 gi|148545725 elongation factor Tu 5.22 43468.15 3062 - - - 55.2 - - - 104 - - -
184 Pput_5297 gi|148550497 F0F1 ATP synthase subunit alpha 5.46 55286.66 1470 - 1097 - 38.7 - 38.7 - 48 - 37 -
185 Pput_1318 gi|148546560 cysteine synthase A 5.71 34318.74 319 - - - 25.3 - - - 11 - - -
186 Pput_0756 gi|148546002 ribose-phosphate py rophosphokinase 5.56 33824.52 307 - - - 12.6 - - - 5 - - -
187 Pput_1316 gi|148546558 ATPase 5.69 32125.96 155 - - - 22.1 - - - 6 - - -
188 Pput_1267 gi|148546510 dihydrodipicolinate synthase 5.73 31634.43 188 - - - 8.1 - - - 3 - - -
189 Pput_2382 gi|148547603 gluconate 2-dehydrogenase 5.92 34548.14 252 - - - 17.5 - - - 13 - - -
190 Pput_2164 gi|148547385 phosphate ABC transporter, periplasmic phosphate-binding protein 6 34009.33 520 - - - 26.8 - - - 12 - - -
191 Pput_4755 gi|148549957 rplI 50S ribosomal protein L9 5.42 15457.23 379 - - - 41.2 - - - 18 - - -
192 Pput_4364 gi|148549569 groES co-chaperonin GroES 5.4 10217.45 330 - - - 54.6 - - - 9 - - -
193 Pput_1666 gi|148546904 dihydrolipoamide succiny ltransferase 5.2 42410.11 - - 468 - - - 26.5 - - - 16 -
194 Pput_4363 gi|148549568 groES chaperonin GroEL 4.97 56693.68 - - 1224 - - - 36.1 - - - 44 -
195 Pput_4363 gi|148549568 groES chaperonin GroEL 4.97 56693.68 - - 1989 - - - 46 - - - 64 -
196 Pput_1822 gi|148547057 isocitrate dehydrogenase, NADP-dependent 5.54 45675.49 - - 413 - - - 28.2 - - - 18 -
197 Pput_1693 gi|148546931 3-oxoacy l-(acy l carrier protein) synthase I 5.42 43235.66 - - 354 - - - 18 - - - 9 -
198 Pput_4590 gi|148549792 carbamoy l phosphate synthase small subunit 5.48 41561.28 - - 143 - - - 10.6 - - - 4 -
199 Pput_4542 gi|148549744 ketol-acid reductoisomerase 5.48 36347.35 - - 597 - - - 36.1 - - - 22 -
200 Pput_1663 gi|148546901 sdhA succinate dehydrogenase flavoprotein subunit 5.83 63408.84 - - 826 - - - 26.9 - - - 27 -
201 Pput_3433 gi|148548641 prpF putative AcnD-accessory protein PrpF 5.32 41401.27 - - 440 - - - 32.6 - - - 11 -

45
Fig. 3.1 The metabolic pathway of toluene, ethylbenzene, and benzene in P. putida F1. The
proteins involved in the tod pathway is the following: TodABC1C2 (toluene dioxygenase;
Pput_2878, Pput_2879, Pput_2881, and Pput_2880), TodD (cis-benzene glycol dehydrogenase;
Pput_2877), TodE (catechol 2,3-dioxygenase; Pput_2876), TodF

46
(2-hydroxy-6-oxohepta-2,4-dienoate hydrolase; Pput_2882), TodG (2-keto-4-pentenoate
hydratase; Pput_2875), TodH (4-hydroxy 2-oxovalerate aldolase; Pput_2873), TodI
(acetaldehyde dehydrogenase; Pput_2874). The proteins involved in the propanoate pathway is
the following: PrpE (propionyl-CoA synthetase; Pput_3345), FasDx (AMP-dependent
synthetase and ligase; Pput_3525), PrpC (methylcitrate synthase; Pput_3435), PrpD
(methylcitrate synthase; Pput_3432), AcnB (bifunctional aconitate hydratase
2/2-methylisocitrate dehydratase; Pput_3431), PrpB (2-methylisocitrate lyase; Pput_3436), PrpF
(2-methylcitrate dehydratase; Pput_3433), and AcnD (2-methylisocitrate dehydratase;
Pput_3434). The proteins involved in the β-ketoadipate pathway is the following: CatA
(catechol 1,2-dioxygenase; Pput_2055), CatB (muconate cycloisomerase; Pput_2053), CatC
(muconolactone isomerase; Pput_2054), PcaD (β-ketoadipate enol-lactone hydrolase;
Pput_4343), PcaI and PcaJ (β-ketoadipate:succinyl CoA transferase; Pput_1870 and Pput_1871),
PcaF (β-ketoadipyl CoA thiolase; Pput_4346), PhaD and FadA (acetyl-CoA acyltransferase;
Pput_2479 and Pput_3605).

47
Fig. 3.2 Residual concentration of toluene, ethylbenzene, and benzene in the inoculated (closed
symbol) and non-inoculated (open symbol) soil of P. putida F1. Error bars indicate the standard
deviation of triplicate measurements.
0
20
40
60
80
100
0 3 6 9 12 15 18
Rem
ain
ing
per
cen
tag
e o
f ar
om
atic
hyd
roca
bo
n (
%)
Incubation time (days)
Toluene (+F1)
Toluene (-F1)
Ethylbenzene (+F1)
Ethylbenzene (-F1)
Benzene (+F1)
Benzene (-F1)

48
Fig. 3.3 2-DE gel images of cellular proteins obtained from P. putida F1 grown in soil of before
(day 0; TEB0) and after addition (day 12; T12, E12 and B12) of the toluene, ethylbenzene, and
benzene. Arrows indicate protein spots analyzed by LC-MS/MS. Proteins (100 μg) were loaded
on an 18-cm strip with a linear gradient of pH 4–7 for IEF, following electrophoresis of 12.5%
SDS-PAGE and silver staining.

49
Fig. 3.4 The close-up images of the identified aromatic hydrocarbons degradation proteins in
TEB0, T12, E12, and B12 gels. (A) Protein spot involved in the tod cluster. (B) Protein spots
involved in the propanoate pathway. (C) Protein spots involved in the β-ketoadipate pathway.

50
Fig. 3.5 SDS-PAGE image of extracted proteins from soil amended with ethylbenzene (E0, E6,
and E18 samples). Twenty-five μg proteins per a lane were analyzed on 12.5% SDS-PAGE. The
gels were stained with CBB.

51
Fig. 3.6 Protein content of proteins involved in the aromatic hydrocarbon degradation in E0, E6,
and E18 samples. (A) Proteins involved in the tod cluster. (B) Proteins involved in the
propanoate pathway.

52
Chapter 4
Soil specific expression proteins in Pseudomonas putida F1

53
4.1. Introduction
While bacteria involved in select processes such as the nitrogen cycle and methane
production and consumption have been studied extensively in situ, the ecophysiological
characteristics of the majority of this bacteria are largely unknown (Fierer, et al., 2007).
Moreover, the laboratory studies have provided only limited information on survival and
adaptive strategies of bacteria in various soil environments because laboratory conditions
substantially differ from those of natural environments. Soil environments are heterogenous
with respect to a variety of physical and chemical factors (e.g. soil particle structures,
temperature, water content, pH and nutrient level) in various interactions with other indigenous
organisms. Furthermore, soil environments are apparently poor in nutrient contents, and they
generally provide severe survival conditions for bacteria, due in the presence of a variety of
competitive organisms.
In the complete genomic sequencing bacterial strain, a many genes of unknown function
are still present. In the soil bacterium P. putida F1, about 22% out of 5250 genes are genes of
unknown function. I considered that the gene which is expressed only in the bacterial habitat
environment is present in the genes of unknown function of P. putida F1.
In fact, in situ functional analysis of bacteria that live in the natural environment is difficult.
However, I previously developed a novel high-throughput, non-targeted mass spectrometry
(MS) approach to determine the identities of thousands of microbial proteins in the complex soil
environments (Chapter 3).
In this study, to understand the bacterial response for environmental factor in soils, I
identified the specific expression protein in environment soils by comparative analysis of the
proteins extracted from P. putida F1 grown in liquid medium and soil culture system.

54
4.2. Material and methods
4.2.1 Growth conditions in liquid culture
P. putida F1 stain was grown aerobically at 30ºC with vigorous shaking (190 rpm) in
mineral salt medium (MSM) supplemented with 0.2% glucose and Luria-Bertani (LB) medium.
The bacteria cells were harvested in log phase (OD600 = 0.3) and stationary phase (25 h) by
centrifugation.
4.2.2 Growth conditions in soil culture
The P. putida F1 strain was grown at 30°C for 16 h in 100 mL of mineral salt medium
(MSM) with vigorous shaking (190 rpm) (Munoz, et al., 2007). Bacterial cells were collected
by centrifugation at 6,000 ×g for 10 min and washed twice with 100 mL of 0.8% (w/v) NaCl.
Finally, cells were suspended in 10 mL of 0.8% NaCl. The cells were inoculated into 50 g of
three types unsterilized soil (soybean, maize and forest soil) containing 0.2% (w/v) glucose in a
petri dish, and adjusted to a final concentration of 1.0 × 10⁸ cells g
-1 soil. Inoculated soils were
incubated at 30°C for 3 days. The moisture content (50%) of the soils was gravimetrically
controlled using distilled water during incubation.
4.2.3 Growth conditions in static culture
P. putida F1 stain was cultured statically at 30 ºC in MSM including 0.2% glucose. The
bacteria cells were harvested in log phase (OD600 = 0.3) by centrifugation.
4.2.4 Preparation of soil extract liquid medium
Soil extract liquid medium were prepared as described previously (Vilain, et al., 2006).

55
Briefly, 60 g (dry weight) of soils from soybean field, maize field and forest field were
suspended in 300 mL of sterile MOPS buffer (10 mM, pH 7.0) with shaking at 200 rpm for 1 h.
To remove soil particles, the soil suspension was centrifuged at 10,000 ×g for 20 min at 4°C.
The supernatant was filtered sequentially through filters with a pore size of 3.0, 0.45 and 0.2 μM
in order to remove soil particles and bacteria cells.
4.2.5 Growth conditions in soil extract liquid medium
P. putida F1 stain was grown aerobically at 30 ºC with vigorous shaking (190 rpm) in soil
extract liquid medium (soybean, maize and forest) supplemented with 0.2% glucose. The
bacteria cells were harvested in log phase by centrifugation.
4.2.6 Separation of bacterial cells from soil
Bacterial cells were separated from soil using Nycodenz density gradient centrifugation
(Rickwood, et al., 1982, Lindahl & Bakken, 1995). A total of 12 g (wet weight) of incubated
soils were dispersed in 24 mL of 0.8% NaCl and sonicated for 5 min using a sonicator
(VS-F100, As One, Tokyo, Japan). Next, 6.5 mL of the soil suspension was carefully added to
6.5 mL of Nycodenz (density approximately 1.3 g mL-1
) (Axis-Shield PoC AS, Oslo, Norway).
After the samples were centrifuged at 10,000 ×g for 40 min at 4°C, the bacterial cell layer was
carefully collected using a pipette. The collected cell was washed with 0.8% NaCl.
4.2.7 Protein extraction
Cold 1.6 mL of 10% TCA/acetone was added the collected cell, and rotated for 5 min at
room temperature. After centrifugation (5 min, 8,000 ×g, 4°C), TCA/acetone was gently
removed and discarded, and added cold 1.6 mL of 80% acetone. After centrifugation (5 min,

56
8,000 ×g, 4°C), TCA/acetone was gently removed and discarded. To residual acetone, the cell
was evaporated for 5 min. The cell pellet was resuspended in 0.8 mL phenol (Tris-buffered,
pH8.0) and 0.8 mL SDS buffer (30% sucrose, 2% SDS, 0.1 M Tris-HCl, pH 8.0, 5%
β-mercaptoethanol), rotated for 30 min at room temperature. After centrifugation (10 min,
14,000 ×g, 4°C), the upper phenol phase was transferred into a fresh 15-mL Falcon tube. This
extraction step was repeated twice. The transferred phenol was added 1/3 volumes of cold
ethanol and 2 volumes of cold isopropanol, and stored overnight at -20°C. After centrifugation
(15 min, 15,000 ×g, 4°C), the supernatant was carefully discarded. The pellet was washed once
with cold 2 mL of 0.1 M ammonium acetate/methanol and twice with cold 2 mL of 80% acetone.
The washed pellet was air-dried and then dissolved in solubilization buffer (5.0 M urea, 2.0 M
thiourea, 2% [w/v] CHAPS, 65 mM dithiothreitol).
4.2.8 SDS-PAGE
The extracted proteins (50 μg) were separated using 12.5% (v/v) acrylamide gel (90 mm ×
85 mm) and stained using Coomassie brilliant blue (CBB). The 1-DE gel lanes were cut into 60
strips of ~1 mm for protein identification.
4.2.9 In-gel digestion
Proteome analysis methods were performed as described previously (Kasahara, et al.,
2012). The 1-D SDS-PAGE gel lanes were cut into 80 strips of ~1 mm. CBB-stained gel strips
were destained using 100 μL of 30% acetonitrile including 25 mM NH4HCO3. The differentially
expressed protein spots were excised from the 2-DE gels. Silver-stained spots were destained
using 100 μL of 50 vol% 50 mM NaS2O3 and 50 vol% 30 mM K3Fe(CN)6. Destained gels were
reduced using 10 mM DTT, followed by alkylation with 55 mM iodoacetamide. After the gels

57
were completely dried, they were digested using 40 μL of sequencing-grade modified trypsin
(12.5 μg/mL in 50 mM NH4HCO3) at 37°C for 16 h. Digested peptides were extracted using 25
mM NH4HCO3 in 60% ACN and washed twice using 5% formic acid in 70% ACN. The peptide
mixtures were used for a nano liquid chromatography-electrospray ionization-tandem mass
spectrometry (nanoLC-ESI-MS/MS) analysis.
4.2.10 NanoLC-ESI-MS/MS analysis
A nanoLC-ESI-MS/MS analysis were performed using an LTQ ion-trap MS (Thermo
Fisher Scientific, Waltham, MA, USA) coupled with a Paradigm MS2 nano-flow HPLC system
(AMR Inc., Tokyo, Japan) and nano-spray electrospray ionization device (Michrom
Bioresources Inc., Auburn, CA, USA). The tryptic peptide mixture was loaded onto an
L-column2 ODS (Chemicals Evaluation & Research Inst., Tokyo, Japan) packed with
C18-modified silica particles (5 μm, 12-nm pore size). The peptide mixture was separated using
a linear gradient of 15–65% buffer B for 40 min, followed by a gradient of 65–95% buffer B for
1 min (buffer A = 2% ACN and 0.1% formic acid in H2O; buffer B = 90% ACN and 0.1%
formic acid in H2O) at a flow rate of 1 μL min-1
. Peptide spectra were recorded over a mass
range of m/z 450–1800. MS/MS spectra were acquired in data-dependent scan mode. After the
full spectrum scan, one MS/MS spectrum of the single most intense peaks was also collected.
Dynamic exclusion features were set as follows: a repeat count of one within 30 s, an exclusion
duration of 180 s, and an exclusion list size of 50.
4.2.11 Protein identification
The generated MS/MS data file was analyzed using the Mascot program ver. 2.3.01
(Matrix Science, London, UK) against the P. putida F1 data (NC_009512) in NCBI. Search
58
parameters were set as follows: tryptic digest with a maximum of two missed cleavage sites;
fixed modifications, carbamidomethyl cysteine; variable modifications, methionine oxidation;
peptide masses, monoisotopic, positive charge (+1, +2, +3) of peptide; and mass tolerance of 1.2
Da for the precursor ion and 0.8 Da for product ions. To determine the false-positive rate, an
automatic decoy search was performed against a randomized database with a default
significance threshold of p < 0.05; the false discovery rate at the identity threshold was below
22.1%. Proteins with at least two unique peptides were used as filtering criteria.
4.3 Results and discussion
4.3.1 Protein identification from P. putida grown in soil
Proteins of P. putida F1 cells grown in the liquid medium and three type soils (soybean,
maize and forest) were separated by SDS-PAGE (Fig. 4.1), and the gels were cut into 60 strips
for in-gel digestion. Each peptide mixture was analyzed with nanoLC-MS/MS for protein
indentation. In total, 2643, 1364, 1273 and 816 proteins of P. putida F1 were identified in liquid
medium, soybean soil, maize soil and forest soil, respectively (Table 4.1).
4.3.2 Detection of soil specific expression protein
To identify specifically expressed proteins in soil environment, I performed pairwise
comparisons of the liquid medium with the soil. In comparison of the proteins extracted from
the liquid medium with soybean soil, 55 proteins expressed only in the soybean soil were
identified, non-expressed in the liquid medium. In comparison of the proteins extracted from the
liquid medium with maize soil, 56 proteins expressed only in the maize soil were identified,
non-expressed in the liquid medium. In comparison of the proteins extracted from the liquid

59
medium with forest soil, 36 proteins expressed only in the forest soil were identified,
non-expressed in the liquid medium. A comparison of the proteins expressed only in these soil
environments revealed a set of 9 shared proteins (Fig. 4.2). The candidate shared protein
contained a heavy metal translocating P-type ATPase (Pput_0055), a hypothetical protein
(Pput_0820), a nitric oxide dioxygenase (Pput_0832), an alkaline phosphatase (Pput_0920), a
hypothetical protein (Pput_3040), a short chain dehydrogenase (Pput_3041), a hypothetical
protein (Pput_3042), an AMP-dependent synthetase, a ligase (Pput_3043) and a hypothetical
protein (Pput_3044).
The used soils were the unsterilized soil including many indigenous microorganisms. It
was examined whether the soil specific proteins (SSP) derived in P. putida F1, using the
incubated soils with and without P. putida F1 (Fig. 4.3). The result indicated that SSP were
derived in P. putida F1, except a heavy metal translocating P-type ATPase (Pput_0055).
Therefore, a heavy metal translocating P-type ATPase (Pput_0055) was excluded from the
candidate of SSP.
Although an alkaline phosphatase (Pput_0920; DppB) expressed specifically in soils is one
of the proteins composed of the dipeptide transporter (Monnet, 2003), other constituent proteins
(Pput_0919; DppC, Pput_0918; DppD, Pput_0917; DppF) were undetected in soil (Fig. 4.4).
Therefore, the alkaline phosphatase (Pput_0920) was excluded from the candidate of SSP.
The gene cluster (Pput_3040, Pput_3041, Pput_3042, Pput_3043 and Pput_3044) were
detected in SSP. The protein cluster was suggested an operon structure from gene information
that is provided by KEGG (Ogata, et al., 1999). Further, a two-component regulatory system
(Pput_3038; integral membrane sensor signal transduction histidine kinase and Pput_3039; two
component transcriptional regulator) was located downstream of the protein cluster. However,
the two-component regulatory system was undetected as SSP. Because the sensor protein

60
(Pput_3038) localized in inner membrane, it was considered to be difficult to detect in proteome
analysis. On the other hand, the regulator protein (Pput_3039) was detected in the soybean soil
(emPAI; 0.60) and the maize soil (emPAI; 0.48). In forest soil, Pput_3039 is possible that were
not detected due to the inhibition of protein extraction by humic acids. The function of SSP
operon was unknown.
In this study, I determined the 2 genes and 1 operon as the specific expression genes in soil
(Table 4.2).
4.3.3 Analysis of expression factor in SSP
The nitric oxide dioxygenase (Pput_0832) has been proposed to function in NO
detoxification (Gardner, et al., 1998, Gardner, et al., 1998).
To clarify the expression factor of the other SSP, I examined the effect of oxygen
concentration, soil particles, soil nutrient and autochthonous microorganism, which inferred
from the differences in liquid culture system and soil culture system.
The effect of oxygen concentration was investigated using a static culture in the liquid
medium. The SSP was undetected in P. putida F1 grown in static culture (Table 4.3). This result
shows that the oxygen concentration does not affect the expression of SSP.
The effect of soil particles, soil nutrient and autochthonous microorganisms were
investigated using a soil extract liquid medium (soybean, maize and forest). The SSP was
up-regulated in P. putida F1 grown in each soil extract liquid medium (Table 4.3). This result
indicates that the soil nutrient is expression factor of SSP.
4.3.4 Phylogenetic analysis of SSP operon
To analyze whether the SSP operon are conserved in any bacteria, the phylogenetic

61
analysis of the SSP operon was performed. The analysis results were revealed that bacteria
conserved all genes of SSP operon belonged to Alphaproteobacteria, Betaproteobacteria and
Gammaproteobacteria (Fig. 4.5). In particular, SSP operon tended to be conserved in the
Gammaproteobacteria.
4.4 Conclusion
In comparative proteome analysis, the 2 genes and 1 operon as the specific expression
genes in soil determined. Furthermore, expression factor of SSP was estimated to be the soil
components. From result of phylogenetic analysis, the SSP operon was conserved in
proteobacteria. In this analysis, it was possible to detect the protein expression of P. putida F1
which was reflected soil environmental factors. Using this proteome analysis method, it is
possible to predict the environmental information. From this research method, I
was able to analyze in detail the expression protein of bacteria that survive in soil,
and it was possible to understand the physiological and genetic environmental
response in situ different from the physiological conditions in vitro. By applying to
other microbial species this study method, a better understanding of lifestyle and
autecology in each native habitat of the target bacteria is expected.

62
Table 4.1 Total number of identified proteins in liquid medium,
soybean soil, maize soil and forest soil
Sample
Total number of identified
proteins
Liquid medium 2643
Soybean soil 1364
Maize soil 1273
Forest soil 816

63
Table 4.2 List of soil specific proteins
emPAI
Pput Function liquid Soybean Maize Forest
0820 Hypothetical protein 0 3.2 0.5 0.5
0832 Nitric oxide dioxygenase 0 1.3 1.8 0.3
3040 Hypothetical protein 0 0.9 4.0 1.6
3041 Short chain dehydrogenase 0 6.9 13.9 1.5
3042 Hypothetical protein 0 5.4 8.8 2.4
3043 AMP-dependent synthetase and ligase 0 0.5 1.8 0.2
3044 Hypothetical protein 0 0.5 1.1 0.3
* liquid: LB_L, LB_S, MSM_L, MSM_S

64
Table 4.3 Expression factor in soil specific proteins
emPAI
Sample 0820 0832 3040 3041 3042 3043 3044
MSM
Shake culture 0 0 0 0 0 0 0
Static culture 0 0 0 0 0 0 0
Soil extract Liquid
Soybean 0.82 0 0.73 2.62 2.27 0.48 0.69
Maize 0 0 1.12 8.14 5.64 0.81 0.44
Forest 1.22 0 10.99 30.77 12.85 2.97 1.67

65
Fig. 4.1 SDS-PAGE of proteins of P. putida F1 cells grown in LB- log phase (LB-log),
LB-stationary phase (LB-sta), MSM- log phase (MSM-log), MSM-stationary phase
(MSM-sta), soybean soil (Sy), maize soil (Ma) and forest soil (Fo).

66
Fig. 4.2 Venn diagram showing soil specific proteins in soybean, maize and forest soils

67
Fig. 4.3 Expression of soil specific proteins in soil with and without P. putida F1.

68
Fig 4.4 Expression profiling of the constituent genes of alkaline phosphatase of P. putida F1
cells grown in soil and liquid culture
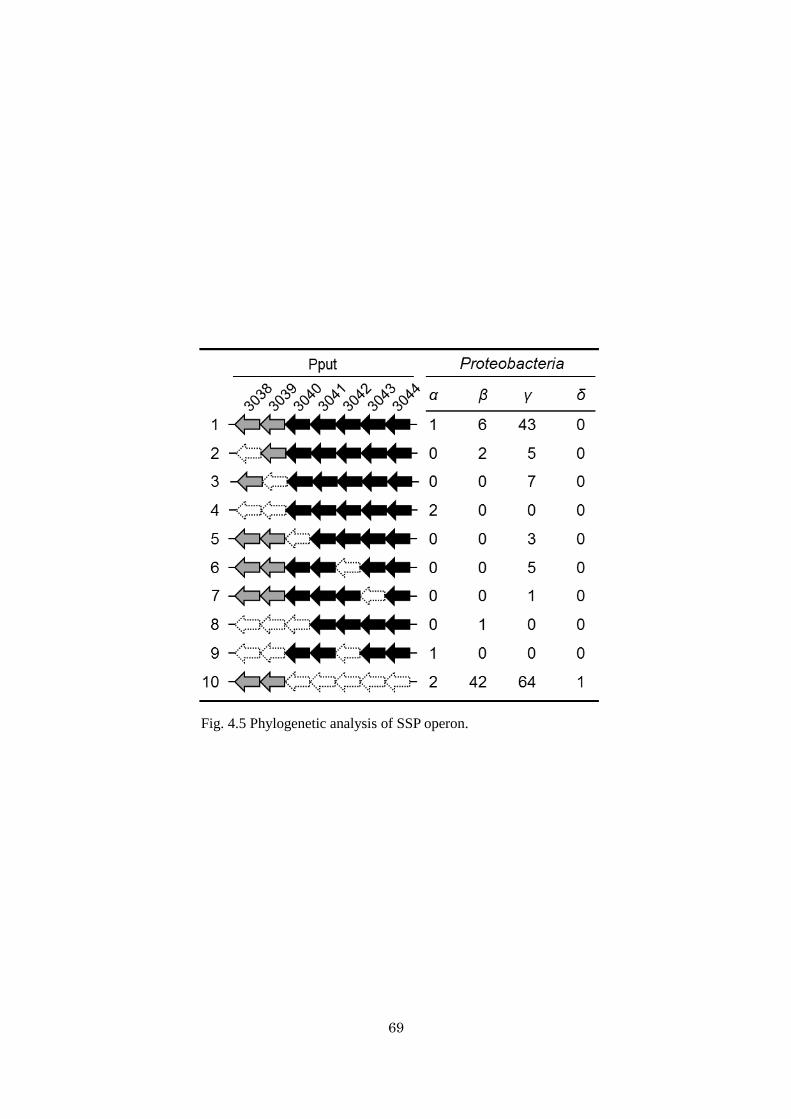
69
Fig. 4.5 Phylogenetic analysis of SSP operon.

70
References
Barbey C, Crepin A, Cirou A, Budin-Verneuil A, Orange N, Feuilloley M, Faure D, Dessaux Y,
Burini JF & Latour X (2012) Catabolic pathway of gamma-caprolactone in the biocontrol agent
Rhodococcus erythropolis. Journal of Proteome Research 11: 206-216.
Bastida F, Nicolas C, Moreno JL, Hernandez T & Garcia C (2010) Tracing changes in the microbial
community of a hydrocarbon-polluted soil by culture-dependent proteomics. Pedosphere 20:
479-485.
Benndorf D, Balcke GU, Harms H & von Bergen M (2007) Functional metaproteome analysis of
protein extracts from contaminated soil and groundwater. The ISME Journal 1: 224-234.
Benndorf D, Thiersch M, Loffhagen N, Kunath C & Harms H (2006) Pseudomonas putida KT2440
responds specifically to chlorophenoxy herbicides and their initial metabolites. Proteomics 6:
3319-3329.
Biddle JF, Fitz-Gibbon S, Schuster SC, Brenchley JE & House CH (2008) Metagenomic signatures
of the Peru Margin subseafloor biosphere show a genetically distinct environment. Proceedings of
the National Academy of Sciences of the United States of America 105: 10583-10588.
Bramer CO & Steinbuchel A (2001) The methylcitric acid pathway in Ralstonia eutropha: new genes
identified involved in propionate metabolism. Microbiology 147: 2203-2214.

71
Brock TD (1987) The study of microorganisms in situ: progress and problems. Symposia of the
Society for General Microbiology 41: 1-17.
Caspi R, Altman T, Dreher K, Fulcher CA, Subhraveti P, Keseler IM, Kothari A, Krummenacker M,
Latendresse M, Mueller LA, Ong Q, Paley S, Pujar A, Shearer AG, Travers M, Weerasinghe D,
Zhang P & Karp PD. (2012) The MetaCyc database of metabolic pathways and enzymes and the
BioCyc collection of pathway/genome databases. Nucleic Acids Research 40: D742-D753.
Claes WA, Puhler A & Kalinowski J (2002) Identification of two prpDBC gene clusters in
Corynebacterium glutamicum and their involvement in propionate degradation via the
2-methylcitrate cycle. Journal of Bacteriology 184: 2728-2739.
Curreem SO, Watt RM, Lau SK & Woo PC (2012) Two-dimensional gel electrophoresis in bacterial
proteomics. Protein & Cell 3: 346-363.
Daniel R (2005) The metagenomics of soil. Nature Reviews Microbiology 3: 470-478.
DeLong EF, Preston CM, Mincer T, Rich V, Hallam SJ, Frigaard NU, Martinez A, Sullivan M B,
Edwards R, Brito BR, Chisholm SW & Karl DM. (2006) Community genomics among stratified
microbial assemblages in the ocean's interior. Science 311: 496-503.
Ding X & Henrichs SM (2002) Adsorption and desorption of proteins and polyamino acids by clay
minerals and marine sediments. Marine Chemistry 77: 225-237.

72
Eaton RW (1996) p-Cumate catabolic pathway in Pseudomonas putida F1: cloning and
characterization of DNA carrying the cmt operon. Journal of Bacteriology 178: 1351-1362.
Eaton RW (1997) p-Cymene catabolic pathway in Pseudomonas putida F1: cloning and
characterization of DNA encoding conversion of p-cymene to p-cumate. Journal of Bacteriology
179: 3171-3180.
Ferrer M, Beloqui A, Timmis KN & Golyshin PN (2009) Metagenomics for Mining New Genetic
Resources of Microbial Communities. Journal of Molecular Microbiology and Biotechnology 16:
109-123.
Fierer N, Bradford MA & Jackson RB (2007) Toward an ecological classification of soil bacteria.
Ecology 88: 1354-1364.
Gans J, Wolinsky M & Dunbar J (2005) Computational improvements reveal great bacterial
diversity and high metal toxicity in soil. Science 309: 1387-1390.
Gardner PR, Costantino G & Salzman AL (1998) Constitutive and adaptive detoxification of nitric
oxide in Escherichia coli. Role of nitric-oxide dioxygenase in the protection of aconitase. The
Journal of Biological Chemistry 273: 26528-26533.
Gardner PR, Gardner AM, Martin LA & Salzman AL (1998) Nitric oxide dioxygenase: an enzymic
function for flavohemoglobin. Proceedings of the National Academy of Sciences of the United States
of America 95: 10378-10383.
73
Gibson DT, Koch JR & Kallio RE (1968) Oxidative degradation of aromatic hydrocarbons by
microorganisms. I. Enzymatic formation of catechol from benzene. Biochemistry 7: 2653-2662.
Gong YH, Li MS, Xu D, Wang H, He J, Wu DD, Chen DJ, Qiu N, Bao QY, Sun M & Yu ZN (2012)
Comparative proteomic analysis revealed metabolic changes and the translational regulation of Cry
protein synthesis in Bacillus thuringiensis. Journal of Proteomics 75: 1235-1246.
Graham C, McMullan G & Graham RL (2011) Proteomics in the microbial sciences. Bioengineered
Bugs 2: 17-30.
Graves PR & Haystead TA (2002) Molecular biologist's guide to proteomics. Microbiology and
Molecular Biology Reviews : MMBR 66: 39-63.
Grimek TL & Escalante-Semerena JC (2004) The acnD genes of Shewenella oneidensis and Vibrio
cholerae encode a new Fe/S-dependent 2-methylcitrate dehydratase enzyme that requires prpF
function in vivo. Journal of Bacteriology 186: 454-462.
Gygi SP, Rist B, Gerber SA, Turecek F, Gelb MH & Aebersold R (1999) Quantitative analysis of
complex protein mixtures using isotope-coded affinity tags. Nature Biotechnology 17: 994-999.
Handelsman J (2004) Metagenomics: Application of genomics to uncultured microorganisms.
Microbiology and Molecular Biology Reviews 68: 669-685.

74
Hecker M, Antelmann H, Buettner K & Bernhardt J (2008) Gel-based proteomics of Gram-positive
bacteria: A powerful tool to address physiological questions. Proteomics 8: 4958-4975.
Horswill AR & Escalante-Semerena JC (1997) Propionate catabolism in Salmonella typhimurium
LT2: two divergently transcribed units comprise the prp locus at 8.5 centisomes, prpR encodes a
member of the sigma-54 family of activators, and the prpBCDE genes constitute an operon. Journal
of Bacteriology 179: 928-940.
Horswill AR & Escalante-Semerena JC (1999) Salmonella typhimurium LT2 catabolizes propionate
via the 2-methylcitric acid cycle. Journal of Bacteriology 181: 5615-5623.
Ishihama Y, Oda Y, Tabata T, Sato T, Nagasu T, Rappsilber J & Mann M (2005) Exponentially
modified protein abundance index (emPAI) for estimation of absolute protein amount in proteomics
by the number of sequenced peptides per protein. Molecular & Cellular Proteomics 4: 1265-1272.
Jimenez JI, Minambres B, Garcia JL & Diaz E (2002) Genomic analysis of the aromatic catabolic
pathways from Pseudomonas putida KT2440. Environmental Microbiology 4: 824-841.
Kasahara Y, Morimoto H, Kuwano M & Kadoya R (2012) Genome-wide analytical approaches
using semi-quantitative expression proteomics for aromatic hydrocarbon metabolism in
Pseudomonas putida F1. Journal of Microbiological Methods 91: 434-442.

75
Keiblinger KM, Wilhartitz IC, Schneider T, Roschitzki B, Schmid E, Eberl L, Riedel K &
Zechmeister-Boltenstern S (2012) Soil metaproteomics – Comparative evaluation of protein
extraction protocols. Soil Biology and Biochemistry 54: 14-24.
Kim YH, Cho K, Yun SH, Kim JY, Kwon KH, Yoo JS & Kim SI (2006) Analysis of aromatic
catabolic pathways in Pseudomonas putida KT 2440 using a combined proteomic approach:
2-DE/MS and cleavable isotope-coded affinity tag analysis. Proteomics 6: 1301-1318.
Knief C, Delmotte N, Chaffron S, Stark M, Innerebner G, Wassmann R, Von Mering C & Vorholt JA
(2012) Metaproteogenomic analysis of microbial communities in the phyllosphere and rhizosphere
of rice. The ISME Journal 6: 1378-1390.
Kurbatov L, Albrecht D, Herrmann H & Petruschka L (2006) Analysis of the proteome of
Pseudomonas putida KT2440 grown on different sources of carbon and energy. Environmental
Microbiology 8: 466-478.
Kuwana R, Kasahara Y, Fujibayashi M, Takamatsu H, Ogasawara N & Watabe K (2002) Proteomics
characterization of novel spore proteins of Bacillus subtilis. Microbiology-Sgm 148: 3971-3982.
Lau PC, Wang Y, Patel A, Labbe D, Bergeron H, Brousseau R, Konishi Y & Rawlings M (1997) A
bacterial basic region leucine zipper histidine kinase regulating toluene degradation. Proceedings of
the National Academy of Sciences of the United States of America 94: 1453-1458.

76
Lee SE, Seo JS, Keum YS, Lee KJ & Li OX (2007) Fluoranthene metabolism and associated
proteins in Mycobacterium sp JS14. Proteomics 7: 2059-2069.
Li YX, Wu JL, Wang W, Ding P & Feng L (2012) Proteomics analysis of aromatic catabolic
pathways in thermophilic Geobacillus thermodenitrificans NG80-2. Journal of Proteomics 75:
1201-1210.
Lindahl V & Bakken LR (1995) Evaluation of methods for extraction of bacteria from soil. FEMS
Microbiology Ecology 16: 135-142.
Mastroleo F, Leroy B, Van Houdt R, s'Heeren C, Mergeay M, Hendrickx L & Wattiez R (2009)
Shotgun proteome analysis of Rhodospirillum rubrum S1H: Integrating data from gel-free and
gel-based peptides fractionation methods. Journal of Proteome Research 8: 2530-2541.
Menn FM, Zylstra GJ & Gibson DT (1991) Location and sequence of the Todf gene encoding
2-hydroxy-6-oxohepta-2,4-dienoate hydrolase in Pseudomonas putida F1. Gene 104: 91-94.
Monnet V (2003) Bacterial oligopeptide-binding proteins. Cellular and MolecularLife Sciences 60:
2100-2114.
Moreno R, Martinez-Gomariz M, Yuste L, Gil C & Rojo F (2009) The Pseudomonas putida Crc
global regulator controls the hierarchical assimilation of amino acids in a complete medium:
Evidence from proteomic and genomic analyses. Proteomics 9: 2910-2928.

77
Munoz R, Diaz LF, Bordel S & Villaverde S (2007) Inhibitory effects of catechol accumulation on
benzene biodegradation in Pseudomonas putida F1 cultures. Chemosphere 68: 244-252.
Nelson KE, Weinel C, Paulsen IT, Dodson RJ, Hilbert H, dos Santos VAPM, Fouts DE, Gill SR, Pop
M, Holmes M, Brinkac L, Beanan M, DeBoy RT, Daugherty S, Kolonay J, Madupu R, Nelson W,
White O, Peterson J, Khouri H, Hance I, Lee PC, Holtzapple E, Scanlan D, Tran K, Moazzez A,
Utterback T, Rizzo M, Lee K, Kosack D, Moestl D, Wedler H, Lauber J, Stjepandic D, Hoheisel J,
Straetz M, Heim S, Kiewitz C, Eisen J, Timmis KN, Dusterhoft A, Tummler B & Fraser CM (2002)
Complete genome sequence and comparative analysis of the metabolically versatile Pseudomonas
putida KT2440. Environmental Microbiology 4: 799-808.
Ogata H, Goto S, Sato K, Fujibuchi W, Bono H & Kanehisa M (1999) KEGG: Kyoto Encyclopedia
of Genes and Genomes. Nucleic Acids Research 27: 29-34.
Oldenhuis R, Kuijk L, Lammers A, Janssen DB & Witholt B (1989) Degradation of chlorinated and
non-chlorinated aromatic solvents in soil suspensions by pure bacterial cultures. Applied
Microbiology and Biotechnology 30: 211-217.
Parales RE, Ditty JL & Harwood CS (2000) Toluene-degrading bacteria are chemotactic towards the
environmental pollutants benzene, toluene, and trichloroethylene. Applied and Environmental
Microbiology 66: 4098-4104.

78
Phoenix P, Keane A, Patel A, Bergeron H, Ghoshal S & Lau PC (2003) Characterization of a new
solvent-responsive gene locus in Pseudomonas putida F1 and its functionalization as a versatile
biosensor. Environmental Microbiology 5: 1309-1327.
Rickwood D, Ford T & Graham J (1982) Nycodenz: A new nonionic iodinated gradient medium.
Analytical Biochemistry 123: 23-31.
Roma-Rodrigues C, Santos PM, Benndorf D, Rapp E & Sa-Correia I (2010) Response of
Pseudomonas putida KT2440 to phenol at the level of membrane proteome. Journal of Proteomics
73: 1461-1478.
Ross PL, Huang YLN, Marchese JN, Williamson B, Parker K, Hattan S, Khainovski N, Pillai S, Dey
S, Daniels S, Purkayastha S, Juhasz P, Martin S, Bartlet-Jones M, He F, Jacobson A & Pappin DJ
(2004) Multiplexed protein quantitation in Saccharomyces cerevisiae using amine-reactive isobaric
tagging reagents. Molecular & Cellular Proteomics 3: 1154-1169.
Saeed AI, Hagabati NK, Braisted JC, Liang W, Sharov V, Howe EA, Li JW, Thiagarajan M, White
JA & Quackenbush J (2006) TM4 microarray software suite. DNA Microarrays, Part B: Databases
and Statistics 411: 134-193.
Saeed AI, Sharov V, White J, Li J, iang W, Bhagabati N, Braisted J, Klapa M, Currier T, Thiagarajan
M, Sturn A, Snuffin M, Rezantsev A, Popov D, Ryltsov A, Kostukovich E, Borisovsky I, Liu Z,
Vinsavich A, Trush V & Quackenbush J (2003) TM4: A free, open-source system for microarray data
management and analysis. Biotechniques 34: 374.

79
Santos PM, Benndorf D & Sa-Correia I (2004) Insights into Pseudomonas putida KT2440 response
to phenol-induced stress by quantitative proteomics. Proteomics 4: 2640-2652.
Schmidt A, Kellermann J & Lottspeich F (2005) A novel strategy for quantitative proteomics using
isotope-coded protein labels. Proteomics 5: 4-15.
Shinoda K, Tomita M & Ishihama Y (2010) emPAI Calc – for the estimation of protein abundance
from large-scale identification data by liquid chromatography-tandem mass spectrometry.
Bioinformatics 26: 576-577.
Taylor EB & Williams MA (2010) Microbial protein in soil: influence of extraction method and C
amendment on extraction and recovery. Microbial Ecology 59: 390-399.
Teufel R, Mascaraque V, Ismail W, Voss M, Perera J, Eisenreich W, Haehnel W & Fuchs G (2010)
Bacterial phenylalanine and phenylacetate catabolic pathway revealed. Proceedings of the National
Academy of Sciences of the United States of America 107: 14390-14395.
Thompson DK, Chourey K, Wickham GS, Thieman SB, VerBerkmoes NC, Zhang B, McCarthy AT,
Rudisill MA, Shah M & Hettich RL (2010) Proteomics reveals a core molecular response of
Pseudomonas putida F1 to acute chromate challenge. Bio Med Central Genomics 11: 311.
Torsvik V & Ovreas L (2002) Microbial diversity and function in soil: from genes to ecosystems.
Current Opinion in Microbiology 5: 240-245.

80
Torsvik V, Goksoyr J & Daae FL (1990) High diversity in DNA of soil bacteria. Applied and
Environmental Microbiology 56: 782-787.
Torsvik V, Ovreas L & Thingstad TF (2002) Prokaryotic diversity--magnitude, dynamics, and
controlling factors. Science 296: 1064-1066.
Tringe SG, von Mering C, Kobayashi A, Salamov AA, Chen K, Chang HW, Podar M, Short JM,
Mathur EJ, Detter JC, Bork P, Hugenholtz P & Rubin EM (2005) Comparative metagenomics of
microbial communities. Science 308: 554-557.
Uchiyama I (2003) MBGD: microbial genome database for comparative analysis. Nucleic Acids
Research 31: 58-62.
Uchiyama I, Higuchi T & Kawai M (2010) MBGD update 2010: Toward a comprehensive resource
for exploring microbial genome diversity. Nucleic Acids Research 38: D361-365.
Vilain S, Luo Y, Hildreth MB & Brozel VS (2006) Analysis of the life cycle of the soil saprophyte
Bacillus cereus in liquid soil extract and in soil. Applied and Environmental Microbiology 72:
4970-4977.
Wada A, Igarashi K, Yoshimura S, Aimoto S & Ishihama A (1995) Ribosome modulation factor:
stationary growth phase-specific inhibitor of ribosome functions from Escherichia coli. Biochemical
and Biophysical Research Communications 214: 410-417.

81
Wada A, Mikkola R, Kurland CG & Ishihama A (2000) Growth phase-coupled changes of the
ribosome profile in natural isolates and laboratory strains of Escherichia coli. Journal of
Bacteriology 182: 2893-2899.
Wang HB, Zhang ZX, Li H, He HB, Fang CX, Zhang AJ, Li QS, Chen RS, Guo XK, Lin HF, Wu
LK, Lin S, Chen T, Lin RY, Peng XX & Lin WX (2011) Characterization of metaproteomics in crop
rhizospheric soil. Journal of Proteome Research 10: 932-940.
Wang Y, Rawlings M, Gibson DT, Labbe D, Bergeron H, Brousseau R & Lau PCK (1995)
Identification of a membrane protein and a truncated LysR-type regulator associated with the toluene
degradation pathway in Pseudomonas putida F1. Molecular & General Genetics 246: 570-579.
Wilkins MR, Gasteiger E, Sanchez JC, Bairoch A & Hochstrasser DF (1998) Two-dimensional gel
electrophoresis for proteome projects: the effects of protein hydrophobicity and copy number.
Electrophoresis 19: 1501-1505.
Williams MA, Taylor EB & Mula HP (2010) Metaproteomic characterization of a soil microbial
community following carbon amendment. Soil Biology & Biochemistry 42: 1148-1156.
Wu L, Wang H, Zhang Z, Lin R & Lin W (2011) Comparative metaproteomic analysis on
consecutively Rehmannia glutinosa-monocultured rhizosphere soil. PloS one 6: e20611.
Wu XA, Monchy S, Taghavi S, Zhu W, Ramos J & van der Lelie D (2011) Comparative genomics
and functional analysis of niche-specific adaptation in Pseudomonas putida. FEMS Microbiology
Reviews 35: 299-323.

82
Xu J (2006) Microbial ecology in the age of genomics and metagenomics: concepts, tools, and
recent advances. Molecular Ecology 15: 1713-1731.
Yu H, Tang HZ, Wang LJ, Yao YX, Wu G & Xu P (2011) Complete genome sequence of the
nicotine- degrading Pseudomonas putida Strain S16. Journal of Bacteriology 193: 5541-5542.
Yun SH, Park GW, Kim JY, Kwon SO, Choi CW, Leem SH, Kwon KH, Yoo JS, Lee C, Kim S &
Kim SI (2011) Proteomic characterization of the Pseudomonas putida KT2440 global response to a
monocyclic aromatic compound by iTRAQ analysis and 1DE-MudPIT. Journal of Proteomics 74:
620-628.
Zylstra GJ & Gibson DT (1989) Toluene degradation by Pseudomonas putida F1. Nucleotide
sequence of the todC1C2BADE genes and their expression in Escherichia coli. Journal of Biological
Chemistry 264: 14940-14946.
Zylstra GJ, McCombie WR, Gibson DT & Finette BA (1988) Toluene degradation by Pseudomonas
putida F1. Genetic organization of the tod operon. Applied and environmental microbiology 54:
1498-1503.

83
Acknowledgement
I would like to express my sincere appreciation to Dr. Yasuhiro Kasahara, for scientific advice,
discussion, support, and encouragement during doctoral course. I am also grateful to Dr. Ryosuke
Kadoya and Masayoshi Kuwano for proteome analysis, critical advices and suggestions. I appreciate
the help of Risa Yoshihisa for the manipulation of in-gel digestion. I thank Drs. Manabu Fukui,
Masaaki Morikawa and Satoshi Okabe for suggestive comments. I would like to appreciate all
member of Microbial Ecology Laboratory for their supports. Finally, I would like to thank my
families for support and understanding.

84
Abstract in Japanese
Proteomics on environmental response of Pseudomonas putida F1 in soil
(土壌における Pseudomonas putida F1の環境応答に関するプロテオーム解析)
微生物は地球上のあらゆる環境に生存している。近年では、メタプロテオミクスによ
り、環境における微生物群集の遺伝子発現レベルにおける機能解析が行われてきているが、
現状のメタプロテオミクスにおいて、複雑な複合系の中で特定個体の個生態を理解するこ
とは困難である。また、土壌環境で微生物がどのような遺伝子を発現し生存しているのか
を研究した例は極めて少ない。本論文では、土壌環境における特定の微生物に着目し、土
壌内における環境応答をプロテオーム解析で解析した。第 2 章では、液体培地で培養した
土壌細菌 Pseudomonas putida F1株の芳香族炭化水素分解に関与するタンパク質群をプロテ
オーム解析により明らかにした。第 3章では、土壌内における P. putida F1株の芳香族炭化
水素の添加に対する応答を解析した。土壌内における P. putida F1株の芳香族分解関連タン
パク質発現を全て検出できたことを踏まえ、第 4章では複雑な土壌環境に対する P. putida F1
株の環境応答として土壌環境でのみ特異的に発現する遺伝子の解析に着目した。
P. putida F1株は芳香族炭化水素(トルエン、エチルベンゼン、ベンゼン)を TCAサ
イクルの中間代謝物に分解できることが知られている。トルエン、エチルベンゼン、ベン
ゼンの分解に関与するタンパク質を決定するために、これら芳香族炭化水素を唯一の炭素
源として添加した液体培地で培養した P. putida F1 株からの細胞内タンパク質は、1-D
SDS-PAGEと LC-MS/MSを用いて同定した。本論文では、ラベルフリーな emPAIに基づい
た半定量的なプロテオーム解析アプローチを用いた。各種培養系からタンパク質セットを
比較解析した結果、P. putida F1株のトルエン、エチルベンゼン、ベンゼンの分解に関与す
るToluene degradation (Tod) pathway、エチルベンゼンの分解に関与する2-methylcitrate (2-MC)
cycle およびベンゼンの分解に関与する β-ketoadipate pathway に関与する全ての主要タンパ
ク質を同定した。さらに、todオペロンの発現を制御する二成分制御系 (TodST) や todオペ
ロンの下流に位置する solvent effux pumps (SepRABC) についても同定した。これらの結果
から、P. putida F1株の液体培養におけるプロテオーム解析で半定量法による解析法を確立
し、芳香族炭化水素分解に関与する遺伝子を明らかにした。
実際の土壌環境における P. putida F1株の芳香族炭化水素に対する応答を解析し、実験
室内で得られた知見が実際の環境において反映されているのかを明らかにすることを試み
た。土壌環境中における P. putida F1株の芳香族炭化水素分解関与タンパク質の発現変化を
解析するため、グルコースを添加した園芸用土壌に P. putida F1株を接種し 3日間の培養を
行った後、その培養土壌に芳香族炭化水素(トルエン、エチルベンゼン、ベンゼン)をそ
れぞれ添加し、培養を継続した。土壌培養した P. putida F1株からのタンパク質抽出は、密
度勾配遠心分離法を用いて土壌から細胞を分画した後、その細胞分画を用いて行った。抽
出タンパク質は、二次元電気泳動法 (2-DE) および一次元電気泳動法 (1-D SDS-PAGE) によ
る分離後、質量分析計 (nanoLC-MS/MS) および Mascot 検索を用いてタンパク質の同定を
行った。2-DE/LC-MS/MS解析は、トルエン、ベンゼン、エチルベンゼンを添加した土壌で
培養した P. putida F1株から、それら芳香族炭化水素の分解に主要な 22タンパク質のうち、
12のタンパク質を検出できた。エチルベンゼンを添加した土壌の 1-D SDS-PAGE/LC-MS/MS
解析では、約 1260の P. putida F1株タンパク質を同定した。エチルベンゼン分解に関与する

85
全て主要タンパク質、トランスポーターおよびセンサータンパク質は、液体培養と同様に
高発現した。これらの結果から、P. putida F1株の土壌環境中における芳香族炭化水素の分
解様式は、実験室内で得られた結果と同様であることを示した。従って、P. putida F1株の
芳香族化合物の分解は、実験室内で得られた知見を実際の環境で反映していることを明ら
かにした。本解析アプローチは、土壌内での P. putida F1株の環境変化に対する応答をタン
パク質レベルで解析できたことから、土壌に生息する微生物の理解に貢献できる可能性を
示した。
未だ細菌ゲノム解析株において多くの機能未知遺伝子が存在する。これらの機能未知
遺伝子の中には、細菌が生来生息する環境でのみ発現・機能する遺伝子が存在すると考え
られた。本研究では、P. putida F1株の土壌培養系と液体培養系に対して、比較プロテオー
ム解析を行い、土壌環境特異的な発現タンパク質の検出および解析を行った。P. putida F1
株は、0.5%グルコースを添加した土壌(大豆畑、コーン畑、森林)に接種し、3日間、30℃
で培養した。土壌培養した P. putida F1株からのタンパク質抽出は、密度勾配遠心分離法と
SDS-フェノール法を用いて行った。抽出タンパク質は 1-D SDS-PAGE後、質量分析計およ
び Mascot検索を用いて同定した。プロテオーム解析により、大豆土壌、野菜土壌および森
林土壌において、それぞれ 1364、1273、816 タンパク質を同定した。比較プロテオーム解
析において、土壌特異的に発現する 2 つの遺伝子および 1 オペロンを特定した。それら遺
伝子は、一酸化窒素ジオキシゲナーゼおよび機能未知遺伝子を含んだ。一方のオペロンは、
二成分制御遺伝子を含む 7 つの遺伝子で構成された機能未知のオペロンであった。また、
土壌特異的オペロンの発現因子について、多種微生物間相互作用の生物学的側面や土壌の
物理的・化学的側面から検討を行った結果、土壌成分がその発現に関与していることが推
測された。さらに、この土壌特異的オペロンについて系統解析を行った結果、主にプロテ
オバクテリア門に保存されている遺伝子群であることが示された。
本論文において、土壌内で P. putida F1株の芳香族炭化水素に対する応答をタンパク質
レベルで検出することができ、液体培養と比較において同様の主要分解タンパク質を発現
することを示した。また、土壌という環境要因による P. putida F1株の土壌特異的発現タン
パク質を特定することができた。本研究手法より、土壌に生息する細菌の発現タンパク質
を詳細に解析することができ、試験管内での生理状態とは異なった現場での生理学的・遺
伝学的な環境応答を理解することが可能となった。本研究手法を他の微生物種に応用する
ことで、対象とする微生物のそれぞれの生息環境における個生態学やライフスタイルの理
解を深めることが期待される。