Proteomic Analysis of Recombinant Saccharomyces cerevisiae ...
Upload
trinhthienCategory
view
216download
0
©FUNPEC-RP www.funpecrp.com.brGenetics and Molecular Research 15 (1): gmr.15017254
Proteomic changes in maize as a response to heavy metal (lead) stress revealed by iTRAQ quantitative proteomics
G.K. Li1,3*, J. Gao4*, H. Peng1,2, Y.O. Shen1, H.P. Ding1, Z.M. Zhang1, G.T. Pan1 and H.J. Lin1
1Key Laboratory of Biology and Genetic Improvement of Maize in Southwest Region, Ministry of Agriculture, Maize Research Institute of Sichuan Agricultural University, Wenjiang, Sichuan, China2Sichuan Tourism University, Chengdu, Sichuan, China3Guangdong Provincial Key Laboratory of Crops Genetics and Improvement, Guangdong Academy of Agricultural Sciences, Crop Research Institute, Guangzhou, China4Key Laboratory of Tumor Immunopathology, Institute of Pathology and Southwest Cancer Center, Southwest Hospital, Third Military Medical University, Ministry of Education, Chongqing, China
*These authors contributed equally to this study.Corresponding authors: G.T. Pan / H.J. LinE-mail: [email protected] / [email protected]
Genet. Mol. Res. 15 (1): gmr.15017254Received September 14, 2015Accepted November 5, 2015Published January 26, 2016DOI http://dx.doi.org/10.4238/gmr.15017254
ABSTRACT. Lead (Pb), a heavy metal, has become a crucial pollutant in soil and water, causing not only permanent and irreversible health problems, but also substantial reduction in crop yields. In this study, we conducted proteome analysis of the roots of the non-hyperaccumulator inbred maize line 9782 at four developmental stages (0, 12, 24, and 48 h) under Pb pollution using isobaric tags for relative and absolute quantification technology. A total of 252, 72 and 116 proteins were differentially expressed between M12 (after 12-h Pb treatment) and CK (water-mocked

2G.K. Li et al.
©FUNPEC-RP www.funpecrp.com.brGenetics and Molecular Research 15 (1): gmr.15017254
treatment), M24 (after 24-h Pb treatment) and CK, and M48 (after 48-h Pb treatment) and CK, respectively. In addition, 14 differentially expressed proteins were common within each comparison group. Moreover, Cluster of Orthologous Groups enrichment analysis revealed predominance of the proteins involved in posttranslational modification, protein turnover, and chaperones. Additionally, the changes in protein profiles showed a lower concordance with corresponding alterations in transcript levels, indicating important roles for transcriptional and posttranscriptional regulation in the response of maize roots to Pb pollution. Furthermore, enriched functional categories between the successive comparisons showed that the proteins in functional categories of stress, redox, signaling, and transport were highly up-regulated, while those in the functional categories of nucleotide metabolism, amino acid metabolism, RNA, and protein metabolism were down-regulated. This information will help in furthering our understanding of the detailed mechanisms of plant responses to heavy metal stress by combining protein and mRNA profiles.
Key words: Pb pollution; Isobaric tags for relative and absolute quantification; Differentially expressed proteins
INTRODUCTION
Plants are frequently subjected to various environmental stresses, such as cold, heat, drought, flooding, salt, light, and pollutants (including heavy metals) (Tester and Bacic, 2005), which have marked effects on plant vigor and crop yields. Recent studies have shown that environmental pollution due to heavy metals represents a serious threat to living organisms. Lead (Pb) has become the most important metal pollutant of the environment because of widespread heavy metal pollution from agriculture, industry, and other human activities (Valko et al., 2005). Plants have developed various abilities to cope with and adapt to stress conditions by changing levels of protein, displaying a relative abundance of stress-responsive proteins in the proteome. To investigate the expression and modification of all proteins in an organism, high-throughput analyses for proteome studies have been developed, aided by advancements in mass spectrometry, genome sequencing, and bioinformatics (Miernyk and Hajduch, 2011).
Maize has a relatively high proportion of its biomass in its roots; therefore, maize could be an important model to study the phytoremediation of Pb-contaminated soil. Previous studies have indicated that a range of gene regulatory mechanisms control the accumulation capacity of Pb in plants, including transcription factors, transport proteins, and some critical genes, which were activated in response to both biotic and abiotic stresses and were involved in certain signal transduction and secondary metabolite pathways (Atkinson and Urwin, 2012; Thapa et al., 2012; Fan et al., 2013). In a previous study, we assayed Pb contents in the roots and aboveground parts of 19 inbred lines of maize seedlings. We selected the non-hyperaccumulator maize germplasm 9782 with Pb accumulation in roots, stems, and leaves under Pb conditions, and compared these individuals with the hyperaccumulator 178 (Zhang et al., 2012). In addition, transcriptomic changes during maize root development in response to Pb were investigated in the non-hyperaccumulator maize germplasm 9782 using RNA sequencing (Gao et al., 2015), as well as the dynamics of

3Proteomic changes in response to lead stress
©FUNPEC-RP www.funpecrp.com.brGenetics and Molecular Research 15 (1): gmr.15017254
DNA methylation in maize germplasm 9782 roots under Pb stress (Ding et al., 2014). However, proteomic alteration profiling involved in various metabolic functions associated with Pb pollution is still uncertain.
In our research, considering that limited information is available with regard to the response of maize roots to Pb pollution, we generated a transcriptome, measuring the relative or absolute expression of protein during the response of maize roots to Pb stress. The recently developed isobaric tag for relative and absolute quantification (iTRAQ) system was used to accurately quantify differentially expressed proteins (DEPs), by measuring peak intensities of reporter ions in tandem mass spectrometry (MS/MS) spectra. DEPs were identified using iTRAQ and the expression patterns at the protein level correlated with transcript levels were investigated.
MATERIAL AND METHODS
Plant materials and experimental design
Seeds of maize (Zea mays) inbred line 9782 were sown on filter paper saturated with distilled water and incubated at 26°C in the dark. Seedlings with uniform growth were selected after three days, transplanted into an aerated complete nutrient solution (see Table S1), and grown in a growth chamber as follows: seedlings were maintained for three days with a 14-h light/10-h dark photoperiod at 26°C and a relative humidity of 70%. After that, the maize seedlings were randomly divided into four groups. CK (water-mocked treatment)-grown (C1A) seedlings were grown only in half-strength Hoagland solution, while Pb1000-grown seedlings were grown in CK + Pb1000 [1000 mg/L Pb(NO3)2] to achieve Pb stress for 12, 24, and 48 h, respectively.
Protein extraction
Protein was extracted using the trichloroacetic acid (TCA)/acetone method (Sheoran et al., 2009) with modifications. Tuber cubes with 10% polyvinyl-polypyrrolidone were ground in liquid nitrogen and suspended in 5 volumes of chilled (20°C) acetone containing 10% TCA (w/v). The homogenate was then precipitated for 2 h at 20°C and centrifuged at 20,000 g for 20 min at 4°C. The supernatant was carefully removed, and the protein pellets were washed three times with chilled acetone. Washed protein pellets were air-dried and dissolved in 500 mL 0.5 M triethylammonium bicarbonate (TEAB) for 15 min under 200 W sonication, and centrifuged at 30,000 g for 20 min at 4°C. Then, the disulfide bonds were reduced in 10 mM dithiothreitol at 56°C for 1 h and followed by alkylation in 55 mM iodoacetamide for 45 min. The supernatant was precipitated overnight at 20°C by the addition of 5 volumes of chilled acetone before centrifuging. The air-dried pellet was dissolved in 500 mL 0.5 M TEAB for 15 min under 200 W sonication. The supernatant was collected as the soluble protein fraction after centrifugation at 30,000 g for 15 min at 4°C. Protein concentration was estimated as a standard using the Bio-Rad protein assay kit (Bio-Rad, Hercules, CA, USA) with bovine serum albumin. The quality of each protein sample was evaluated using sodium dodecyl sulfate-polyacrylamide gel electrophoresis.
iTRAQ labeling and mass spectrometry analysis
iTRAQ labeling and mass spectrometry analysis were performed at the Beijing Genomics Institute (Shenzhen, China) according to the method described by Gan et al. (2007). From each

4G.K. Li et al.
©FUNPEC-RP www.funpecrp.com.brGenetics and Molecular Research 15 (1): gmr.15017254
sample, 100 µg reduced and alkylated protein was digested using sequencing-grade trypsin (Promega Corporation, Beijing) and labeled using iTRAQ 8-plex kits (Applied Biosystems, USA) according to the manufacturer protocol. M12 samples were labeled with reagent 113 and 118, M24 samples were labeled with reagent 114 and 119, and M48 samples were labeled with reagent 115 and 121. After labeling and quenching, the samples were combined and further fractionated by strong cation exchange (SCX) chromatography on an Ultramax SCX column using Shimadzu LC-20AB HPLC. The fractionated samples were analyzed by nano-LC-MS/MS. Peak lists were generated with the Proteome Discoverer 1.3 software.
Proteomic data analysis
Proteins were identified and quantified simultaneously using the Mascot software (version 2.3.02, Matrix Science), and then searched against the maize protein database with the following search parameters: trypsin was chosen as the enzyme with one missed cleavage allowed; fixed modifications of carbamidomethylation at Cys; variable modifications of oxidation at Met; peptide tolerance was set at 0.05 Da and MS/MS tolerance at 0.1 Da; and monoisotopic mass was chosen. iTRAQ 8-plex was chosen for quantification during the search. Protein quantitation was performed at the peptide level by following the procedures described in http://www.matrixscience.com/help/ quant_statistics_help.html. Proteins with changes of 1.5-fold or greater between successive comparisons and a P value of statistical evaluation less than 0.05 were determined as differentially expressed proteins. The MapMan 3.6.0RC1 tool (http://mapman.gabipd.org/web/guest) was used to display expression profiles at the pathway level. Expression values were calculated based on a log2 scale and used to visualize the metabolic processes.
Comparison of protein and mRNA expression profiles
To compare changes in protein abundance with alterations in transcript levels, we conducted RNA sequencing experiments using the same materials as described in protein extraction. RNA extraction (Cat. No. 15596-026, Invitrogen) and RNA sequencing library construction (Illumina protocol) were performed following manufacturer instructions. In this study, the quantified proteins were quantitatively compared and clustered into four groups based on mRNA and protein levels. These groups were i) mRNA and protein levels having the same trends, ii) mRNA and protein levels having opposite change trends, iii) protein levels changing significantly while the mRNA was unchanged, and iv) mRNA levels changing significantly while the protein remains unchanged. Pearson correlation tests were conducted using expression ratios of M12 vs CK, M24 vs CK, and M48 vs CK, respectively.
RESULTS
Overview of quantitative proteome analysis
The proteome of maize roots responsive to Pb pollution were quantitatively cataloged using iTRAQ technology. Briefly, proteins were extracted, digested, and iTRAQ-labeled in solution. Of those, unlabeled peptides were excluded from the data sets; iTRAQ-labeled peptides were analyzed using liquid chromatography combined with tandem mass spectroscopy. Of the 352,944
5Proteomic changes in response to lead stress
©FUNPEC-RP www.funpecrp.com.brGenetics and Molecular Research 15 (1): gmr.15017254
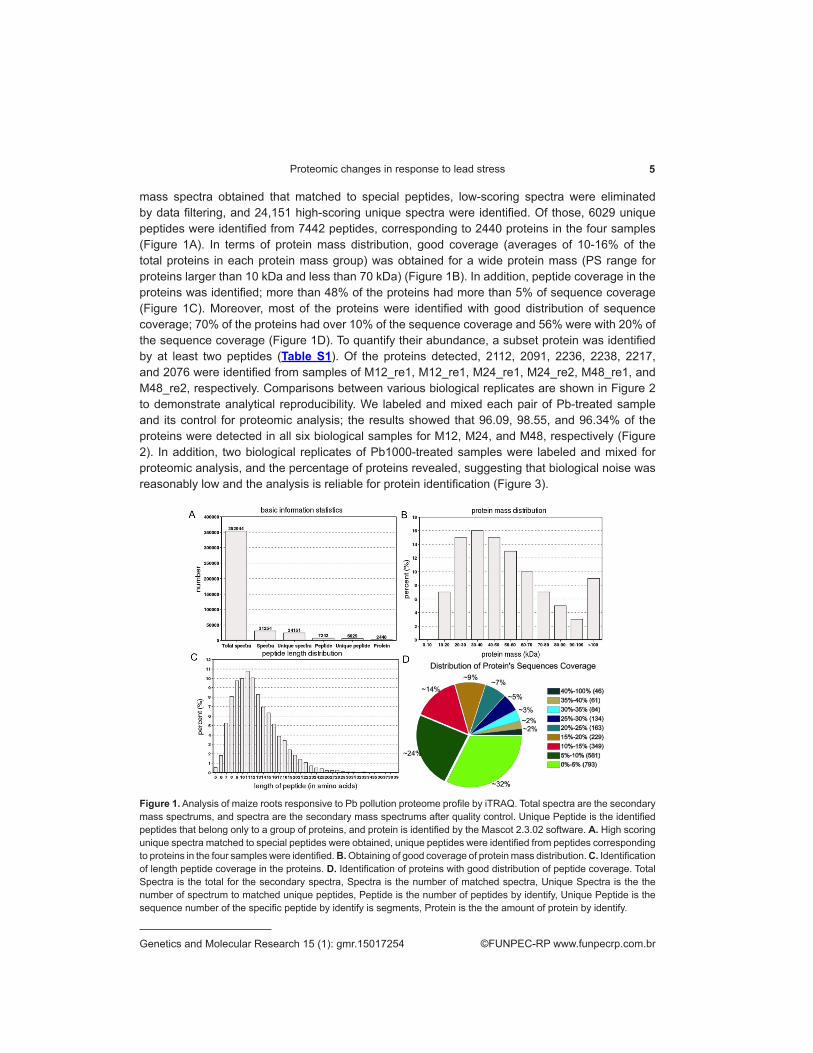
mass spectra obtained that matched to special peptides, low-scoring spectra were eliminated by data filtering, and 24,151 high-scoring unique spectra were identified. Of those, 6029 unique peptides were identified from 7442 peptides, corresponding to 2440 proteins in the four samples (Figure 1A). In terms of protein mass distribution, good coverage (averages of 10-16% of the total proteins in each protein mass group) was obtained for a wide protein mass (PS range for proteins larger than 10 kDa and less than 70 kDa) (Figure 1B). In addition, peptide coverage in the proteins was identified; more than 48% of the proteins had more than 5% of sequence coverage (Figure 1C). Moreover, most of the proteins were identified with good distribution of sequence coverage; 70% of the proteins had over 10% of the sequence coverage and 56% were with 20% of the sequence coverage (Figure 1D). To quantify their abundance, a subset protein was identified by at least two peptides (Table S1). Of the proteins detected, 2112, 2091, 2236, 2238, 2217, and 2076 were identified from samples of M12_re1, M12_re1, M24_re1, M24_re2, M48_re1, and M48_re2, respectively. Comparisons between various biological replicates are shown in Figure 2 to demonstrate analytical reproducibility. We labeled and mixed each pair of Pb-treated sample and its control for proteomic analysis; the results showed that 96.09, 98.55, and 96.34% of the proteins were detected in all six biological samples for M12, M24, and M48, respectively (Figure 2). In addition, two biological replicates of Pb1000-treated samples were labeled and mixed for proteomic analysis, and the percentage of proteins revealed, suggesting that biological noise was reasonably low and the analysis is reliable for protein identification (Figure 3).
Figure 1. Analysis of maize roots responsive to Pb pollution proteome profile by iTRAQ. Total spectra are the secondary mass spectrums, and spectra are the secondary mass spectrums after quality control. Unique Peptide is the identified peptides that belong only to a group of proteins, and protein is identified by the Mascot 2.3.02 software. A. High scoring unique spectra matched to special peptides were obtained, unique peptides were identified from peptides corresponding to proteins in the four samples were identified. B. Obtaining of good coverage of protein mass distribution. C. Identification of length peptide coverage in the proteins. D. Identification of proteins with good distribution of peptide coverage. Total Spectra is the total for the secondary spectra, Spectra is the number of matched spectra, Unique Spectra is the the number of spectrum to matched unique peptides, Peptide is the number of peptides by identify, Unique Peptide is the sequence number of the specific peptide by identify is segments, Protein is the the amount of protein by identify.

6G.K. Li et al.
©FUNPEC-RP www.funpecrp.com.brGenetics and Molecular Research 15 (1): gmr.15017254
Figure 2. Comparisons between various biological replicates to demonstrate the analytical reproducibility, each pair of Pb-treated samples and its control for proteomic analysis were labeled in all six biological samples for M12, M24 and M48, respectively.
Figure 3. Different proteins identified by two biological replicates. To further elucidate the global function of proteins responsive to Pb pollution, the detected proteins were categorized into different functional groups based on the Cluster of Orthologous Groups (COG) database. Expect for general function prediction only, the percentages of proteins involved in posttranslational modification, protein turnover, and chaperones were dominant, indicating that post-transcriptional regulation plays an vital roles in maize roots responsive to Pb pollution (Figure 4).

7Proteomic changes in response to lead stress
©FUNPEC-RP www.funpecrp.com.brGenetics and Molecular Research 15 (1): gmr.15017254
Functional annotation analysis of differences in proteome
To further identify the DEPs in maize roots under Pb stress, proteins with > 1.5-fold difference and P value < 0.05 were regarded as being differentially expressed (Gan et al., 2007). DEP levels of the developmental stages after Pb pollution were compared with those of the mock-treatment control (M12 vs CK, M24 vs CK and M48 vs CK). Of these, 252 proteins were screened as differentially expressed between M12 and CK, including 115 proteins that were up-regulated and 137 that were down-regulated; 72 proteins experienced significant up- (35) or down-regulation (37) between M24 and CK and 116 proteins experienced significant up- (57) or down-regulation (59) between M48 and CK (Table 1). In addition, 14 DEPs were found to be common between M12 and CK, M24 and CK, and M48 and CK. Cluster analysis showed that 4 DEPs were increased and 10 DEPs were induced after Pb1000 treatment. However, most of them were significantly increasing during the maize roots’ response to Pb treatment (Figure 5). Interestingly, based on the differentially expressed genes identified by RNAseq in our study, most DEPs also were identified in the M12 vs CK comparison, suggesting that M12 represents the most active period of the response of maize roots to Pb stress.
Figure 4. Cluster of Orthologus Groups (COG) analysis of differentially expressed proteins in maize roots responsive to Pb pollution. Shown above is the classification of these proteins in different categories based on biological process.

8G.K. Li et al.
©FUNPEC-RP www.funpecrp.com.brGenetics and Molecular Research 15 (1): gmr.15017254
Accession No. Cov Unique Spectrum Unique Peptide Log2 (Treat/CK) Description
GRMZM2G024354_P01 19.6 17 1 2.43 60S ribosomal protein L15GRMZM2G358059_P01 24.9 3 1 2.41 Calreticulin2GRMZM2G015361_P01 27.6 23 5 2.11 GTP bindingGRMZM2G039639_P01 4.8 7 1 1.79 Protein P21GRMZM2G002825_P01 15.8 17 2 1.59 Actin-depolymerizing factor 3GRMZM2G014240_P01 12.3 7 2 1.38 Inorganic diphosphatase activityAC233895.1_FGP001 17.8 28 7 1.08 Proliferation-associated protein 2G4GRMZM2G052562_P01 2.5 6 1 0.93 Zea nodulation homolog1GRMZM2G036099_P03 13.6 8 2 0.91 Calcium ion bindingGRMZM2G162426_P01 3.4 6 3 0.89 Catalytic activityGRMZM5G877500_P01 5.1 5 2 0.87 Catalytic activityGRMZM2G033208_P01 14.4 38 7 0.80 Catalytic activityGRMZM2G015361_P01 27.6 23 5 0.70 GTP bindingGRMZM2G113696_P01 18.8 21 3 0.69 Translation initiation factor 5AGRMZM2G085967_P01 29.0 65 8 0.69 Peroxidase 39GRMZM2G358059_P01 24.9 3 1 0.66 Calreticulin2GRMZM2G008247_P01 20.2 12 1 0.65 Beta-D-glucosidase precursorGRMZM2G058675_P02 29.3 42 9 0.65 Restorer of fertility2GRMZM2G109677_P03 15.2 37 7 0.62 Structural constituent of ribosomeGRMZM2G109677_P03 15.2 37 7 0.62 Structural constituent of ribosomeGRMZM2G178693_P01 14.4 15 3 0.60 Plasma membrane intrinsic proteinGRMZM2G154169_P01 14.5 9 2 -0.62 GRF-interacting factor 2-likeGRMZM2G107073_P01 11.7 23 4 -0.63 Glycoside hydrolase, family 28GRMZM2G000326_P01 38.6 18 2 -0.63 Subtilisin-chymotrypsin inhibitor CI-1BGRMZM2G305046_P01 28.9 12 1 -0.64 Histone2A1GRMZM2G038636_P01 6.4 12 2 -0.68 Cysteine proteaseGRMZM2G050514_P01 33.1 10 4 -0.68 Glutamine synthetaseAC197758.3_FGP004 15.9 21 3 -0.70 Peroxidase 52GRMZM2G145440_P01 7.5 3 1 -0.73 Receptor kinase 1GRMZM2G117989_P01 5.1 9 1 -0.81 Defense response to bacteriumGRMZM2G146246_P02 36.2 21 6 -0.82 Glutathione S-transferase4GRMZM2G003306_P01 29.5 10 1 -0.83 NucleosomeGRMZM2G057608_P01 28.7 16 3 -0.90 40S ribosomal protein S25-1GRMZM2G156632_P01 9.8 12 1 -1.02 WIP1GRMZM2G039639_P01 4.8 7 1 -1.03 Protein P21GRMZM2G374971_P01 16.7 14 3 -1.13 Stress-induced protein1GRMZM2G005633_P02 21 8 3 -1.15 Chitinase activityGRMZM2G304442_P01 20.1 15 3 -1.35 Extracellular regionGRMZM2G075624_P01 24.0 16 2 -1.35 Translationally controlled tumor protein-like ProteinGRMZM2G078314_P01 16.9 4 1 -1.36 NucleosomeGRMZM2G031545_P01 23.6 15 4 -1.44 Elongation factor 1-delta 1GRMZM2G057608_P01 28.7 16 3 -1.49 40S ribosomal protein S25-1GRMZM2G051879_P03 28.3 2 2 -1.91 NucleosomeGRMZM2G158568_P01 11.4 7 2 -1.97 60S ribosomal protein L31GRMZM2G117989_P01 5.1 9 1 -2.77 Defense response to bacteriumGRMZM2G083016_P01 15.7 6 2 -13.35 Phosphoglycerate kinase activity
Accession represent the protein code; coverage values represent the coverage (%) of each protein assigned by a peptides; unique peptide represent the unique peptide align to the protein; CK vs M48 represent the protein abundance at CK is compared to that at M48.
Table 1. DEPs between M48 and CK.
To further study the function of proteins related to Pb stress responsiveness, DEPs were also clustered according to expression changes during the developmental stages after Pb pollution-most proteins between M12 vs CK, M24 vs CK, and M48 vs CK demonstrated forward expression patterns using the MapMan program. Additionally, enriched functional categories between the successive comparisons showed that the proteins in functional categories of stress, redox, signaling, and transport were highly up-regulated, while proteins in functional categories of nucleotide metabolism, amino acid metabolism, RNA, and protein metabolism were down-regulated (Figure 6).

9Proteomic changes in response to lead stress
©FUNPEC-RP www.funpecrp.com.brGenetics and Molecular Research 15 (1): gmr.15017254
Figure 5. Common DEPs identified shared between each group, such as M12 vs CK, M24 vs CK and M48 vs CK. Cluster analysis showed increased and decreased DEPs induced by Pb treatment.
Figure 6. Differentially expressed proteins (DEPs) corresponded to expression changes during the developmental stages after Pb pollution. Clustered and enriched functional categories between the successive comparisons were conducted using MapMan program.

10G.K. Li et al.
©FUNPEC-RP www.funpecrp.com.brGenetics and Molecular Research 15 (1): gmr.15017254
These results suggested that the stress and redox-related metabolism was mainly activated during the developmental stages after Pb pollution, and the metabolites, along with related signaling pathway and transport proteins, also increased to respond to Pb1000 treatment (Table S2).
Comparison of transcriptome and proteome expression
RNA sequencing provided the following numbers of high-quality clean reads from the respective stages: 19,562,150 from CK, 19,171,257 from M12, 19,248,546 from M24, and 17,813,916 from M48. These corresponded to 17,707, 17,440, 16,998, and 16,586 genes identified in maize roots at the four developmental stages (0, 12, 24, and 48 h), respectively. Also, 2825, 2626, 2161, and 2260 stage-specific genes at successive time points were screened, based on the absolute fold change value of log2 ratio >1 with P < 0.001 and FDR < 0.001 (data not shown).
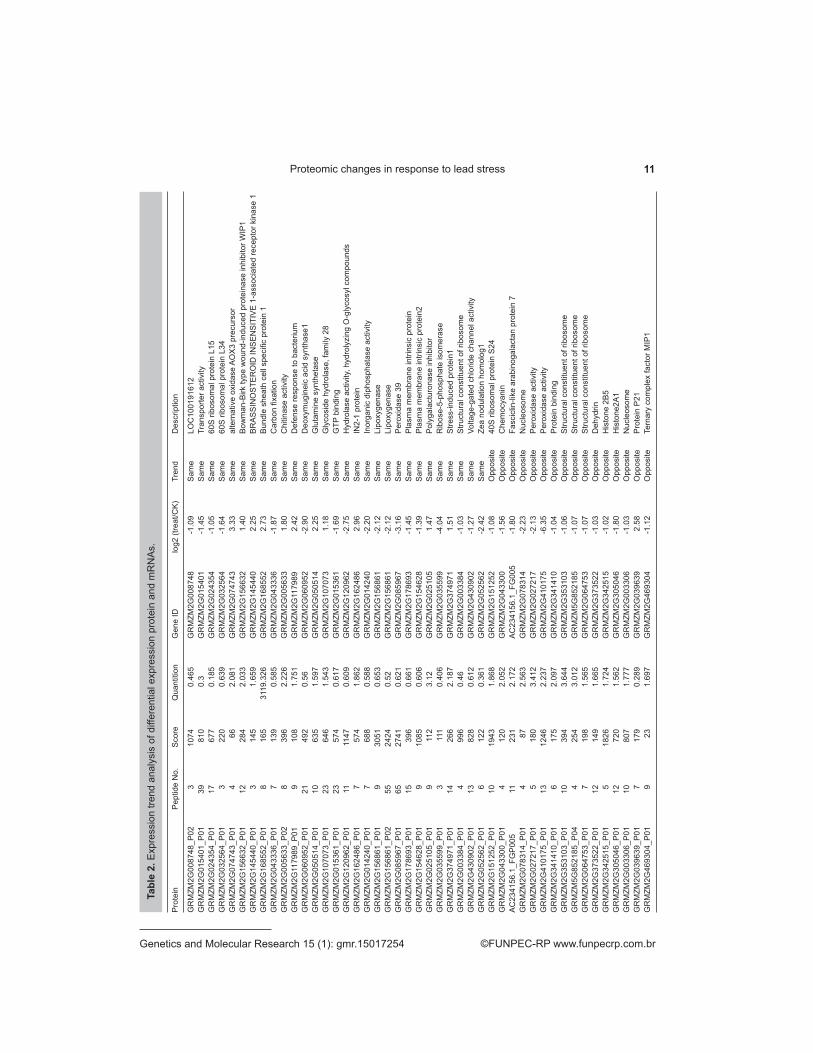
To compare changes in protein abundance with alterations in transcript levels in maize roots responsive to Pb1000 treatment, the correlation between protein and mRNA expression profiles were further comprehensively investigated by comparing M12 vs CK, M24 vs CK, and M48 vs CK. Of 252 proteins that changed significantly in terms of abundance between M12 vs CK, only 41 of their corresponding transcripts were found to be differentially expressed. For M24 vs CK and M48 vs CK, of 72 and 116 proteins corresponding to 19 and 37 transcripts, respectively, some DEPs have the same or opposite change trends with their association mRNA in transcriptome level, some DEPs were significantly changed in proteasome level but the cognate mRNAs were not significantly changed. (Table 2). Next, the correlation between differentially expressed proteins and mRNAs was comprehensively investigated in the comparison of M12 vs CK, M24 vs CK, and M48 vs CK. Concordance tests revealed a positive correlation of r of 0.409, 0.318, and 0.4642 between protein and mRNAs for the significant change (Figure 7). This indicated that a change in transcript abundance may or may not translate into changes in protein level. Posttranscriptional regulatory processes such as protein-protein interactions, redox systems, processes of reversible phosphorylation, and some mediatory molecules may affect the efficiency of translation.
DISCUSSION
DEPs between Pb1000-grown and control groups
In the current study, the effects of heavy metal lead (Pb) on the proteome was investigated using quantitative proteomics to uncover Pb-regulated protein regulatory mechanisms in maize roots. However, previous studies have shown that transcription and translation do not always correlate well with each other. Therefore, our proteomic analysis may reveal novel players involved in heavy metal regulatory pathways. The iTRAQ method was used to identify putative DEPs potentially responsive to heavy metal pollution, and 14 DEPs were identified as being common within each comparison group (M12 vs CK, M24 vs CK, M48 vs CK). Of these 14 common DEPs in all examined time points, two plasma membrane intrinsic proteins (GRMZM2G178693_P01 and GRMZM2G154628_P01) were identified among the proteins that were up-regulated in M24 Pb-pollution conditions and then down-regulated in M48. Plasma membrane intrinsic proteins (PIPs), a subfamily of aquaporins, can control the translocation of water across the membrane. Previous studies have reported that, in various plant species, gene expression and function of
11Proteomic changes in response to lead stress
©FUNPEC-RP www.funpecrp.com.brGenetics and Molecular Research 15 (1): gmr.15017254
Pro
tein
P
eptid
e N
o.
Sco
re
Qua
ntiti
on
Gen
e ID
lo
g2 (t
reat
/CK
) Tr
end
Des
crip
tion
GR
MZM
2G00
8748
_P02
3
1074
0.
465
GR
MZM
2G00
8748
-1
.09
Sam
e LO
C10
0191
612
GR
MZM
2G01
5401
_P01
39
81
0 0.
3 G
RM
ZM2G
0154
01
-1.4
5 S
ame
Tran
spor
ter a
ctiv
ityG
RM
ZM2G
0243
54_P
01
17
677
0.18
5 G
RM
ZM2G
0243
54
-1.0
5 S
ame
60S
ribo
som
al p
rote
in L
15G
RM
ZM2G
0325
64_P
01
3 22
0 0.
639
GR
MZM
2G03
2564
-1
.64
Sam
e 60
S ri
boso
mal
pro
tein
L34
GR
MZM
2G07
4743
_P01
4
66
2.08
1 G
RM
ZM2G
0747
43
3.33
S
ame
alte
rnat
ive
oxid
ase
AO
X3
prec
urso
rG
RM
ZM2G
1566
32_P
01
12
284
2.03
3 G
RM
ZM2G
1566
32
1.40
S
ame
Bow
man
-Birk
type
wou
nd-in
duce
d pr
otei
nase
inhi
bito
r WIP
1G
RM
ZM2G
1454
40_P
01
3 14
5 1.
659
GR
MZM
2G14
5440
2.
25
Sam
e B
RA
SS
INO
STE
RO
ID IN
SE
NS
ITIV
E 1
-ass
ocia
ted
rece
ptor
kin
ase
1G
RM
ZM2G
1685
52_P
01
8 16
5 31
19.3
26
GR
MZM
2G16
8552
2.
73
Sam
e B
undl
e sh
eath
cel
l spe
cific
pro
tein
1G
RM
ZM2G
0433
36_P
01
7 13
9 0.
585
GR
MZM
2G04
3336
-1
.87
Sam
e C
arbo
n fix
atio
nG
RM
ZM2G
0056
33_P
02
8 39
6 2.
226
GR
MZM
2G00
5633
1.
80
Sam
e C
hitin
ase
activ
ityG
RM
ZM2G
1179
89_P
01
9 10
8 1.
751
GR
MZM
2G11
7989
2.
42
Sam
e D
efen
se re
spon
se to
bac
teriu
mG
RM
ZM2G
0609
52_P
01
21
492
0.56
G
RM
ZM2G
0609
52
-2.9
0 S
ame
Deo
xym
ugin
eic
acid
syn
thas
e1G
RM
ZM2G
0505
14_P
01
10
635
1.59
7 G
RM
ZM2G
0505
14
2.25
S
ame
Glu
tam
ine
synt
heta
seG
RM
ZM2G
1070
73_P
01
23
646
1.54
3 G
RM
ZM2G
1070
73
1.18
S
ame
Gly
cosi
de h
ydro
lase
, fam
ily 2
8G
RM
ZM2G
0153
61_P
01
23
574
0.61
7 G
RM
ZM2G
0153
61
-1.6
9 S
ame
GTP
bin
ding
GR
MZM
2G12
0962
_P01
11
11
47
0.60
9 G
RM
ZM2G
1209
62
-2.7
5 S
ame
Hyd
rola
se a
ctiv
ity, h
ydro
lyzi
ng O
-gly
cosy
l com
poun
dsG
RM
ZM2G
1624
86_P
01
7 57
4 1.
862
GR
MZM
2G16
2486
2.
96
Sam
e IN
2-1
prot
ein
GR
MZM
2G01
4240
_P01
7
688
0.58
8 G
RM
ZM2G
0142
40
-2.2
0 S
ame
Inor
gani
c di
phos
phat
ase
activ
ityG
RM
ZM2G
1568
61_P
01
9 30
51
0.65
3 G
RM
ZM2G
1568
61
-2.1
2 S
ame
Lipo
xyge
nase
GR
MZM
2G15
6861
_P02
55
24
24
0.52
G
RM
ZM2G
1568
61
-2.1
2 S
ame
Lipo
xyge
nase
GR
MZM
2G08
5967
_P01
65
27
41
0.62
1 G
RM
ZM2G
0859
67
-3.1
6 S
ame
Per
oxid
ase
39G
RM
ZM2G
1786
93_P
01
15
396
0.66
1 G
RM
ZM2G
1786
93
-1.4
5 S
ame
Pla
sma
mem
bran
e in
trins
ic p
rote
inG
RM
ZM2G
1546
28_P
01
9 10
85
0.60
6 G
RM
ZM2G
1546
28
-1.3
9 S
ame
Pla
sma
mem
bran
e in
trins
ic p
rote
in2
GR
MZM
2G02
5105
_P01
9
112
3.12
G
RM
ZM2G
0251
05
1.47
S
ame
Pol
ygal
actu
rona
se in
hibi
tor
GR
MZM
2G03
5599
_P01
3
111
0.40
6 G
RM
ZM2G
0355
99
-4.0
4 S
ame
Rib
ose-
5-ph
osph
ate
isom
eras
eG
RM
ZM2G
3749
71_P
01
14
266
2.18
7 G
RM
ZM2G
3749
71
1.51
S
ame
Stre
ss-in
duce
d pr
otei
n1G
RM
ZM2G
0033
84_P
01
4 99
6 0.
46
GR
MZM
2G00
3384
-1
.03
Sam
e S
truct
ural
con
stitu
ent o
f rib
osom
eG
RM
ZM2G
4309
02_P
01
13
828
0.61
2 G
RM
ZM2G
4309
02
-1.2
7 S
ame
Volta
ge-g
ated
chl
orid
e ch
anne
l act
ivity
GR
MZM
2G05
2562
_P01
6
122
0.36
1 G
RM
ZM2G
0525
62
-2.4
2 S
ame
Zea
nodu
latio
n ho
mol
og1
GR
MZM
2G15
1252
_P01
10
19
43
1.86
8 G
RM
ZM2G
1512
52
-1.0
8 O
ppos
ite
40S
ribo
som
al p
rote
in S
24G
RM
ZM2G
0433
00_P
01
4 12
0 2.
052
GR
MZM
2G04
3300
-1
.56
Opp
osite
C
hem
ocya
nin
AC
2341
56.1
_FG
P00
5 11
23
1 2.
172
AC
2341
56.1
_FG
005
-1.8
0 O
ppos
ite
Fasc
iclin
-like
ara
bino
gala
ctan
pro
tein
7G
RM
ZM2G
0783
14_P
01
4 87
2.
563
GR
MZM
2G07
8314
-2
.23
Opp
osite
N
ucle
osom
eG
RM
ZM2G
0272
17_P
01
5 18
0 3.
412
GR
MZM
2G02
7217
-2
.13
Opp
osite
P
erox
idas
e ac
tivity
GR
MZM
2G41
0175
_P01
13
12
46
2.23
7 G
RM
ZM2G
4101
75
-6.3
5 O
ppos
ite
Per
oxid
ase
activ
ityG
RM
ZM2G
3414
10_P
01
6 17
5 2.
097
GR
MZM
2G34
1410
-1
.04
Opp
osite
P
rote
in b
indi
ngG
RM
ZM2G
3531
03_P
01
10
394
3.64
4 G
RM
ZM2G
3531
03
-1.0
6 O
ppos
ite
Stru
ctur
al c
onst
ituen
t of r
ibos
ome
GR
MZM
5G85
2185
_P04
4
254
3.01
2 G
RM
ZM5G
8521
85
-1.0
7 O
ppos
ite
Stru
ctur
al c
onst
ituen
t of r
ibos
ome
GR
MZM
2G06
4753
_P01
7
198
1.56
5 G
RM
ZM2G
0647
53
-1.0
7 O
ppos
ite
Stru
ctur
al c
onst
ituen
t of r
ibos
ome
GR
MZM
2G37
3522
_P01
12
14
9 1.
665
GR
MZM
2G37
3522
-1
.03
Opp
osite
D
ehyd
rinG
RM
ZM2G
3425
15_P
01
5 18
26
1.72
4 G
RM
ZM2G
3425
15
-1.0
2 O
ppos
ite
His
tone
2B
5G
RM
ZM2G
3050
46_P
01
12
720
1.56
2 G
RM
ZM2G
3050
46
-1.8
0 O
ppos
ite
His
tone
2A1
GR
MZM
2G00
3306
_P01
10
80
7 1.
777
GR
MZM
2G00
3306
-1
.03
Opp
osite
N
ucle
osom
eG
RM
ZM2G
0396
39_P
01
7 17
9 0.
289
GR
MZM
2G03
9639
2.
58
Opp
osite
P
rote
in P
21G
RM
ZM2G
4693
04_P
01
9 23
1.
697
GR
MZM
2G46
9304
-1
.12
Opp
osite
Te
rnar
y co
mpl
ex fa
ctor
MIP
1
Tabl
e 2.
Exp
ress
ion
trend
ana
lysi
s of
diff
eren
tial e
xpre
ssio
n pr
otei
n an
d m
RN
As.

12G.K. Li et al.
©FUNPEC-RP www.funpecrp.com.brGenetics and Molecular Research 15 (1): gmr.15017254
Figure 7. Correlation analysis between differentially expressed proteins and mRNA was comprehensively investigated in the comparison of each group, such as M12 vs CK, M24 vs CK and M48 vs CK. Concordance tests between protein and mRNAs for the significantly change were also conducted.
PIPs can be modulated by heavy metals such as cadmium, copper, and mercury (Guo et al., 2006). Expression of PsPIP2-1 showed an increasing trend after HgCl2 [mercury (II) chloride] treatment in Pisum sativum (Beaudette et al., 2007), whereas copper stress genes encoding plasmalemma PIP were down-regulated under copper application in Populus deltoides roots (Guerra et al., 2009). Similarly, 15 tags annotated to PIPs were significantly down-regulated, while two tags annotated to Arabidopsis PIPs were up-regulated in response to cadmium stress in Solanum torvum. Moreover, coexpression of nonfunctional ZmPIP1;1 and ZmPIP1;2 isoforms with functional ZmPIP2 protein could enhance their aquaporin activity significantly in maize (Fetter et al., 2004). Further study suggested that PIP1 trafficking would be required for the plasma membrane by PIP1-PIP2 interaction, thereby modulating plasma membrane permeability (Zelazny et al., 2007). We demonstrated that PIPs might facilitate the transport of molecules by modulating plasma membrane permeability in response to Pb pollution.
In addition, most of these down-regulated proteins are metal-ion binding, involved in heavy metal detoxification systems by the activation of metal ion transport pathways; for example, manganese ion binding (GRMZM2G030772_P01) and calcium ion binding (GRMZM2G036099_P03). Transporter proteins mediate metal uptake in root cells and metal transfer between cells and organs. Metal transporters are also involved in metal detoxification by mediating the transport of metals from the cytosol to the vacuolar compartment (Salt and Wagner, 1993; Salt and Rauser, 1995; Rea, 1999).
Moreover, numerous studies have demonstrated that chromatin regulation is involved in the expression of stress-associated genes, including protein P21 (GRMZM2G039639_P01) and histone2A1 (GRMZM2G305046_P01), as well as the structural constituent of ribosome protein (GRMZM2G109677_P03).
Pb-stress alters the expression of proteins in lipid metabolism and redox pathways
MapMan analysis was used to evaluate whether significant DEPs with great alteration due
13Proteomic changes in response to lead stress
©FUNPEC-RP www.funpecrp.com.brGenetics and Molecular Research 15 (1): gmr.15017254
to Pb stress were clustered in specific metabolic pathways. As expected, there was an increase in abundance of many proteins involved in amino acid metabolism as well as lipid and hormone metabolism in response to Pb stress. Two proteins with increased expression were found to be involved in lipid synthesis. Lipid metabolism is affected by heavy metal-induced oxidative stress, in varying degrees depending on concentration and tissue types (Gao et al., 2010).
In addition, some DEPs were identified as regulators for redox pathways. In plants, cellular redox homeostasis can sense and transfer reducing equivalents to numerous target proteins, which is maintained by NAD(P) H-dependent thioredoxin and glutaredoxin systems and involved in various adverse environments (Meyer et al., 2012). In addition, several studies have revealed that glutathione (GSH) acts as an important protection system against metal stress in plants. In Arabidopsis thaliana, Vanhoudt et al. (2010) demonstrated that the redox balance of GSH plays a vital role in protecting against uranium and cadmium stress. In Vicia faba, GSH content was increased by mercury stress level and related to the elimination of H2O2 via the ascorbate GSH cycle (Wang et al., 2010). Kalinowska and Pawlik-Skowrońska (2010) also reported that maintenance of a higher level of GSH was responsible for a higher resistance to copper concomitant with phytochelatin production.
In summary, DEPs associated with Pb stress were identified in our iTRAQ studies and most of them were found to be involved in lipid metabolism and redox pathways. Further characterization of these Pb-regulated proteins may provide new insights into the molecular mechanism of action of lead pollution in plants.
Conflicts of interest
The authors declare no conflict of interest.
ACKNOWLEDGMENTS
Research supported by grants from the National Science Foundation of China (#31171567), the Research Project on Rice Functional Genes related to the Maize Large-scale Gene Discovery and Functional Genomics Resource, Technology, Information Platform Construction Program “863” of China (#SS2012AA100107 and #2012AA10A300), the Science and Information Technology Bureau of Guangzhou (#2013J2200083), the Guangdong Province and Ministry of Education Production-Study-Research Program of China (#2012B091100467), the Foundation of the President of the Guangdong Academy of Agricultural Sciences (201407), and the Guangdong Province Science and Technology Program (#2013B020301015).
REFERENCES
Atkinson NJ and Urwin PE (2012). The interaction of plant biotic and abiotic stresses: from genes to the field. J. Exp. Bot. 63: 3523-3543. http://dx.doi.org/10.1093/jxb/ers100
Beaudette PC, Chlup M, Yee J and Emery RJ (2007). Relationships of root conductivity and aquaporin gene expression in Pisum sativum: diurnal patterns and the response to HgCl2 and ABA. J. Exp. Bot. 58: 1291-1300. http://dx.doi.org/10.1093/jxb/erl289
Ding H, Gao J, Qin C, Ma H, et al. (2014). The dynamics of DNA methylation in maize roots under Pb stress. Int. J. Mol. Sci. 15: 23537-23554. http://dx.doi.org/10.3390/ijms151223537
Fan XD, Wang JQ, Yang N, Dong YY, et al. (2013). Gene expression profiling of soybean leaves and roots under salt, saline-alkali and drought stress by high-throughput Illumina sequencing. Gene 512: 392-402. http://dx.doi.org/10.1016/j.
14G.K. Li et al.
©FUNPEC-RP www.funpecrp.com.brGenetics and Molecular Research 15 (1): gmr.15017254
gene.2012.09.100Fetter K, Van Wilder V, Moshelion M and Chaumont F (2004). Interactions between plasma membrane aquaporins modulate
their water channel activity. Plant Cell 16: 215-228. http://dx.doi.org/10.1105/tpc.017194Gan CS, Chong PK, Pham TK and Wright PC (2007). Technical, experimental, and biological variations in isobaric tags for
relative and absolute quantitation (iTRAQ). J. Proteome Res. 6: 821-827. http://dx.doi.org/10.1021/pr060474iGao J, Zhang Y, Lu C, Peng H, et al. (2015). The development dynamics of the maize root transcriptome responsive to heavy
metal Pb pollution. Biochem. Biophys. Res. Commun. 458: 287-293. http://dx.doi.org/10.1016/j.bbrc.2015.01.101Gao S, Ou-yang C, Tang L, Zhu JQ, et al. (2010). Growth and antioxidant responses in Jatropha curcas seedling exposed to
mercury toxicity. J. Hazard. Mater. 182: 591-597. http://dx.doi.org/10.1016/j.jhazmat.2010.06.073Guerra F, Duplessis S, Kohler A, Martin F, et al. (2009). Gene expression analysis of Populus deltoides roots subjected to
copper stress. Environ. Exp. Bot. 67: 335-344. http://dx.doi.org/10.1016/j.envexpbot.2009.08.004Guo L, Wang ZY, Lin H, Cui WE, et al. (2006). Expression and functional analysis of the rice plasma-membrane intrinsic protein
gene family. Cell Res. 16: 277-286. http://dx.doi.org/10.1038/sj.cr.7310035Kalinowska R and Pawlik-Skowrońska B (2010). Response of two terrestrial green microalgae (Chlorophyta, Trebouxiophyceae)
isolated from Cu-rich and unpolluted soils to copper stress. Environ. Pollut. 158: 2778-2785. http://dx.doi.org/10.1016/j.envpol.2010.03.003
Meyer Y, Belin C, Delorme-Hinoux V, Reichheld JP, et al. (2012). Thioredoxin and glutaredoxin systems in plants: molecular mechanisms, crosstalks, and functional significance. Antioxid. Redox Signal. 17: 1124-1160. http://dx.doi.org/10.1089/ars.2011.4327
Miernyk JA and Hajduch M (2011). Seed proteomics. J. Proteomics 74: 389-400. http://dx.doi.org/10.1016/j.jprot.2010.12.004Rea PA (1999). MRP subfamily ABC transporters from plants and yeast. J. Exp. Bot. 50: 895-913. http://dx.doi.org/10.1093/
jxb/50.Special_Issue.895Salt DE and Wagner GJ (1993). Cadmium transport across tonoplast of vesicles from oat roots. Evidence for a Cd2+/H+
antiport activity. J. Biol. Chem. 268: 12297-12302.Salt DE and Rauser WE (1995). MgATP-dependent transport of phytochelatins across the tonoplast of oat roots. Plant Physiol.
107: 1293-1301.Sheoran IS, Ross AR, Olson DJ and Sawhney VK (2009). Compatibility of plant protein extraction methods with mass
spectrometry for proteome analysis. Plant Sci. 176: 99-104. http://dx.doi.org/10.1016/j.plantsci.2008.09.015Tester M and Bacic A (2005). Abiotic stress tolerance in grasses. From model plants to crop plants. Plant Physiol. 137: 791-
793. http://dx.doi.org/10.1104/pp.104.900138Thapa G, Sadhukhan A, Panda SK and Sahoo L (2012). Molecular mechanistic model of plant heavy metal tolerance. Biometals
25: 489-505. http://dx.doi.org/10.1007/s10534-012-9541-yVanhoudt N, Vandenhove H, Horemans N, Wannijn J, et al. (2010). The combined effect of uranium and gamma radiation
on biological responses and oxidative stress induced in Arabidopsis thaliana. J. Environ. Radioact. 101: 923-930. http://dx.doi.org/10.1016/j.jenvrad.2010.06.008
Valko M, Morris H and Cronin MT (2005). Metals, toxicity and oxidative stress. Curr. Med. Chem. 12: 1161-1208. http://dx.doi.org/10.2174/0929867053764635
Wang CR, Tian Y, Wang XR, Yu HX, et al. (2010). Hormesis effects and implicative application in assessment of lead-contaminated soils in roots of Vicia faba seedlings. Chemosphere 80: 965-971. http://dx.doi.org/10.1016/j.chemosphere.2010.05.049
Zelazny E, Borst JW, Muylaert M, Batoko H, et al. (2007). FRET imaging in living maize cells reveals that plasma membrane aquaporins interact to regulate their subcellular localization. Proc. Natl. Acad. Sci. USA 104: 12359-12364. http://dx.doi.org/10.1073/pnas.0701180104
Zhang Z, Jin F, Wang C, Luo J, et al. (2012). Difference between Pb and Cd accumulation in 19 elite maize inbred lines and application prospects. J. Biomed. Biotechnol. 2012: 271485 http://dx.doi.org/10.1155/2012/271485.
Supplementary material
Table S1. Elementary proteomics data of maize roots repsonsive to Lead (Pb) revealed by iTRAQ.
Table S2. Differentially expressed proteins involved in different metabolic pathways.
www.geneticsmr.com/year2016/vol15-1/pdf/gmr7254_supplementary.pdf