Proteomic approach to flatfish aquaculture, study of the ......Andrés Calamaro (Dulce condena)...
276
DEPARTMENT of BIOCHEMISTRY and MOLECULAR BIOLOGY Doctoral Program in Biochemistry and Molecular Biology "PROTEOMIC APPROACH TO FLATFISH AQUACULTURE. STUDY OF THE REPRODUCTIVE BIOLOGY OF SOLEA SENEGALENSIS." IGNASI FORNÉ i FERRER MAY, 2007
Transcript of Proteomic approach to flatfish aquaculture, study of the ......Andrés Calamaro (Dulce condena)...
DEPARTMENT of BIOCHEMISTRY and MOLECULAR BIOLOGY
Doctoral Program in Biochemistry and Molecular Biology
"PROTEOMIC APPROACH TO FLATFISH AQUACULTURE.
STUDY OF THE REPRODUCTIVE BIOLOGY OF SOLEA
SENEGALENSIS."
IGNASI FORNÉ i FERRER
MAY, 2007

DEPARTMENT of BIOCHEMISTRY and MOLECULAR BIOLOGY
Doctoral Program in Biochemistry and Molecular Biology
Doctoral thesis presented by IGNASI FORNÉ FERRER to obtain the Ph.D. IN BIOCHEMISTRY AND MOLECULAR BIOLOGY This work has been carried out in the Proteomics Laboratory CSIC/UAB and in Oryzon
Genomics under the supervision of Dr. Joaquín Abian and Dr. Joan Cerdà.
Ph.D. candidate Ph.D. Supervisor IGNASI FORNÉ i FERRER Dr. JOAQUIN ABIAN MOÑUX
CSIC Research Scientist
Department Tutor Ph.D. Supervisor Dr. JAUME FARRÉS VICÉN Dr. JOAN CERDÀ LUQUE UAB Biochemistry and Molecular IRTA Research Scientist Biology Professor
Barcelona, May 2007

Veles e vents han mos desigs complir,
faent camins dubtosos per la mar.
Mestre i ponent contra d'ells veig armar;
xaloc, llevant, los deuen subvenir
ab llurs amics lo grec e lo migjorn,
fent humils precs al vent tramuntanal
que en son bufar los sia parcial
e que tots cinc complesquen mon retorn.
Bullirà el mar com la cassola en forn,
mudant color e l'estat natural,
e mostrarà voler tota res mal
que sobre si atur un punt al jorn.
Grans e pocs peixs a recors correran
e cercaran amagatalls secrets:
fugint al mar, on són nodrits e fets,
per gran remei en terra eixiran.
Ausiàs March (Veles e vents)
No importa el problema, no importa la solución,
me quedo con lo poco que queda, entero en el corazón.
Me gustan los problemas, no existe otra explicación.
Esta sí es una dulce condena, una dulce rendición.
Andrés Calamaro (Dulce condena)

Agraïments
En primer lloc agrair al Dr. Carlos Buesa i al Dr. Joaquin Abián la possibilitat de realitzar
el treball de tesi doctoral conjuntament al Laboratori de Proteómica CSIC-UAB i a
Oryzon Genomics, per la oportunitat que suposa combinar el dia a dia del creixement
d’una empresa biotecnològica i la convivència en un entorn acadèmic de referència en
espectrometria de masses i proteòmica.
Al Dr. Joaquín Abián (de nou) i al Dr. Joan Cerdà per la direcció de la tesis i per la seva
implicació personal, dedicació, suport i esforç en tot moment.
A tota la gent que ha participat en el disseny i realització del projecte Pleurogene, en
especial al Dr. Joan Cerdà per la coordinació general, i a la Dra. Tamara Maes per la
direcció científica des d’Oryzon Genomics.
Al Dr. Jaume Farrés per la tutoria d’aquest treball, per la seva col·laboració i
disponibilitat en tot moment.
A tota la gent que he conegut a Oryzon durant aquests gairebé quatre anys,
especialment a la Maite del Hierro, per ser una persona i companya de laboratori
excel·lent, per la seva responsabilitat i el seu humor (kapasao-i-yokezé!!); al Joaquin
(darrer cop) per la seves dosis de moral, experiència i temps quan les coses anaven
maldades; al Jaume Mercadé per la col·laboració en el darrer capítol i per les converses
sobre cóm canviar el món; al Dr. Toni Espinosa per la seva col·laboració en el primer
capítol i per estar sempre a punt per fer “unas risas”; a la Dra. Elisabet Rosell per la
seva mà esquerra i l’optimisme que transmet; al Xavi Calvo pel seu ajut en l’apartat de
microarrays i per cuidar-me la cadira durant les meves llargues absències; al Jaume, el
Jordi, l’Elena, el Roger i el Ricard per compartir l’experiència de fer una tesi dins de la
empresa (ànims, que hi ha una llum al final!!); i a tots els que heu participat en les
tertúlies després de dinar, en una sessió de youtube o senzillament amb un somriure en
un mal dia.
Als companys del Laboratori de Proteómica CSIC-UAB que ja hi eren quan vaig arribar,
en especial a la Dra. Montse Carrascal pel temps i les energies dedicades (si hay que
hacerlo, se hace…), i a la Dra. Carme Quero pels primers temps al lab; als que han
passat deixant petjada, en especial al Miguel Trigo per la convivència al “zulo”, i als que
Agraïments
us quedeu i encara m’acolliu de bon grat quan vinc de visita: Marina, David, Rebeca,
Vanesa i Cristina.
Al Dr. Francesc Canals per facilitar-me l’ús del Laboratori de Proteómica de Vall
d’Hebrón, a la Núria per les classes de Decyder i, junt amb la Cristina, per fer les hores
de Decyder/Typhoon molt més amenes.
Al Dr. Jaume Planas per la cessió dels resultats de microarrays del segon capítol.
Al Miquel Daura de “Common Sense” pel disseny de la portada i del CD.
A tots els que m’heu ajudat a créixer dins del món de la investigació en els diferents
centres on he tingut la sort de treballar, en especial al Dr. Cándido Juarez del
Departament d’Immunologia de l’Hospital de Sant Pau, per les primeres passes en el
món de la proteómica.
A tots els amics que heu col·laborat desinteressadament en el meu suport psicològic
durant aquests anys, a la Cristina i al Miquel per la Vila del Pingüí (i per tantes altres
coses…), a la Sónia i al Pedro per Madrids, Lisboas, París i Basileas, i a tots quatre
per uns quants Munichs; al Jordi i al Natxo per estar sempre a punt; a la colla de l’ESM
(ja sabeu qui sou…), per tant anys d’històries.
Al meu germà Oriol per tots els moments junts a casa, pistes, pavellons, gimnasos, bars
i festes majors: per ser com és.
Als meus pares, Anna i Ernest, per educar-me i fer-me créixer amb generositat,
convicció i amor, donant-me totes les oportunitats i les eines que m’han permès arribar
fins aquí.
A la meva dona Alexandra, per tenir les mides perfectes de “Cherry Blossom Girl”, de
“Limón y Sal” i d’“Alegria”; i a la meva filla Paula pels moments únics que he viscut i
espero viure. A totes dues, “I just want say “Hi” to the ones I love”.

Table of Contents

TOC
Abbreviations Introduction……………………………………………………………………………………………
I.1 Flatfish species……………………………………………………………………………
I.1.1 Flatfish aquaculture……………………………………………………….
I.1.2 Teleost spermatogenesis…………………………………………………
I.1.3 Special features of Solea senegalensis spermatogenesis…………..
I.1.4 Steroid role during spermatogenesis and spermiation in teleosts……
I.1.5 Hormone treatment approaches on flatfish spermatogenesis………..
I.2 Proteomics………………………………………………………………………………… I.2.1 Mass-spectrometry based proteomics………………………………….
I.2.2 Differential expression analysis in proteomics…………………………
I.2.3 Annotation of DNA databases using peptidic ESTs………………….
I.3 Applying proteomics to Solea senegalensis…………………………………..............
Objectives…………………………………………………………………………………………….. About the Pleurogene Project: understanding the frame of this PhD work……………
Chapter 1 De novo peptide sequencing of S. senegalensis larva and testis proteome using
two-dimensional liquid chromatography coupled to tandem mass
spectrometry……………………………………………………………………………..
1.1 Materials and methods………………………………………………………………….
1.1.1 Sample processing ……………………………………………………….
1.1.2 Two-dimensional LC MS-MS…………………………………………….
1.1.3 Data processing and refinement………………………………………...
1.2 Results……………………………………………………………………………………
1.2.1 Two-dimensional LC, de novo sequencing and BLAST comparison..
1.2.2 Methodological analysis: peptide charge distribution among 2-D LC..
1.2.3 Biological analysis: GO charts…………………………………………..
1.3 Discussion……………………………………………………………………………….
1.3.1 Methodological analysis………………………………………………….
1.3.2 Biological analysis………………………………………………………...
1
1
2
3
9
12
16
17
17
21
26
28
29
29
33
35
35
35
39
44
44
45
45
52
52
55

TOC
Chapter 2 Proteomic analysis of differentially expressed proteins in wild and cultured Solea
senegalensis during the spermatogenesis process………………………………….
2.1 Materials and methods…………………………………………………………………..
2.1.1 Biological samples…………………………………………………………
2.1.2 Histological analysis……………………………………………………….
2.1.3 Protein extraction…………………………………………………………..
2.1.4 Two-dimensional electrophoresis………………………………………..
2.1.5 Differential expression analysis and clustering…………………………
2.1.6 Determination of gel variation: Mr and pI variation…………………….
2.1.7 Determination of gel variation: Normalized volume variation…………
2.1.8 Protein identification……………………………………………………….
2.1.9 Bioinformatic analysis of MS/MS spectra……………………………….
2.1.10 Comparing sequenced peptides and identified proteins with S.
senegalensis ESTs………………………………………………………..
2.2 Results…………………………………………………………………………………….
2.2.1 Histological analysis……………………………………………………….
2.2.2 Two-dimensional electrophoresis………………………………………..
2.2.3 Differential expression analysis and clustering…………………………
2.2.4 Mass spectrometry and bioinformatic analysis…………………………
2.2.5 Comparison of sequenced peptides and identified proteins with S.
senegalensis ESTs………………………………………………………..
2.3 Discussion………………………………………………………………………………..
2.3.1 Gel Reproducibility………………………………………………………...
2.3.2 Expression analysis……………………………………………………….
2.3.3 Protein identification………………………………………………………
2.3.4 Use of genomic ESTs for annotation cross-validation…………………
2.3.5 Biological implications of variations in testis proteome………………..
2.3.6 Relationships between 2-D protein gel analysis and RNA microarray
data in F0 …………………………………………………………………..
Chapter 3 Effect of hormone treatments into testis proteome in cultured Solea
senegalensis. Study by 2-D DIGE…………………………………………………
3.1 Materials and methods…………………………………………………………………..
3.1.1 Fish hormone treatments…………………………………………………
3.1.2 Biological samples…………………………………………………………
3.1.3 Histological analysis……………………………………………………….
3.1.4 Determination of sperm density and motility……………………………
60
60
61
62
63
64
64
65
66
67
69
69
69
70
88
97
102
103106
108
112
119
121
122
122
122
123
123
59
60
100

TOC
3.1.5 Protein extraction…………………………………………………………
3.1.6 Two-dimensional DIGE………………………………………………….
3.1.7 Differential expression analysis and clustering……………………….
3.1.8 Protein identification……………………………………………………..
3.1.9 Microarray analysis of testis transcriptome in hormone-treated fish…
3.2 Results……………………………………………………………………………………
3.2.1 Effect of hormone treatments on spermatogenesis……………………
3.2.2 Determination of GSI, sperm density and motility……………………...
3.2.3 Two-dimensional DIGE: self-to-self analysis……………………………
3.2.4 Two-dimensional DIGE: evaluation experiment………………………..
3.2.5 Two-dimensional DIGE and clustering: hormone treatment analysis..
3.2.6 Mass spectrometry and Bioinformatic analysis…………………………
3.2.7 Comparison of sequenced peptides and identified proteins with S.
senegalensis ESTs………………………………………………………..
3.2.8 Relationships between 2-D protein gel analysis and mRNA
microarray data of testis from fish treated with hormones…………….
3.3 Discussion………………………………………………………………………………...
3.3.1 Effect of the hormone treatments on sperm and testis physiological
features……………………………………………………………………..
3.3.2 Evaluating DIGE for expression changes in testis proteome…………
3.3.3 DIGE of testis proteome after hormone treatment……………………..
3.3.4 Combining Mr, pI and sequencing information to validate protein
identification………………………………………………………………..
3.3.5 Biological implications……………………………………………………..
3.3.6 Complementing proteomic data with transcriptomic analysis…………
Chapter 4 Database for 2-D LC MS/MS and 2-D gel-experiments of S. senegalensis….
4.1 Materials and methods…………………………………………………………………..
4.1.1 Biological data……………………………………………………………..
4.1.2 Protein module database organization………………………………….
4.1.3 Application architecture and implementation…………………………...
4.2 Results…………………………………………………………………………………….
4.2.1 Pleuromold interfaces……………………………………………………..
4.2.2 Pleuromold queries………………………………………………………..
4.3 Discussion………………………………………………………………………………...
Conclusions…………………………………………………………………………………………...
128130
130
131
131
134
142
154
170
170
173
173
175
174
181
175
185
189
190
190
192194
194
195202
203
124
124
127
128
190

TOC
References……………………………………………………………………………………………..
Annexes………………………………………………………………………………………………..
Annex I…………………………………………………………………………………………
Annex I.1 GO charts comparison between S. senegalensis and O.
mykiss ……………………………………………………............
Annex I.2 GO charts of the proteins characterized by 2-D LC in S.
senegalensis…………………………………………………….
Annex I.3 Peptide charge distribution for the S. senegalensis
sequenced peptides……………………………………………..
Annex II………………………………………………………………………………………..
Annex II.1 Alignment of sequenced peptides over the identified proteins
for spots in chapter 2…………………………………………….
Annex II.2 Variation between experimental and theoretical Mr and pI
values for spots in chapter 2…………………………………….
Annex II.3 Variations between experimental and theoretical pI values
for spots in chapter 2…………………………………………….
Annex II.4 Variations between experimental and theoretical Mr values
for spots in chapter 2…………………………………………….
Annex III……………………………………………………………………………………….
Annex III.1 Effect of GnRHa with or without OA on GSI, milt production
and sperm motility in the Senegal sole………………………...
Annex III.2 Alignment of sequenced peptides over the identified proteins
for spots in chapter 3…………………………………………….
Annex III.3 Variation between experimental and theoretical Mr and pI
values for spots in chapter 3…………………………………….
Annex III.4 Variations between experimental and theoretical pI values
for spots in chapter 3…………………………………………….
Annex III.5 Variations between experimental and theoretical Mr values
for spots in chapter 3…………………………………………….
Annex III.6 Detailed results for the transcriptomic analysis performed
using the testis tissue from F1 S. senegalensis………………
Compact Disc Detailed file with the 1298 sequences from 2-D LC MS/MS
analysis
PDF files containing Index, Introduction, Objectives,
Chapters 1-4, Conclusions and Annexes I-III
205
219219
219
221
223
224
224
231
233
234
235
235
236
245
247
248
249

Abbreviations

Abbreviations
1-D: one dimensional
2-DE: two-dimensional
electrophoresis
11-KT: 11-ketotestosterone
17α,20β-P: 17α,20β-dihydroxy-4-pregnen-
3-ona
∆: increment
ACN: acetonitrile
BLAST: basic local alignment search
tool
cAMP: 3'-5'-cyclic adenosine
monophosphate
CHAPS: 3-[(3-cholamidopropyl)
dimethylamonio]-1-
propanesulfonate
CID: collision induced dissociation
CV: coefficient of variation
Cy: cyanine fluorophore
Da: Dalton (molecular mass)
DIGE: differential in gel
electrophoresis
DMF: dimethylformamide
DTT: ditiothreitol
EDTA: ethylenediaminetetraacetic acid
ETD: electron transfer dissociation
ESI: electrospray ionization
EST: expressed sequence tag
FSH: follicle stimulating hormone
F0: wild-grown fish
F1: aquaculture-grown fish
FT-ICR: Fourier transform ion cyclotron
resonance (mass spectrometry)
Gc: primary germ cell
GnRH: gonadotropin releasing
hormone
GnRHa: gonadotropin releasing
hormone agonist
GO:
gene ontology
GSI: gonadosomatic index (gonad
weight/body weight x 100)
GtH: gonadotropin hormone
GUI: Graphic user interface
HED: 2-hydroxyethyl disulfide
HPLC: high-performance liquid
chromatography
ID: internal diameter
IEF: isoelectrofocusing
IPG: immobilized pH gradient
IS: internal standard
IT: ion trap
i-TRAQ: isobaric tag for relative and
absolute quantitation
L: late spematogenesis stage
LC: liquid chromatography
Lc: Leydig cells
LH: luteinizing hormone
m/z: mass-to-charge ratio
MALDI: matrix assisted laser desorption
/ionization
M: mid spermatogenesis stage
Mat: functional maturation
spermatogenesis stage
MeOH: methanol
Mr: relative molecular mass
(dimensionless)
MS: mass spectrometry
MS/MS: tandem mass spectrometry
n-ESI: nano electrospray ionization
NP40: nonidet P-40
OA: 11-ketoandrostenedione
P: p-value
PAGE: polyacrylamide gel
electrophoresis
PCR: polymerase chain reaction

Abbreviations
pI: isoelectric point
PMF: peptide mass fingerprinting
PMSF: phenylmethylsulfonyl fluoride
PTM: post-translational modification
RP: reversed phase
chromatography
S2S: self-to-self analysis
Sc: Sertoli cells
SCX: strong cationic exchange
chromatography
SD: standard deviation
SDS: sodium dodecyl sulphate
SEM: scanning electron microscopy
Spc: spermatocytes
Spd: spermatides
Spg A: spermatogonia type A
Spg B: spermatogonia type B
Spz: spermatozoa
st: seminiferous tubules
TFA: trifluororacetic acid
TIC: total ion chromatogram
TL: tubule lumen
TOF: time-of-flight
TSQ: triple stage quadrupole
Tris: tris(hydroxymethyl)
aminomethane
UV: ultraviolet

nIntroduction

Introduction
I.1 Flatfish species Flatfishes, members of the order Pleuronectiformes, comprise a biologically interesting
and commercially relevant group of marine fishes with a broad distribution from the Artic
to Australasia, with a unique asymmetric body shape developed as an adaptation to a
lifestyle living on the sea-bottom. During development, flatfishes reorient themselves to
lie on one side, losing the bilateral symmetry characteristic of most living organisms.
Such metamorphosis involves the migration of one eye to the other side of the body, the
flattening of the body and the settling of the fish on the side vacated by the migrating
eye. Flatfish metamorphosis requires a complex reorganization of skeletal, nervous and
muscle tissues. In addition to this unique developmental event, flatfishes have long been
a choice seafood, with many members of the group (i.e. halibuts, flounders, soles,
turbot, plaice) having commercial value. With the general worldwide decline of wild
fishery and an essentially stable wild catch of these fish species, investigations into
producing them in aquaculture have been underway for the last twenty years.
Aquaculture of some flatfish species like Japanese flounder, turbot, Atlantic halibut and
others has now been successfully achieved, although improvements in the efficiency of
production are still needed (Gibson 05).
The Senegalese sole (Solea senegalensis), a member of the Soleidae family
(Actinopterygii class: ray-finned fishes) is a common, high-value marine flatfish recently
adapted to aquaculture in Spain and Portugal. The fast development of eggs and larvae,
and the improved growth of alevins under intensive culture conditions make the
Senegalese sole a new species for aquaculture with a highly promising economic
potential and an increasing strategic market in Spain and other Mediterranean countries
(Dinis 99). For these reasons, there is a significant demand within the Spanish
aquaculture industry for the development of an integrated culture technology for the
Senegalese sole. This fish species is well-adapted to warm climates and it is commonly
raised in the extensive culture conditions of salt marshes and earthen ponds along the
south coasts of Spain and Portugal (Rodríguez 84; Drake 84; Dinis 92), where the
reproductive biology of this species became a focus of research from the early 1980s
(Rodríguez 82; Rodríguez 84; Dinis 92). However, some culture problems are still
limiting the yield of the sole production process to a level that is not yet optimal for
1
Introduction
commercialisation. Therefore, before a reliable technology for mass production of the
Senegalese sole can be transferred to the industry, several aspects of its culture need to
be solved and optimized. In consequence, this work aims to describe the Senegalese
sole reproductive physiology by using modern chromatographic, electrophoretic and
spectrometric techniques for shotgun and differential expression proteomics, in
combination with DNA microarray analysis and bioinformatic tools.
I.1.1 Flatfish aquaculture
Species belonging to teleosts, one of three infraclasses of the ray-finned fishes, are of
great interest for basic studies and commercial exploitation. Despite this importance and
their ready availability as research subjects, the reproductive biology of relatively few
species of teleosts has been adequately studied. Most of the current knowledge
concerning reproductive physiology in fish originates also from a few species, some of
them interesting for fish industry such as salmonids or the rainbow trout. However,
research on key intracellular and molecular events has been often limited to small
laboratory species that, despite being useful models for developmental biology, often
lack of value as commercial species (Miura 03).
Reproduction represents the phase in the life cycle that links the new generation of
offspring to the adult population for any living species. Successful reproduction is then
vital for the continued existence of the fish population in its natural environment
(Rijnsdorp 05). The main events related to reproduction are spawning, gonad
development, fecundity and onset of sexual maturity. It is well known that certain
commercially important species suffer from low fertilization and low hatching rates, and
similar problems occurs when they are cultured in artificial environments under
controlled conditions (Rottmann 91). Moreover, reproduction in fishes is regulated by
external environmental factors that trigger internal mechanisms, which modulate the
release of eggs and sperm and that result in spawning, the final event of the
reproductive cycle. These external factors controlling the reproduction vary considerably
among species. Factors like photoperiod, water temperature, water quality, water
currents, moon cycles, nutrition, disease and parasites as well as the presence of other
fishes have been involved in the reproductive cycle in an interrelated way. Unfortunately,
this complex set of factors and equilibria that can affect spawning in natural conditions
2

Introduction
can not be reproduced in captivity. In consequence, the artificial conditions inherent to
aquaculture complicate the industrial exploitation of many species of interest.
In nature, S. senegalensis spawn mainly in spring and secondarily in autumn, although
males can produce sperm almost any time through the year with a production of a few
tens of microliters of sperm in overall (García 05). In captivity, however, spontaneous
spawning is often associated with relatively low (45-60%; Anguis 05) or zero fertilization
rates, especially in the F1 generation (Agulleiro 06). As egg quality from female
individuals in aquaculture conditions is acceptable, such reproductive dysfunction might
be related to impaired spermatogenesis and/or spermiation in captivity. This has been
already observed in North Sea plaice, in which captive males produce abnormally dense
milt and show plasma concentrations of sex steroids that are 100 times lower than those
of wild-caught males (Vermeirssen 98). Thus, in S. senegalensis, abnormal
spermatogenesis and/or the production of low quality sperm are the main obstacles that
impair reproduction in captivity. To make things worse, basic knowledge on
gametogenesis and the sexual cycle of wild and cultured S. senegalensis is scarce.
I.1.2 Teleost spermatogenesis As in other vertebrates, the gonads of teleost fishes originally arise as paired structures
in the dorsal lining of the peritoneal cavity. The gonads have two main functions: to
generate germ cells through the processes of oogenesis (ovary) or spermatogenesis
(testis), and to produce sex steroids and growth factors that are important for the
regulation of reproduction. The testis size is highly variable among teleosts, ranging
from 0,2 to 10% of total body weight (Coward 02). In the structure of the testis two
different compartments can be differentiated. The first one, the interstitial compartment,
consists on, fibroblasts, blood and lymph vessels, and Leydig cells. These cells possess
enzymes involved in male steroid hormone synthesis (Miura 91).
The second compartment can show a lobular or tubular structure, depending on the
particular species. Testes are classified as being lobular or tubular referring to the
structure of this compartment. It contains three cell types: membrane basement cells,
germ cells and somatic cells lining the periphery of the lobule/tubule (Nagahama 94).
The somatic cells, known as Sertoli cells, attach to each other by specialized junction
complexes to create the blood–testis barrier that provides the germ cells of physical
3

Introduction
support and other factors needed for its survival, proliferation and differentiation
(Weltzien 04). Functions of Sertoli cells seem to include metabolite transport (Grier 75;
Billard 83) and phagocytosis of residual bodies (Grier 93).
A sperm duct, originated in the posterior region of each testis, leads to the urinary
papilla located between the rectum and urinary ducts. The epithelial cells lining the
sperm duct possess microvilli with numerous mitochondria and alkaline phosphatase
activity, suggesting a role in the regulation of ionic composition, pH and osmotic
pressure of the seminal fluid.
Spermatogenesis in teleosts takes place within the testicular spermatocyst (or cyst)
formed by Sertoli cells involving a primary spermatogonium or germ cell (type A
spermatogonia). Although development occurs synchronously within each cyst germ
cell, spermatogenesis tends to proceed asynchronously in the lobules/tubules and
therefore provides batches of germ cells at different stages of differentiation (Coward
02). This strategy seems to increase fecundation odds as it provides a longer period
where a number of mature cells are exposed, thus not restricting the process to only one
event.
During spermatogenesis, three major events occur in each spermatocyst. First, the
spermatogonial germ cells undergo mitotic proliferation, leading to both new germ cells
and differentiated spermatogonia (type B spermatogonia). After a differentiation process,
spermatogonia transform into primary spermatocytes (spermatocytes I), which enter in
two meiotic cell cycles, presenting in between an intermediate germ cell (spermatocytes
II). The meiotic processes take place with one round of DNA duplication where the
genetic information is recombined and distributed over the resulting genetically distinct
haploid spermatids. Finally, spermatids turn into mature flagellated spermatozoa in a
process referred as spermiogenesis. Spermatids are characterised by the loss of 80% of
the cytoplasmatic volume (García 2005) and the replacement of histones by protamines,
allowing optimal chromatin condensation (Schulz 00). Once maturation occurs, isogenic
clones of spermatozoa are released by rupture of the cyst wall and collected in spermal
ducts derived from cysts (figure i).
4

Introduction
Spz Spg
Gc
Sc Sc
Figure i.- General features of cyst
formation in teleosts. A: Initially, a
Sertoli cell associates with a primary
germ cell. B: The Sertoli cell
completely surrounds the germ cell,
becoming the wall of the new cyst. C:
The germ cells undergo several
mitosis to produce spermatogonia. D:
Spermatogonia maturation proceeds
then with the production of isogenic
spermatozoa. E: Spermiation is
accomplished by the rupture of the
cyst. F: Finally the Sertoli cells
undergo degeneration (adapted from
Grier 93). Gc: germ cell; Sc: Sertoli
cells; Spg: spermatogonia; Spz:
spermatozoa.
At histological level, the process of spermatogenesis in teleosts can be separated into
five stages, where germ cells are found in different developmental stages (Weltzien 02):
(a) Stage I: tubules/lobules contain spermatogonial stem cells associated to
Sertoli cells and spermatocysts with early or late spermatogonia.
(b) Stage II: cysts with primary or secondary spermatocytes appear. The
appearance of spermatocytes indicates the initiation of meiosis.
(c) Stage III: the tubule/lobule diameter increases and cysts with the spermatids
appear.
(d) Stage IV: cysts containing spermatids and also spermatozoa are present.
Spermatozoa appear in the lumen. Milt can be stripped from approximately 50%
of the males in this stage.
(e) Stage V: testis in regression. All stages of developing germ cells may be
present. This stage is characterized by the presence of Sertoli cells
phagocytising spermatid residual bodies.
5

Introduction
In the interstitial compartment of immature and early maturing testis (stages I and II), the
Leydig cells are arranged in clusters, while in mature or maturating testis (stages III and
IV), the Leydig cells become more dispersed and the Sertoli cells more flattened. After
spermiation, the layers of Sertoli cells in the regressing testis (V) become thicker while
the diameter of the lobule lumen decreases.
The way in which spermatogenesis occurs depends on the anatomical organisation of
testis, on the relationship between germ cells and Sertoli cells during the spermatogenic
cycle, and on the place where the fertilization takes place (external or internal). Also
cold-blooded (poikilotherm) and warm-blooded (homeotherm) species show differences
on the spermatogenesis process.
Testes, either lobular or tubular, can be classified in two main types depending on the
distribution of the spermatogonia along the entire length of the tubule or lobule (figure ii).
The unrestricted type is the most common one in teleost and is characterized by
tubules/lobules with a patent lumen that results from a tubule/lobule lining up effect
produced by cysts development at the onset of spermatogenesis. As more cysts burst,
more spermatozoa are collected into the lumen. When required, sperm is finally
released into the sperm duct (spermiation). A second pattern of organization found in
teleost is the restricted spermatogonial testis type, presented only in lobular testes.
Primary spermatogonia are confined in the distal region of the lobule. During
spermatogenesis primary spermatogonia associate with Sertoli cells to form cysts. As
germ cells mature, cysts migrate down the lobule toward the efferent sperm ducts. By
the time spermatozoa have been formed, the cysts are located near the sperm duct and
burst into the lumen of the sperm ducts (figure iii).
6

7
Introduction
Figure ii.- Scheme illustrating unrestricted and restricted spermatogenesis in teleosts.
Unrestricted spermatogenesis is characterized by the presence of germ cells along the
lobule/tubule in testes. Cysts are formed when a Sertoli cell surrounds a germ cell.
Cysts mature and line the lobule/tubule until rupture occurs, liberating spermatozoa
(spermiation). In restricted spermatogenesis, germ cells are restricted to the distal end
of the lobule. Cysts are also formed when a Sertoli cell surrounds a germ cell. As cysts
mature they migrate towards the tubule lumen of efferent ducts. By the time cysts reach
the tubule lumen, they contain spermatozoa. Spermiation results when the cyst fuses
with the tubule lumen (adapted from Grier 93). Sc: Sertoli cell; Gc: germ cell; TL: tubule
lumen; Spg: spermatogonies; Spz: spermatozoa.
Gc
(Sc+Gc) Sc+Spg
Sc+Gc Spz
Spz
Sc+Spz
TL
Sc+Spg
Gc
Gc
Sc
Unrestricted
Restricted

Introduction
100 µm
D
Cyst
Cyst
(Sc+Gc)Sc+Spg
Sc+Gc Spz
(Sc+Gc)Sc+Spg
Sc+Gc Spz
(Sc+Gc)Sc+Spg
Sc+Gc Spz
10µm 10µm
C
BA
Figure iii.-. Scanning electron microscopy (SEM) of maturing spermatocyst (A), cyst
opening with mature sperm (B) and tubule with ripe sperm (C) from a teleost fish
(Cardinal fish). D: Spermatogenesis in unrestricted tubules. Sc= Sertoli cover over
spermatocyst, Spz (SP in C) = spermatozoa, TL= tubule lumen. (A-C: adapted from
Fishelson 2006; D: adapted from Grier 93).
8

Introduction
I.1.3 Special features of Solea senegalensis spermatogenesis
The testis of the vast majority of teleost is elongated and accumulates a high quantity of
sperm during maturation. Thus, in general, the gonadosomatic index (GSI, gonad
weight/body weight x 100) varies significantly during spermatogenesis. In contrast, the
testis of S. senegalensis presents a very small bilobulated structure with rounded
seminiferous tubules. The GSI is ≥0.1 and it does not show marked changes during the
reproductive cycle (García 06). In addition, the spermatogenesis process is of semi-
cystic type, i.e., spermatocytes and spermatids are released into the seminiferous lobule
lumen where they are transformed into spermatozoa (García 05). This unusual model of
spermatogenesis is associated with the constant production of few tens of microliters of
sperm. Spermiating males are thus observed almost all year around, with peak periods
mainly in spring and secondarily in autumn (Rodríguez 84).
The structure and morphological localization of the Senegalese sole testis was recently
described by García and co-workers (2005). It presents two main sections: the cortex
and the medulla. The cortical region is composed by a thin connective capsule that
covers the entire organ and the seminiferous lobules, the main location of
spermatocysts (figure iv).
The seminiferous lobules are disposed transversally from the cortex to the medullar
region. There, developing spermatocysts are scarce or inexistent and in some cases it is
possible to find the efferent duct system that collects and stores the spermatozoa.
Central efferent ducts leave the testicular lobule and open into the main deferent duct,
that canalizes the sperm outwards. Both seminiferous lobules and ducts are surrounded
and structurally supported by the testicular interstitial tissue. Within the interstitial tissue,
myoid cells, collagen fibres, Leydig cells, amyelinic nerves, melanomacrophage centres,
and capillaries can be observed. This structure has been reported for many other
teleosts (García 05).
The germinal compartment, composed of germ and Sertoli cells, is separated from the
interstitial tissue by a basement membrane. Extensions of Sertoli cells envelop germ
cells forming spermatocysts. In S. senegalensis testis, Sertoli cells only enclose
spermatogonia and spermatocytes, because at a certain time during the end of meiosis,
spermatocysts open and spermatids are released into the seminiferous lobule lumen,
9

Introduction
where they are transformed into spermatozoa. The spermatocysts (containing
spermatogonia or spematids) are distributed all along the lobules. However, the majority
of those containing type A spermatogonia are found at the distal part of the lobules.
The location of genital pores in both sexes, the dorsal surface in males (figure v) and the
ventral surface in females, matches the believed spawning behaviour assumed for S.
senegalensis. This is supposed to be similar to that reported in Solea solea (Baynes 94),
where fish form pairs during spawning with the male always positioned under the
female. In this way the genital pores were close together and gamete release takes
place in an optimal position for extensive oocyte fertilization.
1 mm 200 µm
C
Figure iv.- Photomicrographs of a cross-section of S. senegalensis testis. Two main
regions are observed: cortex (in the periphery of the organ; C) and medulla (internal or
central region; M). Deferent duct (DD) is connecting testis to spermatic duct. The
seminiferous lobules present a radial disposition (arrows) from the central medulla (M) to
the tunica albuginea (broken line) at the cortex (C; adapted from García 05).
10

Introduction
Figure v.- Anatomy of male reproductive system in adult S. senegalensis. a, ocular side
testicular lobe; b, blind side testicular lobe; c, spermatic duct; d, urogenital pore; e,
visceral cavity; f, central skeletal portion; g, pelvic fins; h, pectoral fin from the ocular
side; i, operculum; j, head (adapted from García 05).
García-López et al. (2006) defined five stages in spermatogenesis for the Senegalese
sole during spermatogenesis on the basis of the observed histological changes and the
relative abundance of the different germ cell types. The main features of each stage are
described below. The present study will refer to this classification when describing
spermatogenesis states in testes from S. senegalensis.
Early spermatogenesis: The testis cortex is occupied by numerous germinal cysts,
containing spermatogonia surrounded by Sertoli cells. A few spermatids can be present
in the lumen of the seminiferous lobules. Spermatids and spermatozoa can be found in
the medullar efferent ducts. Abundant empty spaces could be seen in both regions.
Mid spermatogenesis: Germ cells are present at all developmental stages. In the cortex,
meiosis is initiated as signalled by the decline in the number of spermatogonia and the
appearance of a large population of spermatocytes. Germinal cysts containing
spermatocytes were distributed in the periphery of the seminiferous lobules, leaving a
small central lumen filled by spermatides. In the medullar efferent ducts,
some spermatids and spermatozoa can be observed.
11

Introduction
Late spermatogenesis: The lumen of the cortical seminiferous lobules is almost fully
filled by spermatids. Few cysts containing spermatocytes are still present. Spermatids
are the most abundant cell type inside the testis. Spermatozoa become more abundant
in the medullar efferent ducts.
Functional maturation: Spermatids are still very abundant in the cortical
seminiferous lobules at the beginning of this stage, but their number decreased
progressively as successive batches transform into spermatozoa. Ripe spermatozoa
accumulate in large quantities in the medullar efferent ducts. Spermatogonia and
associated Sertoli cells commenced to proliferate at the distal part of the cortical lobules,
beneath the thin connective capsule that surrounds the organ.
Recovery: The number of spermatozoa slightly decreases in the medullar efferent ducts
compared to functional maturation stage, while the number of spermatids is significantly
reduced in the cortex. Spermatogonia and Sertoli cells are in active proliferation at the
distal part of the cortical seminiferous lobules, leading to the appearance of numerous
groups of these cells. Spermatocytes are totally lacking indicating the absence of
meiotic processes.
I.1.4 Role of steroids during spermatogenesis and spermiation in teleosts
The regulation of the reproduction process in fish takes place along the brain-
hypothalamus-pituitary-gonad axis and involves a complex mechanism (figure vi).
Briefly, environmental stimuli of reproductive relevance are received and translated by
the brain and routed to the hypothalamus. This brain region produces gonadotropin
releasing hormone (GnRH), as well as gonadotropin release-inhibiting factors like
dopamine (Vacher 00). GnRH is thought to stimulate the pituitary, a small gland located
beneath the brain, to produce and release gonadotropin hormones (GtHs). The GtHs act
on testes through the biosynthesis of gonadal steroid hormones, which in turn mediate
various stages of spermatogenesis, sperm maturation and spermiation. The GtHs
known in teleosts are the follicle-stimulating hormone (FSH) and the luteinizing hormone
(LH) (Weltzein 03). FSH and LH (formely referred to as GtH I and II, respectively) are
released into the circulation and stimulate the gonads by binding to specific membrane
receptors. In the male gonad, FSH and LH receptors are probably located on Sertoli and
12

Introduction
Leydig cells, respectively (figure vi). The gonad has two main functions. First, it
produces germ cells during spermatogenesis. Second, it synthesises sex steroids
(steroidogenesis) and growth factors that are important for the regulation of
reproduction, either directly on gonadal tissues in a paracrine/autocrine manner, or
through positive or negative feedback mechanisms on the hypothalamus and pituitary
hormones in an endocrine fashion (Weltzein 04).
The two major gonadal sex steroid hormones described for teleosts are testosterone
and 11-ketotestosterone (11-KT). In most studied teleosts, testis growth and
development coincide with increased plasma levels of 11-KT, and to a lesser extent,
testosterone. In vivo and in vitro studies show that 11-KT is most effective as a direct
stimulator for spermatogenesis, while testosterone is most effective as a stimulator of
hypothalamic and pituitary activity, leading to further testis activation. 11-KT is then
considered to be the main androgen in teleost fish (Coward 02).
Spermatozoa that have completed the two meiotic divisions in the testis are not yet
fertile, as they lack motility. In some teleosts, another steroid, 17α,20β-dihydroxy-4-
pregnen-3-ona (17α,20β-P), seems to increase sperm duct pH, when spermatozoa pass
through it. This pH variation in turn increases cAMP in sperm, allowing the acquisition of
motility. Such event generally occurs in teleosts immediately before or during the
spawning period (Miura 92). The 17α,20β-P hormone is supposed to be the testicular
mediator of gonadotropin-induced spermiation. This compund is produced in sperm
fluid, from a precursor steroid (probably 17α-hydroxyprogesterone) produced by
testicular somatic cells under the influence of gonadotropin and 11-KT (Nagahama 94).
Contrarily, it has been described that testosterone does not have a direct effect on
gonadotropin-induced spermiation (Miura 92; figure vii).
Little is known about the specificities of the endocrine control of semi-cystic
spermatogenesis in fish. In addition, few reports on the reproductive physiology of
species from the genus Solea have been published to date. Recent studies in S.
senegalensis (García 06) have integrated the histology of gonadal development with sex
steroids profiles. These studies demonstrated the relationship between plasma levels of
sex steroids (T, 11-KT, 17α,20β-P) with different phases of spermatogenic activity.
13

Introduction
Figure vi.- The brain–pituitary–gonad (BPG) axis in male teleosts. NPOav, nucleus
reopticus anteroventralis; tel, telencephalon; mes, mesencephalon; DA, dopamine; Se,
Sertoli cell; Le, Leydig cell; G, germ cell (adapted from Weltzien 04).
14

Figure vii.- Schematic diagram of the main molecular mechanisms during fish spermatogenesis. E2, 17�-estradiol; FSH, follicle-
stimulating hormone; IGF-I, insulin growth factor I; 11-KT,11-ketotestosterone; LH, luteinizing hormone; Spg spermatogonia; SpgA,
spermatogonia type A; SpgB, spermatogonia type B; SpcI, spermatocyte type I; SpcII, spermatocyte type II; Spd, spermatid; Spz,
spermatozoa (provided by Dr. Joan Cerdà).
15

Introduction
Plasma 11-KT and testosterone levels progressively increased in association with the
progression of spermatogenesis, showing a peak in the late spermatogenic stage.
Levels decrease dramatically in functional maturation stage when spermatozoa appear
massively. On the other hand, high concentrations of 17α,20β-P were reported at any
developmental stage. These hormone profiles are unusual in other pleuronectiform
teleosts and may be related to the special type of spermatogenesis reported to resemble
the pattern of oocyte development in group-synchronous ovaries (García 06). Further
studies should be done to determine the role of 17α,20β-P in S. senegalensis.
I.1.5 Hormone treatment approaches on flatfish spermatogenesis
Treatment of flatfish with gonadotropin-releasing hormone agonist (GnRHa) generally
increases plasma concentrations of androgens (Harmin 93; Vermeirssen 98, 00;
Pankhurst 00; Moon 03; Agulleiro 06), C21 steroids (Baynes 85, Vermeirssen 98 and
00), milt hydration (Vermeirssen 98; Martin-Robichaud 00; Tvedt 01; Moon 03; Lim 04)
and/or sperm motility (Clearwater 98; Vermeirssen 04). However, in the Senegalese
sole and some other teleost species, GnRHa is apparently ineffective at enhancing milt
production (Berlinsky 96, 97; Agulleiro 06). In fish, it is known that synthesis of 11-KT in
the testis, as well as in extratesticular tissues, can occur from pregnenolone via pro-
gesterone, 17α-hydroxyprogesterone, androstenedione, 11β-hydroxyandrostenedione
and 11-ketoandrostenedione (OA) (Mayer 90a; Goos 02). Accordingly, castrated fish
treated with OA show elevated plasma 11-KT levels and restored secondary sexual
characteristics (Mayer 90b; Borg 93). Also, treatment of intact males with OA or 11-KT
can promote testicular development (Goos 02).
A recent study performed by Agulleiro and co-workers (2007) demonstrates that males
treated with GnRHa in combination with OA show an enhancement of plasma levels of
sex steroids, germ cell development and milt production in the Senegalese sole. The OA
is an immediate precursor in the biosynthesis of 11-KT through its conversion by the
enzyme 17β-hydroxysteroid dehydrogenase (17β-HSD), which is present in testis and
other tissues in fish (Mayer 90a; Schulz 91). The authors hypothesized that GnRHa+OA
administration in males could result in an additional source of 11-KT, independent of
gonadotropin stimulation and hence of regulatory mechanisms at the brain-pituitary
level, to potentiate the GnRHa effect on spermatogenesis.
16

Introduction
I.2 Proteomics
The term proteome was first coined to describe the set of proteins encoded by a
genome (Wilkins 96). Nowadays this term evokes a broader meaning that includes the
full range of protein isoforms and modifications, the interaction between them, and the
structural description of proteins and their higher-order complexes. Proteomics is a
research area that studies the proteome components in a global and often quantitative
manner. Together with other functional “omic” approaches, proteomics aims to provide a
wide vision of cellular function (Zhu 03). In consequence, proteomics must deal with the
vast and heterogeneous collection of proteins derived from alternative RNA splicing,
pre- and post-translational modifications and other metabolic processes that compose a
highly dynamic proteome, whose component distribution is further affected by the
specific cell or tissue type as well as by interindividual, transient, developmental stages.
This huge proteomic task is often further complicated by sample availability (such as
biopsies), limited collections in banks of patience or unique sample preparations (Tyers
03).
Different disciplines are combined together to achieve a proteome wide vision: mass
spectrometry (MS), arrays and separation nanotechnologies, structural proteomics,
functional proteomics and bioinformatics. Some of these tools (MS-based proteomics
and bioinformatics) will be discussed more in detail in the following lines, as they will be
thoroughly applied in this work for the study of the Senegalese sole proteome.
I.2.1 Mass-spectrometry based proteomics
MS has increasingly become the method of choice for qualitative and quantitative
analysis of complex protein samples. MS-based proteomics is possible because of
advances in other several areas like genome sequence databases or technologies
related to protein ionization for MS analysis. Electrospray ionization (ESI; Fenn 89,
Abián 99) and matrix assisted laser desorption/ionization (MALDI; Karas 88) are the two
most popular techniques for protein or peptide ionization in proteomics. ESI ionizes
proteins from the liquid state, making this technique advisable for coupling MS to liquid-
17

Introduction
based separations (for instance, liquid chromatography and capillary zone
electrophoresis). On the other hand, MALDI ionizes the sample out of a crystalline
matrix via laser pulses and it is then best suited for fast analysis of individual samples.
For proteomic purposes, ESI ion sources have mostly been coupled to three
dimensional (3-D IT) and linear ion traps (LIT), quadrupole (Q) and, more recently,
Fourier transform ion cyclotron (FT-ICR) analyzers. The 3-D IT is more sensitive and
inexpensive in comparison to other MS equipment for proteomic studies, but shows a
lower mass resolution than time-of-flight (TOF) analyzers. Recently commercialized
devices such as the Orbitrap have substantially increased 3-D IT accuracy. However,
The FT-ICR is still the analyzer presenting the higher potential in terms of sensitivity,
dynamic range, accuracy and resolution, despite its economical cost and operational
complexity have limited their use in proteomics (Aebersold 03).
These devices allow all the measurement of the m/z of intact protein or peptide ions, the
production of fragments from those ions and its mass analysis. The latter capability, i.e.
the mass analysis of fragment ions from peptide molecules, is the basis for MS-based
protein sequencing. Ion fragmentation can be carried out by several procedures
including collision induced dissociation -CID- or electron transfer dissociation –ETD.
These processes can take place inside the analyzer (such as in ion traps and ICRs) or
in especial collision chambers in tandem or hybrid instruments.
MALDI is usually coupled to TOF analyzers. The simplicity, mass accuracy, resolution
and sensitivity of MALDI-TOF mass spectrometers made them the most common
equipment to identify proteins by peptide mass fingerprinting (PMF, see below). New
configurations of MALDI instruments have been coupled to linear ion traps, 3D ion traps
(Viner 05), or to tandem TOF-TOF or hybrid mass spectrometers, allowing
fragmentation of MALDI generated ions.
The identification of proteins by MS is based in two main methods: PMF and MS/MS
sequencing (figure viii). In both cases, the initial step is the digestion of the protein with
a specific enzyme like trypsin. In PMF a protein can be identified by comparing the list of
the experimental masses from the digested peptides with those corresponding to the
different peptide collections predicted from the protein sequences stored in a
comprehensive database. This method requires purified target proteins, so previous
18

Introduction
protein fractionation using 1-D or 2-D electrophoretic separation of the sampe is
performed before MS analysis. In comparison, protein identification by MS/MS peptide
sequencing does not require the isolation of the target protein and gives information
about the peptide sequence in addition to the peptide mass. Trypsin digested peptides
are medium length (500-2000 Da) and their carboxy-terminal residue is almost always
Lys or Arg. This favours the production of doubly charged ions that yield fragmentation
spectra which can be easily deciphered because of the presence of complementary
series of b and y ions (see below) and that allows peptide sequence characterization
and its correlation with known gene sequences stored in databases (Reinders 04).
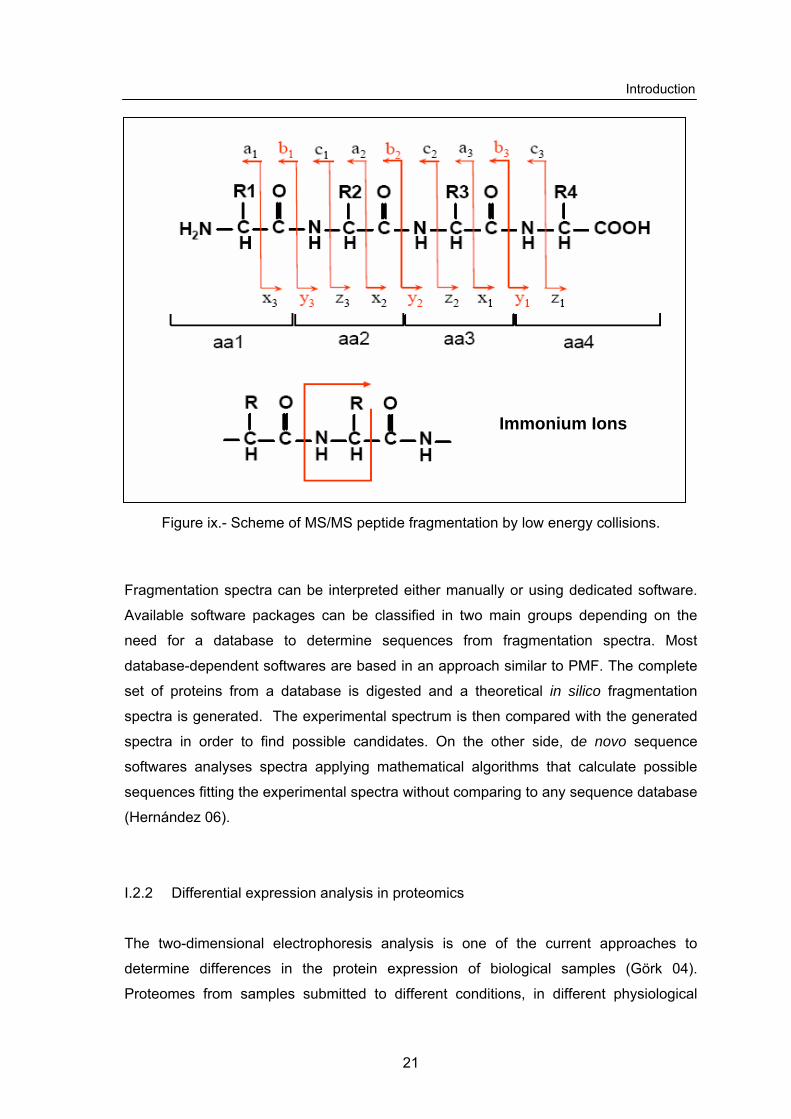
The CID MS/MS fragmentation pattern of a peptide is a characteristic of the peptide
sequence, the charge of the fragmented ion and the collision energy. In a MS/MS
analysis, peptides can fragment in any of the peptidic bonds, generating fragments of
different types, which can be grouped in two main series: a, b, c contains the amino-
terminal, while series x, y, z contains the carboxi-terminal (figure ix, Roepstorff 84).
In addition, the breakdown of two peptide bonds generates ion fragments denominated
internal ions. Typical ions of this class are the immonium ions that contain only one
aminoacid residue. In consequence, immonium ions are useful markers for the presence
of some aminoacids. Depending on the aminoacid composition, fragments derived from
a loss of water (S, T, D o E) or ammonium (Q, K, R) from y and b ions can also be
detected.
The relative intensity of the ionic fragments depends on the aminoacids present in the
peptide chain, as well as on other experimental parameters like collision energy and
pressure. Some peptidic bonds like Gly-Gly or Gly-Ala are especially stable. Fragments
derived from the breakdown of these bonds are thus difficult to observe in the spectra.
This makes sometimes sequence assignation difficult because the molecular mass of
Gly-Gly is identical to Asn and Gly-Ala to Gln/Lys. Other cases of special fragmentation
pattern are caused by the presence of proline (Maux 02), aspartic followed by an
arginine, (Wysocki 00), or the formation of disulfide bonds between cysteine (Carrascal
05).
19

Introduction
Figure viii.- Generic MS–based proteomics experiment. First, proteins are isolated by
physicochemical fractionation or bioaffinity selection, and then separated in a 1-D gel or
2-D gel. Proteins are then digested, usually by trypsin, leading to peptides with C-
terminal protonated aminoacids. Resulting peptides are then analysed in a MALDI-TOF
mass spectrometer and protein identification performed via peptide mass fingerprinting.
In parallel, analysis by MS/MS can also be performed for protein identification (adapted
from J. Abián in “Tratado de Medicina Interna Rodés-Guardia” Ed. Massons 2004).
When the peptides derive from known protein or gene sequences, the determination of
partial sequences or tags is sufficient to identify the original proteins in a database.
Once the protein is found, the complete sequence of the peptide can be deduced from
combining the information from the tag, the aminoacid sequence next to the tag region
and the molecular weight of the analysed peptide. In this manner peptides can be
matched between real peptide sequences and sequences stored in databases, even
when spectra are difficult to interpret completely or when only a poor spectra is
obtained.
20
Introduction
Immonium Ions
Figure ix.- Scheme of MS/MS peptide fragmentation by low energy collisions.
Fragmentation spectra can be interpreted either manually or using dedicated software.
Available software packages can be classified in two main groups depending on the
need for a database to determine sequences from fragmentation spectra. Most
database-dependent softwares are based in an approach similar to PMF. The complete
set of proteins from a database is digested and a theoretical in silico fragmentation
spectra is generated. The experimental spectrum is then compared with the generated
spectra in order to find possible candidates. On the other side, de novo sequence
softwares analyses spectra applying mathematical algorithms that calculate possible
sequences fitting the experimental spectra without comparing to any sequence database
(Hernández 06).
I.2.2 Differential expression analysis in proteomics
The two-dimensional electrophoresis analysis is one of the current approaches to
determine differences in the protein expression of biological samples (Görk 04).
Proteomes from samples submitted to different conditions, in different physiological
21

Introduction
situations or developmental stages are separated orthogonally by isoelectric point (pI)
and molecular mass (Mr) in polyacrylamide supports. The full 2-DE expression analysis
procedure can be divided in six main steps: sample preparation, isoelectrofocusing
(IEF), SDS-polyacrilamide gel electrophoresis (SDS-PAGE), gel staining, image analysis
and protein identification.
There are many variations in the experimental procedures for sample preparation, but
they normally include: 1) tissue or cell disruption (either mechanical and/or chemical),
protein precipitation using TCA/acetone, methanol-chloroform (Wessel 84) or optimized
commercial kits, 2) protein resuspension in 2-D compatible buffer and 3) protein
quantification (Shaw 03). IEF is currently run with commercially available plastic baked
immobiline strips, although in the past other supports have been used (O’Farrell 77,
Bjellqvist 82) The introduction of these strips (Patel 88) increased the reproducibility of
the 2D-gel experiments and also allowed to extend the length of proteome vision, to
analyse small pI regions (zoom strips) and basic proteins (Görk 04).
For expression studies, SDS-PAGE is generally performed in a gel format of about 24
cm wide x 20 cm long. Mini-gels (approximately 7x7 cm) can be also used in some
cases, especially for result validation (Rodríguez 06). Visualization of separated proteins
can be carried out using various labelling or staining methods (Westermeier 05). Among
them, silver staining has been the more used technique in proteomics, despite some of
its limitations: restricted dynamic range, impaired linearity and staining variations
between proteins depending on their chemical structure (Rabilloud 94). Staining
methods based on fluorescent dyes are also used to overcome some of the silver
drawbacks providing at the same time similar sensitivities. However, fluorescence
reading requires scanners with extra features (Miller 06). Moreover, spot excision from
fluorescent stained gels requires spot pickers with compatible cameras or a further step
to silver stain the gels.
The analysis of the gel images is partially automated with available software. These
packages include spot detection algorithms that allow the characterization of hundreds
of protein spots usually present in the images, methods to match spots among all the
experiment gels, and statistical and data analysis tools to determine expression
variations (Marengo 05)
22

Introduction
Recently, the DIGE technology has been introduced to overcome some of the problems
of reproducibility, spot detection and matching of the classical gel approach (Alban 03).
This technology is based upon the specific properties of three different fluorescent dyes
of the cyanine family (CyDye), which enable multiplexing of separate samples on the
same 2-D gel. Common DIGE protocols involve the multiplexing of two different samples
and one internal standard (IS) per gel. This IS consists of a pool including all of the
samples within the experiment.
In DIGE, each protein spot in a sample can be compared to its counterpart within the IS
on the same gel, to generate a ratio of relative protein levels. Quantitative comparisons
of samples between gels are made based on the relative change of sample to its in-gel
internal standard. This process effectively removes the gel-to-gel variation enabling
accurate quantitation of biological induced changes. These characteristics also help to
reduce the number of gels replicates required per experiment. Besides, spot matching
between different gels in the DIGE approach is more straightforward. As the IS image is
common between all gels in an experiment, matching process can be performed
between IS images, which have similar or nearly identical spot patterns (Marouga 05).
On the contrary, conventional 2-D electrophoresis requires matching between different
samples on different gels, which introduces differences in spot patterns from sample-to-
sample and gel-to-gel variation. Matching between IS in DIGE allows matching between
identical samples, so variations in spot patterns are due only to electrophoretic
differences. Additionally, the scanner that is used for imaging accepts gel sandwiches
including the low fluorescent glass plates. As occurs with plastic-backed gels for silver
staining, this reduces the variation between gels, and the risk of damaging or destroying
them.
Whichever the method used for protein visualization, the spots of interest are finally
excised from the gel and submitted to an in-gel digestion with enzymes with known
restrictions points. The resulting peptides are used to identify the protein of origin by
PMF. When this approach does not result in any protein identification, digested peptides
can be sequenced by nano-electrospray ionization coupled to tandem mass
spectrometry (n-ESI/MS-MS), as described above (figure viii; de Hoog 04).
Despite the usefulness of 2-DE analysis, it is well known that only a fraction of the
proteome can be observed by this procedure. Proteins with extreme pI and Mr as well
23

Introduction
as low solubility proteins are not detected in conventional analyses. In addition, the
dynamic range of concentrations of the proteome components and the detection limit of
the staining methods determine that only the more abundant proteins can be observed
(Gygi 99). Several improvements have been performed in sensitive staining methods,
large-format resolving gels and sample fractionation to diminish, although not
eliminating, these restrictions from the 2-DE/MS approach.
The shotgun proteomic approach aims to circumvent some of the limitations of 2-DE in
determining protein expression differences and to provide a complementary, less biased
and more global view of the proteome. This approach is based in liquid chromatography
coupled to mass spectrometry (LC-MS) with two main variants: non-labelling and
labelling techniques. The first set of technologies requires a highly reliable LC-MS
system, able to process a great number of samples at different times under controlled
and repetitive conditions. Variations between samples are obtained after samples run on
different analysis are compared (Old 05).
The labelling techniques overcome this reproducibility requirement by analysing at the
same time a mixture of samples that were labelled separately with different chemical
tags. These tags are based on an unique chemical reagent that is synthesized with
different isotopical compositions (Leitner 05, Frohlich 06). For a given peptide, the
derivatives produced from these reagents differ only in its isotopical composition, so that
physicochemical properties are practically identical and the same protein or peptide in
different samples behave in like manner, when enzymatically digested or submitted to a
chromatographic separation. Relative differences between analysed samples are
revealed in the mass spectrometer, where the mass differences due to the isotopical
variations allows the separation of the corresponding peptide signals. In both
approaches specially designed bioinformatic tools are mandatory to extract results from
the data generated by the LC-MS system (Ong 05).
As indicated above, the LC-MS technique presents advantages over the gel
experiments. Briefly, proteins in a larger dynamic range can be studied, the set of
analysed proteins is opened to membrane and other insoluble proteins, as well as to a
wider range of pI and Mr, and the change ratios of the same peptide in the different
analyzed samples are more accurate and reproducible. However, there are practical
difficulties in LC-MS that made 2D-gel analysis more popular. The acquisition and
24
Introduction
maintenance costs of the mass spectrometer, as well as the required experience to run
LC-MS instruments, are among them (Hanash 03, Neverova 04).
More recently, the microarray technology is also finding its way into quantitative
proteomics through various formats, which promise to allow a rapid interrogation of
protein activity at proteomics level. Protein-detecting microarrays are currently
performed using many different affinity reagents (recombinant proteins, antibodies,
peptides, small molecules, single-stranded oligonucleotides) arrayed at high spatial
density on a solid support. Each surface-bound molecule captures its target protein from
a complex mixture (such as serum or cell lysate), and the captured proteins are
subsequently detected and quantified. Detection and quantification is normally achieved
by labelling the compared samples with different cyanines (i.e. Cy3 and Cy5) and
measurement of the array fluorescence. Other approaches go further and identify the
captured proteins by MALDI-TOF MS (Finnskog 04, Ekstrom 01).
Protein microarray technology has been tested successfully in the study of several
human cancer or human autoimmune diseases (Miller 03, Haab 03, Joos 00, Graham
04). In contrast to less specific separation methods such as gel electrophoresis and
liquid chromatography, affinity-based approaches enable the investigator to direct the
experiment. If the goal of the experiment is to study a particular biological process, only
those proteins involved in that process need to be examined. The downside, of course,
is that this approach requires both a prior knowledge of the proteins to be studied and
appropriate affinity reagents. This highlights the importance of efforts directed at the
rapid selection of recombinant antibodies, phage display ligands and small molecules.
25

Introduction
I.2.3 Annotation of DNA databases using peptidic ESTs
Organism genome annotation has been classically approached with genomic techniques
that pursue the continuous nucleotide sequence which encodes genes. Databases
containing nucleotide sequences are the mandatory framework for different applications
in genomics, proteomics and interactomics.
However, complete genomic sequences of many organisms are still not available, and
even for those that are known, modifications such post-translational chemical changes
are rarely inferable from the genetic sequence. Thus, complete characterization or just
an early approach to primary protein structure may require determination of protein
sequence with minimal or null assistance from genomic data, a strategy so-called de
novo protein sequencing (Standig 03). Moreover, the recent technical advances outlined
above in this introduction allow the effective application of proteomic approaches to
implement gene annotation (Tanner 07). These new tools include highly efficient soft
ionization methods for the analysis of peptides and proteins, availability of new types of
ion-mass analyzers providing increased mass accuracy, resolution and scan speed as
well as an important improvement in software tools for high throughput data analysis.
Several liquid phase separation techniques that can be directly coupled to mass
spectrometers and are capable of resolving hundreds of compounds per analysis, like
capillary liquid chromatography and capillary zone electrophoresis, have also evolved in
parallel with these advances. In order to cope with the complexity inherent to the direct
analysis of whole proteomes, several separations steps have to be arranged in two-
dimensional liquid chromatography (2-D LC) setups. These systems make use of two or
more orthogonal separation methods (often an ion exchange chromatography followed
by a reversed phase separation) to further increase the chromatographic separation
power. Patterson and co-workers (Davis 01) demonstrated the utility of 2-D LC in the
analysis of the proteome human brain glioma cells characterizing 213 proteins (869
unique peptides sequences). These authors used two chromatographic separations, a
strong cationic exchange chromatography (SCX) followed by a reversed phase (RP)
column and an intermediate reversed phase C18-column trap to optimize the capture of
the SCX fractions and their separation in the reverse phase column. The on-line 2-D LC
system was directly coupled to an LCQ ion trap mass spectrometer.
26

Introduction
In a simpler experimental scheme, the different separation processes can be carried out
off-line through the collection of chromatographic fractions that are individually analyzed
in other systems. In 2003, Gygi and co-workers (Peng 03) described the yeast proteome
using an off-line 2-DLC experimental scheme. Eighty fractions were collected after the
SCX chromatography and each was analysed by RP-LC MS/MS in a LCQ Deca ion trap
mass spectrometer, identifying up to 1504 proteins (7537 unique peptides). Both options
have their pros and cons. On-line coupling is preferable to off-line separation, as it
allows complete automation and diminishes sample losses. On the other side, the off-
line option is proposed as a flexible experimental approach where sample amount and
chromatographic conditions can be optimized for each separation step. In fact, as the
loading capacity of the first fractionation step is not restricted, in practice, this approach
is able to produce a higher number of peptidic tags than the on-line approach where the
amount of starting sample have to be limited (Gygi 02, Vollmer 04).
The state-of-the-art of the 2-D LC approach allows processing of around 10000 peptide
fragmentation spectra from a crude proteome tryptic digest in less than two hours1.
Additional previous sample fractionation procedures provide of an extended proteome
description. As a consequence, the huge volume of generated data makes necessary
the use of bioinformatic tools in order to extract the maximum amount of relevant
information (MacCoss 05, Gaspari 06).
1 The state-of-the-art of electrospray coupled ion traps is nowadays in its third generation. The work in this PhD was performed with the first generation of ion traps acquired in the 1995 by the CSIC/UAB Proteomics Laboratory.
27

Introduction
I.3 Applying proteomics to Solea senegalensis
Up to the present, the application of proteomic technologies for differential expression
analysis in fish species, either wild or cultured, has been scarce and mainly focused on
the model organism zebrafish (Danio rerio; Link 06a-b, Tay 06, Knoll-Gelida 06, Love
04, Shrader 03), the rainbow trout (Oncorhynchus mykiss; Russell 06, Smith 05, Rime
04, Martin 03, Hogstrand 02) and, in less extend, to other species like the Atlantic
salmon (Salmon salar; Provan 06, Booy 05), the Sea bass (Dicentrarchus labrax; Monti
06), or the flatfish dab (Limanda limanda; Stentiford 05). Other fish-related research
areas have also taken advantatge of proteomic tools, like marine ecology (López 07),
the description of fish allergens, the identification of species among fish families (i.e.
Merluccius sp.) or fish quality control (Carrera 06, Martínez 04, Piñeiro 03).
The present study will approach for the first time the flatfish S. senegalensis with some
of the above-mentioned proteomic technologies (2-D LC MS/MS, 2-DE, 2-D DIGE),
focusing on the reproductive biology in wildness and captivity. This novel study will
provide a new insight at molecular level into the reproductive biology of this species and
will constitute groundwork for further studies on reproductive aspects of flatfish
aquaculture.
28

Objectives

About the Pleurogene Project: understanding the frame of this PhD work
The Senegal sole (Solea senegalensis) and the Atlantic halibut (Hippoglossus
hippoglossus) are two flatfish yielding high value market products with the potential for
production in aquaculture. Currently, the culture of Senegal sole in Spain and other
European countries is seriously impaired primarily because of difficulties in controlling
reproduction in captivity. Atlantic halibut aquaculture is somewhat more advanced, with
commercial aquaculture production occurring in Norway, Iceland, Scotland and
Canada, but there are still improvements to make, particularly with regard to judging
when to spawn females, selecting genetically superior broodstock and enhancing
disease resistance. Thus, between these two species, there are a series of production-
related problems that would be more easily solved with improved knowledge of several
basic biological processes: reproduction, development, nutrition, genetics and
immunity.
In order to overcome hurdles in the development of these species for aquaculture, the
Pleurogene project aims to set up a high-throughput, genome- and proteome-based
technology for the identification and characterization of genes and proteins important
for sex differentiation, reproduction, larval development, immunity and nutrition, both in
the Senegal sole and the Atlantic halibut. With this purpose, a comprehensive EST
survey has been performed to become the basis of a microarray for the study of flatfish
gene expression during reproduction, development and under different environmental,
hormonal and dietary conditions. The microarray analysis of gene expression has been
complemented with other molecular approaches, such as tissue laser capture
microdissection, in situ hybridization and Real-Time PCR. Proteomic technologies
played a main role in the analysis of specific abnormal phenotypes of gonads and
larvae to identify differentially expressed proteins as biomarkers of quality.
All the genetic and molecular information obtained in this project has been integrated
into Pleuromold, an interactive bioinformatic platform specifically developed for this
project. This platform reconstructs an in silico flatfish with a tissue-specific gene/protein
expression-based atlas. The platform will help to identify crucial genes/proteins and
regulatory pathways involved in reproduction and development in the Senegal sole and
the Atlantic halibut, and will contribute with the generation of new genomic, proteomic
and bioinformatic tools for flatfish research in the control of reproduction and
29
optimization of larval health and nutrition in these species, and other related flatfish,
under intensive culture conditions.
The focus of this thesis work is on the study of the reproduction of Solea sengalensis in
captivity and especially in the description of the proteins involved in spermatogenesis.
The study of several phenotypes of testis of wild and cultured animals has been
performed in order to unravel biochemical pathways related to morphological and
functional defects of gonads from male Senegal soles in captivity. The effect of
hormonal treatments to solve these deficiencies has been also analysed to define
biomarkers of gamete quality in captivity.
As indicated in the introduction, the spermiation process in S. senegalensis involves
important physiological changes especially focused on testes. The study of these
molecular changes is essential for the understanding of the mechanisms and factors
involved in these physiological processes. The proteomic approach has been
demonstrated to be a powerful tool for the global study of complex systems. A classic
proteomic tool, the expression analysis based on 2-D electrophoresis gels, could help
to determine differences along the physiological evolution in a process like
spermatogenesis.
Comparative analyses in testis have been performed using proteomic and genomic
technologies, in order to combine information of both approaches and obtain a general
vision of the studied situations. All the proteomic-derived have been placed in
Pleuromold, which also includes the genomic based data generated in the DNA
microarray analysis. The fruitful combination of information and tools from different
technologies in this thesis project has been only possible through the inclusion of this
work inside the interdisciplinary Pleurogene project.
30
Objectives
The aim of this thesis is described in the following individual purposes:
• Annotate the proteome of pre-metamorphic larva and testis tissue of Solea
senegalensis using two-dimensional liquid chromatography coupled to tandem
mass spectrometry.
• Determine the proteome variations in testis during the different
spermatogenesis stages in wild and cultured Solea senegalensis.
• Compare the classical and the DIGE approaches for measuring proteome
variations in testis from Solea senegalensis.
• Determine the proteome expression changes in testis of Solea senegalensis
after different hormonal treatments.
• Integrate the data generated in the 2-D LC MS/MS and 2-D gel experiments on
Solea senegalensis tissues into a comprehensive bioinformatic platform.
31

Chapter 1 De novo peptide sequencing of Solea senegalensis larva and testis proteome
using two-dimensional liquid chromatography coupled to tandem mass
spectrometry.

Chapter 1
In this chapter, proteins from larva and testis of Solea senegalensis are characterized
using a proteomic shotgun approach, i.e., proteome digestion followed by peptide
separation and sequencing by 2-D LC coupled to mass spectrometry. This set of
sequenced peptides will be of great interest to help the annotation of S. senegalensis
databases and will complement the set of expressed sequence tags (ESTs) obtained by
other Pleurogene partners. Thus, the results obtained in the characterization by shotgun
proteomics of protein sequences of S. senegalensis will help in further experimental
procedures when studying important biological processes like sexual maturation or
larval metamorphosis.
After considering the different technical approaches that could be applied (see general
introduction) it was decided to use an on-line SCX-RP LC setup and the “salt-plug”
method for the sequencial desorption and separation of the peptide mixtures. In this type
of system, samples of interest are usually injected automatically. Most sample
components are retained in the first column, a SCX cartridge, while others such as
molecules of low pI or even anionic species with a low number of negative charges
escape the cartridge and are trapped in a RP pre-concentration cartridge at the exit of
the SCX column. These molecules will be desorbed from the RP cartridge and
submitted to the second chromatographic step as described later, while the SCX-
retained peptides will wait until the first step of the salt desorption cycle begins. Thus,
using the 'salt-plug' procedure the SCX-retained peptides are gradually eluted from the
first cartridge by injections of ammonium acetate solutions at increasing concentration.
In each salt step, a few microlitres of the salt solution enter to the system and pass
through the SCX column eluting a peptide fraction that will be trapped in the pre-
concentration cartridge. This process is repeated until a concentration of 0.25-2M,
depending on the case, is achieved. At this salt concentration most peptides have been
already eluted from the column. The number of salt steps used varies depending on the
desired resolution, although in practice, a compromise between resolution and cost must
be taken.
Peptides eluted from the SCX cartridges are trapped in the RP cartridge, where they are
concentrated and suffer a buffer exchange step that eliminates salt residues and
optimizes the next analytical separation in the RP analytical column. For this second
chromatographic separation, the peptides concentrated in each cycle are eluted from
the pre-concentration cartridge to the analytical column using an acetonitrile gradient.
33

Chapter 1
Peptides separated in the analytical column enter directly into the mass spectrometer
ion source, so that its mass and sequence analysis takes place in real time. Three
different steps are carried out automatically before obtaining a fragmentation spectrum.
First, the spectrometer acquires a full scan mass spectrum of the material eluting from
the chromatographic system at a given moment. Then, it acquires a second spectrum
with a short m/z range (zoom spectra) centered at the m/z value of the highest m/z peak
in the full scan, and finally, it fragments by CID the peptide ion corresponding to this
target peak. This triple scan process is performed in a relatively short time. Depending
on the experimental conditions, it could take from milliseconds to a few seconds. The full
process can generate from 1000 to 10000 fragmentation spectra depending mainly on
the MS speed, the number of different salt steps used, the length of the acetonitrile
gradient and the amount and complexity of the injected sample.
The set of MS/MS spectra is further processed with bioinformatic tools to obtain
tentative peptide sequences, polish this tentative sequences, assign a corresponding
protein through a BLAST comparison, query other bioinformatic tools, and finally create
a database summarizing all the information related to each fragmentation spectrum. The
information deduced from peptide sequencing can then be used in combination with
genomic sequence database to complete and, when necessary, correct the available
information to describe an organism.
A similar homology-driven approach was proposed and automated by Shevchenko and
co-workers to describe proteomes of species without sequenced genome (Xenopus
laevis; Liska 04), using cross-species references from Homo sapiens, Mus musculus,
Danio rerio, Salmo salar, Droshopila auria, Gallus gallus and Paralichtchys olivaceus,
among others.
34
Chapter 1
1.1 Materials and methods
1.1.1 Sample processing
Protein from 100 mg of testis tissue was obtained from three wild-caught individuals of
S. senegalensis fished in Cadiz Bay (Spain) in spring 2004. Approximately 70 mg of 10-
days old pre-metamorphic larvae of S. senegalensis were obtained from eggs spawned
in captivity and cultured as described (Cañavate 99). Fifty milligrams of protein were
mixed with 500 µl of TNE buffer (50 mM Tris HCl pH 7.6, 150 mM NaCl, 2 mM EDTA pH
8,0, 1 mM Na3VO4, 1 µM Leupeptin, 2 µM Pepstatin A, 0,1 µM Aprotinin) and
mechanically disrupted. NP40, DTT and PMSF were added to a final concentration of
1% v/v, 1 mM and 2 mM, respectively. Proteins were precipitated with
methanol/chloroform as described elsewhere (Wessel 84) and dissolved in 400 µl of 6 M
Urea, 50 mM Tris pH 8.0, 4 mM DTT buffer. Sample quantification was done using the
RcDc kit (Bio-Rad). Two hundred fifty micrograms of protein extract dissolved in 2,5 ml
of 6 M urea, 50 mM Tris pH 8 and 10 mM DTT were incubated 30 minutes at 30ºC.
Afterwards, 25 µl of 500 mM iodoacetamide were added and incubated 30 minutes at
30ºC. The sample was digested overnight at 37ºC with 1,3 µg Trypsin Gold (Promega)
in 50 mM NH4HCO3 pH 7,8. After digestion, tryptic peptides were extracted using C18
Bond Elut LRC columns (3 mg Varian), following supplier instructions. Peptides were
eluted with ACN/H2O 1:1 0,25% TFA and the resulting extract was fully dried in a
centrifugal evaporator-concentrator (Savant).
1.1.2 Two-dimensional LC MS-MS
Protein extracts were redissolved in 40 µl (testis) or 30 µl (larva) of SCX buffer (5 mM
K2HPO4, 5% ACN pH 3.0). Twenty microliters of each sample (volume equivalent to 83
µg testis protein and 166 µg larva protein assuming a 100% recovery process) were
injected. A custom-made 2-D LC MS/MS system was used for analysing larva and testis
samples (figures 1.1 and 1.2). The first dimension separation was carried out using a
Kontron 325 System (Kontron Instruments). An Agilent HP1100 automatic injector was
used for the injection of both the sample and the salt plugs required for desorption. The
35

Chapter 1
mobile phase consisted on 5 mM K2HPO4, 5% ACN, pH 3 at 0,2 ml/min). Five salt steps
were loaded using 20 µl of ammonium acetate solutions at increasing concentration (10,
50, 100, 250 and 500 mM ammonium acetate in SCX-buffer). The second dimension
chromatography of these salt fractions was done using a HP1100 (Agilent Technologies)
provided of an automatic injector for sample and salt steps injection, and a UV detector
with a Z-cell for microflow working.
Both HP1100 systems were controlled by a HP Chemstation. The SCX chromatography
used a BioX-SCX 500 µm ID x15 mm cartridge (LCPackings) and the reverse phase
chromatography used a preconcentration C18 300 µm ID x 5 mm cartridge
(LCPackings) and a Kromasil C18 5 µm, 5 cm x 180 µm custom-built as described
before (Carrascal 03). Separation on the C18 capillary column was carried out at 10
µl/min using a solvent gradient that started at 10 min from 0% to 60% solvent B in 60
min. (A: H20/CAN 95/5 v/v 0,05% TFA; B:H2O/ACN 20/80 v/v 0,05% TFA). The eluted
material was analysed on-line with a LCQ ion trap mass spectrometer (Thermo
Electron). Electrospray ionization voltage was set at 2,5 kV and entrance capillary
temperature at 140ºC. LCQ acquisition parameters were set as follows: maximum
injection time 20 ms, 8 accumulated microscans, automatic gaining control on and
multiplier voltage at –910V. A continuous series of acquisition data containing each a
scan spectrum, a zoom scan spectrum and a MS/MS fragmentation spectrum, were
acquired automatically by the LCQ under the control of the Xcalibur 1.0 software (figures
1.3 and 1.4).
36

Figure 1.1.-Overview of the on-line 2-D LC
system. Mass Spectrometer: (1) LCQ
Classic Ion trap Mass Spectrometer with (2)
Protana micrometric positioner. Columns:
(3) SCX precolumn: BioX-SCX 500µm
IDx15mm (LC Packings); (4) C18
precolumn: C18 300 µm ID x 5mm (LC
Packings). (5) Analytical column: Home-
made fused silica with Kromasil C18, 5 µm.
Pumps: (6) HPLC pump 1: Waters 2000
isocratic pump; (7) HPLC pump 2: HP 1100
BinPump, HP UV Detector and (8) Degasser
G1312A, controlled by HP ChemStation
software. 2-D LC valve-switch system: (9)
Home-made with two Valco VICI valves.
System control: (10) Custom built hard- and
software for system control through open-
close electric switches. A pentium 100
computer with I/O card and extern signal
converter coordinate all the 2-D LC
elements. A C++ software controls the
events of the equipment involved (valves,
mass spectrometer, chromatographic
system).
1
9
7
8 6
10
5
3
42
37

Figure 1.2.-Overview of the on-line 2-D
LC system used in this work. The SCX
cartridge absorbs the injected sample.
This material is stepwise desorbed
using solvent trains of increasing salt
concentration. Each SCX fractions is
directed to a RP concentration cartridge
and then desorbed, separated by an
acetonitrile gradient in a capillary
column and analysed in a mass
spectrometer. The 2-D LC system uses
two Valco electromechanic valves of 6
ports and 2 positions (0 and 1). When
valve configuration is 1-1 (valve1 in
position 1 and valve 2 in position 1)
sample or salt trains go to SCX
cartridge, when 0-1 they run to C18
precolumn and when 0-0 sample elute
from precolumn to analytical C18 and
mass detector
38

Chapter 1
1.1.3 Data processing and refinement
Xcalibur 1.0 generated 7 total ion chromatograms (TICs) per sample, one for each salt
step and another from the initial SCX-non retained fraction. Then, the Sequest 1.0
software (Thermo Electron) was used in order to extract the information encoded in the
fragmentation spectra of each TIC. Sequest data processing produces files in dta
format. Dta files are ASCII files that include information about the precursor peptides
mass and charge and the fragment ions m/z and intensity values. Two different de novo
sequencing softwares, Peaks Studio 2.4 (Bioinformatic Solutions) and Lutefisk97 (free
software developed by Richard Johnson and Amgen Inc. with Graphic User Interface
designed by Dr J. Abian; Johnson 97) were used to produce a maximum of 5 candidate
peptide sequences per each 2-D LC dta file. De novo sequencing conditions for Peaks
were: Parent mass error tolerance 0.5; Fragment mass error tolerance 0.5; Enzyme and
PTM Trypsin with Cam; Instrument IonTrap. Lutefisk used options were: Parent mass
error tolerance =0.6; Fragment mass error tolerance =0.6; Peak width= 1; Enzyme and
PTM = Trypsin with Cam; Instrument=LCQ.
A BLAST search (Altschul 90) was performed for each Peaks result file, looking for short
related, nearly exact matches in 3 Ensembl fish fasta peptide databases (Takifugu
rubripes September-2004; Danio rerio September-2004; Tetraodon nigroviridis
September-2004). In order to automate the BLAST search, Orynovo, a perl script
developed at Oryzon Genomics by Dr. A. Espinosa was used. When the resulting
BLAST protein description did not indicate protein function, a tentative one was looked
for through a pBLAST against NCBI databases (www.ncbi.nlm.nih.gov/BLAST). BLAST
and sequence information from Peaks and Lutefisk were individually revised and
integrated in the 2-D LC sequence database. Lutefisk results were used for validation of
Peaks–derived candidates, and therefore only Peaks candidates were processed with
Orynovo. The data processing scheme is depicted in figure 1.5. Charge at pH 3 was
also calculated for each sequence using the “iep function” based on aminoacids pKas
present in the EMBOSS package (Rice 00; bioinfo.cnio.es/EMBOSS/gui/).
Four protein-containing databases (December 2003 NCBI entries containing any of the
words “danio”, “rerio”, takifugu”, “rubripes”, “tetraodon”, “nigroviridis” or “fish”; September
2004 Ensembl fish fasta peptide databases for Takifugu rubipres, Danio rerio and
Tetraodon nigroviridis) were digested in silico with a Python 2.4 script designed by Dr.
39

Chapter 1
Abián. Trypsin-like cleavages, a minimum peptide length of 5 aminoacids, and none
missing cleavages were set as working conditions. Peptide length distribution was
calculated for both experimental and database peptides. Charge at pH 3 was calculated
based on aminoacids pKas (web.indstate.edu/thcme/mwking/amino-acids.html). The
charge distribution at pH 3 of S. senegalensis peptides was also calculated with this
Python script.
When available at NCBI web site (www.ncbi.nlm.nih.gov/entrez), human and,
occasionally, mouse Unigene number were used to query DAVID
(apps1.niaid.nih.gov/david) and get gene ontology (GO) charts. The resulting
information was compared with GO charts already published for Tetraodon nigroviridis
(Jaillon 04), Takifugu rubripes (Jaillon 04), and Oncorhynchus mykiss (rainbow trout;
Rexroad 03). GO classifications from literature were obtained from cDNA
(Oncorhynchus mykiss) or complete sequenced genome (Tetraodon nigroviridis,
Takifugu rubripes).
40

Chapter 1
R
elat
ive
Inte
nsity
4x 1
09
Retention time (min)
Rt= 25 min
15 20 25 30 35 40 45 50 55 60 6515 20 25 30 35 40 45 50 55 60 6515 20 25 30 35 40 45 50 55 60 65
Figure 1.3.- Automated MS/MS analysis of peptides eluted from de 2-D LC system. A
peptide eluting from the analytical column at minute 25 (up), is detected as the major
component in the full mass scan spectrum acquired at that retention time (down). The
mass spectrometer identifies on the fly the most abundant ions in each spectrum and
performs MS/MS spectra centered on the corresponding masses (see figure 1.4).
41

Chapter 1
∆m= 0.5 m/z Z = 2
m= (m/z x 2) – 2 mH+
m=1348.4 Da
m/z= 674.7
(RD) E G T LA E T NSR (RS) N T E A L T G ED R
Figure 1.4.- The MS/ MS analysis over the eluted peptides (II): The zoom scan spectrum
allows the determination of the peptide mass (up) previous to peptide fragmentation
(down). The sequence of the analysed peptide (RDEGTLAETNSR) can be calculated
from this spectrum using a de novo sequencing software.
42

Figure 1.5.- The informatics process over the MS/MS fragmentation spectra. Each recorded TIC is processed by the SEQUEST software
to generate a collection of dta files, one per each MS/MS spectrum. Each dta file is submitted to de novo sequencing using Peaks Studio
2.4 and Lutefisk 97. Lutefisk97 entries are used as confirmation data for Peaks candidates. Each candidate sequence produced by Peaks
Studio output file is compared with fish genomes using ORYNOVO 1.0, a BLAST based software. The information coming from the
Peaks, Lutefisk and ORYNOVO output files is finally integrated and the best sequence corresponding to every initial dta file is annotated
in a database (figure 1.7).
43

Chapter 1
1.2 Results 1.2.1 Two-dimensional LC, de novo sequencing and BLAST comparison
Two-dimensional chromatography analyses resulted in seven TICs per sample (figure
1.6). From these data, 954 and 815 peptide tags for testis and larva, respectively, were
obtained by de novo sequencing. After these sequences were refined using BLAST, a
database containing 1298 selected entries was generated (figure 1.7). Database
annotation for each peptide tag include the source dta file, the mass and charge of the
MS/MS fragmented ion, the name of the protein that had been related with the resulting
sequence by BLAST and the charge of the sequence peptide at pH 3 calculated using
EMBOSS. Information related with the bioinformatic analysis was also annotated
including tentative sequences and scores, obtained using Peaks Studio 2.4 and
Lutefisk97, the sequence of the protein database which gives the best BLAST
comparison and the score of this comparison (tables 1.1 and 1.2).
Fragmentation spectra could present regions where it is difficult to deduce the
aminoacid sequence and its relative order. Both de novo softwares, Peaks and Lutefisk,
provide of alternative solutions in order to fit the final precursor ion mass. Lutefisk
introduces a mass value in brackets ([Da]), indicating that any aminoacid combination
with this mass value could be placed in that sequence region. On the other hand, Peaks
calculations results in the placement of a series of high mass aminoacids, mainly
tryptophans and tyrosines, at the C-terminal or N-terminal of the tentative sequence, to
fill the undefined mass gap. This is obviously an artifact and thus, this type of sequence
terminations have to be considered carefully. When BLAST matches from Peaks-
derived sequence tags are available, the tag giving the best macht for a given entry is
underlined to define relevant aminoacids in the corresponding tentative sequences. The
complete and detailed sequence database is available in the information found on the
attached CD.
44

Chapter 1
1.2.2 Methodological analysis: peptide charge distribution among 2-D LC
The charge distribution at pH 3 of S. senegalensis peptides was calculated with the
EMBOSS “iep function“, and they were then classified depending on the salt step of
elution and the charge of the peptide (figure 1.8 and Annex I.3). The charge distribution
at pH 3 of S. senegalensis peptides was also calculated with a Python script designed
by Dr. Abián. The four protein databases containing fish entries were digested in silico
and the charge at pH 3 of the resulting peptides calculated with the same Python script.
(figures 1.9 and 1.10).
1.2.3 Biological analysis: GO charts
In order to determine the extent of the proteome description performed by the 2-D LC
approach, GO description of S. senegalensis and GO classifications for other fish
species available in the literature were compared. GO classifications in literature were
performed from genomic data of Tetraodon nigroviridis, Takifugu rubripes,
Oncorhynchus mykiss (rainbow trout). The molecular function classification at level 1 for
the four fish species was compared in a bar diagram to determine similarities in protein
description with data available in the literature (figure 1.12). Annex I.1 contains the
detailed comparison between S. senegalensis testis and larva and Oncorhynchus
mykiss GO charts for every classification level at hierarchical level 1.
The available Unigene ID numbers for the proteins described by the 2-D LC approach
were introduced at DAVID gene ontology tool (203 Unigene ID for larvae and 242 for
testis). Resulting GO charts are depicted in the Annex I.2 for the available classification
modes: Biological Process, Molecular Function and Cellular Component.
45
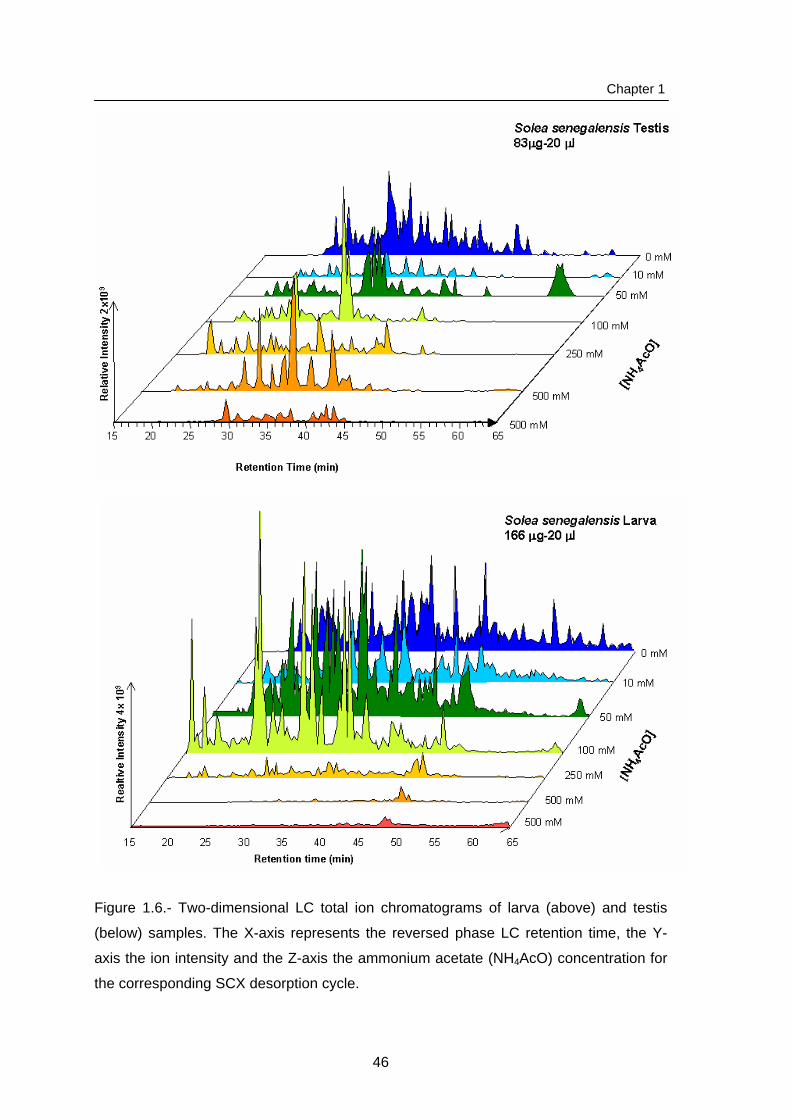
Chapter 1
Figure 1.6.- Two-dimensional LC total ion chromatograms of larva (above) and testis
(below) samples. The X-axis represents the reversed phase LC retention time, the Y-
axis the ion intensity and the Z-axis the ammonium acetate (NH4AcO) concentration for
the corresponding SCX desorption cycle.
46

Figure 1.7.- Solea senegalensis peptide tags database: Overview of the 1298 entries. All entries from larva and testis peptide tags were
introduced in the database after processing as described in figure 1.5. Detailed explanation of each field can be found in tables 1.1-1.2.
47

Tabla 1.1.- The Sequence Database (I). The validated sequences are introduced to a database where different information is integrated.
Sample and Salt step identify the analyzed fraction; Unigene Human, NCBI and Prot ID give information about the protein that has been
related with the resulting sequence by BLAST comparison; Precursor Info describes the mass in Da and charge of the MS/MS fragmented
ion described in every dta file. BLAST matches are indicated with an orange background; charge (EMBOSS) of each Peptide#1
sequence is calculated at pH 3 using EMBOSS; Peptide #1 and Score#1 are the sequence and the score indicating the confidence of the
de novo calculated sequence, obtained using Peaks Studio 2.4. Peptide sequences are also colour coded to indicate the confidence of
different sequence tags: Red = 99-80%; Blue= 79-60%; Cyan= 59-40%; Black=<40%. Underlined tag sequences are common with the
BLAST sequence. When present, Peptide #2 and Score#2 show a second, different high probability sequence provided by the de novo
program.
Sample Salt Step UNIGENE Human
NCBI Prot ID Precursor Info
Charge (EMBOSS)
Peptide #1 Score #1
Testis 0 NR NP_001001409.2 Actin, alpha 2 895.865 2 3.93 SY ELPDGQVLTLGNER 88.10%Testis 0 NR
Hs.503315 NP_001002680.1| Protein-kinase, interferon-inducible double stranded RNA dependent inhibitor, repressor of (P58 repressor)
1245.315 2 3.98 FWYQEAVTVLSAMEVECWNK 1%
Testis 0 NR Hs.75514 NP_998476.1 Purine nucleoside phosphorylase 596.29 2 4.11
TADWLLDQTK 10.10%Testis 0 NR Hs.248017 NP_998259.1| Glyceraldehyde 3-phosphate dehydrogenase 765.33 2 4.11 VPVADVSVVDLTCR 35.80%Testis 0 NR Hs.480653 emb|CAF92142.1| Annexin A5 851.89 2 4.18
GLGTFPDALLELLTSR 1%
Testis 0 NR Hs.180141 emb|CAG09506.1| Cofilin 2 (muscle) 990.785 2 4.18 AW VQVAMEVLSLFNDMK 6.10%Testis 0 NR Hs.434255 emb|CAG05091.1| Pleckstrin and Sec7 domain containing 912.36 2 4.18 FQSVFTPDLPATFPEK 17%Testis 0 NR Hs.153322 CAG02823.1 Phospholipase C 671.29 2 4.18 23%Testis 0 NR NP_851847.1 Heat shock 60 kD protein 1 601.22 2 4.26
WPSPPDCAEQRNAGVEGSLVV EK 5.30%
48

Table 1.2.- The Sequence Database (II). NCBI gives information about the protein that has been related with the resulting sequence by
BLAST comparison in the NCBI protein database; Lutefisk presents the sequence or sequence tag provided by this algorithm, rank
among the five resulting candidates and the general score. This score indicates probability to be true from 1 (maximum value) to 0
(minimum value). Underlined tag sequences are common with the Peaks (Peaks#1); BLAST contains the m/z precursor info, Score#1
(see table 1.1) of the Peaks candidate giving the best BLAST comparison, and the matched database protein fragment; Score and E
value are the BLAST scores.
NCBI Lutefisk Rank Score BLAST Score
(bits) E value Peaks
ref|NP_001001409.2| 895.865 2 88% SYELPDGQVLTLGNER 47 1.00E-06 88 ref|NP_001002680.1| [243.1][260.0]CFAVTVLSAMWE[154.1]N[234.1]
K1 0.331 1245.315 2 <1% FWYQEAVTVLSAMEVECWNK 32 0.027
NP_998476.1 596.29 2 10% TADWLLDQTK 28 0.52 10ref|NP_998259.1| VPVADVSVVDLT[160.0]R 1 0.527 765.33 2 36% VPVADVSVVDLTCR 47 1.00E-06 36
emb|CAF92142.1| WAADEDALLELLTSR 1 0.97 851.89 2 <1% GLGTFPDALLELLTSR 27 1.2 emb|CAG09506.1| [144.0]LVKVSDEVLSLFNDMK
5 0.762 990.785 2 6% AWVQVAMEVLSLFNDMK 30 0.12 6emb|CAG05091.1| FKSVFTPDLPATFPEK 3 0.691 912.36 2 20% FQSVFTPDLPTFAPEK 29 0.28 20
CAG02823.1 671.29 2 23% WPSPPDCAEQR 26 2.2 23NP_851847.1 NAGVEGSLVVEK 2 0.97 601.22 2 5% NAGVEGSLVVEK 38 4.00E-04 5
49

Figure 1.8.- Peptide charge distribution for the Solea senegalensis sequenced peptides. The peptide charge distribution of the sole testis and
larva peptide sequences described with the 2-D LC approach are represented relative to the salt step where they were acquired. Both panels
show the same figure from opposite perspectives.
50

Chapter 1
-1 0 1 2 3 4 5 -1 0 1 2 3 4 5
7
6
5
4
3
2
1
0
6
5
4
3
2
1
0
Number of charges at pH 3
Num
bero
fpep
tides
x 10
5
Danio rerio Takifugu rubripes
Tetraodon nigroviridis NCBI fish
-1 0 1 2 3 4 5 -1 0 1 2 3 4 5
7
6
5
4
3
2
1
0
6
5
4
3
2
1
0
-1 0 1 2 3 4 5 -1 0 1 2 3 4 5
7
6
5
4
3
2
1
0
6
5
4
3
2
1
0
Number of charges at pH 3
Num
bero
fpep
tides
x 10
5
Danio rerio Takifugu rubripes
Tetraodon nigroviridis NCBI fish
Figure 1.9.- Peptide charge distribution at pH 3 for the in silico Trypsin-digested database genomes. Ensembl peptide databases for Takifugu rubripes, Danio rerio and Tetraodon nigroviridis and the NCBI fish related database.
Num
bero
fpep
tides
140
120
80
60
40
20
120
80
60
40
20
1 2 3 4 5 6 7 8 5 10 15 20 25 30
Number of charges at pH 3 Number of aminoacids per peptide
Num
bero
fpep
tides
140
120
80
60
40
20
120
80
60
40
20
1 2 3 4 5 6 7 8 5 10 15 20 25 30
Number of charges at pH 3 Number of aminoacids per peptide
140
120
80
60
40
20
120
80
60
40
20
1 2 3 4 5 6 7 8 5 10 15 20 25 30
Number of charges at pH 3 Number of aminoacids per peptide
Figure 1.10.- Peptide charge and length distribution for the Senegalese sole experimental sequences.
51

Chapter 1
1.3 Discussion
The goal of this chapter was the description of the proteome of testis and larva of the
Senegalese sole. To achieve this objective, proteins were obtained from testis and larva
tissue, digested with trypsin and the resulting peptides analysed in a 2-D LC system
coupled to an ion trap mass spectrometer. Resulting MS/MS spectra were processed
with several bioinformatic tools to generate a set of tentative peptide sequences. These
sequences were further compared with existing proteins to find a possible identification.
The information related to MS/MS, de novo sequencing and protein identification were
introduced in a peptide tag database. This database, that currently contains around
1300 entries, comprises the first source of proteomic information for the Senegalese
sole available for further investigations in reproductive biology and larval development of
this species.
1.3.1 Methodological analysis
Chromatography of testis and larva samples was carried out at pH 3. In these
conditions, most peptides are positively charged and their interaction with the SCX
sorbent is favoured. To determine the charge profile of the 2-D LC experiment, the
charge at pH 3 of the resulting 1298 peptides was calculated using the “iep function” of
the EMBOSS software.
The distribution of peptide charge along the different salt steps where the peptide was
detected shows roughly the expected trend: as the salt concentration increases, the
calculated charge of the peptides eluting in that fraction also increases (Alpert 88, Zhu
91). Nevertheless, some biases or exceptions to this main trend can be observed. For
example, the amount of double charged peptides showed an steady increase between
100 and 500 mM, despite the major concentration of these sort of peptides was found in
the non-retained fraction (0 mM) Also, the salt step with a maximum of peptides at five,
eight and nine charges was 10 mM, although this maximum was expected at a higher
concentration, probably, about 100 mM and 250-500 mM for 5 and 8 or 9 charges
respectively, in agreement with the tendency observed in the graph. These biases may
be the result of other factors involved in the separation process such as hydrophobic
interactions (Peng 03) or peptide length effects (Gillar 05).Charge distributions from the
52

Chapter 1
four studied fish databases and the 2-D LC MS/MS obtained sequences presented
significant differences (figures 1.9 and 1.10). The S. senegalensis data indicates a more
spread distribution, with a maximum for 2 and 3 positively charged peptides, while the
fish databases present a maximum for peptides around one positive charge.
This effect could be caused by the different peptide length distribution between
database and experimental data (figures 1.10 and 1.11). The great number of short
peptides resulting after the digestion of the proteins in the four databases may generate
a maximum at one positive charge, as observed in figure 1.9. For this reason, new
distributions for the databases were calculated, restricitng the length of the peptides
resulting from digesting in silico the database. No changes were observed between both
approaches, concluding that differences in charges distributions should be caused by
other factors explained below.
Num
bef
1 2 3 4 5 6 7 8
rope
ptid
esx
104
0 10 20 30 40 50
Number of aminoacids per peptide8
7
6
5
4
2
3
1
16
14
12
10
8
4
6
2
Lenght: 12-25
-1 0 1 2 3 4 5 6
7
6
5
4
3
2
1
0
Number of charges at pH 3
Num
bero
fpep
tides
x 10
5 Lenght: full range
Num
bero
fpep
tides
x 10
4
1 2 3 4 5 6 7 8
0 10 20 30 40 50
Number of aminoacids per peptide8
7
6
5
4
2
3
1
16
14
12
10
8
4
6
2
Lenght: 12-25
-1 0 1 2 3 4 5 6
7
6
5
4
3
2
1
0
Number of charges at pH 3
Num
bero
fpep
tides
x 10
5
Length: 12-25 aa
Figure 1.11.- Peptide charge
distributions at pH 3 for the NCBI fish
database taking into account all
resulting tryptic peptides and restricting
peptides length from 12 to 25
aminoacids.
Lenght: full rangeLength: full range
53

Chapter 1
Three main reasons might explain this bias between the shotgun-derived peptide
repertory and the protein databases. First, tryptic digestion of proteins commonly
produces a fraction of incompletely digested peptides. These peptides were not
considered in the in silico calculation. As a result, experimentally determined sequences,
and especially those with a large number of aminoacids, could have additional charges
derived for the presence of internal K or R residues. This fact may produce a bias
relative to the in silico peptide population. Second, the 2-D LC setup in this study could
be selective for some groups of peptides, as the SCX step traps more effectively
peptides with multiple positive charges. And finally, MS analysis and detection could
understimate peptides with negative or small positive charge, because the response in
the electrospray positive ion mode is greater for basic compounds. All these facts
together should contribute to underestimate the multiple charged peptides in the in silico
calculated distribution.
As observed in figures 1.9-1.11, taking into account a unit of charge, the possible values
for a set of experimental or in silico peptides describes a distribution, where some of
them are more probable than others, and even some values present almost null
probability of ocurrence. This distribution was consistent over the different modifications
tested in the Python script, and may be caused by the fact that charge for peptides is
restricted to a certain values resulting from the combination of a limited number of pKa
values of the aminoacids. A similar distribution of probabilities was described and
applied to peptide identification by Mann and Zubarev (Mann 95; Zubarev 96) regarding
to the possible masses that a peptides could present in function of the masses of the
aminoacids. Several approaches have taken advantatge of this property to discrimate
between peptides and contaminants in MS analysis (Dods 06, Kaur 06, Fukai 00, Blom
97). On the other hand, the observed property on charge distribution will not be so
profitable for peptide discrimination, but it is still of interest for theoretical and
experimental calculations of peptide charge.
The shotgun technology has been successfully applied to human samples (Davis 01;
MacCoss 02; Shen 04), yeast (Wolters 01; Washburn 02; Peng 03), Xenopus sp. (Liska
04), some plants like Oryza sativa (Koller 02) or different bacterias (Choe 05; Wolff 06).
Descriptions for any fish proteome (tissue or whole organism) using this technology
were not available in the literature by the time of the current study.
54

Chapter 1
Testis from other species has been also described using a similar 2-D LC MS system
composed by an off-line SCX-RP chromatography coupled to a LCQ Deca (Rattus
norvegicus; Essader 04). This study obtained over 6500 unique peptides and around
2600 proteins from 1 mg of digested testis proteome. As explained in the general
introduction, the broadness of the description obtained by 2-D LC coupled to MS/MS
depends principally on the election of an off-line (R. norvegicus) or an on-line system (S.
senegalensis), on the scan speed of the mass spectrometer (LCQ Deca vs. LCQ,
second and first generation of IT-MS by Thermo Electron, respectively) and, obviously,
on the amount of sample analysed (1 mg for R. norvegicus against less than 0,1 mg for
S. senegalensis). These three factors made the description of the testis proteome of R.
norvegicus much more extensive than the performed in this study for the testis of S.
senegalensis. On the other hand, the description of R. norvegicus was facilitated by the
presence of genome databases for the same species or for very close homologous
animals. In the case of S. senegalensis, proteome was described by peptide sequencing
without database support and homology-driven protein identification.
Different improvements on the shotgun system of the current study could be performed
to extent the description on S. senegalensis. For instance, loaded sample should be
increased either by changing the SCX cartridge for another column with higher capacity
or by turning to an off-line system. The range of salt-plugs can also be wider, especially
in the low concentration range, where the majority of peptides were identified, or the
length of the RP gradient could be adjusted to expand the time region where peptides
elute. Another major upgrade would be the usage of the last generation of IT mass
spectrometers (i.e. LTQ Orbitrap). Considering the expertise and know-how acquired
during this first approach, and that much of these experimental requierements are
already available, these ameloriations will provide in a near future a further and deeper
step into the description of S. senegalensis proteome.
1.3.2 Biological analysis
The GO description of the Senegalese sole proteome was compared with the
descriptions available in the literature for other fish species (Tetraodon nigroviridis,
Takifugu rubripes and Oncorhynchus mykiss). These GO classifications had been
performed using predicted proteins translated from a cDNA library (Oncorhynchus
55

Chapter 1
mykiss) or full genome sequences (Tetraodon, Takifugu), and correspond to the larger
GO data collections available for fishes. The entries used in GO classifications were
450, 25625, 10841 and 9885 for Solea, Oncorhynchus, Tetraodon and Takifugu,
respectively (Rexroad 03, Jaillon 04).
Protein distributions were similar between the four fish species despite differences in the
methodological origin and size of the datasets (figure 1.12). Major discrepancies were
observed in the “enzyme regulator” and “nucleic acid binding” groups of the rainbow
trout. Interestingly, in the case of the Senegalese sole, the group of proteins in the
“signal transducer” group was more numerous than in any of the other species. This
increased proportion of proteins involved in pathway signalling could be related to the
specific samples analyzed in the case of S. senegalensis, as expected for tissues
involved in growing and metamorphosis processes (larva; Kimmel 01) or
spermatogenesis (testis; Ethier 01; Welt 02).
0%
10%
20%
30%
40%
Enzyme
Enzyme regulator
Ligand binding or carrier
Nucleic acid binding
MotorSignal transducer
Structural molecule
Transcription regulator
Transporter
Tetraodon nigroviridisTakifugu rubripesSolea senegalensisOncorhynchus mykiss
Figure 1.12.- Molecular function geneontology comparison for different fish species.
Comparison of the Solea senegalensis GO results for Molecular Function at level 1
compared with those described in the literature for Tetraodon nigroviridis, Takifugu rubripes,
Oncorhynchus mykiss (rainbow trout). Proteins classified under the “Unknown” term in GO
results were not taken into account to calculate the percentatges of the other groups.
56

Chapter 1
The comprehensive GO comparison between the Senegalese sole and the rainbow trout
(Annex I.1) showed that, proportionally, less sole entries were determined as “unknown”
at any classification level. These differences coud be produced by the different
methodologies used for sequence analysis (2-D LC MS/MS peptide sequencing and
mRNA-cDNA sequencing for sole and trout, respectively) and the relative size of the two
data collections (1300 peptides vs 25625 cDNA sequences). The 2-D LC approach
detects with more probability peptides derived from high abundant proteins, while cDNA
sequenciation is not so conditioned by the abundance of the mRNA, as the genomic
material is amplified by PCR. Then, the cDNA trout dataset probably present more
sequences representing low abundant proteins, which in turn have a lower chance of
having annotated functions than highly expressed molecules.
In summary, a set of about 1300 peptides from S. senegalensis testis and larva has
been described for the first time by an LC-MS shotgun approach. This experimental
design yielded a peptidic repertory where double and, more generally, multiple charged
peptides were overrepresented relative to monocharged or acidic sequences. Despite
this bias, the functional description obtained from the 2-D LC-derived data was
comparable to other descriptions performed with larger genomic datasets, validating the
shotgun methodology in terms of the protein groups represented by the obtained peptide
repertory in Solea senegalensis.
57

Chapter 2 Proteomic analysis of differentially expressed proteins in wild and cultured Solea
senegalensis during the spermatogenesis process.

Chapter 2
In this chapter, proteome variations during spermatogenesis were compared between
wild-caught and F1 generation in captivity of Solea senegalensis. The Senegalese sole
F1 males often present an impaired production of sperm and morphological
abnormalities in spermatozoa, which decrease the fecundation rates with respect to
those observed in wild-caught fish. An approach that detects differences at the protein
level in testis and/or sperm of both wild and F1 animals during spermatogenesis will be
of great interest to increase the current knowledge on flatfish spermatogenesis and the
factors which modulate this process. Therefore, a proteomic study was carried out on
testis from wild and F1 animals at different stages of spermatogenesis, i.e., mid, late and
functional maturation. In collaboration with the research groups of Dr. J. Planas and Dr. J. Cerdà, the testes
from wild animals used in this study were also analyzed by using an oligonucleotide-
based microarray as a complementary expression analysis tool. Both proteomic and
transcriptomic analyses were performed using the same biological material to provide
data without interindividual variations. These studies will be of interest to describe
expression changes at protein and mRNA level in the spermatogenic process in the wild
Senegalese sole.
The whole process of microarray analysis was carried out in the genomic platform of
Oryzon Genomics as described by Cerdà et al. (in preparation). The proteomic analysis
was performed using the facilities of the CSIC/UAB Proteomic Laboratory as described
in Materials and methods.
59

Chapter 2
2.1 Materials and methods 2.1.1 Biological samples
Testis tissue was obtained from 9 wild (F0) adult individuals of S. senegalensis fished in
the salt marshes of the Cadiz bay (Spain) in March and April 2004, and then maintained
in the facilities of “CICEM El Toruño” in tanks under natural conditions of photoperiod
and temperature for 30 days until sacrifice. Testis samples were also obtained in April
2005 from 6 cultured (F1) Solea senegalensis adult fish reared from eggs spawned by
wild-caught fish adapted to captivity. These individuals were fed ad libitum for one year
once a day with commercial pellets (Proaqua, Spain), and kept under natural
photoperiod and temperature in 12,000-liter rectangular tanks in the Centre of
Aquaculture-IRTA. The morphometric data of all the studied individuals are described in
table 2.1.
Fish were sacrificed by stunning and decapitation, the testes were dissected and
weighed and the GSI was calculated. For each animal, the testis was divided in different
parts for further genomic, proteomic and histological analysis. For genomic and
proteomic purposes, samples were frozen in liquid nitrogen and kept at –80ºC.
Transport of these samples was always done in dry ice.
2.1.2 Histological analysis
Histological analysis was carried out to determine the stage of spermatogenesis. Pieces
of testis were fixed in modified Bouin solution (75% picric acid and 25% formaline) for
two hours, dehydrated, embedded in paraplast, sectioned at 5 µm and stained with
eosin/hematoxilin. Testes were classified into three stages depending on the relative
abundance of germinal cells as described by García-López et al. (2005).
60

Chapter 2
Table 2.1.- Morphometric data of the studied individuals. Group= Experimental group in
which each individual was classified for 2-D analysis. F0 and F1 stands for wild and
aquacultured, respectively; the following key letters in the group name (M, L or Mat)
indicate spermatogenesis stage. F0=wild, F1=cultured, M=mid spermatogenesis stage,
L=late spermatogenesis stage, Mat=functional maturation.
Animal ID
Weight (g)
Length (cm)
Spermatogenesis Stage Growth Environment Group
4 740 43,5 Mid Wild F0M
10 511 38,2 Mid Wild F0M
12 716 40,7 Mid Wild F0M
1 566 39 Late Wild F0L
2 685 43,2 Late Wild F0L
3 758 44 Late Wild F0L
6 414 45,7 Functional maturation Wild F0Mat
7 537 41,1 Functional maturation Wild F0Mat 11 546 41 Functional maturation Wild F0Mat
2F8E 746 0,056 Late IRTA F1L
13C9 899 0,093 Late IRTA F1L
149F 833 0,113 Late IRTA F1L
L77 639 0,087 Functional maturation IRTA F1Mat
L5530 1164 0,083 Functional maturation IRTA F1Mat
L55 750 0,080 Functional maturation IRTA F1Mat
2.1.3 Protein extraction
Protein extracts were obtained from 3 testis samples per histological stage. According to
male origin (F0 or F1) and the criterions to determine spermatogenesis state (García
05), five classes were defined: F0 Mid (F0M), F0 Late (F0L), F0 Functional maturation
(F0Mat), F1 Late (F1L) and F1 Functional maturation (F1Mat). Fifty milligrams of tissue
per individual fish in table 2.1 were disrupted mechanically in 400 µl of TNE buffer (50
mM Tris-HCl pH 7,6; 150 mM NaCl; 2 mM EDTA pH 8,0; 1 mM Na3VO4; 1 µM
Leupeptin; 2 µM Pepstatin; 0,1 µM Aprotinin).
Then, samples were sonicated in a water bath at 4ºC for 10 min and NP40, PMSF and
DTT were added to achieve 1% v/v, 1 mM and 2 mM respectively. Proteins from 100 µl
of the resulting homogenate were precipitated using the Wessel-Flugge method (Wessel
61

Chapter 2
84). The precipitated proteins were dissolved with 100 µl of 2-D rehydration buffer (7M
urea, 2M thiourea, 2% CHAPS, 40 mM Tris-Cl, 1,2% HED (DeStreak, GE Healthcare)
and 0,5% ampholites 3-10 pI (GE Healthcare)). Each sample was quantified individually
using the RcDc kit (Bio-Rad).
2.1.4 Two-dimensional electrophoresis
Each sample was analysed twice by 2-DE. IPGstrips (3-10 L, 18 cm. GE Healthcare)
were loaded with 100 µg of protein each. These IPGstrips were processed in an
IPGphor II following a seven step voltage program during approximately 24 hours (table
2.2 and figure 2.1; 10 h at 50 V, 1:30h at 500 V, increase to 1000 V during 1:30h,
increase to 2000 V during 1:30h, increase to 4000 V during 1:30h increase to 8000 in 2
hours and focus at 8000 V until 70000 Vhr). Strips were frozen at -40 ºC until
equilibration or immediately equilibrated during 15 minutes with 10 ml of 50 mM Tris-HCl
pH 8,8, 6 M urea, 30% v/v glycerol, 2% w/v SDS, 10 mg/ml DTT and 0.1% bromophenol
blue, 15 minutes more with 10 ml of 50 mM Tris-HCl pH 8,8, 6 M urea, 30% v/v glycerol,
2% w/v SDS, 25 mg/ml IAA and then loaded over a 12% polyacrylamide gel. Samples
ran through the polyacrylamide gels in an Ettan Dalt VI electrophoresis unit (GE
Healthcare) at 20 ºC (Hetofrig CB refrigerator, Heto) under standard conditions (30
minutes at 2,5 W/gel and 16 W/gel for 4 hours). Gels were then stained as described
before (Moertz 01) and images acquired in a GS-800 Calibrated Densitometer (Bio-Rad)
Table 2.2.- Isoelectrofocusing steps programmed on the IPGphor to separated proteins
of gonad proteome samples by pI.
Step Process Voltage (V) Time (hh:mm) Volts-hour (Vhr)
1 Voltage assisted
rehydration and sample loading
50 10:00 --
2 Sample loading and focusing
500 1:30 --
3 Sample focusing 1000 1:30 --
4 Sample focusing 2000 1:30 --
5 Final sample resolution 4000 1:30 --
6 Final sample resolution 8000 2:00 --
7 Final sample resolution 8000 -- 70000
Current was 50 µA/IPGstrip and temperature was set at 20ºC during the whole process
62

Chapter 2
Voltage (V) Conductivity (µA) Voltage·hour (Vh)
Figure 2.1.- Evolution of the electrical parameters monitored for the IPG separation of a
protein extract from a male sole gonad. These graphics were used as quality controls for
the IEF processes involved in this study. Voltage, conductivity and voltage·hour were
recorded every 5 minutes during the 24 hours of the process and plotted against time
(Hours: Minutes). The vertical lines delimitate the seven steps described in table 2.2.
2.1.5 Differential expression analysis and clustering
The expression analysis was done using the Image Master Platinum 5.0 software
package (IMP 5.0, GE Healthcare). Spots were detected automatically fixing saliency
between 1000-2500, and minimum area and smooth at 5 and 2, respectively. Spot
detection was further refined manually for each gel to ensure good quality results.
Matching was done using one of the gel replicates from individual number 3 (F0 Late) as
the reference gel, with 10 landmark uniformly distributed and further manual checking.
Six different comparisons were performed between the previously defined classes (F0M
vs. F0L; F0L vs. F0Mat; F0M vs. F0Mat; F1L vs. F1Mat; F0L vs. F1L; F0Mat vs. F1Mat),
to determine spots with changing protein levels. Normalized volume (%Vol) of spots was
used to determine differences. This value corresponds to the volume of a certain spot in
a gel divided by the summatory of the volumes of all the spots detected in the same gel.
The degree of difference between two groups of spots is expressed as the average
ratio. The average ratio value indicates the normalized volume ratio between the two
groups. Values are displayed in the range of -∞ to -1 for decreases and +1 to +∞ for
increases in protein abundance. Values between -1 and +1 are not represented, hence
a two-fold increase and decrease is represented by 2 and -2, respectively (instead of 2
and 0,5).
63
Chapter 2
Determination of the significance of the differences on %Vol between two groups was
performed using the Student’s t-test option provided in the IMP 5.0 package. Only
groups presenting differences with Student’s t-test values greater than 3 in one of the
comparisons were used for further identification steps. A Student’s t-test value greater
than 3 with 6 gels per state (10 degrees of freedom) corresponds to a p-value < 0.05.
Normalized volume data for spots present in all gels was referred to F0Mat values and
hierarchical clustering perfomed using Cluster 3.0 (developed by Michael Eisen and
updated by Michiel de Hoon) with centred correlation and complete linkage conditions.
Resulting clusters were visualized with Java TreeView 1.0.7 (Saldanha 04).
2.1.6 Determination of gel variation: Mr and pI variation
Six spots were chosen to study variation of Mr and pI coordinates during the experiment.
Coordinates were calculated relative to the values of 10 spots taken as reference spots
along the 30 gels. The Mr values of these 10 spots were interpolated from an
experimentally determined relationship between the log Mr and electrophoretic mobility
of molecular mass markers added to the 2D separation in the performed gels. Mr for
these molecular mass markers was referred to the dye front. The pI values were
deduced from the linear relationship between pH and length of the IPGstrips. The mean,
the standard deviation (SD), and the coefficient of variation (CV) of Mr and pI values for
these six spots were calculated in all the 30 performed gels.
2.1.7 Determination of gel variation: Normalized volume variation
A collection of spots that where present in all 30 gels (488 items) were chosen to study
reproducibility of the normalized volumes in gels. The standard deviation and the
coefficient of variation of the normalized volume for these spots were calculated in all
the gels from the same state. The mean for the CV of all the spots of the same state (CV
Mean Value) was also obtained.
64

Chapter 2
2.1.8 Protein identification
Target spots were manually excised in a laminar flow cabin and placed in a digestion
plate (Proxeon Biosystems). A multiscreen vacuum manifold (Millipore) was used to
digest samples with trypsin. The procedure for in-gel digestion was as follows. First, gel
slices were washed 3 times with 50 µl of 25 mM NH4HCO3 at pH 8 and dehydrated by
washing them three times with acetonitrile. Gel slices were then incubated 1 hour at
37ºC with 50 microliters of 10 mM DTT in NH4HCO3 (25 mM, pH 8). Afterwards slices
were incubated one hour at 25 ºC in a dark place with 50 µl of 55 mM iodoacetamide in
NH4HCO3 (25 mM, pH 8) to carbamidomethylate the reduced cysteines. Gel fragments
were washed with NH4HCO3 (25 mM, pH 8) and dehydrated again with acetonitrile. Five
to fifteen microliters of 50 ng/µl trypsin (Promega) were added to each gel slice,
depending on the volume of the excised spot, incubated 45 minutes at 4ºC and then the
non absorbed trypsin removed. Gel fragments were covered with NH4HCO3 (25 mM, pH
8) and digestion took place during 16 hours at 30ºC (Carrascal 02). For the peptide
extraction, gel slices were washed three times with ACN/H2O 1/1 v/v 0,25% TFA and
three times with acetonitrile. The resulting liquid (80-120 µl) containing the digested
peptides was totally evaporated, redissolved with 5 µl de MeOH/H2O 1/2 v/v 0,1% TFA
and stored at –80 ºC until mass spectrometry analysis.
The digested sample (0,5 µl) was analysed with a Voyager De PRO MALDI–TOF mass
spectrometer (Applied Biosystems). The instrument was run in reflectron mode with an
average resolution of 12,000 full-width half-maximum at m/z 1500 and laser intensity
between 1800 and 1900 V. A 5 mg/ml α-cyano-4-hydroxycinnamic solution was used as
MALDI matrix. Spectra were externally calibrated using a standard peptide mixture (des-
Arg1-bradykinin (904,46 Da), Glu1-fibrinopeptide B (1570,68 Da), angiotensin-1,
(1296,69 Da), ACTH 1-17 (2093,09 Da), ACTH 18-39 (2465,20 Da), ACTH 7-38
(3657,93 Da)). Samples and calibration mixtures were spotted in alternate lines of a 96 x
2 sample positions MALDI plate. Each sample was externally calibrated with the
standard peptide mix in the corresponding top left position in the plate. When the ions
corresponding to already known trypsin autolytic peptides (m/z 842,5100 and
2111,1046) were detected, a second automatic internal calibration of the spectra was
performed using these ions as reference.
65

Chapter 2
The resulting spectra were used to select the peptides susceptible to be analysed by
tandem mass spectrometry. Previously to this analysis, samples were desalted using
ZipTip C-18 micropippete tips (Millipore) following these steps: chromatographic phase
conditioning with 5x 10 µl ACN/H2O 1/1 and 5 x 10 µl H2O 0.1% TFA, sample load,
sample wash with 3 x 10 µl H2O 0.1% TFA and 3 x 10 µl H2O; peptide elution with 5 µl of
70% methanol 1% acetic acid. A volume of 2-3 µl of sample was loaded into a nanoESI
spray capillary (Proxeon Biosystems) and analysed by n-ESI ITMS/MS using a LCQ
mass spectrometer (Thermo Electron) equipped with a nanospray interface (Protana).
The instrument parameters were set with five standard peptides of molecular weights
between 1296 and 2149 (angiotensin I and substance P and 3 synthetic peptides of
1758, 1911 and 2149 Da, respectively). Applied electrospray voltage to create
electrospray was 0,8 kV and capillary temperature was set at 110 ºC.
For MS/MS experiments, the isolation window was 3 mass-units wide, and the relative
collision energy was 20–45%, depending on the charge of the precursor ion. Resulting
information contained a scan spectrum, a high resolution spectrum or zoom scan and a
fragmentation spectrum or MS/MS spectrum. In the scan spectrum the signals
corresponding to the different charge states from the present peptides were detected,
while in the zoom scan the m/z and charge state of the ions to be fragmented were
observed with precision. The MS/MS spectrum is used to determine the peptide
sequence of each analyzed ion.
2.1.9 Bioinformatic analysis of MS/MS spectra
The information encoded in the fragmentation spectra of each peptide was extracted
using the SEQUEST software (Thermo Electron) and transformed into dta format.
Further analysis using Peaks 2.4 and Lutefisk97 and were performed as described in
Chapter 1.
For each spectrum, the tentative de novo sequences derived from Peaks were sent
together for a BLAST homology search, looking for short related, nearly exact matches
(Altschul 90, www.ncbi.nlm.nih.gov/BLAST). In case of more than one BLAST match,
Lutefisk candidates were used to confirm or suggest the final tentative sequence. When
66
Chapter 2
resulting BLAST protein description did not indicate any protein function, a new search
was performed against the NCBI database using pBLAST.
2.1.10 Comparing sequenced peptides and identified proteins with S. senegalensis
ESTs
An EST database for the Senegalese sole was generated in the Pleurogene project by
sequencing approximately 11000 clones from a normalized cDNA library generated by
combining different cDNA libraries. These libraries were from intestine, stomach, liver,
larvae at different metamorphic stage, brain (including pituitary), ovary, testis, and
undifferentiated gonads (Cerdà, in preparation).
The peptide sequences from all spots were translated to genomic ATG code. All the
possible degenerated combinations were taken into account for further steps. The
resulting genomic sequences for each spot were compared using tblastn ([pam30]
matrix; protein query vs. translated database, six frame translation) with a set of 10000
ESTs from the Senegalese sole. For each sequence a maximum of three possible hits
were reported. The ESTs were also compared to the NCBI protein database using
blastx ([blosum62] matrix; translated query vs. protein database with six frame
translation). For each EST a maximum of three possible hits were reported.
Both results (peptide sequences vs. ESTs, ESTs vs. NCBI database) were combined to
confirm relationships of MS/MS sequenced peptides and identified proteins. The 3
resulting ESTs for each peptide sequence were searched against the result list of the
ESTs vs. NCBI comparison. In that list, each EST presents 3 protein hits. Those
proteins were compared with the original protein assignation made after peptide
sequencing (figure 2.2).
67
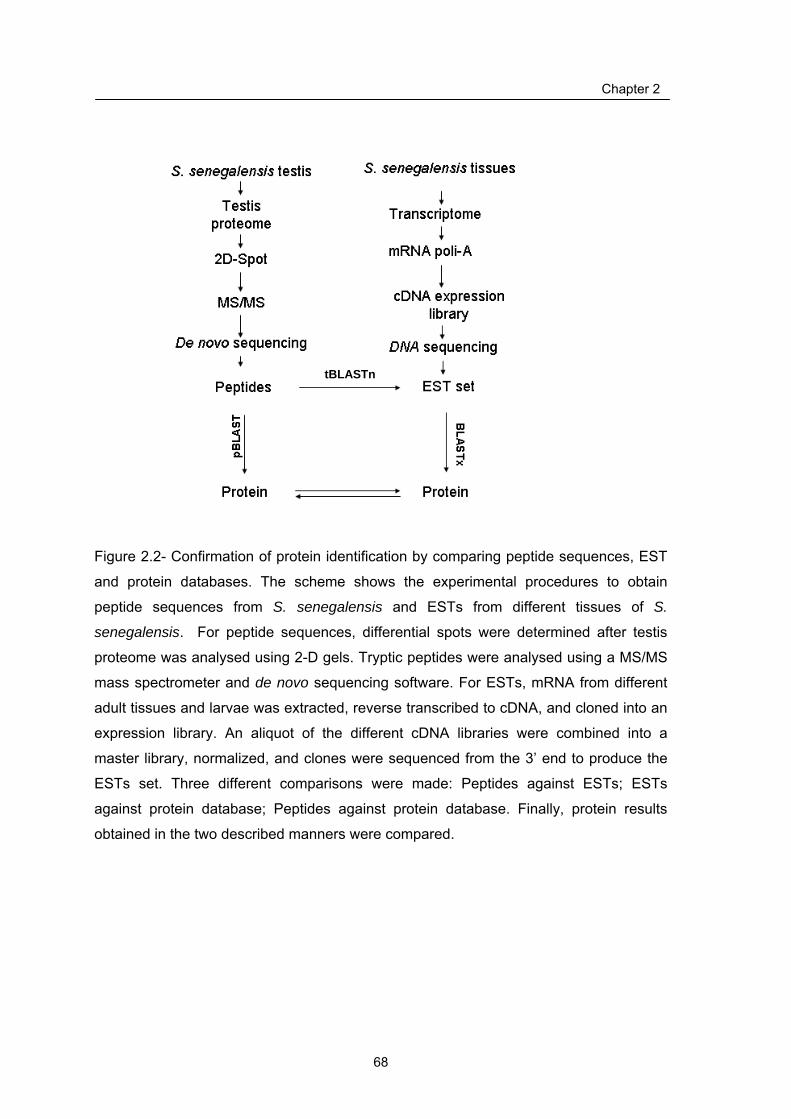
Chapter 2
tBLASTn
Figure 2.2- Confirmation of protein identification by comparing peptide sequences, EST
and protein databases. The scheme shows the experimental procedures to obtain
peptide sequences from S. senegalensis and ESTs from different tissues of S.
senegalensis. For peptide sequences, differential spots were determined after testis
proteome was analysed using 2-D gels. Tryptic peptides were analysed using a MS/MS
mass spectrometer and de novo sequencing software. For ESTs, mRNA from different
adult tissues and larvae was extracted, reverse transcribed to cDNA, and cloned into an
expression library. An aliquot of the different cDNA libraries were combined into a
master library, normalized, and clones were sequenced from the 3’ end to produce the
ESTs set. Three different comparisons were made: Peptides against ESTs; ESTs
against protein database; Peptides against protein database. Finally, protein results
obtained in the two described manners were compared.
68

Chapter 2
2.2 Results
2.2.1 Histological analysis
Samples from F0 (wild) and F1 (cultured) ) fish were divided into mid, late and functional
maturation depending on the relative abundance of germinal cells as described by
García-López et al. (2005). In mid spermatogenesis germ cells at all the different
developmental stages were present. In the cortex, there was a decline in the number of
spermatogonia and the appearance of a high population of spermatocytes (Fig. 2.3, A
and B). Germinal cysts containing spermatocytes were distributed in the periphery of the
seminiferous lobules, leaving a small central lumen filled by spermatides. In late
spermatogenesis, the lumen of the cortical seminiferous lobules was almost fully filled
by spermatides (figure 2.3, C-D). Few cysts containing spermatocytes were visible.
Spermatides were the most abundant cell type inside the testis, and spermatozoa
became more abundant in the medullar efferent ducts. In the final functional maturation
stage, spermatides were still very abundant in the cortical seminiferous lobules, but their
number decreased progressively as successive batches transformed into spermatozoa
(figure 2.3, F and G). Ripe spermatozoa accumulated in large quantities in the medullar
efferent ducts. This classification was used to divide the samples into the five states of
this study: Mid wild (F0M), Late wild (F0L), Functional maturation wild (F0Mat), Late
cultured (F1L) and Functional maturation (F1Mat).
2.2.2 Two-dimensional electrophoresis
Two gels per sample were performed (figure 2.4), scanned with a 300 dots per inch (dpi)
resolution and introduced in an Image Master Platinum project, in order to analyse
differences in protein expression between the different stages of spermatogenesis. The
main features of each gel were evaluated taking into account all the spots considered for
analysis (table 2.3). The reproducibility of the gels across the performed gels was
determined by studying the variations in Mr and pI of six spots. These spots presented
variations of their expression in the different experimental groups (figure 2.5 and 2.6).
The standard mean deviation of normalized volume of 488 spots with representation in
all thirty gels was also calculated to determine variability of normalized volume inside the
same experimental group (figure 2.7). Mean value of CV in each state was 54%, 42%,
69

Chapter 2
55%, 36% and 38% for F0M, F0L, F0Mat, F1Mat and F1L, respectively. From this data
it was assumed that only variations greater than ±1,6 must be taken into account for
further expression analysis.
2.2.3 Differential expression analysis and clustering
The %Vol of the detected spots was compared between F0 Mid and F0 Late; between
F0 Mid and F0 Functional maturation; between F0 Late and F0 Functional maturation;
between F1 Late and F1 Functional maturation; between F0 Late and F1 Late; and
between F0 Functional maturation and F1 Functional maturation. The spots showing
significant changes are indicated in the gel images depicted in figure 2.8. The
corresponding statistical data is given in table 2.4, and the bar diagrams represent the
relative changes in the five different stages in figure 2.10. Bar diagrams in this latter
figure are grouped depending on the criteria described in figure 2.9. Briefly, histograms
were visually analysed to determine whether a positive or negative variation occurs
between “state A” and “state B”. In case it was positive (increase) a number 1 was
annotated, while in the case of a negative variation a number 2 was chosen. Number 0
indicates no significant variation between states. The comparisons between spots in
mid, late and functional maturation F0 gels were analysed together and in this case a
code from 1 to 6 was given to represent the six different evolution patterns observed.
Spots could then be grouped on the basis of the four-number code that was built after
these comparisons (Table 2.5) The first number is related to the evolution through the
mid, late and functional maturation F0 states (F0 MLMat), the second one is the
comparison between F1Mat and F1L (F1Mat-F1L) states, the third stands for the
differences found in the F0L- F1L analysis (F0 Late-F1 Late), and the last one for the
F0Mat-F1Mat comparison (F0Mat-F1Mat).
Table 2.3.- Number of analysed spots per each experimental group. SD and CV: mean
standard deviation and coefficient of variation of the spots of each experimental group,
respectively.
Experimental group F0M F0L F0Mat F1Mat F1L
Spots 1055 1155 1135 1148 769 SD 188 299 108 238 183 CV 17,8 25,8 9,5 20,8 23,8
70

Chapter 2
Figure 2.3.- Photomicrographs of histological sections of Senegalese sole testis at different stage
of spermatogenesis. Panels A-B: Testis at mid spermatogenesis where spermatocytes (Spc) and
spermatides (Spd) are the main germinal cells observed in the seminiferous tubules. The lumen
of the seminiferous lobules is narrow, and some start to show some spermatozoa (Spz). Panels
C-E: Testis at late spermatogenesis in which the lobules are almost fully filled of Spd, and Spc
are restricted to the periphery of the lobules. (D). In the medullar area of the testis, the lobules
show a bigger lumen filled by Spd and Spz (E). Panels F-G:, Testis at the functional maturation
stage in which lobules show much bigger lumen containing much more Spz and few Spd. The
Spc almost disappear of the periphery of the seminiferous lobules.
71

Chapter 2
F1 Functional maturation F1 Late
F0 Mid F0 Functional maturation
R2 R1 Mw 10 kDa
3 pI 10 F0 Late
Mw 150 kDa
Figure 2.4.- Two dimensional electrophoresis gels obtained from Senegalese sole
testis. Each sample was analysed twice. In the figure, these duplicates (R1, R2) are
placed one next to the other inside each group of six gels with the same state. 2-DE
separation was carried out in the 3-10 range of pI and in the 10-150 kDa range for Mw.
The specimen code is, top to bottom in each group: F0 Mid = 4, 10, 12; F0 Late = 1, 2,
3; F0 Functional maturation = 6, 7, 11; F0 Late 2F8E, 13C9, 149F; F1 Functional
maturation = L77; L5530, L55.
72

73
Chapter 2
Figure 2.5.- Reproducibility of gel analysis: Mr and pI variations across the experiment.
The variation of Mr and pI coordinates of six spots (in red circles: 1821, 1814, 2667,
2709, 3017 and 3014) was studied during the experiment (figure 2.6). Coordinates were
calculated relative those 10 reference spots (indicated in the white squares as Mr-pI
pairs).
18211814
2709
30143017
2667
4.50-106.10-12
8.00-10
5.80-100
4.70-75
3.00-50 7.40-50
5.50-407.80-37
10.0-34
9.80-15
7.00-226.00-22
6.70-15
18211814
2709
30143017
2667
4.50-106.10-12
8.00-10
5.80-100
4.70-75
3.00-50 7.40-50
5.50-407.80-37
10.0-34
9.80-15
7.00-226.00-22
6.70-15
kDa
100
50
25
70
37
15
3 pI 10

Chapter 2
Mr pI
Group ID Mean SD CV Mean SD CV
1821 61,5 2,2 4,7 4,7 0,07 0,01
1814 61,7 2,5 6,3 6,7 0,04 0,00
2667 37,0 0,5 0,2 5,3 0,03 0,00
2709 36,1 0,3 0,1 8,5 0,05 0,00
3014 17,8 0,4 0,1 6,1 0,09 0,01
3017 17,1 0,3 0,1 3,7 0,12 0,01
Figure 2.7.- Reproducibility of gel analysis. Top: Gel image areas containing the six
selected spots are depicted indicating 4 Mr units wide and 1 pI unit high reference
window. Bottom: The mean, the standard deviation (SD), and the variation coefficient
(CV) of Mr and pI values for these spots in the 30 performed gels.
74

Chapter 2
Table 2.4 Part A.- Protein abundance changes for the spots submitted to protein
identification. ∆: variation value. Variation was calculated as vali/valj where vali=max
(val1, val2) and valj=min (val1, val2). Variation is indicated as a positive value in case of
overexpression and as a negative value in case of subexpression. Abundance changes
higher than 2 fold are highlighted in yellow. Changes with confidence higher than 95%
are indicated in bold; T-test: t-test value; p>: probability in percentage of obtaining the
observed difference not because of stochastic variation (only probabilities <95% are
described); Number code (NC): Group for each variation as explained in figure 2.8.
F0M - F0L F0L - F0Mat F0M - F0Mat Spot Prot ID T-test / p > ∆ T-test / p > ∆ T-test / p > ∆
NC
1942 Phosphoserine aminotransferase 1 0,5 +1,1 1,8 +1,6 2,9 / 99 +1,7 3 1963 Olfactory receptor Olr653 4,3 / 99,5 -3,8 3,3 / 99,5 +2,5 0,6 -1,5 2 1966 Serine (or cysteine) proteinase inhibitor 0,7 -1,4 0,1 -1,0 0,7 -1,4 4 2006 No ID 2,3 / 95 +1,6 3,1 / 99 -19 1,1 -1,2 1
2055 Isocitrate dehydrogenase 3 (NAD+)
alpha 0,1 +1,0 0,1 -1,0 0,04 -1,0 0 2126 Malate dehydrogenase 1 0,4 +1,1 0,01 1,0 0,3 +1,1 0
2174 Polymerase (RNA) II (DNA directed)
polypeptide C 2,2 / 95 -2,2 1,4 +1,5 0,8 -1,4 2
2176 Acidic ribosomal phosphoprotein P0 3,6 / 95 +23,5 1,6 -26,6 0,4 -1,1 1 2243 Uridine phosphorylase 1 0,9 +1,3 0,1 +1,0 0,5 -1,3 4
2275 Pyruvate dehydrogenase E1-beta
subunit 2,5 / 95 +2,3 2,8 / 99 -2,6 0,3 -1,1 1
2339 Hydroxysteroid (17-beta)
dehydrogenase 4 0,04 -1,0 0,6 -1,2 1,0 -1,2 0 2436 No ID 2,5 / 95 -4,6 1,4 -1,8 3,4 / 99,5 -7,8 6 2499 14-3-3 protein 0,5 +1,3 1,7 -2,0 1,12 -1,6 1 2521 6-phosphogluconolactonase 3,2 / 99 -1,6 2,7 / 95 +1,5 0,7 -1,1 2 2578 Carbonic anhydrase 0,8 +1,1 0,3 -1,1 0,4 +1,1 0
2587 Purine-nucleoside phosphorylase or Proteasome subunit alpha
1,4 +1,3 5,8 / 99,9 1,0 2,6 +1,3 1
2591 Carbonic anhydrase 0,8 +1,3 0,1 -1,2 0,8 +1,1 1 2603 Methionine sulfoxide reductase A 1,2 -1,3 4,0 / 99,5 +3,6 3,2 / 99 +2,8 2 2650 Glutathione S-transferase 1,1 +1,4 0,2 +1,1 2,8 +1,5 5 2667 Ubiquitin C-terminal hydrolase 3,1 / 99 -1,6 3,5 / 99,5 +1,8 0,5 +1,1 2 2685 Glutathione peroxidase 1,0 -1,3 3,1 / 99 +1,8 1,0 +1,5 2 2686 No ID 1,1 +1,9 9,0 / 99,9 -3,6 2,0/ 95 -1,9 1 2696 No ID 1,1 +1,2 3,3 / 99,5 -1,5 1,8 -1,3 1 2717 No ID 3,1 / 99 +1,7 2,6 / 95 -2,0 0,6 -1,1 1 2723 Peroxiredoxin 3 or Translin 0,1 +1,0 0,5 -1,1 0,4 -1,1 0 2738 Proteasome subunit beta 2,4 / 95 +1,4 3,4 / 99,5 -1,6 1,4 -1,2 1 2759 Apolipoprotein A-IV4 0,6 -1, 7 0,5 -1,4 0,9 -2,3 0 2778 Proteasome beta 4 subunit 1,8 / 95 +1,5 2,5 / 95 -1,5 0,1 -1,0 1 2784 No ID 0,5 -1,6 0,4 -1,5 0,7 -2,3 0 2820 No ID 2,3 / 95 +1,4 2,7 / 95 -1,4 0,3 +1,0 1
2837 Heterochromatin-specific nonhistone
protein 2,3 / 95 -6,4 2,0 / 95 +5,2 0,2 -1,2 2
2877 Histidyl-tRNA synthetase 3,4 / 99,5 -1,5 2,1 / 95 +1,3 0,1 -1,2 2 2897 Cofilin 12,4 / 99,9 -10,7 12,2 / 99,9 +9,5 0,3 -1,1 2
75

76
Chapter 2
Table 2.4 Part A (continuation).- Expression changes for the spots submitted to protein
ID.
F0M - F0L F0L – F0Mat F0M - F0Mat Spot Prot ID T-test / p > ∆ T-test / p > ∆ T-test / p > ∆
NC
2898 Cofilin 2 0,4 +1,4 3,1 / 99 -2,0 2,3/ 95 -1,4 1 2908 Myosin regulatory light chain 2 1,4 +1,7 3,2 / 99 +1,9 0,3 +1,1 2 2909 Unnamed protein product 0,3 +1,2 3,9 / 99,5 -2,1 3,5 / 99,5 -1,7 1 2912 No ID 0,2 -1,1 0,5 -1,2 0,8 -1,3 6 2918 Myosin light chain 1,8 / 95 +1,9 2,7 / 95 +2,2 0,3 +1,1 2
2972 Cofilin 2 10,5 / 99,9 ---∞∞∞ 8,7 / 99,9 +18,8 1,0 ---∞∞∞ 2
3013 Transgelin 2 4,0 / 99,5 +4,3 6,5 / 99,9 -4,6 0,4 -1,1 1 3022 No ID 5,0 / 99,9 -2,3 4,9 / 99,9 +2,1 0,4 -1,1 2 3089 Nucleoside diphosphate kinase 0,9 +1,1 0,9 -1,2 0,5 -1,1 0 3122 Myosin light chain alkali 3,6 / 99,5 -3,6 3,9 / 99,5 +2,4 0,7 -1,5 2 3159 Myosin alkali light chain 6 1,8 -1,4 4,9 / 99,9 +3,8 0,8 +2,8 2 3233 Profilin 2 or Cytochrome c oxidase Vb 1,2 +1,3 3,7 / 99,5 +1,8 1,1 +1,4 2 3649 Apolioprotein A1 or Serin protease 35 0,6 +1,3 1,0 -1,6 0,4 -1,2 1 3675 No ID 1,6 +1,5 1,6 -1,7 0,4 -1,1 1 3676 No ID 0,5 +1,3 2,2 / 95 +7,0 2,5 / 95 +8,9 3 3690 Proteasome subunit alpha 2,6 / 95 +1,9 2,2 / 95 -1,8 0,4 -1,1 1

Chapter 2
Table 2.4 Part B.- Expression changes for the spots submitted to protein ID. See “Part
A” for legend.
F1L - F1Mat F0L- F1L F0Mat - F1 Mat Spot Prot ID T-test / p > ∆ NC T-test / p > ∆ NC T-test / p > ∆ NC
1942 Phosphoserine aminotransferase 1 1,6 +1,3 1 0, 8 +1,2 2 0,2 -1,0 0 1963 Olfactory receptor Olr653 2,7 / 95 -3,1 2 0,9 +4,6 2 1,5 -1,7 1 1966 Serine (or cysteine) proteinase inhibitor 2,5 / 95 +1,3 1 4,6 / 99,9 -2,3 1 2,8 / 99 -1,7 1 2006 No ID 3,6 / 99,5 -3,7 2 3,3 / 99,5 +4,2 2 4,1 / 99,5 +2,1 2
2055 Isocitrate dehydrogenase 3 (NAD+) alpha 3,4 / 99,5 +2,1 1 3,1 / 99 -2,6 1 0,7 -1,2 1
2126 Malate dehydrogenase 1 5,3 / 99,9 +1,8 1 5,5 / 99,9 -2,7 1 1,8 / 95 -1,5 1
2174 Polymerase (RNA) II (DNA directed) polypeptide C 5,1 / 99,9 -7,0 2 2,5 / 95 +7, 7 2 1,4 -1,4 1
2176 Acidic ribosomal phosphoprotein P0 0,1 -1,1 2 9,3 / 99,9 -31,1 1 1,9 / 95 -1,3 1 2243 Uridine phosphorylase 1 3,8 / 99,5 +2,1 1 3,8 / 99,5 -3,1 1 1,3 -1,6 1
2275 Pyruvate dehydrogenase E1-beta subunit 5,0 / 99,9 +4,2 1 2,0 / 95 -4,1 2 3,1 / 99 +2,6 2
2339 Hydroxysteroid (17-beta) dehydrogenase 4 0,02 1,00 0 1,5 +1,6 2 3,3 / 99,5 +2,0 2
2436 No ID 1,2 +1,9 1 0,9 +1,5 2 3,0 / 99 +4,7 2 2499 14-3-3 protein 5,2 / 99,9 +3,5 1 0,3 -2,2 2 2,8 / 99 +3,2 2 2521 6-phosphogluconolactonase 1,4 -1,5 2 2,6 / 95 +1,8 2 1,0 -1,2 1 2578 Carbonic anhydrase 5,2 / 99,9 -2,5 2 0,9 +1,3 2 3,1 / 99 -1,7 1
2587 Purine-nucleoside phosphorylase or Proteasome subunit alpha 1,0 -1,2 2 2,6 / 95 -1,4 1 1,1 -1,6 2
2591 Carbonic anhydrase 4,5 / 99,9 +2,1 1 1,4 -1,3 2 2,0 / 95 +1,9 2 2603 Methionine sulfoxide reductase A 0,8 -1,2 2 2,6 / 95 +1,6 2 2,5 / 95 -2,7 1 2650 Glutathione S-transferase 1,1 -1,4 2 1,0 -1,4 1 3,7 / 99,9 -2,2 1 2667 Ubiquitin C-terminal hydrolase 1,4 -1,3 2 2,5 / 95 +1,5 2 2,4 / 95 -1,5 1 2685 Glutathione peroxidase 1,1 +1,2 1 1,1 -1,3 1 4,7 / 99,9 -1,9 1 2686 No ID 0,2 +1,1 0 1,6 -2,1 1 2,5 / 95 +1,8 2 2696 No ID 0,4 -1,1 0 1,9 / 95 -1,8 1 1,2 -1,3 1 2717 No ID 0,5 -1,2 0 1,9 / 95 -2,1 1 1,1 -1,2 1 2723 Peroxiredoxin 3 or Translin 2,8 / 99 +1,7 1 4,7 / 99,9 -2,1 1 0,9 -1,2 1 2738 Proteasome subunit beta 0,8 +1,1 1 1,4 -1,2 0 3,0 / 99 +1,4 2 2759 Apolipoprotein A-IV4 1,4 -1,3 2 3,7 / 99,5 -9,8 1 15,0 / 99,9 -9,6 1 2778 Proteasome beta 4 subunit 3,7 / 99,5 +1,6 1 2,1 / 95 -2,0 2 1,4 +1,2 2 2784 No ID 4,6 / 99,5 -15,1 2 1,3 +3,7 2 2,1 / 95 -2,8 1 2820 No ID 2,6 / 95 +1,5 1 4,3 / 99,9 -1,9 1 0,3 +1,0 0
2837 Heterochromatin-specific nonhistone protein 4,4 / 99,9 -6,4 2 2,0 / 95 +5,2 2 4,4 / 99,9 -6,5 1
2877 Histidyl-tRNA synthetase 2,2 /95 -2,1 2 3,0 / 99 +2,5 2 1,1 -1,1 0
77

Chapter 2
Table 2.4 Part B (continuation).- Expression changes for the spots submitted to protein
ID. See “Part A” for legend.
F1L - F1Mat F0L- F1L F0Mat - F1 Mat Spot Prot ID T-test / p > ∆ NC T-test / p > ∆ NC T-test / p > ∆ NC
2897 Cofilin 0,4 -1,1 2 0,4 +1,1 0 6,2 / 99,9 -9,7 1 2898 Cofilin 2 2,5 /95 +1,4 1 2,4 / 95 -1,6 1 3,2 / 99 +1,7 2 2908 Myosin regulatory light chain 2 1,6 -1,4 2 2,7 / 95 +1,8 2 2,0 / 95 -1,5 1 2909 Unnamed protein NCBI gi|47218822 0,9 -1,1 2 0,9 -1,2 1 2,7 / 99 +1,5 2 2912 No ID 4,2 /99,9 ---∞∞∞ 2 3,5 / 99,5 +++∞∞∞ 2 0,7 +1,3 2 2918 Myosin light chain 2,9 / 99 -1,6 2 2,2 / 95 +1,7 2 3,3 / 99,5 -2,0 1 2972 Cofilin 2 0,6 -1,2 2 2,3 / 95 +1,6 2 4,4 / 99,9 -14,1 1 3013 Transgelin 2 1,2 -1,6 2 0,7 -1,3 0 3,2 / 99,5 +2,2 2 3022 No ID 0,2 -1,0 0 5,9 / 99,9 +2,2 2 0,2 +1,0 0 3089 Nucleoside diphosphate kinase 1,5 +1,2 1 4,7/ 99,9 -1,6 1 0,8 -1,2 0 3122 Myosin light chain alkali 6,6 / 99,9 -2,5 2 2,5 / 95 +1,5 2 7,5 / 99,9 -3,9 1 3159 Myosin alkali light chain 6 2,6 / 95 -1,9 2 3,1/ 99 +2,3 2 4,7 / 99,9 -3,3 1 3233 Profilin 2 or Cytochrome c oxidase Vb 2,2 / 95 -1,2 2 0,2 +1,7 2 4,8 / 99,9 +1,2 1 3649 Apolioprotein A1 or Serin protease 35 8,6 / 99,9 +2,4 1 4,2 / 99,9 -3,8 1 0,01 1,0 0 3675 No ID 5,3 / 99,9 +5,1 1 1,7 -1,7 1 4,2 / 99,9 +5,1 2 3676 No ID 0,5 -2,0 0 2,2 / 95 +6,0 2 0,5 -2,4 1 3690 Proteasome subunit alpha 11,0 / 99,9 +++∞∞∞ 1 2,3 / 95 -1,7 1 7,1 / 99,9 +++∞∞∞ 2
78

Chapter 2
3 pI 10 3 pI 10 kDa
70
100
50
37
25
15
A B
D
C
70
100
50
37
25
15
E F
70
100
50
37
25
15
Figure 2.8.- Differential spots excised for identification in the spermatogenesis studies
(A:04_150904; B: 06_160904; C: 02_160904; D: 01_210305; E: 05_060605;
F: 05_060605)
79

Chapter 2
Figure 2.9.- Classification of spots relative to their protein abundance profile along the
stages of development. The five %Vol data from each spot submitted to protein
identification were arranged into a bar diagram. The comparisons between experimental
states are represented with a line (blue for F0M- F0L - F0Mat; red for F1 L- F1M; purple
for F0 L-F1 L; green for F0Mat-F1Mat). These lines are connecting the bars
corresponding to the experimental groups considered in each comparison, showing
graphically the relationship between them. A number is assigned to each line profile
(Legend). The combination of the four numbers assigned to each bar diagram
constitutes the code of the group in which every spot is classified on Figure 2.10. The
examples in the figure represent spot#1, spot#2 and spot#3, classified in group 1211,
2221 and 3120 respectively (F0 = wild; F1= cultured; M= Mid; L=Late; Mat = Functional
maturation).
80

Chapter 2
Table 2.5.- Classification of proteins depending on their expression behaviour in the
four comparisons. Spots chosen for mass spectrometry identification after image
analysis were classified as described in figure 2.9. Comparison codes: (0) No significant
differences between state A relative to state B; (1) Increase between state A relative to
state B; (2) Decrease between state A relative to state B; The comparisons between
spots in mid, late and functional maturation F0 gels were analysed together, giving four
new patterns which were assigned to 3, 4, 5 and 6 (figure 2.9).
COMPARISON Spot ID Prot ID
F0M-F0L-F0Mat F0Mat- F0L F0L-F1L F0Mat- F1
Mat
Group Class
2339 Hydroxysteroid (17-beta) dehydrogenase
4 0 0 2 2 0022
3089 Nucleoside diphosphate kinase 0 1 1 0 2055 Isocitrate dehydrogenase 3 (NAD+) alpha 0 1 1 1 2126 Malate dehydrogenase 1 0 1 1 1 2723 Peroxiredoxin 3 or Translin 0 1 1 1
011X
2759 Apolipoprotein A-IV4 0 2 1 1 2578 Carbonic anhydrase 0 2 2 1 2784 No ID 0 2 2 1
02X1
2717 No ID 1 0 1 1 2696 No ID 1 0 1 1 2686 No ID 1 0 1 2
101X
3649 Apolioprotein A1 or Serin protease 35 1 1 1 0 2820 No ID 1 1 1 0
1110
2738 Proteasome subunit beta 1 1 0 2 2898 Cofilin 2 1 1 1 2 3690 Proteasome subunit, alpha 1 1 1 2
2275 Pyruvate dehydrogenase E1-beta subunit 1 1 2 2 2499 14-3-3 protein 1 1 2 2 2591 Carbonic anhydrase 1 1 2 2 2778 Proteasome beta 4 subunit 1 1 2 2 3675 No ID 1 1 1 2
11X2
2176 Acidic ribosomal phosphoprotein P0 1 2 1 1
2587 Purine-nucleoside phosphorylase or
Proteasome subunit alpha 1 2 1 2 2909 Unnamed protein NCBI gi|47218822 1 2 1 2 3013 Transgelin 2 1 2 0 2 2006 No ID 1 2 2 2
12XX
3022 No ID 2 0 2 0 2685 Glutathione peroxidase 2 1 1 1
2XXX
81

Chapter 2
Table 2.5 (continuation).- Classification of proteins depending on their expression
behaviour in the four comparisons.
COMPARISON Spot ID Prot ID
F0M-F0L-F0Mat F0Mat- F0L F0L-F1L F0Mat- F1
Mat
Group Class
2877 Histidyl-tRNA synthetase 2 2 2 0 2521 6-phosphogluconolactonase 2 2 2 1 2603 Methionine sulfoxide reductase A 2 2 2 1 2667 Ubiquitin C-terminal hydrolase 2 2 2 1
2837 Heterochromatin-specific nonhistone
protein 2 2 2 1 2897 Cofilin 2 2 0 1 2908 Myosin regulatory light chain 2 2 2 2 1 2918 Myosin light chain 2 2 2 1 3122 Myosin light chain alkali 2 2 2 1 3159 Myosin alkali light chain 6 2 2 2 1
3233 Profilin 2 or Cytochrome c oxidase
subunit Vb 2 2 2 1 2972 Cofilin 2 2 2 2 1 1963 Olfactory receptor Olr653 2 2 2 1
2174 Polymerase (RNA) II (DNA directed)
polypeptide C 2 2 2 1
2221
3676 No ID 3 0 2 1 1942 Phosphoserine aminotransferase 1 3 1 2 0
3XXX
1966 Serine (or cysteine) proteinase inhibitor 4 1 1 1 2243 Uridine phosphorylase 1 4 1 1 1
4111
2650 Glutathione S-transferase 5 2 1 1 2436 No ID 6 1 2 2 2912 No ID 6 2 2 2
5-6XXX
82

Group 0022 ABCD
Group 101X
Group 02X1
Group 011X 2126
F0 E
arly
F0 M
id
F0 L
ate
F1 L
ate
F1 M
id
0.00.10.20.30.40.50.60.70.80.9
F0 EarlyF0 MidF0 LateF1 LateF1 Mid
2055
F0 E
arly
F0 M
id
F0 L
ate
F1 L
ate
F1 M
id
0.0
0.1
0.2
0.3F0 EarlyF0 MidF0 LateF1 LateF1 Mid
2723
F0 E
arly
F0 M
id
F0 L
ate
F1 L
ate
F1 M
id
0.0
0.1
0.2
0.3
0.4
0.5
0.6F0 EarlyF0 MidF0 LateF1 LateF1 Mid
2784
F0 E
arly
F0 M
id
F0 L
ate
F1 L
ate
F1 M
id
0.00
0.05
0.10
0.15
0.20
0.25F0 EarlyF0 MidF0 LateF1 LateF1 Mid
F0 Mid
F0 Late
F0 Mat
F1 Mat
F1 Late
2759
F0 E
arly
F0 M
id
F0 L
ate
F1 L
ate
F1 M
id
0.00
0.05
0.10
0.15
0.20
0.25F0 EarlyF0 MidF0 LateF1 LateF1 Mid
2578
F0 E
arly
F0 M
id
F0 L
ate
F1 L
ate
F1 M
id
0.00
0.25
0.50
0.75F0 EarlyF0 MidF0 LateF1 LateF1 Mid
3 0 8 9
F0 Ea rly
F 0 Mid
F 0 Late
F 1 Late
F 1 Mid
0 . 00 . 10 . 20 . 30 . 40 . 50 . 60 . 70 . 80 . 91 . 01 . 1
F 0 E a r lyF 0 M i dF 0 L a teF 1 L a teF 1 M i d
2 3 3 9
F 0 Ea rly
F 0 Mid
F 0 Late
F 1 Late
F 1 Mid
0 . 0 0
0 . 0 5
0 . 1 0
0 . 1 5F 0 E a r lyF 0 M i dF 0 L a teF 1 L a teF 1 M i d
F0 Mid
Late Mat Mat Late
F0 F0 F1
F1
Carbonic anhydrase
F0 MidF0 LateF0 MatF1 MatF1 Late
F0 MidF0 LateF0 MatF1 MatF1 Late
F0 MidF0 LateF0 MatF1 MatF1 Late
F0 MidF0 LateF0 MatF1 MatF1 Late
F0 MidF0 LateF0 MatF1 MatF1 Late
F0 MidF0 LateF0 MatF1 MatF1 Late
F0 MidF0 LateF0 MatF1 MatF1 Late
F0 F0 F0 F1
F1 Mid
Late Mat Mat Late
F0 F0 F0 F1
F1 Mid
Late Mat Mat Late
F0 Mid
Late Mat Mat Late
Isocitrate dehydrogenase 3 (NAD+) alpha
Hydroxysteroid (17-β) dehydrogenase
F0 Mid
Late Mat Mat Late
F0 F0 F1
F1
Malate dehydrogenase 1 F0 F0 F0 F1
F1 Mid
Late Mat Mat Late
Peroxiredoxin 3 or Translin F0 M F0 La
F0 F1
F1
Nucleoside diphosphate kinase
id te
Mat Mat LateF0 MidF0 LateF0 MatF1 MatF1 Late
F0 F0 F1
F1
Apolipoprotein A-IV4
2696
F0 E
arly
F0 M
id
F0 L
ate
F1 L
ate
F1 M
id
0.0
0.1
0.2
0.3
0.4F0 EarlyF0 MidF0 LateF1 LateF1 Mid
F0 Mid
F0 Late
F0 Mat
F1 Mat
F1 Late
F0 MidF0 LateF0 MatF1 MatF1 Late
2717
F0 E
arly
F0 M
id
F0 L
ate
F1 L
ate
F1 M
id
0.000
0.025
0.050
0.075
0.100
0.125
0.150
0.175F0 EarlyF0 MidF0 LateF1 LateF1 Mid
F0 Mid
F0 Late
F0 Mat
F1 Mat
F1 Late
F0 MidF0 LateF0 MatF1 MatF1 Late
2686
F0 E
arly
F0 M
id
F0 L
ate
F1 L
ate
F1 M
id
0.000.050.100.150.200.250.300.350.400.45
F0 EarlyF0 MidF0 LateF1 LateF1 Mid
F0 Mid
F0 Late
F0 Mat
F1 Mat
F1 Late
F0 MidF0 LateF0 MatF1 MatF1 Late
2820
F0 E
arly
F0 M
id
F0 L
ate
F1 L
ate
F1 M
id0.0
0.1
0.2
0.3
0.4F0 EarlyF0 MidF0 LateF1 LateF1 Mid
F0 Mid
F0 Late
F0 Mat
F1 Mat
F1 Late
F0 MidF0 LateF0 MatF1 MatF1 Late
Figure 2.10.- Selected spots after differential expression analysis. The mean %Vol oif the spot in each studied state and its SD are
displayed in each bar diagram, together with the name of the identified protein, when available. The bar diagrams are classified in several
groups depending on the result of the comparisons made through the different states (see Figure 2.9). The symbol “X” in the code means
that any code number is possible at that position. (Comparison A= F0MLMat, B=F1Mat-F1L, C=F0L-F1L, D=F0Mat-F1Mat; F0 = wild; F1=
cultured; M= Mid; L=Late; Mat = Functional maturation)
83
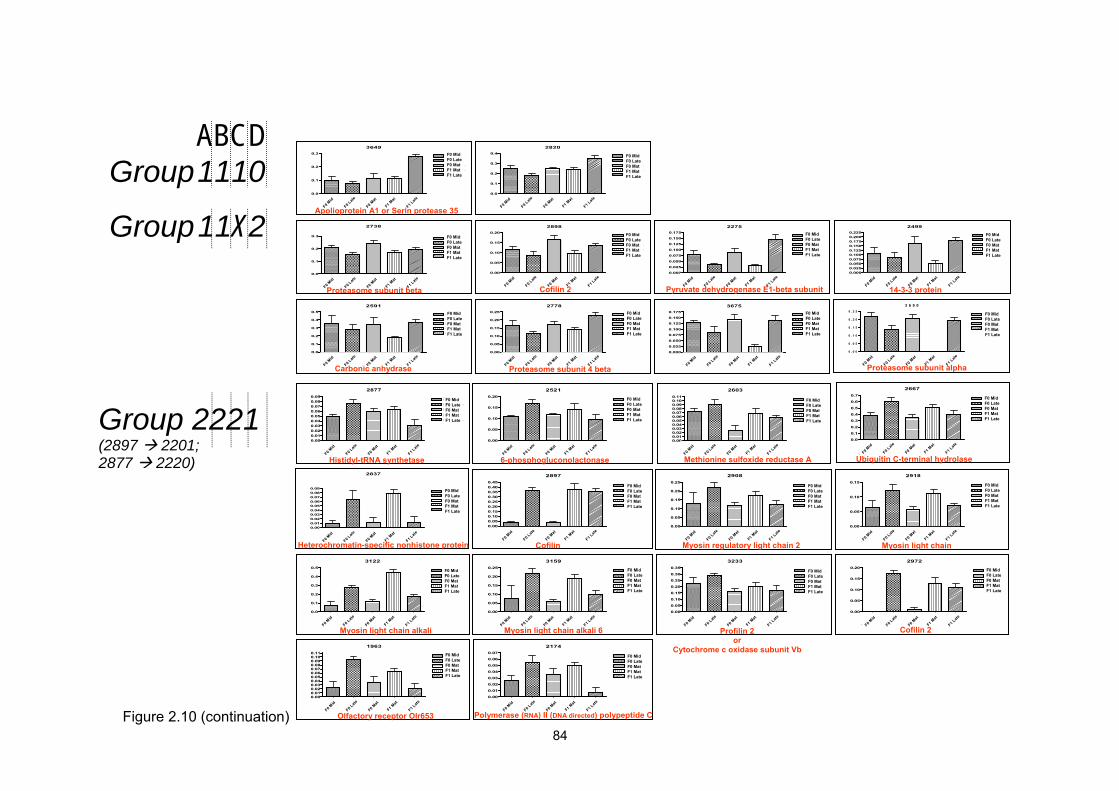
2877
F0 E
arly
F0 M
id
F0 L
ate
F1 L
ate
F1 M
id
0.000.010.020.030.040.050.060.070.080.09
F0 EarlyF0 MidF0 LateF1 LateF1 Mid
2521
F0 E
arly
F0 M
id
F0 L
ate
F1 L
ate
F1 M
id
0.00
0.05
0.10
0.15
0.20F0 EarlyF0 MidF0 LateF1 LateF1 Mid
2837
F0 E
arly
F0 M
id
F0 L
ate
F1 L
ate
F1 M
id
0.000.010.020.030.040.050.060.070.080.09
F0 EarlyF0 MidF0 LateF1 LateF1 Mid
2897
F0 E
arly
F0 M
id
F0 L
ate
F1 L
ate
F1 M
id0.000.050.100.150.200.250.300.350.400.45
F0 EarlyF0 MidF0 LateF1 LateF1 Mid
2908
F0 E
arly
F0 M
id
F0 L
ate
F1 L
ate
F1 M
id
0.00
0.05
0.10
0.15
0.20
0.25F0 EarlyF0 MidF0 LateF1 LateF1 Mid
2918
F0 E
arly
F0 M
id
F0 L
ate
F1 L
ate
F1 M
id
0.00
0.05
0.10
0.15F0 EarlyF0 MidF0 LateF1 LateF1 Mid
3122
F0 E
arly
F0 M
id
F0 L
ate
F1 L
ate
F1 M
id
0.0
0.1
0.2
0.3
0.4
0.5F0 EarlyF0 MidF0 LateF1 LateF1 Mid
3159
F0 E
arly
F0 M
id
F0 L
ate
F1 L
ate
F1 M
id
0.00
0.05
0.10
0.15
0.20
0.25F0 EarlyF0 MidF0 LateF1 LateF1 Mid
3233
F0 E
arly
F0 M
id
F0 L
ate
F1 L
ate
F1 M
id
0.00
0.05
0.10
0.15
0.20
0.25
0.30
0.35F0 EarlyF0 MidF0 LateF1 LateF1 Mid
2972
F0 E
arly
F0 M
id
F0 L
ate
F1 L
ate
F1 M
id
0.00
0.05
0.10
0.15
0.20F0 MidF0 LateF1 LateF1 Mid
1963
F0 E
arly
F0 M
id
F0 L
ate
F1 L
ate
F1 M
id
0.000.010.020.030.040.050.060.070.080.090.100.11
F0 EarlyF0 MidF0 LateF1 LateF1 Mid
2174
F0 E
arly
F0 M
id
F0 L
ate
F1 L
ate
F1 M
id
0.00
0.01
0.02
0.03
0.04
0.05
0.06
0.07F0 EarlyF0 MidF0 LateF1 LateF1 Mid
Myosin light chain
Profilin 2or
Cytochrome c oxidase subunit Vb
Figure 2.10 (continuation)
Group 2221 (2897 2201; 2877 2220)
F0 MidF0 LateF0 FmF1 FmF1 Late
F0 MidF0 LateF0 FmF1 FmF1 Late
2603
F0 E
arly
F0 M
id
F0 L
ate
F1 L
ate
F1 M
id
0.000.010.020.030.040.050.060.070.080.090.100.11
F0 EarlyF0 MidF0 LateF1 LateF1 Mid
2667
F0 E
arly
F0 M
id
F0 L
ate
F1 L
ate
F1 M
id
0.0
0.1
0.2
0.3
0.4
0.5
0.6
0.7F0 EarlyF0 MidF0 LateF1 LateF1 Mid
Myosin regulatory light chain 2
3649
F0 Mid
Late
0 Mat
Mat
Late
F0 F F1 F1
Olfactory receptor Olr653
F0 MidF0 LateF0 MatF1 MatF1 Late
F0 MidF0 LateF0 MatF1 MatF1 Late
F0 MidF0 LateF0 MatF1 MatF1 Late
F0 MidF0 LateF0 MatF1 MatF1 Late
F0 MidF0 LateF0 MatF1 MatF1 Late
F0 Mid
Late
0 Mat
F1 Mat
Late
F0 F F1 F0 F0 F F1 Mid
Late
0 Mat
F1 Mat
Late
F0 F0 F0 F1
F1 Mid
Late Mat Mat Late
F0 MidF0 LateF0 MatF1 MatF1 Late
F0 MidF0 LateF0 MatF1 MatF1 Late
Histidyl-tRNA synthetase
Cofilin
6-phosphogluconolactonase
Heterochromatin-specific nonhistone protein
F0 F0 F
Mid
Late
0 Mat
F1 Mat
F1 Late
F0 MidF0 LateF0 MatF1 MatF1 Late
F0 F0 F1 F1 Mid
Late
F0 Mat
Mat
Late
F0 Mid
Late
F0 Mat
Mat
Late
F0 F1 F1
Ubiquitin C-terminal hydrolase
F0 MidF0 LateF0 MatF1 MatF1 Late
F0 MidF0 LateF0 MatF1 MatF1 Late
F0 Mid
Late
0 Mat
Mat
Late
F0 F0 F F1 F1
Methionine sulfoxide reductase A
Mid
Late
0 Mat
Mat
Late
F0 Mid
F0 Late
0 Mat
F1 Mat
F1 Late
FF0 MidF0 LateF0 MatF1 MatF1 Late
F0 MidF0 LateF0 MatF1 MatF1 Late
F0 Mid
F0 Late
F0 Mat
Mat
F1 Late
F0 Mid
F0 Late Mat Mat
F1 Late
F0 F1
Cofilin 2
F1F0 Mid
Late
0 Mat
Mat
Late
F0 F F1 F1
F0 F0 F0 F1 F1
Polymerase (RNA) II (DNA directed) polypeptide C
Mid
Late Mat
Mat
Late
F0 MidF0 LateF0 MatF1 MatF1 Late
F0 MidF0 LateF0 MatF1 MatF1 Late
Myosin light chain alkali 6
F0 F F1 F1
Myosin light chain alkali
F0 E
arly
F0 M
id
F0 L
ate
F1 L
ate
F1 M
id
0.0
0.1
0.2
0.3F0 EarlyF0 MidF0 LateF1 LateF1 Mid
2820
F0 E
arly
F0 M
id
F0 L
ate
F1 L
ate
F1 M
id
0.0
0.1
0.2
0.3
0.4F0 EarlyF0 MidF0 LateF1 LateF1 Mid
2738
F0 E
arly
F0 M
id
F0 L
ate
F1 L
ate
F1 M
id
0.0
0.1
0.2
0.3F0 EarlyF0 MidF0 LateF1 LateF1 Mid
2898
F0 E
arly
F0 M
id
F0 L
ate
F1 L
ate
F1 M
id
0.00
0.05
0.10
0.15
0.20F0 EarlyF0 MidF0 LateF1 LateF1 Mid
2275
F0 E
arly
F0 M
id
F0 L
ate
F1 L
ate
F1 M
id
0.000
0.025
0.050
0.075
0.100
0.125
0.150
0.175F0 EarlyF0 MidF0 LateF1 LateF1 Mid
2499
F0 E
arly
F0 M
id
F0 L
ate
F1 L
ate
F1 M
id
0.0000.0250.0500.0750.1000.1250.1500.1750.2000.225
F0 EarlyF0 MidF0 LateF1 LateF1 Mid
2591
F0 E
arly
F0 M
id
F0 L
ate
F1 L
ate
F1 M
id
0.0
0.1
0.2
0.3
0.4
0.5F0 EarlyF0 MidF0 LateF1 LateF1 Mid
2778
F0 E
arly
F0 M
id
F0 L
ate
F1 L
ate
F1 M
id
0.00
0.05
0.10
0.15
0.20
0.25F0 EarlyF0 MidF0 LateF1 LateF1 Mid
3675
F0 E
arly
F0 M
id
F0 L
ate
F1 L
ate
F1 M
id
0.000
0.025
0.050
0.075
0.100
0.125
0.150
0.175F0 EarlyF0 MidF0 LateF1 LateF1 Mid
Group 11X2
Group 1110 ABCD
3 6 9 0
F0 Ea rly
F 0 Mid
F 0 Late
F 1 Late
F 1 Mid
0 . 0 0
0 . 0 5
0 . 1 0
0 . 1 5
0 . 2 0
0 . 2 5F 0 E a r lyF 0 M i dF 0 L a teF 1 M i d
F0 MidF0 LateF0 MatF1 MatF1 Late
F0 MidF0 LateF0 MatF1 MatF1 Late
F0 Mid
F0 Late
F0 Mat
F1 Mat
F1 Late
F0 M F0 La
F0 F1
F1
id te
Mat Mat Late
F0 MidF0 LateF0 MatF1 MatF1 Late
F0 MidF0 LateF0 MatF1 MatF1 Late
F0 Mid
Late Mat Mat Late
Proteasome subunit alphaF0 F0 F0 F1
F1
Proteasome subunit 4 beta
Mid
Late Mat Mat Late
F0 F0 F1
F1
Carbonic anhydrase
F0 MidF0 LateF0 MatF1 MatF1 Late
F0 MidF0 LateF0 MatF1 MatF1 Late
F0 MidF0 LateF0 MatF1 MatF1 Late
F0 MidF0 LateF0 MatF1 MatF1 Late
F0 F0 F0 F1
F1 Mid
Late Mat Mat Late
F0 Mid
F0 Late
F0 Mat
F1 Mat
F1 Late
F0 MidF0 LateF0 MatF1 MatF1 Late
F0 MidF0 LateF0 MatF1 MatF1 Late
F0 M F0 La
F0 F1
F1
id te
Mat Mat Late
F0 Mid
F0 Late Mat Mat
F1 Late
Proteasome subunit beta
F0 F1
Cofilin 2
Apolioprotein A1 or Serin protease 35
F0 M F0 La
F0 F1
F1
id te
Mat Mat Late
F0 Mid
F0 Late Mat
Mat
F1 Late
Pyruvate dehydrogenase E1-beta subunit F0 F1
14-3-3 protein
84

85
Group 3XXX Group 4111
Group 5-6XXX
1942
F0 E
arly
F0 M
id
F0 L
ate
F1 L
ate
F1 M
id
0.000.010.020.030.040.050.060.070.080.090.100.110.120.130.14
F0 EarlyF0 MidF0 LateF1 LateF1 Mid
3676
F0 E
arly
F0 M
id
F0 L
ate
F1 L
ate
F1 M
id
0.000.010.020.030.040.050.060.070.080.090.100.110.120.130.14
F0 EarlyF0 MidF0 LateF1 LateF1 Mid
1966
F0 E
arly
F0 M
id
F0 L
ate
F1 L
ate
F1 M
id
0.0
0.1
0.2
0.3
0.4
0.5
0.6
0.7F0 EarlyF0 MidF0 LateF1 LateF1 Mid
2243
F0 E
arly
F0 M
id
F0 L
ate
F1 L
ate
F1 M
id
0.00
0.05
0.10
0.15
0.20
0.25F0 EarlyF0 MidF0 LateF1 LateF1 Mid
2650
F 0Ea
rly
F0 M
id
F0 L
ate
F1 L
ate
F1 M
id
0.00
0.05
0.10
0.15
0.20F0 EarlyF0 MidF0 LateF1 LateF1 Mid
2436
F0 E
arly
F0 M
id
F0 L
ate
F1 L
ate
F1 M
id
0.00
0.05
0.10
0.15
0.20
0.25F0 EarlyF0 MidF0 LateF1 LateF1 Mid
2912
F0 E
arly
F0 M
id
F0 L
ate
F1 L
ate
F1 M
id
0.00
0.05
0.10
0.15F0 EarlyF0 MidF0 LateF1 LateF1 Mid
F0 M
id
Lat
e
0 Fm
1 Fm
Lat
e
F0 F F F1 F F0 F F F1
0 M
id
Lat
e
0 Fm
1 Fm
Lat
e
3022
F0 E
arly
F0 M
id
F0 L
ate
F1 L
ate
F1 M
id
0.0
0.1
0.2
0.3F0 EarlyF0 MidF0 LateF1 LateF1 Mid
2685
F E
arly
0 F0 M
id
F0 L
ate
F1 L
ate
F1 M
id
0.0
0.1
0.2
0.3
0.4
0.5F0 EarlyF0 MidF0 LateF1 LateF1 MidGroup 2XXX
2176
F0 E
arly
F0 M
id
F0 L
ate
F1 L
ate
F1 M
id
0.00
0.05
0.10
0.15
0.20F0 EarlyF0 MidF0 LateF1 LateF1 Mid
2587
F0 E
arly
F0 M
id
F0 L
ate
F1 L
ate
F1 M
id
0.0
0.1
0.2
0.3
0.4F0 EarlyF0 MidF0 LateF1 LateF1 Mid
2909
F0 E
arly
F0 M
id
F0 L
ate
F1 L
ate
F1 M
id
0.0
0.1
0.2
0.3F0 EarlyF0 MidF0 LateF1 LateF1 Mid
3013
F0 E
arly
F0 M
id
F0 L
ate
F1 L
ate
F1 M
id
0.00
0.05
0.10
0.15
0.20
0.25
0.30
0.35F0 MidF0 LateF1 LateF1 Mid
2006
F0 E
arly
F0 M
id
F0 L
ate
F1 L
ate
F1 M
id
0.000.010.020.030.040.050.060.070.080.09
F0 EarlyF0 MidF0 LateF1 LateF1 Mid
Group 12XX ABCD
F0 MidF0 LateF0 MatF1 MatF1 Late
F0 MidF0 LateF0 MatF1 MatF1 Late
F0 F0 F0 F1
F1 Mid
Late Mat Mat Late
F0 F0 F0 F1
F1 Mid
Late Mat Mat Late
F0 MidF0 LateF0 MatF1 MatF1 Late
F0 F0 F0 F1 F1 Mid
Late Mat
Mat
Late
F0 Mid
F0 Late Mat Mat
F1 Late
Acidic ribosomal phosphoprotein P0 Unnamed protein NCBI gi|47218822Purine-nucleoside phosphorylase or
Proteasome subunit alpha F0 MidF0 LateF0 MatF1 MatF1 Late
F0 Mid
F0 Late
F0 Mat
F1 Mat
F1 Late
F0 MidF0 LateF0 MatF1 MatF1 Late
F0 Mid
F0 Late
F0 Mat
F1 Mat
F1 Late
F0 F0 F F1 F1 Mid
Late
0 Mat
Mat
Late
F0 MidF0 LateF0 MatF1 MatF1 Late
F0 MidF0 LateF0 MatF1 MatF1 Late
F0 Mid
F0 Late
F0 Mat
F1 Mat
F1 Late
F0 F0 F0 F1 F1 Mid
Late Mat
Mat
Late
F0 MidF0 LateF0 MatF1 MatF1 Late
Glutathione peroxidase
Phosphoserine aminotransferase 1
F0 MidF0 LateF0 MatF1 MatF1 Late
F0 Mid
Late Mat
Mat
Late
F0 F0 F1 F1 F0 F0 F0 F1 F1 Mid
Late Mat
Mat
LateF0 MidF0 LateF0 MatF1 MatF1 Late
F0 MidF0 LateF0 MatF1 MatF1 Late
F0 F0 F0 F1 F1 Mid
Late Mat
Mat Late
F0 Mid
F0 Late
F0 Mat
F1 Mat
F1 Late
F0 MidF0 LateF0 MatF1 MatF1 Late
Glutathione S-transferase
Serine (or cysteine) proteinase inhibitor
F0 Mid
F0 Late
F0 Mat
F1 Mat
F1 Late
F0 MidF0 LateF0 MatF1 MatF1 Late
F0 MidF0 LateF0 MatF1 MatF1 Late
Uridine phosphorylase 1
F0 F1
Transgelin 2
Figure 2.10 (continuation).

Chapter 2
Normalized volume data of spots present in all gels along the spermatogenesis stages
study was referred to F0Mat state values. Clustering of these expression data was
performed with Cluster 3.0 and visualized with Java TreeView 1.0.7, unveiling six main
subtrees of spots (figure 2.11). Identified proteins included in each subtree are
described in table 2.6. Resulting classification of spots either in the manual or in the
informatic clustering showed similar patterns of spot distribution (see colour legend in
table 2.6). For instance, subtrees 1 and 2 included mainly spots from groups 2221,
2XXX and 3XXX of figure 2.10, while subtrees 5 and 6, present principally spots from
groups 011X, 1110 and 11X2 of the same figure. From both clustering methods, manual
approach (see fig 2.9) was used as a main guide to relate spots by their similar
expression profile (informatic clustering used as confirmatory), when discussing
biological function of spots with similar protein abundance patterns.
Table 2.6. MS/MS analyzed spots from 2-DE gels present in expression data clustering
subtrees. Spots were highlighted to display the classification group in figure 2.10.
Legend = : Groups 2221-2XXX-3XXX; : Groups 0022-101X-12XX-5-6XXX; :
Group 4111; : Groups 011X-1110-11X2; : Group 02X1.
Subtree Spots Protein ID
1
1942, 2972, 3159,
2603, 2918, 2667,
2908, 2650, 2578
Phosphoserine aminotransferase 1, Cofilin 2, Myosin alkali
light chain 6, Methionine sulfoxide reductase A, Myosin light
chain, Ubiquitin C-terminal hydrolase, Myosin regulatory light
chain 2, Glutathione S-transferase, Carbonic anhydrase.
2 1963, 2521, 3233,
3022, 2877, 2006
Olfactory receptor Olr653, 6-phosphogluconolactonase,
Profilin 2 or Cytochrome c oxidase Vb, No ID, Histidyl-tRNA
synthetase, No ID.
3 2685, 3122, 1966,
2759, 2176, 2717, 2696
Glutathione peroxidase, Myosin light chain alkali, Serine (or
cysteine) proteinase inhibitor, Apolipoprotein A-IV4, Acidic
ribosomal phosphoprotein P0, No ID, No ID.
4
3013, 2587, 2686,
2909, 2339, 2436,
2738,2898
Transgelin 2, Purine-nucleoside phosphorylase or
Proteasome subunit alpha, No ID, Unnamed protein product,
Hydroxysteroid (17-beta) dehydrogenase 4, No ID,
Proteasome subunit beta, Cofilin 2
5
2275, 2243, 2723,
2055, 2126, 3649,
2820, 2778, 3089
Pyruvate dehydrogenase E1-beta subunit, Uridine
phosphorylase 1, Peroxiredoxin 3 or Translin, Isocitrate
dehydrogenase 3 (NAD+) alpha, Malate dehydrogenase 1,
Apolioprotein A1 or Serin protease 35, No ID, Proteasome
beta 4 subunit, Nucleoside diphosphate kinase
6 2499, 3675, 2591 14-3-3 protein, No ID, Carbonic anhydrase.
86

Subtree 1
Subtree 2
Subtree 3
Subtree 4
Subtree 6
Subtree 5
Subtree 1
Subtree 2
Subtree 3
Subtree 4
Subtree 6
Subtree 5
Spot annotationSpot expressionZoomareaSpot Tree
Subtree 1
Subtree 2
Subtree 3
Subtree 4
Subtree 6
Subtree 5
Subtree 1
Subtree 2
Subtree 3
Subtree 4
Subtree 6
Subtree 5
Spot annotationSpot annotationSpot expressionSpot expressionZoomareaSpot TreeSpot Tree
Log (State/Ref)
Figure 2.11.- Dendrogram of the spots present in all gels from the spermatogenic stage study. Six subtrees are visible from the “Spot tree“
panel. Relative spot expression to F0 Mat state (red squared) is displayed in the “Spot expression” panel, where Subtrees are divided by
yellow lines. The “Zoom area” and “Spot annotation” panel are focused on the subtree 5. Spot belonging to this subtree are displayed with
ID when available. Colour code: Green= overexpression; red= underexpression; black= no change.
87

Chapter 2
2.2.4 Mass spectrometry and Bioinformatic analysis
The forty-nine excised spots were digested with trypsin and the resulting peptides
analysed using tandem mass spectrometry. Spectra were processed by Peaks 2.4 and
Lutefisk97. Resulting sequences were compared to NCBI database using BLAST, to
determine the protein of origin (Table 2.7). Forty spots were correlated with described
proteins, the other 9 spots could not be matched despite tandem mass spectra from 1-3
peptides could be produced for all of them. From the 40 correlated spots, only 4
produced ambiguous identifications pointing to more than one protein. Thirty-five
assigned proteins were identified by homology of sequenced peptides to fish species
(16 identifications from Danio rerio, 13 from Tetraodon nigroviridis, 3 from
Pseudopleuronectes americanus, and 1 from Oreochromis nilotilus, Takifugu rubripes
and Fundulus heteroclitus, respectively), while the missing identifications were assigned
from other vertebrate species (2 identification from Mus musculus, 2 from Pan
trogolodytes and 1 from Homo sapiens).
Peaks 2.4 provided more confident sequences than Lutefisk97. From 188 sequenced
peptides, 104 were predicted more accurately by Peaks, while the other 84 were closely
coincident between both de novo softwares. Even so, predictions of Lutefisk97 in some
spots were of great utility to validate a candidate proposed after one Peaks sequence
was analysed (spots 2126, 2499, 2685, 2778, 2908), or were fundamental for protein
identification (spot 2909). Coverage of the identified proteins with the sequenced
peptides used to assign the protein is detailed in Annex II.1.
Mr and pI values of each identified spot were calculated using Image Master Platinum
5.0 tools and the obtained result compared with the Mr and pI values given by Expasy
tools. Deviation between both values, calculated as (Experimental value -Theoretical
value) / (Experimental value + Theoretical value) for Mr value and as (Experimental
value -Theoretical value) for pI, were observed for several spots (Annex II.2 - II.4). The
significance of these variations will be discussed individually further down in combination
with the number of peptides used for spot identification.
88

Table 2.7.- De novo peptide sequencing for protein identification in the analysis of spermatogenesis stages. nESI-MS/MS: Peptide
sequences obtained from de novo sequencing of nESI-MS/MS data from trypsin digested spots (table 4) are displayed in two columns
depending on the software used (Peaks 2.4 or Lutefisk 97). For Peaks characters, colours indicate probability (%) of the corresponding
residue to be correct. (Red = 99-80%; Blue= 79-60%; Cyan= 59-40%; Black=<40%). Brackets in Lutefisk 97 column contain the mass in
Da not assigned to any sequence. Rank-Score for Lutefisk97 indicates position of the candidate sequence within any individual de novo
sequencing search and the probability of this sequence to be correct (values from 1 to 0, where 1 is maximum probability). PROTEIN ID:
NCBI access number and name of the protein that was identified with each sequence using BLAST search for short nearly exact
sequences (Sequence position inside the protein for each peptide in Annex II.1).
nESI-MS/MS PROTEIN ID Peaks 2.4 Lutefisk 97 Spot ID
Sequence Score % Sequence Rank-Score Acc Number Name
1942 NLGCAGVTVVLVR 47 [227,1]GCGAGVLSVLVR 1 0,970 gi|41053792 Phosphoserine aminotransferase 1 1963 LLNFLLLLSR 36 [226,1]NFPELLSR 1 0,613 gi|47577631 Olfactory receptor Olr653
MGMVDAFDVAR 99 MGMVDAFDVAR 1 0,970 gi|47225177 Serine (or cysteine) proteinase inhibitor FDGLLGMAYPR 95 FDGLLGMAYPR 1 0,970 gi|27503926 ---- SYQFVEDFLGK 71 YSKFVEDFLGK 1 0,970 ---- ---- GQTNFCLDLFK 35 [185,0]TNFCLDLFK 1 0,970 gi|13385352 Serine (or cysteine) proteinase inhibitor
NNLVQGVLDNMTR 61 [227,1]NVKGVLDNMTR 1 0,970 ---- ---- SSANSHPYRYVNK 3 [260,0]VY[319,2]PHSNAR 3 0,267 gi|68430931 ---- RACVPGLLLLAQHR 24 EPWRALNLHVVLR 2 0,394 ---- ---- LNLNTWVESQTGKK 21 [226,2]LNTWVESKTK[185,1] 1 0,595 gi|27503926 Serine (or cysteine) proteinase inhibitor
TTFSGMSPANDLVEANVVHK 67 TTFSGMS[168,1]NNNVLSNVVHK 1 0,631 gi|47225177 Serine (or cysteine) proteinase inhibitor LTCAPSGDTGTSLLTVLNWR 99 [213,1]MTPSGTDGTSLVDVLYHR 1 0,922 gi|45382395 ----
1966
VKCADEFPNMNDELMEWKK 40 ---- ---- ---- ---- LVLTLVGELPPKDR 79 [324,3]TLVGEPLVKD[154,1] 1 0,444 ---- ---- 2006
CDMEDGPNVSGWNWK 93 [258,0]WTEVMLSGVSGNTR 1 0,565 ---- ----
89

Table 2.7 (continuation).- De novo peptide sequencing for protein identification in the analysis of spermatogenesis stages. nESI-MS/MS PROTEIN ID
Peaks 2.4 Lutefisk 97 Spot ID Sequence Score % Sequence Rank-Score
Acc Number Name
LANYAFEYAR 72 ALNYAFEYAR 1 0,404 gi|47225844 Isocitrate dehydrogenase 3 (NAD+) α NLETACFDTLR 88 ARETACFDTLR 1 0,970 gi|47225845 Isocitrate dehydrogenase 3 (NAD+) α
TPYTDVNLVTLR 99 [197,4]YTDVNLVT[269,0] 1 0,705 gi|47225845 Isocitrate dehydrogenase 3 (NAD+) α DWRTLLYYLGAHKMMMTK 22 ---- ---- ---- ----
2055
WMRTHGYGGGSGGFGSASSNMWEER 37 ---- ---- ---- ---- DPVVGNPANTNCLLNR 1 YFVGDPALTNCLLAAK 2 0,702 gi|37362242 Malate dehydrogenase 1
NNLPTFDGWRR 39 [228,0]LPTATVGS[274,0]K 1 0,604 ---- ---- QCNSGYTGSMPR 15 [228,0]WALLVGSMPR 4 0,970 gi|37362242 Malate dehydrogenase 1
2126
DPDGLSLNDFSR 5 LVDGLSLFGDATK 3 0,495 gi|37362242 Malate dehydrogenase 1
2174 HPAPTAGVSFEYDDPYYK 96 ---- ---- gi|47221930Polymerase (RNA) II (DNA directed)
polypeptide C TSFFQALVATTK 32 [188,0]FFKALGLCVA 1 0,604 gi|63650325 Acidic ribosomal phosphoprotein P0 2176
VVNAPCDVTVCHLTGLLAAR 99 WKLSNLLKARTVPDCAHR 1 0,281 gi|63650325 Acidic ribosomal phosphoprotein P0 FVCTGGSAWR 53 [246,0]CTGTNWR 1 0,769 ---- ---- ESLDGMFQPR 40 SELDGMFKPR 2 0,288 ---- ---- VQVCVTLLDR 51 [226,1]VCVTLLDR 1 0,628 gi|20071298 Uridine phosphorylase 2
TTYPNLCAGTDR 99 [201,0]YPGGNCAGTNR 1 0,515 gi|6678515 Uridine phosphorylase 2 RGDLDQGLAEELLK 40 LVDLDKGNAEKLLK 1 0,730 gi|47225480 Uridine phosphorylase 2
2243
FLFGWGPRGSGWGNTR 99 LYLGWGSLLTGGEGDTR 1 0,628 ---- VVSPWNAEDVK 56 KRPWNAEDAR 2 0,505 gi|47210341 Pyruvate dehydrogenase E1-beta LLEDNSVPLQK 28 [225,2]EDNSVPKLK 4 0,450 gi|47210341 Pyruvate dehydrogenase E1-beta
QAGVDHPLSLPR 21 PTGVVE[234,1]DVA[168,1] 1 0,215 ---- ----
EGLECEVLNLR 1 NAT[142,0]CEVLNLR 1 0,642 gi|47210341 Pyruvate dehydrogenase E1-beta
LMEGPAFNYLDAPVTR 2 LMKGPAFNYLDAVEPK 1 0,812 gi|47210341 Pyruvate dehydrogenase E1-beta
MMLLGEEVAQYDQYK 44 [210,2]VKNYKAVEEGLNDK 2 0,768 gi|47210341 Pyruvate dehydrogenase E1-beta
YTYMASGLQTVPLVFR 99 [264,1]GVH[158,0]DKRV[210,2]VFR 1 0,601 gi|47210341 Pyruvate dehydrogenase E1-beta DSTDNPNDNSGLERDER 99 ---- ---- ---- ----
2275
YEMSQSEMGFTGLAVGSAWWR 37 [214,1]FANASGVALGTFGMKSNP[253,2]R 1 0,691 gi|47210341 Pyruvate dehydrogenase E1-beta
90
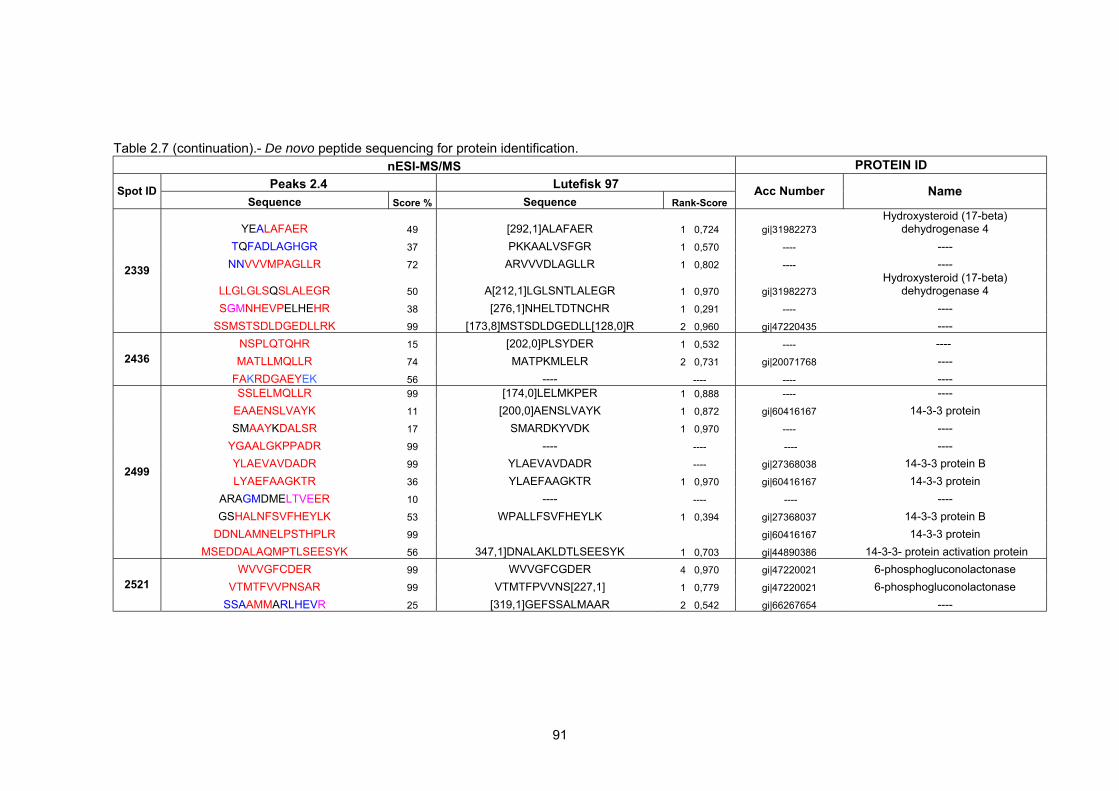
Table 2.7 (continuation).- De novo peptide sequencing for protein identification.
nESI-MS/MS PROTEIN ID Peaks 2.4 Lutefisk 97 Spot ID
Sequence Score % Sequence Rank-Score Acc Number Name
YEALAFAER 49 [292,1]ALAFAER 1 0,724 gi|31982273 Hydroxysteroid (17-beta)
dehydrogenase 4 TQFADLAGHGR 37 PKKAALVSFGR 1 0,570 ---- ----
NNVVVMPAGLLR 72 ARVVVDLAGLLR 1 0,802 ---- ----
LLGLGLSQSLALEGR 50 A[212,1]LGLSNTLALEGR 1 0,970 gi|31982273 Hydroxysteroid (17-beta)
dehydrogenase 4 SGMNHEVPELHEHR 38 [276,1]NHELTDTNCHR 1 0,291 ---- ----
2339
SSMSTSDLDGEDLLRK 99 [173,8]MSTSDLDGEDLL[128,0]R 2 0,960 gi|47220435 ---- NSPLQTQHR 15 [202,0]PLSYDER 1 0,532 ---- ---- MATLLMQLLR 74 MATPKMLELR 2 0,731 gi|20071768 ---- 2436
FAKRDGAEYEK 56 ---- ---- ---- ---- SSLELMQLLR 99 [174,0]LELMKPER 1 0,888 ---- ----
EAAENSLVAYK 11 [200,0]AENSLVAYK 1 0,872 gi|60416167 14-3-3 protein SMAAYKDALSR 17 SMARDKYVDK 1 0,970 ---- ----
YGAALGKPPADR 99 ---- ---- ---- ---- YLAEVAVDADR 99 YLAEVAVDADR ---- gi|27368038 14-3-3 protein B LYAEFAAGKTR 36 YLAEFAAGKTR 1 0,970 gi|60416167 14-3-3 protein
ARAGMDMELTVEER 10 ---- ---- ---- ---- GSHALNFSVFHEYLK 53 WPALLFSVFHEYLK 1 0,394 gi|27368037 14-3-3 protein B
DDNLAMNELPSTHPLR 99 gi|60416167 14-3-3 protein
2499
MSEDDALAQMPTLSEESYK 56 347,1]DNALAKLDTLSEESYK 1 0,703 gi|44890386 14-3-3- protein activation protein WVVGFCDER 99 WVVGFCGDER 4 0,970 gi|47220021 6-phosphogluconolactonase
VTMTFVVPNSAR 99 VTMTFPVVNS[227,1] 1 0,779 gi|47220021 6-phosphogluconolactonase 2521
SSAAMMARLHEVR 25 [319,1]GEFSSALMAAR 2 0,542 gi|66267654 ----
91

Table 2.7 (continuation).- De novo peptide sequencing for protein identification. nESI-MS/MS PROTEIN ID
Peaks 2.4 Lutefisk 97 Spot ID Sequence Score % Sequence Rank-Score
Acc Number Name
ADVANFPLADGPR 89 SVVANFPLADGPR 3 0,924 gi|56554783 Carbonic anhydrase CHANFPLADGPR 62 ---- ---- gi|56554783 Carbonic anhydrase EWGLDRSACHK 24 ---- ---- ---- ----
TSPRLSLSDLNKR 6 ---- ---- ---- ----
QGCHANGNADADGPR 10 [184,1]LALANFPLAD[154,1]R 1 0,341 ---- ----
GPGCHANFPLWPGR 13 ---- ---- ---- ----
SLLFSADGEAECCMVSGYWWMNRK 1 [200,0]LFSADWYGSGRMVVHAKNEAFRR 1 0,820 gi|56554783 Carbonic anhydrase RWFSRVCQCCHNDDYYMSQWK 99 [199,1]NFSADWAENRVCSADSPSGWCRR 1 0,327 ---- ----
2578
WWWDRMFAYQQNWFDEVHTPMLEDFDGPLSYWK 42 ---- ---- ---- ----
QLAEEKGCGGFLR 26 [Q/L]AEEKGCGGFLR 2 0,970 ---- ----
FPCMSDAYDR 99 FPCMSDAYDR 1 0,970 gi|45387733Purine-nucleoside
phosphorylase
WVYCMLAGPTYETLAECR 98 WVYCMLAGPTYETLAECR 3 0,904 gi|45387733Purine-nucleoside
phosphorylase
LMVVLGRNVGMSTVHWDRR 93 DALYLGHLVGMAVVS[256,2]VVVK 1 0,249 gi|45387733Purine-nucleoside
phosphorylase YGYELHVGYVCK 30 YGYELVPDMLCK 1 0,636 gi|55640605 Proteasome subunit alpha
LYKVEYAFK 62 LYKVEYAFK 1 0,970 gi|55640605 Proteasome subunit alpha TGPLEVLTLPLVGTYR 90 ----- ---- ---- ----
2587
YSENQTEPVLEYYR 26 SYENKTE[P/V]LEYYR 2 0,717 gi|47085881 ---- LLDAFDSLK 93 LLDAFD[200,0]K 1 0,970 ---- ----
EPVSVSPASAMVK 45 226,1]VSVSARTTVR 3 0,334 ---- ---- ADVANFPLADGPR 2 SVVANFPLAD[154,1]R 1 0,970 gi|56554783 Carbonic anhydrase
LPCHANNQDADGPR 20 ----- ---- ---- ---- FAPPHADRTMECCMNHANGCLWKK 98 [201,0]NFSSPWAHTKSEASSNYTNASFPAK 1 0,415 ---- ----
2591
FFNDLVPGEASDQPQVLDMMK 47 [408,6]DLVPGEASDYAGLKMA[336,2] 1 0,560 ---- ---- MDCTQVGFCGGFTPNNSCR 45 RV[251,1]KVGFCGGFTPNTPYR 2 0,496 gi|55251370 Methionine sulfoxide reductase A 2603
RRWGYGKVWKKALSLAAGNSKTVRMKGLVEWR 99 ---- ---- ---- ----
92

Table 2.7 (continuation).- De novo peptide sequencing for protein identification.
nESI-MS/MS PROTEIN ID Peaks 2.4 Lutefisk 97 Spot ID
Sequence Score % Sequence Rank-Score Acc Number Name
TLGNLDLVVAR 75 LTEVLDNLV[154,1] 1 0,672 ---- ---- EFEGLTFYEK 10 KFEGLTFYEK 1 0,358 gi|1165134 Glutathione S-transferase
LLLDNPAEQALMYKR 46 PEMPNPDKRLMYKR 1 0,970 gi|1165134 Glutathione S-transferase 2650
DGFLWVTSFVDPAVVFR 51 [251,2][253,2]DVTVFS[210,2]A[200,0]FR 1 0,324 gi|1165134 Glutathione S-transferase FLDETANMSADDR 99 FLDETANMSWDR 2 0,970 gi|24413939 Ubiquitin C-terminal hydrolase
FNLNTAMELNPEMAKR 99 FLLDTAMELNAATLLSR 4 0,970 gi|34393056 Ubiquitin C-terminal hydrolase 2667
FSAVAAAMR 99 FSAVALCR 3 0,970 3 0,970 gi|21361091 Ubiquitin C-terminal esterase GPLLLGDVFPNPFVDGYRR 99 [267,2]LLGDVFPNFEADTTLGR 1 0,970 ---- Glutathione peroxidase
LSLLYPATTGR 85 [199,1]LLYPATWK 2 0,229 gi|47227982 Glutathione peroxidase 2685
FDTPVCMAELACNR 79 [261,3]TPVCTTELAC[270,0] 1 0,454 ---- Glutathione peroxidase TLDSLKLTAQK 29 ---- ---- ---- ----
TYDLGDVFPGGPFVTAYRR 99 [144,0]D[184,1]CDCEDGGPFVDGNM[230,0] 4 0,550 ---- ---- 2686
VDMDCGSQADTLFWCNFNRK 80 [214,1]MDCNSKESALFMKSNFSV[212,1] 1 0,50 ---- ---- CAAEPSLLNVSNHMK 28 ----- ---- ---- ----
VLQLVLFFK 55 VLKLVLFFK 2 0,959 ---- ---- 2696
FLLNLKGFETDTEFGQLRRR 37 DPCDPTGKKYDTEFGKLV[241,2]K 1 0,970 ---- ---- AASFAVTFARCR 23 [229,0]FANFTVCLR 1 0,970 ---- ----
FMNFDLSAGSFVGFRR 94 NYVYDLSGASFVGM[172,0]R 3 0,943 ---- ---- 2717
WGAGTLPLGSTNK 65 FLTSGLPLTKPK 1 0,970 ---- ---- SSVVRPDLLGNK 99 [260,0]GLLDPRVVR 4 0,970 ---- ----
FAQFYECVTVCPASWTPK 76 TDKWSAPCVTVCPSKKTPK 1 0,970 gi|62204368 Peroxiredoxin 3 DYGVLLEGGPLALR 50 [278,1]GVLLEGGPLALR 1 0,970 gi|62204368 Peroxiredoxin 3 LSNFLNELDSGFR 53 [199,1]NFLDKLFGDSR 1 0,396 gi|66910263 Translin
MEHWTAGDRLVKFR 18 ------- ---- ---- ---- ELLTVLQSVHQPSGFK 20 KLLTVLKSVHKN[274,0]K 1 0,655 gi|66910263 Translin
MLRLSSLEHGEMSARLR 81 MLRNSSLVGARLRW[199,1]K 1 0,303 ---- ----
2723
FAQFVETHGEVCPASWTPK 52 [346,1]FVETHGEVC[168,1]SWTPK 1 0,868 gi|62204368 Peroxiredoxin 3
93
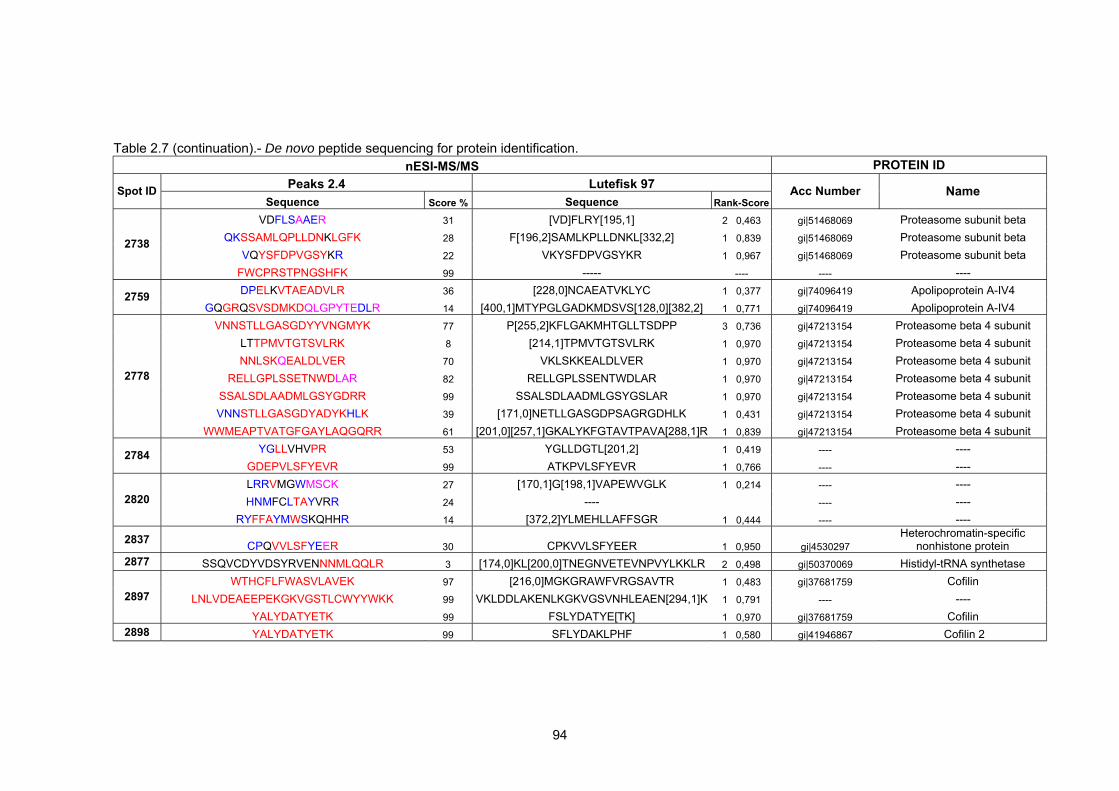
Table 2.7 (continuation).- De novo peptide sequencing for protein identification.
nESI-MS/MS PROTEIN ID Peaks 2.4 Lutefisk 97 Spot ID
Sequence Score % Sequence Rank-ScoreAcc Number Name
VDFLSAAER 31 [VD]FLRY[195,1] 2 0,463 gi|51468069 Proteasome subunit beta QKSSAMLQPLLDNKLGFK 28 F[196,2]SAMLKPLLDNKL[332,2] 1 0,839 gi|51468069 Proteasome subunit beta
VQYSFDPVGSYKR 22 VKYSFDPVGSYKR 1 0,967 gi|51468069 Proteasome subunit beta 2738
FWCPRSTPNGSHFK 99 ----- ---- ---- ---- DPELKVTAEADVLR 36 [228,0]NCAEATVKLYC 1 0,377 gi|74096419 Apolipoprotein A-IV4 2759
GQGRQSVSDMKDQLGPYTEDLR 14 [400,1]MTYPGLGADKMDSVS[128,0][382,2] 1 0,771 gi|74096419 Apolipoprotein A-IV4 VNNSTLLGASGDYYVNGMYK 77 P[255,2]KFLGAKMHTGLLTSDPP 3 0,736 gi|47213154 Proteasome beta 4 subunit
LTTPMVTGTSVLRK 8 [214,1]TPMVTGTSVLRK 1 0,970 gi|47213154 Proteasome beta 4 subunit NNLSKQEALDLVER 70 VKLSKKEALDLVER 1 0,970 gi|47213154 Proteasome beta 4 subunit
RELLGPLSSETNWDLAR 82 RELLGPLSSENTWDLAR 1 0,970 gi|47213154 Proteasome beta 4 subunit SSALSDLAADMLGSYGDRR 99 SSALSDLAADMLGSYGSLAR 1 0,970 gi|47213154 Proteasome beta 4 subunit VNNSTLLGASGDYADYKHLK 39 [171,0]NETLLGASGDPSAGRGDHLK 1 0,431 gi|47213154 Proteasome beta 4 subunit
2778
WWMEAPTVATGFGAYLAQGQRR 61 [201,0][257,1]GKALYKFGTAVTPAVA[288,1]R 1 0,839 gi|47213154 Proteasome beta 4 subunit YGLLVHVPR 53 YGLLDGTL[201,2] 1 0,419 ---- ---- 2784
GDEPVLSFYEVR 99 ATKPVLSFYEVR 1 0,766 ---- ---- LRRVMGWMSCK 27 [170,1]G[198,1]VAPEWVGLK 1 0,214 ---- ---- HNMFCLTAYVRR 24 ---- ---- ---- 2820
RYFFAYMWSKQHHR 14 [372,2]YLMEHLLAFFSGR 1 0,444 ---- ----
2837 CPQVVLSFYEER 30 CPKVVLSFYEER 1 0,950 gi|4530297 Heterochromatin-specific
nonhistone protein 2877 SSQVCDYVDSYRVENNNMLQQLR 3 [174,0]KL[200,0]TNEGNVETEVNPVYLKKLR 2 0,498 gi|50370069 Histidyl-tRNA synthetase
WTHCFLFWASVLAVEK 97 [216,0]MGKGRAWFVRGSAVTR 1 0,483 gi|37681759 Cofilin LNLVDEAEEPEKGKVGSTLCWYYWKK 99 VKLDDLAKENLKGKVGSVNHLEAEN[294,1]K 1 0,791 ---- ---- 2897
YALYDATYETK 99 FSLYDATYE[TK] 1 0,970 gi|37681759 Cofilin 2898 YALYDATYETK 99 SFLYDAKLPHF 1 0,580 gi|41946867 Cofilin 2
94

Table 2.7 (continuation).- De novo peptide sequencing for protein identification. nESI-MS/MS PROTEIN ID
Peaks 2.4 Lutefisk 97 Spot ID Sequence Score % Sequence Rank-Score
Acc Number Name
LELTTMGDR 8 [242,1]LTTMGDR 1 0,568 gi|47217449 Myosin regulatory light chain 2 NGFNYAEFTR 1 NGFNYAEFTR 1 0,970 gi|47217449 Myosin regulatory light chain 2
LNGTDLNNVLR 99 LNGTDPEDVLR 1 0,970 gi|47217449 Myosin regulatory light chain 2 EAFNMLDQNR 50 SLFNMLDKNR 1 0,970 gi|47217449 Myosin regulatory light chain 2
NGNVVCQDVLR 67 ---- ---- ---- ---- FTDEEVDELFR 99 FTDEEVDELFR 1 0,970 gi|47217449 Myosin regulatory light chain 2
2908
ATSNVFAMFDQSKLKEFK 31 [188,0][185,0]VFAMFDKSKLKEFK 1 0,970 gi|47217449 Myosin regulatory light chain 2 2909 MWVRLNAGLHLER 11 [316,1]VGVLTYDLLER 1 0,922 gi|47218822 Unnamed protein product
SNFNYVEFTR 7 [201,0]FNYVEFTR 2 0,970 gi|33991794 Myosin light chain FTDEEVDELFR 99 248,1]PFEVDELFR 1 0,942 gi|33991794 Myosin light chain
SGNLVFAMFDKSQLQEFK 1 YEEKLKSEDFMA[196,2]EFK 4 0,394 gi|33991794 Myosin light chain 2918
NAFACFDEEGTGSLKEDYLR 12 [185,0]FACFDEEGTGSLKED[276,1]R 1 0,970 ---- ---- LAVGVVEKSR 76 SPVGVVKKSR 1 0,589 ---- ----
SLASGSGLVYQTR 47 [199,1]ASGSGLVYKTR 1 0,697 ---- ---- 2912
YKPGWGSLQSGWGNTR 32 [274,0]DGWGSLLTGWGDKK 1 0,676 ---- ---- YGLYDATYETK 38 YGLYDATYETK 1 0,970 gi|41946867 Cofilina2 2972
NNNVLLSLELGPK 5 T[202,0]HLLSLEGK[210,2] 3 0,577 gi|41946867 Cofilina2 LLKMGTVALTK 13 [225,2]EMGSL[217,0][196,2] 3 0,450 gi|37681953| Transgelin 2 3013
MQEQLSQFLSAAEK 6 [259,1]EKLSKFLSAAEK 1 0,970 gi|37681953| Transgelin 2 FPTLSGSMDLADK 41 [244,0]TLSGSFVLEGK 1 0,423 ---- ---- 3022
DVQCGTVYFEKGTVTQAVPK 29 KWVKFAYFEKGTVTKA[196,2]K 2 0,307 ---- ---- GDFCLDVGK 61 [171,1]FCLDV[185,0] 1 0,673 gi|47211278 Nucleoside diphosphate kinase MLHASEDLLK 49 MLHASEDKLL 1 0,970 gi|47211278 Nucleoside diphosphate kinase
TFLALQPDRKR 26 [248,1]LPDPKLAWR 2 0,553 ---- ---- YFLLPKMNERK 7 [285,1]RCCG[196,2]LEY 1 0,480 ---- ----
MLGETNPANSEPSALR 9 [243,1]WLKSDAPNTEGPK 1 0,478 gi|47211278 Nucleoside diphosphate kinase
3089
DFHNSSLNLRLSSWPGR 48 MNT[168,1]SSLRLMMRDHAR 1 0,655 ---- ----
95

Table 2.7 (continuation).- De novo peptide sequencing for protein identification.
nESI-MS/MS PROTEIN ID Peaks 2.4 Lutefisk 97 Spot ID
Sequence Score % Sequence Rank-ScoreAcc Number Name
LSFGKCGDVMR 99 LSFGKCGDVMR 1 0,970 gi|55250139 Myosin light chain alkali 3122 MTEEEVETLLAHGWDQGCLNYRWQR 99 [307,2][225,2]SVKTLLEHEDANGGTDLWDFEGR 4 0,492 gi|37362252 Myosin light chain alkali
LSFGQCGDVMR 82 ---- ---- gi|51261923 Myosin alkali light chain 6 FFELLTGRLEFK 98 ---- ---- ---- ----
TVFLLFDK 49 [200,0]FLLFDK 1 0,391 gi|37362252 Myosin light chain alkali DTFYCCCPAAGKPGVANVCAYDKWMR 5 ---- ---- ---- ----
3159
WGGSMEDFVEGLR 16 [243,1]GSMEDFVE[170,1]R 2 0,561 gi|37362252 Myosin light chain alkali AYEMADYLR 99 AYEMWYLR 1 0,970 gi|45501160 Profilin 2
ESFFTNGLTLGSK 96 [216,0]FFTNGLTLGSK 2 0,720 gi|45501160 Profilin 2 3233
AAGGMPTDEEQATGLER 58 ---- ---- gi|47228591 Cytochrome C oxidase subunit
Vb DVEPMVEGETAK 24 [214,1]EPMMSW[154,1]R 1 0,281 ---- ----
LDDMVNGALESLR 1 [228,0]DMVNGALESLR 1 0,970 ---- ---- GGQAASLDDVENPLGYK 25 [242,0]AASLDDVENPLGYK 1 0,970 gi|47215998 Serin protease 35 TAYTQAQSVNAEKLKSLR 60 374,2]KLKEANVSKAKMMR 1 0,898 gi|52430350 Apolioprotein A1
QVSPVTDSVVTTLAEATRGKK 25 [510,0]TDSVVTTLAEATAE[269,1] 2 0,888 gi|57157761 Apolipoprotein A-I
3649
SMSEKYDDNADWPWMWYK 32 ---- ---- ---- ---- 3675 MNRTMNGKKPEK 65 ---- ---- ---- ----
SRAGTLPLGSTNK 48 [260,0][245,0]LPHSTNK 1 0,791 ---- ---- 3676 AASFANFTVCLR 4 [228,0]FANFTGLMAR 5 0,547 gi|68365664 Profilin family, member 4 LFQVEYALERR 40 [260,0]KALAYEVKLK 1 0,663 gi|37681911 Proteasome subunit, alpha 3690
SGRVNLELATVVRR 92 [300,1]VNLELATVVRR 3 0,780 ---- Proteasome subunit, alpha
96

97
Chapter 2
2.2.5 Comparison of sequenced peptides and identified proteins with S. senegalensis
ESTs
As described in materials and methods (see pages 67-68), de novo peptide sequences,
genomic ESTs and proteins in NCBI were compared searching for similarities. A protein
subdatabase was created with the protein matches derived from the screening of
databases with the EST sequences. In parallel, ESTs and peptide sequences were also
compared. The sets of ESTs presenting good relationship with one or more peptides
from the same spot was sent for a common search in the protein subdatabase in order
to cross-validate tentative assignations. On the other hand, the sets of de novo peptide
sequences originating from the same gel spot that could not be assigned initially to the
tentatively identified protein were submitted to a refined search comparing these
sequences with those in the corresponding EST set.
Twenty-one out of forty-nine spots present at least one peptide which could be related to
an EST that matched with the same protein as the original peptide. From them, eleven
spots presented between 2 and 6 peptides that confirm in the same way the protein
assignation, while two spots (2918 and 3649) produced new peptide assignations that
could not be matched in the comparison between MS/MS peptide and protein database
In the case of three spots with more than three assigned peptides (2908, 3089 and
3159), all the sequences previously assigned matched with an EST corresponding to the
same gene/protein made in the peptides against protein database. Contrarily, for eight
spots with more than three assigned peptides (2055, 2243, 2578, 2667, 2685, 2723,
2738, 3233), none of these peptides found a match with an EST related to the same
gene/protein (Table 2.8; see discussion in page 108).

Chapter 2
Table 2.8.- Coincidences between MS/MS peptide sequences from S. senegalensis
and ESTs from S. senegalensis. For each spot, 3 different comparisons were made
between peptide sequences, ESTs and sequences in the NCBI protein database:
peptides against ESTs; ESTs against NCBI protein database; and peptides against
NCBI protein database. Proteins resulting from each process were compared and
matches between peptide and EST annotated. Prot ID: Protein identified from the
MS/MS-derived peptides sequences. Pep seq: Number of MS/MS peptide sequenced
for a certain spot. Seq related to Prot ID: Sequences of a spot used to identify the
protein. EST related to Prot ID: ESTs matching with the protein identified with MS/MS
peptides.
Spot ID Prot ID Pep Seq Seq
related to Prot ID
EST related to Prot ID
3649 Apolipoprotein A1 4 2 4 2918 Myosin light chain 4 3 4 2176 Acidic ribosomal phosphoprotein P0 2 2 2 2759 Apolipoprotein A-IV4 3 3 3 2837 Heterochromatin-specific nonhistone protein 1 1 1 2898 Cofilin 2 1 1 1 2908 Myosin regulatory light chain 2 7 6 6 3089 Nucleoside diphosphate kinase 6 3 3 3122 Myosin light chain alkali 2 2 2 3159 Myosin alkali light chain 6 5 3 3 2778 Proteasome beta 4 subunit 7 7 6 1966 Serine (or cysteine) proteinase inhibitor 11 7 4 2499 14-3-3 protein (Tyrosine 3-monooxygenase) 10 6 3 2521 6-phosphogluconolactonase 3 2 1 2897 Cofilin 3 2 1 2972 Cofilin2 2 2 1 3013 Transgelin 2 2 2 1 2126 Malate dehydrogenase 1 4 3 1 2650 Glutathione S-transferase 4 3 1 2587 Purine-nucleoside phosphorylase 8 3 1 2275 Pyruvate dehydrogenase E1-beta subunit 9 7 1 1942 Phosphoserine aminotransferase 1 1 1 0 1963 Olfactory receptor Olr653 1 1 0 2006 No ID 2 0 0 2055 Isocitrate dehydrogenase 3 (NAD+) alpha 5 3 0
2174 Polymerase (RNA) II (DNA directed)
polypeptide C 1 1 0 2239 Hydroxysteroid (17-beta) dehydrogenase 4 6 2 0 2243 Uridine phosphorylase 1 6 3 0 2436 No ID 3 1 0
98
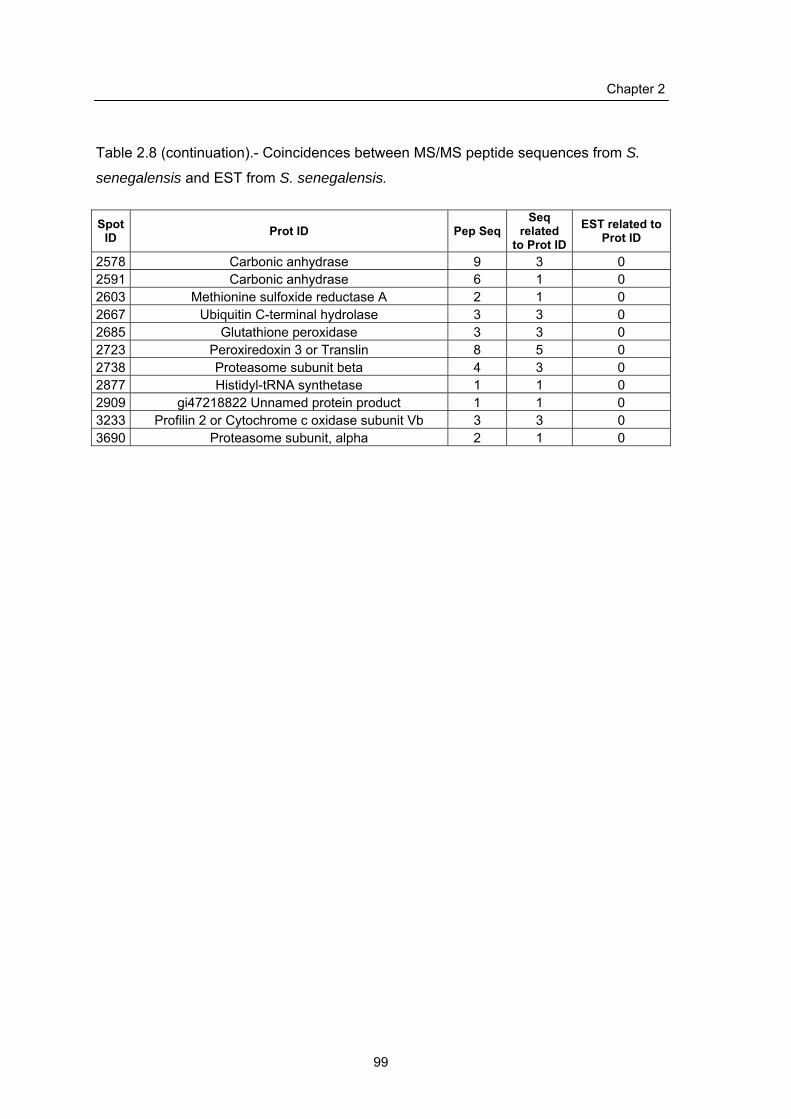
Chapter 2
Table 2.8 (continuation).- Coincidences between MS/MS peptide sequences from S.
senegalensis and EST from S. senegalensis.
Spot ID Prot ID Pep Seq
Seq related
to Prot ID EST related to
Prot ID
2578 Carbonic anhydrase 9 3 0 2591 Carbonic anhydrase 6 1 0 2603 Methionine sulfoxide reductase A 2 1 0 2667 Ubiquitin C-terminal hydrolase 3 3 0 2685 Glutathione peroxidase 3 3 0 2723 Peroxiredoxin 3 or Translin 8 5 0 2738 Proteasome subunit beta 4 3 0 2877 Histidyl-tRNA synthetase 1 1 0 2909 gi47218822 Unnamed protein product 1 1 0 3233 Profilin 2 or Cytochrome c oxidase subunit Vb 3 3 0 3690 Proteasome subunit, alpha 2 1 0
99

Chapter 2
2.3 Discussion
The testes from animals involved in this study were classified depending on the relative
abundance of germ cells types as described before (García 05). Wild animals captured
in spring 2004 presented three of the five possible stages of spermatogenesis described
by García-López et al. (mid, late, and functional maturation stages). The three stages of
spermatogenesis were characterized by different amounts of spermatozoa in the
medullar efferent ducts, with its maximum in the functional maturation stage. The
distribution of testicular developmental stage in the studied animals (3 animals in mid, 3
animals in late, 3 animals in functional maturation) correlates with the distribution of
animals described by García-López and co-workers. They found that from 35 individuals
caught from November 2003 to July 2004, those captured between February and May, 6
were at mid spermatogenesis stage, 3 were at late spermatogenesis stage and 7 at
functional maturation stage. Only one animal was found in the recovery stage, and no
fish was found to be in the early spermatogenesis stage.
Table 2.9.- Number of S. senegalensis males sampled at each stage of testicular
development by month of collection (adapted from García 05). The months where the
individuals for the current study were caught are shadowed.
Testicular developmental stages
Early Mid Late
Functional
maturation Recovery Total
November 03 3 2 -- -- -- 5
January 04 -- 3 2 -- -- 5
February 04 -- 4 1 -- -- 5
March 04 -- 2 2 -- -- 4
April 04 -- -- -- 3 1 4
May 04 -- -- -- 4 -- 4
June 04 -- -- -- -- 5 5
July 04 2 -- -- -- 1 3
5 11 5 7 7 35
100

Chapter 2
Captive males produce sperm all along the year, with a maximum of production
occurring between February and April, and a minor peak (around 50% of maximum
activity) in summer (Anguis 05). F1 animals at IRTA facilities were sacrificed in April,
month that corresponds to the period with the highest sperm production along the year,
and classified in the late and functional maturation stages (García 05). The observed
spermatogenesis stages in these animals are then consistent with the observations
made before by Anguis et al. (Table 2.9; Anguis 05).
The 2-D gel analysis was performed on 18x24 cm polyacrylamide supports, with a
number of spots per gel between 769 and 1148. From the analyses of spots on 2-D gels
(see also chapter 3) and from the shotgun approach (see chapter 1), about 2000 peptide
tags were sequenced de novo. Combined annotation from peptide tags and genomic
ESTs obtained inside the Pleurogene project constitutes the first insight on the
Senegalese sole genome.
As mentioned before, the genome of S. senegalensis is not described, and thus the
number of genes is unknown. Description of fish model organisms (i.e. Danio rerio,
Takifugu rubripes or Tetraodon nigroviridis) predicts a number of genes between 24000
and 29000 (Chen 05; www.ensembl.org). Predictions of proteome length based on
genome for Takifugu rubripes postulate the presence of about 33,700 non-redundant
proteins including alternative predictions for the same gene loci but not post-translational
modifications (Aparicio 02). Assuming the predictions for fugu fish, the number of
detected spots in this work corresponds to 3% of the testis proteome from S.
senegalensis. For 2-DE studies performed in similar conditions on D. rerio (Tay 06, Link
06a-b), the number of spots detected (between 1000 and 1600, depending on the study)
represent around 4-5% of the predicted number of genes.
However, this parameter should be corrected by other factors. For instance, the genes
expressed in a certain tissue are less than those for the complete genome of one
species and, therefore increasing this predicted value. Moreover, the spots in 2-D gels
are not univocally related to one gene, because of alternative splicing and PTMs. This in
turn will reduce the predicted value for this parameter.
101

Chapter 2
2.3.1 Gel Reproducibility
Due to the spermatogenesis cycle of the Senegalese sole, it was convenient to
coordinate specimen sampling in two different years, and therefore, the testis samples
of this study were processed in different periods during the year. The first batch was
processed in October 2004. This included F0 mid spermatogenesis, late
spermatogenesis and functional maturation groups. The second batch of gels was
performed in March 2005, and included the F1 functional maturation group. The last
batch was performed in June 2005 and the F1 late spermatogenesis group was
analysed. The reliability and robustness of the analytical procedures along the time
extension of the project was thus critical as gels performed in different batches must be
compared.
In addition to this, the Pleurogene project is a collaborative effort that involves research
centres in Spain and Canada. Thus, any technical protocols developed in this framework
had to take into account that the samples analysed were obtained with the implication of
several partners and that the results must be reproducible and shareable by other
groups.
Major concerns were related with image reproducibility both in terms of spot distribution
(Mr/pI stability) and intensity (%Vol variation). Reproducibility and robustness along the
experiments were checked using six spots distributed through the gel (Mr range: 60-17
kDa; pI range: 3,7-8,5). The CV of the Mr mean values for spots placed in the 60 kDa
area (1821 and 1814) were 4,7 and 6,3 respectively, while for the other spots it was
lower than 0,2. The CV of the pI mean values were never higher than 0,01. These
measures showed that IEF system was highly reproducible in the ranges studied. On
the other hand the SDS-PAGE separation presented reproducibility with less than 1% of
variation under 40 kDa, but it increases up to 5-6% above this mobility limit.
Main reproducibility issues were however found related with spot volumes. The mean
CV values for the normalized volume of 488 spots common to all gels were 54, 42, 55,
36 and 38% for F0M, F0L, F0Mat, F1Mat and F1L, respectively. These variations are
principally produced during the silver staining process and sample preparation,
especially in protein quantification and IPG holder loading (Görg 04, Quero 04). In
consequence, changes in spot volumes lower than 30-40% in the comparisons between
102

Chapter 2
different stages can not be confidently assigned to biological changes, but to
experimental variability. To diminish false positives, in this study, only variations equal or
over two-fold were considered. Exceptionally, statistically significant changes (P < 0,05)
between 2-fold and 1,6-fold were also considered, when neighbouring spots presented
significative variations over 2-fold. This allowed unmasking other spots with the same
protein identification and related abundance variations.
After the analytical conditions described in Materials and methods were set, results were
found consistent and reproducible over the time, allowing comparisons of gels obtained
in different periods using routine procedures for image analysis. Moreover, this
approach has been also evaluated in several proteomic studies, resulting always that
the technique was consistently reproducible and reliable for comparative studies
(Higginbotham 91, Heinke 98, Tsuji 99, Vasseur 99, López 01, Quero 04).
2.3.2 Expression analysis
Forty-nine spots were determined as differential in at least one of the comparisons
performed. Few spots were exclusive of a given individual comparison, indicating that
the majority of the described spots could play a role in the whole process of
spermatogenesis. Changes observed were mainly in the range from ±2 to ±5-fold
variations. About 20% of the spots showed changes between ±5 and ±10, and 12% over
±10-fold change (Table 2.10).
The identification of stage-specific differential spots could proportion tentative
biomarkers to define the corresponding spermatogenic stage. From the F1L vs. F1Mat
comparison, two stage-specific spots were detected and identified as carbonic
anhydrase. Also, a specific spot corresponding to a protein involved in the steroid
pathway was identified from the F0Mat vs. F1Mat comparison. Protein identification of
uni spots from other comparisons are related to structural and antioxidant functions,
metabolic pathways, or protein folding processes (Table 2.11). Functional implications in
spermatogenesis of these proteins are discussed below.
103

Chapter 2
Conversely, the presence of common differential spots between two comparisons could
indicate biological similarities between the studied transitions, especially when those
common spots vary in the same sense (Table 2.12). For instance, the transformation
from F0M to F0L stages shares 5 spots changing in the same sense with the
transformation from F1L to F1Mat. Although histologically F0 and F1 animals are
classified identically, the presence of coincident spots between these comparisons could
indicate that the molecular changes needed to transform testis from F0M to F0L are
similar to those needed to transform testis from F1L to F1Mat. Then, F1L state would
be more similar to F0M than to F0L, and F1Mat closer to F0L than to F0Mat, indicating a
less mature state than the observed in the histological analysis. This fact correlates with
the experimental data, which showed F1Mat animals producing sperm without all the
signs of maturity.
Table 2.10.- Number of differential spots observed in the different spermatogenic stages
and classification based on their observed expression changes (∆). Specific spots
indicate the number of spots whose variation is considered only significant in the
corresponding comparison (see Table 2.11 for spot identification).
Spots with
Differential
Spots
Specific
spots 5≥ ∆ >2 10≥ ∆ >5 ∆ >10
F0M-F0L 11 -- 7 2 2
F0L-F0 Mat 15 2 10 3 2
F0M-F0Mat 7 -- 4 2 1
F1L-F1Mat 18 2 13 3 2
F0L-F1L 19 4 18 4 2
F0Mat-F1Mat 17 2 12 4 2
Unique Total 49 10 64 18 11
104

105
Chapter 2
Table 2.11.- Differential spots unique to each experimental comparison in the
spermatogenic stages study (see table 2.10)
Unique spots ID Protein ID of unique spots
F0L-F0Mat 2898
2909
Cofilin 2
Unnamed protein product gi47218822
F1L-F1Mat 2578
2591
Carbonic anhydrase
Carbonic anhydrase
F0L-F1L
1966
2126
2723
2778
Serine (or cysteine) protease inhibitor
Malate dehydrogenase
Peroxiredoxin 3 or Translin
Proteasome beta 4 subunit
F0Mat-F1Mat 2339
2650
Hydroxysteroid (17-β) dehydrogenase 4
Glutathione s-transferase
Table 2.12.- Classification of differential spots based on repetition in comparisons and
common sign variation. The total number of differential spots in each comparison is
indicated in parenthesis in the header. CS: Total number of Common differential spots
between comparisons. SS: Number of spots presenting the same sign variation in both
comparisons. F0= wild animals; F1= cultured animals; M= Mid spermatogenic stage; L=
Late spermatogenic stage; Mat= functional maturation spermatogenic stage.
F0M –F0L
(11)
F0L-
F0Mat
(15)
F0M –
F0Mat
(7)
F1L –
F1Mat
(18)
F0L – F1 L
(24)
F0 Mat – F1
Mat
(18)
F0M – F0L
(11)
CS SS F0L – F0 Mat
(15) 6 --
CS SS CS SS F0M – F0 Mat
(7) 2 2 4 3
CS SS CS SS CS SS F1L – F1 Mat
(18) 5 5 5 -- 2 1
CS SS CS SS CS SS CS SS F0L- F1L
(24) 6 -- 9 8 4 2 13 1
CS SS CS SS CS SS CS SS CS SS F0 Mat – F1 Mat
(18) 7 6 10 -- 7 3 9 7 8 2

Chapter 2
2.3.3 Protein identification
More than 80% of the analyzed differential spots (40 out of 49 spots) could be assigned
to a protein by MS/MS. Moreover, quite a few of these identifications were confirmed by
combining proteomic and EST information.
Two different de novo sequencing softwares and several types of BLAST searches
(pblast, blastx, tblastn) were used during the protein identification analysis. The
development and optimization of several bioinformatic tools for protein identification was
primordial to achieve the objectives of the current investigations. Nowadays, as long as
the experimental MS/MS raw data is prime-quality, sequencing softwares play a critical
role in determining the number of relevant results finally obtained, and thus sequencing
softwares are nowadays in the edge of bioinformatic development (Xu 06).
Despite the amount of data generated in the process described here to identify protein
from 2-D spots is not as demanding as the LC-MS/MS data processing, the identification
process of proteins from species without sequenced genome is still a high time-
consuming work. Unfortunately, de novo sequencing softwares available for the study
(Peaks 2.4 and Lutefisk 97) were not designed to integrated data from different sources
(i.e. BLAST analysis, de novo data from other softwares) and this situation complicates
the task of producing good quality results.
In this work, it was resolved to use several identification approaches to cross-validate
the candidate sequences. Initial comparison of the two de novo sequencing softwares
available showed that Peaks gave generally better results than Lutefisk97, as already
observed elsewhere (Pevtsov 06, DiMaggio 07). In consequence Lutefisk was used as a
confirmation tool for the main data flow produced from Peaks, although in several cases
both tools were combined to obtain the final result.
Following the analytical protocol designed for this work, and after a tentative protein was
identified, the analysis of the differences between theoretical and experimental values of
Mr and pI was used as a source for additional clues on its identity (figure 2.12).
Differences over ±0,2 and ±2 for Mr and pI, respectively were taken as the threshold
values to determine possible erroneous identifications.
106
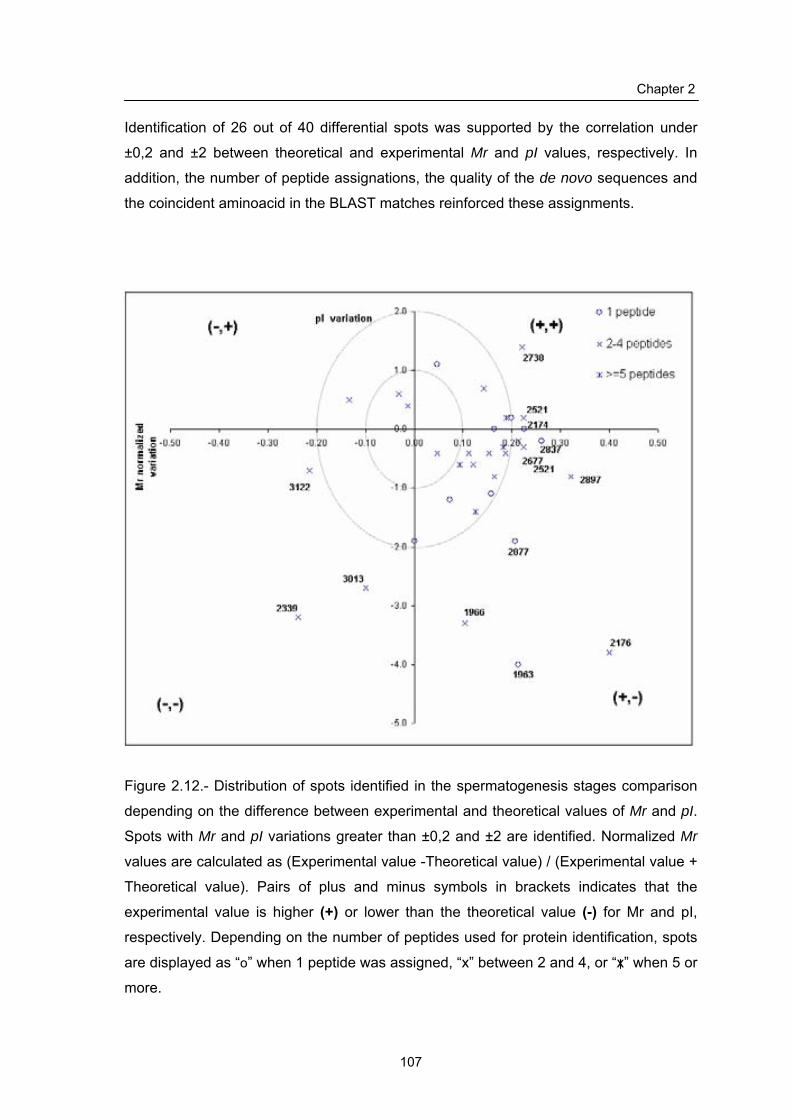
Chapter 2
Identification of 26 out of 40 differential spots was supported by the correlation under
±0,2 and ±2 between theoretical and experimental Mr and pI values, respectively. In
addition, the number of peptide assignations, the quality of the de novo sequences and
the coincident aminoacid in the BLAST matches reinforced these assignments.
Figure 2.12.- Distribution of spots identified in the spermatogenesis stages comparison
depending on the difference between experimental and theoretical values of Mr and pI.
Spots with Mr and pI variations greater than ±0,2 and ±2 are identified. Normalized Mr
values are calculated as (Experimental value -Theoretical value) / (Experimental value +
Theoretical value). Pairs of plus and minus symbols in brackets indicates that the
experimental value is higher (+) or lower than the theoretical value (-) for Mr and pI,
respectively. Depending on the number of peptides used for protein identification, spots
are displayed as “o” when 1 peptide was assigned, “x” between 2 and 4, or “x” when 5 or
more.
107

Chapter 2
For other 9 spots, theoretical and experimental pI and/or Mr were over the reference
values, although the number of assigned sequences (≥2 peptides) or the number of
aminoacid identities (≥9 coincidences) in the BLAST alignments supported the
assignment. These variations could suggest the presence of PTM (∆Mr and ∆pI), a
significant modification in the number of charged aminoacids in S. senegalensis
sequence in respect with the specie for which the protein has been identified (∆pI;
Tetraodon nigroviridis, Danio rerio, Pan troglodytes and Mus musculus) or the
identification of a fragment instead of the full-length protein (∆Mr). The latter case can be
supported by inspecting the position in the protein sequence of the identified peptides.
For the remaining 5 spots, high ∆Mr and/or ∆pI differences with only one peptide
assignation could be indicative of an incorrect identification, and in this case a careful
reanalysis of the original MS/MS sequence and BLAST data was performed. Only
assignation for spot 1963 was then rejected.
In summary, 39 out of 40 protein assignations passed the quality control on protein
assignment based on the combination of the number of peptides assigned for each spot,
BLAST comparison and difference between theoretical and experimental pI and Mr
values.
2.3.4 Use of genomic ESTs for annotation cross-validation
The availability of EST from S. senegalensis tissues allowed further validation of
tentative peptide sequences. The combination of genomic and proteomic information
resulted to be of great value for sequence assignation. For instance, 6 out of 7 peptides
from spot 2778 fit perfectly in PGSP0002H09_T7.AB1 EST. Only one peptide did not
correspond to any region of the EST. After analyzing the distribution of these peptides in
the assigned protein (gi|47213154: [Tetraodon nigroviridis] Proteasome beta 4 subunit),
it was noticed that the peptide was situated at the beginning of the protein sequence
(figure 2.13).
This fact could indicate the presence of some bias in the EST sequence generated from
the polyA mRNA population. The mRNA reversely transcribed to cDNA present from 5’
to 3’ the coding region, an untranslated region (UTR) of variable length and a polyA
region. This reverse transcription was made using polyT as a primer. Then, the resulting
108

Chapter 2
cDNA’ should be constituted, from 5’ to 3, of a polyT region, an UTR region of variable
length and the coding region. Unfortunately, the product length of the reverse
transcription does not always cover the complete mRNA sequence with high fidelity and
depending on the UTR length, some cDNA will present modified or even truncated
coding regions, missing a portion of their 5’ sequence. This region corresponds to the N-
terminal aminoacids of a protein as expected from the observed disposition of peptides
in spot 2778 (figure 2.14). In this way the proteomic approach was complementary to the
genomic available data, while the EST sequences confirmed the MS/MS assignations.
>gi|47213154|emb|CAF93844.1| Tetraodon nigroviridis; proteasome beta 4 subunit
GMKLSFWENGPKPGQFYSFPGSRNQTGTSCGPVRHTLNPMVTGTSVLGVKFSGGVIIAADMLGSYGSLARFRNISRLMKVNDSTILGASGDYADYQYLKRVIEQMVIDEELLGDGHSYSPKAVHSWLTRVMYNRRSKMNPLWNTVVIGGFYKGESFLGYVDKLGVAYEAPTVATGFGAYLAQPLMREAVENKPELSKQEARDLIERCLKVLYYRDARSYNRYEIAIVTEEGVEIISPLSSETNWDIAHMVR
MALDI/nESI (z) Peaks sequences Score 2167 (+3) VNNSTLLGASGDYYVNGMYK 77% 1501 (+1) LTTPMVTGTSVLRK 8% 1628 (+2) NNLSKQEALDLVER 70% 1958 (+2) RELLGPLSSETNWDLAR 82% 1986 (+2) SSALSDLAADMLGSYGDRR 99% 2497 (+2) WWMEAPTVATGFGAYLAQGQRR 61%
Figure 2.13.- Peptides described for spot 2778 were aligned over the predicted protein
(Proteasome beta 4 subunit). Peptides were aligned with S. senegalensis EST, giving a
correspondence with PGSP0002H09_T7.AB1. “PMVTGTSVL” is the closer peptide to
the N-terminal and the only sequence that does not correspond to a EST region.
The number of identified peptides matching with S. senegalensis ESTs (21 out of 40,
53%) is much higher than theoretically expected from the predicted number of
genes/proteins for fish species (around 25000 genes and 30000 proteins not including
PTM variants; Chen 05). The EST-peptide correlation takes into account 10000 EST
and 40 identified proteins. The EST set represents 40% of the total gene number, while
proteins are less than 1% of the total predicted proteins. Assuming that every gene finds
a match in the general protein set, the theoretical probability of finding a correlation
109

Chapter 2
between groups in this study would be only 16%. These differences can be due to a
bias introduced by the experimental procedures in the obtainment of the EST set and
the analysis of the proteome. During EST obtention, mRNAs with a high number of
copies had a greater chance to be cloned and amplified. More drastically, the 2-DE
analyses reveal only the more abundant protein species. In overall, this fact results in
the obtainment of EST and protein collections included in the relative small subset of
highly expressed molecules, and in consequence, a greater probability of coincidence
between them. This situation was also described for the shotgun peptide dataset (see
page 57).
Some spots in the EST-peptide-database comparison with several peptides perfectly
related to a described protein, did not find any EST relationship (i.e spot 2685). Beside
the previous argument of probability and expression, the lack of coincidence could be
induced by the transcription problem cited above (the EST does not present a coding
region at all, because the UTR is too long). In these cases proteomic information
acquires even more relevance, and the complementariety between approaches
becomes more evident.
Unfortunately, EST comparison was not able to predict the protein identification for
those spots that could not be identified by MS/MS procedures. This is understandable
assuming that peptide sequences for this spots are not so reliable, that mRNA for this
protein was not captured or that the coding sequence was not transcribed from fish
genome. Other similar approaches with Xenopus laevis described in literature found
similar results (Liska 04).
110
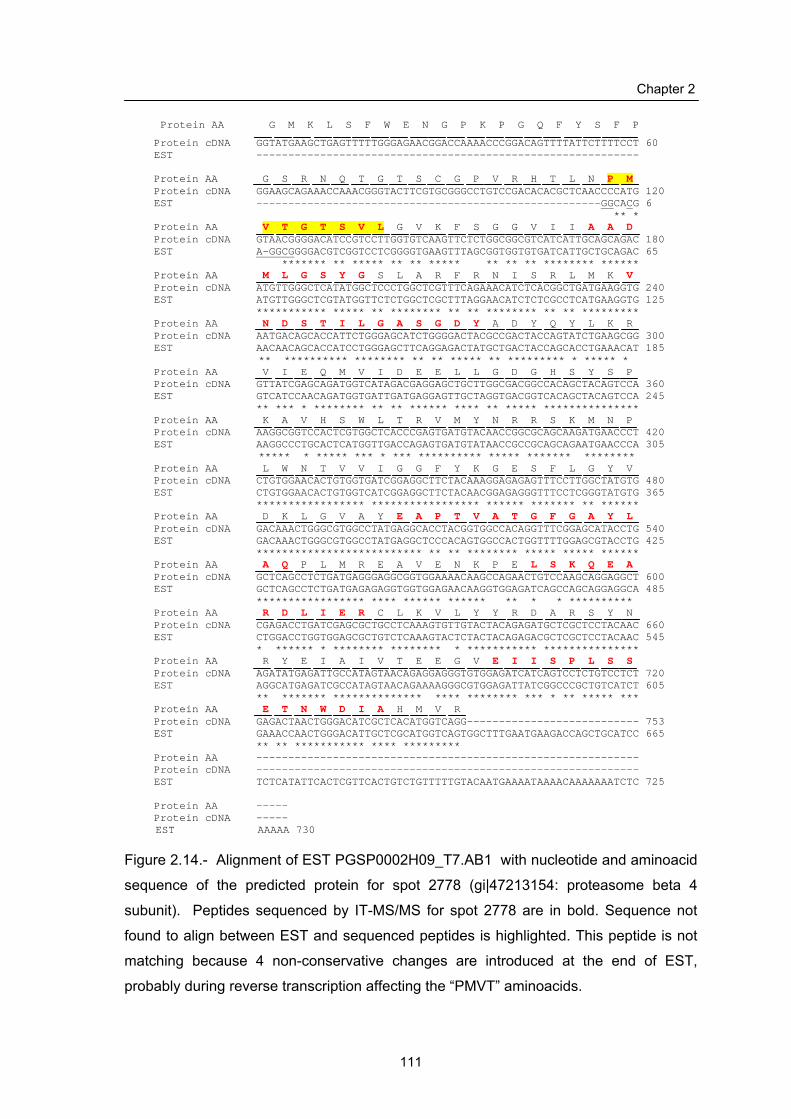
Chapter 2
Protein AA G M K L S F W E N G P K P G Q F Y S F P Protein cDNA GGTATGAAGCTGAGTTTTTGGGAGAACGGACCAAAACCCGGACAGTTTTATTCTTTTCCT 60 EST ------------------------------------------------------------ Protein AA G S R N Q T G T S C G P V R H T L N P M Protein cDNA GGAAGCAGAAACCAAACGGGTACTTCGTGCGGGCCTGTCCGACACACGCTCAACCCCATG 120 EST ------------------------------------------------------GGCACG 6 ** * Protein AA V T G T S V L G V K F S G G V I I A A D Protein cDNA GTAACGGGGACATCCGTCCTTGGTGTCAAGTTCTCTGGCGGCGTCATCATTGCAGCAGAC 180 EST A-GGCGGGGACGTCGGTCCTCGGGGTGAAGTTTAGCGGTGGTGTGATCATTGCTGCAGAC 65 ******* ** ***** ** ** ***** ** ** ** ******** ****** Protein AA M L G S Y G S L A R F R N I S R L M K V Protein cDNA ATGTTGGGCTCATATGGCTCCCTGGCTCGTTTCAGAAACATCTCACGGCTGATGAAGGTG 240 EST ATGTTGGGCTCGTATGGTTCTCTGGCTCGCTTTAGGAACATCTCTCGCCTCATGAAGGTG 125 *********** ***** ** ******** ** ** ******** ** ** ********* Protein AA N D S T I L G A S G D Y A D Y Q Y L K R Protein cDNA AATGACAGCACCATTCTGGGAGCATCTGGGGACTACGCCGACTACCAGTATCTGAAGCGG 300 EST AACAACAGCACCATCCTGGGAGCTTCAGGAGACTATGCTGACTACCAGCACCTGAAACAT 185 Protein AA V I E Q M V I D E E L L G D G H S Y S P
** ********** ******** ** ** ***** ** ********* * ***** *
Protein cDNA GTTATCGAGCAGATGGTCATAGACGAGGAGCTGCTTGGCGACGGCCACAGCTACAGTCCA 360 EST GTCATCCAACAGATGGTGATTGATGAGGAGTTGCTAGGTGACGGTCACAGCTACAGTCCA 245 ** *** * ******** ** ** ****** **** ** ***** *************** Protein AA K A V H S W L T R V M Y N R R S K M N P Protein cDNA AAGGCGGTCCACTCGTGGCTCACCCGAGTGATGTACAACCGGCGCAGCAAGATGAACCCT 420 EST AAGGCCCTGCACTCATGGTTGACCAGAGTGATGTATAACCGCCGCAGCAGAATGAACCCA 305 Protein AA L W N T V V I G G F Y K G E S F L G Y V
***** * ***** *** * *** ********** ***** ******* ********
Protein cDNA CTGTGGAACACTGTGGTGATCGGAGGCTTCTACAAAGGAGAGAGTTTCCTTGGCTATGTG 480 EST CTGTGGAACACTGTGGTCATCGGAGGCTTCTACAACGGAGAGGGTTTCCTCGGGTATGTG 365 ***************** ***************** ****** ******* ** ****** Protein AA D K L G V A Y E A P T V A T G F G A Y L Protein cDNA GACAAACTGGGCGTGGCCTATGAGGCACCTACGGTGGCCACAGGTTTCGGAGCATACCTG 540 EST GACAAACTGGGCGTGGCCTATGAGGCTCCCACAGTGGCCACTGGTTTTGGAGCGTACCTG 425 ************************** ** ** ******** ***** ***** ****** Protein AA A Q P L M R E A V E N K P E L S K Q E A Protein cDNA GCTCAGCCTCTGATGAGGGAGGCGGTGGAAAACAAGCCAGAACTGTCCAAGCAGGAGGCT 600 EST GCTCAGCCTCTGATGAGAGAGGTGGTGGAGAACAAGGTGGAGATCAGCCAGCAGGAGGCA 485 ***************** **** ****** ****** ** * * ********** Protein AA R D L I E R C L K V L Y Y R D A R S Y N Protein cDNA CGAGACCTGATCGAGCGCTGCCTCAAAGTGTTGTACTACAGAGATGCTCGCTCCTACAAC 660 EST CTGGACCTGGTGGAGCGCTGTCTCAAAGTACTCTACTACAGAGACGCTCGCTCCTACAAC 545 * ****** * ******** ******** * *********** *************** Protein AA R Y E I A I V T E E G V E I I S P L S S Protein cDNA AGATATGAGATTGCCATAGTAACAGAGGAGGGTGTGGAGATCATCAGTCCTCTGTCCTCT 720 EST AGGCATGAGATCGCCATAGTAACAGAAAAGGGCGTGGAGATTATCGGCCCGCTGTCATCT 605 Protein AA E T N W D I A H M V R ** ******* ************** **** ******** *** * ** ***** ***
Protein cDNA GAGACTAACTGGGACATCGCTCACATGGTCAGG--------------------------- 753 ST GAAACCAACTGGGACATTGCTCGCATGGTCAGTGGCTTTGAATGAAGACCAGCTGCATCC 665 E ** ** *********** **** *********
Protein AA ------------------------------------------------------------ Protein cDNA ------------------------------------------------------------ EST TCTCATATTCACTCGTTCACTGTCTGTTTTTGTACAATGAAAATAAAACAAAAAAATCTC 725 Protein AA ----- Protein EST AAAAA 730
cDNA -----
Figure 2.14.- Alignment of EST PGSP0002H09_T7.AB1 with nucleotide and aminoacid
sequence of the predicted protein for spot 2778 (gi|47213154: proteasome beta 4
subunit). Peptides sequenced by IT-MS/MS for spot 2778 are in bold. Sequence not
found to align between EST and sequenced peptides is highlighted. This peptide is not
matching because 4 non-conservative changes are introduced at the end of EST,
probably during reverse transcription affecting the “PMVT” aminoacids.
111

Chapter 2
In several cases, one spot was assigned to two different proteins. The set of sequenced
peptides for the spot led to the identification of different proteins making difficult to
assign univocally one protein identification to that spot. Two main situations could be
behind these cases: the use of bad quality spectra and the posibility of protein
colocalization in the spot.
Bad quality spectra or spectra with partial, ambiguous data can derive from the analysis
of low concentration samples as well as from peptide sequences with unadequate
fragmentation characteristics. In the latter case, these spectra can be obtained even
from intense spots from where good quality spectra derived from other tryptic peptides
produce alternative identifications. In these cases a careful, manual filtering of the data
was required in order to select those identifications from the best spectra available.
In other cases, two different assignations could be produced from two different subsets
of spectra produced from the same gel spot. Probable causes of this double
identification are the colocalization of proteins under the same spot or the contamination
by other intense spots in the surroundings. Further complementary analysis such as
qualitative Western blot or ELISA should be performed in those cases to determine the
protein responsible of the spot variation. In the case of fish species, these confirmatory
techniques are not always possible because of the low availability of commercial
antibodies, especially for those fish that are not model organisms.
2.3.5 Biological implications of variations in the testis proteome
Transition from mid to late spermatogenesis stages in F0 animals was accompanied by
several proteome changes. A significant high variation was found in the acidic ribosomal
phophoprotein P0 (spot 2176). Absence or reduction of this protein leads to inactive
ribosomes and impaired protein synthesis (Santos 94). The molecular mass difference
between theoretical (21 kDa H. sapiens, 34 kDa D. rerio and S. cerevisiae) and
experimental values (49 kDa S. senegalensis) of spot 2176 is 13 and 38 kDa,
respectively. This could indicate that the identified protein is a precursor of functional P0
protein. The profile of this protein along the F0L and F0Mat spermatogenic stages may
indicate a maturation of this precursor to produce active P0 protein. Protein synthesis
requirements are high in late spermatogenesis, where protamines and transient histone-
112
Chapter 2
replacing proteins are needed to transform spermatids into spermatozoa. On the
contrary, this P0 precursor is not processed between F1L and in F1Mat stages and
protein synthesis is then impaired, leading to the impossibility to replace histones
properly, and possibly causing abnormalities in spermatozoa as often observed in F1
animals.
Another broad change with the same expression profile was observed between the
F0M-F0L stages for two spots related to cofilin (2897 and 2972). Spot 2898, that
showed significative variations in the F0L-F0Mat comparison, was also related to cofilin.
Spots 2897 and 2898 presented the same Mr value differing in 0,4 pI units, while spot
2972 is placed 3 kDa below 2897. This disposition suggest different post-translational
modifications between spots 2897, 2898, and 2972 (figure 2.15). From the available MS
experimental data in this study (i.e. MALDI spectra from digested spots, MS/MS spectra
of fragmented peptides and situation of the tentative de novo sequences inside the
homologous assigned protein) it is not possible to confirm which PTM could be
associated and which possible cofilin isoform is related to each spot.
In the literature, a prevalent role for cofilin was described in the control of
polymerization/depolymerization of actin during spermatogenesis. The actin filaments
are involved in the progressive movement of the germ cells from the basal to the luminal
compartment of the seminiferous epithelium. In this process, cellular cysts must cross
the blood-testis barrier (BTB). Several disassembly and reassembly of cellular junctions
occurs during this process: between Sertoli cells (Tight junctions, TJs) and between
Sertoli and germ cells (actin-based adherent junctions, AJs) (Cheng 02). These events
in spermatogenesis are also associated with extensive turnover of junctions with
changes in actin filament organization. This process is mediated by integrins and
regulated by cofilin phosphorylation/dephosphorylation, acting as a simple switch for
actin assembly and disassembly (Huang 06). Then, variations between cofilin profiles
between F0 and F1 group might indicate that isoforms of cofilin are involved in observed
sperm abnormalities, possibly by participating in the modulation of sperm actin filaments
or by regulating the cell-cell junctions during spermatocyst maturation.
113

Chapter 2
2897
2972
2898
5,8 6,2
25kDa
20kDa
pI
Figure 2.15.- Relative positions in a 2-D gel of spots 2897, 2898, 2972, assigned to
isoforms of the cofilin family.
Heterochromatin-specific nonhistone protein (spot 2837) presented great variations not
only in the F0 spermatogenesis process but also in F1 animals. This protein is
implicated in formation of the XY body during spermatogenesis in mammals. The XY
body is essential for heterochromatinization of sex chromosomes and for successful
spermatogenesis. Expression of this protein changes along the spermatogenesis
process (Motzkus 99) as observed in F0 animals, but not in F1. This may indicate
disturbed functionality of XY body formation and therefore impaired spermatogenesis.
Spots 2908, 2918, 3122 and 3159 were assigned to myosin light chain proteins (MLC).
All of them presented a similar protein expression profile, with a maximum of presence
in late stage for F0 animals, but a maximum in functional maturation stage for F1 group
possibly indicating a delay in the spermatogenesis process for F1 individuals, as pointed
earlier in this discussion. The relative disposition of spots in the gel could point to pI
changes due to PTM between spots 2908 and 2918 (figure 2.16). Unfortunately, thid
possibility could not be clarified from the available MS data. However, substantial
evidences implicate a role for phosphorylation-dephosphorylation systems in the
regulation of MLC in sperm motility. MLC kinases and phosphatases were described to
be involved in fowl sperm motility (Ashizawa 95). The modulating role of
phosphorylation-dephosphorylation described for MLC in sperm motility may have an
important implication in the deficiencies observed in F1 animals.
114

Chapter 2
2908
3122
3159
2918
25kDa
15kDa
3 4pI
Figure 2.16.- Relative positions of spots 2908, 2918, 3122 and 3159, identified as
different isoforms of the myosin light chain family.
Glutathione-S-transferase (spot 2650), glutathione peroxidase (spot 2685),
peroxiredoxin 3 (spot 2723) and methionine sulfoxide reductase A (spot 2603) were
generally increased in F1 stages respect to the parallel stages in F0 animals. Different
roles in spermatogenesis and sperm maturation have been described for these proteins:
oxidation of protamine thiols in DNA condensation for stabilizing chromatin by
crosslinking protamine disulfides (Pfeifer 01), prevention of protein and DNA damage
(Benbahim 02), steroid binding activity (Aravinda 95) and general maintenance of cell
redox state, specially by controlling reactive oxygen species (ROS; Rao 00, Drevert 06,
Fuji 05, Cabreiro 06). All these fundamental functions should be balanced and, the
expression patterns of these 4 proteins showed a variation in F1 animals that may
indicate a loss of control of the redox state. This situation can contribute to the
abnormalities observed in sperm and the infertility of F1 animals.
The spots assigned to P0 protein, cofilin, MLC and redox proteins are grouped mainly in
the subtrees 1 and 3 of the cluster analysis (table 2.6), confirming a common behaviour
of these proteins during the studied states.
Spots 2578 and 2591 were identified as carbonic anhydrase (CA). Their expression
profile was especially interesting in the F1Mat group where spot 2578 is increased, while
spot 2591 decreases respect the other four states. Both spots show identical
115

Chapter 2
electrophoretic mobility, differing only in few pI units. This could point to a PTM
difference between CA isoforms that may modulate their activity.
CA has been involved in the acquisition of motility of spermatozoa. They acquire this
faculty during the passage through the sperm duct. This sperm maturation process
involves only physiological but not morphological changes (Miura 03). The pH of both
the sperm duct and the spermatozoa cytosol are considered key for sperm motility. The
mechanisms regulating pH are not clear, but several elements have been related: CA in
spermatozoa membrane (Inaba 03) and epididymis epithelium (Ekstedt 04), 17α,20β−P
and cAMP (Miura 03) and the CO2/ HCO3⎯ balance (Inaba 03). The inverse expression
profiles of these two spots could indicate that CA regulation in F1 animals is not proper
and then sperm motility is impaired due to this PTM regulation deficiency.
The spot 2499, identified as the 14-3-3 protein, changes principally when comparing
between F0 and F1 animals the transitions from late to functional maturation stages.
Two different isoforms were related to the same spot: β isoform from direct comparison
of peptide sequences with NCBI database and δ isoform from comparison of peptide
sequences with S. senegalensis EST. From the sequenced peptides it is not possible to
determine which 14-3-3 protein is differential in this study. Human β, δ and θ isoforms
contain 80% of common regions and clustal comparison for β, δ and θ isoforms is not
available for any fish species. However, it is clear that the variation observed suggests a
biological importance of 14-3-3 proteins during the Senegalese sole spermatogenesis.
As described in the literature, 14-3-3 proteins may be involved in the differentiation of
spermatids, principally in the morphogenesis of sperm flagellum (Berruiti 00), and
therefore in the acquisition of sperm motility. The process from late to functional
maturation includes the transformation from spermatids to spermatozoa (Garcia 05).
The variation of 14-3-3 expression profile between F1 and F0 can contribute to explain
the abnormalities in form and motility observed in F1 spermatozoa.
The results obtained in the present work shows an absence of spot 3690 in functional
maturation stage of F1 fish, while present in F0 fish. Two other spots related to
proteasome subunits (2738 and 2778) also showed a different expression pattern in F0
animals and F1 animals. Proteasome components have been connected to
spermatogenesis in several studies. One of the key elements of spermatozoa
116

Chapter 2
maturation is the replacement of spermatid histones by protamines to allow a higher
package ratio of gamete DNA. The control of this change is under ubiquitin ligases
which ubiquitinate histones as they are replaced first by testis-specific transition proteins
and then by protamines (Sutovoksky 03, Sassone-Corsi 02). The replaced histones are
processed by proteasome after replacement. For example, histones H3 and H2A
become ubiquitinated in elongating spermatids, just before the histones are replaced
(Agell 88, Chen 98) and knock out of an Ub-conjugating enzyme causes male sterility,
with morphological abnormalities in spermatozoids suggesting a failure in nuclear
condensation (Roest 96).
As described for spot related to proteasome units, pattern expression for Ubiquitin C-
terminal hydrolase (spot 2667) was different between F1 and F0 animals. UCHs are
highly expressed in testis. Previous work demonstrated that UCH-L1-deficient mice
exhibit progressively decreasing of spermatogonial stem cell proliferation, suggesting
that UCH isozymes in the testis function during spermatogenesis (Kwon 03). These
observations could be pointing in the same direction described above: sperm maturation
is not complete in F1 because histone replacement is not performed effectively as
ubiquitin/proteasome pathway is not acting properly.
Spot 2339 was identified as 17-β hydroxysteroid dehydrogenase (17β-HSD). F1 levels
of this spot 2339 were always decreased compared with F0 levels. The comparison
F1Mat-F0Mat uncovers a 2-fold variation for this protein. This enzyme modulates the
biological potency of estrogens and androgens by conversion at position 17: keto-forms
are inactive (estrone, ∆4-androstenedione), whereas hydroxy-forms are active and
access the steroid receptors (estradiol, testosterone; Mindnich 04). As described in the
introduction, testosterone is the precursor of 11-ketotestosterone (11-KT). Testosterone
is most effective as a stimulator of hypothalamic and pituitary activity, leading to further
testis activation, while 11-KT is most effective as a direct stimulator for spermatogenesis
and then considered the main androgen teleost fish (Nagahama 94).
The role of this enzyme in testosterone production and its general decrease in F1 stages
may indicate that F1 individuals do not produce enough testosterone, and consequently
not enough 11-KT to maintain the signalling needed for complete spermatogenesis. The
lack of this hormonal stimulation during spermatogenesis could be the origin of most of
the morphological and molecular variations observed for F1 individuals.
117

Chapter 2
The expression pattern of spot 2275, assigned to the E1 β subunit of pyruvate
dehydrogenase (PDH), showed a positive 4-fold difference in F1Mat relative to F1L. By
contrast, in F0 animals a decrease of near 3 fold was observed for this transition
Pyruvate dehydrogenase E1 β subunit is directly related to the testis-specific pyruvate
dehydrogenase E1 α subunit (Iannello 92) in the PDH complex as observed in figure
2.17. Regulation of E1 α subunit of the pyruvate dehydrogenase gene has been of
special interest because it remains transcriptionally silent in spermatogonia, but is active
in spermatocytes (Iannello 97). Assuming that E1 β subunit could reflex E1 α subunit
state, PDH activation in F1 animals diverges completely from F0 animals. This
difference could lead to an energetic deficiency in spermatozoa causing motility
problems.
PDCE1B
PDCE1A1PDCE1A1
PDCE1PDCE1
PDCE1A2PDCE1A2
PDCE2PDCE2
PDCE3PDCE3 E2KE2K
Figure 2.17.- STRING network predictions for spot 2275. Ensemble Danio rerio
accession number (ENSDARG00000021346) for the pyruvate dehydrogenase E1 was
introduced in STRING (embl.string.de) with the conditions: high confidence 0.900,
network depth 2, interactors showed no more than 20. Resulting network based on the
identified protein pyruvate dehydrogenase E1 showed relationships between proteins
with an overall score superior to 90% of confidence. PDCE1A1: Pyruvate DH Component
E1 type A1; PDCE1B: Pyruvate DH Component E1 type B; PDCE1: Pyruvate DH Component E1;
PDCE2: Pyruvate DH Component E2; PDCE3: Pyruvate DH Component E3; E2K: α-ketoglutarat
DH Component E2.
118
Chapter 2
2.3.6 Relationships between 2-D protein gel analysis and RNA microarray data in F0
Besides the proteomic approach to identify proteins of interest in the spermatogenic
process, a microarray analysis of the mRNA of testis from wild S. senegalensis was
performed. The samples processed were identical to the samples analysed in the
proteomic study. Results of this analysis (Castellana and Planas, unpublished data)
were then compared with the proteomic experiments.
Two different comparisons were performed in triplicate in an array composed of 5087
oligonucleotids: F0L-F0M and F0Mat-F0L. In the F0L-F0M comparison 20 genes were
up-regulated, while 81 down-regulated. In the F0Mat-F0L comparison 25 genes were
up-regulated, while 117 down-regulated. One hundred and ten of the sequences in the
microarray that were found to be up or down-regulated in any of the comparisons
present a related entry with a known gene/protein database.
Seven differential expressed genes (from 243) corresponded with proteins already
identified as differential in the proteomic analysis (49 total proteins). Coincident proteins
were serine or cysteine proteinase inhibitor (spot 1966), profilin 2 (spot 3233), two genes
of proteasome subunits (spots 2738, 2778, 2587, 3690) and two genes of
apolipoproteins (spots 2759, 3649). The ubiquitin ligase complex gene was also
included in this collection of coincident data because spot 2667 was identified as
ubiquitin hydrolase and both proteins are involved in the protein ubiquitination pathway.
The role of two of these gene/protein molecules, proteasome and ubiquitin hydrolase,
had been specially adressed in the previous section because their important functions in
histone substitution by protamine for proper DNA condensation. However, and despite
several isoforms of apolipoproteins have been related with sperm activacion (Akerlof 91,
Poussette 93, Leijonhufvud 97), the relevance of the changes observed for this protein
was not clear from the proteomics experiments. The main concern was related with the
possibility of this changes being derived from the presence of blood in testis samples.
Array analyses confirmed that changes in expression of the corresponding gene is
actually ocurring during fish spermatogenesis.
Profilin is mainly involved in integrating different signal pathways and transforms the
information into actin polymerization/depolimeryzation process. As described for cofilin
119

Chapter 2
(spots 2897, 2898 and 2972) this role is extremely important in cellular sperm
maturation and motility.
The low correlation found between mRNA and protein expression values in Senegalese
sole testis is already described in literature for other human cancer samples (Huber 03,
Chen 02, Orntoft 02, Anderson 97), human pancreas samples (Maziarz 05), murine cell
lines (Lian 02, Baik 05) and yeast (Washburn 03, Gygi 99), indicating that protein
expression is regulated at other levels than transcription. A higher degree of
correspondence is usually found for highly abundant proteins (Celis 00) or for protein
pathways considered as a whole (Washburn 03).
Discrepancies between mRNA and protein levels may be attributed to translational
regulation, mRNA stability, splicing, post-translational processing regulation, protein
degradation, protein turn-over, or a combination of these. The partial analysis of protein
isoforms at protein level is also a technical limitation to correlate both expression levels.
Negative correlation may reflect negative feedback on the mRNA or the protein or the
presence of other regulatory influences not understood currently (Pradet-Balade 01).
All these reasons make hard to predict the overall protein expression based on average
mRNA abundance, and, thus, parallel use of DNA microarrays and proteomics provides
with a powerful strategy to get new insights into mechanisms by which cells regulates
responses to the internal/external environment and to gain a more complete and
biologically meaningful picture of the system under study.
In summary, several proteins appear to be implicated in the presence of sperm
abnormalities and infertility in F1 Senegalese sole. The major affected processes are the
replacement of histones during nuclear condensation, morphogenesis of flagellum,
disruption of actin filaments blood-testis barrier, general impaired cell redox and
energetic state. All this changes can be caused by the lack of proper hormonal
stimulation due to the disruption of the testosterone metabolic pathway.
120

Chapter 3 Effect of hormone treatments in the testis proteome of cultured Solea
senegalensis. Study by 2-D DIGE.

Chapter 3
In a recent work, Agulleiro et al. (2007) demonstrated that the treatment of the
Senegalese sole male with gonadotropin releasing hormone agonist (GnRHa) in
combination with 11-ketoandrostenedione (OA), a precursor of 11-KT, increases the
plasma levels of 11-KT and of the free and sulphated forms of 17,20βP and its
metabolites (see Introduction). This combined hormonal treatment accelerated
spermatogenesis and markedly increased sperm motility, despite the reduction in the
amount of produced milt. Although additional studies are needed to identify the
mechanism of action of sex steroids in the testis of the Senegalese sole, this study
suggests that GnRHa+OA might be employed as a potential hormonal therapy to
ameliorate the reproductive dysfunctions of the captive Senegalese sole male. These
data corroborate the role of 11-KT and its precursor testosterone during
spermatogenesis in the Senegalese sole as suggested from the experimental
observations described in chapter 2.
In collaboration with the group of Dr J. Cerdà, testes from the same animals analyzed in
the study described above were evaluated using two complementary expression
analysis tools: mRNA microarrays and protein 2-D DIGE gels. Both analyses were
performed using the same biological material to provide data without interindividual
variations. These analyses have generated information on the variations at the
proteome and transcriptome level that could be correlated to the mechanisms of sex
steroids and to the physiological changes observed in these animals.
The following chapter is divided in three main parts. The first one is focused on the
suitability of 2-D DIGE technology for the study of differentially expressed proteins in the
testis of Solea senegalensis. As a reference, the F0 samples processed in the previous
chapter by 2-DE with conventional procedures are analysed using the DIGE approach.
In the second part, once analytical conditions were established, the methodology is then
applied to the study of changes of protein levels in testis of the animals treated with
hormones in the above-mentioned study. Finally, genomic and proteomic data are
correlated.
The whole process of microarray analysis was carried out in the transcriptomic platform
of Oryzon Genomics, while the proteomic analyses were performed using the facilities of
the CSIC/UAB Proteomics Laboratory, as described in Materials and Methods (Chapter
3).
121

Chapter 3
3.1 Materials and Methods
3.1.1 Fish hormone treatments
Adult Senegalese soles, F1 generation of 1-1.5 year-old, were reared from eggs
spawned by different stocks of wild fish acclimated to captivity at the facilities of the
“CIFPA-El Toruño” (Puerto de Santa María, Cádiz, Spain). Selected fish were
transported to the “Centre of Aquaculture-IRTA”. During the adaptation period, fish were
fed ad libitum once a day with commercial pellets (Proaqua, Spain) and placed in 1,500 l
circular tanks (density 0.6-0.8 kg m-2) connected to a recirculated water system for the
control of temperature, and maintained at constant photoperiod (13L:11D).
Approximately five months before the hormone treatments were initiated, groups of
males (0.79 ±0.03 kg in weight) were maintained under a controlled temperature regime.
This regime consisted of a progressive decrease of the temperature from 19.5ºC to
8.5ºC, and a further progressive increase up to 19.5-20ºC, so that fish were maintained
below 10ºC for approximately 3 weeks. After this treatment, and when the temperature
of the tanks was stable at 19.5-20ºC for approximately two weeks in March, fish were
treated with a single Ethylene-Vinyl Acetate implant (Mylonas 98) containing saline
(control) or 50 µg kg-1 [D-Ala6, Pro9, Net] GnRHa with or without another implant
containing 7 mg kg-1 OA (Sigma). The males were distributed between six tanks (two
tanks per treatment; three fish per tank).
3.1.2 Biological samples
Testis samples from animals in the F0 functional maturation (F0Mat) group were
prepared as described in chapter 2, and used as a reference of spermatogenesis stage
for wild-caught fish. Testes from 3 individuals of each group of hormonal treatment
(control saline, GnRHa and GnRHa+OA) were obtained after 4 weeks of treatment. Fish
were sacrificed by stunning and decapitation, and the testes were dissected and
weighed, and the GSI was calculated. Testes were divided for further genomic,
122

Chapter 3
proteomic and histological analyses. Samples were frozen in liquid nitrogen and kept at
–80 ºC until processed. Transport of these samples was always done in dry ice.
3.1.3 Histological analysis
A piece of each testis was fixed in modified Bouin solution (75% picric acid, 25%
formaline) for two hours, then dehydrated, embedded in paraplast (Sigma), sectioned at
5 µm and stained with eosin/hematoxilin or methylene blue/azure II/basic fuchsin. The
occurrence of seminiferous lobules, as well as of germinal and somatic cells, in the
cortex of the testis was evaluated by microscopic examination by using a Leica DMLB
light microscope. Sertoli cells, spermatogonia A, spermatogonia B, spermatocytes I,
spermatocytes II, and spermatids were counted in each section. For spermatozoa, the
number of cells per seminiferous tubule was also counted on at least 5 different tubules
in each section.
3.1.4 Determination of sperm density and motility
The amount of milt produced, the sperm density and the sperm motility duration were
determined directly from the testis after fish sacrifice at the end of the hormone
treatment, to avoid stressing the animal. The sperm was collected from the whole dorsal
testis that was two half sectioned and gently pressed; the volume of milt was then
measured by using a micropipette. With this method, milt free of urine could be
obtained, and thus its total amount could be measured more accurately. The sperm
density was determined on 50- to 100-fold diluted milt samples using a haemocytometer
and a Leica DMLB light microscope. The dilution was performed in sperm buffer (150
mM NaCl, 15.2 mM KCl, 1.3 mM CaCl2, 1.6 mM MgCl2, buffered with 5 mM NaHCO3 at
pH 8.2). To measure the sperm motility duration, milt samples were diluted 10-fold in
filtered seawater and immediately monitored at 200x magnification under the
microscope.
The sperm motility duration was defined as the time interval from activation to the
cessation of all spermatozoa movement (Lim 04). The morphology of the spermatozoa
was examined on a sample of milt diluted 1,000-fold with sperm buffer, and the diameter
123

Chapter 3
and length of the head and tail, respectively, were measured by using the image
analysis software AnalySIS (SIS Gmbh).
3.1.5 Protein extraction
Protein for 2-D DIGE purposes was obtained from 3 testes samples of each F0
histological group described in chapter 2 (F0M, F0L and, F0Mat) and from 3 testes
samples of each hormone treatment group (Control, GnRHa, GnRHa+OA). For each of
them, 50 mg of tissue were disrupted mechanically in 400 µl of TNE buffer (50 mM Tris-
HCl pH 7,6; 150 mM NaCl; 2mM EDTA pH 8,0; 1 mM Na3VO4; 1 µM Leupeptin; 2 µM
Pepstatin; 0.1 µM Aprotinin), then sonicated in water bath at 4ºC for 10 min and NP40,
PMSF and DTT were added to achieve 1% v/v, 1 mM and 2 mM, respectively.
Afterwards 100 µl from the resulting sample were processed using the 2-D Clean Up kit
(GE Healthcare) and the precipitated proteins dissolved with 100 µl of 2-D DIGE
labelling buffer (7M urea, 2M thiourea, 4% w/v CHAPS, 30 mM Tris-HCl pH 8,5) at 4ºC
during at least 1 hour. Protein from each dissolved sample was quantified using the
RcDc kit (Bio-Rad).
3.1.6 Two-dimensional DIGE
Three different 2-D DIGE experiments were performed using the samples described
above. First, the labelling process was tested in a self-to-self (S2S) experiment with a
pool composed by the F0M, F0L and F0Mat samples. Second, F0M, F0L and F0Mat
pools were prepared in a similar way to chapter 2. Finally, testis samples from the
hormone treatment experiment and the F0Mat state were analysed together.
In the S2S experiment one pool representing the F0 groups (F0M, F0L and F0Mat) was
used to test Cy-labelling. For each gel, three aliquots of 50 µg of protein from the test
sample was mixed with 1 µl of a solution of 400 pmols/µl of Cy2 in dimethylformamide
(DMF), 1 µl of 400 pmols of Cy3 in DMF, and 1 µl of 400 pmols of Cy5 in DMF,
respectively. Samples were prepared to run two identical DIGE gels. Tubes were
incubated at 4ºC for 30 minutes in darkness. Then 1 µl of 10 mM lysine in water was
added to each tube and incubated at 4ºC in darkness for 10 more minutes. Test
124

Chapter 3
samples labelled with Cy2, Cy3 and Cy5 were mixed. An equal volume of 2x IEF buffer
(7M urea, 2M thiourea, 130 mM DTT, 1% v/v ampholites 3-10 pI (GE Healthcare),
bromophenol blue 0,25% w/v) as the resulting mixture was added. Then, a volume of 1x
IEF buffer (7M urea, 2M thiourea, 65 mM DTT, 0,5% v/v ampholites 3-10 pI (GE
Healthcare), bromophenol blue 0,12% w/v) necessary to achieve 350 µl was added.
Finally HED (DeStreak, GE Healthcare) was added up to 1,2%.
A volume corresponding to 150 µg of protein was loaded into IPGstrips (3-10 L, 18 cm.
GE Healthcare). These IPGstrips were processed in an IPGphor II, equilibrated as
described in chapter 2, and then loaded over a 12% polyacrylamide gel casted in low
fluorescence plates.
Samples were run through the polyacrylamide gels in an Ettan Dalt VI electrophoresis
unit (GE Healthcare) at 20ºC (Hetofrig CB refrigerator, Heto) under standard overnight
conditions (16:30h at 1 W/gel). Gels were then stored at 4ºC until scanning.
Fluorescence images of the gels were acquired on the Typhoon 9400 scanner (GE
Healthcare) in the facilities of the Proteomic Laboratory at the Hospital Vall d’Hebron.
Cy2, Cy3 and Cy5 images were scanned at 488 nm/520 nm, 532 nm/580 nm and 633
nm/670 nm excitation/emission wavelengths, respectively, and at a 100 µm resolution.
Gels were silver stained as described before (Moertz 01) and images acquired in a GS-
800 Calibrated Densitometer (Bio-Rad).
For the second experiment, the F0 pools (F0M, F0L and F0 Mat) used in the S2S
experiment were analysed under an alternative experimental design. Each pool was
labelled separately with Cy3 and Cy5 following the ratio 50 µg protein:400 pmols Cy as
described in the S2S experiment. In parallel, aliquots from each pools were mixed
together to form the Internal Standard (IS). Enough IS sample (150 µg) for three gels
was labelled with Cy2 (labelling ratio 50 µg protein: 400 pmols Cy) as described above.
Samples labelled with Cy2, Cy3 and Cy5 belonging to the same gel were mixed (table
3.1) and processed as described for the S2S experiment. IEF, SDS-PAGE, Typhoon gel
scanning, silver staining and image acquisition were performed as described for the S2S
experiment.
125

Chapter 3
Table 3.1.- Distribution of DIGE evaluation samples in the gels of this experiment.
Gel ID Cy 2 Cy 3 Cy 5
1 St Int F0M r1 F0L r1
2 St Int F0Mat r1 F0M r2
3 St Int F0L r2 F0Mat r2
For the hormone treatment experiment, the analysed samples were the F0Mat testis and
the testis samples of each hormone treatment group (Control, GnRHa, GnRHa+OA).
Samples from each group were pooled and resulting pools were labelled separately with
Cy3 and Cy5 once or twice (table 3.2) following the ratio 50 µg protein:400 pmols Cy as
described in the S2S experiment. Pools were mixed proportionally to form the Internal
Standard (IS). Enough IS sample (300 µg) for six gels was labelled with Cy2 (labelling
ratio 50 µg protein: 400 pmols Cy) as described above. Samples labelled with Cy2, Cy3
and Cy5 belonging to the same gel were mixed (table 3.2) and processed as described
for the S2S experiment. IEF was performed on 24 cm IPGstrips (3-10 L, GE
Healthcare). The IEF conditions, SDS-PAGE, Typhoon gel scanning, silver staining and
image acquisition were performed as described for the S2S experiment.
Table 3.2.- Distribution of hormone treatment samples in the DIGE gels.
Gel ID Cy 2 Cy 3 Cy 5
1 St Int F1 Control r1 F1 GnRHa r1
2 St Int F1 GnRHa+OA r1 F0Mat r1
3 St Int F0Mat r2 F1 Control r2
4 St Int F1 GnRHa r2 F1 GnRHa+OA r2
5 St Int F0Mat r3 F1 GnRHa r3
6 St Int F1 Control r3 F1 GnRHa+OA r3
126

Chapter 3
3.1.7 Differential expression analysis and clustering
Fluorescent images were analysed using the Decyder 6.0 software (GE Healthcare).
This software package includes two main tools: the Differential In-gel Analysis (DIA) and
the Biological Variation Analysis (BVA) modules. The three experiments (S2S, DIGE
evaluation and hormone treatment) were studied separately. In the DIA module spots
were detected using the following settings of slope (S), volume (Vol), and peak height
(PH) for the three different experiments:
1.- S2S: S>2,5, Vol< 2,5e+4 and 145<PH< 37900
2.- DIGE evaluation: S>1,8, Vol< 3,8e+4 and 275<PH< 35900
3.- Hormone treatment: S>1,8, Vol< 4,3e+4 and 360<PH< 38800
In the BVA module, matching was performed using all the fluorescent images included
in each experiment. Matching was further refined manually to ensure good quality
results. The expression data generated for the S2S experiment was extracted with the
XML module and analysed with Excel to determine possible bias derived from different
fluorescence or reactivity of the Cy2, Cy3 or Cy5 dyes.
For the DIGE evaluation and the hormone treatment experiments several comparisons
were carried out using the BVA module to determine spots with different relative levels
(table 3.3). Normalized volume (%Vol) of spots was compared to determine these
differences. This value corresponds to the volume of a certain spot in an image divided
by the summatory of the volumes of all the spots detected in the same image. The
difference between two groups of spots is expressed like in chapter 2 (see page 63).
Determination of the significance of the differences on %Vol between two groups was
performed using the p-value (P) of the Student’s t-test option provided in the Decyder
6.0 package. This P represents the probability of obtaining the observed data if the two
compared groups have the same protein abundance. If P between two groups is 0,01,
the probability of obtaining the observed difference in protein abundance by stochastic
variation is 1%. Only differences with P ≤0.05 (i.e. 95% of probability) were assumed to
be statiscally significant. The value displayed in tables is the probability to obtain the
observed difference not because of stochastic variations [(1-P)*100].
127

Chapter 3
A hierarchical clustering was performed as described in chapter 2, with normalized
volume data for spots present in all gels from the hormone experiment referred to F0Mat
values.
Table 3.3.- Comparisons performed in the BVA module of Decyder for the DIGE
evaluation and the hormone experiments.
EXPERIMENT DIGE evaluation Hormone treatment
1 Mid vs. Late 1 F0 Mat vs. F1 Control
2 Late vs. Mat 2 F0 Mat vs. F1 GnRHa
3 Mid vs. Mat 3 F0 Mat vs. F1 GnRHa+OA
-- ------- 4 F1 Control vs. F1 GnRHa
-- ------- 5 F1 Control vs. F1 GnRHa+OA
Comparison
-- ------- 6 F1 GnRHa vs. F1 GnRHa+OA
3.1.8 Protein identification
Protein identification, bioinformatic analysis of MS/MS spectra and comparison of
sequenced peptides and identified proteins with S. senegalensis ESTs were carried out
following the same procedures described in chapter 2.
3.1.9 Microarray analysis of testis transcriptome in hormone-treated fish.
The mRNA from 3 testis samples for each hormone treatment group (Control, GnRHa,
GnRHa+OA) was extracted using a RNeasy kit (Qiagen) following supplier instructions.
Concentration of total RNA was then measured using a Nano-drop 1000
spectrophotometer (Nanodrop). RNA purity was calculated from the 260/280 nm and
260/230 nm absorbance ratios. RNA integrity was measured using 200 pg of total RNA
in a RNA 6000 Pico LabChip with a Bioanalyzer 2001 (Agilent). Preparation of cDNA
from mRNA was performed using the Message Amp kit II-96 for RNA (Ambion),
following supplier instructions. The resulting double strand cDNA sequences were
labelled with the incorporation of Cy3 or Cy5 nucleotides (Cy3/Cy5-CTP Perkin Elmer)
during an in vitro transcription to cRNA. Labelled cRNA was purified and its quality
128

Chapter 3
checked in the Nanodrop 1000 spectrophotometer and the Bioanalyzer 2001. Samples
from individuals in the same histological state were analyzed in triplicate in a different
array each time. Arrays were DNA 11K-chips (Agilent) composed of the 10,000 S.
senegalensis ESTs generated inside the Pleurogene project as described in chapter 2.
The GnRHa state (Cy3) was compared with the Control state (Cy5) in one triplicate, and
with the GnRHa+OA state in the other triplicate. DNA-cRNA hybridizations were
detected in the DNA microarray scanner (Agilent) using a 10 µm resolution and 30% of
photomultiplier range for red (Cy3: 532 nm/580 nm) and green (Cy5: 633 nm/670 nm)
channels. Data from microarray scans were then obtained using the Feature Extraction
software (Agilent). Statistical analysis of results was made using Polyphemus, a
software developed at Oryzon Genomics. This software first filters the data with values
under background mean plus 3 times its standard deviation. In a second step,
Polyphemus normalizes data to balance possible experimental variability and
fluorescence levels of sample compared in each array. Normalization is performed using
the local regression model LOWES to correct the non linear intensities and increase the
quality of the analysis. This correction is performed thanks to the addition of fluorescent
standard at several intensities in each hybridization assay. Finally, comparisons
between states are performed and array spots with variations higher than three standard
deviations and P ≤0,01 are taken into account to elaborate the biological meaning of the
results.
129

Chapter 3
3.2 Results
3.2.1 Effect of hormone treatments on spermatogenesis
The effect of the GnRHa and GnRHa+OA treatments on spermatogenesis was
evaluated by histological examination of the testis cortex. This region is where the
developing germ cells are located, and holds the seminiferous lobules, opposed to the
medullar region, which contains the efferent duct system that collects and stores the
sperm (figure 3.1; García 05). Fish from all experimental groups showed production of
sperm on day 28 of treatment, although differences in the occurrence of Leydig cells and
in the progression of spermatogenesis were observed. The spermatogenic process
appeared to be stimulated in both treated groups with respect to controls, since the
percentage of spermatogonia B, spermatocytes I and spermatids per seminiferous
tubule in the testis of GnRHa-treated fish were higher than those in the saline-treated
fish. According to the stimulatory effect of GnRHa, the number of spematozoa per
seminiferous tubule was higher in males treated with GnRHa than in control males.
However, fish treated with GnRHa+OA showed the same amount of spermatozoa per
seminiferous tubules as controls, but presenting the most advanced stage of
spermatogenesis of both treatments.
Figure 3.1.- Photomicrographs of histological sections of Senegalese sole testis stained
with methylene blue/azure II/basic fuchsin (A) or hematoxilin and eosin (B). (A) Section
of the cortical area of the testis showing a seminiferous lobule containing spermatogonia
A (Spg A), spermatogonia B (Spg B), spermatocytes I (Spc I), spermatids (Spd) and
spermatozoa (Spz). Sertoli (Sc) and Leydig cells (Lc) adjacent to the lobules are also
indicated. (B) Section of the medullar area of the testis in which efferent tubules filled
with Spd and Spz can be observed.
130

Chapter 3
3.2.2 Determination of GSI, sperm density and motility
Following the fish sacrifice and the removal of the testis from each male at the end of
the experiment, the GSI and the production of milt by each group was evaluated (figure
3.2, Annex III.1). The analysis revealed that the GSI values remained similar before and
after the experiment. Regarding to milt production, the treatment with GnRHa alone
increased significantly the volume produced with respect to the control males. Since
there were no differences in the density of the sperm between the different treatments,
the production of spermatozoa by this group appeared to be increased, in agreement
with the histological results. In contrast, males implanted with GnRHa+OA present
volumes of milt in the testis not significantly different from controls. However,
determination of spermatozoa motility after its activation in seawater revealed that
GnRHa+OA-treated males produced spermatozoa that were approximately twice more
motile than those produced by the control and GnRHa-treated males, while there were
no differences in the diameter and length of the head and tail, respectively, of the
spermatozoa produced by the different groups.
3.2.3 Two-dimensional DIGE: self-to-self analysis
Two gels were performed with a pool sample representing the three F0 groups (figure
3.3). This pool sample was labelled separately with Cy2, Cy3 and Cy5, mixed and
processed in a 2-D gel. For each spot, the normalized volumes of the signals from the
different fluorochrome emitters were measured. A mean value of the normalized volume
(%Vol) for each spot-emitter was calculated from these two gels. Finally, a linear
regression analysis was used to determine the analytical bias. The r factor for the three
comparisons (Cy2/Cy3, Cy3/Cy5 and Cy2/Cy5) was ≥ 0,99, indicating a good correlation
between normalized %Vol of the spots labelled with Cy2, 3 and 5 (figure 3.4). Similar
studies for silver stained gels are already available in the literature, resulting in
correlation values between 0,98 and 0,96 (Quero 04, López 01).
Therefore, the set-up labelling procedure was able to label the same sample in rather
identical grades with the three different cyanines. Observed variations in further
expression analysis should not be produced by the labelling procedure.
131
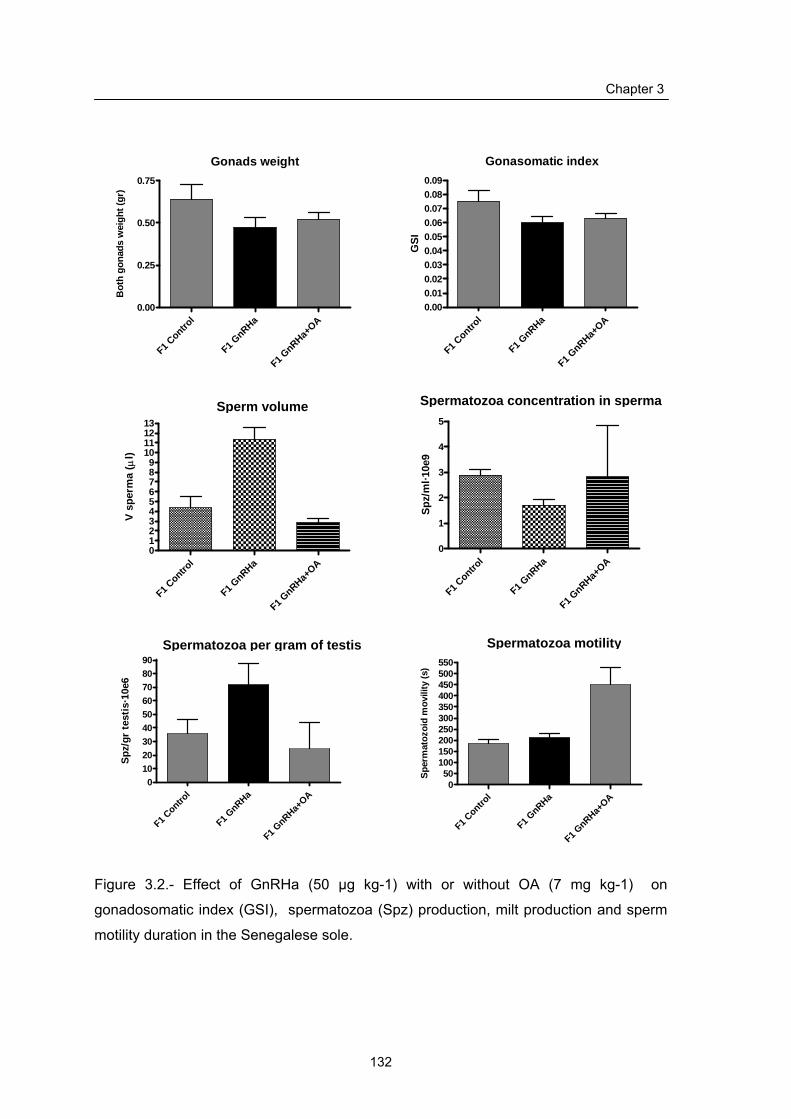
Chapter 3
Gonads weight
F1 Contro
l
F1 GnRHa
F1 GnRHa+
OA0.00
0.25
0.50
0.75
Bot
h go
nads
wei
ght (
gr)
Gonasomatic index
F1 Contro
l
F1 GnRHa
F1 GnRHa+
OA0.000.010.020.030.040.050.060.070.080.09
GSI
Sperma volume
F1 Contro
l
F1 GnRHa
F1 GnRHa+
OA0123456789
10111213
V sp
erm
a ( µ
l)
Spermatozoids concentration in sperma
F1 Contro
l
F1 GnRHa
F1 GnRHa+
OA0
1
2
3
4
5Sp
z/m
l·10e
9
Spermatozoids per gram of testis
F1 Contro
l
F1 GnRHa
F1 GnRHa+
OA0
102030405060708090
Spermatozoid Movility
F1 Contro
l
F1 GnRHa
F1 GnRHa+
OA0
50100150200250300350400450500550
Sper
mat
ozoi
d m
ovili
ty (s
)
Spermatozoa concentration in sperma
Spermatozoa per gram of testis Spermatozoa motility
Sperm volume
Spz/
gr te
stis
·10e
6
Figure 3.2.- Effect of GnRHa (50 µg kg-1) with or without OA (7 mg kg-1) on
gonadosomatic index (GSI), spermatozoa (Spz) production, milt production and sperm
motility duration in the Senegalese sole.
132

133
Chapter 3
Figure 3.3.- Gels analysed in the S2S experiment (pI range 3-10 L and Mr range 150-10
kDa). In the left side, the total fluorescence image (Cy2+Cy3+Cy5) acquired in the
Typhoon scanner (GE Healthcare). In the right side, image of the silver stained gel
obtained in the GS800 densitometer (BioRad).
kDa
37
50
25
15
70
100
kDa
37
50
25
15
70
100
pI 103 pI 103
pI 3 10 3 pI 10

Chapter 3
Signal linearity Cy3 vs Cy5 y = 0,9283x + 0,0892
R2 = 0,9817
0
5
10
15
20
25
30
35
40
45
50
0 5 10 15 20 25 30 35 40 45 50
Norm Vol Cy3
Norm
Vol
Cy5
Figure 3.4.- Determination of labelling linearity. The figure compares the normalized
volume of spots from the same protein sample of Senegalese sole testis labelled with
Cy3 and Cy5. For the other comparisons the regression curve is y=1,1x-0,24 and r=0,99
(Cy2-Cy3) and y=1,0x-0,15 and r=0,99 (Cy2-Cy5).
3.2.4 Two-dimensional DIGE: evaluation experiment
Three gels were performed with the sample distribution described in table 3.1. The
number of spots detected was 1555, 1782 and 1597 for gel 1, gel 2 and gel 3,
respectively (figure 3.5). The number of spots matched between all three gels was 1183.
Expression differences between samples were determined using the Decyder 6.0
statistical package. Three comparisons were performed between states, resulting in 15
spots with differential levels in at least one comparison with a minimum variation of ±1,4
and a confidence ≥95% (table 3.4, figure 3.6). Eleven proteins were unambiguously
identified using de novo sequencing of tryptic peptides and BLAST analysis of candidate
sequences. In one case the spot was assigned to 2 different proteins, another spot
identification was not possible although three peptides were sequenced, and two spots
were analysed without results because of the low amount of material present in the
sample (table 3.5).
134

135
Figure 3.5.- Gels analysed in the DIGE evaluation experiment (pI range 3-10 L and Mr
range 150-10 kDa). In the left side, the total fluorescence image (Cy2+Cy3+Cy5)
acquired in the Typhoon scanner (GE Healthcare). In the right side, image of the silver
stained gel obtained in the GS800 densitometer (BioRad).
kDa
Gel 3
Gel 1
Gel 2

Chapter 3
Resulting proteins were compared with the list of proteins from the experiment in
chapter 2 with silver stained gels. Differential proteins identified as carbonic anhydrase
(1403-DIGE) and as a mixture of carbonic anhydrase and apolipoprotein AI (1400-DIGE)
were also characterized in the 2-DE expression analysis in chapter 2 (spots 2578-silver
and 3649-silver, respectively). Protein profile between studied states (F0 Mid, F0 Late
and F0 Functional maturation) in spot 1403-DIGE was very similar to the expression
profile in spot 2578-silver. The profile of variations among the three states is slightly
different for the pair of spots 1400-DIGE:3649-silver (figure 3.7). This difference
between abundance profiles was probably a consequence of the mixture of proteins
underneath this spot in the DIGE analysis.
3 pI 10
kDa
70
100
50
37
25
15
Figure 3.6.- Differentially expressed spots in the DIGE evaluation experiment excised
from gel 2. Gel range: pI 3-10L, Mr 150-10 kDa.
136

Chapter 3
F0 M
at
F0 M
id
F0 L
ate
F0 M
at
Stan
dard
ized
Abu
ndan
ce
1.35
1.3
1.25
1.2
1.15
1.1
1.05
1
0.95
0.9
0.85
0.8
0.75
F0 M
at
F0 M
id
F0 L
ate
F0 M
at
Figure 3.7.- Protein profile of coincident spots between 2-D DIGE and 2-D Silver-stained
gels in the differential expression analysis of F0 Mid, F0 Late and F0 Functional
maturation spermatogenesis stages in S. senegalensis (1403-DIGE with 2578-silver;
1400-DIGE with 3649-silver).
Stan
dard
ized
Abu
ndan
1.35
1.3
1.25
1.2
1.15
1.1
1.05
1
0.95
0.9
0.85
0.8
1400 DIGE
F0 M
id
F0 L
ate
F0 M
at
0.00
0.15
0.30
0.45
0.60
F0 M
id
F0 L
ate
F0 M
at
0.00
0.05
0.10
0.15
0.20
1403 DIGE
3649 Silver 2578 Silver
F0 M
id
F0 L
ate
F0 M
at
F0 L
ate
F0 M
at
F0 L
ate
F0 M
at
F0 M
id
F0 L
ate
F0 M
at
F0 L
ate
F0 M
at
F0 M
id
F0 L
ate
F0 M
at
F0 M
id
F0 L
ate
F0 M
at
F0 L
ate
F0 M
at
F0 L
ate
F0 M
at
F0 M
id
F0 L
ate
F0 M
at
F0 L
ate
F0 M
at
F0 L
ate
F0 M
at
F0 M
id
F0 L
ate
F0 M
at
F0 L
ate
F0 M
at
F0 M
id
F0 L
ate
F0 M
at
F0 M
id
F0 L
ate
F0 M
at
F0 L
ate
F0 M
at
F0 L
ate
F0 M
at
ce
137

Table 3.4.- Expression changes for the differential spots detected by 2-D DIGE in the analysis of sole testis. p>: probability in percentage
of obtaining the observed difference not because of stochastic variation (only probabilities >95% are described) ∆: variation values.
Variation was calculated as vali/valj where vali=max (val1, val2) and valj=min (val1, val2). Variation is indicated as a positive value in
case of overexpression and as a negative value in case of subexpression.
Comparison L/M Mat/L Mat/M Spot ID Acc Num Prot ID
p > (%) ∆ p > (%) ∆ p > (%) ∆ 241 gi|6959826 Transferrin 98,1 -1,42 ---- 1,04 97,9 -1,36
340 gi|47223919 Complement C3 99,59 -1,53 98,8 1,47 ---- -1,04
401 gi|31872040 Transketolasa 98,5 1,45 99,23 -1,72 ---- -1,18 474 gi|37681753 Chaperonin containing TCP1 96,4 1,41 ---- -1,30 ---- 1,08 503 gi|41053915 Ubiquitin specific protease 14 ---- 1,05 94,8 -1,48 97 -1,41 524 No ID 97,7 -1,28 99,9 1,42 ---- 1,11
839 gi|47210587 GDP-dissociation inhibitor ---- 1,22 97,7 -1,41 ---- -1,16 874 gi|22671694 Aldolase C ---- -1,43 1,00 99,86 -1,42
1217 gi|47221006 Calponin C 91,7 -1,26 96,5 1,41 ---- 1,12
1400 gi|56554783/gi|60417202
Carbonic anhydrase/ Apoliprotein AI 99,5 -1,7 ---- 1,38 ---- -1,23
1403 gi|56554783 Carbonic anhydrase 99,95 -1,77 ---- 1,36 ---- -1,30 1448 gi|55251222 Peroxiredoxin 6 ---- 1,20 96,2 -1,57 ---- -1,31 1458 No ID 98,9 1,20 99,6 -1,4 98,8 -1,17 1475 No ID ---- -1,25 ---- -1,24 99,66 -1,56 1770 gi|22002420 Alpha type globin 99,46 -1,6 98,3 1,69 ---- 1,06
138

Table 3.5.- Protein identification by de novo sequencing of the 2-D DIGE differential spots detected in the analysis of sole testis (see table
3.4). nESI-MS/MS: Peptide sequences obtained from de novo sequencing of nESI-MS/MS data from trypsin digested spots (table 4) are
displayed in two columns depending on the software used (Peaks 2.4 or Lutefisk 97). For Peaks characters, colours indicate probability
(%) of the corresponding residue to be correct. (Red = 99-80%; Blue= 79-60%; Cyan= 59-40%; Black=<40%). Brackets in Lutefisk 97
column contain the mass in Da not assigned to any sequence. Rank-Score for Lutefisk97 indicates position of the candidate sequence
within any individual de novo sequencing search and the probability of this sequence to be correct (values from 1 to 0, where 1 is
maximum probability). PROTEIN ID: NCBI access number and name of the protein that was identified with each sequence using BLAST
search for short nearly exact sequences.
nESI-MS/MS PROTEIN ID Peaks 2.4 Lutefisk 97 Spot
ID Sequence Score % Sequence Rank-Score NCBI Name
(CamC)DGYNGAFR 68 [276.1]GYNGAFR 1 0.289 gi|6959826 Transferrin YLNLVQSLK 53 YLNLVKSLK 2 0.970
SAGFPLNAVGR 47 [158.0]GWNLPMGR 1 0.929
LLNWQGSDVSR 44 LLNWKGSDVSR 1 0.970
SSPAGPV(CamC)SAFEK 79 [174.0]PAGPVCSKFAK 1 0.582 QPWAQNLLADDYR 36 [225.2]WAKNLLADDYR 1 0.970
DSGL(CamC)EL(CamC)TGD(CamC)SK 59 SDGLCELCTGDCSK 1 0.923 gi|6959826 Transferrin RF(CamC)AFNPAAGVLDVR 99 [273.1]DLVGAAPNFACER 1 0.970
EDQTAMT(CamC)NLAKVAPHAVEAR 49 [158.0]TMRETCNPSKVPAHAV[200.0]R 1 0.392 gi|6959826 Transferrin
241
ELSLLLNSLNAVENFNLFG(CamC)R 26 [228.0]YYNNSLNAVENFNLF[217.0]R 1 0.532 gi|6136041 Transferrin
(CamC)GLRAAASK 71 AYDDHRR 1 0.435 340
M(CamC)VYLQAQFPDR 26 MCVYLKAKFS[281.2] 4 0.605 gi|47223919 Complement C3
(CamC)MTKENGELVDRDFVK 99 MLFKENDANGRAF[271.1]R 1 0.348 401
SPPT(CamC)TLFYPSDRMWR 69 [202.0]VGERLFYPSDRSTER 1 0.488 gi|31872040 Transketolase
139

Table 3.5 (continuation).- De novo peptide sequencing for protein identification in the set up of DIGE approach for the analysis of sole testis proteome.
nESI-MS/MS PROTEIN ID Peaks 2.4 Lutefisk 97 Spot
ID Sequence Score % Sequence Rank-Score
NCBI Name
WVGGPELELLALATNR 97 WVGGPELELLALATNR 3 0.970 gi|37681753 Chaperonin containing
TCP1 FQNGWGSAGLSGWGDKK 24 FKNGWGSLMDLRNTR 1 0.762
ALETFPFDPNNTESLHK 94 [313.0]TFPFDPNNTE[210.2]VR 1 0.739 gi|37681753 Chaperonin containing
TCP1 474
NTYPSSNSSYGSNGSYGSGWRR 14 [403.2]GLSGYSGGGSGYSSNSGT[386.1] 1 0.209
LPAYLTVQMVR 50 LPAYAKLKMVR 1 0.435 gi|41053915 Ubiquitin specific protease
14
DDRQETGVKPDR 75 [198.1]LFANTGVK[211.1]R 3 0.504 503
SSTNGWGSLQSGWYHK 50 [226.1]YGWGTVKSGRAMVR 1 0.539
DNKARLYPR 50 DFMHATAE[210.2] 1 0.257 T(CamC)QDPANGDQNK 29 [261.1]KDYFDRSR 1 0.428 524
TTLVNAASMDANVLR 50 MLMYPYTR 97 MLLLTKVTR 1 0.923
TTESSASGTREGK 23 [202.0]MSSAEPGVFGK 1 0.342
LQL(CamC)DSPYAPDR 28 KLLCDPSYALVR 1 0.933 gi|47210587 GDP-dissociation inhibitor
MTGSDFDFGEMER 49 MTGSDFDEFGMATL 1 0.970 gi|47210587 GDP-dissociation inhibitor
DMTVSDLYEPTDR 74 [246.0]TVSDLYEPTDR 1 0.730 gi|47210587 GDP-dissociation inhibitor
TDDYLDQP(CamC)LDTLNR 88 [331.1]YLDKPCLDTLNR 1 0.970 gi|47210587 GDP-dissociation inhibitor
839
SPYLYPLYGLGELPKFKR 24 [232.0]NNYPLYGLGELHYEAR 2 0.719 gi|47210587 GDP-dissociation inhibitor QLLFTADKR 17 [258.0]PFTANER 1 0.339 gi|22671694 Aldolase C
SPQASALNAWR 17 [184.1]VVSALNAWR 2 0.470 Aldolase C GSHQYPALTPEQK 51 Aldolase C
MMGPTPSELALLENANVLAR 32 [279.1]HTPSELALLENANVLAR 3 0.970 Aldolase C
874
RVPLAGTDGETTTQGLDGLSER 38 N[158.0]S[202.0]NLGKTTTEGDTGA[291.0]R 1 0.608 Aldolase C AAELGGKPPR 99 [188.0]TTYGLPR 1 0.755
AAVAFGLTGEVK 75 SGPAFGLSAEVK 1 0.970 gi|47221006 Calponin 1 1217 MFHDPVDKSTLSLQMDER 14 [260.0]RNPVDAGSTLSLKM[244.0]R 1 0.805
140

Table 3.5 (continuation).- De novo peptide sequencing for protein identification in the set up of DIGE approach for the analysis of sole testis proteome.
nESI-MS/MS PROTEIN ID Peaks 2.4 Lutefisk 97 Spot
ID Sequence Score
% Sequence Rank-Score NCBI Name
LLDAFDSLK 98% LLDAFDSLK 1 0.970 WVANFPLADGPR 73% SVVANFPLADGPR 1 0.970 gi|56554783 Carbonic anhydrase
LDDMVNQLESLR 50% [228.0]DMVNGALESLR 1 0.970
KWW(CamC)EHSPLDLVHHMFYHGVLYWR 17% [469.3]SKMGNKASLYPPNTKPSKFNVGHPK 1 0.329 NNGKADVPAP(CamC)KHVR 99% [171.0]NKADVPAPCKHVR 1 0.756
DPTASLDDVENPLGYK 67% 241.2]AASNDDVELPLGYK 4 0.642
GRTPVTDSVVTTLAEATAELR 17% [201.0]LPVTDWVTTLAEATAELR 1 0.970 gi|60417202 Apolipoprotein AI
precursor YVYDLVPWASDYE(CamC)LDMMK 49%
1400
WVANFPLADGPR 82% SVVANFPLADGPR 1 0.970 gi|56554783 Carbonic anhydrase
G(CamC)YYLVPWATT(CamC)PPPNDVYK 30% [408.2]NLHRCTTALLGVLD[253.2]R 1 0.258 RDMEEAEEE(CamC)(CamC)MMDNYRQTFRK gi|56554783 Carbonic anhydrase
1403
YDWRG(CamC)DDLLLGYREHETMDDNDSSTLTDGH(CamC)WYK gi|56554783 Carbonic anhydrase
SSSDLELR 27 NFDLELR 1 0.372
YLYGKGAR 52 YLYKGGAR 5 0.634 LSLLYGDPWK 31 [199.1]LLYPATTGR 1 0.661 Peroxiredoxin 6
1448
MHLLGDVFPNPFVDGYRR 99 [267.2]LLGDVFPNFEADTTLGR 2 0.970 gi|55251222 Peroxiredoxin 6 LQVDYDPPK 38 LKVDNNPFK 1 0.970
FLQNVALALSEK 99 FLKNVALALSKE 1 0.970 gi|22002420 Alpha type globin MMTPEVKVSVDK 84 DFTPEVKVSVDK 3 0.970
SSGLAEAGLLDSHQK 99% [184.1]LNSDLLGAEALGR 1 0.970 LLSHSLQLVLAMYYPK 74 LLSHSLKLVLAMYYPK 2 0.970
ALWAVEGLDDLKLNLSR 20 [184.1]WAVEGLDDLKLNLSR 1 0.970
1770
YTFSHWSDLSPTSEVKK 54% TYFSHWSDLSPTSEKVK 1 0.970 gi|22002420 Alpha type globin
141

Chapter 3
3.2.5 Two-dimensional DIGE and clustering: hormone treatments analysis.
Six gels were performed with the sample distribution described in table 3.2. The number
of spots detected was 1596, 1564, 1586, 1453, 1475 and 1412, from gel 1 to 6,
respectively (figures 3.8 and 3.9). The number of spots matched between all six gels
was 1014. Expression differences between samples were determined using the
statistical package in Decyder 6.0. Six comparisons were performed between states and
fifty-nine spots were selected. Only the 691 spots present in all images were taken into
account. These spots were differently expressed in at least one comparison with a
minimum average variation of ±1,7 and a confidence value ≥ 95% (figures 3.10 and
3.11; table 3.6). Spots were classified by similarity on their protein levels profile, similar
to chapter 2 (page 83).
Less than 40 out of the 691 spots (5%) present in all images of the hormone treatment
analysis showed variations over ±2 in the comparisons performed between the analyzed
states. This percentage increased to 12% when minimum variation was ±1,6. These
figures indicate the range of spots with differential levels expected to be observed using
a DIGE approach when studying the testis proteome of S. senegalensis under the
studied hormone treatments.
For 2-DE analysis in chapter 2, about 65 out of the 489 spots (13%) present in all gels
showed variations over ±3. This percentage increased to 20% when minimum variation
changes to ±2,5. Comparing the values obtained for 2-DE and DIGE experiments, spots
changing ±1,6 times represents around the 50% of the total spots, for only 12% in the
DIGE approach. Therefore, using DIGE better than a silver-based protein detection
method allowed observing smaller variations in gel-based differential expression
analysis.
142
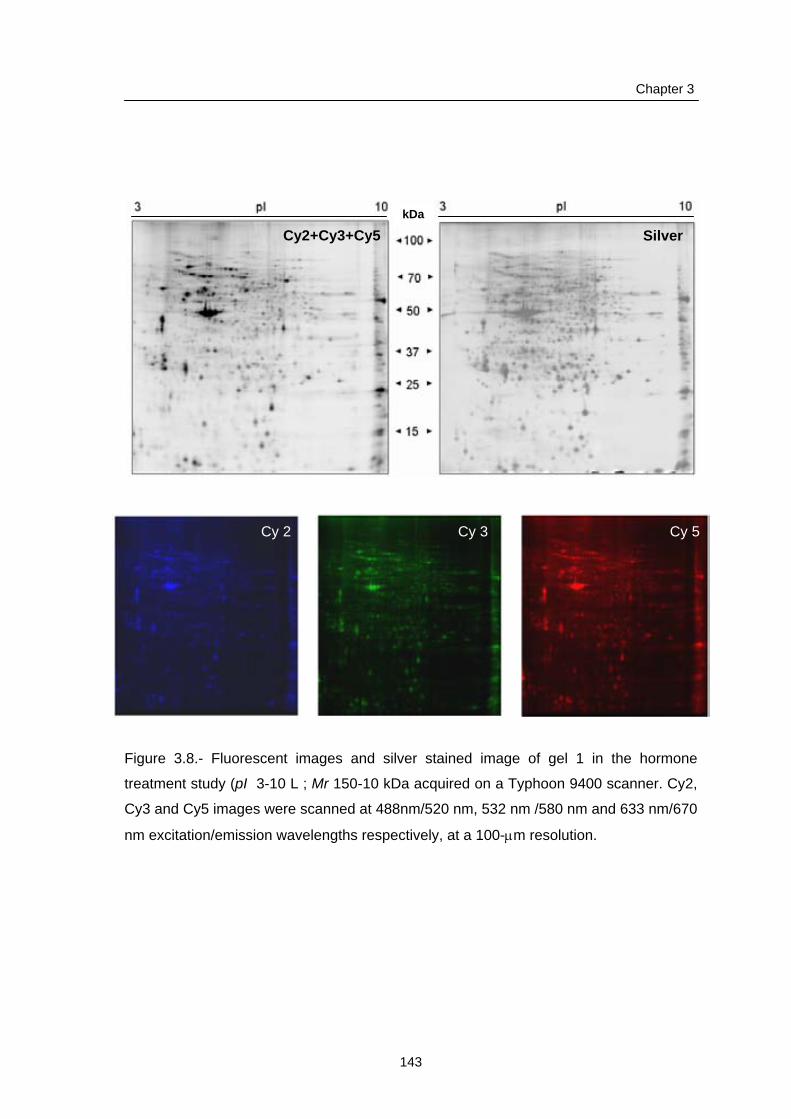
143
Chapter 3
Figure 3.8.- Fluorescent images and silver stained image of gel 1 in the hormone
treatment study (pI 3-10 L ; Mr 150-10 kDa acquired on a Typhoon 9400 scanner. Cy2,
Cy3 and Cy5 images were scanned at 488nm/520 nm, 532 nm /580 nm and 633 nm/670
nm excitation/emission wavelengths respectively, at a 100-µm resolution.
Cy2+Cy3+Cy5
Cy 2 Cy 3 Cy 5
Silver kDa

Chapter 3
Gel 2
Gel 4
Gel 5
Gel 4
kDa
Figure 3.9.- Gels 2, 4 and 5 analysed as part of the hormone effect studies (pI 3-10 L;
Mr 150-10 kDa). In the left side, the total fluorescence image, and in the right side the
image of the silver stained gel obtained in the GS-800 densitometer.
144

Chapter 3
70
100
50
37
25
15
70
100
50
37
25
15
3 pI 10
kDa
Figure 3.10.- Differentially expressed spots in the hormone treatment study excised from
gel 1 (up) and 2 (down). Gel range: pI 3-10L, Mr 150-10 kDa.
145

146
Table 3.6.- Protein level changes for the spots submitted to identification in the analysis of hormone effect over testis proteome. p>: probability in percentage of obtaining the observed difference not because of stochastic variation (only cases with probabilities >95% are
shown) ∆: variation values. Variation was calculated as vali/valj where vali=max (val1, val2) and valj=min (val1, val2). Variation is
indicated as a positive value in case of overexpression and as a negative value in case of subexpression.
Comparison
F0Mat-F1C F0Mat-
F1GnRHa F0Mat-
F1GnRHa+OA F1C-F1GnRHa F1C-
F1GnRHa+OA F1GnRHa-
F1GnRHa+OA Spot
ID NCBI Prot ID p > (%) ∆
p > (%) ∆
p > (%) ∆
p > (%) ∆
p > (%) ∆
p > (%) ∆
231 No ID 99,99 -1,66 99,9 -1,48 99,99 -3,27 ---- 1,12 99,99 -1,96 99,99 -2,21 240 gi|47224921 Alpha-2-macroglobulin-1 99,99 -2 99,9 -1,45 99,99 -2,53 99,7 1,38 97,5 -1,27 99,9 -1,74 250 gi|47224921 Alpha-2-macroglobulin-1 99,99 -2,27 99,99 -1,48 99,99 -2,22 99,99 1,53 ---- 1,02 99,99 -1,5 253 gi|47224921 Alpha-2-macroglobulin-1 99,99 -2,72 99,99 -1,71 99,99 -2,14 99,9 1,59 99,3 1,27 99,7 -1,25 261 gi|47224921 Alpha-2-macroglobulin-1 99,99 -2,8 99,99 -1,9 99,99 -2,15 98,7 1,48 97,5 1,3 ---- -1,13 263 gi|47224921 Alpha-2-macroglobulin-1 99,40 -1,50 99,8 -1,82 99,8 -2,5 95,1 -1,21 99,0 -1,67 ---- -1,37 265 gi|47224921 Alpha-2-macroglobulin-1 ---- -1,1 ---- 1,25 99,5 -1,66 98,4 1,37 99,6 -1,52 99,9 -2,08 267 gi|47224921 Alpha-2-macroglobulin-1 ---- 1,04 98,0 1,58 99,99 -1,79 97,6 1,52 99,99 -1,85 99,9 -2,82 277 gi|47224921 Alpha-2-macroglobulin-1 95,0 -1,14 98,9 1,31 99,99 -1,9 99,9 1,5 99,99 -1,66 99,99 -2,5 284 gi|47224921 Alpha-2-macroglobulin-1 97,2 -1,91 ---- -1,34 99,1 -2,34 98,4 1,42 95,5 -1,23 99,9 -1,75 298 gi|31323728 Chaperone protein GP96 99,9 1,55 96,1 -1,39 97,5 -1,51 99,6 -2,15 99,6 -2,34 ---- -1,09 424 gi|74096001 Hemopexin 99,98 -1,98 ---- -1,02 99,99 -1,64 99,99 1,94 98,9 1,21 99,99 -1,61 431 gi|74096001 Hemopexin 99,98 -2,15 ---- -1,16 99,9 -1,67 99,99 1,85 99,5 1,29 99,9 -1,44 438 gi|74096001 Hemopexin 99,99 -2,07 99,6 -1,28 99,99 -1,57 99,99 1,61 99,9 1,32 99,9 -1,22 439 No ID 99,96 -1,96 98,9 -1,39 99,7 -1,56 99,8 1,4 99,4 1,25 87,0 -1,12 509 No ID 96,1 -2,14 ---- -1,61 97,1 -2,11 ---- 1,33 ---- 1,02 76,0 -1,31 531 gi|74096001 Hemopexin 99,95 -1,40 99,8 -1,41 99,7 1,23 ---- -1,01 99,99 1,72 99,99 1,73 540 gi|59710087 Keratin 95,4 -1,13 95,5 1,3 99,8 2,28 98,9 1,46 99,9 2,56 98,5 1,75 541 gi|59710087 Keratin ---- -1,01 ---- 1,21 99,99 3,19 98,2 1,23 99,99 3,23 99,99 2,63

147
Table 3.6 (continuation).- Protein level changes for the spots submitted to identification in the analysis of hormone effect over testis proteome. Comparison
F0Mat-F1C F0Mat-
F1GnRHa F0Mat-
F1GnRHa+OA F1C-F1GnRHa F1C-
F1GnRHa+OA F1GnRHa-
F1GnRHa+OA Spot
ID NCBI Prot ID p > (%) ∆
p > (%) ∆
p > (%) ∆
p > (%) ∆
p > (%) ∆
p > (%) ∆
581 gi|59710087 Keratin 99,93 -1,41 ---- -1,11 99,9 1,62 97,6 1,27 99,99 2,29 99,8 1,81
801 gi|37362196 Cytosolic non-specific dipeptidase ---- 1,00 99,4 -1,32 99,9 1,38 99,8 -1,33 99,99 1,38 99,99 1,83
808 No ID 99,3 -1,54 96,2 -1,21 98,8 1,29 94,8 1,28 99,9 2 99,7 1,56 851a gi|47218629 ATP synthase β-subunit 99,8 -1,84 99,7 -1,67 99,3 -1,59 ---- 1,1 ---- 1,16 ---- 1,06 851b gi|47218629 ATP synthase β-subunit ---- -1,08 97,3 -1,18 ---- -1,08 95,1 -1,09 ---- 1,01 98,0 1,1 932 No ID ---- 1,11 99,6 -1,44 99,9 -1,85 99,8 -1,59 99,99 -2,04 96,1 -1,28
1017 gi|61403546 3-hydroxyisobutyryl-Coenzyme A hydrolase ---- -1,09 99,0 1,39 99,7 -1,91 98,8 1,52 99,1 -1,74 99,9 -2,65
1018 No ID ---- -1,89 ---- 1,13 ---- 1,09 96,3 2,13 97,2 2,06 12,0 -1,03 1030 gi|47212109 Keratin 18 99,5 -1,25 ---- -1,1 99,99 1,72 95,0 1,14 99,99 2,15 99,99 1,89 1031 gi|47212109 Keratin 18 99,9 -1,41 95,6 -1,12 99,9 1,48 99,9 1,26 99,99 2,08 99,99 1,66
1032 gi|54035446 Proteasome 26S subunit ATPase 6 99,9 1,53 ---- -1,23 98,2 -1,4 99,6 -1,88 99,9 -2,15 64,0 -1,14
1102 gi|56718619 Glyceraldehyde 3-phosphate dehydrogenase 99,89 -2,97 99,5 -2,67 99,8 -2,72 ---- 1,11 ---- 1,09 2,0 -1,02
1106 gi|37682099 Keratin 8 99,0 -3,41 99,9 -2,88 99,99 -4,08 ---- 1,19 ---- -1,2 86,0 -1,42 1112 No ID 99,96 -2,23 99,0 -1,52 99,6 -1,55 98,9 1,47 99,6 1,44 13,0 -1,02 1116 No ID ---- 1,00 98,3 -1,76 99,7 -1,83 98,1 -1,75 99,7 -1,82 9,0 -1,04 1119 gi|28557116 Tropomyosin 98,9 -1,18 99,99 1,84 99,9 1,49 99,99 2,17 99,99 1,76 99,6 -1,23 1123 gi|47213546 Keratin S8 type I 99,99 -3,29 99,99 -1,77 99,99 -2,07 99,99 1,85 99,99 1,59 99,9 -1,17 1134 gi|47216949 Annexin A3 ---- -1,02 ---- 1,15 99,99 -1,6 ---- 1,17 99,99 -1,57 99,9 -1,84 1139 gi|74310597| NADH dehydrogenase 5 97,6 1,63 98,3 1,73 ---- -1,15 95,8 1,06 99,9 -1,87 99,9 -1,99 1146 gi|66792936 Tropomyosin 4 isoform 1 99,99 -1,53 99,99 1,29 ---- 1,03 99,99 1,97 99,99 1,58 99,9 -1,25 1147 gi|74136103 Tropomyosin 2 99,98 -1,74 99,7 1,26 ---- 1,07 99,99 2,2 99,99 1,86 98,9 -1,18 1153 No ID ---- -1,26 ---- -1,32 99,3 2,05 ---- -1,05 99,9 2,58 99,99 2,7
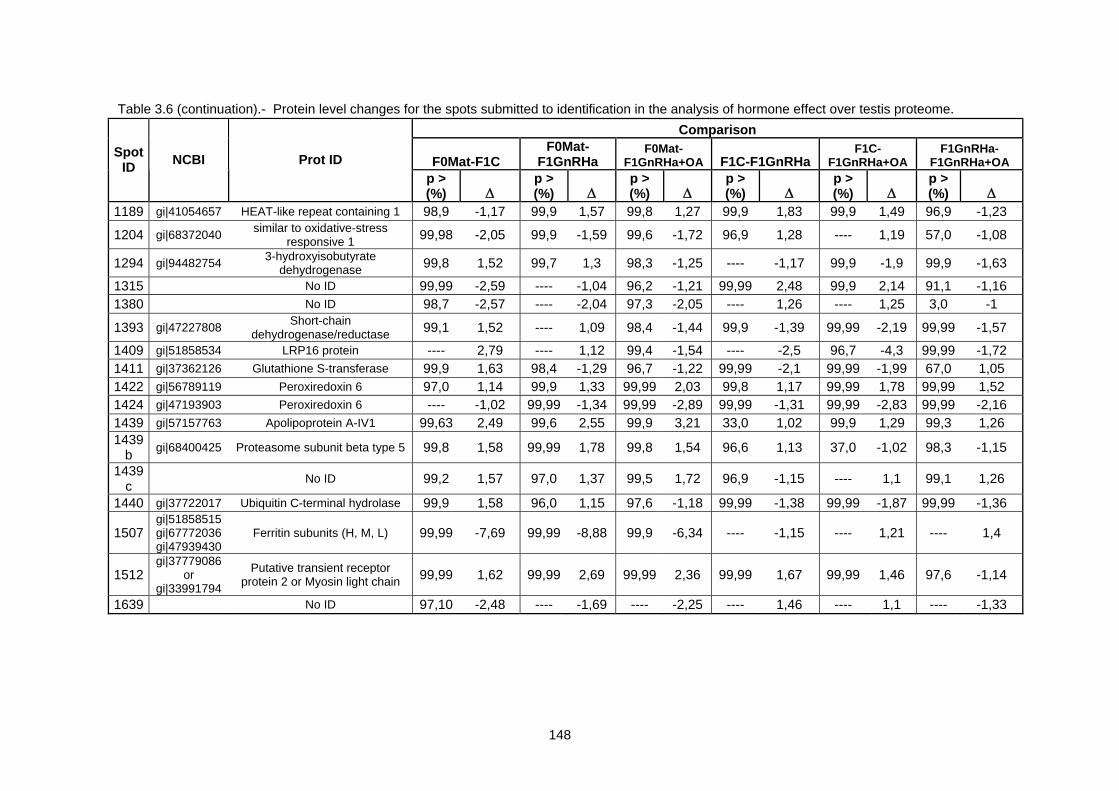
148
Table 3.6 (continuation).- Protein level changes for the spots submitted to identification in the analysis of hormone effect over testis proteome. Comparison
F0Mat-F1C F0Mat-
F1GnRHa F0Mat-
F1GnRHa+OA F1C-F1GnRHa F1C-
F1GnRHa+OA F1GnRHa-
F1GnRHa+OA Spot
ID NCBI Prot ID p > (%) ∆
p > (%) ∆
p > (%) ∆
p > (%) ∆
p > (%) ∆
p > (%) ∆
1189 gi|41054657 HEAT-like repeat containing 1 98,9 -1,17 99,9 1,57 99,8 1,27 99,9 1,83 99,9 1,49 96,9 -1,23
1204 gi|68372040 similar to oxidative-stress responsive 1 99,98 -2,05 99,9 -1,59 99,6 -1,72 96,9 1,28 ---- 1,19 57,0 -1,08
1294 gi|94482754 3-hydroxyisobutyrate dehydrogenase 99,8 1,52 99,7 1,3 98,3 -1,25 ---- -1,17 99,9 -1,9 99,9 -1,63
1315 No ID 99,99 -2,59 ---- -1,04 96,2 -1,21 99,99 2,48 99,9 2,14 91,1 -1,16 1380 No ID 98,7 -2,57 ---- -2,04 97,3 -2,05 ---- 1,26 ---- 1,25 3,0 -1
1393 gi|47227808 Short-chain dehydrogenase/reductase 99,1 1,52 ---- 1,09 98,4 -1,44 99,9 -1,39 99,99 -2,19 99,99 -1,57
1409 gi|51858534 LRP16 protein ---- 2,79 ---- 1,12 99,4 -1,54 ---- -2,5 96,7 -4,3 99,99 -1,72 1411 gi|37362126 Glutathione S-transferase 99,9 1,63 98,4 -1,29 96,7 -1,22 99,99 -2,1 99,99 -1,99 67,0 1,05 1422 gi|56789119 Peroxiredoxin 6 97,0 1,14 99,9 1,33 99,99 2,03 99,8 1,17 99,99 1,78 99,99 1,52 1424 gi|47193903 Peroxiredoxin 6 ---- -1,02 99,99 -1,34 99,99 -2,89 99,99 -1,31 99,99 -2,83 99,99 -2,16 1439 gi|57157763 Apolipoprotein A-IV1 99,63 2,49 99,6 2,55 99,9 3,21 33,0 1,02 99,9 1,29 99,3 1,26 1439
b gi|68400425 Proteasome subunit beta type 5 99,8 1,58 99,99 1,78 99,8 1,54 96,6 1,13 37,0 -1,02 98,3 -1,15
1439c No ID 99,2 1,57 97,0 1,37 99,5 1,72 96,9 -1,15 ---- 1,1 99,1 1,26
1440 gi|37722017 Ubiquitin C-terminal hydrolase 99,9 1,58 96,0 1,15 97,6 -1,18 99,99 -1,38 99,99 -1,87 99,99 -1,36
1507 gi|51858515 gi|67772036 gi|47939430
Ferritin subunits (H, M, L) 99,99 -7,69 99,99 -8,88 99,9 -6,34 ---- -1,15 ---- 1,21 ---- 1,4
1512 gi|37779086
or gi|33991794
Putative transient receptor protein 2 or Myosin light chain 99,99 1,62 99,99 2,69 99,99 2,36 99,99 1,67 99,99 1,46 97,6 -1,14
1639 No ID 97,10 -2,48 ---- -1,69 ---- -2,25 ---- 1,46 ---- 1,1 ---- -1,33

149
F1 G
nRH
+OA
F0 L
ate
F1 C
ontro
l
F1 G
nRH
F0 L
ate
F1 C
ontro
l
F0 L
ate
F1 G
nRH
F1 C
ontro
l
F1 G
nRH
+OA
F1 G
nRH
F1 G
nRH
+OA
Stan
dard
ized
Abu
ndan
ce
3.4
3.2
3
2.8
2.6
2.4
2.2
2
1.8
1.6
1.4
1.2
1
0.8
F1 G
nRH
+OA
F0 L
ate
F1 C
ontro
l
F1 G
nRH
F1 G
nRH
+OA
F1 C
ontro
l
F1 G
nRH
+OA
F1 C
ontro
l
F1 G
nRH
Stan
dard
ized
Abu
ndan
ce
2.4
2.2
2
1.8
1.6
1.4
1.2
1
0.8
F1 G
nRH
+OA
F0 L
ate
F1 C
ontro
l
F1 G
nRH
F0 L
ate
F1 C
ontro
l
F0 L
ate
F1 G
nRH
F1 C
ontro
l
F1 G
nRH
+OA
Stan
dard
ized
Abu
ndan
ce
1.7
1.6
1.5
1.4
1.3
1.2
1.1
1
0.9
0.8
F1 G
nRH
+OA
F0 L
ate
F1 C
ontro
l
F1 G
nRH
F0 L
ate
F1 C
ontro
l
F1 G
nRH
F1 G
nRH
+OA
F0 L
ate
F1 G
nRH
F1 C
ontro
l
F1 G
nRH
+OA
Stan
dard
ized
Abu
ndan
ce
1.8
1.7
1.6
1.5
1.4
1.3
1.2
1.1
1
0.9
0.8
0.7
0.6
0.5
F1 G
nRH
+OA
F0 L
ate
F1 C
ontro
l
F1 G
nRH
F0 L
ate
F1 C
ontro
l
F1 G
nRH
F1 G
nRH
+OA
F0 L
ate
F1 G
nRH
F1 C
ontro
l
F1 G
nRH
+OA
Stan
dard
ized
Abu
ndan
ce
1.4
1.3
1.2
1.1
1
0.9
0.8
0.7
0.6
F1 G
nRH
+OA
F0 L
ate
F1 C
ontro
l
F1 G
nRH
F0 L
ate
F1 C
ontro
l
F1 G
nRH
F1 G
nRH
+OA
F0 L
ate
F1 G
nRH
Stan
dard
ized
Abu
ndan
ce
2.2
2
1.8
1.6
1.4
1.2
1
0.8
0.6
F1 p
11KT
F0 L
ate
F1 C
ontro
l
F1 G
nRH
F0 L
ate
F1 C
ontro
l
F1 G
nRH
F1 p
11KT
F0 L
ate
F1 G
nRH
F1 C
ontro
l
F1 p
11KT
Stan
dard
ized
Abu
ndan
ce
3.2
3
2.8
2.6
2.4
2.2
2
1.8
1.6
1.4
1.2
1
0.8
0.6
F1 G
nRH
+OA
F0 L
ate
F1 C
ontro
l
F1 G
nRH
F0 L
ate
F1 C
ontro
l
F1 G
nRH
F1 G
nRH
+OA
F0 L
ate
F1 G
nRH
F1 C
ontro
l
F1 G
nRH
+OA
Stan
dard
ized
Abu
ndan
ce
3.2
3
2.8
2.6
2.4
2.2
2
1.8
1.6
1.4
1.2
1
0.8
F1 G
nRH
+OA
F0 L
ate
F1 C
ontro
l
F1 G
nRH
F0 L
ate
F1 C
ontro
l
F1 G
nRH
F1 G
nRH
+OA
F0 L
ate
F1 G
nRH
F1 C
ontro
l
F1 G
nRH
+OA
Stan
dard
ized
Abu
ndan
ce
1.451.4
1.351.3
1.251.2
1.151.1
1.051
0.950.9
0.850.8
0.750.7
0.65
F1 G
nRH
+OA
F0 L
ate
F1 C
ontro
l
F1 G
nRH
F0 L
ate
F1 C
ontro
l
F1 G
nRH
F1 G
nRH
+OA
F0 L
ate
F1 G
nRH
F1 C
ontro
l
F1 G
nRH
+OA
Stan
dard
ized
Abu
ndan
ce
1.351.3
1.251.2
1.151.1
1.051
0.950.9
0.850.8
0.750.7
0.650.6
0.55
F1 G
nRH
+OA
F0 L
ate
F1 C
ontro
l
F1 G
nRH
F0 L
ate
F1 C
ontro
l
F1 G
nRH
F1 G
nRH
+OA
F0 L
ate
F1 G
nRH
F1 C
ontro
l
F1 G
nRH
+OA
Stan
dard
ized
Abu
ndan
ce
1.25
1.2
1.15
1.1
1.05
1
0.95
0.9
0.85
0.8
0.75
0.7
0.65
0.6
0.55
F1 G
nRH
+OA
F0 L
ate
F1 C
ontro
l
F1 G
nRH
+OA
F1 C
ontro
l
F1 G
nRH
F1 G
nRH
+OA
F0 L
ate
F1 G
nRH
Stan
dard
ized
Abu
ndan
ce
1.7
1.6
1.5
1.4
1.3
1.2
1.1
1
0.9
0.8
0.7
0.6
0.5
F1 G
nRH
+OA
F0 L
ate
F1 C
ontro
l
F1 G
nRH
F0 L
ate
F1 C
ontro
l
F0 L
ate
F1 G
nRH
F1 C
ontro
l
F1 G
nRH
+OA
F1 G
nRH
F1 G
nRH
+OA
Stan
dard
ized
Abu
ndan
ce
1.7
1.6
1.5
1.4
1.3
1.2
1.1
1
0.9
0.8
0.7
0.6
Group 2
Group 1
F1 G
nRH
+OA
F0 L
ate
F1 C
ontro
l
F1 G
nRH
F0 L
ate
F1 C
ontro
l
F1 G
nRH
F1 G
nRH
+OA
F0 L
ate
F1 G
nRH
F1 C
ontro
l
F1 G
nRH
+OA
Stan
dard
ized
Abu
ndan
ce
1.6
1.5
1.4
1.3
1.2
1.1
1
0.9
0.8
0.7
0.6
0.5
F1 G
nRH
+OA
F0 L
ate
F1 C
ontro
l
F1 G
nRH
F0 L
ate
F1 C
ontro
l
F1 G
nRH
F1 G
nRH
+OA
F0 L
ate
F1 G
nRH
F1 C
ontro
l
F1 G
nRH
+OA
Stan
dard
ized
Abu
ndan
ce
1.6
1.5
1.4
1.3
1.2
1.1
1
0.9
0.8
0.7
0.6
F1 G
nRH
+OA
F0 L
ate
F1 C
ontro
l
F1 G
nRH
F0 L
ate
F1 C
ontro
l
F1 G
nRH
F1 G
nRH
+OA
F0 L
ate
F1 G
nRH
F1 C
ontro
l
F1 G
nRH
+OA
Stan
dard
ized
Abu
ndan
ce
1.8
1.7
1.6
1.5
1.4
1.3
1.2
1.1
1
0.9
0.8
0.7
0.6
231 240-250 284
F1 G
nRH
+OA
F0 L
ate
F1 C
ontro
l
F1 G
nRH
F0 L
ate
F1 C
ontro
l
F1 G
nRH
F1 G
nRH
+OA
F0 L
ate
F1 G
nRH
F1 C
ontro
l
F1 G
nRH
+OA
Stan
dard
ized
Abu
ndan
ce
2.8
2.6
2.4
2.2
2
1.8
1.6
1.4
1.2
1
0.8
509
253 261 424 431-438 439
531 2 1106 1112
Alpha-2-macroglobulin-1Alpha-2-macroglobulin-1
F0 M
at
F1 C
ontr
ol
F1 G
nRH
a
F1 G
nRH
a+O
A
F0 M
at
F1 C
ontr
ol
F1 G
nRH
a
F1 G
nRH
a+O
A
F0 M
at
F1 C
ontr
ol
F1 G
nRH
a
F1 G
nRH
a+O
A
F0 M
at
F1 C
ontr
ol
F1 G
nRH
a
F1 G
nRH
a+O
A
Alpha-2-macroglobulin-1 HemopexinAlpha-2-macroglobulin-1 Hemopexin
F0 M
at
F1 C
ontr
ol
F1 G
nRH
a
F1 G
nRH
a+O
A
F0 M
at
F1 C
ontr
ol
F1 G
nRH
a
F1 G
nRH
a+O
A
F0 M
at
F1 C
ontr
ol
F1 G
nRH
a
F1 G
nRH
a+O
A
F0 M
at
F1 C
ontr
ol
F1 G
nRH
a
F1 G
nRH
a+O
A
Figure 3.11.- Protein level profiles of the spots selected after differential expression analysis for the hormone treatment study. In each
graphic the mean %Vol in each studied state with its individual measures and the identification of this protein are displayed, when
available. Graphics are classified in nine groups depending on the protein level profile resulting from connecting mean %Vol values in
each of the four studied states (F0Mat, F1 Control, F1 GnRHa and F1 GnRHa+OA).
110
F0 M
at
F1 C
ontr
ol
F1 G
nRH
a
F1 G
nRH
a+O
A
F0 M
at
F1 C
ontr
ol
F1 G
nRH
a
F1 G
nRH
a+O
A
F0 M
at
F1 C
ontr
ol
F1 G
nRH
a
F1 G
nRH
a+O
A
F0 M
at
F1 C
ontr
ol
F1 G
nRH
a
F1 G
nRH
a+O
A
F0 M
at
F1 C
ontr
ol
F1 G
nRH
a
F1 G
nRH
a+O
A
Glyceraldehyde 3-phosphate DHHemopexin Keratin 8
F1 G
nRH
+OA
F0 L
ate
F1 C
ontro
l
F1 G
nRH
F0 L
ate
F1 C
ontro
l
F1 G
nRH
F1 G
nRH
+OA
F0 L
ate
F1 G
nRH
F1 C
ontro
l
F1 G
nRH
+OA
Stan
dard
ized
Abu
ndan
ce
1.8
1.7
1.6
1.5
1.4
1.3
1.2
1.1
1
0.9
851a
F0 M
at
F1 C
ontr
ol
F1 G
nRH
a
F1 G
nRH
a+O
A
ATP synthase β-subunit
Keratin S8 type I Oxidative-stress responsive 1
1123 1380 1639 1204
F0 M
at
F1 C
ontr
ol
F1 G
nRH
a
F1 G
nRH
a+O
A
F0 M
at
F1 C
ontr
ol
F1 G
nRH
a
F1 G
nRH
a+O
A
F0 M
at
F1 C
ontr
ol
F1 G
nRH
a
F1 G
nRH
a+O
A
F0 M
at
F1 C
ontr
ol
F1 G
nRH
a
F1 G
nRH
a+O
A
F1 G
nRH
+OA
F0 L
ate
F1 C
ontro
l
F1 G
nRH
F0 L
ate
F1 C
ontro
l
F1 G
nRH
F1 G
nRH
+OA
F0 L
ate
F1 G
nRH
F1 C
ontro
l
F1 G
nRH
+OA
Stan
dard
ized
Abu
ndan
ce
2.6
2.4
2.2
2
1.8
1.6
1.4
1.2
1
0.8
0.6
0.4
0.2
1507
F0 M
at
F1 C
ontr
ol
F1 G
nRH
a
F1 G
nRH
a+O
A
Ferritin
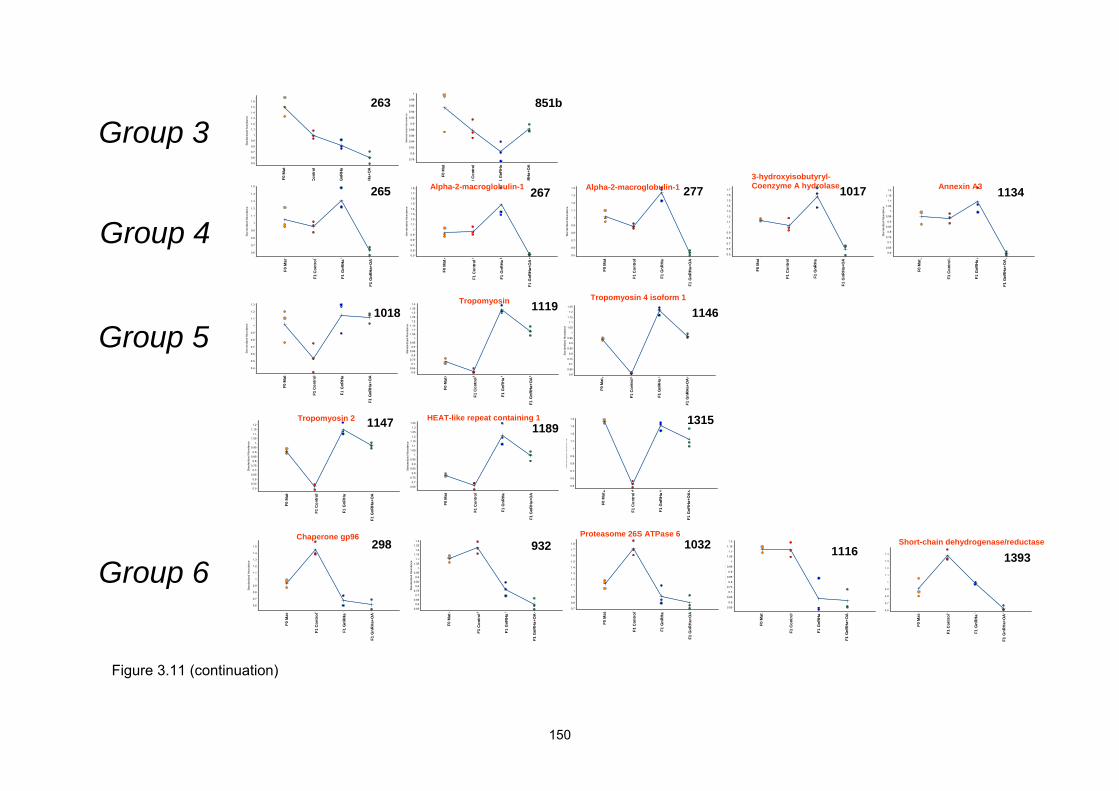
150
Figure 3.11 (continuation)
Group 3
Group 5
Group 4
Group 6
F1 G
nRH
+OA
F0 L
ate
F1 C
ontro
l
F1 G
nRH
F0 L
ate
F1 C
ontro
l
F1 G
nRH
F1 G
nRH
+OA
F0 L
ate
F1 G
nRH
F1 C
ontro
l
F1 G
nRH
+OA
Stan
dard
ized
Abu
ndan
ce
1 .4
1.3
1.2
1.1
1
0.9
0.8
0.7
0.6
F1 G
nRH
+OA
F0 L
ate
F1 C
ontro
l
F1 G
nRH
F0 L
ate
F1 C
ontro
l
F1 G
nRH
F1 G
nRH
+OA
F0 L
ate
F1 G
nRH
F1 C
ontro
l
F1 G
nRH
+OA
Stan
dard
ized
Abu
ndan
ce
1
0.98
0.96
0.94
0.92
0.9
0.88
0.86
0.84
0.82
0.8
0.78
F1 G
nRH
+OA
F0 L
ate
F1 C
ontro
l
F1 G
nRH
F0 L
ate
F1 C
ontro
l
F1 G
nRH
F1 G
nRH
+OA
F0 L
ate
F1 G
nRH
F1 C
ontro
l
F1 G
nRH
+OA
Stan
dard
ized
Abu
ndan
ce
1.6
1.5
1.4
1.3
1.2
1.1
1
0.9
0.8
0.7
0.6
0.5
263 851b
F0 M
at
Con
trol
GnR
Ha
F1 G
nRH
a+O
A
F0 M
at
ontr
ol
nRH
a
F1 G
nRH
a+O
A
1393
F1 G
nRH
+OA
F0 L
ate
F1 C
ontro
l
F1 G
nRH
F0 L
ate
F1 C
ontro
l
F1 G
nRH
F1 G
nRH
+OA
F0 L
ate
F1 G
nRH
F1 C
ontro
l
F1 G
nRH
+OA
Stan
dard
ized
Abu
ndan
ce
1.2
1.15
1.1
1.05
1
0.95
0.9
0.85
0.8
0.75
0.7
0.65
0.6
0.55
1116
F0 M
at
F1 C
ontr
ol
F1 G
nRH
a
F1 G
nRH
a+O
A
F0 M
at
F1 C
ontr
ol
F1 G
nRH
a
F1 G
nRH
a+O
A
Short-chain dehydrogenase/reductase
F1 F1 F1 C
F1 G
Alpha-2-macroglobulin-1 ATP synthase β-subunit
F1 G
nRH
+OA
F0 L
ate
F1 C
ontro
l
F1 G
nRH
F0 L
ate
F1 C
ontro
l
F1 G
nRH
F1 G
nRH
+OA
F0 L
ate
F1 G
nRH
F1 C
ontro
l
F1 G
nRH
+OA
Stan
dard
ized
Abu
ndan
ce
1.2
1.15
1.1
1.05
1
0.95
0.9
0.85
0.8
0.75
0.7
0.65
0.6
F1 G
nRH
+OA
F0 L
ate
F1 C
ontro
l
F1 G
nRH
F0 L
ate
F1 C
ontro
l
F1 G
nRH
F1 G
nRH
+OA
F0 L
ate
F1 G
nRH
F1 C
ontro
l
F1 G
nRH
+OA
Stan
dard
ized
Abu
ndan
ce
1.7
1.6
1.5
1.4
1.3
1.2
1.1
1
0.9
0.8
0.7
0.6
0.5
F1 G
nRH
+OA
F0 L
ate
F1 C
ontro
l
F1 G
nRH
F0 L
ate
F1 C
ontro
l
F1 G
nRH
F1 G
nRH
+OA
F0 L
ate
F1 G
nRH
F1 C
ontro
l
F1 G
nRH
+OA
Stan
dard
ized
Abu
ndan
ce
1.4
1.3
1.2
1.1
1
0.9
0.8
0.7
0.6
0.5
F1 G
nRH
+OA
F0 L
ate
F1 C
ontro
l
F1 G
nRH
F0 L
ate
F1 C
ontro
l
F1 G
nRH
F1 G
nRH
+OA
F0 L
ate
F1 G
nRH
F1 C
ontro
l
F1 G
nRH
+OA
Stan
dard
ized
Abu
ndan
ce
1.8
1.7
1.6
1.5
1.4
1.3
1.2
1.1
1
0.9
0.8
0.7
0.6
0.5
F1 G
nRH
+OA
F0 L
ate
F1 C
ontro
l
F1 G
nRH
F1 G
nRH
+OA
F0 L
ate
F1 G
nRH
F1 C
ontro
l
F1 G
nRH
+OA
F1 C
ontro
l
F1 G
nRH
Stan
dard
ized
Abu
ndan
ce
1.5
1.4
1.3
1.2
1.1
1
0.9
0.8
0.7
0.6
265 267 277 017 1134 1Alpha-2-macroglobulin-13-hydroxyisobutyryl-Coenzyme A hydrolase Alpha-2-macroglobulin-1 Annexin A3
F1 G
nRH
+OA
F0 L
ate
F1 C
ontro
l
F1 G
nRH
F0 L
ate
F1 C
ontro
l
F1 G
nRH
F1 G
nRH
+OA
F0 L
ate
F1 G
nRH
F1 C
ontro
l
F1 G
nRH
+OA
Stan
dard
ized
Abu
ndan
ce
1.41.35
1.31.25
1.21.15
1.11.05
10.95
0.90.85
0.80.75
0.70.65
0.6F1
GnR
H+O
A
F0 L
ate
F1 C
ontro
l
F1 G
nRH
F0 L
ate
F1 C
ontro
l
F1 G
nRH
F1 G
nRH
+OA
F1 C
ontro
l
F1 G
nRH
+OA
F0 L
ate
F1 G
nRH
Stan
dard
ized
Abu
ndan
ce
1.3
1.2
1.1
1
0.9
0.8
0.7
0.6
0.5
0.4
1018 1119
F1 G
nRH
+OA
F0 L
ate
F1 C
ontro
l
F1 G
nRH
F0 L
ate
F1 C
ontro
l
F1 G
nRH
F1 G
nRH
+OA
F0 L
ate
F1 G
nRH
F1 C
ontro
l
F1 G
nRH
+OA
Stan
dard
ized
Abu
ndan
ce
1.8
1.7
1.6
1.5
1.4
1.3
1.2
1.1
1
0.9
0.8
0.7
F1 G
nRH
+OA
F0 L
ate
F1 C
ontro
l
F1 G
nRH
F0 L
ate
F1 C
ontro
l
F1 G
nRH
F1 G
nRH
+OA
F0 L
ate
F1 G
nRH
F1 C
ontro
l
F1 G
nRH
+OA
Stan
dard
ized
Abu
ndan
ce
1.31.25
1.21.15
1.1
1.051
0.950.9
0.850.8
0.750.7
0.650.6
0.55
F1 G
nRH
+OA
F0 L
ate
F1 C
ontro
l
F1 G
nRH
F0 L
ate
F1 C
ontro
l
F0 L
ate
F1 G
nRH
F1 C
ontro
l
F1 G
nRH
+OA
Stan
dard
ized
Abu
ndan
ce
1.5
1.4
1.3
1.2
1.1
1
0.9
0.8
0.7
0.6
298 932 1032
F0 M
at
F1 C
ontr
ol
F1 G
nRH
a
F1 G
nRH
a+O
A
F0 M
at
F1 C
ontr
ol
F1 G
nRH
a
F1 G
nRH
a+O
A
F0 M
at
F1 C
ontr
ol
F1 G
nRH
a
F1 G
nRH
a+O
A
F0 M
at
F1 C
ontr
ol
F1 G
nRH
a
F1 G
nRH
a+O
A
F0 M
at
F1 C
ontr
ol
F1 G
nRH
a
F1 G
nRH
a+O
A
F0 M
at
F1 C
ontr
ol
F1 G
nRH
a
F1 G
nRH
a+O
A
F0 M
at
F1 C
ontr
ol
F1 G
nRH
a
F1 G
nRH
a+O
A
Tropomyosin
F1 G
nRH
+OA
F0 L
ate
F1 C
ontro
l
F1 G
nRH
F0 L
ate
F1 C
ontro
l
F1 G
nRH
F1 G
nRH
+OA
F0 L
ate
F1 G
nRH
F1 C
ontro
l
F1 G
nRH
+OA
Stan
dard
ized
Abu
ndan
ce
1.25
1.2
1.15
1.1
1.05
1
0.95
0.9
0.85
0.8
0.75
0.7
0.65
0.6
1146
F0 M
at
F1 C
ontr
ol
F1 G
nRH
a
F1 G
nRH
a+O
A
Tropomyosin 4 isoform 1
F1 G
nRH
+OA
F0 L
ate
F1 C
ontro
l
F1 G
nRH
F0 L
ate
F1 C
ontro
l
F1 G
nRH
F1 G
nRH
+OA
F0 L
ate
F1 G
nRH
F1 C
ontro
l
F1 G
nRH
+OA
Stan
dard
ized
Abu
ndan
ce
1.4
1.3
1.2
1.1
1
0.9
0.8
0.7
0.6
0.5
F1 G
nRH
+OA
F0 L
ate
F1 C
ontro
l
F1 G
nRH
F0 L
ate
F1 C
ontro
l
F0 L
ate
F1 G
nRH
F1 C
ontro
l
F1 G
nRH
+OA
F1 G
nRH
F1 G
nRH
+OA
Stan
dard
ized
Abu
ndan
ce
1.2
1.15
1.11.05
10.95
0.9
0.850.8
0.750.7
0.65
0.60.55
0.5
1147 1315
F0 M
at
F1 C
ontr
ol
F1 G
nRH
a
F1 G
nRH
a+O
A
F0 M
at
F1 C
ontr
ol
F1 G
nRH
a
F1 G
nRH
a+O
A
F0 M
at
F1 C
ontr
ol
F1 G
nRH
a
F1 G
nRH
a+O
A
F0 M
at
F1 C
ontr
ol
F1 G
nRH
a
F1 G
nRH
a+O
A
Proteasome 26S ATPase 6
Tropomyosin 2
F0 M
at
F1 C
ontr
ol
F1 G
nRH
a
F1 G
nRH
a+O
A
F1 G
nRH
+OA
F0 L
ate
F1 C
ontro
l
F1 G
nRH
F0 L
ate
F1 C
ontro
l
F1 G
nRH
F1 G
nRH
+OA
F0 L
ate
F1 G
nRH
F1 C
ontro
l
F1 G
nRH
+OA
Stan
dard
ized
Abu
ndan
ce
1.35
1.3
1.25
1.2
1.15
1.1
1.05
1
0.95
0.9
0.85
0.8
0.75
0.7
0.65
HEAT-like repeat containing 11189
F0 M
at
F1 C
ontr
ol
F1 G
nRH
a
F1 G
nRH
a+O
A
Chaperone gp96

151
Figure 3.11 (continuation)
Group 6
F1 G
nRH
+OA
F0 L
ate
F1 C
ontro
l
F1 G
nRH
F0 L
ate
F1 C
ontro
l
F1 G
nRH
F1 G
nRH
+OA
F0 L
ate
F1 G
nRH
F1 C
ontro
l
F1 G
nRH
+OA
Stan
dard
ized
Abu
ndan
ce
1.2
1.15
1.1
1.05
1
0.95
0.9
0.85
0.8
0.75
0.7
0.65
F1 G
nRH
+OA
F0 L
ate
F1 C
ontro
l
F1 G
nRH
F0 L
ate
F1 C
ontro
l
F1 G
nRH
F1 G
nRH
+OA
F0 L
ate
F1 G
nRH
F1 C
ontro
l
F1 G
nRH
+OA
Stan
dard
ized
Abu
ndan
ce
1.5
1.4
1.3
1.2
1.1
1
0.9
0.8
0.7
F1 G
nRH
+OA
F0 L
ate
F1 C
ontro
l
F1 G
nRH
F0 L
ate
F1 C
ontro
l
F1 G
nRH
F1 G
nRH
+OA
F0 L
ate
F1 G
nRH
F1 C
ontro
l
F1 G
nRH
+OA
Stan
dard
ized
Abu
ndan
ce
4.5
4
3.5
3
2.5
2
1.5
1
0.5
1409 1411
F0 M
at
F1 C
ontr
ol
F1 G
nRH
a
F1 G
nRH
a+O
A
F0 M
at
F1 C
ontr
ol
F1 G
nRH
a
F1 G
nRH
a+O
A
ransferase
F1 G
nRH
+OA
F0 L
ate
F1 C
ontro
l
F1 G
nRH
F0 L
ate
F1 C
ontro
l
F1 G
nRH
F1 G
nRH
+OA
F0 L
ate
F1 G
nRH
F1 C
ontro
l
F1 G
nRH
+OA
Stan
dard
ized
Abu
ndan
ce
1.4
1.3
1.2
1.1
1
0.9
0.8
0.7
0.6
0.5
0.4
0.3
F1 G
nRH
+OA
F0 L
ate
F1 C
ontro
l
F1 G
nRH
F0 L
ate
F1 C
ontro
l
F1 G
nRH
F1 G
nRH
+OA
F0 L
ate
F1 G
nRH
F1 C
ontro
l
F1 G
nRH
+OA
Stan
dard
ized
Abu
ndan
ce
1.5
1.4
1.3
1.2
1.1
1
0.9
0.8
0.7
F0 M
at
F1 C
ontr
ol
F1 G
nRH
a
F1 G
nRH
a+O
A
F1 G
nRH
+OA
F0 L
ate
F1 C
ontro
l
F1 G
nRH
F0 L
ate
F1 C
ontro
l
F1 G
nRH
F1 G
nRH
+OA
F0 L
ate
F1 G
nRH
F1 C
ontro
l
F1 G
nRH
+OA
Stan
dard
ized
Abu
ndan
ce
2.32.22.1
21.91.81.71.61.51.41.31.21.1
10.90.80.7
F1 G
nRH
+OA
F0 L
ate
F1 C
ontro
l
F1 G
nRH
F0 L
ate
F1 C
ontro
l
F1 G
nRH
F1 G
nRH
+OA
F0 L
ate
F1 G
nRH
F1 C
ontro
l
F1 G
nRH
+OA
Stan
dard
ized
Abu
ndan
ce
1.5
1.4
1.3
1.2
1.1
1
0.9
0.8
0.7
F1 G
nRH
+OA
F0 L
ate
F1 C
ontro
l
F1 G
nRH
F0 L
ate
F1 C
ontro
l
F1 G
nRH
F1 G
nRH
+OA
F0 L
ate
F1 G
nRH
F1 C
ontro
l
F1 G
nRH
+OA
Stan
dard
ized
Abu
ndan
ce
1.251.2
1.151.1
1.051
0.950.9
0.85
0.80.75
0.70.65
0.60.55
0.5
F1 p
11KT
F0 L
ate
F1 C
ontro
l
F1 G
nRH
F0 L
ate
F1 C
ontro
l
F1 G
nRH
F1 p
11KT
F0 L
ate
F1 G
nRH
F1 C
ontro
l
F1 p
11KT
Stan
dard
ized
Abu
ndan
ce
1.551.5
1.451.4
1.351.3
1.251.2
1.151.1
1.051
0.950.9
0.850.8
0.750.7
F1 G
nRH
+OA
F0 L
ate
F1 C
ontro
l
F1 G
nRH
F0 L
ate
F1 C
ontro
l
F1 G
nRH
F1 G
nRH
+OA
F0 L
ate
F1 G
nRH
F1 C
ontro
l
F1 G
nRH
+OA
Stan
dard
ized
Abu
ndan
c
1.9
1.4
1.3
1.2
1.1
1
0.9
0.8
0.7
0.6
0.5
e
1.8
1.7
1.6
1.5
540-541
1422
Keratin 18
808
1030 1031581
Group 7
F1 G
nRH
+OA
F0 L
ate
F1 C
ontro
l
F1 G
nRH
+OA
F1 C
ontro
l
F1 G
nRH
F0 L
ate
F1 C
ontro
l
F0 L
ate
F1 G
nRH
F1 G
nRH
+OA
Stan
dard
ized
Abu
ndan
ce
1.251.2
1.151.1
1.051
0.950.9
0.850.8
0.750.7
0.650.6
0.550.5
0.45
F1 G
nRH
+OA
F0 L
ate
F1 C
ontro
l
F1 G
nRH
F0 L
ate
F1 C
ontro
l
F1 G
nRH
F1 G
nRH
+OA
F0 L
ate
F1 G
nRH
F1 C
ontro
l
F1 G
nRH
+OA
Stan
dard
ized
Abu
ndan
ce
1.2
1.15
1.1
1.05
1
0.95
0.9
0.85
0.8
0.75
0.7
0.65
0.6
F1 G
nRH
+OA
F0 L
ate
F1 C
ontro
l
F1 G
nRH
F0 L
ate
F1 C
ontro
l
F1 G
nRH
F1 G
nRH
+OA
F0 L
ate
F1 G
nRH
F1 C
ontro
l
F1 G
nRH
+OA
Stan
dard
ized
Abu
ndan
ce
1.2
1.15
1.1
1.05
1
0.95
0.9
0.85
0.8
0.75
0.7
0.65
0.6
0.55
F1 G
nRH
+OA
F0 L
ate
F1 C
ontro
l
F1 G
nRH
F0 L
ate
F1 C
ontro
l
F1 G
nRH
F1 G
nRH
+OA
F0 L
ate
F1 G
nRH
F1 C
ontro
l
F1 G
nRH
+OA
Stan
dard
ized
Abu
ndan
ce
1.41.35
1.31.25
1.21.15
1.11.05
10.95
0.90.85
0.80.75
0.70.65
0.6
Group 8
NADH dehydrogenase subunit 5 3-hydroxyisobutyrate dehydrogenase Proteasome subunit beta type 5
151
Putative transient receptor protein 2 or Myosin light chain
1139 1294 1439b 2
F1 G
nRH
+OA
F0 L
ate
F1 C
ontro
l
F1 G
nRH
F0 L
ate
F1 C
ontro
l
F1 G
nRH
F1 G
nRH
+OA
F0 L
ate
F1 G
nRH
F1 C
ontro
l
F1 G
nRH
+OA
Stan
dard
ized
Abu
ndan
ce
1.25
1.2
1.15
1.1
1.05
1
0.95
0.9
0.85
0.8
0.75
0.7
0.65
1439cGroup 9
F0 M
at
F1 C
ontr
ol
F1 G
nRH
a
F1 G
nRH
a+O
A
F0 M
at
F1 C
ontr
ol
F1 G
nRH
a
F1 G
nRH
a+O
A
Peroxiredoxin 6
F0 M
at
F1 C
ontr
ol
F1 G
nRH
a
F1 G
nRH
a+O
A
Keratin
F0 M
at
F1 C
ontr
ol
F1 G
nRH
a
F1 G
nRH
a+O
A
F0 M
at
F1 C
ontr
ol
F1 G
nRH
a
F1 G
nRH
a+O
A
Keratin 18
F0 M
at
F1 C
ontr
ol
F1 G
nRH
a
F1 G
nRH
a+O
A
F0 M
at
F1 C
ontr
ol
F1 G
nRH
a
F1 G
nRH
a+O
A
1439Apolipoprotein A-IV1
F0 M
at
F1 C
ontr
ol
F1 G
nRH
a
F1 G
nRH
a+O
A
F0 M
at
F1 C
ontr
ol
F1 G
nRH
a
F1 G
nRH
a+O
A
F0 M
at
F1 C
ontr
ol
F1 G
nRH
a
F1 G
nRH
a+O
A
F0 M
at
F1 C
ontr
ol
F1 G
nRH
a
F1 G
nRH
a+O
AF1
GnR
H+O
A
F0 L
ate
F1 C
ontro
l
F1 G
nRH
F0 L
ate
F1 C
ontro
l
F1 G
nRH
F1 G
nRH
+OA
F0 L
ate
F1 G
nRH
F1 C
ontro
l
F1 G
nRH
+OA
Stan
dard
ized
Abu
ndan
ce
2
1.9
1.8
1.7
1.6
1.5
1.4
1.3
1.2
1.1
1
0.9
0.8
0.7
1153
F0 M
at
F1 C
ontr
ol
F1 G
nRH
a
F1 G
nRH
a+O
AF1
GnR
H+O
A
F0 L
ate
F1 C
ontro
l
F1 G
nRH
F0 L
ate
F1 C
ontro
l
F1 G
nRH
F1 G
nRH
+OA
F0 L
ate
F1 G
nRH
F1 C
ontro
l
F1 G
nRH
+OA
Stan
dard
ized
Abu
ndan
ce
1.3
1.25
1.2
1.15
1.1
1.05
1
0.95
0.9
0.85
0.8
0.75
0.7
0.65
F0 M
at
F1 C
ontr
ol
F1 G
nRH
a
F1 G
nRH
a+O
A
LRP16 protein Glutathione S-t
Keratin
1440
F1 G
nRH
+OA
F0 L
ate
F1 C
ontro
l
F1 G
nRH
F0 L
ate
F1 C
ontro
l
F1 G
nRH
F1 G
nRH
+OA
F0 L
ate
F1 G
nRH
F1 C
ontro
l
F1 G
nRH
+OA
Stan
dard
ized
Abu
ndan
ce
1.3
1.2
1.1
1
0.9
0.8
0.7
0.6
0.5
1424
F0 M
at
F1 C
ontr
ol
F1 G
nRH
a
F1 G
nRH
a+O
A
F0 M
at
F1 C
ontr
ol
F1 G
nRH
a
F1 G
nRH
a+O
A
Peroxiredoxin 6Ubiquitin C-terminal hydrolase
Cytosolic non-specific dipeptidase801

Chapter 3
Normalized volume data of spots present in all images along the gels on the hormone
experiment was referred to F0Mat state values. Clustering of these data from hormone
treatment was performed with Cluster 3.0 and visualized with Java TreeView 1.0.7,
unveiling five main subtrees of spots (figure 3.12).
The classification of spots in both manual and informatic clustering showed similar
patterns of spot distribution (see colour legend in table 3.7), except for group 2 of figure
3.11. This was splitted in three different subtrees, unveiling more profiles in this group
than that determined by manual classification. As in chapter 2 (see page 86), this type of
protein level profile classification was used as a main guide when discussing biological
function of spots with similar protein abundance patterns.
Table 3.7.- MS/MS analyzed spots from 2-D DIGE gels present in expression data
clustering subtrees from the hormone treatment experiment. Spots were highlighted to
display the classification group in figure 3.11. Legend = : Groups 6+9+7; : Groups
8+3+5; : Groups 1+4; : Group 2.
Subtree Spots Protein ID
1 326, 1116, 851a, 261, 1507,
801, 1153, 531, 1031, 1030
Alpha-2-macroglobulin-1, No ID, ATP synthase β-subunit,
Alpha-2-macroglobulin-1, Ferritin, No ID, Cytosolic non-
specific dipeptidase, No ID, Hemopexin, Keratin 18, Keratin 18
2
581, 808, 439, 1112, 1018,
1315, 1189, 1147, 1146,
1119, 424, 1512, 540, 541,
1422
Keratin, No ID, No ID, No ID, No ID, No ID, HEAT-like repeat
containing 1, Tropomyosin 2, Tropomyosin 4 isoform 1,
Tropomyosin, Hemopexin, Putative transient receptor protein
2 or Myosin light chain, Keratin, Keratin, Peroxiredoxin 6.
3 250, 253, 1102, 431, 1123,
1639, 267, 277, 1134, 265,
240, 284, 1204, 1017, 231
Alpha-2-macroglobulin-1, Alpha-2-macroglobulin-1,
Glyceraldehyde 3-phosphate dehydrogenase, Hemopexin,
Keratin S8 type I, No ID, Alpha-2-macroglobulin-1, Alpha-2-
macroglobulin-1, Annexin A3, Alpha-2-macroglobulin-1, Alpha-
2-macroglobulin-1, Alpha-2-macroglobulin-1, similar to
oxidative-stress responsive 1, 3-hydroxyisobutyryl-Coenzyme
A hydrolase, Alpha-2-macroglobulin-1.
4 1409, 1032, 1411, 298, 932,
1424, 1393
LRP16 protein, Proteasome 26S subunit ATPase 6,
Glutathione S-transferase, Chaperone protein GP96, No ID,
Peroxiredoxin 6, Short-chain dehydrogenase/reductase.
5 1439, 1440, 1139, 1294 Apolipoprotein A-IV1, Ubiquitin C-terminal hydrolase, NADH
dehydrogenase 5, 3-hydroxyisobutyrate dehydrogenase.
152

Subtree 1
Subtree 2
Subtree 3
Subtree 4
Subtree 5Spot annotationSpot expression
ZoomareaSpot Tree
Subtree 1
Subtree 2
Subtree 3
Subtree 4
Subtree 5Spot annotationSpot annotationSpot expressionSpot expression
Zoomarea
ZoomareaSpot TreeSpot Tree
Log (State/Ref)
Figure 3.12.- Dendrogram of the spots present in all gel images from the hormone treatment study. Six subtrees are visible from the “Spot
tree“ panel. Relative spot expression to F0Mat state (red squared) is displayed in the “Spot expression” panel, where Subtrees are divided
by yellow lines. The “Zoom area” and “Spot annotation” panel are focused on the subtree 5. Spot belonging to this subtree are displayed
with ID when available. Colour code: green= overexpression; red= underexpression; black= no change.
153

Chapter 3
3.2.6 Mass spectrometry and bioinformatic analysis
The fifty-nine excised spots were digested with trypsin and the resulting peptides
analysed using tandem mass spectrometry. Spectra were processed with Peaks 2.4 and
Lutefisk97. Following the procedures optimized for the analysis of the MS data in
chapter 2, Peaks 2.4 was used as the main de novo sequencing engine while
candidates coming from Lutefisk were used as confirmatory. Only when Peaks provided
no candidates, Lutefisk sequences were used instead. A final number of 355 tentative
sequences were compared to NCBI database using BLAST to determine the protein of
origin (table 3.8). Forty-eight spots were correlated with described proteins, while 7
spots were sequenced (1-7 sequenced peptides), but no protein was identified. No
sequence was possible from the other three spots, probably because of the low amount
of material. The assigned proteins were identified by homology of sequenced peptides
to fish species like Danio rerio (19 spots), Tetraodon nigroviridis (12 spots), Takifugu
rubripes (8 spots), Oncorhynchus mykiss (1 spot), Micropterus salmonoides (1 spot),
Pleuronecetes platessa (1 spot), Siniperca chuats (1 spot) or Pagrus major (1 spot), and
to other species like Xenopus sp. (2 spots) and Cylindrophis ruffus (1 spot). The
coverage of the identified proteins with the sequenced peptides used to assign the
protein is detailed in Annex III.2.
The Mr and pI values of each identified spot were calculated using Decyder tools and
compared with the Mr and pI values given by Expasy tools for every identified protein.
Deviation between both experimental and theorical values was calculated as
(Experimental value -Theoretical value) / (Experimental value + Theoretical value) for
Mr, while for pI was calculated as Experimental value -Theoretical value (Annex III.3). In
the corresponding graphic distributions of these values, it was observed that most of the
predicted pI values from database sequences were greater than those from
experimental data. This trend was also observed for the proteins identified during the
2-DE comparison of cultured and wild fish in chapter 2. Contrarily, predicted and
theoretical Mr was randomly distributed in this experiment and no general tendency
could be observed.
.
154

Table 3.8.- De novo peptide sequencing for protein identification in the analysis of hormone effect over testis proteome. nESI-MS/MS:
Peptide sequences obtained from de novo sequencing of nESI-MS/MS data from trypsin digested spots (table 4) are displayed in two
columns depending on the software used (Peaks 2.4 or Lutefisk 97). For Peaks characters, colours indicate the probability (%) for the
corresponding residue to be correct. (Red = 99-80%; Blue= 79-60%; Cyan= 59-40%; Black=<40%). Brackets in Lutefisk 97 column
contain the mass in Da not assigned to any sequence. Rank-Score for Lutefisk 97 indicates position of the candidate sequence within any
individual de novo sequencing search and the probability of this sequence to be correct (values from 1 to 0, where 1 is maximum
probability). PROTEIN ID: NCBI access number and name of the protein that was identified with each sequence using BLAST search for
short nearly exact sequences (Sequence position inside the protein for each peptide in Annex III.2).
nESI-MS/MS PROTEIN ID Peaks 2.4 Lutefisk 97
Spot ID Score Sequence Rank-
Score NCBI Name
Sequence
EPKLSYSLNSEAR 2 0.975 gi|47224921 Alpha-2-macroglobulin-1 LLQLSYSLNSEAR 32%
[246.0]VLLKGNTYFSK 1 0.990 MDVLLQDQNLVVK 43%
WDYQVLLTVGDEK 24% [188.0]LYKVLLTVGDEK 4 0.864 VYDVLELEDANDNR 48% MP[248.1]LELEDAN[248.1]H 1 0.620
QVDVQDQTVTEWVSFK 4% [227.1]DHWETVTKDKVPAR 1 0.990 MQHSL(CamC)GLSALDKWEPK 21% [185.0]PNSLCGLSALDKSVLLK 1 0.990 gi|47224921 Alpha-2-macroglobulin-1
240
Q(CamC)EHLDLTADVEEEYHR 33% FM[276.1]LDLTADVEEE[158.0]GLK 1 0.767 QPELSYSLNSEAR 12% LLKLSYTVDSKAR 1 0.523 gi|47224921 Alpha-2-macroglobulin-1 EDTLLQGWLNVVK 26% FVVLWNGKLVNAR 1 0.904 DWYQVLLTVGDEK 22% [218.1]GDMAVLLTVGDEK 1 0.990
MMDVLEELDANNDR 29% MMDVLEELDANNDR 1 0.836 QVDVQDQTVTEWVHPK 4% [227.1]DVKDKTVTEWV[234.1]K 1 0.990
WWSH(CamC)GLSALDQWEPK 22% [202.0]GHSLCGLSALDKSVLLK 1 0.990 gi|47224921 Alpha-2-macroglobulin-1
250
QMGTHLDLTADVEEEYHR 36% [212.1]DFEEEVDATLDLVD[194.1]K 1 0.716
155

156
Table 3.8 (continuation).- De novo peptide sequencing for protein identification in the analysis hormone effect over testis proteome. nESI-MS/MS PROTEIN ID
Peaks 2.4 Lutefisk 97 Spot ID
Sequence Score Sequence Rank-Score
NCBI Name
DYLMNMMK 12% LSS[269.2]PL[260.0] 1 0.241 NQPGHSMMLPK 2%
QPELSYSLNSEVK 12% LLKLSYTVNSERA 1 0.642 gi|47224921 Alpha-2-macroglobulin-1 VFVLLQGNTYFSK 16% FVVLLKGNTYFSK 1 0.990 WDYQVLLTVGDEK 17% [218.1]GDTTVLLTVGDEK 1 0.990 VYDVLELEDANDNR 20% [264.1]LVLENKDANDNR 1 0.664
MRAPTAEDLGYWGLVR 19% F[211.1]PTAEDLGYSV[251.1][174.0] 1 0.612 gi|47224921 Alpha-2-macroglobulin-1 VQDVQDQTVTEWVHPK 10% [227.1]DVKDKTVTEGEV[234.1]K 1 0.990
253
MQHSL(CamC)GLSALDKWEPK 16% [184.1][212.1]SLCGLSALDKSVLLK 1 0.893 gi|47224921 Alpha-2-macroglobulin-1 LLQLSYSLNSEAR 28% [241.2]LLSYSLNSEVK 2 0.782 gi|47224898 Alpha-2-macroglobulin-1 NMTLLKDKNLVVK 28% [246.0]VLLKGNTYFSK 1 0.990 DWYQVLLTVGDEK 36% MGLYKVLLTVGDEK 1 0.985 FDDVLELEDANDNR 7% [264.1]LVLELEDANDNR 1 0.336
MNFQENGELVDRFWR 34% VF[256.2]YLVLEGNEKFLN 1 0.374
261
FLLWKALGPALGSVDGHDK 8% FLL[168.1]KNMEYEK[228.0]RR 1 0.130 LLQLSYSLNSEVK 19% LLKLSYSLNSEVK 1 0.945 gi|47224898 Alpha-2-macroglobulin-1 VFVLLQGNTYFSK 22% FVVLLLMRYFSK 1 0.990
GDEYKVLLTVGDEK 48% [214.1]SYKVLLTVGDEK 1 0.906 VYDVLELEDANDNR 47% [264.1]LVLELEDANNDR 1 0.522
QVDVQDQTVTEWVHPK 15% [227.1]DVKDKTVTEGEV[234.1]K 1 0.834 MQHSL(CamC)GLSALDQWEPK 29% [184.1][212.1]SLCGLSALDKSVLLK 1 0.990 gi|47224921 Alpha-2-macroglobulin-1
263
QMGTHLDLTADVEEEYHR 57% [259.1]GTGEEEVDATLDLHT[170.1]K 1 0.952 EPQLSYSLNSEVK 13% LLKLSYCGPSEAR 1 0.722 gi|47224898 Alpha-2-macroglobulin-1 FVVLLQDELNVVK 28% FVVLLEDRYFSK 1 0.990
RHNGQVLLTVGDEK 52% [301.1]YKVLLTRDTR 1 0.688 QVDVQDQTVTEWVHPK 4% [227.1]DVRSKTVTELKNEY 1 0.673
265
(CamC)HWAHEYSNNRLKDRR 9%

157
Table 3.8 (continuation).- De novo peptide sequencing for protein identification in the analysis hormone effect over testis proteome. nESI-MS/MS PROTEIN ID
Peaks 2.4 Lutefisk 97 Spot ID
Sequence Score Sequence Rank-Score
NCBI Name
MPS(CamC)LSFR 97% MPSCLSFR 1 0.745 gi|47224921 Alpha-2-macroglobulin-1 DYL(CamC)AFTR 25% LSRVTPL[260.0] 1 0.129
AQSFLFLDPK 23% AKSFLFLDPK 1 0.877 gi|55667245 Alpha-2-macroglobulin precursor RFFLTSPPQR 38% MGNHGSTLFNVA 1 0.223 gi|47224921 Alpha-2-macroglobulin-1
SQEKLTPALLEK 15% NTEKLT[168.1]LLEK 1 0.745 MYTTVPVVAKMNR 24% MYTTVVPVAKMNR 1 0.270 NMVDLKDQLNVVK 20% FVVLLEDKLNVVK 5 0.986
MRAPTAEDLGYWGLVR 69% LCLGLAEDLGYW[170.1]VR 1 0.760 gi|47224921 Alpha-2-macroglobulin-1
267
QVDVQDQTVTEPTSHPK 48% EV[213.1]EDKTVTEL[323.1][211.1] 1 0.288 NYL(CamC)AFTR 28% LSSG[194.1]DLFL 1 0.286 MGNFLTSPPQR 49% [255.2]LKSTLFKR 1 0.062 gi|47224921 Alpha-2-macroglobulin-1
YMDWPVVAKMNR 26% [294.1]DSV[208.1]SAKH[264.1] 1 0.236 MRAPTAEDLGYWGLVR 45% LSASPTAEDLGYWGLVR 3 0.740 gi|47224921 Alpha-2-macroglobulin-1
277
DW(CamC)LLAVRLTLRWPLWQK 37% [557.2]LSVRLKL[967.3] 1 0.224 TWVHVFTR 21% LSS[168.1]TPNMK 1 0.288
NKFSVWENK 5% LEFSKNSGNR 1 0.909 DYMSV(CamC)GTHRRK 10% MRAPTAEDLGYWGLVR 40% EAASPTAEDLGYSVD[154.1]R 1 0.579 gi|47224921 Alpha-2-macroglobulin-1
284
QRQNNLAFSATEEALKSYWR 5% [411.9]NNLAFSATEEALKST[404.2] 1 0.722 F(CamC)QLPDTK 53% FCKLPDTE 2 0.111
VAFDEYGSK 12% VAFDEYGSK 1 0.606 LSLFVVNRPR 25% [200.0]LFVV[199.1]APR 1 0.811
RVDSDLDPLNVSR 31% RVDSDDL[210.2]NVSR 2 0.452 gi|31323728 Chaperone protein GP96 M(CamC)SFLNFDESAAWER 17%
MNFQENGELVDLNDFR 80% FPFEEEVLEMCHFLN 1 0.694 FMFTDEWMAANEELWR 25% [226.1]SLTNEDAMAANEELTLK 1 0.850
298
YEHP(CamC)ALVASQYGWSGNPYR 10% [266.1]Y[257.1]ALVASKYGWS[225.2][234.1]K 1 0.470 gi|31323728 Chaperone protein GP96

158
Table 3.8 (continuation).- De novo peptide sequencing for protein identification in the analysis hormone effect over testis proteome. nESI-MS/MS PROTEIN ID
Peaks 2.4 Lutefisk 97 Spot ID
Sequence Score Sequence Rank-Score
NCBI Name
WQDLFGFHK 18% VSGADLFGCDH 1 0.898 gi|74096001 Hemopexin LVNSEQLPALFK 20%
W(CamC)WDWLFFK 82% ADCWDWLFFK 1 0.990 KLTHPVLMEGYPK 30% KDVHPVLMEGYPK 1 0.990
424
LVVGNHYYTFESLK 69% VLRNHYYTFESLK 1 0.990 gi|74096001 Hemopexin WQDLFGFHK 10% VSGADLFGCDH 1 0.902 gi|74096001 Hemopexin
LVNSEQPLALFK 20% W(CamC)WDWLFFK 89% ADCWDSVLFFK 1 0.990
QDVHLMLVLE(CamC)R 22% VGSVHLMLVLGYPK 1 0.896 431
VLVGNHYYTFESLK 63% VLVGNHYYTFESLK 1 0.979 gi|74096001 Hemopexin LVNSEQLPALFK 66% VLNSEKPLALFK 1 0.990
QNYHRHV(CamC)QR 3% KDVHLMLVLE(CamC)R 14% KDVHPVLMEGYPK 1 0.952
438 VLVGNHYYTFESLK 50% VLVGNHYYTFESLK 1 0.990 gi|74096001 Hemopexin
QANTVLATGNYR 8% NSAWEVSANLDK 509
WNLLLNSEWR 41% SRGLLLNSEWR 1 0.598 ERHPELD(CamC)K 11.4% DLGHPFKLTR 1 0.530
DEWTLTRNR 31.4% W(CamC)TADSVLFFK 19% WCTADSVLFFK 1 0.990 gi|74095891 Hemopexin
MLHYTSSTHPYK 14.1% TAA[199.1]CSETYHPK 1 0.478 FGHGPAKLSNEVFK 11.8% [204.1]HGPAKLRADSFK 4 0.712 gi|74095891 Hemopexin HYPHLPADMWRR 7.4% KDGPHLD[227.1]AM[212.1]R 1 0.484
MNQLPKDVTMWNLLK 20.2% [259.1]NLWMTVDKPLNNK 1 0.440
531
NMFQENGELVDLNMMR 15.8% [259.1]NLWMTVDKPLNNK 1 0.440
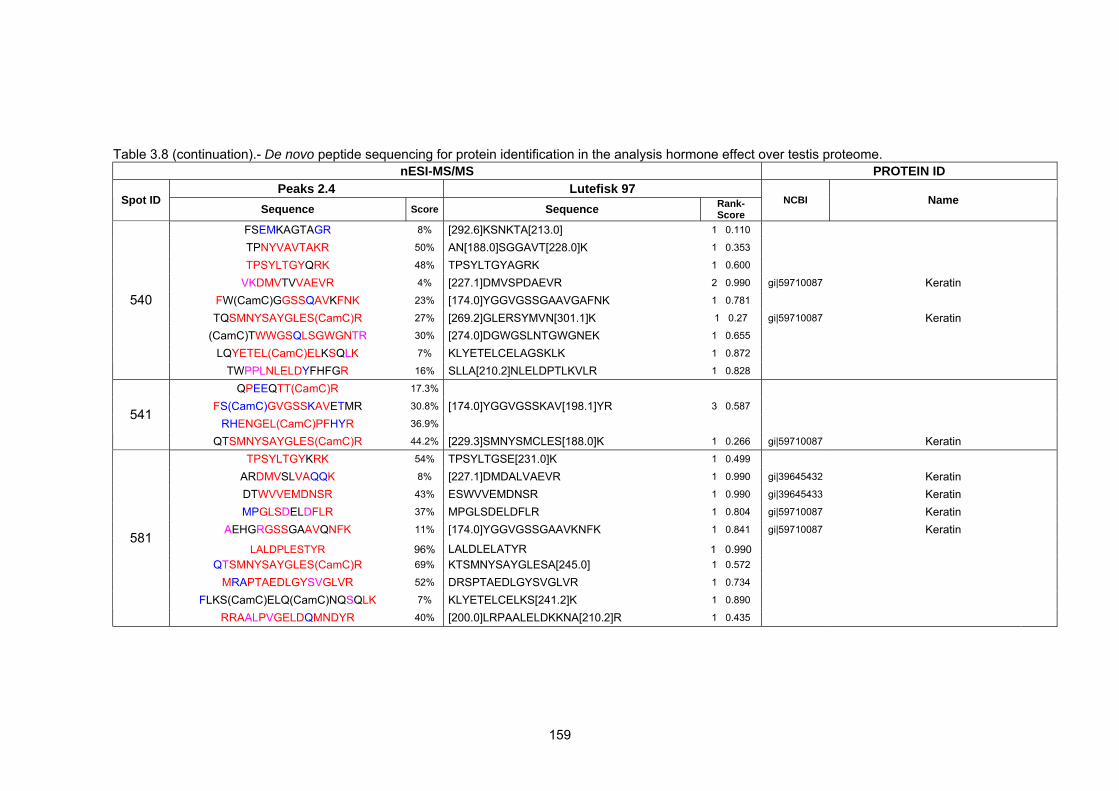
Table 3.8 (continuation).- De novo peptide sequencing for protein identification in the analysis hormone effect over testis proteome.
nESI-MS/MS PROTEIN ID Peaks 2.4 Lutefisk 97
Spot ID Sequence Score Sequence Rank-
Score NCBI Name
FSEMKAGTAGR 8% [292.6]KSNKTA[213.0] 1 0.110 TPNYVAVTAKR 50% AN[188.0]SGGAVT[228.0]K 1 0.353 TPSYLTGYQRK 48% TPSYLTGYAGRK 1 0.600
VKDMVTVVAEVR 4% [227.1]DMVSPDAEVR 2 0.990 gi|59710087 Keratin FW(CamC)GGSSQAVKFNK 23% [174.0]YGGVGSSGAAVGAFNK 1 0.781 TQSMNYSAYGLES(CamC)R 27% [269.2]GLERSYMVN[301.1]K 1 0.27 gi|59710087 Keratin
(CamC)TWWGSQLSGWGNTR 30% [274.0]DGWGSLNTGWGNEK 1 0.655 LQYETEL(CamC)ELKSQLK 7% KLYETELCELAGSKLK 1 0.872
540
TWPPLNLELDYFHFGR 16% SLLA[210.2]NLELDPTLKVLR 1 0.828 QPEEQTT(CamC)R 17.3%
FS(CamC)GVGSSKAVETMR 30.8% [174.0]YGGVGSSKAV[198.1]YR 3 0.587 RHENGEL(CamC)PFHYR 36.9%
541
QTSMNYSAYGLES(CamC)R 44.2% [229.3]SMNYSMCLES[188.0]K 1 0.266 gi|59710087 Keratin TPSYLTGYKRK 54% TPSYLTGSE[231.0]K 1 0.499
ARDMVSLVAQQK 8% [227.1]DMDALVAEVR 1 0.990 gi|39645432 Keratin DTWVVEMDNSR 43% ESWVVEMDNSR 1 0.990 gi|39645433 Keratin MPGLSDELDFLR 37% MPGLSDELDFLR 1 0.804 gi|59710087 Keratin
AEHGRGSSGAAVQNFK 11% [174.0]YGGVGSSGAAVKNFK 1 0.841 gi|59710087 Keratin
LALDPLESTYR 96% LALDLELATYR 1 0.990 QTSMNYSAYGLES(CamC)R 69% KTSMNYSAYGLESA[245.0] 1 0.572
MRAPTAEDLGYSVGLVR 52% DRSPTAEDLGYSVGLVR 1 0.734 FLKS(CamC)ELQ(CamC)NQSQLK 7% KLYETELCELKS[241.2]K 1 0.890
581
RRAALPVGELDQMNDYR 40% [200.0]LRPAALELDKKNA[210.2]R 1 0.435
159
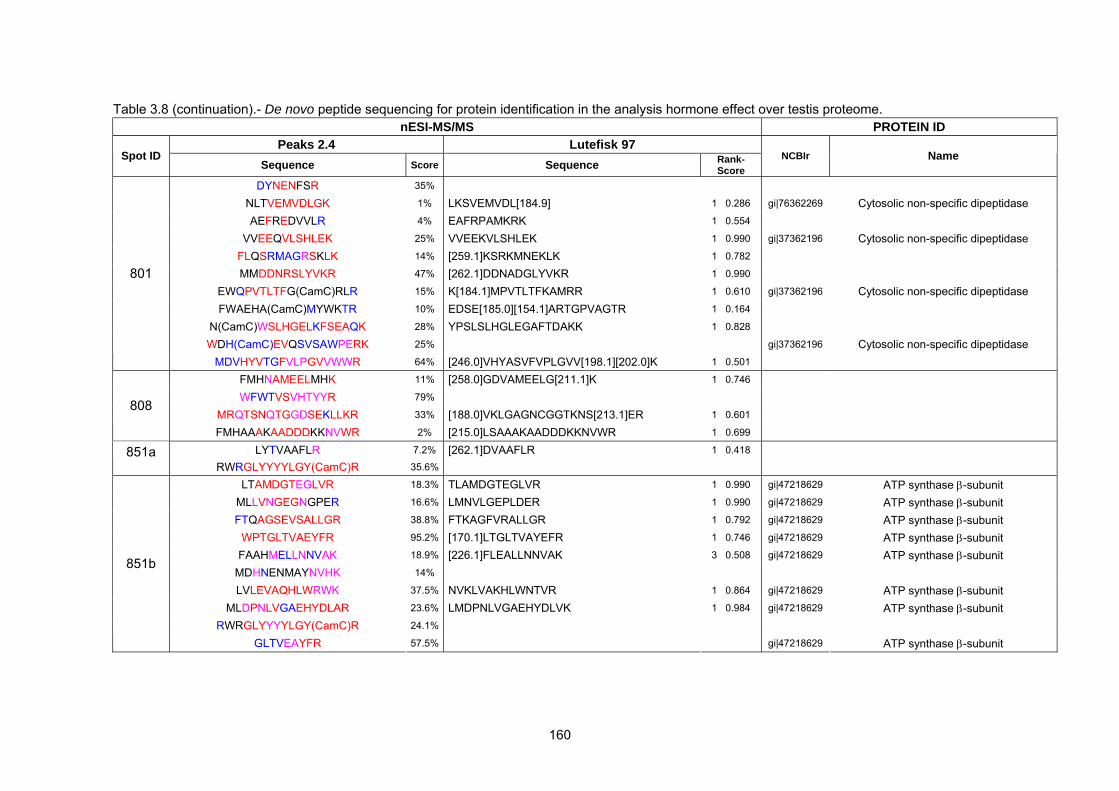
Table 3.8 (continuation).- De novo peptide sequencing for protein identification in the analysis hormone effect over testis proteome.
nESI-MS/MS PROTEIN ID Peaks 2.4 Lutefisk 97
Spot ID Sequence Score Sequence Rank-
Score NCBIr Name
DYNENFSR 35% NLTVEMVDLGK 1% LKSVEMVDL[184.9] 1 0.286 gi|76362269 Cytosolic non-specific dipeptidase AEFREDVVLR 4% EAFRPAMKRK 1 0.554
VVEEQVLSHLEK 25% VVEEKVLSHLEK 1 0.990 gi|37362196 Cytosolic non-specific dipeptidase FLQSRMAGRSKLK 14% [259.1]KSRKMNEKLK 1 0.782 MMDDNRSLYVKR 47% [262.1]DDNADGLYVKR 1 0.990
EWQPVTLTFG(CamC)RLR 15% K[184.1]MPVTLTFKAMRR 1 0.610 gi|37362196 Cytosolic non-specific dipeptidase FWAEHA(CamC)MYWKTR 10% EDSE[185.0][154.1]ARTGPVAGTR 1 0.164
N(CamC)WSLHGELKFSEAQK 28% YPSLSLHGLEGAFTDAKK 1 0.828 WDH(CamC)EVQSVSAWPERK 25% gi|37362196 Cytosolic non-specific dipeptidase
801
MDVHYVTGFVLPGVVWWR 64% [246.0]VHYASVFVPLGVV[198.1][202.0]K 1 0.501 FMHNAMEELMHK 11% [258.0]GDVAMEELG[211.1]K 1 0.746 WFWTVSVHTYYR 79%
MRQTSNQTGGDSEKLLKR 33% [188.0]VKLGAGNCGGTKNS[213.1]ER 1 0.601 808
FMHAAAKAADDDKKNVWR 2% [215.0]LSAAAKAADDDKKNVWR 1 0.699 LYTVAAFLR 7.2% [262.1]DVAAFLR 1 0.418 851a
RWRGLYYYYLGY(CamC)R 35.6% LTAMDGTEGLVR 18.3% TLAMDGTEGLVR 1 0.990 gi|47218629 ATP synthase β-subunit
MLLVNGEGNGPER 16.6% LMNVLGEPLDER 1 0.990 gi|47218629 ATP synthase β-subunit FTQAGSEVSALLGR 38.8% FTKAGFVRALLGR 1 0.792 gi|47218629 ATP synthase β-subunit
WPTGLTVAEYFR 95.2% [170.1]LTGLTVAYEFR 1 0.746 gi|47218629 ATP synthase β-subunit FAAHMELLNNVAK 18.9% [226.1]FLEALLNNVAK 3 0.508 gi|47218629 ATP synthase β-subunit
MDHNENMAYNVHK 14% LVLEVAQHLWRWK 37.5% NVKLVAKHLWNTVR 1 0.864 gi|47218629 ATP synthase β-subunit
MLDPNLVGAEHYDLAR 23.6% LMDPNLVGAEHYDLVK 1 0.984 gi|47218629 ATP synthase β-subunit RWRGLYYYYLGY(CamC)R 24.1%
851b
GLTVEAYFR 57.5% gi|47218629 ATP synthase β-subunit
160

Table 3.8 (continuation).- De novo peptide sequencing for protein identification in the analysis hormone effect over testis proteome.
nESI-MS/MS PROTEIN ID Peaks 2.4 Lutefisk 97
Spot ID Sequence Score Sequence Rank-
Score NCBI Name
LSHWVEFK 70% LSSPATLNKD 1 0.531 NKEQFLDLR 27% MRDPELRDM 1 0.277
MMNWLQVYDSR 6% YLCDSKLWNMN 1 0.360 932
(CamC)PDPENLYLAAV(CamC)LK 68% [257.1]D[226.1]NLYLAAVSWK 1 0.595 WYARL(CamC)NR 26%
LGLFLALTGFR 1% [242.1][188.0]LALTGFR 4 0.636 gi|61403546 3-hydroxyisobutyryl-Coenzyme A hydrolase LNAALNLPMVR 26% ARAALNLPMVR 1 0.907 RDSLAQDFFR 39% VGDSLAKDFFR 2 0.835 gi|89268269 3-hydroxyisobutyryl-Coenzyme A hydrolase
EEYLLNNALGSYR 84% [258.0]YLLNNALGSYR 1 0.864 gi|61403546 3-hydroxyisobutyryl-Coenzyme A hydrolase
1017
NYLHDSVTSLVPWK 33% FQTW(CamC)HFVYR 10% [276.1]HPKKLWNMN 1 0.341
1018 QWKKLKFLPMR 2%
(CamC)VQVSLEAPK 21.2% gi|47212109 Keratin 18 EYPLLDDRLK 22% YEPLLDDRLK 1 0.832
NHENEVMELR 92% NHENEVMELR 1 0.866 gi|47212109 Keratin 18 KGDLAQLMEDMR 87.5% [250.2]YAKLMEDMR 2 0.918 gi|47212109 Keratin 18
WYYAKGMYEL(CamC)HR 37.5% Y(CamC)FLELELASQQSLK 20.3% [241.2]KTLELELASKKSLK 1 0.990 gi|47212109 Keratin 18 LNWYSSSLYGKNF(CamC)R 16.8% [188.9]PKYSSSLYGGAGGY[300.1] 1 0.291
NMFQENGELVDYYYR 23.2% NMFKENGELVDECELN 1 0.805
1030
(CamC)HEQQTQEYEVLLNMK 7.8% FMNLLVEYKKTKK[253.2]R 1 0.554 gi|47212109 Keratin 18
161

Table 3.8 (continuation).- De novo peptide sequencing for protein identification in the analysis hormone effect over testis proteome.
nESI-MS/MS PROTEIN ID Peaks 2.4 Lutefisk 97
Spot ID Sequence Score Sequence Rank-
Score NCBI Name
Q(CamC)SHFKR 40% [174.0]KFHSNR 1 0.990 MMLQLNWR 8% DFLKLDNAR 1 0.990
YEPLHHSHNK 39%
QGDLAQLMEDMR 23% ANDLAKLMEDMR 1 0.990 gi|47212109 Keratin 18 MGSRSL(CamC)PKSGNDK 71% [333.3]VSLKCPSGWGN 1 0.457
KLRWELELASQQAEK 12% S[154.1]KTLELELASKK[199.1]E 1 0.901 gi|47212109 Keratin 18
1031
LNWYSSSLYGGANF(CamC)R 12% TSPKYSSSLYNAGGYGDK 1 0.766 Q(CamC)QFFTYFK 20%
NV(CamC)TEAGLFALR 62% NVCTEKLFALR 1 0.969 gi|54035446 Proteasome 26S subunit ATPase 6 LGASKLD(CamC)NFLK 20% VAASAGLDCNFLK 1 0.980 gi|54035446 Proteasome 26S subunit ATPase 6
WPSWRLGFVPR 20% FKPQGSLTFYVR 5% NFYEYEQFWNK 11%
RMDVFHFK(CamC)VLR 57% EVLELPLTNPELFKR 10% VD[278.1]RHFK[259.1]LR 1 0.266 gi|54035446 Proteasome 26S subunit ATPase 6
1032
WWLG(CamC)GLSTGYGAALNTAK 20% [258.0]LNGCGLSTGYKALNTAK 1 0.631
VPVADVWVDLT(CamC)R 89% VPVADVSVVDLTCR 1 0.865 gi|56718619 Glyceraldehyde 3-phosphate dehydrogenase
VFLRAVFARAWRR 14% RAL(CamC)YDDAGFGYHSR 18%
YRKWGSQLSGWWNK 27% FKAECRLLSGWGNRT 1 0.689 W(CamC)APSSLRAGLWSLLNR 10% [245.0]TWRLRARLSSPATLN 1 0.756
MWFKENGELSPLDYRK 8% CamC)NLFQENGELVDLYLKK 11% CNLFKENGELVDEFLKK 1 0.565
1102
YYEPSPDAPMFVMRA(CamC)VK 26% gi|56718619 Glyceraldehyde 3-phosphate dehydrogenase
162
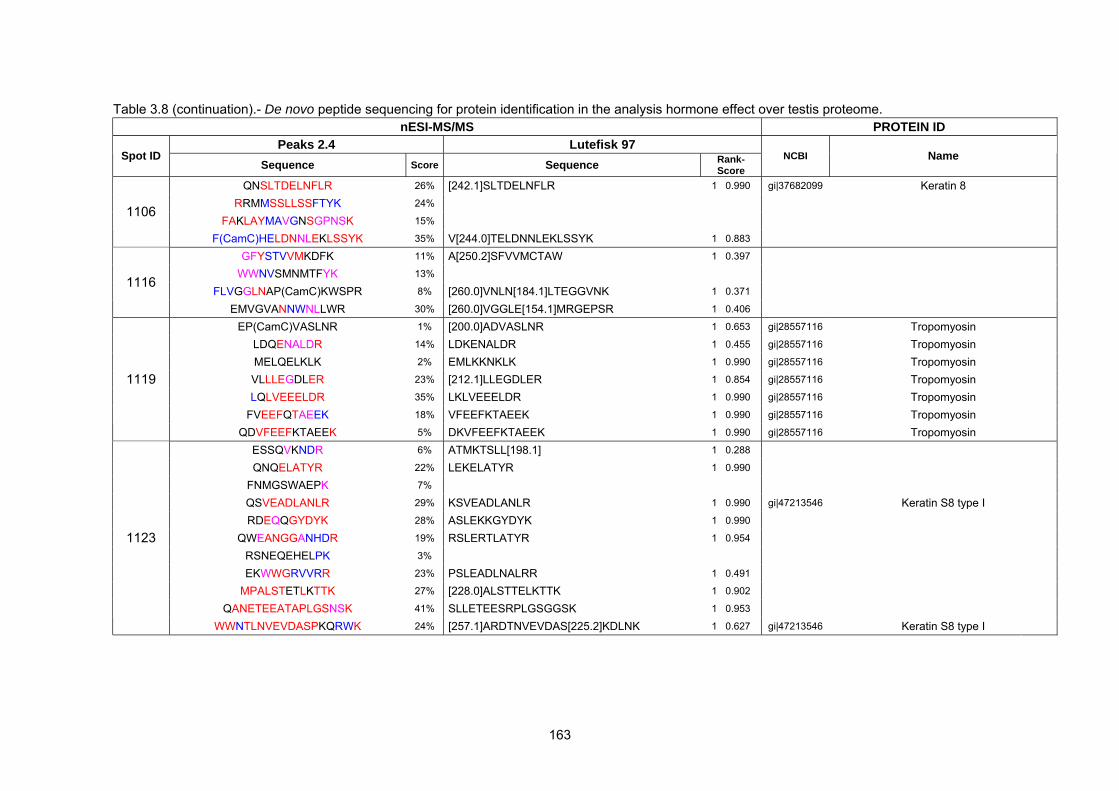
Table 3.8 (continuation).- De novo peptide sequencing for protein identification in the analysis hormone effect over testis proteome.
nESI-MS/MS PROTEIN ID Peaks 2.4 Lutefisk 97
Spot ID Sequence Score Sequence Rank-
Score NCBI Name
QNSLTDELNFLR 26% [242.1]SLTDELNFLR 1 0.990 gi|37682099 Keratin 8 RRMMSSLLSSFTYK 24%
FAKLAYMAVGNSGPNSK 15% 1106
F(CamC)HELDNNLEKLSSYK 35% V[244.0]TELDNNLEKLSSYK 1 0.883 GFYSTVVMKDFK 11% A[250.2]SFVVMCTAW 1 0.397
WWNVSMNMTFYK 13% FLVGGLNAP(CamC)KWSPR 8% [260.0]VNLN[184.1]LTEGGVNK 1 0.371
1116
EMVGVANNWNLLWR 30% [260.0]VGGLE[154.1]MRGEPSR 1 0.406 EP(CamC)VASLNR 1% [200.0]ADVASLNR 1 0.653 gi|28557116 Tropomyosin
LDQENALDR 14% LDKENALDR 1 0.455 gi|28557116 Tropomyosin MELQELKLK 2% EMLKKNKLK 1 0.990 gi|28557116 Tropomyosin VLLLEGDLER 23% [212.1]LLEGDLER 1 0.854 gi|28557116 Tropomyosin LQLVEEELDR 35% LKLVEEELDR 1 0.990 gi|28557116 Tropomyosin
FVEEFQTAEEK 18% VFEEFKTAEEK 1 0.990 gi|28557116 Tropomyosin
1119
QDVFEEFKTAEEK 5% DKVFEEFKTAEEK 1 0.990 gi|28557116 Tropomyosin ESSQVKNDR 6% ATMKTSLL[198.1] 1 0.288 QNQELATYR 22% LEKELATYR 1 0.990
FNMGSWAEPK 7% QSVEADLANLR 29% KSVEADLANLR 1 0.990 gi|47213546 Keratin S8 type I RDEQQGYDYK 28% ASLEKKGYDYK 1 0.990
QWEANGGANHDR 19% RSLERTLATYR 1 0.954 RSNEQEHELPK 3% EKWWGRVVRR 23% PSLEADLNALRR 1 0.491
MPALSTETLKTTK 27% [228.0]ALSTTELKTTK 1 0.902 QANETEEATAPLGSNSK 41% SLLETEESRPLGSGGSK 1 0.953
1123
WWNTLNVEVDASPKQRWK 24% [257.1]ARDTNVEVDAS[225.2]KDLNK 1 0.627 gi|47213546 Keratin S8 type I
163

Table 3.8 (continuation).- De novo peptide sequencing for protein identification in the analysis hormone effect over testis proteome.
nESI-MS/MS PROTEIN ID Peaks 2.4 Lutefisk 97
Spot ID Sequence Score Sequence Rank-
Score NCBI Name
NVFRLQVR 13% [213.1]LNGCTVR 1 0.426 NTATGLMDLR 27% ESLDLMDLR 1 0.634
SPSEAYKAETGK 32% [184.1]SEAYKAE[158.0]K 1 0.592 gi|47216949 Annexin A3 EELFDVTMLTLR 76% [258.0]LFDCGNLTLR 1 0.987
QMQE(CamC)TLTELFSDK 23% K[158.0]TECTLTELFSSR 1 0.888 gi|47216949 Annexin A3 MNFQENGELVDLRFTK 17% NM[275.0]ENGELVDL[158.0]FKV 1 0.442
RRATRDVKAGA(CamC)WYHYR 41%
1134
FF(CamC)LLYSQLESEVSGDYVMPR 42% [305.1]PFMYSKLESEVSGDYG[270.1]R 1 0.713 gi|47216949 Annexin A3 VTGLFEL(CamC)R 8% [200.0]GLSNFNKD 1 0.745 AQVLWALESYGR 27% [198.2]VLWALESY[213.0] 1 0.286 gi|74310597| NADH dehydrogenase subunit 5
LRLTAYSWY(CamC)GR 50% [174.0]PDPAYSWATLHN 1 0.976 MP(CamC)TEDEFAEDQPR 26%
1139
RDW(CamC)GGPAAVV(CamC)KRR 5% FKKTGLTEKK 25% [200.0]VDFLTKEK 1 0.893 LQLVEEELDR 34% LKLVEEELDR 1 0.990 gi|66792936 Tropomyosin 4 isoform 1
KLYAVHTALQK 5% RSASAELVAVNR 1 0.468 RFRNAWPWR 9% KAGDTVAPKEDNR 1 0.376
QQDAEEGVAALNR 9% gi|66792936 Tropomyosin 4 isoform 1 FLWEAHENDYDK 31% V[188.0]DELDKFSEALK 1 0.988 FLAAELFENSERR 14% LVVLEGELEKAEER 1 0.981
LVVLEGELEKAEER 3% [258.0]LVKLELDRAKER 1 0.677 EQLVLEELDRAEKR 23% [274.0]DLEEELKNGKDKLK 1 0.655 gi|66792936 Tropomyosin 4 isoform 1
QWFLHGMYEY(CamC)DK 12%
1146
FLELEEKSRNVEWVR 6% [245.0]FKENGELVEEKFVK 1 0.687
164

Table 3.8 (continuation).- De novo peptide sequencing for protein identification in the analysis hormone effect over testis proteome.
nESI-MS/MS PROTEIN ID Peaks 2.4 Lutefisk 97
Spot ID Sequence Score Sequence Rank-
Score NCBI Name
SGDLEEQNK 27% SGDLEEELK 1 0.990 NNKENALDR 31% LDKENALDR 1 0.822 gi|74136103 Tropomyosin 2 LVLLEGDLER 85% LVLLEGDLER 1 0.990 gi|74136103 Tropomyosin 2 QLLVEEELDR 33% LKLVEEELDR 1 0.990 gi|74136103 Tropomyosin 2 FKLGLLKAHKK 15% [222.9]EEELLGLKK 1 0.465 gi|74136103 Tropomyosin 2 LQEEELLGLKK 17% LKEEELLGLKK 1 0.990 gi|74136103 Tropomyosin 2
VDDDLEENLAQAK 21% [214.1]MVLEENLAKAK 1 0.990 gi|74136103 Tropomyosin 2 REDELDQYSESLK 95% VWDELDKYSESLK 1 0.990 gi|74136103 Tropomyosin 2
1147
QMLEEELGANVTNLNK 28% FEPKEELGANVTNLNK 1 0.990 gi|74136103 Tropomyosin 2 1153 F(CamC)HASYETQYVSHA(CamC)K 11% [245.0]T[168.1]WTRARLS[255.2][172.0]R 1 0.248
DDQMALVASLNR 32% DGWEWVASLNR 1 0.990 WLLDDTLPLFER 56% WLLDDTL[210.2]FER 1 0.919 gi|41054657 HEAT-like (PBS lyase) repeat containing 1
MH(CamC)WPAQDAGDFYLKLWR 8% [245.0]NNKEYMDGADEYFL[212.1]K 1 0.433 EWWRLLVLSQAVNN(CamC)WYK 43% [297.2]M[227.1]NDTALVLVNPS[196.2][243.1]K 1 0.388
1189
WWKWVLALGGLDQ(CamC)SYWPK 30% N[257.1]EDAVLALGLGDKCSSA[260.0]R 1 0.473 gi|41054657 HEAT-like (PBS lyase) repeat containing 1 FEAFFPASHAKK 8% FEAFFPFFAEK 1 0.414
FGATGFLKNLTEK 24% [174.0]TSAFLELLTTR 1 0.990 VMRVEKLVDSDAR 31% [230.0]GVVEKLVDDSAR 1 0.990 FNANGSFLYEHLR 22% FEGLGSFLYEYDK 1 0.973
APPNFSYN(CamC)MREK 34% PA[211.1]FSMASPGPALEK 1 0.438
1204
FNVPESELLEVLWK 23% [174.0]SVPESLLEEVLASR 1 0.990 gi|68372040 Similar to oxidative-stress responsive 1
165

Table 3.8 (continuation).- De novo peptide sequencing for protein identification in the analysis hormone effect over testis proteome.
nESI-MS/MS PROTEIN ID Peaks 2.4 Lutefisk 97
Spot ID Sequence Score Sequence Rank-
Score NCBI Name
DFSWFKFLR 17% DFSSVFKFLR 1 0.990 MPGLAQNTATDTK 17% DLGLAKNTATDTK 1 0.990 gi|94482754 3-hydroxyisobutyrate dehydrogenase MNPVLEHAQYFR 81% [245.0]KNEWFLVPLN 1 0.227 DWPLSSLAHKLYR 37% [188.0]LPLSSLAHKLYR 1 0.730 gi|94482754 3-hydroxyisobutyrate dehydrogenase
NFVHDSSTLDPEQR 11% MPRLVCMLDPAVSR 1 0.531 MMLVTSLEHQDLDK 46% [260.0]TLTSLEHKDLSR 1 0.777
FSTPVLATDVFRE(CamC)R 19% [236.2]VKRFVDTALVWVK 1 0.485 FWDPLLHYRNSGWK 19%
EWPWNALVVDSF(CamC)(CamC)K 95% [216.0][154.1]DLNALVVDSS[210.2]VAK 1 0.920
1294
MNLFMDAPVTGRKWRR 43% [358.1]FMDAPVTNVGAADRR 1 0.990 gi|94482754 3-hydroxyisobutyrate dehydrogenase 1315 TPGWLTYLFHR 29% [198.1]LFLYTLPLGR 1 0.707
KNF(CamC)FMMPEK 10% [242.1]FMMFCPEK 2 0.357 1380
VEFVVNGALESLR 48% AKSGMVNGALESLR 3 0.407 YAVTALTEGLR 99% [234.1]VTALTWLR 1 0.990 gi|47227808 Short-chain dehydrogenase/reductase
VKLTDMSPPSHK 13% VALVTGASVGLGAATAR 62% PWVTGASVGLGAATAR 1 0.990 gi|47227808 Short-chain dehydrogenase/reductase
TPPSADVHMDVHSK 55% VVSPADVHFVSS[277.1] 1 0.623 WGDDVNVLALPVHRK 23% [265.2]CNFVLALSLCTR 1 0.637 gi|47227808 Short-chain dehydrogenase/reductase VTSLSPGLVETEFAFR 99% VTSLSPGLVETEFAFR 1 0.823 gi|47937924 Short-chain dehydrogenase/reductase
EAAE(CamC)KSAGYSGTLLPYK 28% [247.0]FYMSAGYS[158.0]LLPYK 1 0.449 MQESNEEELLSMFRDK 16% [275.0]LSGGEEELLSMFSALK 1 0.895 gi|47227808 Short-chain dehydrogenase/reductase
1393
E(CamC)LQLNNAGLAHTDKLTPR 6% VGDMKLNNAGLAHSL[225.2]LSW 1 0.278
YYGSHMGHFFTK 15% MWYWTPSN(CamC)(CamC)K 4%
T(CamC)MEKDGGANGRNRGYR 6% WAFP(CamC)LSTGLYGYHWK 61% WAFPCLSTGLYGY[323.1]K 1 0.710 gi|51858534 LRP16 protein
1409
YHLEYRHESPSLAEHK 17%
166
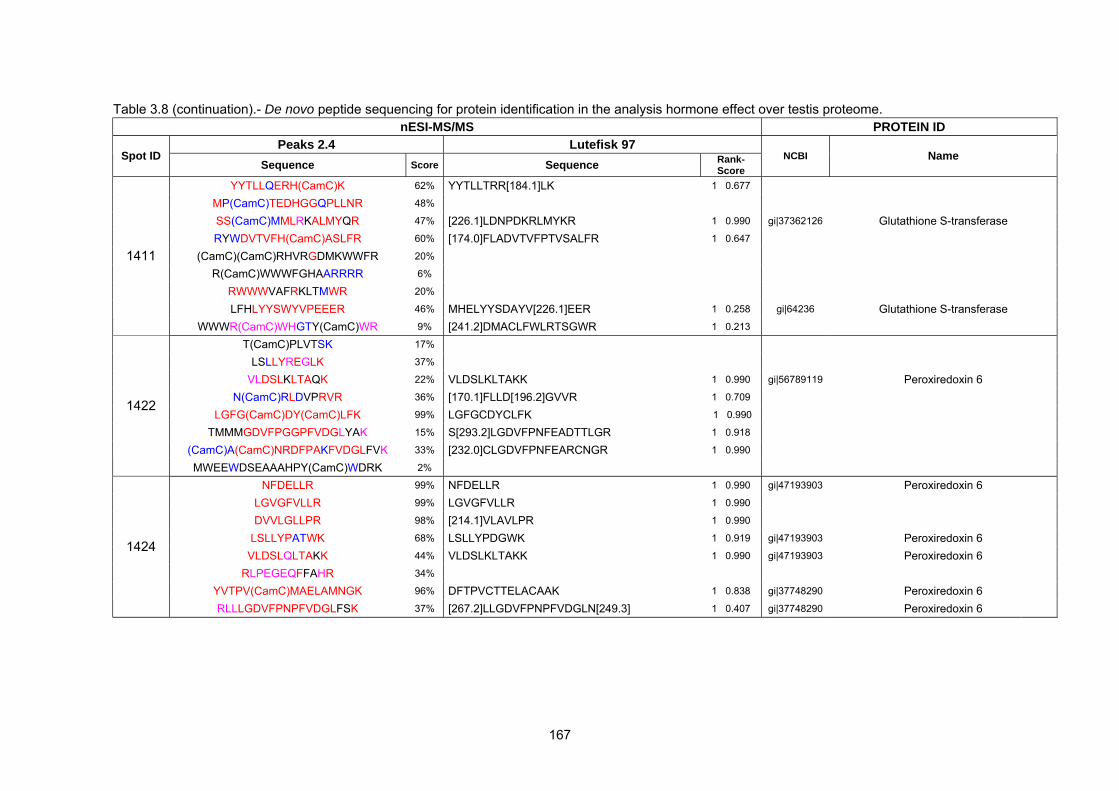
Table 3.8 (continuation).- De novo peptide sequencing for protein identification in the analysis hormone effect over testis proteome.
nESI-MS/MS PROTEIN ID Peaks 2.4 Lutefisk 97
Spot ID Sequence Score Sequence Rank-
Score NCBI Name
YYTLLQERH(CamC)K 62% YYTLLTRR[184.1]LK 1 0.677 MP(CamC)TEDHGGQPLLNR 48% SS(CamC)MMLRKALMYQR 47% [226.1]LDNPDKRLMYKR 1 0.990 gi|37362126 Glutathione S-transferase RYWDVTVFH(CamC)ASLFR 60% [174.0]FLADVTVFPTVSALFR 1 0.647
(CamC)(CamC)RHVRGDMKWWFR 20% R(CamC)WWWFGHAARRRR 6%
RWWWVAFRKLTMWR 20% LFHLYYSWYVPEEER 46% MHELYYSDAYV[226.1]EER 1 0.258 gi|64236 Glutathione S-transferase
1411
WWWR(CamC)WHGTY(CamC)WR 9% [241.2]DMACLFWLRTSGWR 1 0.213 T(CamC)PLVTSK 17%
LSLLYREGLK 37% VLDSLKLTAQK 22% VLDSLKLTAKK 1 0.990 gi|56789119 Peroxiredoxin 6
N(CamC)RLDVPRVR 36% [170.1]FLLD[196.2]GVVR 1 0.709 LGFG(CamC)DY(CamC)LFK 99% LGFGCDYCLFK 1 0.990
TMMMGDVFPGGPFVDGLYAK 15% S[293.2]LGDVFPNFEADTTLGR 1 0.918 (CamC)A(CamC)NRDFPAKFVDGLFVK 33% [232.0]CLGDVFPNFEARCNGR 1 0.990
1422
MWEEWDSEAAAHPY(CamC)WDRK 2% NFDELLR 99% NFDELLR 1 0.990 gi|47193903 Peroxiredoxin 6
LGVGFVLLR 99% LGVGFVLLR 1 0.990 DVVLGLLPR 98% [214.1]VLAVLPR 1 0.990
LSLLYPATWK 68% LSLLYPDGWK 1 0.919 gi|47193903 Peroxiredoxin 6 VLDSLQLTAKK 44% VLDSLKLTAKK 1 0.990 gi|47193903 Peroxiredoxin 6
RLPEGEQFFAHR 34% YVTPV(CamC)MAELAMNGK 96% DFTPVCTTELACAAK 1 0.838 gi|37748290 Peroxiredoxin 6
1424
RLLLGDVFPNPFVDGLFSK 37% [267.2]LLGDVFPNPFVDGLN[249.3] 1 0.407 gi|37748290 Peroxiredoxin 6
167

Table 3.8 (continuation).- De novo peptide sequencing for protein identification in the analysis hormone effect over testis proteome.
nESI-MS/MS PROTEIN ID Peaks 2.4 Lutefisk 97
Spot ID Sequence Score Sequence Rank-
Score NCBI Name
LFEQKNKVLKTK 1% DGWVD(CamC)VNKYVVALR 20% MARVVYGAGGVMDKALR 1 0.699 gi|57157763 Apolipoprotein A-IV1
QWAPLSKDFMTKFNR 28% KWAPLSKDFMTKFNR 1 0.990 KWAPLSQDFFTQFNR 11% [158.0]RA[210.2]SKDFFTKFNR 1 0.848
1439
MQWVEAQMTPYTKEMR 3% [320.0][225.2]AGAKMT[260.0]TKEMR 1 0.491 gi|57157763 Apolipoprotein A-IV1 ALQSSDMVGGASTMVALR 34% [184.1]GASSDMVNAGYVVALR 1 0.580
WQAPLSQDFMTYEPR 47% [215.0]VA[210.2]SKDFMTK[289.0]K 1 0.673 gi|68400425 Proteasome subunit beta type 5 GQVT(CamC)KAQMTHS(CamC)YAMR 49% [188.0][226.1]MKAKMT[260.0][269.2][220.1]R 1 0.245
VEVWGENMQPYALYYSK 72% [270.1]GWWNMKEMATRV[170.1]K 1 0.616 1439b
YDSAA(CamC)DVLTLND(CamC)WRK 21% [276.1]NFEDYYPTMCNLSR 1 0.208 GHPDTLAMLR 61% ALLDPLESTYR 99% [184.1]LDLELATYR 1 0.592
AEDLQFASFLDK 21% MAALTQQLK(CamC)KK 6% [220.1]RWLKKTLAAN 1 0.960
FQTWLQSDFDR 25% ETPHAVGT(CamC)TYYR 15%
1439c
MMNHSSLGGLSSNLSWHK 35%
168

Table 3.8 (continuation).- De novo peptide sequencing for protein identification in the analysis hormone effect over testis proteome.
nESI-MS/MS PROTEIN ID Peaks 2.4 Lutefisk 97
Spot ID Sequence Score Sequence Rank-
Score NCBI Name
FSAVAL(CamC)R 99% FSAVALCR 1 0.990 gi|37722017 Ubiquitin C-terminal hydrolase TTFNSDRDK 45% TTFNRNF[184.1] 1 0.488
MRYSLVWESK 73% QQKVGNLAEDSK 16% KKKVGNLAEDSK 1 0.990 AKPGELSQFLNNR 46% LFDETANFSADDR 67% FLDETANFSADDR 1 0.944 gi|47211292 Ubiquitin C-terminal hydrolase VDVNGQLYEFDGR 52% [213.1]VPGRYLKGN[224.1]A 1 0.331 gi|37722017 Ubiquitin C-terminal hydrolase
FSADMMHGNARDASK 15% FGQVAVTAGKAPVAVANK 31% FLALGVESHATVAVKGK 1 0.901
KDALPVSEATDVYWR 22% [242.1]ALCWHSMNF[213.1]K 1 0.299 T(CamC)LRQWLETTMFHR 15% [232.0]VFVNVHRTEAS[170.1][172.0]R 1 0.233
LGLFFNVNGQLYEYRR 49% (CamC)NLFKENGELVDQVVYR 47% CNLYLDPSEL[215.0]KFLKK 1 0.374
YS(CamC)NS(CamC)GTLALLHAVANDWR 91% [361.2]NNAVAHLLALTGCSP[253.2]R 1 0.712 gi|47211292 Ubiquitin C-terminal hydrolase
1440
MAKFMAVAVLALLHAVANNKSK 23% [230.0]PTLH[168.1]TLALLHAVANN[215.0]K 1 0.315 gi|47211292 Ubiquitin C-terminal hydrolase LLSFKNNR 40% LLSFKNNR 1 0.990 gi|67772036 Ferritin middle subunit MAEYLFSR 95% gi|51858515 Ferritin heavy polypeptide
LGDYLGTLTR 80% LGDYLGTLTR 1 0.990 gi|47939430 Ferritin lower subunit RGNKALVELHK 37% NVNKALLD[250.2]K 1 0.628
N(CamC)LTWTRTLVR 36% [220.1]RWLKKTLAAN 1 0.990 DLTANPELPLPER 5% DDVALPGA[210.2]AL[184.1]K 1 0.285
1507
FWNELLT(CamC)GWNK 55% FWLGSFLYEYNE 1 0.581 GNFNYAEFTR 9% [171.0]FNYAEFTR 1 0.990
ARGTDMLPVLR 81% LDGTDPEDVLR 1 0.778
EAFNMLDQNR 45% [200.0]FNMLDKNR 1 0.889 1512
FTDEEVDELFR 99% FTDEEVDELFR 1 0.990
gi|37779086 or
gi|33991794
Putative transient receptor protein 2 or Myosin light chain
169

Chapter 3
3.2.7 Comparison of sequenced peptides and identified proteins with S. senegalensis
ESTs
The same procedure described in chapter 2 was carried out with sequences from
differential spots resulting from the hormone treatment experiment. Twenty-three out of
fifty-nine spots produced from one to seven peptides that could be related to an EST
that matches with the same protein as the original peptide (table 3.9). Nine of these
spots discover new peptide assignations (17 new correlations) that could not be
matched in the comparison between peptide and protein database.
3.2.8 Relationships between 2-D protein gel analysis and mRNA microarray data of
testis from fish treated with hormones
A transcriptomic approach was performed in parallel to proteomic analysis using the
same testis tissue from F1 S. senegalensis in both cases. Two different comparisons
were performed in triplicate in an array composed of 5087 oligonucleotides: F1 GnRHa
vs. F1 Control and F1 GnRHa vs. F1 GnRHa+OA. In the F1 GnRHa-Control comparison
32 genes were found up-regulated, while 38 were down-regulated. In the F1 GnRHa-
GnRHa+OA comparison 11 genes were up-regulated, while 34 down-regulated (see;
Annex III.6 for detailed results). No gene identification was found to be coincident with
any of the protein described in the proteomic analysis (total proteins: 48). About half of
the sequences in the microarrays that were found to be up or down-regulated in any of
the comparisons (61 among 115) present a related entry with a known gene/protein
database. However, none of those genes could be directly correlated with any protein.
Only in the case of the gene PRP19, which is described to posses ubiquitin ligase
activity, could be related to the protein assigned to the spot 1440 (ubiquitin C-terminal
hydrolase). This gene is down regulated 1,86 times (p> 99%) in the GnRHa+OA state in
comparison with the GnRHa state. In the proteomic analysis the spot is 1,36 times
(p>99%) less present in the GnRHa+OA state than in the GnRHa state. However, for
the comparison between F1 Control and F1 GnRHa, the genomic and proteomic data
are in the opposite sense (gene up-regulated 1,5 times in GnRHa (p>99,9%), lower
protein levels 1,4 times in GnRHa (p> 99,9%), probably indicating that gen and protein,
although functionally related, are not under direct relationship.
170

171
Chapter 3
Table 3.9.- Coincidences between MS/MS-derived peptide sequences from differential
spots and EST from S. senegalensis. For each spot, 3 different comparisons were made
between peptide sequences, ESTs and protein data in the NCBI database: peptides
against ESTs; ESTs against database sequences; and peptides against database
sequences. Proteins resulting from each process are compared and peptide-EST
matches annotated. Prot ID: Protein identified from the MS/MS peptides. Pep seq:
Number of MS/MS peptides sequenced for a certain spot. Seq related to Prot ID: Sequences from a spot used to identify the protein. EST related to Prot ID: Number of
EST that matches with the protein identified with MS/MS peptides.
Spot ID Prot ID Pep Seq
Seq related to Prot ID
EST related to Prot ID
1123 Keratin S8 type I 11 2 6 1439 Apolipoprotein A-IV1 5 2 4 1507 Ferritin subunits (H, M, L) 7 3 5 1146 Tropomyosin 4 isoform 1 11 3 4
1512 Putative transient receptor protein 2 or
Myosin light chain 4 4 4 1422 Peroxiredoxin 6 8 1 1 1102 Glyceraldehyde 3-phosphate dehydrogenase 8 2 2 284 Alpha-2-macroglobulin-1 5 1 1 1147 Tropomyosin 2 9 8 7 801 Cytosolic non-specific dipeptidase 11 4 3 581 Keratin 10 4 3 1030 Keratin 18 9 5 3 1119 Tropomyosin 7 7 4 1411 Glutathione S-transferase 9 2 1 1031 Keratin 18 7 2 1 298 Chaperone protein GP96 8 2 1 277 Alpha-2-macroglobulin-1 5 2 1 267 Alpha-2-macroglobulin-1 9 4 2 1424 Peroxiredoxin 6 8 5 2 1134 Annexin A3 8 3 1 1032 Proteasome 26S subunit ATPase 6 9 3 1 253 Alpha-2-macroglobulin-1 9 3 1 851b ATP synthase β-subunit 10 8 2 1439b Proteasome subunit beta type 5 5 1 0 1440 Ubiquitin C-terminal hydrolase 15 5 0 1409 LRP16 protein 5 1 0 1393 Short-chain dehydrogenase/reductase 9 5 0 1294 3-hydroxyisobutyrate dehydrogenase 10 3 0 1204 similar to oxidative-stress responsive 1 6 1 0 1189 HEAT-like repeat containing 1 5 2 0 1139 NADH dehydrogenase 5 5 1 0

172
Chapter 3
Table 3.9 (continuation).- Coincidences between MS/MS peptide sequences and EST from S. senegalensis
Spot ID Prot ID Pep Seq
Seq related to Prot ID
EST related to Prot ID
1106 Keratin 8 4 1 0 1017 3-hydroxyisobutyryl-Coenzyme A hydrolase 6 3 0 932 Interferon induced protein 56 4 1 0 541 Keratin 4 1 0 540 Keratin 9 2 0 531 Hemopexin 8 2 0 521 Rho guanine nucleotide exchange factor 1 1 0 438 Hemopexin 4 1 0 431 Hemopexin 5 2 0 424 Hemopexin 5 2 0 265 Alpha-2-macroglobulin-1 5 1 0 263 Alpha-2-macroglobulin-1 7 2 0 261 Alpha-2-macroglobulin-1 6 1 0 250 Alpha-2-macroglobulin-1 7 2 0 240 Alpha-2-macroglobulin-1 7 2 0
Figure 3.13.- DNA microarray hybridization results for the comparison between
GnRHa (Cy3 Control) and GnRHa+OA (Cy5 Sample). Normalized intensities of the
triplicate of each transcript for Cy3 and Cy5 are plotted in panel (a). The cut-off
threshold to determine transcripts that are up or down-regulated is ±3 σ (points
outside the blue line). A fold change value of +1.2 reflects a 20% up-regulation, while -
1.4 means a 40% of down-regulation. The P threshold is set at 0,01, meaning that
probability of an observed variation is not because of an stochastic event is 99%.
GnRHa+OA down-
regulated
GnRHa+OA up-regulated transcripts

Chapter 3
3.3 Discussion
3.3.1 Effect of hormone treatments on sperm and testis physiological features
The effects of hormone treatment on the measured physiological parameters were
notable, especially in the amount of milt produced and the number and motility of
spermatozoa. Among all these parameters, spermatozoa motility seems to be the most
critical aspect to achieve successful fecundation in fish species (Coward 02). The
GnRHa+OA treatment increased spermatozoa motility more than two times. When
GnRHa was applied to animals the production of milt was doubled respect to controls,
but when OA was present the amount of milt produced was decreased to control levels.
These data indicate that GnRHa+OA treatment possibly generates less but more
capable spermatozoa, and therefore the fertility of these animals could be higher than
that from control or GnRHa treated fish.
The study from Agulleiro et al (2007) described that males treated with GnRHa+OA had
a much stronger and sustained increase of 11-KT plasma levels than males treated with
GnRHa alone. Also, males treated with GnRHa+OA showed more Leydig cells and a
higher proportion of spermatozoa per seminiferous lobule in the testis with respect to
males treated with only GnRHa. These data clearly indicated that GnRHa+OA effectively
accelerated spermatogenesis, and such acceleration of spermatogenesis was possibly
associated with the production of more capacitated sperm, thereby increasing its
motility.
In studies on spermatogenesis in other fish species, it was described the key role in
sperm motility of the gonadotropin-induced 17α,20β-P hormone, by increasing the pH of
sperm duct. However, 11-KT and testosterone do not show any direct effect on the
acquisition of sperm motility in fish (Miura 92, Nagahama 94). In the present study we
found that sperm motility was increased in presence of OA, a precursor of 11-KT.
Therefore, it is most likely that sperm motility in the Senegalese sole is increased by
enhancing the plasma levels of 11-KT, which might induce the synthesis of maturation-
induction steroids in the testis (Agulleiro 07).
173

Chapter 3
3.3.2 Evaluating DIGE for expression changes in testis proteome
In the previous chapter, a 2-DE approach along with silver staining was used to
characterize several expression changes during spermatogenesis stages in testis from
wild and cultured individuals of S. senegalensis. In this chapter 2-D DIGE conditions
were optimized to evaluate the expression changes in testis by using, for comparison,
the same type of samples already analyzed by silver staining. The S2S and DIGE
evaluation experiments aimed to determine whether DIGE approach was valuable for
the analysis of testis proteome, and to set up the conditions to analyze variations in the
hormone treatment experiment. Moreover, comparing both 2-DE methodologies could
give an idea about how complemetary these two methodologies are.
The S2S experiment showed a good linearity among the different labelled samples,
validating the CyDye labelling procedure for the solea testis extracts. Some deviation
from linearity was observed for spots with normalized volumes higher than 20. In the
final setup, spots with volumes above this limit were discarded from the comparison in
the spot detection step in the DIA module. As most of the spots (over 95%) presented
values of normalized volumes under 20, elimination of outsiders produced less noisy
results with a minimal loss of information.
As a second part of the set up of the DIGE technology, results from comparable
experimental designs for silver 2-DE and DIGE were analysed. In order to perform this
comparison, testis sample from the same animals classified in chapter 2 as F0M, F0L
and F0Mat were processed under DIGE compatible protocols. Fifteen differential spots
were processed using the same protocol than in chapter 2. Procedures described there
for mass spectrometry, bioinformatic and BLAST comparison generate results of the
same quality in terms of MS/MS spectra quality, de novo sequencing scores for Peaks
and Lutefisk, and BLAST scores. Proportionally, the number of identified proteins was
very similar (DIGE: 12 out of 15 -80%; Silver: 40 out of 49 -82%).
Two spots were found coincident between the DIGE and the silver staining analyses.
One of the reasons explaining the different spot datasets found with each methodology
could lie on the chemical fundaments of protein detection of each experiment. CyDyes
are covalently attached to the epsilon amino group of lysine of proteins via an amide
linkage. The proportion of cyanine to protein is set in order to label only 1-2% of lysines
174
Chapter 3
present in the sample. This substeochiometric labelling lead to a situation where lysine-
rich proteins will have a higher probability of being labelled and thus detected than
proteins with less lysines. In accordance, an empirical reduction of about 20% of the
total number of spots was found in a DIGE image in comparison to silver stained image
of the same gel when compared. In overall, besides silver staining can be considered a
more universal staining method than DIGE, both methods show different specificities,
originating collections of proteome components that can differ significantly. Selection of
any of the two methods must be considered thus for each case in terms of throughput
and the need for visualizing the maximum possible number of spots.
In the present case, the use of both approaches has extended the number of
characterized proteins that could be involved in molecular processes related to
spermatogenesis.
3.3.3 DIGE of testis proteome after hormone treatment
After evaluating the suitability of the DIGE system for studying the proteome of S.
senegalensis testis, the analysis of samples from the hormone treatment experiment
was performed. The complete set of comparisons produced 59 unique differential spots.
Few of these spots were exclusive for each comparison, indicating that the majority of
them are involved in the physiological processes affected by the different hormone
treatments. Variations of these spots were mainly between ±1,5 to ±5-fold, with only few
cases with variations over ±5.
3.3.4 Combining Mr, pI and sequencing information to validate protein identification
Proteins were identified as previously described (see pages 65-67). Regarding to de
novo sequencing softwares, also in this case, Peaks was more efective in producing de
novo sequences with a good BLAST matching than Lutefisk (see 2.3.3).
As discussed in chapter 2, comparison of experimental and theoretical Mr and pI values
for the identified proteins provided additional information on possible
modifications/fragments from the database canonical sequence and also helped to
175

Chapter 3
validate the tentative assignations (see graphics in Annex III.4 and III.5). In cases when
high differences between experimental and theoretical values were observed, the
number of MS/MS peptides assigned to the identified proteins become then very useful
to increase confidence in correct protein assignation to a certain spot.
Table 3.10.- Classification of differential spots in hormone experiment based on
comparison and variation. Unique spots indicate the number of spots whose variation is
considered significant only in that comparison. Spots in each classification are divided in
two groups depending on their change ratio.
Spots with
Differential spots over
±1,5 fold change
Unique spots over
±2 fold change 5≥ ∆ >2 10≥ ∆ >5
F0Mat-F1C 35 5 17 1
F0Mat-F1GnRHa 18 0 5 1 F0Mat-
F1GnRHa+OA 41 2 18 1
F1C-F1GnRHa 23 3 7 0 F1C-
F1GnRHa+OA 33 7 14 0
F1GnRHa-
F1GnRHa+OA 25 4 7 0
Unique Total 59 20 58 1
As explained in chapter 2 (section 2.3.3), differences over ±0,2 and ±2 between
theoretical and experimental values of Mr and pI, respectively, were taken as the
threshold values to determine possible erroneous identifications (figure 3.14). About half
of the tentatively identified proteins showing differential levels after hormone treatment
(22 out of 46), were under these limits. Moreover, their identifications were fully
supported by 2 to 7 sequenced peptides and more than 7 aminoacid coincidences in
BLAST comparison. For spots over these references values, the number of assigned
sequences (≥2 peptides) or the number of aminoacid identities (≥9 coincidences) in the
BLAST alignments supported the assignment. Explanation for these differences in Mr
and/or pI values is available in chapter 2 and in table 3.11. Only four spots presented
∆Mr and ∆pI values over the arbitrary reference and could only be supported by one
peptide or a number of aminoacid coincidences under 7 in the BLAST analysis. These
176

Chapter 3
spots were not taken into account for further biological interpretations of hormone
treatments in S. senegalensis testis proteome.
Forty and forty-six protein assignations in chapters 2 and 3, respectively, fulfilled the
described criteria for confirming protein assignation in the current work. Only the
assignation of 3 proteins with high values of ∆Mr and/or ∆pI and just one supportive
sequenced peptide were deleted from following discussions about biological meaning of
the observed variations. Both in chapter 2 and 3, the explained parameters proportioned
an extra quality control in protein identification that may be of interest for other gel-based
proteomic studies on species without sequenced genome like S. senegalensis.
Data in chapter 2 indicated that tryptic peptides would match to the corresponding EST
with more probability when they are placed closer to the C-terminus of the
corresponding protein. This fact has been confirmed after EST analysis from peptides in
the hormone treatment experiment (figure 3.15). Moreover, the observation of the
matching ratio from proteins with higher and lower Mr suggest that, with a fixed number
of sequenced peptides assigned to a protein, peptides from high Mr proteins present
less probability to match EST than peptides from low Mr protein. The explanation of this
observation is also based in the procedure of ESTs obtainment. In this case, the longer
the protein is, the less probable is to catch a sequencing region on the EST intersecting
one of the available peptide sequences. This will be in agreement with the fact that for a
protein like ATP synthase β-subunit (spot 851b; Mr 56) with 8 sequenced peptides
assigned, only to 2 peptides were found matching an EST, while in the case of
tropomyosin (spot 1147; Mr 41) also with 8 assigned peptides match an EST with 7
peptides.
177

Chapter 3
Figure 3.14.-Distribution of spots identified in the spermatogenesis stages (Silver) and
the hormone treatment experiment (DIGE) depending on the difference between
experimental and theoretical values of Mr and pI. Spots with values greater than ±0,2
and ±2 for Mr and pI respectively are identified. Normalized value is calculated as
(Experimental value-Theoretical value) / (Experimental value + Theoretical value). (+, +) indicates experimental value is higher both for Mr and pI. See figure 2.12 in page 107 for
legend of plus and minus pairs and table 3.11 for spot identifications.
178

Chapter 3
Table 3.11.- Spots identified in the spermatogenesis stages comparison (Silver) and the
hormone experiment (DIGE) with differences between experimental and theoretical
values of Mr and pI greater than 0,2 and 2, respectively (figure 3.14). Exp= Experiment
where the spots was differential. S= Silver: Spermatogenesis stages comparison. D=
DIGE: Hormone treatment experiment; Peptides Seq/ID= Number of MS/MS sequenced
peptides and peptides yielding protein identification; Mr/pI region= in figure 3.14,
quadrant where the spot is placed (see figure 2.12 in page 107 for description of plus-
minus pairs); Tentative explanation= Possible reasons for differences between
experimental and theoretical values of Mr and pI.
Exp Spot ID Prot ID Peptides Seq/ID
Mr/pI Region
Tentative explanation
D 1123 Keratin S8 type I 11/2 -/- Fragment or homology
difference
D 240-284 Alpha-2-macroglobulin-1 7/2 -/- Precursor
S 2339 Hydroxysteroid (17-beta) dehydrogenase 4
6/2 -/- Homology difference
S 3013 Transgelin 2 2/2 -/- Homology difference
S 3122 Myosin light chain alkali 2/2 -/- Fragment or homology
difference
D 1204 Oxidative-stress resp 1 6/1 -/- Fragment or homology
difference
D 1439b Proteasome β type 5 5/1 -/- Error in protein assignation
D 1139 NADH dehydrogenase 5 5/1 -/- Error in protein assignation
D 1424 Peroxiredoxin 6 8/5 0/- Phosphorylation
D 424-431-438 Hemopexin 5/2 +/- Precursor
S 1966 Serine (or cysteine)
proteinase inhibitor 11/3 +/- Homology difference
S 2667 Ubiquitin C-terminal hydrolase
3/3 +/- Precursor
S 2897 Cofilin 3/2 +/- Precursor
S 2176 Acidic ribosomal phosphoprotein P0
2/2 +/- Homology difference
S 1963 Olfactory receptor Olr653 1/1 +/- Error in protein assignation
S 2174 Polymerase (RNA) II (DNA directed) polypeptide C
1/1 +/- Precursor or homology
difference
S 2837 Heterochromatin-specific nonhistone protein
1/1 +/- Precursor or homology
difference
S 2877 Histidyl-tRNA synthetase 1/1 +/- Homology difference
S 2738 Proteasome subunit beta 4/3 +/+ Precursor or PTM
S 2521 6-phosphogluconolactonase
3/2 +/+ Precursor or PTM
179

Chapter 3
>gi|47218629|emb|CAG04958.1| ATP synthase β-subunit [Tetraodon nigroviridis]
MLGAVGRCCTGALQALKPGVQPLKALVGSPAVLARRDYVAPAAAAATANGRIVAVIGAVVDVQF
DEGLPPILNALEVAGRDSR R
LGRI
AGVGKTVLI HEMIESGVINLKDTTSKVALVYGQ
MNEPPGARARVAL EGQDVLLFIDNIFR
LVLEVAQHLGENTV TIAMDGTEGLVRGQKVLDTGAPIRIPVGPET
MNVIGEPIDERGPITTKQTAPIHAEAPEFTDMSVEQEILVTGIKVVDLLAPYAKGGKIGLFGG
MELINNVAKAHGGYSVFAGVGERTREGNDLY
TGLTVAEYFRDQ FTQAGSEVSALLGRIPSAVGYQ
IMDPNIVGAEHYDVAR
PTLA
TDMGTMQERITTTKKGSITSVQAIYVPADDLTDPAPATTFAHLDATTVLSRAIAELGIYPAVDPLDS
TSR GVQKILQDYKSLQDIIA
EVIELPLTNPELFQRVGIIPPKGCLLY ASQLDCNFL
KVVSSSIVD
ILGMDELSEEDKLTVARARKIQRFLSQPFQ
VAEVFTGHLGKLVPLKETIKGFQSILAGEYDALPEQAFYMVGPIEEVVQKAKKLVEEQS
>gi|54035446| 26S protease regulatory subunit S10B [Danio rerio] MAENREKGLQDYRKKLLEHKEIDGRLKELREQLKELTKQYEKSENDLKALQSVGQIVGEVLKQLT
EEKFIVKATNGPRYVVGCRRQLDKSKLKPGTRVALDMTTLTIMRYLPREVDPLVYNMSHEDPGS
VSYSEIGGLSEQIRELR GPPGTGKTLLARAV
KYIGESARLIREMFNYARDHQPCIIFMDEIDAIGGRRFSEGTSADREIQRTLMELLNQ
MDGFDTLHRVKMIMATNRPDTLDPALLRPGRLDRKIHIELPNEQARLDILKIHSGPITKHGDIDYEA
IVKLSDGFNGADLRNVCTEAGMFAIRAHEYVTQEDFMKAVRK
LLGDVFPNFEADTTIGKIKFHEFLGNS DFTPVCTTELARAAKLHEEFKKRDVK
LSILYPATTGR
VADSKKLESKLDYKPV
>gi|37748290|gb|AAH59671.1| Peroxiredoxin 6 [Danio rerio] MPGI WGILFSHPR
MIALSIDSVEDHRKWSEDILAFNQDKACCPMPFPIIADDKRELSVLLGMLDPDERDKDGMPLTAR
CVFVVGPDKRLK NFDEILRVVDSLQLTATKKVATPVDWKPGQEVMVIPSLSDEE
ANKLFPAGFTLKEVPSGKKYIRYTKP
Figure 3.15.- Peptides described for spots 851b, 1032 and 1424 (underlined) were
aligned over the predicted protein (ATP synthase β-subunit, 26S protease regulatory
subunit S10B, Peroxiredoxin 6, respectively). Peptides giving a correspondence with S.
sengalensis EST (CL52Contig1, CL516Contig1 and CL1Contig9, respectively) are
placed close to the C-terminal aminoacid sequence (underlined). Peptides close to the
N-terminal find an EST correspondence with less probability than peptides next to C-
terminal.
180

Chapter 3
3.3.5 Biological implications
Spots with significant variations in the protein levels along the different studied states
were classified into several groups, based on their protein profiles, in order to unmask
proteins changing in the same direction due to hormone treatments. Spots changing
exclusively in one comparison more than ±1,9 folds were also selected as tentative
markers for a certain state (table 3.12). Literature data and protein database annotations
for these spots were analyzed in order to link determined variations in testis proteome
with observed physiological and histological features in each studied state.
Table 3.12.- Spot ID and Prot ID of the differential spots unique to each experimental
comparison in the hormone experiment.
Unique spots Unique spot ID Protein identification for unique spots
F0 Mat-F1C 5
431
438
1204
1380
1639
Hemopexin
Hemopexin
Similar to oxidative-stress responsive 1
No ID
No ID
F0 Mat-
F1GnRHa 0 ---- ----
F0 Mat-
F1GnRHa+OA 2
250
1422
Alpha-2-macroglobulin-1
Peroxiredoxin 6
F1C-F1GnRHa 3
1119
1147
1411
Tropomyosin
Tropomyosin 2
Glutathione S-transferase
F1C-
F1GnRHa+OA 8
581
932
1030
1031
1032
1393
1409
1440
Keratin
No ID
Keratin 18
Keratin 18
Proteasome 26S subunit ATPase 6
Short-chain dehydrogenase/reductase
LRP16 protein
Ubiquitin C-terminal hydrolase
F1GnRHa-
F1GnRHa+OA 4
265
267
277
1017
Alpha-2-macroglobulin-1
Alpha-2-macroglobulin-1
Alpha-2-macroglobulin-1
3-hydroxyisobutyryl-Coenzyme A hydrolase
181
Chapter 3
In the general introduction, it was reported that males in F0Mat state are at maximum
spawn stage, producing spermatozoa with high motility, without morphological
abnormalities, and with the highest fecundation rate relative to any other stage (Anguis
05). Therefore, for this study, F0Mat stage was considered as the optimum stage of
spermatogenesis to be reached in captivity. As the observed morphological and
physiological features of testis from F1 Control fish were away from that stage, it could
be expected that an effective hormone treatment should bring the situation to a
phenotype as close as possible to the F0Mat state.
The physiological data obtained suggest that the GnRHa+OA treatment was the most
effective procedure to improve the spermatogenic process, since spermatozoa motility
was increased (figure 3.2). In consequence, proteins with relevant variations between
F1 Control and F1 GnRHa+OA, and presenting levels similar to the state considered
here as optimum (F0Mat) could be of special relevance for male fish fertility.
Proteins with differential abundance level only after GnRHa+OA treatment (table 3.12)
present mainly two profile tendencies: the protein abundance is higher in GnRHa+OA
than in any other state (for example spots 581, 1030 and 1031; group 8 in figure 3.11) or
the protein level in the F0Mat state is lower than in F1 Control and similar to GnRHa+OA
(for example spots 1440, 1409, 1393, 1032; group 6 in figure 3.11). Accordingly, these
relevant spots were concentrated in two different regions of the dendrogram in the
cluster analysis (see table 3.7; subtrees 1-2 and subtrees 4-5, respectively)
These first five spots were all assigned to keratin or tropomyosin related proteins,
indicating an important role of GnRHa+OA treatment in structural rearrangements,
possibly leading to the observed increment of spermatozoa motility.
From the second set of spots, number 1393 was identified as short chain
dehydrogenase/reductase (SCHAD), a protein found in Danio rerio and Tetraodon
nigroviridis, and homologous to members of the 17-β hydroxysteroid dehydrogenase
family in other vertebrates. Labrie et al. (1997) described the activity of 17-β
hydroxysteroid dehydrogenases in human tissues and its importance in sex steroid
activity as a control point for its intracellular concentration. This family of enzymes has
two major roles: catalyze the conversion of androstenedione into testosterone, and
inactivate sex steroids to reduce its activity. Then, increased levels of 1393 in F1 Control
182

Chapter 3
could partially block the effect of testosterone in testis and, by consequence, affect the
spermatogenesis process. Therefore, the observed features in F1 Control can partially
be caused by an anomalous increased level of an enzyme that is reducing the activity of
testorene and its derivates.
In chapter 2 spot 2339, also related to the family of 17-β hydroxysteroid dehydrogenase
enzymes, was found to be increased in wild animals with respect to cultured fish, while
in this chapter spot 1393 present the opposite variation between wild and cultured fish.
This may indicate that, although functionally related, these proteins have different roles
in hormone metabolism in S. senegalensis. This family of proteins will become then
interesting candidates for further research on hormone regulation in both wild and
cultured Senegalese sole.
LRP16 protein (spot 1409) presented increased levels in F1 Control, but lower levels in
the other three states (F0Mat, F1 GnRHa, F1 GnRHa+OA). LRP16 protein has been
described as up-regulated by 17-β-estradiol effect through estrogen receptor in
mammals (Zhao 05). Estrogen receptors have been described in fish male reproductive
organs, where estrogen action was related to the renewal of spermatogonial stem cells
(Miura 99). Considering these observations, increased levels of LRP16 indirectly
suggest that estrogen concentrations are also increased in F1 Control state relative to
the F0Mat ideal state. The balance between androgen and estrogens is essential for
normal sexual development and reproduction (Conley 01). Hormone treatment may
normalize this steroid ratio, and then promote a normal spermatogenic process. Future
estrogen/androgen measurements in the studied states will be of great interest to
determine the effect of this balance on spermatogenesis in S. senegalensis.
Spots 1032 and 1440 were assigned, respectively, to proteasome 26S ATPase 6 and
ubiquitin C-terminal hydrolase, both involved in protein degradation. Their expression
profile indicated an accumulation of this protein in F1 Control fish. Levels after hormone
treatment were similar than expression in F0Mat, suggesting that steroid application
modified protein catabolic processes towards the desired spermatogenic state.
Implications in spermatogenesis of proteasome proteins and ubiquitin hydrolases/lyases
were already discussed in chapter 2.
183

Chapter 3
Spot 298 presented an expression profile similar to other spots described until now
(group 6 of figure 3.11). Spot 298 was assigned to chaperone gp96 of Danio rerio, a
protein with a 93% of homology with the mouse tumour rejection antigen gp96. This
protein has been localized on precursor germ cells but not on spermatozoa in the
seminiferous tubules of mouse testes (Asquith 05). In this study, chaperone gp96 was
highly abundant in F1 Control testis, but less abundant in the other three states,
indicating a major presence of germ cells than mature spermatozoa in F1 Control state.
This fact is coincident with the observations on histological preparation in Agullerio et al.
(2007). All together indicates that spermatogenesis in F1 Control presented a lower
number of mature spermatozoa than in the other three states, while after hormone
treatment it acquires similar levels to the F0Mat state. The monitorization of this protein
during spermatogenesis could be of interest as a biomarker of the maturation grade of
testis in S. senegalensis.
Summarising, the biological functions described for the proteins showing similar levels in
F0Mat and F1GnRHa+OA but differing in F1 Control and F1 GnRHa suggest that
testosterone effect is reduced in testis of F1 Control fish. This which can cause an
altered estrogen/androgen balance that will end in impaired spermatogenesis, as
demonstrated by the observed low spermatozoa motility and by the underexpression of
a mature spermatozoa biomarker for spermatozoids maturity (gp96). Other processes
like protein exchange of histones and protamines, and structural proteins could be also
involved in the increase of motility in the phenotype observed for F1GnRHa+OA fish
relative to F1 Control animals.
The GnRHa treatment influenced sperm volume but not the number of spermatozoa
produced (figure 3.2). Differential spots in testis of these animals could be related to
these processes, especially when they were expressed at the same level than F0Mat
fish but different in F1 Control or F1 GnRHa+OA states. Some of the spots assigned to
hemopexin (424, 431 and 438) and α-2-macroglobulin-1 (240, 250, 265 and 284) fit this
expression profile.
Alpha-2-macroglobulin-1 is a non-specific inhibitor of proteases produced in testis by
Sertoli cells, where it probably inhibits proteases from degenerating late spermatids, like
acrosin (Cheng 90). A lack of this activity leads to disruptions in the blood-testis barrier,
abnormal spermatozoa development and finally to infertility (Metayer 02). Then, the
184

Chapter 3
increment in the number of spermatozoa produced by GnRHa can be mediated by the
presence of this protease inhibitor. Interestingly, the protein level of some isoforms of α-
2-macroglobulin-1 was higher in GnRHa-treated fish than other cultured states, probably
indicating that PTM regulation is also playing a role in modulating the final α-2-
macroglobulin-1 activity.
Hemopexin spots showed protein levels in the GnRHa fish similar to those in F0Mat
animals. Hemopexin is a heme-binding protein which prevents oxidative stress caused
by free Fe species (Tolosano 02). Possible damage caused by oxidative stress on
spermatogenesis was already described in chapter 2. The presence of similar levels of
hemopexin in GnRHa and F0 Mat states could indicate similar protective conditions
against oxidative stress. This protective environment favours then the spermatogenic
process, and thus more spermatozoa could be produced in the GnRHa treatment with
respect to F1 Control and GnRHa+OA states.
The spots assigned to hemopexin and α-2-macroglobulin-1 are mainly grouped in the
subtree 3 of the cluster analysis (table 3.7), confirming a common expression pattern of
these proteins with protective functions on spermatozoa. This combinated protective
effect could explain the increase on the number of spermatozoa after GnRH treatment.
Spot 1507 was assigned to ferritin, a protein that has been described to store ionic Fe in
Sertoli and Leydig cells, thus providing this element to the developing gametes during
spermatogenesis (Wise 03). Protein levels in F1 states are almost two times less than in
males at F0Mat state. In mammals a decreased of intracellular ferritin is related to a
decrease of available Fe. Therefore, the low levels of ferritin in the testis of F1 males
might indicate a lack of available ionic Fe to gametes. The low availability of this element
was reported to affect adversely reproduction in other animals in captivity (Hidiroglou
79).
3.3.6 Complementing proteomic data with transcriptomic analysis
In chapter 2, few protein changes matching with the transcriptome analysis were
observed. This observation was however not unusual as judged from other combined
proteomic and genomic studies published (see references in 2.3.6). In the hormone
185

Chapter 3
experiment, direct correspondences at protein and mRNA level were not found. As
discussed in chapter 2, the lack of correspondence between mRNA and protein level
can be caused by several reasons: translational regulation, mRNA stability, splicing,
post-translational processing regulation, and partial analysis of protein isoforms, protein
degradation or a combination of these facts.
Figure 3.16.- Implication of UDP-glucuronate β-D-glucuronosyltransferase (E.C.
2.4.1.17) in androgen and estrogen metabolism in Danio rerio (KEGG pathway
dre00150). Enzyme 2.4.1.17 is involved in elimination of testosterone, androsterone,
etiocholan-3 α-ol-17-one, estrone, estradiol-17 β, estriol, and 2-methoxyestrone.
The extent of correspondence between mRNA and protein variations increases when
complete protein pathways are considered (Washburn 03). In this study, three elements
involved in the sex steroid pathway (proteins: SCHAD and LPRP16; gene: UDP-
glucuronate β-D-glucuronosyltransferase) were found as differential in proteomic and
186

Chapter 3
genomic analysis of testis under hormone treatment. The degree of correlation between
both approaches is similar to that described for yeast by Washburn et al. (2003), who
found five correlations at the pathway level, for instance at the purine or the aromatic
amino acid biosynthetic pathways.
The biological meaning of expression changes of UDP-glucuronate β-D-
glucuronosyltransferase should be related with its implication in the pathway of steroid
hormone elimination and in general detoxification (figure 3.16). The increment in
hormone treated states possibly indicates that the application of hormonal implants is
increasing the concentration of sex steroids. Probably, the hormone doses administered
to fish males were above the physiological levels, and therefore the fish responded by
activating the enzymes involved in hormone elimination.
In conclusion hormone treatments in males under captivity of the Senegalese sole led to
improvements in the number (GnRHa) and motility (GnRHa+OA) of spermatozoa. These
physiological progressions in spermatogenesis after hormone treatment were related to
the variation in the abundance of proteins involved in iron metabolism and in protective
functions on spermatozoa (GnRHa), and in testosterone catabolism, response to
estrogens and the exchange of histones and protamines (GnRHa+OA). Moreover, the
protein chaperone gp96 was proposed as possible biomarker for determining
spermatogenesis maturity in S. senegalensis.
Confidence on these protein identifications, performed through de novo sequencing of
MS/MS fragmented peptides and BLAST, was increased with further comparisons with
genomic EST from S. senegalensis and with the combined analysis of theorical and
experimental Mr and pI values along with MS/MS fragmented peptides.
In overall, these results constitute an original contribution for the flatfish aquaculture field
and proportion a new insight in the molecular mechanisms involved in the
spermatogenesis of the Senegalese sole.
187

Chapter 4
Database for 2-D LC MS/MS and 2-D gel-experiments of Solea senegalensis.

Chapter 4
The high-throughput experiments involved in modern “omic” technologies such as
genomics, transcriptomics, proteomics or metabolomics, generate vast amounts of
complex data. Projects dealing with any of these “omic” approaches should be then
prepared to deal with large amounts of data both at the processing stages as well as
during daily data retrieving and consultign (Wilke 03).
The Pleurogene project aims to integrate all the data from DNA microarrays, histological
preparations and proteome experiments performed within the project in an interactive
bioinformatic platform known as Pleuromold. This platform is derived from a previous
interactive database designed at Oryzon Genomics (OG), focused on the integration of
mRNA expression analyses and tissue histological preparations in Oryza sativa
(Mercadé in preparation). This type of integrative platforms, known as e-mold, recreates
an organism in silico enabling the integration of structural and molecular information.
Pleuromold was designed as a visual computer-based atlas where mRNA/protein
expression data is organized in function of the studied tissue. Precise sample features of
the target species like developmental stage or histological structure are strongly
considered to make the e-mold organization.
In collaboration with Jaume Mercadé from the OG Bioinformatic unit, data from 2-D LC
MS/MS (Chapter 1) and 2-D gel experiments (Chapters 2 and 3) were organized in a
database built into the framework of an e-mold designed at OG and, then integrated in
Pleuromold. In this way, information produced in the previous three chapters will be
available for other scientific groups interested in flatfish reproduction. Moreover, the
integration of genomic and proteomic data in an e-mold environment will provide a wider
vision of the Solea senegalensis reproduction and a better understanding of the flatfish
biology.
189
Chapter 4
4.1 Material and methods 4.1.1 Biological data
2-D LC MS/MS. The list of nearly 1300 peptides characterized in chapter 1, including all
parameters described for each entry, was considered for storing and consulting in the
database. This list was introduced with a brief method description of the 2-D LC MS/MS
system, and the bioinformatic treatment performed to the MS/MS spectra.
Histological preparations. Representative histological images of testis tissue
corresponding to the different spermatogenesis stages studied in chapter 2 (F0 Mid, F0
Late, F0 Mat, F1 Late, F1 Mat) and in chapter 3 (F0 Mat, F1 Control, F1 GnRHa, F1
GnRHa+OA) were included in the database. These images were introduced with a brief
description of the histological preparation and indications to interpret biological
structures present in the images.
2-D gel experiments. Low resolution (300 dpi) gel images acquired on a GS-800
Calibrated Densitometer (Bio-Rad) after silver staining were stored in the database. This
collection was accompanied by general experimental information and included 30 gel
images related with spermatogenesis stages (Chapter 2) and 6 more images related to
hormone treatment (Chapter 3). For each differential spots on chapter 2 and 3 (49 spots
and 59 spots, respectively), an information package was prepared containing the gel
image localization, the graphic of the normalized expression values in the studied states,
the statistical values of confidence in variation when proceed, the MALDI spectrum of
the digested spot, the n-ESI MS/MS of the sequenced peptides, the Peaks 2.4 and
Lutefisk 97 candidates for each sequenced peptides, the protein assignation of each
spot and the protein coverage of the sequenced peptides over the assigned protein.
4.1.2 Protein module database organization
2-D LC MS/MS. Peptide sequences were introduced in a tabulated text format. Each
entry included the sample identification (testis or larva) and the experimental source
190

Chapter 4
(2-D LC salt step), the accession number to NCBI and Unigene human protein
databases, the identification data obtained from BLAST comparison (score and e-value),
the peptide mass (Da) and charge of the MS/MS fragmented ion, the calculated peptide
charge at pH 3, and the Peaks 2.4 and Lutefisk 97 peptide sequence and score.
2-D gel experiments.- Information was organized taking into account the source
experiment. Accordingly, a main “Experiment“ field , identified with the key “id-exp”, was
created. This field holds several attributes including the “exp_type” that identifies the
study (spermatogenesis and hormone treatment studies indicated as "Silver" or "DIGE",
respectively) and a short experimental description of the experiments that could be
accessed through a “description” key.
Information related to the studied states of each experiment was included in the field
“State”. This field includes the name of the studied states (id_state), the “id_exp” where
each state is studied, an image of a 2-D gel from this state, and a testis histological
preparation of the mentioned state.
Data belonging to univocal identification of the spot inside the database was provided in
the “Spot” field by “id_spot”. This key term was formed with the name of the experiment
“id_exp” plus the “spot_name” (the number of the spot in each 2D experiment). For
instance in spot 2897 in the spermatogenesis stage experiment will be known as
Silver_2897. Under the “Spot” field it was also found the situation of the spot in a 2-D
gel (spot_map), the MALDI MS spectrum from after digesting the spot (Maldi), the
protein related to this spot (prot_id), and the histogram with the normalized volumes of
this spot in the states studied in the present experiment (histogram).
Sequence information from n-ESI MS/MS analysis and de novo sequencing was divided
in three fields. “Peptide”: Each sequenced peptide is named with an “id_peptide”
composed with the “id_spot” and its m/z value and charge. The fragmentation spectrum
is also presented. “Peaks”: For each sequenced peptide (id_peptide) the five candidates
are shown when available. “Lutefisk”: For each sequenced peptide (id_peptide) the five
candidates are shown when available. For both “Peaks” and “Lutefisk”, general
sequencing parameters are displayed.
191
Chapter 4
Final peptide sequences chosen to relate spots with identified proteins are found under
the “Sequence” field. Each sequence is identified by the “id_peptide”, the “prot_id” and
the “id_exp” keys. Information on the protein identified for each spot was located in the
“Protein“ field. This information included the protein name, the specie of homology
where protein was identified, the sequence coverage of the sequenced peptides for the
identified protein (sequence), the theoretical molecular mass and isoelectric point and a
short definition on biological aspects of the protein.
All these fields and terms were related inside the database structure as described in
figure 4.1, providing that each element inside the database is always univocally
identified to avoid conflicts during the query module.
4.1.3 Application architecture and implementation
The present application was implemented in a client server architecture to allow many
users working simultaneously and accessing the data in concurrent and remote
mode. Function in this client server architecture was divided in two parts: the server,
who manages the data storage and delivery, and the client, responsible of presenting
the server to the users and allowing them to perform operations on it.
A relational database was designed to capture all the relationships between
experimental data and to obtain fast and accurate retrieval. To ensure robustness and
reliability, open source MySQL 5.0 (www.mysql.com) was selected as the
Database Management system (DBMS).
A standalone client was implemented in Java (www.sun.com). Standalone applications
are more difficult to implement and deploy than other possibilities, but allow a friendly
interaction to the future user. On the other hand, Java selection takes full advantage of
graphical user interface (GUI) building libraries such as Swing. The possibility to employ
powerful 2D graphical imaging libraries such as Java Advanced Imaging (JAI), and to
provide portability to any operative system (OS) were also key points to determine this
selection. Java Database Connectivity (jdbc) application programming interface (API)
and driver were used in order to connect the client to the server.
192

Chapter 4
Figure 4.1.- Database structure for 2-D gels based experiments in the protein module.
Information is placed under eight fields “Experiment”, “State”, “Spot”, “Peptide”, “Peaks”,
“Lutefisk”, “Sequence” and “Protein”. Each field contains both data and field-linking terms. For
instance, “Spot” contains own terms like “histograms” or “Maldi”, and foreign keys to “Experiment”
(id_exp) or “Protein” (prot_id). Relationships between fields are depicted by arrows. Arrows
indicate relationship between fields. “Experiment” field Terms: id_exp= Identification of the 2D
experiment; intro_date= date when information is introduced in the DB; description= experimental
methodology; exp_type= protein detection method. “State” field Terms: id_state= experimental
group studied; 2d_gel=2-D gel image; ontology_link=image of tissue preparation. “Spot” field
Terms: id_spot =identification of the spot in the database; spot_map=gel image localizing spot;
spot_name= spot number in the database; Maldi=MALDI MS spectrum; prot_id= protein
identification in the DB; histogram=spot normalized expression volumes. “Peptide” field Terms:
id_peptide=peptide identification in the DB; Nesi=nESI MS/MS spectrum. “Peaks” field Terms:
peaks_seq=peptide candidates from Peaks2.4; peaks_data=de novo sequencing conditions for
Peaks. “Lutefisk” field Terms: lute_seq= peptide candidates from Lutefisk; lutefisk_data= de
novo sequencing conditions for Lutefisk. “Sequence” field Terms: sequence= peptide
sequence used to identify spot related protein. “Protein” field molweight=molecular weight of
the identified protein; IsoP=isoelectric point of the protein; prot_name=name of the protein in
NCBI protein DB; definition=biological functions related to the assigned protein.
193

Chapter 4
4.2 Results
4.2.1 Pleuromold interfaces
The Pleuromold interface is organized in three main parts: first a browsable tree that
contains an ontology of cell types, tissues and organs at distinct developmental stages
of the organism in study; second an atlas of interactive pictures coherent with those
terms included in the ontology; and third, two interactive lists to work with the
experimental data and a regions worklist. Behind the GUI, data is also organized in
three distinct and independent modules. Thus, it is possible to work in three different
query modes: expression data coming from microarray technology experiments,
expression data obtained from in situ hybridizations, and expression data from
proteomic experiments. The querying mode appears defined in the upper part of the
main frame (figure 4.1). Further explanations about modules and query modes are
focused only on those related to protein.
The GUI design allows the user to navigate intuitively through the organism data both by
using the tissue ontology tree or the picture atlas. Besides providing spatial and
developmental contextualization useful for analysis, the ontology tree and the atlas
contextualize the information displayed in the tool to the user. For those users unfamiliar
with the organism, the picture atlas includes graphical maps showing all those regions
and subregions included in the database that can be highlighted on demand. In a higher
degree of interactivity, the user can also ask the application to highlight only the regions
below the mouse pointer so they become evident one at a time, as the mouse pointer
moves over them (figure 4.2).
The information from proteomic experiments were displayed in two ways depending on
the primal experiment:
2-D LC MS/MS. Proteins identified from peptides sequenced in chapter 1 are distributed
depending on the original sample (testis or larva). Each protein list is then available
under the testis or larva entry in Pleuromold. Peptides originally sequenced in the
shotgun experiment can also be consulted for each protein in the list (figure 4.3).
194

Chapter 4
2-DE: In the case of testis, proteins could be originated from shotgun or 2-D gel
experiments. A general list of those proteins is displayed under testis description in
Pleuromold with the prefixes Exp1-[SHOTGUN] for 2-D LCMS/MS proteins, Exp 2-[2D
gel] for spermatogenesis stage study, and Exp 3-[2D gel] for hormone treatment
experiment. From this list, proteins are related to the original spot information in each 2-
D gel experiment. It is possible to consult the biological variation among the states in
each experiment, 2-D gel position, related MALDI-TOF, n-ESI MS/MS, peptide de novo
sequence and alignment of these peptides on the assigned protein ID (figures 4.4-4.7).
4.2.2 Pleuromold queries
Pleuromold allows for full acces to the data stored in the database. The basic querying
unit is the protein. Thus, by selecting a protein present in the work list, the user can
make questions such as regions containing proteomic experiments or regions where the
selected proteins were identified. Immediately, those regions appear listed in the region
work list, providing the user with a protein expression profile based on the ontology. The
same question can be performed to any region and the query retrieves all the present
proteins expressed in that region. These proteins appear redundantly in case where the
same protein was found in distinct experiments for the same region. This redundancy
allows the statement of the certainty of the expression and the independent retrieval of
information from each experiment.
Besides the simple queries described above, Pleuromold permits more refined
questions about protein presence using logical operations, both on proteins and regions
selected on the worklists. For instance, the user can perform a query about differential
proteins present in one region, but not in another, just by selecting the two regions of
interest. In the current implementation of the program the query operation is not
commutative, so to retrieve the proteins specific to the second region the user should
perform the same operation but interchanging the operands. An analogous query can be
performed by selecting proteins pairs in the work list. In this case, the user can ask for
regions where a given protein was specifically found relative to the other. Pleuromold
users can also perform sum and intersection operations on data. For instance, a
possible sum question could be proteins present in region 1 or in region 2, and for an
intersection question proteins that are present in both region 1 and 2 at the same time.
195

Figure 4.2.- Pleuromold
graphic interface (protein
module) showing the
tissue ontology tree
(left), the visual atlas
(right) and the interactive
worklist regions (down).
In the initial screen the
complete dorsal part of
S. senegalensis body is
displayed with the
gonadal region
highlighted. When this
region is selected
descriptions performed
on testis are presented
as described in the next
figure.
196
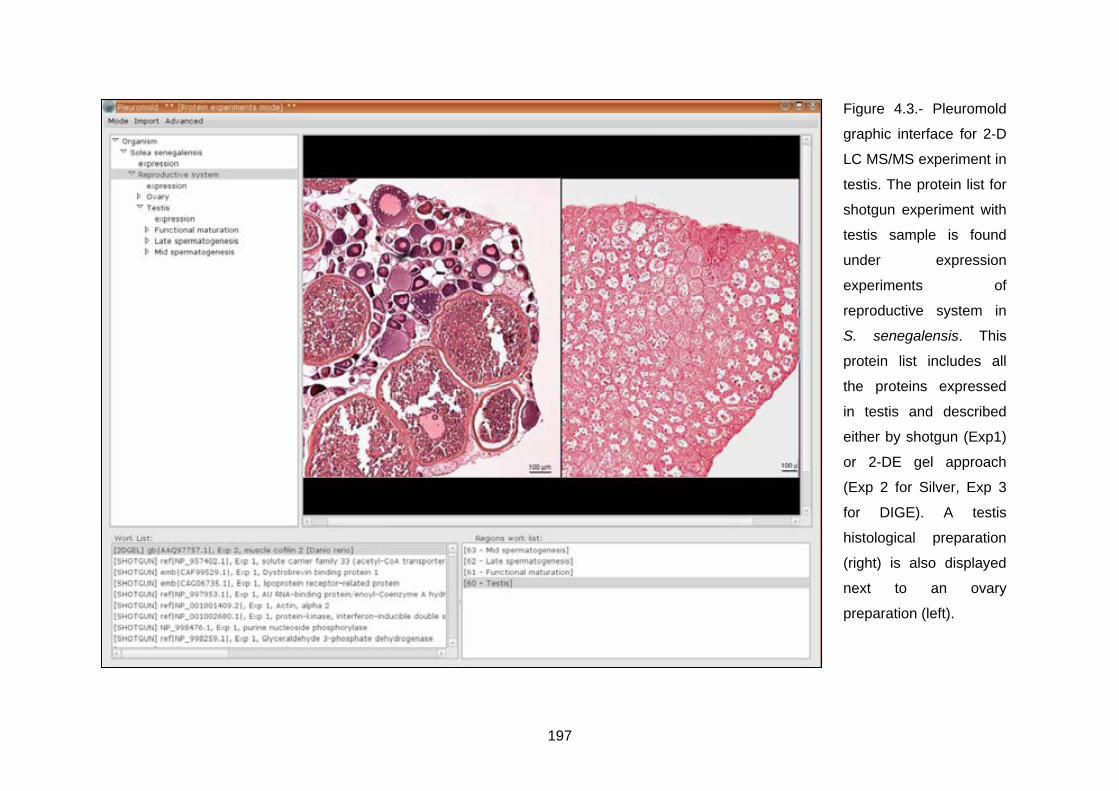
Figure 4.3.- Pleuromold
graphic interface for 2-D
LC MS/MS experiment in
testis. The protein list for
shotgun experiment with
testis sample is found
under expression
experiments of
reproductive system in
S. senegalensis. This
protein list includes all
the proteins expressed
in testis and described
either by shotgun (Exp1)
or 2-DE gel approach
(Exp 2 for Silver, Exp 3
for DIGE). A testis
histological preparation
(right) is also displayed
next to an ovary
preparation (left).
197

Figure 4.4.- Pleuromold
graphic interface (protein
module) for 2-D gel
experiment in testis (I).
From the general protein
list in figure 4.2, protein
cofilin 2 from Danio rerio
(NCBI accession number
gbIAAQ97757.1) related
to spot Silver_2897 was
selected. Histological
preparations of the
spermatogenesis stages
studied in chapter 2 are
displayed. In this figure
mid spermatogenesis
stage is selected.
198

Figure 4.5.- Pleuromold
graphic interface (protein
module) for 2-D gel
experiment in testis (II).
Gels available for spot
Silver_2897 assigned to
protein cofilin 2 (NCBI
gbIAAQ97757.1) are
displayed in the “Browse
2D gels” window (in this
case from F0 Functional
maturation). From this
window gels can be
selected and also
position for spot is
available. Mass
spectrometry information
is accessible from this
point as described in the
next figure.
199

Figure 4.6.- Pleuromold
graphic interface (protein
module) for 2-D gel
experiment in testis (III).
MS information available
for spot Silver_2897
assigned to protein
cofilin 2 (NCBI
gbIAAQ97757.1) is
displayed. The
information includes
MALDI-TOF spectrum of
digested spot and
fragmentation spectra of
some digested peptides.
From this point is
possible to consult de
novo sequence
candidates and protein
identification from these
sequences.
200
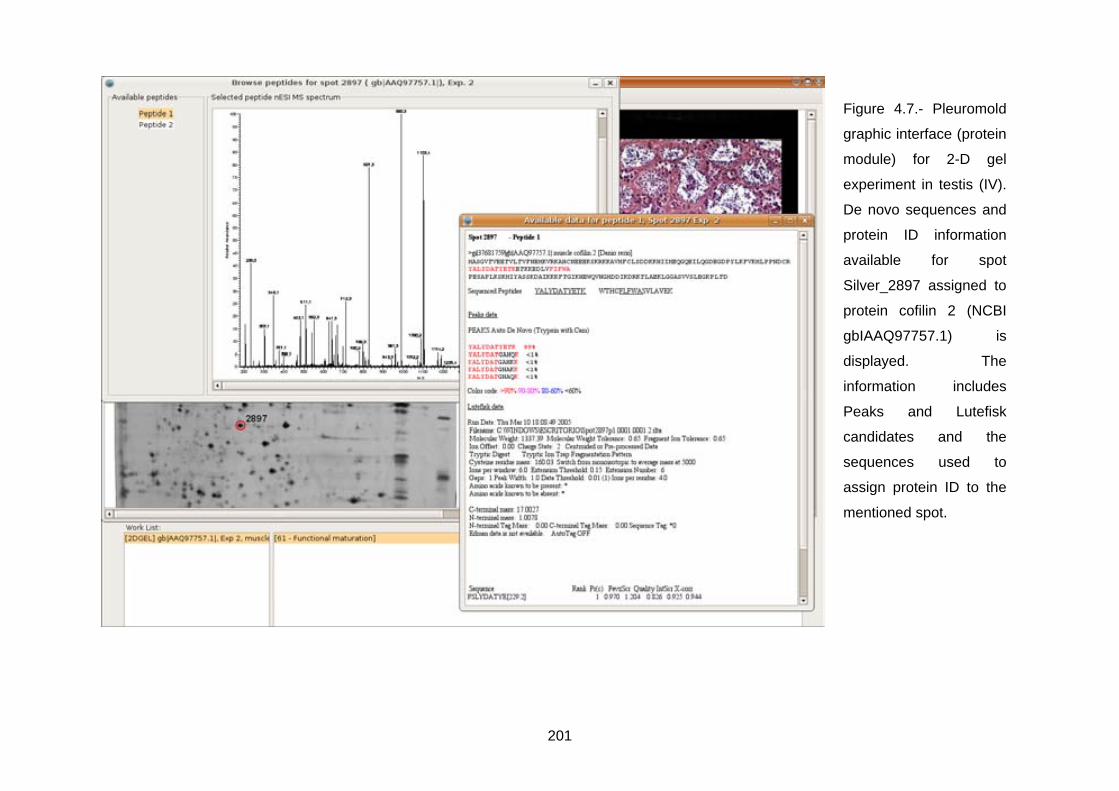
Figure 4.7.- Pleuromold
graphic interface (protein
module) for 2-D gel
experiment in testis (IV).
De novo sequences and
protein ID information
available for spot
Silver_2897 assigned to
protein cofilin 2 (NCBI
gbIAAQ97757.1) is
displayed. The
information includes
Peaks and Lutefisk
candidates and the
sequences used to
assign protein ID to the
mentioned spot.
201

Chapter 4
4.3 Discussion The information generated to describe S. senegalensis testis and larva at molecular
level during the Pleurogene project aims to yield new tools and basic knowledge on the
fish physiology, which could be of interest for optimizing flatfish culture and
commercialization. In this respect, Pleuromold provides a user-friendly storage and
consulting platform for the data generated inside the mentioned project.
Nowadays, three different types of public web-based databases have been designed
according to the available information. The first one integrates data principally from
already existing databases of proteins (NCBI, Uniprot, PDB) and genes (Ensemble,
GenBank; Hinrichs 06, Jones 06, Goesmann 05). These sorts of databases provide of a
common space for consulting existing gene/protein information. Other more specific
databases provide of organism (mouse embryonic development, Williams 96) or specific
tissue images (brain, Gustafson 07; dermopathology, Feit 05; breast histopathology,
Lundin 07) obtained using mainly photographs, histological techniques, tissue
microarrays or magnetic resonance imaging from the group publishing the database or
from already available data in different public collections. Images are then linked to
constitute an atlas, with different related information available during navigation. Finally,
the third type combines tissue image with tissue-related genomic data (Lein 07), similar
to what is described above for Pleuromold. Additional to data from DNA microarrays,
Pleuromold design assumes the inclusion of results from proteomic analysis and in situ
hibridations in the visual atlas of S. senegalensis. Moreover, Pleuromold users can
define the items to be displayed in the tissue ontology tree and participate in the creation
of the final tool. Data is also inserted directly after user decision, providing a customer-
tailored analysis instrument. This structure provides a general description of the
biological interest rather than only an image or gene/protein description alone, since the
gene or protein data is always contextualized in a biological ontology tree. Moreover, the
information displayed in Pleuromold was entirely obtained within the Pleurogene project,
as little previous information was available for genes, proteins or tissue from the
Senegalese sole. All the data then was generated with the purpose to fit an e-mold
platform. The result is a bioinformatic visual tissue atlas with genomic and proteomic
data available to perform consultancies at molecular level. Thus, Pleuromold is an
essential tool for designing further functional analysis on S. senegalensis and
homologous flatfish species.
202

Conclusions

Conclusions
Chapter 1
1.- More than one thousand and two hundred proteins from testis and larva of Solea
senegalensis were described for the first time. This dataset was obtained in an on-line
2-D LC-MS/MS system followed by de novo peptide sequencing method and
homology-driven protein identification.
Chapters 2 and 3
2.- The procedure to identify proteins from 2-D gels by tandem mass spectrometry, de
novo peptide sequencing, and homology-driven identification led to three hundred and
fifty-five tentative peptide sequences corresponding to near one hundred proteins of
Solea senegalensis testis.
3.- The proteomic and genomic analysis of testis in several spermatogenic stages from
wild and F1 cultured Solea senegalensis unravelled differences in proteins related to
the metabolism of testosterone, the histone replacement by protamines, the cell redox
balance and the flagellum morphogenesis in sperm. Disorders in these processes
would be involved in the detected impairment in sperm quality of F1 fish.
4.- The improvement of spermatozoa motility after the GnRHa+OA treatment on Solea
senegalensis males correlated with a variation in the level of proteins related to
androgen/estrogen balance.
5.- The increased number of spermatozoa observed in GnRHa-treated males of Solea
senegalensis coincided with variations in the abundance of proteins concerning to
protection against oxidative stress and extracellular proteases.
6.- The chaperone gp96 was proposed as a biomarker of maturation in
spermatogenesis of Solea senegalensis.
Chapter 4
7.- An integrative bioinformatics platform was specifically designed and developed to
store and consult in a general organism environment the information obtained by
proteomic techniques to describe the proteome of testis and larva from Solea
senegalensis.
203

mlReferences
References
Abian, J., Oosterkamp, A. J., Gelpí, E. (1999). "Comparison of conventional, narrow-bore and capillary liquid chromatography/mass spectrometry for electrospray ionization mass spectrometry: practical considerations." Journal of Mass Spectrometry 34(4): 244-254. Aebersold, R., Mann, M. (2003). "Mass spectrometry-based proteomics." Nature. 13(422): 198-207. Agell, N., Mezquita, C. (1988). "Cellular content of ubiquitin and formation of ubiquitin conjugates during chicken spermatogenesis." The Biochemical Journal 250: 883-889. Agulleiro, M. J., Anguis, V., Cañavate, J.P., Martínez-Rodríguez, G., Mylonas, C.C., Cerdà, J. (2006). "Induction of spawning of captive-reared Senegal sole (Solea senegalensis) using different administration methods for gonadotropin-releasing hormone agonist." Aquaculture 257: 511-524. Agulleiro, M. J., Scott, A.P., Duncan, N., Mylonas, C.C., Cerdà, J. (2007). "Treatment of GnRHa-implanted Senegalese sole (Solea senegalensis) with 11-ketoandrostenedione stimulates spermatogenesis and increases sperm motility." Comparative Biochemistry and Physiology, Part A In press. Åkerlof, E., Jornvall, H., Slotte, H. (1991). "Identification of apolipoprotein A1 and immunoglobulins as components of a serum complex that mediates activation of sperm motility." Biochemistry 30: 8986-8990. Alban, A., David, S.O., Bjorkesten, L., Andersson, C., Sloge, E., Lewis, S., Currie, I. (2003). "A novel experimental design for comparative two-dimensional gel analysis: two-dimensional difference gel electrophoresis incorporating a pooled internal standard." Proteomics 3(1): 36-44. Alpert, A. J., Andrews, P.C. (1988). "Cation-exchange chromatography of peptides on poly(2-sulfoethyl aspartamide)-silica." Journal of Chromatography 443: 85-96. Altschul, S. F., Gish, W., Miller, W., Myers, E.W., Lipman, D.J. (1990). "Basic local alignment search tool." Journal of Molecular Biology 215: 403-410. Anderson, L., Seilhamer, J. (1997). "A comparison of selected mRNA and protein abundances in human liver." Electrophoresis 18(3-4): 533-537. Anguis, V., Cañavate, J.P. (2005). "Spawning of captive Senegal sole (Solea senegalensis) under a naturally fluctuating temperature regime." Aquaculture 243: 133-145. Aparicio, S., Chapman, J., et al. (2002). "Whole-Genome Shotgun Assembly and Analysis of the Genome of Fugu rubripes." Science 297: 1301-1310. Aravinda, S., Gopalakrishnan, B., Dey, C.S., Totey, S.M., Pawshe, C.H., Salunke, D., Kaur, K., Shaha, C. (1995). "A testicular protein important for fertility has glutathione S-transferase activity and is localized extracellularly in the seminiferous tubules." Journal of Biological Chemistry 270(26): 15675-15685. Ashizawa, K., Wishart, G.J., Hashimoto, K., Tsuzuki, Y. (1995). "Dephosphorylation of a 30-kDa protein of fowl spermatozoa by the addition of myosin light chain kinase substrate peptide inhibits the flagellar motility." Biochemical and Biophysical Research Communications 215(2): 706-712. Baik, J. Y., Lee, M.S., An, S.R., Yoon, S.K., Joo, E.J., Kim, Y.H., Park, H.W., Lee, G.M. (2006). "Initial Transcriptome and Proteome Analyses of Low Culture Temperature-Induced Expression in CHO Cells Producing Erythropoietin." Biotechnology and Bioengineering. 93(2): 361-371. Baynes, S. M., Howell, B.R., Beard, T.W., Hallam, J.D. (1994). "A description of spawning behaviour of captive dover sole, Solea solea (L.)." Neth. J. Sea Res. 32: 271-275.
205
References
Baynes, S. M., Scott, A.P. (1995). "Seasonal variations of parameters of milt production and in plasma concentration of sex steroids of male rainbow trout (Salmo gaidneri)." General and Comparative Endocrinology 57: 150-160. Benbrahim-Tallaa, L., Tabone, E., Tosser-Klopp, G., Hatey, F., Benahmed, M. (2002). "Glutathione S-Transferase Alpha Expressed in Porcine Sertoli Cells Is under the Control of Follicle-Stimulating Hormone and Testosterone." Biology of Reproduction 66: 1734-1742. Berlinsky, D. L., King, W.V., Smith, T.I.J., Hamilton II, R.D., Holloway Jr., J., Sullivan, C.V. (1996). "Induced ovulation of Southern flounder Paralichthys lethostigma using gonadotropin releasing hormone analogue implants." Journal of the world aquaculture society 27: 143-152. Berlinsky, D. L., William, K., Hodson, R.G., Sullivan, C.V. (1997). "Hormone induced spawning of summer flounder Paralichthys dentatus." Journal of the world aquaculture society 28: 79-86. Berruti, G. (2000). "A Novel Rap1/B-Raf/14-3-3 u Protein Complex Is Formed in Vivo during the Morphogenetic Differentiation of Postmeiotic Male Germ Cells." Experimental Cell Research 257: 172–179. Billard, R. H. (1983). "Spermiogenesis in the rainbow trout (Salmo gairdneri). An ultrastructural study." Cell and tissue research 233(2): 265-284. Bjellqvist, B., Ek, K., Righetti, P. G., Gianazza, E. et al. (1982). "Isoelectric focusing in immobilized pH gradients: principle, methodology and some applications." Journal of Biochemical and Biophysical Methods 6: 317-339. Blom, K. F. (1997). "Strategies and Data Precision Requirements for the Mass Spectrometric Determination of Structures from Combinatorial Mixtures." Analytical Chemistry 69(21): 4354-4362. Blom, N., Gammeltoft, S., Brunak, S. (1999). "Sequence and Structure-based Prediction of Eukaryotic Protein Phosphorylation Sites." Journal of Molecular Biology 294: 1351-1362. Booy, A. T., Haddow, J.D., Ohlund, L. B., Hardie, D.B., Olafson, R.W. (2005). "Application of Isotope Coded Affinity Tag (ICAT) Analysis for the Identification of Differentially Expressed Proteins Following Infection of Atlantic Salmon (Salmo salar) with Infectious Hematopoietic Necrosis Virus (IHNV) or Renibacterium salmoninarum (BKD)." Journal of Proteome Research 4(325-334). Borg, B., Antonopoulou, E., Anderson, E., Carlberg, T., Mayer, I. (1993). "Effectiveness of several androgens in stimulating kidney hypertrophy, a secondary sexual character, in castrated male three-spined sticklebacks, Gasterosteus aculeatus." Canadian journal of zoology 71: 2327-2329. Cabreiro, F., Picot, C.R., Friguet, B., Petropoulos, I. (2006). "Methionine sulfoxide reductases: relevance to aging and protection against oxidative stress." Annals of the New York Academy of Sciences. 1067: 37-44. Cañavate, J. P., Fernández-Díaz, C. (1999). "Influence of co-feeding larvae with live and inert diets on weaning the sole Solea senegalensis onto commercial dry feeds." Aquaculture 174: 255–263. Carrascal, M. (2005). Estudio de la vía de presentación de péptidos por moléculas de MHC de clase II mediante estrategias proteómicas. Barcelona, University of Barcelona. Carrascal, M., Abián, J. (2003). Capillary separations. HPLC of Peptides and Proteins: Methods and Protocols., Humana Press Inc. 251: 143-164.
206
References
Carrascal, M., Carujo, S., Bachs, O., Abian, J. (2002). "Identification of p21Cip binding proteins by gel electrophoresis and capillary liquid chromatography microelectrospray tandem mass spectrometry." Proteomics 2: 455-468. Carrera, M., Cañas, B., Piñeiro, C., Vázquez, J., Gallardo, J.M. (2006). "Identification of commercial hake and grenadier species by proteomic analysis of the parvalbumin fraction." Proteomics 6(19): 5278-5287. Celis, J. E., Kruhoffer, M., Gromova, I., Frederiksen, C., Ostergaard, M., Thykjaer, T., Gromov, P., Yu, J., Palsdottir, H., Magnusson, N., Orntoft, T.F. (2000). "Gene expression profiling: monitoring transcription and translation products using DNA microarrays and proteomics." FEBS Letters 480(1): 2-16. Cerdà, J., et al. (In preparation). "Development and application of an oligo-based microaaray for a commercial marine flatfish, the Senegalese sole (Solea senegalensis): integration into the bioinformatic platform Soleamold." Chen, G., Gharib, T., Huang, C., Taylor, J., et al. (2002). "Discordant Protein and mRNA Expression in Lung Adenocarcinomas." Molecular and cellular proteomics 1(4): 304-313. Chen, H. Y., Sun, J.M., Zhang, Y., Davie, J.R., Meistrich, M.L. (1998). "Ubiquitination of histone H3 in elongating spermatids of rat testes." Journal of Biological Chemistry 273: 13165-13269. Chen, P. Y., Manninga, H., Slanchev, K., Chien, M., Russo, J.J., Ju, J., Sheridan, R., John, B., Marks, D.S., Gaidatzis, D., Sander, C., Mihaela Zavolan, M., Tuschl, T. (2005). "The developmental miRNA profiles of zebrafish as determined by small RNA cloning." Genes and Development 19: 1288-1293. Cheng, C. Y., Grima, J., Stahler, M.S., Guglielmotti, A., Silvestrini, B., Bardin, C.W. (1990). "Sertoli cell synthesizes and secretes a protease inhibitor, a-2-macroglobulin." Biochemistry 29(4): 1063-1068. Cheng, C. Y., Mruk, D. D. (2002). "Cell Junction Dynamics in the Testis: Sertoli-Germ Cell Interactions and Male Contraceptive Development." Physiological Reviews 82: 825-874. Choe, L. H., Aggarwal, K., Franck, Z., Lee, K.H. (2005). "A comparison of the consistency of proteome quantitation using two-dimensional electrophoresis and shotgun isobaric tagging in Escherichia coli cells." Electrophoresis 26(12): 2437-2449. Clearwater, S. J., Crim, L.W. (1998). "Gonadotropin releasing hormone-analogue treatment increases sperm motility seminal plasma pH and sperm production in yellowtail flounder Pleuronectes ferrugineus." Fish physiology and biochemistry. 19: 349-357. Conley, A., Hinshelwood, M. (2001). "Mammalian aromatases." Reproduction 121: 685-695. Cottrell, J. S. (1994). "Protein identification by peptide mass fingerprinting." Peptide research 7(3): 115-124. Coward, K., Bromage, N.R., Hibbitt, O., Parrington, J. (2002). "Gamete physiology, fertilization and egg activation in teleost fish." Reviews in Fish Biology and Fisheries . 12: 33–58. Davis, M. T., Beierle, J., Bures, E.T., McGinley, M.D., Mort, J., Robinson J.H.,Spahr C.S. , Yu W., Luethy, R. ,Patterson, S.D. (2001). "Automated LC–LC–MS–MS platform using binary ion-exchange and gradient reversed-phase chromatography for improved proteomic analyses." Journal of Chromatography B 752: 281-291.
207

References
Davis, M. T., Beierle, J., Bures, E.T., McGinley, M.D., Mort, J., Robinson, J.H., Spahr, C.S., Yu, W., Luethy, R., Patterson, S.D. (2001). "Automated LC-LC-MS-MS platform using binary ion-exchange and gradient reversed-phase chromatography for improved proteomic analyses." Journal of Chromatography B 752: 281-291. Dennis, G., Sherman, B.T., Hosack,D.A., Yang, J., Gao, W., Lane, H.C., Lempicki R.A. (2003). "DAVID: Database for Annotation, Visualization, and Integrated Discovery." Genome Biology 4(9): R60. DiMaggio, P. A. J., Floudas C.A. (2007). "De Novo Peptide Identification via Tandem Mass Spectrometry and Integer Linear Optimization." Analytical Chemistry 79: 1433-1446. Dinis, M. T. (1992). "Aspects of the potential of Solea senegalensis Kaup for aquaculture: larval rearing and weaning to artificial diets." Aquacult. Fish. Manag. 23: 515-520. Dinis, M. T., Ribeiro, L., Soares, F., Sarasquete, C. (1999). "A review on the cultivation potential of Solea senegalensis in Spain and in Portugal." Aquaculture 176: 27-38. Dodds, E. D., H. J. An, et al. (2006). "Enhanced peptide mass fingerprinting through high mass accuracy: Exclusion of non-peptide signals based on residual mass." Journal of Proteome Research 5(5): 1195-1203. Drake, P., Arias, A.M., Rodríguez, R.B. (1984). "Cultivo extensivo de peces marinos en los esteros de las salinas de San Fernando (Cádiz).Características de la producción de peces." Inf. Téc. Inv. Pesq 116: 23. Drevet, J. R. (2006). "The antioxidant glutathione peroxidase family and spermatozoa: A complex story." Molecular and Cellular Endocrinology 250: 70-79. Ekstedt, E., Holm,. L, Ridderstråle, Y. (2004). "Carbonic anhydrase in mouse testis and epididymis; transfer of isozyme IV to spermatozoa during passage." Journal of Molecular Histology 35: 167-173. Ekström, S., Malmström, J., Wallman, L., Löfgren, M., Nilsson, J., Laurell, T., Marko-Varga, G. (2002). "On-chip microextraction for proteomic sample preparation of in-gel digests." Proteomics 2: 413-421. Essader, A. S., , Cargile, B.J., Bundy, J.L., Stephenson, J.L. Jr. (2005). "A comparison of immobilized pH gradient isoelectric focusing and strong-cation-exchange chromatography as a first dimension in shotgun proteomics." Proteomics. 5(1): 24-34. Ethier, J. F., Findlay, J.K. (2001). "Roles of activin and its signal transduction mechanisms in reproductive tissues." Reproduction 121(5): 667-675. Feit, J., Kempf, W., Jedlickova, H., Burg, G. (2005). "Hypertext atlas of dermatopathology with expert system for epithelial tumors of the skin." Journal of Cutaneous Pathology 32: 433–437. Fenn, J. B., Mann, M., Meng, C.K., Wong, S.F., Whitehouse, C.M. (1989). "Electrospray ionization for mass spectrometry of large biomolecules." Science 246: 64-71. Finnskog, D., Ressine, A., Laurell, T., Marko-Varga, G. (2004). "Integrated Protein Microchip Assay with Dual Fluorescent- and MALDI Read-Out." Jourtnal of proteome research 3: 988-994. Fishelson, L., Delarea, Y., Gon, O. (2006). "Testis structure, spermatogenesis, spermatocytogenesis, and sperm structure in cardinal fish (Apogonidae, Perciformes)." Anatomy and embriology 211: 31-46.
208
References
Fröhlich, T., Arnold G.J. (2006). "Proteome research based on modern liquid chromatography – tandem mass spectrometry: separation, identification and quantification." Journal of Neural Transmission. 113: 973-994. Fuji, J., Iuchi, Y., Matsuki, S., Ishii,T. (2003). "Cooperative function of antioxidant and redox systems against oxidative stress in male reproductive tissues." Asian Journal of Andrology 5: 231-242. Fukai, T., J. Kuroda, et al. (2000). "Accurate mass measurement of low molecular weight compounds by matrix-assisted laser desorption/ionization time-of-flight mass spectrometry." Journal of the American Society for Mass Spectrometry 11(5): 458-463. García-López, A., Fernández-Pasquier, V., Couto, E., Canario, A.V.M, Sarasquete, C., Martínez-Rodríguez, G. (2006). "Testicular development and plasma sex steroid levels in cultured male Senegalese sole Solea senegalensis Kaup." General and Comparative Endocrinology 147: 343-351. García-López, A., Martínez-Rodríguez, G., Sarasquete, C. (2005). "Male reproductive system in Senegalese sole Solea senegalensis (Kaup):Anatomy, histology and histochemistry." Histology and Histopathology 20: 1179-1189. Gaspari, M., Verhoeckx, K.C.M., Verheij, R., van der Greef, J. (2006). "Integration of Two-Dimensional LC-MS with Multivariate Statistics for Comparative Analysis of Proteomic Samples." Analytical Chemistry 78: 2286-2296. Gibson, R. N. (2005). Flatfishes. Biology and Exploitation. Goesmann, A., Linke, B., Bartels, D., Dondrup, M., Krause, L., Neuweger, H., Oehm, S., Paczian, T., Wilke, A., Meyer, F. (2005). "BRIGEP—the BRIDGE-based genome–transcriptome–proteome browser." Nucleic Acids Research 33: W710–W716. Goos, H. J. T., Consten, D. (2002). "Stress adaptation, cortisol and pubertal development in the male common carp, Cyprinus carpio." Molecular and cellular endrocrinology 197(105-116). Görg, A., Weiss, W.,Dunn, M.J. (2004). "Current two-dimensional electrophoresis technology for proteomics." Proteomics 4: 3665-3685. Graham, K. L., Robinson, W.H., Steinman, L., Utz, P.J . (2004). "High-throughput methods for measuring autoantibodies in systemic lupus erythematosus and other autoimmune diseases." Autoimmunity 37(4): 269-272. Grier, J. H. (1975). "Aspects of germinal cyst and sperm development in Poecilia latipinna (Teleostei: Poeciliidae)." Journal of Morphology 146(2): 229-49. Grier, J. H. (1993). Comparative organization of Sertoli cells including the Sertoli cell barrier. The Sertoli Cell. G. M. D. Russell L.D.: 703-709. Gustafson, C., Bug, W.J., Nissanov, J. (2007). "NeuroTerrain – a client-server system for browsing 3D biomedical image data sets." BMC Bioinformatics 8(40). Gygi, S. P., Rist, B., Griffin, T.J., Eng, J., Aebersold, R. (2002). "Proteome analysis of low-abundance proteins using multidimensional chromatography and isotope-coded affinity tags." Journal of Proteome Research 1(1): 47-54. Gygi, S. P., Rochon, Y., Franza, B.R., Aebersold, R. (1999). "Correlation between Protein and mRNA Abundance in Yeast." Molecular and cellular biology 19(3): 1720-1730.
209

References
Haab, B. B. (2003). "Methods and applications of antibody microarrays in cancer research." Proteomics 3: 2116-2122. Hanash, S. M., Bobek, M.P., Rickman, D.S., Williams, T., Rouillard, J.M., Kuick, R., Puravs, E. (2002). "Integrating cancer genomics and proteomics in the post-genome era." Proteomics 2: 69-75. Harmin, S. A., Crim, L.W. (1993). "Influence of gonadotropic hormone releasing hormone analog (GnRH-A) on plasma sex steroids profiles and milt production in male winter flounder, Pseudopleuronectes americanus (Walbaum)." Fish physiology and biochemistry. 10: 399-407. Heinke, M. Y., Wheeler, C.H., Chang, D., Einstein, R., Drake-Holland, A., Dunn, M.J., dos Remedios, C.G. (1998). "Protein changes observed in pacing-induced heart failure using two-dimensional electrophoresis." Electrophoresis 19: 2021-2030. Hernandez, P., Müller, M., Appel, R.D. (2006). "Automated protein identification by tandem mass spectrometry: issues and strategies." Mass Spectrometry Reviews 25: 235-254. Hidiroglou, M. (1979). "Trace element deficiencies and fertility in ruminants: a review." Journal of Dairy Science 62(8): 1195-1206. Higginbotham, J. W., Smith, J.S., Smith, O.S. (1991). "Quantitative analysis of two-dimensional protein profiles of inbred lines of maize (Zea mays L)." Electrophoresis 12(425-431). Hinrichs, A. S., Karolchik, D., et al. (2006). "The UCSC Genome Browser Database: update 2006." Nucleic Acids Research 34: D590-D598. Hogstrand, C., Balesaria, S., Glover, C.N. (2002). "Application of genomics and proteomics for study of the integrated response to zinc exposure in a non-model fish species, the rainbow trout." Comparative Biochemistry and Physiology Part B 133: 523-535. Huang, T. Y., DerMardirossian, C., Bokoch GM (2006). "Cofilin phosphatases and regulation of actin dynamics." Current Opinion in Cell Biology 18: 26-31. Huber, M., Bahr, I., Kratzschmar, J.R.,Becker, A., Muller, E., Donner, P., Pohlenz, H., Scheneider, M.R., Sommer, A. (2003). "Comparison of Proteomic and Genomic Analyses of the Human Breast Cancer Cell Line T47D and the Antiestrogen-resistant Derivative T47D-r." Molecular and cellular proteomics 3: 44-55. Iannello, R. C., Dahl, H.H. (1992). "Transcriptional expression of a testis-specific variant of the mouse pyruvate dehydrogenase E1 alpha subunit." Biology of Reproduction 47(1): 48-58. Iannello, R. C., Young, J., Sumarsoni, S., Tymms, M.J., Dahl, H.M.,Gould, J., Hedger, M., Kola, I. (1997). "Regulation of Pdha-2 Expression Is Mediated by Proximal Promoter Sequences and CpG Methylation." Molecular and cellular biology 17(2): 612-619. Inaba, K., Dreanno,C., Cosson J. (2003). "Control of Flatfish Sperm Motility by CO2 and Carbonic Anhydrase." Cell Motility and the Cytoskeleton 55: 174-187. Jaillon, O., Aury, J-M., et al. (2004). "Genome duplication in the teleost fish Tetraodon nigroviridis reveals the early vertebrate proto-karyotype." Nature 431(21 OCTOBER 2004): 946-957. Jones, J., Cote, R.G., et al. (2006). "PRIDE: a public repository of protein and peptide identifications for the proteomics community." Nucleic Acids Research 34: D659–D663. Joos, T. O., Schrenk, M., Hopfl, P., Kroger, K., Chowdhury, U., Stoll, D., Schorner, D., Durr, M., Herick, K., Rupp, S., Sohn, K., Hammerle, H. (2000). "A microarray enzyme-linked immunosorbent assay for autoimmune diagnostics." Electrophoresis. 21(13): 2641-2650.
210
References
Karas, M., Hillenkamp, F. (1988). "Laser desorption ionization of proteins with molecular masses exceeding 10,000 daltons." Analytical chemistry 60: 2299-2301. Kaur, P. and P. B. O'Connor (2006). "Algorithms for automatic interpretation of high resolution mass spectra." Journal of the American Society for Mass Spectrometry 17(3): 459-468. Kimmel, C. B., Miller, C.T., Moens, C.B. (2001). "Specification and morphogenesis of the zebrafish larval head skeleton." Developmental biology 233(2): 239-257. Knight, M. I., Chambers, P.J. (2003). "Problems associated with determining protein concentrations." Molecular Biotechnology 23: 19-28. Knoll-Gellida, A., Andre, M., Gattegno, T., Forgue, J., Admon, A., Babin, P.J. (2006). "Molecular phenotype of zebrafish ovarian follicle by serial analysis of gene expression and proteomic profiling, and comparison with the transcriptomes of other animals." BMC Genomics 7(46). Koller, A., Washburn, M.P., Lange, B.M., Andon, N.L., Deciu, C., Haynes, P.A., Hays, L., Schieltz, D., Ulaszek, R., Wei, J., Wolters, D., Yates, J.R. 3rd. (2002). "Proteomic survey of metabolic pathways in rice." PNAS 99(18): 11969-74. Kwon, J., Kikuchi, T., Setsuie, R., Ishii, Y., Kyuwa, S., Yoshikawa, Y. (2003). "Characterization of the testis in congenitally ubiquitin carboxy-terminal hydrolase-1 (Uch-L1) defective (gad) mice." Experimental animals 52(1): 1-9. Labrie, F., Luu-The, V., Lin, S., Labrie, C., Simard, J., Breton, R., Brlanger, A. (1997). "The key role of 17b-hydroxysteroid dehydrogenases in sex steroid biology." Steroids 62: 148-158. Leijonhufvud, P., Åkerlo, E., Pousette, A. (1997). "Structure of sperm activating protein." Molecular Human Reproduction 3(3): 249–253. Lein, E. S., Hawrylycz, M.J., et. al. (2007). "Genome-wide atlas of gene expression in the adult mouse brain." Nature 445: 168-176. Leitner, A., Lindner, W. (2006). "Chemistry meets proteomics: The use of chemical tagging reactions for MS-based proteomics." Proteomics 6: 5418–5434. Lian, Z., Kluger, Y., Greenbaum, D.S., Tuck, D., Gerstein, M., Berliner, N., Weissman, S.M., Newburger, P.E. (2002). "Genomic and proteomic analysis of the myeloid differentiation program: global analysis of gene expression during induced differentiation in the MPRO cell line." Blood 100(9): 3209-3220. Lim, H. K., Pankhurst, N.W., Fitzgibbon, Q.P. (2004). "Effects of slow release gonadotropin releasing hormone analog on milt characteristics and plasma levels of gonadal steroids in Greenback flounder, Rhombosolea tapirina." Aquaculture 240: 505-516. Link, V., Carvalho, L., Castanon, I., Stockinger, P., Shevchenko, A., Heisenberg, C.P. (2006 a). "Identification of regulators of germ layer morphogenesis using proteomics in zebrafish." Journal of Cell Science 119(10): 2073-2083. Link, V., Shevchenko, A., Heisenberg, C.P. (2006 b). "Proteomics of early zebrafish embryos." BMC Developmental Biology 6(1). Liska, A. J., Popov, A.V., Sunyaev, S., Peg Coughlin, P., Habermann, B., Shevchenko A., Bork P., Karsenti, E., Shevchenko, A. (2004). "Homology-based functional proteomics by mass spectrometry: Application to the Xenopus microtubule-associated proteome." Proteomics 4: 2707–2721. López, J. L. (2007). "Applications of proteomics in marine ecology." Marine Ecology Progress Series 332: 275-279.
211

References
López, J. L., Mosquera, E., Fuentes, J., Marina, A., Vázquez, J., Alvarez, G. (2001). "Two-dimensional gel electrophoresis of Mytilus galloprovincialis: differences in protein expression between intertidal and cultured mussels." Marine Ecology Progress Series 224: 149-156. Love, D. R., Pichler, F.B., Dodd, A., Copp, B.R., Greenwood, D.R. (2004). "Technology for high-throughput screens: the present and future using zebrafish." Current Opinion in Biotechnolgy 15: 564-571. Lundin, M., Lundin, J., Helin, H., Isola, J. (2004). "A digital atlas of breast histopathology: an application of web based virtual microscopy." Journal of Clinical Pathology 54: 1288–1291. MacCoss, M. J. (2005). "Computational analysis of shotgun proteomics data." Current Opinion in Chemical Biology 9: 88-94. MacCoss, M. J., McDonald, W.H., Saraf, A., Sadygov, R., Clark, J.M., Tasto, J.J., Gould, K.L., Wolters, D., Washburn, M., Weiss, A., Clark, J.I., Yates, J.R. 3rd. (2002). "Shotgun identification of protein modifications from protein complexes and lens tissue." PNAS 99(12): 7900-7905. Mann, M. (1995). "Useful tables of possible and probable peptide masses." 43rd ASMS Conference on Mass Spectrometry and Allied Topics, Atlanta, GA. Marengo, E., Robotti, E,, Antonucci, F., Cecconi, D., Campostrini, N., Righetti, P.G. (2005). "Numerical approaches for quantitative analysis of two-dimensional maps: a review of commercial software and home-made systems." Proteomics 5(3): 654-666. Marouga, R., David, S., Hawkins, E. (2005). "The development of the DIGE system: 2D fluorescence difference gel analysis technology." Analytical and Bioanalytical Chemistry 382: 669-678. Martin, S. A., Vilhelmsson, O., Medale, F., Watt, P., Kaushik, S., Houlihan, D.F. (2003). "Proteomic sensitivity to dietary manipulations in rainbow trout." Biochimica et Biophysica Acta 165(1-2): 17-29. Martínez, I., Tone Jakobsen, F. (2004). "Application of proteome analysis to seafood authentication." Proteomics 4(2): 347-354. Martin-Robichaud, D. J., Powell, J., Wade, J. (2000). "Gonadotropin-releasing hormone affects sperm production of Atlantic halibut (Hippoglossus hippoglossus)." Bulletin of the Aquaculture Association of Canada 4: 45-48. Maux, D., Enjalbal, C., Martínez, J., Aubagnac, J.L. (2002). "New example of proline-induced fragmentation in electropray ionization mass spectrometry of peptides." Rapid communications in mass spectrometry 16: 1470-1475. Mayer, I., Borg, B., Schulz, R. (1990a). "Conversion of 11-ketoandrostenedione to 11-ketotestosterone by blood cells of six fish species." General and Comparative Endocrinology 77: 70-74. Mayer, I., Borg, B., Schulz, R. (1990b). "Seasonal changes in and effect of castration/androgen replacement on the plasma levels of five androgens in the male three-spined stickleback, Gasterosteus aculeatus L." General and Comparative Endocrinology 79: 23-30. Maziarz, M., Chung, C., Drucker, D., Emili, A. (2005). "Integrating Global Proteomic and Genomic Expression Profiles Generated from Islet b Cells." Molecular and cellular proteomics 4(4): 458-474. Mercadé, J., et al. (In preparation).
212

References
Métayer, S., Dacheux, F., Dacheux, J., Gatti, J. (2002). "Comparison, Characterization, and Identification of Proteases and Protease Inhibitors in Epididymal Fluids of Domestic Mammals. Matrix Metalloproteinases Are Major Fluid Gelatinases." Biology of Reproduction 66: 1219-1229. Miller, I., Crawford, J., Gianazza, E. (2006). "Protein stains for proteomic applications: Which, when, why?" Proteomics 6: 5385–5408. Miller, J. C., Zhou, H., Kwekel, J., Cavallo, R., Burke, J., Butler, E.B., Teh, B.S., Haab, B.B. (2003). "Antibody microarray profiling of human prostate cancer sera: antibody screening and identification of potential biomarkers." Proteomics 3(56-63). Mindnich, R., Moller, G., Adamski. J. (2004). "The role of 17 beta-hydroxysteroid dehydrogenases." Molecular and Cellular Endocrinology 218: 7-20. Miura, T., Miura, C., Ohta, T., Nader, M.R., Todo, T.,Yamauchi,K. (1999). "Estradiol-17b stimulates the renewal of spermatogonial stem cells in males." Biochemical and Biophysical Research Communications 264: 230-234. Miura, T., Miura, C.I. (2003). "Molecular control mechanisms of fish spermatogenesis." Fish Physiology and Biochemistry 28: 181-186. Miura, T., Yamauchi, K., Takahashi, H. Nagahama, Y. (1992). "The role of hormones in the acquisition of sperm motility in salmonid fish." Journal of experimental zoology 261: 359-363. Miura, T., Yamauchi, K., Takahashi, H., Nagahama, Y. (1991). "Hormonal induction of all stages of spermatogenesis in vitro in the male Japanese eel (Anguilla japonica)." PNAS 88: 5774-5778. Moertz, E., Krogh, T. N., Vorum, H., Görg, A. (2001). "Improved silver staining protocols for high sensitivity protein identification using matrix-asisted laser desorption/ionization-time of flight analysis." Proteomics 1: 1359-1363. Monti, G., De Napoli, L., Mainolfi, P., Barone, R., Guida, M., Marino, G., Amoresano, A. (2005). "Monitoring Food Quality by Microfluidic Electrophoresis, Gas Chromatography, and Mass Spectrometry Techniques: Effects of Aquaculture on the Sea Bass (Dicentrarchus labrax)." Analitycal Chemistry 77: 2587-2594. Moon, S. H., Lim, H.K., Kwon, J.Y., Lee, J.K., Chang, YJ. (2003). "Increased plasma 17-hydroxyprogesterone and milt production in response to gonadotropin-releasing hormone agonist in captive male starry flounder, Platichthys stellatus." Aquaculture 218: 703-716. Motzkusa, D., Singhb, P.B., Hoyer-Fendera, S. (1999). "M31, a murine homolog of Drosophila HP1, is concentrated in the XY body during spermatogenesis." Cytogenetics and Cell Genetics 86: 83-88. Mylonas, C. C., Woods III,L.C., Thomas, P., Zohar, Y. (1998). "Endocrine Profiles of Female Striped Bass (Morone saxatilis) in Captivity, during Postvitellogenesis and Induction of Final Oocyte Maturation via Controlled-Release GnRHa-Delivery Systems." General and Comparative Endocrinology 110: 276-289. Nagahama, Y. (1994). "Endocrine regulation of gametogenesis in fish." Int. J. Dev. Biol. 38: 217-229. O’Farrell, P. Z., Goodman, H. M., O’Farrell, P. H. (1977). "High resolution two-dimensional electrophoresis of basic as well as acidic proteins." Cell 12: 1133-1141. Old, W. M., Meyer-Arendt, K., Aveline-Wolf, L., Pierce, K.G., Mendoza, A., Sevinsky, J.R., Resing, K.A., Ahn, N.G. (2005). "Comparison of label-free methods for quantifying human proteins by shotgun proteomics." Molecular and cellular proteomics 4(10): 1487-14802.
213

References
Ong, S., Mann, M. (2005). "Mass spectrometry-based proteomics turns quantitative." Nature Chemical Biology 1(5): 252-262. Ørntoft, T., Thykjaer, T., Waldman, F., Wolf, H., Celis, J. (2002). "Genome-wide Study of Gene Copy Numbers, Transcripts, and Protein Levels in Pairs of Non-invasive and Invasive Human Transitional Cell Carcinomas." Molecular and cellular proteomics 1(1): 37-45. Pankhurst, N. W., Poortenaar, C.W. (2000). "Milt characteristics and plasma levels of gonadal steroids in greenback flounder Rhombosolea tapirina following treatment with exogenous hormones." Mar. Freshw. Behav. Physiol 33: 141-159. Patel, K., Dunn, M.J., Gunther, S., Postel, W., Gorg, A. (1988). "Dual-label autoradiographic analysis of human skin fibroblast and myoblast proteins by two-dimensional polyacrylamide gel electrophoresis using immobilised pH gradients in the first dimension." Electrophoresis. 9(9): 547-554. Peng, J., Schwartz, D., Elias, J.E., Thoreen, C.C., Cheng, D., Marsischky, G., Roelofs, J., Finley, D., Gygi, S.P. (2003). "A proteomics approach to understanding protein ubiquitination." Nature biotechnology 21(8): 921-926. Pevtsov, S., Fedulova, I., Mirzaei, H., Buck, C., Zhang, X. (2006). "Performance Evaluation of Existing De Novo Sequencing Algorithms." Journal of Proteome Research 5: 3018-3028. Pfeifer, H., Conrad, M., Roethlein, D., Kyriakopoulos, A., Brielmeier, M., Bornkamm, G.W., Behne, D. (2001). "Identification of a specific sperm nuclei selenoenzyme necessary for protamine thiol crosslinking during sperm maturation." The FASEB Journal 15: 1236-1239. Piñeiro, C., Barros-Velázquez, J., Vázquez, J., Figueras, A., Gallardo, J.M. (2003). "Proteomics as a Tool for the Investigation of Seafood and Other Marine Products." Journal of Proteome Research 2: 127-135. Pousette, Å., Leijonhufvud, P.K.G., Åkerlof, E. (1993). "Purification, structure and partial characterization of the major sperm activating protein complex in human serum." Scandinavian Journal of Clinical and laboratory Investigation 53: 39-44. Pradet-Balade, B., Boulme, F., Beug, H., Mullner, E.W., Garcia-Sanz, J.A. (2001). "Translation control: bridging the gap between genomics and proteomics?" Trends in Biochemical Sciences 26(4): 225-229. Provan, F., Bjornstad, A., Pampanin, D.M., Lyng, E., Fontanillas, R., Andersen, O.K., Koppe, W., Bamber, S. (2006). "Mass spectrometric profiling – A diagnostic tool in fish?" Marine Environmental Research 62: S105-S108. Pudney, J. (1995). "Spermatogenesis in nonmammalian vertebrates." Microscope research and technique 32: 459-497. Quero, C., Colome, N., Prieto, M.R., Carrascal, M., Posada, M., Gelpi, E., Abian, J. (2004). "Determination of protein markers in human serum: Analysis of protein expression in toxic oil syndrome studies." Proteomics 4(2): 303-315. Rabilloud, T., Vuillard, L., Gilly, C., Lawrence, J. J. (1994). "Silver staining of proteins in polyacrylamide gels: a general overview." Cellular and Molecular Biology 40: 57–75. Rao, A. V., Shaha, C. (2000). "Role of glutathione S-transferases in oxidative stress-induced male germ cell apoptosis." Free Radical Biology and Medicine 29: 1015-1027. Reinders, J., Lewandrowski, U., Moebius, J., Wagner, Y., Sickmann, A,. (2004). "Challenges in mass spectrometry-based proteomics." Proteomics 4: 3686–3703.
214

References
Rexroad, C. E., Y. Lee,Y., Keele, J.W., Karamycheva, S., G. Brown, G., Koop, B., Gahr S.A., Paltia, Y., Quackenbushc, J. (2003). "Sequence analysis of a rainbow trout cDNA library and creation of a gene index." Cytogenetic and Genome Research 102: 347–354. Rice, P., Longden, I. Bleasby, A. (2000). "EMBOSS: The European Molecular Biology Open Software Suite." Trends in Genetics 16(6): 276-277. Rijnsdorp, A. D., Witthames, P.R. (2005). Ecology of reproduction. Flatfishes. Biology and exploitation. G. R.N.: 68-87. Rime, H., Guitton, N., Pineau, C., Bonnet, E., Bobe, J., Jalabert, B. (2004). "Post-ovulatory ageing and egg quality: A proteomic analysis of rainbow trout coelomic fluid." Reproductive Biology and Endocrinology 2(26). Rodríguez, A., Pascual, E. (1982). "Primeros ensayos sobre la utilización de la hipófisis del atún (Thunnus thynnus) en la maduración y puesta de Solea senegalensis y Sparus aurata." Inv. Pesq. 97: 1-11. Rodríguez, C., Quero, C., Dominguez, A., Trigo, M., Posada de la Paz, M., Gelpi, E., Abian, J. (2006). "Proteotyping of human haptoglobin by MALDI-TOF profiling: Phenotype distribution in a population of toxic oil syndrome patients." Proteomics Suppl 1: S272-81. Rodríguez, R. B. (1984). Biología y cultivo de Solea senegalensis Kaup 1858 en el Golfo de Càdiz. Sevilla, Universidad de Sevilla. Roepstorff, P., Fohlmann, J. (1984). "Proposal for a common nomenclature for sequence ions in mass spectra of peptides." Biomedical mass spectrometry 11: 601. Roest, H. P., van Klaveren, J., de Wit. J., van Gurp, C.G., Koken, M.H., Vermey, M., van Roijen, J.H., Hoogerbrugge, J.W., Vreeburg, J.T., Baarends, W.M., Bootsma, D., Grootegoed, J.A., Hoeijmakers, J.H. (1996). "Inactivation of the HR6B ubiquitin-conjugating DNA repair enzyme in mice causes male sterility associated with chromatin modification." Cell 86(5): 799-810. Rottmann, R. W., Shireman, J.V., Chapman, F.A. (1991). "Hormonal Control of Reproduction in Fish for Induced Spawning." Southern Regional Aquaculture Center Publications 424. Russell, S., Hayes, M.A., Simko, E., Lumsden, J.S. (2006). "Plasma proteomic analysis of the acute phase response of rainbow trout (Oncorhynchus mykiss) to intraperitoneal inflammation and LPS injection." Developmental and Comparative Immunology 30: 393-406. Saldanha, A. J. (2004). "Java Treeview: extensible visualization of microarray data." Bioinformatics 20(17): 3246-3248. Santos C., B. J. P. G. (1994). "Ribosomal Protein P0, Contrary to Phosphoproteins P1 and P2, Is Required for Ribosome Activity and Saccharomyces cerevisiae Viability." Journal of Biological Chemistry 269(22): 15689-15696. Sassone-Corsi, P. (2002). "Unique chromatin remodeling and transcriptional regulation in spermatogenesis." Science 296(5576): 2176-2178. Schulz, R. W., Blum, V. (1991). "Extragonadal 17b-hydroxysteroid dehydrogenase activity in rainbow trout." General and Comparative Endocrinology 82: 197-205. Schulz, R. W., Vischer, H.F., Cavaco, J.E.B, Santos, E.M., Tyler, C.R., Goos, H.J.Th., Bogerd, J. (2000). "Gonadotropins, their receptors, and the regulation of testicular functions in fish." Comparative Biochemistry and Physiology Part B 129: 407-417.
215

References
Shaw, M. M., Riederer, B.M. (2003). "Sample preparation for two-dimensional gel electrophoresis." Proteomics 3: 1408-1417. Shen, Y., Jacobs, J.M., Camp, D.G., Fang, R., Moore, R.J., Smith, R.D., Xiao, W., Davis, R.W., Tompkins, R.G. (2004). "Ultra-high-efficiency strong cation exchange LC/RPLC/MS/MS for high dynamic range characterization of the human plasma proteome." Analytical chemistry 76(4): 1134-44. Shrader, E. A., Henry, T.R., Greeley, M.S. Jr, Bradley, B.P. (2003). "Proteomics in zebrafish exposed to endocrine disrupting chemicals." Ecotoxicology 12(6): 485-488. Smith, R. W., Wood, C.M., Cash, P. Diao, L., Part, P. (2005). "Apolipoprotein AI could be a significant determinant of epithelial integrity in rainbow trout gill cell cultures: A study in functional proteomics." Biochimica et Biophysica Acta 1749: 81-93. Standing, K. G. (2003). "Peptide and protein de novo sequencing by mass spectrometry." Current opinion in structural biology. 13: 595-601. Stentiford, G. D., Viant, M.R., Ward, D.G., Johnson, P.J., Martin, A., Wenbin, W., Cooper, H.J., Lyons, B.P., Feist, S.W. (2005). "Liver Tumors in Wild Flatfish: A Histopathological, Proteomic, and Metabolomic Study." OMICS A Journal of Integrative Biology 3: 281-299. Sutovsky, P. (2003). "Ubiquitin-Dependent Proteolysis in Mammalian Spermatogenesis, Fertilization, and Sperm Quality Control: Killing Three Birds With One Stone." Microscopy reserach and technique. 61: 88-102. Tanner, S., Shen, Z., Ng, J., Florea, L., Guigó, R., Briggs, S.P., Bafna, V. (2007). "Improving gene annotation using peptide mass spectrometry." Genome Research 17: 231–239. Tay, T. L., Lin, Q., Seow, T.K., Tan, K.H., Hew, C.L., Gong, Z. (2006). "Proteomic analysis of protein profiles during early development of the zebrafish, Danio rerio." Proteomics 6: 3176–3188. Taylor, J. A., Johnson, R.S. (1997). "Sequence database searches via de novo peptide sequencing by tandem mass spectrometry." Rapid communications in mass spectrometry 11: 1067-1075. Tolosano, E., Fiorella, A. (2002). "Hemopexin: Structure, Function, and Regulation." DNA and Cell Biology 21(4): 297-306. Tsuji, T., Shimohama, S., Kamiya, S., Sazuka, T., Ohara, O. (1999). "Analysis of brain proteins in Alzheimer’s disease using high-resolution two-dimensional gel electrophoresis." Journal od Neurology 166: 100-106. Tvedt, H. B., Benfey, T.J., Martin-Robichaud, D.J., Power, J. (2001). "The relationship between sperm density, spermatocrit, sperm motility and fertilization success in Atlantic halibut, Hippoglossus hippoglossus." Aquaculture 194: 191-200. Tyers, M., Mann, M. (2003). "From genomics to proteomics." Nature 13(422): 193-197. Vacher, C., Mañanos, E.L., Breton, B., Marmignon, M.H., Saligaut, C. (2000). "Modulation of pituitary dopamine D1 or D2 receptors and secretion of follicle-stimulating hormone and luteinizing hormone during the annual reproductive cycle of female rainbow trout." Journal of neuroendocrinology. 12: 1219-1226.
216
References
Vermeirssen, E. L. M., Mazorra de Quero, C., Shields, R.J., Norberg, B., Kime, D.E., Scott, A.P. (2004). "Fertility and motility of sperm from Atlantic halibut (Hippoglossus hippoglossus) in relation to dose and timing of gonadotropin releasing hormone agonist implant." Aquaculture 230: 547-567. Vermeirssen, E. L. M., Scott, A.P., Mylonas, C.C., Zohar, Y. (1998). "Gonadotrophin-releasing hormone agonist stimulates milt fluidity and plasma concentrations of 17α, 20β-dihydroxylated and 5β-reduced, 3α-hydroxylated C21 steroids in male plaice (Pleuronectes platessa)." General and comparative endocrinology. 112: 163-177. Vasseur, C., Labadie, J., Hebraud, M. (1999). "Differential protein expression by Pseudomonas fragi submitted to various stresses." Electrophoresis 20(2204-2213). Vermeirssen, E. L. M., Shields, R., Mazorra de Quero, C., Scott, A.P. (2000). "Gonadotropin-releasing hormone agonist raises plasma concentrations of progestogens and enhances milt fluidity in male Atlantic halibut (Hippoglossus hippoglossus)." Fish physiology and biochemistry. 22: 77-87. Viner, R., Zhang, T., Miller, K. (2005). "Complementary Analysis of Human CSF Proteins by Nano LC-MALDI and ESI-MS/MS." Thermo Electron application notes 356. Vollmer, M., Nägele, E., Moritz, R. (2004). "On-line and Off-line 2-D LC–ESI MS-MS Methods in Proteomic Analysis." Pharmaceutical Discovery 6: 42-49. Washburn, M. P., Ulaszek, R., Deciu, C., Schieltz, D.M., Yates, J.R. 3rd. (2002). "Analysis of quantitative proteomic data generated via multidimensional protein identification technology." Analytical chemistry 74(7): 1650-1657. Welt, C., Sidis, Y., Keutmann, H., Schneyer, A. (2002). "Activins, inhibins, and follistatins: from endocrinology to signaling. A paradigm for the new millennium." Experimental biology and medicine 227(9): 724-752. Weltzien, F. A., Andersson, E., Andersend, O., Shalchian-Tabrizie, K., Norberg, B. (2004). "The brain–pituitary–gonad axis in male teleosts, with special emphasis on flatfish (Pleuronectiformes)." Comparative Biochemistry and Physiology Part A. 137: 447–477. Weltzien, F. A., Norberg, B., Swanson, P. (2003). "Isolation and chartacteritzation of FSH and LH from pituitary glands of Atlantic halibut (Hippoglossus hippoglossus L.)." Genral and Comparative Endocrinology 131: 97-105. Weltzien, F. A., Taranger, G.L., Karlsen, O., Norberg, B. (2002). "Spermatogenesis and related plasma androgen levels in Atlantic halibut (Hippoglossus hippoglossus L.)." Comparative Biochemistry and Physiology Part A 132: 567-575. Wessel, D., Flugge, U.I. (1984). "A method for the quantitative recovery of protein in dilute solution in the presence of detergents and lipids." Analytical Biochemistry 138(1): 141-143. Westermeier, R., Marouga, R. (2005). "Protein Detection Methods in Proteomics Research." Bioscience Reports 25(1-2): 19-32. Wilke, A., Ruckert, C., Bartels, D., Dondrup, M., Goesmann, A., Huser, A.T., Kespohl, S., Linke, B., Mahne, M., McHardy, A., Puhler, A., Meyer, F. (2003). "Bioinformatics support for high-throughput proteomics." Journal of Biotechnology 106: 147-156.
217
References
Wilkins, M. R., Pasquali, C., Appel, R.D., Ou, K., Gola,z O., Sanchez, J.C., Yan, J.X., Gooley, A.A., Hughes, G., Humphery-Smith, I., Williams, KL., Hochstrasser, D.F. (1996). "From proteins to proteomes: large scale protein identification by two-dimensional electrophoresis and amino acid analysis." Biotechnology 14(1): 61-65. Williams, B. S., Doyle, M.D. (1996). "An Internet Atlas of Mouse Development." Computerized Medical Imaging and Graphics 20(6): 433-447. Wise, T., Lunstra, D.D., Rohrer, G.A., Ford, J.J. (2003). "Relationships of testicular iron and ferritin concentrations with testicular weight and sperm production in boars." Journal of Animal Science 81(2): 503-511. Wolff, S., Otto, A., Albrecht, D., Zeng, J.S., Buttner, K., Gluckmann, M., Hecker, M., Becher, D. (2006). "Gel-free and gel-based proteomics in Bacillus subtilis: a comparative study." Molecular and cellular proteomics 5(7): 1183-1192. Wolters, D. A., Washburn, M.P., Yates, J.R. 3rd. (2001). "An automated multidimensional protein identification technology for shotgun proteomics." Analytical chemistry 73(23): 5683-5690. Wysocki, V. H., Tsaprailis, G., Smith, L.L., Breci, L.A. (2000). "Mobile and localized protons: a framework for understanding peptide dissociation." Journal of mass spectrometry 35(12): 1399-1407. Xu, C., Ma, B. (2006). "Complexity and scoring function of MS/MS peptide de novo sequencing." Computational systems bioinformatics.: 361-9. Zhao, Y. L., Han, W.D., Li, Q., Mu, Y.M., Lu, X.C., Yu, L., Song, H.J., Li, X., Lu, J.M., Pan, C.Y. (2005). "Mechanism of transcriptional regulation of LRP16 gene expression by 17-b estradiol in MCF-7 human breast cancer cells." Journal of Molecular Endocrinology 34: 77-89. Zhu, B. Y., Mant, C.T., Hodges, R. S. (1991). "Hydrophilic-interaction chromatography of peptides on hydrophilic and strong cation-exchange columns." Journal of Chromatography A 548: 13-24. Zhu, H., Bilgin, M., Snyder, M. (2003). "Proteomics." Annual Reviews in Biochemistry 72: 783–812. Zubarev, R. A., Hakansson, P., Sundqvist, B. (1996). "Accuracy requirements for peptide characterization by monoisotopic molecular mass measurements." Analytical chemistry 68: 4060-4064.
218

Annexes

Annex I
Annex I.1 Detailed comparison between Solea senegalensis testis and larva and Oncorhynchus
mykiss (Rainbow trout) gene ontology charts for Biological Process, Molecular Function,
and Cellular Component classification levels at hierarchical level 1. Proteins from Solea
senegalensis were obtained from BLAST comparison with experimental peptides.
Proteins from larva and testis were analysed separately.
219
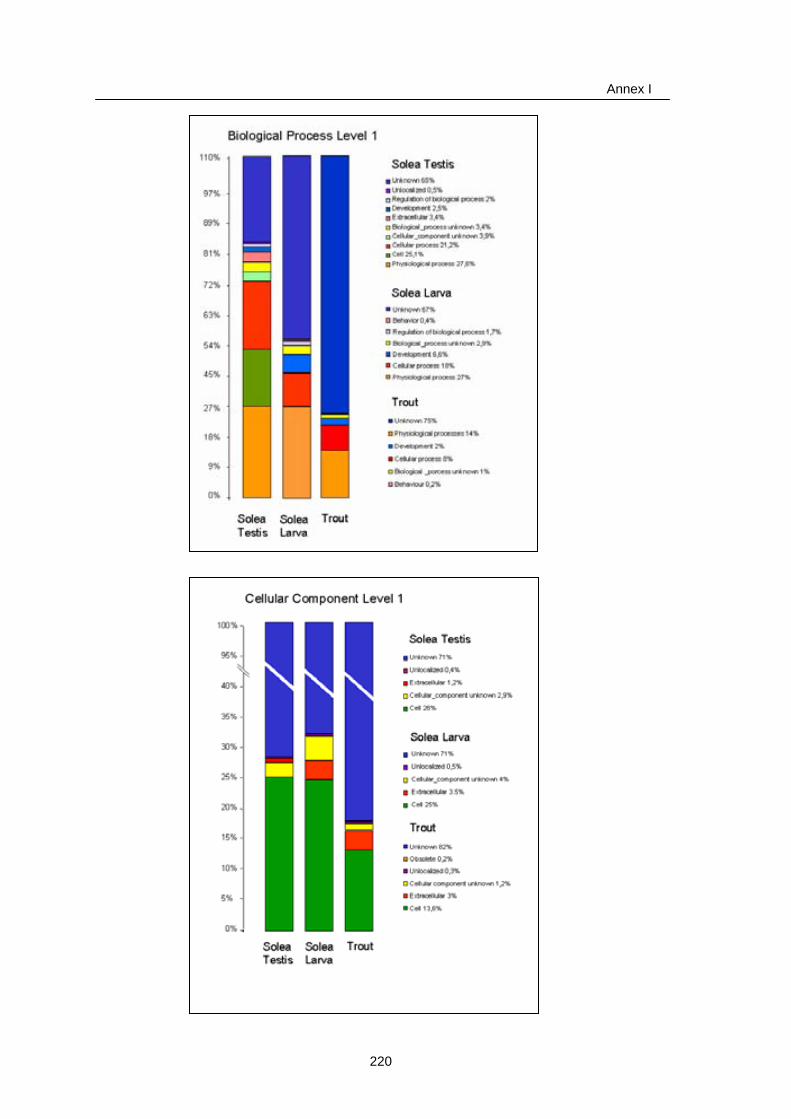
Annex I
220

Annex I
Annex I.2 Gene ontology charts of the proteins described for Solea senegalensis. Proteins were
obtained through BLAST search using peptide sequences obtained by 2D LC-MS/MS
and adequately filtered. Charts represented up to the level 1 in Molecular Function
classification, up to level 2 in Biological Process classification and up to level 3 in
Cellular Component.
221

Annex I
222
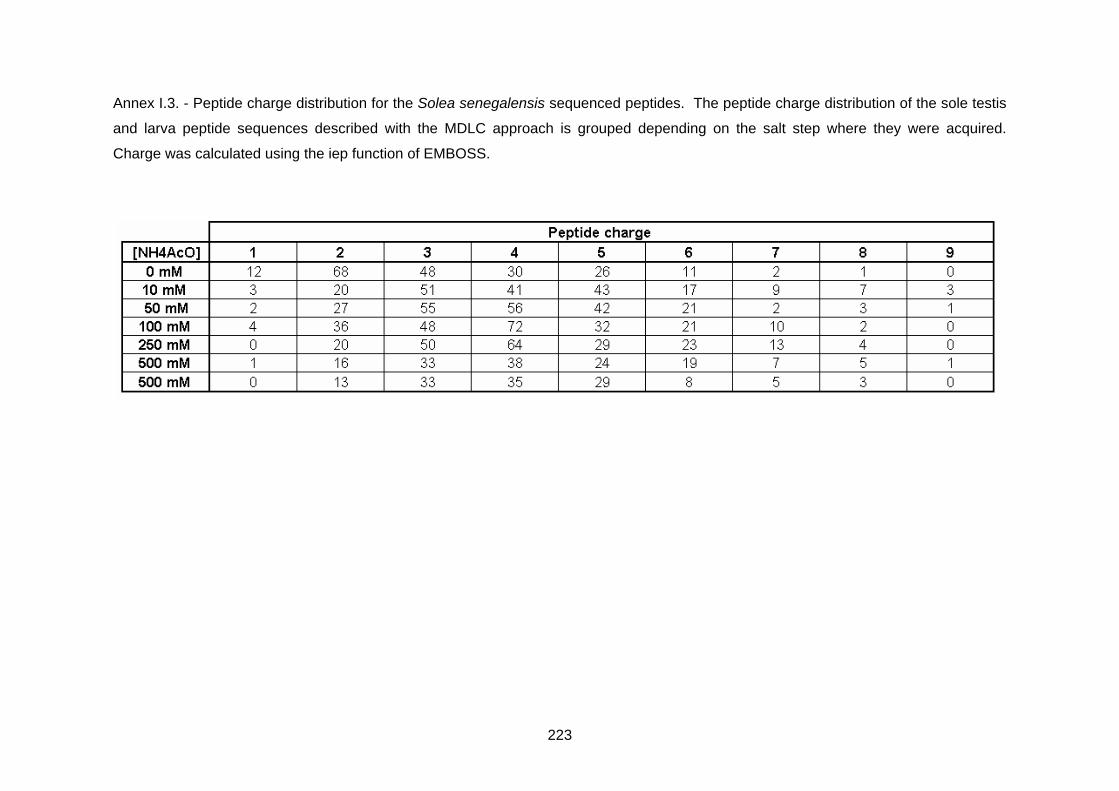
223
Annex I.3. - Peptide charge distribution for the Solea senegalensis sequenced peptides. The peptide charge distribution of the sole testis
and larva peptide sequences described with the MDLC approach is grouped depending on the salt step where they were acquired.
Charge was calculated using the iep function of EMBOSS.

Annex II
Annex II.1
The NCBI protein identification and sequence, sequenced peptides and their situation in
the homologous protein (red letters) from the identified spots in the spermatogenesis
stages study in chapter 2.
Spot 1942 >gi|39795813|gb|AAH64289.1| Phosphoserine aminotransferase 1 [Danio rerio]
MEKKQTVNFGAGPAKLPKSVLLQAQKELQDYSGTGISILEMSHRSSDFTKIINTTENLIRELLNVPENYKILFLQGGGSGQFSAVPLNLIGLKEERCADYLVTGTWSARAAKEAEKYGKVNVIHPKLDSTKIPDSSTWSLNPSASYVYYCCNETVHGVEFNFIPDTKGVILVSDMSSNFLSRPVDVSKFGLIFAGAQKNVGCAGVTVVIVREDLIGKALKECPIILDYQVQAGNNSLYNTPPCFSIYIMGLVLEWIRNNGGADAMERLNKQKSALVYDIINRSNGFYSCPVDAACRSRMNIPFRIGKKEGDESLEKSFLDGASKLGMISLKGHRSVGGIRASLYNAVTVEDVKILAAYMEDFLRNH
Sequenced Peptides NLGCAGVTVVLVR
Spot 1963 >gi|47577631|ref|NP_001000637.1| olfactory receptor Olr653 [Rattus norvegicus]
MEIRNNVTEFVLLGLTQNLHMQKIVFVVFLVIYVFSVVGNLLILITITNSQLLGAPMYYFLAYLSFIDACYSSVNTPKLIFDSLHKKKSIKFNGCMTQVFAEHFFGGAEIILLTVMAYDRYVAICKPLHYATIMNRQLCNILVGVSWVGGFLHAGIQMLFMIGLPFCGPNVIDHFMCDLNPLLALACVDTHILGLFVAANSGFICLLNFLLLLVSYLVILHSLKNHSAEGRRKALSTCVSHITVVVLFFVPGIFVYMRPAATLPIDKAVAIFYTIITPMLNPLIYTLRNAQMKNAIWKLFSTNINSDEK
Sequenced Peptides LLNFLLLLSR
Spot 1966 >gi|47225177|| serine (or cysteine) proteinase inhibitor [Tetraodon nigroviridis].
MASPSPLSKANTSFSLALFRELGDNDRTANIFYSPFSISSALAMVLLGAGGNTATEMSEVLCFTEAEKPKDVEEQQQQQQLQQQHHLRLPDFLKKCLKTEGCQDDIHTSFSQLLDELHKKNAPYALSVANRLYGKHYRAELESVDFQSAAEASRIHINSWVEKQTEGKIKDLLVQGIVSSDTRLVLVNAIYFKGKWNKQFKEEATRDAQFNVTKNSSKPVKMMHQTSKFPFTFIPEAKCQILEMPYIGEELSMLIFLPYQMEDSSTGLEKLEKLLTYDKFMEWTRPDMMDSVEVQVGLPRFKLEEKFNMKNVLVKMGMVEAFDVATSNFSGMSPANDLFLSEVVHKAFVEVNEEGTEAAAATGAIMMLRCARPSERFYADHPFLFFIRHNPSMSILFAGRYCSPE
Sequenced Peptides MGMVDAFDVAR TTFSGMSPANDLVEANVVHK
>gi|13385352|ref|NP_080143.1| serine (or cysteine) proteinase inhibitor, clade B (ovalbumin), member 11 [Mus musculus]
MDPITTASTEFCLDVFKELSSNNVGENIFFSPLTTFYALSMLLLGTRGKSAEQMEKVLHYDSFSGVLKAKTKNSSECSQVGVMHPDFRALISHINQQNSLSVANRIYGTRSISFHKQYVRCCEKLYQAKLQTVDFELSTEETRKSINAWVKNKTNGKITNLFAKGTIDPSSVMVLVSAIYFKGQWQNKFQKRETVKAPFHMGVGKSAVVNMMYQTGTFKLAIIKEPEMQVLELPYANNKLRMIILLPVGTASVSQIEKHLNVKMLREWTNPSNMVEREVDVHIPKFSLSVKYDLNTLLKSLGMRDIFNVANADLSGMSPDKGLYLSKVVHKSYVDVNEEGTEAAAATGESISVKRLPVTVQFTANCPFLFFIWDESGNILFAGKFASP
Sequenced Peptides GQTNFCLDLFK
>gi|39795277|gb|AAH63756.1| Serine (or cysteine) proteinase inhibitor, clade B (ovalbumin), member 3A [Mus musculus]
MHLFAEATTKFTLELYRQLRESDNNIFYSPISMMTALAMLQLGAKGNTEKQIEKVLQFNETTKKTTEKSAHCHDEENVHEQFQKLMTQLNKSNDAYDLKAANSIYGAKGFPFVQTFLEDIKEYYQANVESLDFEHAAEESEKKINSWVESQTNGKIKDLFPNGSLNRSTILVLVNAVYFKGQWNHKFDEKHTTEEKFWLNKNTSKPVQMMKQNIEFNFMFLEDVQAKIVEIPYKGKELSMIVLLPVEINGLKQLEEQLTADKLLEWTRAENMHMTELYLSLPRFKVDEKYDLPIPLEHMGMVDAFDPQKADFSGMSSTQGLVVSKVLHKSFVEVNEEGTEAAAATGVEVSLTSAQIAEDFCCDHPFLFFIIHRKTNSILFFGRISSP Sequenced Peptides LNLNTWVESQTGKK
224

Annex II
Spot 2055 >gi|47225844Isocitrate dehydrogenase 3 (NAD+) [Tetraodon nigroviridis]; MAGRAWRSAASWAFGALRKETPQVRGTNRAIHTVTLIPGDGIGPEISTAVMKIFEAAEAPIQWEERNVTAIQGPGGKWIIPPDCKESMDRNKIGLKGPLKTPIAAGHPSMNLLLRKTFDLYANVRPCVSIEGYKTPYADVNLVTIRENTEGEYSGIEHVIVDGVVQSIKLITEEASQRIAEYAFEYARNNQRGSVTAVHKANIMRMSDGLFLRKCREAAEKHKDVKFTEMYLDTVCLNMVQDPSQFDVLVMPNLYGDILSDLCAGLIGGLGVTPSGNIGANGVAIFESVHGTAPDIAGKDLANPTALLLSAVMMLRHMGLHNHAKRIETACFDTIRDKQVLTKDLGGNSKCSEFTAAICQRVKDLN
Sequenced Peptides TPYTDVNLVTLR LANYAFEYAR NLETACFDTLR
Spot 2126 >gi|37362242|gb|AAQ91249.1| malate dehydrogenase 1, NAD [Danio rerio]
MAEPIRVLVTGAAGQIAYSLLYSIAKGDVFGKDQPIILVLLDITPMLPVLDGVVMELQDCALPLLREVIPTDKVEVGFKDLDAAILVGSMPRKEGMERKDLLKANVAIFKTQGEALEKYAKKTVKVLVVGNPANTNCLIASKSAPSIPKENFSCLTRLDHNRARSQVAMRVGVPSDSVKNVTIWGNHSSTQYPDVHHAIVTRNGKEIAAFDAVNDESWLKGDFISTVQQRGAAVIKARKLSSAMSAAKAICDHMRDIWFGTPDGEWVSMGIYSSGNSYGVPDDLMYSFPVKIKNKSWKVVDGLSINDFSRGKMDATAAELVEERDTALTFLSA
Sequenced Peptides QCNSGYTGSMPR DPVVGNPANTNCLLNR DPDGLSLNDFSR
Spot 2174 >gi|47221930| [Tetraodon nigroviridis] Polymerase (RNA) II (DNA directed) polypeptide C
MPYANQPTVKITELTDENVKFVIENTDLAVANSIRRVFMSEVPTIAIDWIQIDANSSVLHDEFVAHRVGLIPLTSDDIVDKLQYSRDCTCDDFCPECSVELTLDVRCTEDQTRHVTSRDLLSNNPRVIPVTSRSRDNDPNDYVEQDDILVVKLRKGQELRLRAYAKKGFGKEHAKWNPTAGVSFEYDPDNVLRHTVYPRPEEWPKSEYSEIEEDEIQAPFDPNGKPEKFFYNVESCGSLRPENIVMSALAVLKKKLSDLQTQLSHEIQSDVLTIN
Sequenced Peptides HPAPTAGVSFEYDDPYYK Spot 2176 >gi|63650325 similar to acidic ribosomal phosphoprotein P0 [Mus musculus] MPREDRATWKSNYFLKIIQLLDDYPKCFIVGADNVGSKQMQQICMSLRGKAVVLMGKNTMMRKAIGGHLENNPALEKLLPHIRRNMGFVFTKEDFTEIRDILLANKVPAAARAGAIAPCEVTVPAQNTGLGPEKTSFFQALGITTKISRGTIEILSDVQLIKTGDKVGASEATLLNMLNISPLLLRADHPAGV
Sequenced Peptides VVNAPCDVTVCHLTGLLAAR TSFFQALVATTK Spot 2243 >gi|47225480|emb|CAG11963.1| [Tetraodon nigroviridis] uridine phosphorylase 2 MDGNVPEPSSSPVCVHNPHLETLKDDILYHFSLGTSTHDLPAIFGDVKFVCVGGSPSRMKAFIEYIAAELNMEDPKSEYPNICAGTDRYTMYKVGPVLSVSHGVGIPSIAIMLHELIKLLYHARCKDVTIIRLGTSGGIGLEPGTVVVTKQAVDATFLPKFEQVILGKTVVRNTDLDQSLAEQLLECSQELNQFETVLGKTMCTMDFYEGQARLDGAFCSYTEEDKQEYLKARDAGVCNIEMESSVFATMCKMSGLKAAVVCVTLLNRLKGDQLDSSHHVLQNYQQRPQILVGSYIKKEL
Sequenced Peptides TTYPNLCAGTDR RGDLDQGLAEELLK VQVCVTLLDR Spot 2275 >gi|47210341| [Tetraodon nigroviridis] pyruvate dehydrogenase E1-beta subunit MAMSLVNIIRKGKPVVSALRRRNFHKTVPAAVQVTVRDALNQAMDEELERDERVFLLGEEVAQYDGAYKVSRGLWKKYGDKRVIDTPISEMGFAGIAVGAAMAGLRPICEFMTFNFSMQAIDQVINSAAKTYYMSAGLQPVPIVFRGPNGASAGVAAQHSQCFAAWYAHCPGLKVVSPWNAEDCKGLLKAAIRDDNPVVFLENELMYGVPFDMSEESQSKDFVIPIGKAKVERAGNHVTLVSHSRYVGHCLDAAAVLAKEGIECEVINLRTIRPMDVGCIEASVMKTNHLLTVEGGWPQFGVGAEICAQIMEGPAFNYLDAPVSRVTGVDIPMPYAKILEDNSVPQVKDIIFSVKKMLNV
Sequenced Peptides MMLLGEEVAQYDQYK YEMSQSEMGFTGLAVGSAWWR YTYMASGLQTVPLVFR VVSPWNAEDVK EGLECEVLNLR LMEGPAFNYLDAPVTR LLEDNSVPLQK
Spot 2339 >gi|55624676| hydroxysteroid (17-beta) dehydrogenase 4 [Pan troglodytes]
MALGRQVLPASGVTLNYISQDSKGAARSALIFLPEIGKSLTLVPPPPFPASSCPAVGVQRLCLFVCVSLQALFMGSPLRFDGRVVLVTGAGAGLGRAYALAFAERGALVVVNDLGGDFKGVGKGSLAADKVVEEIRRRGGKAVANYDSVEEGEKVVKTALDAFGRIDVVVNNAGILRDRSFARISDEDWDIIHRVHLRGSFQVTRAAWEHMKKQKYGRIIMTSSASGIYGNFGQANYSAAKLGLLGLANSLAIEGRKSNIHCNTIAPNAGSRMTQTVMPEDLVEALKPEYVAPLVLWLCHDSCEENGGLFEVGAGWIGKLRWERTLGAIVRQKNHPMTPEAVKANWKKICDFENASKPQSIQESTGSIIEVLSKIDSEGGVSANHTSRATSTATSGFAGAIGQKLPPFSYAYTELEAIMYALGVGASIKDPKDLKFIYEGSSDFSCLPTFGVIIGQKSMMGGGLAEIPGLSINFAKVLHGEQYLELYKPLPRAGKLKCEAVVADVLDKGSGVVIIMDVYSYSEKELICHNQFSLFLVGSGGFGGKRTSDKVKVAVAIPNRPPDAVLTDTTSLNQAALYRLSGDWNPLHIDPNFARPIHLPQYVRMYRAIDLKSGSGKVYQGPAKGAADTTIILSDEDFMEVVLGKLDPQKAFFSGRLKARGNIMLSQKLQMILKDYAKL
225

Annex II
Sequenced Peptides YEALAFAER LLGLGLSQSLALEGR
Spot 2436 >gi|20071768|gb|AAH27160.1| Dolichyl-phosphate beta-glucosyltransferase-like [Mus musculus]
MATLLLQLLGLGVALAAAALILVSIVAFITATKMPPCYQHEEEKFFLNAKGQKEALPSIWDSPTKQLSVVVPSYNEEKRLPVMMDEALNYLEKRQKHDCTFTYEVIVVDDGSEDQTSKVALKYCQKYGSDKVRVITLVRNRGKGGAVRMGVFSSRGEKILMADADGATKFPDVEKLEKGLSDLQPWPEQMAIACGSRAHLEKESIAQRSYFRTFLMYGFHFLVWFLCVKGIRDTQCGFKLLTREAAARTFSSLHIERWAFDVELLYIAQCLQIPIAEVAVNWTEIEGSKLVPFWSWLQMGKDLLFIRLRYLTGAWRLKQTRKAS
Sequenced Peptides MATLLMQLLR
Spot 2499 >gi|44890386|gb|AAH66763.1| Tyrosine 3-monooxygenase/tryptophan 5-
monooxygenase activation protein, epsilon polypeptide [Danio rerio] of 14-3-3 protein
MGDREDLVYQAKLAEQAERYDEMVDSMKKVAGMDVELTVEERNLLSVAYKNVIGARRASWRIISSIEQKEENKGGEDKLKMIREYRQTVENELKSICNDILDVLDKHLIPAANSGESKVFYYKMKGDYHRYLAEFATGNDRKEAAENSLVAYKAASDIAMTDLQPTHPIRLGLALNFSVFYYEILNSPDRACRLAKAAFDDAIAELDTLSEESYKDSTLIMQLLRDNLTLWTSDMQGDGEEQNKEALQDVEDENQ
Sequenced Peptides YLAEFAAGKTR GSHALNFSVFHEYLK EAAENSLVAYK DDNLAMNELPSTHPLR GSHALNFSVFHEYLK MSEDDALAQMPTLSEESYK
Spot 2521 >gi|47220021|emb|CAG12169.1| [Tetraodon nigroviridis] 6-phosphogluconolactonase
MAGRRVVVFPSSAELGPALASLVASRAEEAIASHGRFTVGLSGGSLVSMLSKELLALPSLDCSKWVVGFCDERLVPFDDPESTYGLYKSHFFSKVNIPAGGILTIDSSLPVNDCAEDYERKLKEVFPDDDFPVFDLLLLGMGPDGHTCSLFPDHPLLEETKKIVAPISDSPKPPPQRVTLTFPVVNSARCVAFVSTGGSKAPVLKEVLEGEGHPVYPAARVVPANGELFWLVDDPAAASLTIQVERL
Sequenced Peptides WVVGFCDER VTMTFVVPNSAR
Spot 2578 >gi|56554783|gb|AAV97962.1| carbonic anhydrase [Pseudopleuronectes americanus]
MSWGYAADNGPDKWADNFPVANGPRQSPIDILPGEASFDGALKPLSLKYDPSNCLEILNNGHSFQVTFVDDTDSSTLKDGPISGVYRLKQFHFHWGACDERGSEHTVAGTMYPAELHLVHWNTKYPSFGDAASKPDGLAVVGVFLKIGAENANLQKVLDAFSSIQAKGKQTTFAGFDPASLLPGCLDYWTYDGSLTTPPLLESVTWIVCKEPISISAEQMAKFRSLLFSAEGEAECCMVDNYRPPQPLKGRTVRASFK Sequenced Peptides ADVANFPLADGPR CHANFPLADGPR SLLFSADGEAECCMVSGYWWMNRK
Spot 2587 >gi|45387733|ref|NP_991218.1| hypothetical protein zgc:77182 [Danio rerio] Purine-nucleoside phosphorylase
MSTSSECSFSYEEYKETADWLLANTDIRPKVAIICGSGLGGLADLLDNKQVFPYDKIPRFPHSTVQGHKGQLVFGELNGKQCVCMQGRFHFYEGYNVATVTYPVRVFFLLGIETLIVTNAAGGLNPKFKVGDIMVIKDHINMPGFAGQNPLCGHNEERFGVRFPCMSDAYDRDLAQLVRKTAKELGCDSFLQEGVYCMLAGPSYETIAEC RVLQMLGADAVGMSTVPEVVIARHCGIRVFGLSLITNKVVTDYDSKERANHEEVLETTRMRTEDLQRIVSNVVRKM
Sequenced Peptides FPCMSDAYDR WVYCMLAGPTYETLAECR LMVVLGRNVGMSTVHWDRR
>gi|55640605|ref|XP_509906.1| PREDICTED: similar to Proteasome subunit alpha type 6 (Proteasome iota chain) [Pan troglodytes]
MSRGSSAGFDRHITIFSPEGRLYQVEYAFKAINQGGLTSVAVRGKDCAVIVTQKKVPDKLLDSSTVTHLFKITENIGCVMTGMTADSRSQVQRARYEAANWKYKYGYEIPVDMLCKRIADISQVYTQNAEMRPLGCCMILIGIDEEQGPQVYKCDPAGYYCGFKATAAGVKQTESTSFLEKKVKKKFDWTFEQTVETAITCLSTVLSIDF KPSEIEVGVVTVENPKFRILTEAEIDAHLVALAERD
Sequenced Peptides LYKVEYAFK YGYELHVGYVCK
226

Annex II
Spot 2591 gi|56554783|gb|AAV97962.1|carbonic anhydrase [Pseudopleuronectes americanus]
MSWGYAADNGPDKWADNFPVANGPRQSPIDILPGEASFDGALKPLSLKYDPSNCLEILNNGHSFQVTFVDDTDSSTLKDGPISGVYRLKQFHFHWGACDERGSEHTVAGTMYPAELHLVHWNTKYPSFGDAASKPDGLAVVGVFLKIGAENANLQKVLDAFSSIQAKGKQTTFAGFDPASLLPGCLDYWTYDGSLTTPPLLESVTWIVCKEPISISAEQMAKFRSLLFSAEGEAECCMVDNYRPPQPLKGRTVRASFK
Sequenced Peptides ADVANFPLADGPR
Spot 2603 >gi|55251370|emb|CAH68999.1| novel protein similar to vertebrate
methionine sulfoxide reductase A (MSRA) [Danio rerio]
MVARTSVRLIWRQFIQSRMGEMSSKVQMISPEEALPGREQSIKVSAKHDVNGNRTVPPFPEGLQMVLFGMGCFWGAERKFWRQKGVYSTQVGYSGGYTPNPTYEEVCTGKTGHTEVVRVVFEPQKIKFSELLKVFWESHNPTQGMRQGNDVGTTYRSSIYTNTQEQLEQALQSREEYQKVLTEEGFGAITTEITMAKEFYYAEDYHQQYLSKNPDGYCGLGGTGVSCPIGLKSKH
Sequenced Peptides MDCTQVGFCGGFTPNNSCR
Spot 2650 >gi|1165134|emb|CAA64496.1| glutathione S-transferase [Pleuronectes platessa]
MAQDMTLLWGSGSCPCWRVMILLEEKNLQGYNHKLLSFDKKEHKSQEVLDINPRGQLPSFKHGDNVVNDSYAACFYLESQFKSQGNQLIPDSPAEQALMYQRMFEGLTLYEKLNAVIYYDWFVPEGERHDSALKRNKEALATELKLWEGYLQKHGKHLAGRSFSLADVTVFPTVATLFRMGLSAESYPQLGQYHALLKERPGIKRSWPPHWLENPKGQDALKDI Sequenced Peptides LLLDNPAEQALMYKR EFEGLTFYEK DGFLWVTSFVDPAVVFR Spot 2667 >gi|24413939|dbj|BAC22191.1| ubiquitin C-terminal hydrolase [Oreochromis niloticus]
MEWTPMEINPEMLNKMMGKLGVGESWRFVDVLGLEGEQLSSVPKPCCALMLLFPLTQQHETFRAQQADKVSGGSEAYFLKQTAVNSCGTIALLHAVANNKDKMTFDGASALKKFLDETANMSPDDRAKHLEKNQAIFDAHNEIAAQGQCRPEADKVNFHFIAFVNVNGQLYEFDGKINGPVNHGHTKEESFVMDAAKVCRGFMEREEVRFSAVALCQN
Sequenced Peptides FNLNTAMELNPEMAKR FLDETANMSADDR FSAVALCR
Spot 2685 >gi|47227982|emb|CAF97611.1| unnamed protein product [Tetraodon nigroviridis] Glutathione peroxidase
MPGLLLGEVFPDFRAETTTGTISFHQFLGDSWAILFSHPGDYTPVCTTELGRAARLSGEFSKRRVKMVALSVNSLEDHQGWTKVWRETHRAVTAGHMCMCARLSAHQDILAYNGEDGESGELPFPIIADANRELAVALGMLDPEEKDKDGMPLTARCASVFIIGPDKRLKLSLLYPATTGRNFDEILRVVDSLQLTAAKRVATPADWKPGECVMVPPSMSEEEAAAMFPEGIYSKELPSGKKYLRYTPQP
Sequenced Peptides GPLLLGDVFPNPFVDGYRR FDTPVCMAELACNR LSLLYPATTGR
Spot 2723 >gi|62204368|gb|AAH92846.1| Peroxiredoxin 3 [Danio rerio] MAATIGRLLGASARRAAVCGLKTLVPRNGVSVIRAPQPLACIAAQKACFSISAARWAPAVTQAAPHFKGTAVINGEFKEISLGDFKGKYLVLFFYPLDFTFVCPTEIVAFSDKANEFHDVNCAVVGVSVDSHFTHLAWTNTPRKSGGLGKIQIPLLADLTKQVSRDYGVLLEGPGIALRGLFIIDPNGIVRHMSVNDLPVGRSVGETLRLVKAFQFVETHGEVCPASWTPKSPTIKPTPDGSKEYFEKVN
Sequenced Peptides DYGVLLEGGPLALR FAQFYECVTVCPASWTPK
>gi|66910263|gb|AAH96804.1| Hyp pro LOC321908 [Danio]: Translin; Testisbrain RNA binding protein
MSVTEMFSYIQGFLSADQDIREDIRKVVQGLEQTAREILTVLQSVHQPTGFKDIPSKCLKARELFCTVRNHTGELKTKFPVEQYYRYHELWRFVLQRLAFLAAFVVYLESEALVTREEVAKILAIEVDREKGFHLDVEDYLAGVLILASELSRLAVNSVTAGDYGRPLRISNFINELDSGFRLLNLKNDPLRKRYDGLKYDVKKIEEVVYDLSIRGLAKEQEAGEEK
Sequenced Peptides ELLTVLQSVHQPSGFK LSNFLNELDSGFR
227

Annex II
Spot 2738 >gi|51468069|ref|NP_001003889.1| proteasome (prosome, macropain) subunit, beta type, 1 [Danio rerio]
MISAQAYGENGKMKEYHYTGPVEHKFSPYAFNGGTVLAVAGEDFAIVASDTRLSEGYSIHSRDSPKCYKLTDTTVLGCSGFHGDCLTLTKIIEARLKMYKHSNNKSMTSGAIAAMLSTILYGRRFFPYYVYNIIGGLDEEGRGAVYSFDPVGSYQRDTYKAGGSASAMLQPLLDNQIGFKNMENVEHVPLTQEKAVQLVKDVFISAAERD VYTGDALKVCIVSKEGIKEEIVPLRKD
Sequenced Peptides VQYSFDPVGSYKR QKSSAMLQPLLDNKLGFK VDFLSAAER Spot 2759 >gi|74096419|ref|NP_001027893.1| apolipoprotein A-IV4 [Takifugu rubripes]
MKVLVVLALAVFSGCQANLFYADAPKPQLEVLTDAFWDYVAKATQTADDTLQMVRKSQFGQDVSARLTESADMASKYAVSIQEQLPPGAQDLITKVTTEADVLRERVTQELSTVRNKLEPYTEDMKAKVQARVEQLKQELAPYADSVDSEALRATLMQKSEELKSSLEQSVKDLQAQLGPYTDDLKLKVDGHLQNFQQNLAPMAEKVQTELNQRAQQVKDMAAPFVDELRDKLDPYAQDLQARLASLYESFVKAG
Sequenced Peptides DPELKVTAEADVLR GQGRQSVSDMKDQLGPYTEDLR Spot 2778 >gi|47213154|| [Tetraodon nigroviridis proteasome beta 4 subunit;
GMKLSFWENGPKPGQFYSFPGSRNQTGTSCGPVRHTLNPMVTGTSVLGVKFSGGVIIAADMLGSYGSLARFRNISRLMKVNDSTILGASGDYADYQYLKRVIEQMVIDEELLGDGHSYSPKAVHSWLTRVMYNRRSKMNPLWNTVVIGGFYKGESFLGYVDKLGVAYEAPTVATGFGAYLAQPLMREAVENKPELSKQEARDLIERCLKVLYYRDARSYNRYEIAIVTEEGVEIISPLSSETNWDIAHMVR
Sequenced Peptides LTTPMVTGTSVLRK SSALSDLAADMLGSYGDRR VNNSTLLGASGDYYVNGMYK WWMEAPTVATGFGAYLAQGQRR
VKLSKKEALDLVER RELLGPLSSETNWDLAR
Spot 2837 >gi|4530297| heterochromatin-specific nonhistone protein [Homo sapiens]
KDKVEYLLKWKGFSDEDNTWEPEENLDCLDLIAEFLQSQKTAHETDKSEGGKHKADSDSEDKGEESKPKGKKEESEKPRGFARGLEPERIIGATDSSGEVMFLMKWKNSNEADLVPAKEASVKCPQVVISFYEERLTWHSYPSEDDDKKNDKN
Sequenced Peptides CPQVVLSFYEER Spot 2877 >gi|50370069|gb|AAH76141.1| Zgc:92657 [Danio rerio] (histidyl-tRNA synthetase)
MKAIIQRVTRASVTVGEEQISSIGRGLCVLLGISAEDTQKDVDYMVRKILNLRVFEDENGRAWSRSVMDGELEVLCVSQFTLQCLLKGNKPDYHAAMPAELAQPFYNNMLEQLRETYKPELIKDGQFGAKMQVLIQNDGPVTIQLESPPAPTDPKLLSKQEKQQQRKEKTRSKGPSDSSREKAAQRSKVDPSASSGAEGDVSSEREP
Sequenced Peptides SSQVCDYVDSYRVENNNMLQQLR Spot 2897 >gi|37681759|gb|AAQ97757.1| muscle cofilin 2 [Danio rerio]
MASGVTVEETVLTVFNEMKVRKAHCNEEEKSKRKKAVMFCLSDDKKHIIMEQGQEILQGDEGDPYLKFVKMLPPNDCRYALYDATYETKETKKEDLVFIFWAPESAPLKSKMIYASSKDAIKKKFTGIKHEWQVNGMDDIKDRKTLAEKLGGASVVSLEGKPLTD
Sequenced Peptides YALYDATYETK WTHCFLFWASVLAVEK
Spot 2898 >gi|41946867|gb|AAH65947.1| Cofilin 2 (muscle) [Danio rerio]
MASGVTVSDEVIKVFNDMKVRKSSSSDEVKKRKKAVLFCLSDDKKKIIVEEGRQILVGDIGDSVDDPYACFVKLLPLNDCRYGLYDATYETKESKKEDLVFIFWAPEGAPLKSKMIYASSKDAIKKKFTGIKHEWQVNGLDDIQDRSTLAEKLGGNVVVSLEGRPL
Sequenced Peptides YALYDATYETK
Spot 2908 >gi|47217449 [Tetraodon nigroviridis] Myosin regulatory light chain 2 MSSKRTKAKTTKKRPQRATSNVFAMFDQSQIQEFK//EAFNMIDQNRDGFVDKEDLHDMLASLGKNPTDEYLEAMMNEAPGPINFTMFLTMFGEKLNGTDPEDVIRNAFACFDEEGTGFIQEDYLRELLTTMGDR//FTDEEVDELFREAPIDKKNNFNYVEFTRILKHGAKDKDD
Sequenced Peptides ATSNVFAMFDQSKLKEFK EAFNMLDQNR LNGTDPEDVLR LELTTMGDR FTDEEVDELFR NGFNYAEFTR
228

Annex II
Spot 2909 >gi|47218822|emb|CAG02807.1| unnamed protein product [Tetraodon nigroviridis]
MESAEAVAADVSRSRSVTIEISNLTKNYCLINPRVYLESGETYNPPQPTVRPLMTEVCTFSKSSGIPTGSVGVLTYELLERRSTMLPETLAIMFSVPYDYSFYNNWFAVGIYETGTKCNEGLYKQMYNEKKQAEHGFVREKANGSGINYVGGNLDIRATMNPLGKAIMKVEVWDAFFPFSE
Sequenced Peptides VGVLTYDLLER Spot 2918 >gi|33991794|gb|AAH56526.1| Myosin light chain (19.9 kD) (mlc-4) [Danio rerio]
(regulatory Subunit)
MSSKRAKGKITKKRPQRATSNVFAMFDQSQIQEFKEAFNMIDQNRDGFIDKEDLHDMLASLGKNPADDYLEAMMTEAPGPINFTMFLTMFGEKLNGTDPEEVIRNAFACFDEEGTGFIHEDYLRELLTTMGDRFTDEEVDELFREAPIDKKSNFNYVEFTRILKHGAKDKDD
Sequenced Peptides SGNLVFAMFDKSQLQEFK NAFACFDEEGTGSLKEDYLR FTDEEVDELFR SNFNYVEFTR
Spot 2972 >gi|41946867|gb|AAH65947.1| Cofilin 2 (muscle) [Danio rerio].
MASGVTVSDEVIKVFNDMKVRKSSSSDEVKKRKKAVLFCLSDDKKKIIVEEGRQILVGDIGDSVDDPYACFVKLLPLNDCRYGLYDATYETKESKKEDLVFIFWAPEGAPLKSKMIYASSKDAIKKKFTGIKHEWQVNGLDDIQDRSTLAEKLGGNVVVSLEGRPL
Sequenced Peptides YGLYDATYETK
Spot 3013 >gi|37681953|gb|AAQ97854.1| transgelin [Danio rerio]
MANKGPSYGLSREVQSKIDKKYDPELEGRLVQWIVSQCGEAIGKPQPGKQGFQQWLKDGCILCELINSLFKDSKPVKKIQSSSMAFKQMEQISQFLTAAERYGITKSDIFQTVDLWEGKDLAAVQMTLLSLGSLAVTKDDGCYRGDPAWFPKKSHENRREFSEEQMKEGHSVIGLHMGTNIGASQAGMTGYGRPRQILNNQ
Sequenced Peptides MQEQLSQFLSAAE LLKMGTVALTK
Spot 3089 >gi|47211278|emb|CAF90396.1| unnamed protein product [Tetraodon nigroviridis] nucleoside diphosphate kinase
MSSQLERTFIAVKPDGVQRGIVGEIIKRFEVKGFKLVAMKMVQASEDLLMNHYIDLKDRPFFPQLVKYMSSGPVVAMVWEGKGVVKTGRVMLGETDPAKSSPGTIRGDFCIDVSKNIIHGSDSVESANKEISLWFQEGELVDYT
Sequenced Peptides MLHASEDLLK MLGETNPANSEPSALR GDFCLDVGK
Spot 3122 gi|51261923|gb|AAH79951.1| Myosin alkali light chain 6, smooth muscle form [Xenopus
tropicalis]
MCDYSDDQIADYKESFQLFDRVGDGKILFGQCGDVMRALGQNPTNAEVMKVLGNPKPEDMNIKTLDFEQFLPMMQTVAKNRDVPGLEDIIEGLRVFDKEGNGTVMGSELRHVLVSLGEKMTDDEVETLLSNHEDANGCINYEELIRAILNG Sequenced Peptides LSFGKCGDVMR
gi|37362252|gb|AAQ91254.1| myosin light chain alkali, smooth-muscle isoform [Danio rerio]
MSDFSEDQILEFKEAFLLFDRTGDGKITYNQCGDVMRALGQNPVNAEVLKVLGNPKAEEMNHKLLDFEQFLPMLQAIAKNKDQGTFEDFVEGLRVFDKEGNGTVMGAELRHVLTTLGEKMTEEEVETLLAGHEDANGCINYEELVRMVMSG
Sequenced Peptides MTEEEVETLLAHGWDQGCLNYRWQR
Spot 3159 gi|51261923 Myosin alkali light chain 6, smooth muscle form [Xenopus tropicalis]
MCDYSDDQIADYKESFQLFDRVGDGKILFGQCGDVMRALGQNPTNAEVMKVLGNPKPEDMNIKTLDFEQFLPMMQTVAKNRDVPGLEDIIEGLRVFDKEGNGTVMGSELRHVLVSLGEKMTDDEVETLLSNHEDANGCINYEELIRAILNG
Sequenced Peptides LSFGQCGDVMR
gi|37362252| myosin light chain alkali, smooth-muscle isoform [Danio rerio]
MSDFSEDQILEFKEAFLLFDRTGDGKITYNQCGDVMRALGQNPVNAEVLKVLGNPKAEEMNHKLLDFEQFLPMLQAIAKNKDQGTFEDFVEGLRVFDKEGNGTVMGAELRHVLTTLGEKMTEEEVETLLAGHEDANGCINYEELVRMVMSG Sequenced Peptides TVFLLFDK WGGSMEDFVEGLR
229
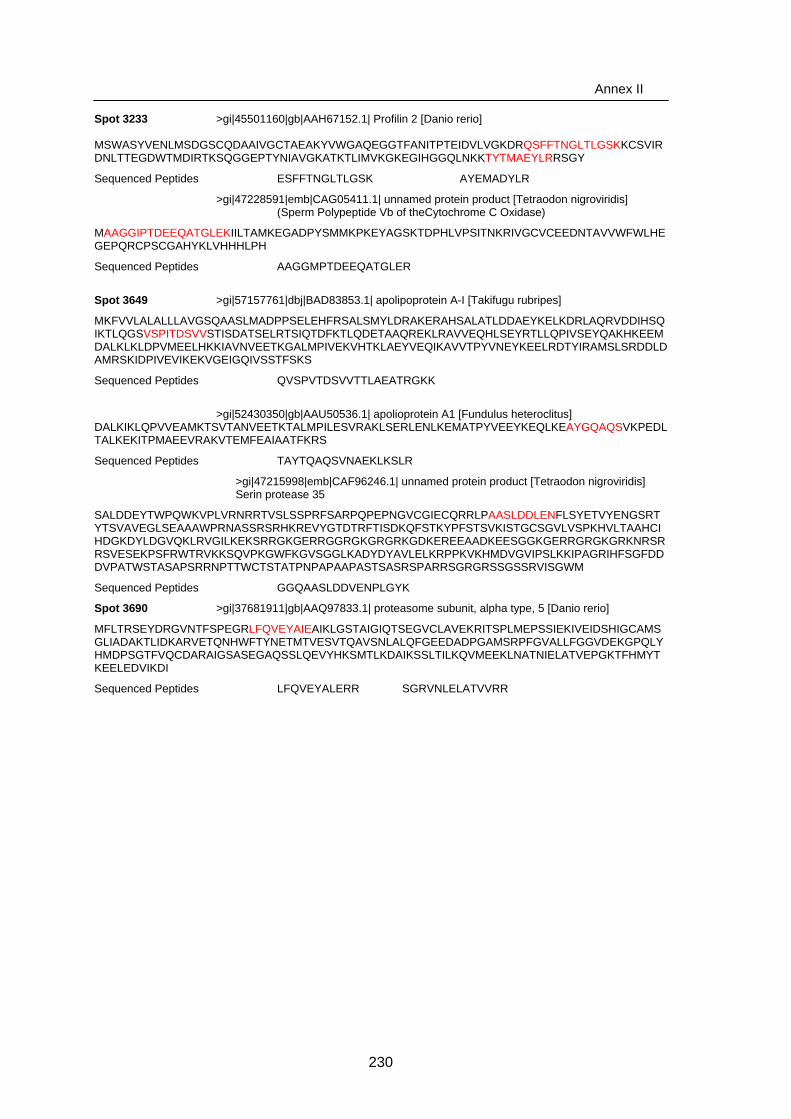
Annex II
Spot 3233 >gi|45501160|gb|AAH67152.1| Profilin 2 [Danio rerio] MSWASYVENLMSDGSCQDAAIVGCTAEAKYVWGAQEGGTFANITPTEIDVLVGKDRQSFFTNGLTLGSKKCSVIRDNLTTEGDWTMDIRTKSQGGEPTYNIAVGKATKTLIMVKGKEGIHGGQLNKKTYTMAEYLRRSGY
Sequenced Peptides ESFFTNGLTLGSK AYEMADYLR
>gi|47228591|emb|CAG05411.1| unnamed protein product [Tetraodon nigroviridis] (Sperm Polypeptide Vb of theCytochrome C Oxidase)
MAAGGIPTDEEQATGLEKIILTAMKEGADPYSMMKPKEYAGSKTDPHLVPSITNKRIVGCVCEEDNTAVVWFWLHEGEPQRCPSCGAHYKLVHHHLPH
Sequenced Peptides AAGGMPTDEEQATGLER
Spot 3649 >gi|57157761|dbj|BAD83853.1| apolipoprotein A-I [Takifugu rubripes]
MKFVVLALALLLAVGSQAASLMADPPSELEHFRSALSMYLDRAKERAHSALATLDDAEYKELKDRLAQRVDDIHSQIKTLQGSVSPITDSVVSTISDATSELRTSIQTDFKTLQDETAAQREKLRAVVEQHLSEYRTLLQPIVSEYQAKHKEEMDALKLKLDPVMEELHKKIAVNVEETKGALMPIVEKVHTKLAEYVEQIKAVVTPYVNEYKEELRDTYIRAMSLSRDDLDAMRSKIDPIVEVIKEKVGEIGQIVSSTFSKS
Sequenced Peptides QVSPVTDSVVTTLAEATRGKK
>gi|52430350|gb|AAU50536.1| apolioprotein A1 [Fundulus heteroclitus] DALKIKLQPVVEAMKTSVTANVEETKTALMPILESVRAKLSERLENLKEMATPYVEEYKEQLKEAYGQAQSVKPEDLTALKEKITPMAEEVRAKVTEMFEAIAATFKRS
Sequenced Peptides TAYTQAQSVNAEKLKSLR
>gi|47215998|emb|CAF96246.1| unnamed protein product [Tetraodon nigroviridis] Serin protease 35
SALDDEYTWPQWKVPLVRNRRTVSLSSPRFSARPQPEPNGVCGIECQRRLPAASLDDLENFLSYETVYENGSRTYTSVAVEGLSEAAAWPRNASSRSRHKREVYGTDTRFTISDKQFSTKYPFSTSVKISTGCSGVLVSPKHVLTAAHCIHDGKDYLDGVQKLRVGILKEKSRRGKGERRGGRGKGRGRKGDKEREEAADKEESGGKGERRGRGKGRKNRSRRSVESEKPSFRWTRVKKSQVPKGWFKGVSGGLKADYDYAVLELKRPPKVKHMDVGVIPSLKKIPAGRIHFSGFDDDVPATWSTASAPSRRNPTTWCTSTATPNPAPAAPASTSASRSPARRSGRGRSSGSSRVISGWM
Sequenced Peptides GGQAASLDDVENPLGYK
Spot 3690 >gi|37681911|gb|AAQ97833.1| proteasome subunit, alpha type, 5 [Danio rerio]
MFLTRSEYDRGVNTFSPEGRLFQVEYAIEAIKLGSTAIGIQTSEGVCLAVEKRITSPLMEPSSIEKIVEIDSHIGCAMSGLIADAKTLIDKARVETQNHWFTYNETMTVESVTQAVSNLALQFGEEDADPGAMSRPFGVALLFGGVDEKGPQLYHMDPSGTFVQCDARAIGSASEGAQSSLQEVYHKSMTLKDAIKSSLTILKQVMEEKLNATNIELATVEPGKTFHMYTKEELEDVIKDI
Sequenced Peptides LFQVEYALERR SGRVNLELATVVRR
230

231
Annex II.2.- Variation between experimental and theoretical Mr and pI values. Experimental (Exper) and theoretical (Theor) Mr and pI
values of each protein were measured with software analysis and Expasy Mw/pI tool, respectively. Variation [∆ (Exp-Theor)] was
calculated as (Exper-Theor)) value and normalization [Norm ∆] as (Exper value-Theor value)/ (Exper value+Theor value). For spots 2587,
2723, 3233 and 3649, which couldn’t be assigned univocally, values from both candidates are considered.
Mr pI Spot ID Prot ID
Exper Theor ∆ (Exp-Theor) Norm ∆ Exper Theor ∆ (Exp-Theor)
1942 Phosphoserine aminotransferase 1 55 40 15 0,158 6,9 8 -1,1 1963 Olfactory receptor Olr653 54 35 19 0,213 4,8 8,8 -4,0 1966 Serine (or cysteine) proteinase inhibitor 53 43 10 0,104 5,7 9 -3,3 2055 Isocitrate dehydrogenase 3 (NAD+) alpha 51 40 11 0,121 6,5 7,1 -0,6 2126 Malate dehydrogenase 1 49 36 13 0,153 6,6 7 -0,4 2174 Polymerase (RNA) II (DNA directed) polypeptide C 49 31 18 0,225 4,6 4,8 -0,2 2176 Acidic ribosomal phosphoprotein P0 49 21 28 0,400 5,6 9,4 -3,8 2243 Uridine phosphorylase 1 37 38 -1 -0,013 6,5 6,1 0,4 2275 Pyruvate dehydrogenase E1-beta subunit 47 39 8 0,093 5,6 6,2 -0,6 2339 Hydroxysteroid (17-beta) dehydrogenase 4 45 73 -28 -0,237 5,7 8,9 -3,2 2499 14-3-3 protein (Tyrosine 3-monooxygenase) 42 29 13 0,183 4,5 4,8 -0,3 2521 6-phosphogluconolactonase 41 26 15 0,224 5,1 4,9 0,2 2578 Carbonic anhydrase 39 28 11 0,164 4,4 5,2 -0,8
Purine-nucleoside phosphorylase 39 32 7 0,098 6,4 6 0,4 2587 Proteasome subunit alpha 39 27 12 0,182 6,4 6,4 0
2591 Carbonic anhydrase 39 28 11 0,164 4,5 5,2 -0,7 2603 Methionine sulfoxide reductase A 39 26 13 0,200 7,9 7,7 0,2 2650 Glutathione S-transferase 38 26 12 0,188 6,3 6,7 -0,4 2667 Ubiquitin C-terminal hydrolase 37 24 13 0,213 5,3 5,51 -0,2 2685 Glutathione peroxidase 36 27 9 0,143 6,3 5,6 0,7
Peroxiredoxin 3 36 27 9 0,142 6,6 9,2 2,6 2723 Translin 36 26 10 0,161 6,6 5,8 0,8

232
Annex II.2.- Variation between experimental and theoretical Mr and pI values (continuation).
Mr pI Spot ID Prot ID
Exper Theor ∆ (Exp-Theor) Norm ∆ Exper Theor ∆ (Exp-Theor)
2738 Proteasome subunit beta 36 23 13 0,220 7,7 6,3 1,4 2759 Apolipoprotein A-IV4 35 28 7 0,111 4,4 4,8 -0,4 2778 Proteasome beta 4 subunit 36 28 8 0,125 7,0 8,4 -1,4 2837 Heterochromatin-specific nonhistone protein 29 17 12 0,261 4,6 4,8 -0,2 2877 Histidyl-tRNA synthetase 35 23 12 0,207 4,1 6 -1,9 2897 Cofilin 22 18 4 0,100 6,0 6,8 -0,8 2898 Cofilin 2 22 19 3 0,073 6,4 7,6 -1,2 2908 Myosin regulatory light chain 2 22 15 7 0,189 4,5 4,7 -0,2 2909 Unnamed protein product 22 20 2 0,048 6,4 5,3 1,1 2918 Myosin light chain 22 20 2 0,048 4,3 4,7 -0,4 2972 Cofilina2 19 19 0 0,000 5,7 7,6 -1,9 3013 Transgelina 2 18 22 -4 -0,100 5,9 8,6 -2,7 3089 Nucleoside diphosphate kinase 15 16 -1 -0,032 6,7 6,1 0,6 3122 Myosin light chain alkali 13 17 -4 -0,133 3,8 4,5 -0,7 3159 Myosin alkali light chain 6 11 17 -4 -0,214 3,9 4,4 -0,5
Profilin 2 18 15 3 0,091 5,6 7,7 -2,1 3233 Cytochrome c oxidase subunit Vb 18 11 7 0,241 5,6 6 -0,4 Apolipoprotein A1 39 29 10 0,147 4,9 5,4 -0,5 3649 Serin protease 35 39 39 0 0 4,9 10 -5,1
3690 Proteasome subunit, alpha 41 26 15 0,224 4,4 4,7 -0,3

233
Annex II
Annex II.3.- Variation between experimental pI value of the identified proteins measured
with the IMP software and the theoretical pI calculated with Expasy tools. The
experimental pI of every identified spot was plotted against the theoretical pI (down).

234
Annex II
Annex II.4 .- Variation between experimental Mr value of the identified proteins
measured with the IMP software and the theoretical Mr calculated with Expasy tools.
The experimental Mr of every identified spot was plotted against the theoretical Mr
(down).

Annex III
Annex III.1.- Effect of GnRHa (50 µg kg-1) with or without OA on GSI, milt production
and sperm motility in the Senegal sole.
235
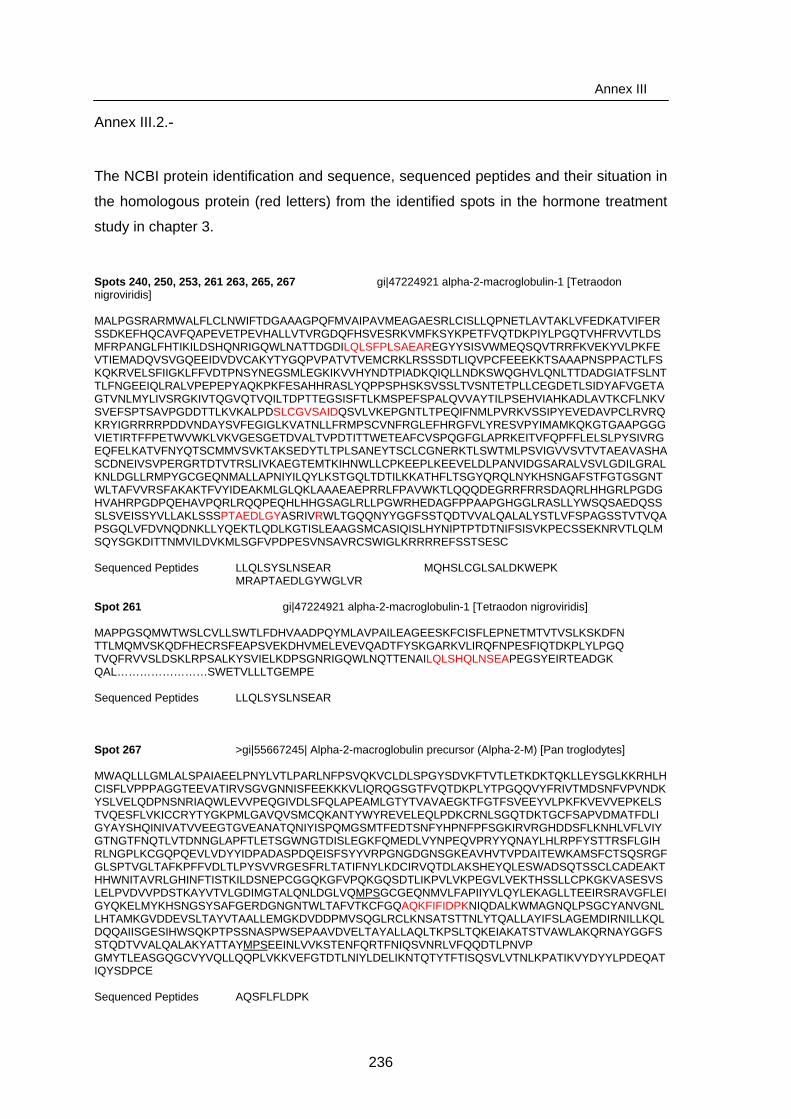
Annex III
Annex III.2.-
The NCBI protein identification and sequence, sequenced peptides and their situation in
the homologous protein (red letters) from the identified spots in the hormone treatment
study in chapter 3.
Spots 240, 250, 253, 261 263, 265, 267 gi|47224921 alpha-2-macroglobulin-1 [Tetraodon nigroviridis] MALPGSRARMWALFLCLNWIFTDGAAAGPQFMVAIPAVMEAGAESRLCISLLQPNETLAVTAKLVFEDKATVIFERSSDKEFHQCAVFQAPEVETPEVHALLVTVRGDQFHSVESRKVMFKSYKPETFVQTDKPIYLPGQTVHFRVVTLDSMFRPANGLFHTIKILDSHQNRIGQWLNATTDGDILQLSFPLSAEAREGYYSISVWMEQSQVTRRFKVEKYVLPKFEVTIEMADQVSVGQEEIDVDVCAKYTYGQPVPATVTVEMCRKLRSSSDTLIQVPCFEEEKKTSAAAPNSPPACTLFSKQKRVELSFIIGKLFFVDTPNSYNEGSMLEGKIKVVHYNDTPIADKQIQLLNDKSWQGHVLQNLTTDADGIATFSLNTTLFNGEEIQLRALVPEPEPYAQKPKFESAHHRASLYQPPSPHSKSVSSLTVSNTETPLLCEGDETLSIDYAFVGETAGTVNLMYLIVSRGKIVTQGVQTVQILTDPTTEGSISFTLKMSPEFSPALQVVAYTILPSEHVIAHKADLAVTKCFLNKVSVEFSPTSAVPGDDTTLKVKALPDSLCGVSAIDQSVLVKEPGNTLTPEQIFNMLPVRKVSSIPYEVEDAVPCLRVRQKRYIGRRRRPDDVNDAYSVFEGIGLKVATNLLFRMPSCVNFRGLEFHRGFVLYRESVPYIMAMKQKGTGAAPGGGVIETIRTFFPETWVWKLVKVGESGETDVALTVPDTITTWETEAFCVSPQGFGLAPRKEITVFQPFFLELSLPYSIVRGEQFELKATVFNYQTSCMMVSVKTAKSEDYTLTPLSANEYTSCLCGNERKTLSWTMLPSVIGVVSVTVTAEAVASHASCDNEIVSVPERGRTDTVTRSLIVKAEGTEMTKIHNWLLCPKEEPLKEEVELDLPANVIDGSARALVSVLGDILGRALKNLDGLLRMPYGCGEQNMALLAPNIYILQYLKSTGQLTDTILKKATHFLTSGYQRQLNYKHSNGAFSTFGTGSGNTWLTAFVVRSFAKAKTFVYIDEAKMLGLQKLAAAEAEPRRLFPAVWKTLQQQDEGRRFRRSDAQRLHHGRLPGDGHVAHRPGDPQEHAVPQRLRQQPEQHLHHGSAGLRLLPGWRHEDAGFPPAAPGHGGLRASLLYWSQSAEDQSSSLSVEISSYVLLAKLSSSPTAEDLGYASRIVRWLTGQQNYYGGFSSTQDTVVALQALALYSTLVFSPAGSSTVTVQAPSGQLVFDVNQDNKLLYQEKTLQDLKGTISLEAAGSMCASIQISLHYNIPTPTDTNIFSISVKPECSSEKNRVTLQLMSQYSGKDITTNMVILDVKMLSGFVPDPESVNSAVRCSWIGLKRRRREFSSTSESC Sequenced Peptides LLQLSYSLNSEAR MQHSLCGLSALDKWEPK MRAPTAEDLGYWGLVR Spot 261 gi|47224921 alpha-2-macroglobulin-1 [Tetraodon nigroviridis] MAPPGSQMWTWSLCVLLSWTLFDHVAADPQYMLAVPAILEAGEESKFCISFLEPNETMTVTVSLKSKDFN TTLMQMVSKQDFHECRSFEAPSVEKDHVMELEVEVQADTFYSKGARKVLIRQFNPESFIQTDKPLYLPGQ TVQFRVVSLDSKLRPSALKYSVIELKDPSGNRIGQWLNQTTENAILQLSHQLNSEAPEGSYEIRTEADGK QAL……………………SWETVLLLTGEMPE Sequenced Peptides LLQLSYSLNSEAR Spot 267 >gi|55667245| Alpha-2-macroglobulin precursor (Alpha-2-M) [Pan troglodytes] MWAQLLLGMLALSPAIAEELPNYLVTLPARLNFPSVQKVCLDLSPGYSDVKFTVTLETKDKTQKLLEYSGLKKRHLHCISFLVPPPAGGTEEVATIRVSGVGNNISFEEKKKVLIQRQGSGTFVQTDKPLYTPGQQVYFRIVTMDSNFVPVNDKYSLVELQDPNSNRIAQWLEVVPEQGIVDLSFQLAPEAMLGTYTVAVAEGKTFGTFSVEEYVLPKFKVEVVEPKELSTVQESFLVKICCRYTYGKPMLGAVQVSMCQKANTYWYREVELEQLPDKCRNLSGQTDKTGCFSAPVDMATFDLIGYAYSHQINIVATVVEEGTGVEANATQNIYISPQMGSMTFEDTSNFYHPNFPFSGKIRVRGHDDSFLKNHLVFLVIYGTNGTFNQTLVTDNNGLAPFTLETSGWNGTDISLEGKFQMEDLVYNPEQVPRYYQNAYLHLRPFYSTTRSFLGIHRLNGPLKCGQPQEVLVDYYIDPADASPDQEISFSYYVRPGNGDGNSGKEAVHVTVPDAITEWKAMSFCTSQSRGFGLSPTVGLTAFKPFFVDLTLPYSVVRGESFRLTATIFNYLKDCIRVQTDLAKSHEYQLESWADSQTSSCLCADEAKTHHWNITAVRLGHINFTISTKILDSNEPCGGQKGFVPQKGQSDTLIKPVLVKPEGVLVEKTHSSLLCPKGKVASESVSLELPVDVVPDSTKAYVTVLGDIMGTALQNLDGLVQMPSGCGEQNMVLFAPIIYVLQYLEKAGLLTEEIRSRAVGFLEIGYQKELMYKHSNGSYSAFGERDGNGNTWLTAFVTKCFGQAQKFIFIDPKNIQDALKWMAGNQLPSGCYANVGNLLHTAMKGVDDEVSLTAYVTAALLEMGKDVDDPMVSQGLRCLKNSATSTTNLYTQALLAYIFSLAGEMDIRNILLKQLDQQAIISGESIHWSQKPTPSSNASPWSEPAAVDVELTAYALLAQLTKPSLTQKEIAKATSTVAWLAKQRNAYGGFSSTQDTVVALQALAKYATTAYMPSEEINLVVKSTENFQRTFNIQSVNRLVFQQDTLPNVP GMYTLEASGQGCVYVQLLQQPLVKKVEFGTDTLNIYLDELIKNTQTYTFTISQSVLVTNLKPATIKVYDYYLPDEQATIQYSDPCE Sequenced Peptides AQSFLFLDPK
236
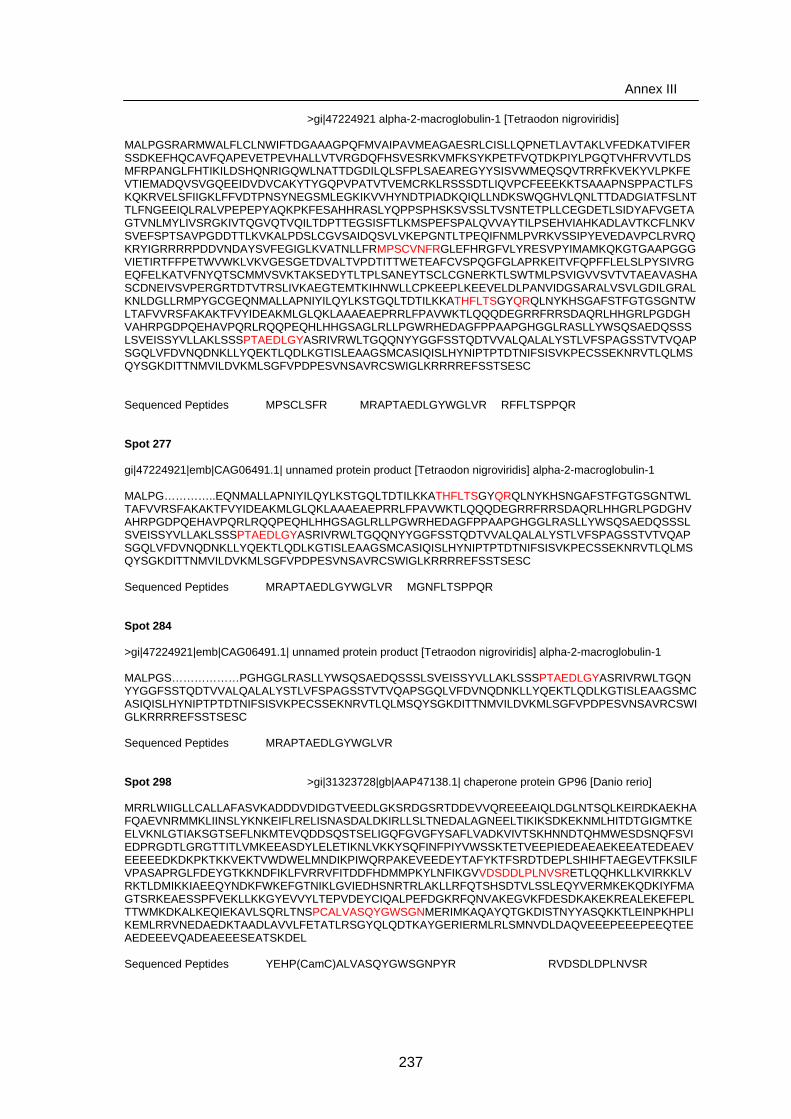
Annex III
>gi|47224921 alpha-2-macroglobulin-1 [Tetraodon nigroviridis] MALPGSRARMWALFLCLNWIFTDGAAAGPQFMVAIPAVMEAGAESRLCISLLQPNETLAVTAKLVFEDKATVIFERSSDKEFHQCAVFQAPEVETPEVHALLVTVRGDQFHSVESRKVMFKSYKPETFVQTDKPIYLPGQTVHFRVVTLDSMFRPANGLFHTIKILDSHQNRIGQWLNATTDGDILQLSFPLSAEAREGYYSISVWMEQSQVTRRFKVEKYVLPKFEVTIEMADQVSVGQEEIDVDVCAKYTYGQPVPATVTVEMCRKLRSSSDTLIQVPCFEEEKKTSAAAPNSPPACTLFSKQKRVELSFIIGKLFFVDTPNSYNEGSMLEGKIKVVHYNDTPIADKQIQLLNDKSWQGHVLQNLTTDADGIATFSLNTTLFNGEEIQLRALVPEPEPYAQKPKFESAHHRASLYQPPSPHSKSVSSLTVSNTETPLLCEGDETLSIDYAFVGETAGTVNLMYLIVSRGKIVTQGVQTVQILTDPTTEGSISFTLKMSPEFSPALQVVAYTILPSEHVIAHKADLAVTKCFLNKVSVEFSPTSAVPGDDTTLKVKALPDSLCGVSAIDQSVLVKEPGNTLTPEQIFNMLPVRKVSSIPYEVEDAVPCLRVRQKRYIGRRRRPDDVNDAYSVFEGIGLKVATNLLFRMPSCVNFRGLEFHRGFVLYRESVPYIMAMKQKGTGAAPGGGVIETIRTFFPETWVWKLVKVGESGETDVALTVPDTITTWETEAFCVSPQGFGLAPRKEITVFQPFFLELSLPYSIVRGEQFELKATVFNYQTSCMMVSVKTAKSEDYTLTPLSANEYTSCLCGNERKTLSWTMLPSVIGVVSVTVTAEAVASHASCDNEIVSVPERGRTDTVTRSLIVKAEGTEMTKIHNWLLCPKEEPLKEEVELDLPANVIDGSARALVSVLGDILGRALKNLDGLLRMPYGCGEQNMALLAPNIYILQYLKSTGQLTDTILKKATHFLTSGYQRQLNYKHSGAFSTFGTGSGNTWLTAFVVRSFAKAKTFVYIDEAKMLGLQKLAAAEAEPRRLFPAVWKTLQQQDEGRRFRRSDAQRLHHGRLPGDGHVAHRPGDPQEHAVPQRLRQQPEQHLHHGSAGLRLLPGWRHEDAGFPPAAPGHGGLRASLLYWSQSAEDQSSSLSVEISSYVLLAKLSSSPTAEDLGYASRIVRWLTGQQNYYGGFSSTQDTVVALQALALYSTLVFSPAGSSTVTVQAPSGQLVFDVNQDNKLLYQEKTLQDLKGTISLEAAGSMCASIQISLHYNIPTPTDTNIFSISVKPECSSEKNRVTLQLMSQYSGKDITTNMVILDVKMLSGFVPDPESVNSAVRCSWIGLKRRRREFSSTSESC Sequenced Peptides MPSCLSFR MRAPTAEDLGYWGLVR RFFLTSPPQR Spot 277 gi|47224921|emb|CAG06491.1| unnamed protein product [Tetraodon nigroviridis] alpha-2-macroglobulin-1 MALPG…………..EQNMALLAPNIYILQYLKSTGQLTDTILKKATHFLTSGYQRQLNYKHSNGAFSTFGTGSGNTWLTAFVVRSFAKAKTFVYIDEAKMLGLQKLAAAEAEPRRLFPAVWKTLQQQDEGRRFRRSDAQRLHHGRLPGDGHVAHRPGDPQEHAVPQRLRQQPEQHLHHGSAGLRLLPGWRHEDAGFPPAAPGHGGLRASLLYWSQSAEDQSSSLSVEISSYVLLAKLSSSPTAEDLGYASRIVRWLTGQQNYYGGFSSTQDTVVALQALALYSTLVFSPAGSSTVTVQAPSGQLVFDVNQDNKLLYQEKTLQDLKGTISLEAAGSMCASIQISLHYNIPTPTDTNIFSISVKPECSSEKNRVTLQLMSQYSGKDITTNMVILDVKMLSGFVPDPESVNSAVRCSWIGLKRRRREFSSTSESC Sequenced Peptides MRAPTAEDLGYWGLVR MGNFLTSPPQR Spot 284 >gi|47224921|emb|CAG06491.1| unnamed protein product [Tetraodon nigroviridis] alpha-2-macroglobulin-1 MALPGS………………PGHGGLRASLLYWSQSAEDQSSSLSVEISSYVLLAKLSSSPTAEDLGYASRIVRWLTGQNYYGGFSSTQDTVVALQALALYSTLVFSPAGSSTVTVQAPSGQLVFDVNQDNKLLYQEKTLQDLKGTISLEAAGSMCASIQISLHYNIPTPTDTNIFSISVKPECSSEKNRVTLQLMSQYSGKDITTNMVILDVKMLSGFVPDPESVNSAVRCSWIGLKRRRREFSSTSESC Sequenced Peptides MRAPTAEDLGYWGLVR Spot 298 >gi|31323728|gb|AAP47138.1| chaperone protein GP96 [Danio rerio] MRRLWIIGLLCALLAFASVKADDDVDIDGTVEEDLGKSRDGSRTDDEVVQREEEAIQLDGLNTSQLKEIRDKAEKHAFQAEVNRMMKLIINSLYKNKEIFLRELISNASDALDKIRLLSLTNEDALAGNEELTIKIKSDKEKNMLHITDTGIGMTKEELVKNLGTIAKSGTSEFLNKMTEVQDDSQSTSELIGQFGVGFYSAFLVADKVIVTSKHNNDTQHMWESDSNQFSVIEDPRGDTLGRGTTITLVMKEEASDYLELETIKNLVKKYSQFINFPIYVWSSKTETVEEPIEDEAEAEKEEATEDEAEVEEEEEDKDKPKTKKVEKTVWDWELMNDIKPIWQRPAKEVEEDEYTAFYKTFSRDTDEPLSHIHFTAEGEVTFKSILFVPASAPRGLFDEYGTKKNDFIKLFVRRVFITDDFHDMMPKYLNFIKGVVDSDDLPLNVSRETLQQHKLLKVIRKKLVRKTLDMIKKIAEEQYNDKFWKEFGTNIKLGVIEDHSNRTRLAKLLRFQTSHSDTVLSSLEQYVERMKEKQDKIYFMAGTSRKEAESSPFVEKLLKKGYEVVYLTEPVDEYCIQALPEFDGKRFQNVAKEGVKFDESDKAKEKREALEKEFEPLTTWMKDKALKEQIEKAVLSQRLTNSPCALVASQYGWSGNMERIMKAQAYQTGKDISTNYYASQKKTLEINPKHPLIKEMLRRVNEDAEDKTAADLAVVLFETATLRSGYQLQDTKAYGERIERMLRLSMNVDLDAQVEEEPEEEPEEQTEEAEDEEEVQADEAEEESEATSKDEL Sequenced Peptides YEHP(CamC)ALVASQYGWSGNPYR RVDSDLDPLNVSR
237

Annex III
Spots 424 , 431, 438, 531 >gi|74096001|ref|NP_001027856.1| Hemopexin [Takifugu rubripes] MKLLTQVLCLALAVTWAHCNSHASAVLDRCLGLEMDAVAVNEVGIPYFFKGDHLFKGFHGKAELSNESFAELDDHHHLGHVDAAFRMHFENSTDHDHLFFFLDHSVFSYYQHKLEQGYPKKISEVFPGIPDHLDAAVECPHPECEEDSVIFFKGDEIYHYNVRTQAVDEKEFKDMPNCTSAFRFMEHFYCFHGHMFSKFDPKTGEVLGKYPKEARDYFMRCAKFSEESDPVERERCSRVHLDAVTSDNAGNKYAFRGHHFLFKEEANDTLKADTIENAFKELHSDVDAVFSYQDHLYMIKNDKIHIYKTGTAHTHLEGYPKPLKEELGIEGPIDAAFVCGDHHIAHLIKGQKMYDVDLKSSQRVADNERPISLFQKIDAAICDGEGLKVIVGNHYYHFDSPMLFIAGRALPEQRRVSLELFGCDH Sequenced Peptides VLVGNHYYTFESLK VSGADLFGCDH Spot 531 >gi|74096001|ref|NP_001027856.1| Hemopexin [Takifugu rubripes] MDLFSKTLLLCLLLILTDAAPAPQDAAEKDNISEVKEEDSGPALPDRCAGIEFDAITPDEKGKTLFFKGAYMWKDFHGPAQLVSESFKEIDDIPNAGSISAAFRMHNKANPDDHDRIYLFLEDKVFSYYEQVLEEGYPKHINEEFPGVPTHLDAAVECPKGECMADSVLFFKGQDVHMYDLSTKTVKTKTWSHLPACTSAFRWLEHYYCFHGHNFTRFNPISGEVNGTYPKDARHYFMRCPNFGHGGGYNIPKCSEVKIDAITVDEAGRMYAFAGPIYMRLDTRRDGFHAFPITRQWKEVVGKVDAVFSYGDKMYLIKGKQVYIYKGGAHYTLVEGYPKTLEEELGVEGPVDAAFVCPGQHTVHIIQGERFLDVSLTATPRVVARNLPFVLSDIDAAYCDAKGVKLFSGSKYYQYASVTILALSKIAALAEPITSEMLGCQD Sequenced Peptides W(CamC)TADSVLFFK HGPAKLRADSFK Spot 540 >gi|59710087|ref|NP_001011879.1| keratin [Takifugu rubripes] MSVRAVKTTTLSSVSTSRGPSQGFSSRSFSGYGGYGVGGGRQSFAVRSSYGGLGSSGAAVGAGGFKVVGGYVGGAGNRVGGLECGYIGFGGGVAGGMGNDVVAPITAVTVNKSLLAPLNLEIDPTIQAIRTQEKEQIKTLNNRFASFIKVRFLEQQNKMLETKWKLLQEQTTSRSNIDMMFEAYIANLRKHLDNLGHEKVKLESDLHHMDLVEDYKTRYEDEINKRTDCENNFVLIKKDADAAYMNKVDLETQVTALSDELDFLRQIYDVEIQELQGQIKDTCVVVEMDNSRDLDMDSIVAEVRAQYEDVANRSRAEAETWYQTKYAEMQQSAGRYGDDLKLSKAEISDMNRRIMRLQSEIDMVKSQKNHLEAQIAESEERGELAVTDAKHRIRELEEALQRAKQDMTMQVRQYQELMNVKLALDIEIATYRKLLEGEEDRLATGIKTTVSKQTSMNFSAYGLESSRTPSYVSSSFGAVKISGGPVSAQEATAMEHINKTETKVIKAEGAQKEEQVAQEVSAAVEEQTSEEKQEQKQEQQVVEAEAVVEE Sequenced Peptides TQSMNYSAYGLES(CamC)R VKDMVTVVAEVR Spot 541 >gi|59710087|ref|NP_001011879.1| keratin [Takifugu rubripes] MSVRAVKTTTLSSVSTSRGPSQGFSSRSFSGYGGYGVGGGRQSFAVRSSYGGLGSSGAAVGAGGFKVVGGYVAGGAGNRVGGLECGYIGFGGGVAGGMGNDVVAPITAVTVNKSLLAPLNLEIDPTIQAIRTQEKEQIKTLNNRFASFIDKVRFLEQQNKMLETKWKLLQEQTTSRSNIDMMFEAYIANLRKHLDNLGHEKVKLESDLHHMTDLVEDYKTRYEDEINKRTDCENNFVLIKKDADAAYMNKVDLETQVTALSDELDFLRQIYDVEIQELQGQIKDTCVVVEMDNSRDLDMDSIVAEVRAQYEDVANRSRAEAETWYQTKYAEMQQSAGRYGDDLKLSKAEISDMNRRIMRLQSEIDMVKSQKNLEAQIAESEERGELAVTDAKHRIRELEEALQRAKQDMTMQVRQYQELMNVKLALDIEIATYRKLLEGEEDRLATGIKTTVSKQTSMNFSAYGLESSRTPSYVSSSFGAVKISGGPVSAQEATAMEHINKTETKVIKAEGAQKEEQVAQEVSAAVEEQTSEEKQEQKQEQQVVEAEAVVEE Sequenced Peptides QTSMNYSAYGLES(CamC)R Spot 581 >gi|39645432|gb|AAH63955.1| Keratin [Danio rerio] MSGGMGGGMGGGIRKNFSSMSTSAVPMGSRSSVSFRRSGGGGGGGGFGAGSGGSFSYSMGGGGGGGGSGFGGGFGSGGGFGSGGGFGGGAGFGGGSAYGGGAGFGGGFGPGGVVPITAVTVNQNLLAPLNLEIDPNIQVVRTQEKEQIKTLNNRFASFIDKVRFLEQQNKVLETKWSLLQEQTTTRSNIDAMFEAYIANLRRQLDGLGNEKMKLEGELKNMQNLVEDFKNKYEDEINKRAAVENEFVLLKKDVDAAYMNKVELEAKVDSLQDEINFLRAIFEEELRELQSQIKDTSVVVEMDNSRNLDMDAIVAEVRAQYEDIANRSRAEAESWYKQKFEEMQSSAGKYGDDLRNTKAEIADLNRMISRLQNEIEAVKGQRANLEAQIAEAEERGELAVKDAKLRIKDLEDALQRAKQDMARQVREYQELMNVKLALDIEIATYRKLLEGEESRIASGGNTATIHIQESSSSSGGGGGGFGYGGGSGYGGGSGFGGGSGYGGGSGFGGGSGFGYGGGSGMSIGGGSGMSMSGGGGGQISMSRSSIVSSQKRRF Sequenced Peptides DMDALVAEVR DTWVVEMDNSR LLALDLELATYR
238

Annex III
>gi|59710087|ref|NP_001011879.1| keratin [Takifugu rubripes] MSVRAVKTTTLSSVSTSRGPSQGFSSRSFSGYGGYGVGGGRQSFAVRSSYGGLGSSGAAVGAGGFKVVGGYVAGGAGNRVGGLECGYIGFGGGVAGGMGNDVVAPITAVTVNKSLLAPLNLEIDPTIQAIRTQEKEQIKTLNNRFASFIDKVRFLEQQNKMLETKWKLLQEQTTSRSNIDMMFEAYIANLRKHLDNLGHEKVKLESDLHH MTDLVEDYKTRYEDEINKRTDCENNFVLIKKDADAAYMNKVDLETQVTALSDELDFLRQIYDVEIQELQG QIKDTCVVVEMDNSRDLDMDSIVAEVRAQYEDVANRSRAEAETWYQTKYAEMQQSAGRYGDDLKLSKAEISDMNRRIMRLQSEIDMVKSQKNHLEAQIAESEERGELAVTDAKHRIRELEEALQRAKQDMTMQVRQYQELMNVKLALDIEIATYRKLLEGEEDRLATGIKTTVSKQTSMNFSAYGLESSRTPSYVSSSFGAVKISGGPVS AQEATAMEHINKTETKVIKAEGAQKEEQVAQEVSAAVEEQTSEEKQEQKQEQQVVEAEAVVEE Sequenced Peptides MPGLSDELDFLR YGGLGSSGAAV QTSMNYSAYGLES(CamC)R Spot 801 >gi|37362196|gb|AAQ91226.1| cytosolic nonspecific dipeptidase [Danio rerio] MSYLPNLFKYVDEHQNEYVERLAQWVAVQSVSAWPEKRGEIKKIMEMAGKDIERLGGTVELVDIGMQKLP SGEEIPLPPIVLGRLGSDPGKKTVCIYGHLDVQPASIEDGWDSQPFILEERDGKMYGRGSTDDKGPVLAW FNIIEAYQKIGQELPINIKFCFEGMEESGSEGLDDLVFSRKDTFFKDVDYVCISDNYWLGKTKPCITYGL RGICYFFIEMECCDKDLHSGVFGGSVHEAMTDLIALMGTLVDNKGKIKVPGIYDQVAKLTDEEKKLYEKI EFDLEEYAKDVGAGKLMHDTKEQILMHRWRYPSLSLHGIEGAFSEAGAKTVIPRKVIGKFSIRLVPDMDP KVVEKQVISHLEKTFAELKSSNQPEVATGPWTKAGWSDFNHPHYMAGRKGHETVFGVEPDLTREGGSIPVTLTFQEATGQNVMLLPVGSSDDGAHSQNEKLNRSNYIQGTKMLGAYFYEVSQLS Sequenced Peptides VVEEQVLSHLEK WDH(CamC)EVQSVSAWPERK NLTVEMVDLGK
EWQPVTLTFG(CamC)RLR Spot 851b , 851a >gi|47218629|emb|CAG04958.1| ATP synthase β-subunit [Tetraodon nigroviridis] MLGAVGRCCTGALQALKPGVQPLKALVGSPAVLARRDYVAPAAAAATANGRIVAVIGAVVDVQFDEGLPP ILNALEVAGRDSRLVLEVAQHLGENTVRTIAMDGTEGLVRGQKVLDTGAPIRIPVGPETLGRIMNVIGEPIDERGPITTKQTAPIHAEAPEFTDMSVEQEILVTGIKVVDLLAPYAKGGKIGLFGGAGVGKTVLIMELINNVAKAHGGYSVFAGVGERTREGNDLYHEMIESGVINLKDTTSKVALVYGQMNEPPGARARVALTGLTVAEYFRDQEGQDVLLFIDNIFRFTQAGSEVSALLGRIPSAVGYQPTLATDMGTMQERITTTKKGSITSVQAIYVPADDLTDPAPATTFAHLDATTVLSRAIAELGIYPAVDPLDSTSRIMDPNIVGAEHYDVARGVQKILQDYKSLQDIIAILGMDELSEEDKLTVARARKIQRFLSQPFQVAEVFTGHLGKLVPLKETIKGFQSILAGEYDALPEQAFYMVGPIEEVVQKAKKLVEEQS Sequenced Peptides LTAMDGTEGLVR TGLTVAEYFR FTQAGSEVSALLGR FAAHMELLNNVAK LVLEVAQHLWRWK MLDPNLVGAEHYDLAR LMNVLGEPLDER Spot 1017 >gi|61403546| 3-hydroxyisobutyryl-Coenzyme A hydrolase [Danio rerio] MSLIIFTSAQRLRSVCRLQRIHGHMMSSKAGSEVLFEKVGKAGVITLNRPKALNALTLNMIRHIYPQLKKWDKDSETDIVIIKGAGEKAFCAGGDIRAIAEAGKAGNLLSQVFFREEYILNNTIGTYQKPYVALINGITMGGGVGLSVHGQFRVATEKTLFAMPETGIGLFPDVGGGYFLPRLQGKLGLFLALTGFRLKGRDVQRVGVATHFVQSEKIESLEKDLVDLKSPSISDVAQLLDSYQEQSHLDAEKPFVLQEQTEAIDRLFSAGSVEEIVENLKKDGSAFALKQAETLAKMSPTSLKLTFRQIEEGARMSLQEVFMMEYRLSQACMNGHDFYEGVRAVLIDKDQSPKWKPSTLAGVSEQFVDKCFSSLDERDLKL Sequenced Peptides LGLFLALTGFR EEYLLNNALGSYR >gi|89268269| 3-hydroxyisobutyryl-Coenzyme A hydrolase [Xenopus tropicalis] MSLGLLESQLRLKVFGRLQVIRQHLRMTNHTVKDGECLLTKAGCAGVITLNRPKALNALNLGMIRLIYPQLGLWEEDPETYLVIIKGVGGKAFCAGGDIRAVTDAGKAGDRLAQDFFREEYILNNAIGTYKKPYVALIDGITMGGGVGLSVHGHFRVASENTLFAMPETAIGLFPDVGGGYFLPRLPGKLGLYLALTGFRLKGSDVQKAGIATHFVESEKIPSLEQDLVAMKCPSKENVADVLDSYHNKSYAAQDKPFVLAEHLDKINSLFSASSVEAIIENLRCDGSSFALKQLQTLSTMSPTSLKITFRQLKEGSSMSLQEVLTMEYRLSQACMKGYDFYEGVRAVLIDKNQNAKWNPELLEEVTDDYIDSYFTSLGNSDLKL Sequenced Peptides RDSLAQDFFR
239

Annex III
Spot 1030, 1031 >gi|47212109|emb|CAF96691.1| keratin 18 [Tetraodon nigroviridis] MSFRKTTMVSIPSTRISLTRSTPQYGSSASIYGGAGGQGARTSSVSASLLRSNTPMVASSSSFKLSSALGGGAGGSKVTGAGIIGDERGAMQNLNDRLANYIETVRNLELANKELEQKIMLAMEKGGPQTRDYSKYESIIEDLRRKIFDSITDNARLVLQIDNARLAADDFKVKFDNEMAIRQSVEAEMAGLKKVIDDTNMNRMNIEGEIEAVREELAYLKKNHENDVMELRHQISRSGVQVDVDAPKGQDLAQIMEDMRANYEKIGAKNAEDLKRWHENQIADVQVQVSQNTEALQGAQMEIGDLSRQLQTLEIELASQQSLKASLEDTLRNTELRSNMEMEKYNAITMRLEEELTKLRANIQNQTQDYEVLLNMKMKLEAEISTYKVLLDGGDFKLQDALDELAGTA Sequenced Peptides (1030) NHENEVMELR VQVSLEAPK KGDLAQLMEDMR Y(CamC)FLELELASQQSLK Sequenced Peptides (1031) KGDLAQLMEDMR Y(CamC)FLELELASQQSLK Spot 1032 >gi|54035446| 26S protease regulatory subunit S10B [Danio rerio] MAENREKGLQDYRKKLLEHKEIDGRLKELREQLKELTKQYEKSENDLKALQSVGQIVGEVLKQLTEEKFI VKATNGPRYVVGCRRQLDKSKLKPGTRVALDMTTLTIMRYLPREVDPLVYNMSHEDPGSVSYSEIGGLSE QIRELREVIELPLTNPELFQRVGIIPPKGCLLYGPPGTGKTLLARAVASQLDCNFLKVVSSSIVDKYIGE SARLIREMFNYARDHQPCIIFMDEIDAIGGRRFSEGTSADREIQRTLMELLNQMDGFDTLHRVKMIMATN RPDTLDPALLRPGRLDRKIHIELPNEQARLDILKIHSGPITKHGDIDYEAIVKLSDGFNGADLRNVCTEA GMFAIRADHEYVTQEDFMKAVRKVADSKKLESKLDYKPV Sequenced Peptides EVLELPLTNPELFKR NV(CamC)TEAGLFALR LGASKLD(CamC)NFLK Spot 1102 >gi|56718619|gb|AAW28030.1| Glyceraldehyde 3-phosphate dehydrogenase [Danio rerio] MSELCVGINGFGRIGRLVLRACLQKGIKVTAINDPFIDLQYMVYMFKYDSTHGRYKGEVHMEDGKLIVDGQAISVFQCMKPAEIPWGDAGALYVVESTGVFLSIEKASAHIQGGAKRVVVSAPSPDAPMFVMGVNQDKYDPSSMTIVSNASCTTNCLAPLAKVIHDNFGIEEALMTTVHAYTATQKTVDGPSAKAWRDGRGAHQNIIPASTGAAKAVGKVIPELNGKLTGMAFRVPVADVSVVDLTCRLTRPASYANIKESVKKAAHGPMKGILGYTEDSVVSSDFVGDTHSSIFDAGAGISLNDNFVKLISWYDNEFGYSHRVADLLMYMHSKE
Sequenced Peptides VPVADVWVDLT(CamC)R YYEPSPDAPMFVMRA(CamC)VK
Spot 1106 >gi|37682099|gb|AAQ97976.1| keratin 8 [Danio rerio]
MSTYSKKTSYTVKSSSSGSIPRNFSSLSYSGPSMSRQSYSARSSYGGVNRGMGAGMGGGSGFISSSSAYGLGGMGTGMGAGVVAPIQAVTVNKSLLAPLNLEIDPNIQIVRTQEKEQIKTLNNRFASFIDKVRFLEQQNKMLETKWSLLQNQTATRSNIDAMFEAYIANLRRQLDSLGNDKMKLEADLHNMQGLVEDFKNKYEDEINKRTECENEFVLIKKDVDEAYMNKVELEAKLESLTDEINFLRQIFEEEIRELQSQIKDTSVVVEMDNSRNLDMDAIVAEVRAQYEDIANRSRAEAEMWYKSKYEEMQTSANKYGDDLRSTKTEIADLNRMIQRLQSEIDAVKGQRANLENQIAEAEERGEMAVRDAKGRIKDLEDALQRAKQDMARQIREYQDLMNVKLALDIEIATYRKLLEGEEDRLATGIKAINISKQSTSYGGYPMESAGSSYSTYSSGYSSGLSGGYGGGYSGGYSGGYSSGSGYSDTVSQTKKSVVIKMIETKDGRVVSESSEVVQD
Sequenced Peptides QNSLTDELNFLR
Spot 1119 >gi|28557116|dbj|BAC57564.1| tropomyoshin1-1 [Takifugu rubripes]
MDAIKKKMQMLKLDKENALDRAEQAETDKKAAEDRSKQLEDELRELEKKLRVTEDERDRVTEEFQTAEEKLLTAEEVATKAEAEVASLNRRIQLVEEELDRAQERLGTALTKLEEAEKAADESERGMKVIENRAMKDEEKMELQEIQLKEAKHIAEEADRKYEEVARKLVIIEGDLERTEERAELAESKCAELEEELKTVTNNLKSLEAQAEKYSQKEDKYEEEIKVLTDKLKEAETRAEFAERTVAKLEKTIDDLEDELYSQKLKYKAISEELDHALNDMTSI Sequenced Peptides LDQENALDR QDVFEEFKTAEEK EP(CamC)VASLNR
VEEFQTAEEK LQLVEEELDR MELQELKLK LLEGDLER
240

Annex III
Spot 1123 >gi|15028982| type I keratin S8 [Oncorhynchus mykiss]
MSYYSYKSSSGGGPMNFSGGSNIMSSRVGYVSSAPKAFSVYGGGSGGGTRISSSSVRSVSSGYGGGAGFGGGYGSGGGGYGSGGGGYGSGGGGGFNLSSALDGGAIHLNEKATMQNLNDRLSTYLDKVRSLEEANSKLEIQIREYKKGPAAERDYSKYWAIINDLKDKINGATCNNANILLQIDNSKLAADDFQTKFEHELMMRQSVEADIANLRRLLDQTTLTKADLEMQIEGLQDELAYLKKNHIEELAAMRAQLTGTVNVEVDAAPQQDMSRTMEEIRTQYEGIIDKHRRDQEAWFNDKSANLSKEVATSTEIIQTTKTEINDLRRTMQGLEIELQSQLSMKAALENTLRETDGRYSAMLSGYQNQIDMLEQELNRVRQSIETQGHDYKMLLDIKSRLEQEIATYRGLLEGEESRTVGSGGSKTTVTTSTVRSSS
Sequenced Peptides QSVEADLANLR WWNTLNVEVDASPKQRWK
Spot 1134 >gi|47216949|emb|CAG04891.1| annexin A3t [Tetraodon nigroviridis] annexin A3
MSVWDDLDLLLDSPSSITVNSNTKGTVKDKKDFKVEEDVSALRKAIEGLGTTETTLIEVLTQRSNNQRQLIAKAYEKATGRTLVADLEGDTHGDFEDLLVALVTPPDVFDCQEVIRAIKGAGTTESTLTEIFASRSNRQIKGLSEAYLAETGRSVIHDLQSEVSGDYGKALLILAEGKRDESTSADAAKAKAEAKELYNAGEKKWGTDEAKFIDILCHRSVPQLRQTLVEYKSMSKKTLQESIESEMSGNLQKLLVAVVKCVKNVPAYFAEKLFKAMKGAGTTESILTRILVSRSEIDLSDIKAEYKKLFGSSLYSQLESEVSGSYGDALKSLCGQED Sequenced Peptides K[158.0]TECTLTELFSSR SPSEAYKAETGK FF(CamC)LLYSQLESEVSGDYVMPR
Spot 1139 >gi|74310597|rNADH dehydrogenase subunit 5 [Cylindrophis ruffus]
MNTITPTLTVTIFMSLTLLIMKLLIKKTQNLTHTKHIMMLMFIISLIPLSLLLNNENETMLSSPPIIYMTTTNISISLILDTFSLTFIPVSLFITWSIVEFSIWYMSTDPYINKFIKHLLTFLIAMLIIITANNMIQLFVGWEGVGIMSFLLIGWWYARSDANSAALQAIIYNRIGDIGLIMTTAWLMSSSSMNMQELFTQHETMSIIPLMGLVGAAAGKSAQFGLHPWLPAAMEGPTPVSALLHSSTMVVAGVFLLIRLHPIMQNNITSTTCLILGATTTLFAAASAITQHDIKKIIALSTTSQLGLMMTMIGLNQPKLAFLHMAMHSFFKALLFLCSGSFIHNLGGEQDIRKMGNLNKNLPMTSSMITIASLSLMGMPFLSGFYSKDTIIETMTISHINSWALMLTLVATMLSAMYSMRIINFTLTNFPRTKQKIHQENKTLAKPTLRLTLGSILAGTMTKLSTLQTTSTMTMPTTIKLSALTITIAGILLSTDLMFLSPHQPPKKPKTLTLFFNQLAFFNMIHRAAPMKTLKFGQQISTELVDLWALENYGPKGLSNSTIKMIHTTTQQKNLIKNYLTTFTLTIILTLVLMMSK Sequenced Peptides AQVLWALESYGR Spot 1146 >gi|66792936| tropomyosin 4 isoform 1 [Danio rerio] MEAIKKKMQMLKLDKENAIDRAEQAETEQKAAEDKCKQLDDELVGLQKKLRQTEDELDKYSEALKDAQEKLELSEKKAADAEGDVAALNRRIQLVEEELDRAQERLGTALQKLEEAEKAADESERGMKVIENRAMKDEEKMEIQEMQLKEAKHIAEEADRKYEEVARKLVILEGELERAEERAEVAECKASDLEEELKNVTNNLKSLEAQAEKYSEKEDKYEEEIKVLSDKLKEAETRAEFAERTVAKLEKSIDDLEDELYAQKLKYKAISEELDHALND TTSL Sequenced Peptides LQLVEEELDR QQDAEEGVAALNR EQLVLEELDRAEKR LVVLEGELEKAEER Spot 1147 >gi|74136103|ref|NP_001027910.1| tropomyosin2 [Takifugu rubripes] MEAIKKKMQMLKLDKENAIDRAEQAEGDKKGAEDKCKQLEEELLGLQKKLKGVEDELDKYSESLKDAQEKLEQAEKKAADAEAEVASLNRRIQLVEEELDRAQERLATALQKLEEAEKAADESERGMKVIENRASKDEEKMEIQEMQLKEAKHIAEEADRKYEEVARKLVILEGDLERSEERAEVAEAKSGDLEEELKNVTNNLKSLEAQAEKYSQKEDKYEEEIRVLTDKLKEAETRAEFAERSVAKLEKTIDDLEEKLAQAKEENLDMHQVLDQTLLELNNL Sequenced Peptides NNKENALDR LQEEELLGLKK QLLVEEELDR REDELDQYSESLK
LVLLEGDLER QMLEEELGANVTNLNK VDDDLEENLAQAK
241
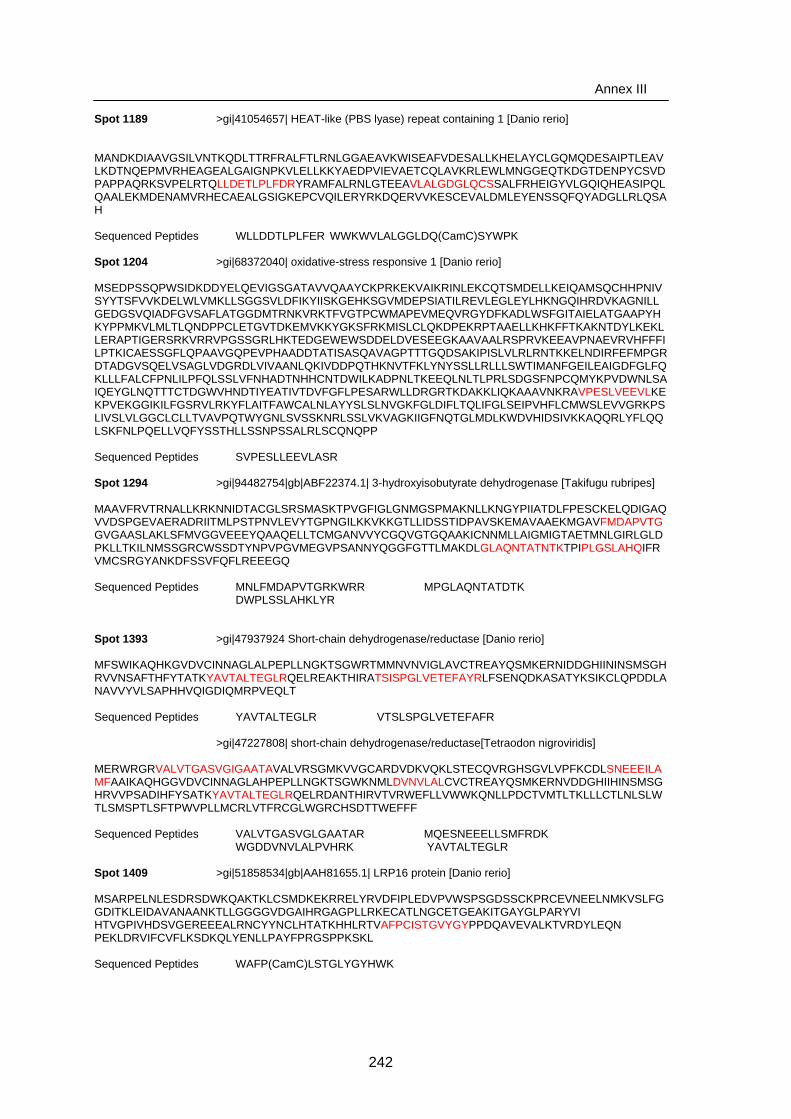
Annex III
Spot 1189 >gi|41054657| HEAT-like (PBS lyase) repeat containing 1 [Danio rerio] MANDKDIAAVGSILVNTKQDLTTRFRALFTLRNLGGAEAVKWISEAFVDESALLKHELAYCLGQMQDESAIPTLEAVLKDTNQEPMVRHEAGEALGAIGNPKVLELLKKYAEDPVIEVAETCQLAVKRLEWLMNGGEQTKDGTDENPYCSVDPAPPAQRKSVPELRTQLLDETLPLFDRYRAMFALRNLGTEEAVLALGDGLQCSSALFRHEIGYVLGQIQHEASIPQLQAALEKMDENAMVRHECAEALGSIGKEPCVQILERYRKDQERVVKESCEVALDMLEYENSSQFQYADGLLRLQSAH Sequenced Peptides WLLDDTLPLFER WWKWVLALGGLDQ(CamC)SYWPK Spot 1204 >gi|68372040| oxidative-stress responsive 1 [Danio rerio] MSEDPSSQPWSIDKDDYELQEVIGSGATAVVQAAYCKPRKEKVAIKRINLEKCQTSMDELLKEIQAMSQCHHPNIVSYYTSFVVKDELWLVMKLLSGGSVLDFIKYIISKGEHKSGVMDEPSIATILREVLEGLEYLHKNGQIHRDVKAGNILLGEDGSVQIADFGVSAFLATGGDMTRNKVRKTFVGTPCWMAPEVMEQVRGYDFKADLWSFGITAIELATGAAPYHKYPPMKVLMLTLQNDPPCLETGVTDKEMVKKYGKSFRKMISLCLQKDPEKRPTAAELLKHKFFTKAKNTDYLKEKLLERAPTIGERSRKVRRVPGSSGRLHKTEDGEWEWSDDELDVESEEGKAAVAALRSPRVKEEAVPNAEVRVHFFFILPTKICAESSGFLQPAAVGQPEVPHAADDTATISASQAVAGPTTTGQDSAKIPISLVLRLRNTKKELNDIRFEFMPGRDTADGVSQELVSAGLVDGRDLVIVAANLQKIVDDPQTHKNVTFKLYNYSSLLRLLLSWTIMANFGEILEAIGDFGLFQKLLLFALCFPNLILPFQLSSLVFNHADTNHHCNTDWILKADPNLTKEEQLNLTLPRLSDGSFNPCQMYKPVDWNLSAIQEYGLNQTTTCTDGWVHNDTIYEATIVTDVFGFLPESARWLLDRGRTKDAKKLIQKAAAVNKRAVPESLVEEVLKEKPVEKGGIKILFGSRVLRKYFLAITFAWCALNLAYYSLSLNVGKFGLDIFLTQLIFGLSEIPVHFLCMWSLEVVGRKPSLIVSLVLGGCLCLLTVAVPQTWYGNLSVSSKNRLSSLVKVAGKIIGFNQTGLMDLKWDVHIDSIVKKAQQRLYFLQQLSKFNLPQELLVQFYSSTHLLSSNPSSALRLSCQNQPP Sequenced Peptides SVPESLLEEVLASR Spot 1294 >gi|94482754|gb|ABF22374.1| 3-hydroxyisobutyrate dehydrogenase [Takifugu rubripes] MAAVFRVTRNALLKRKNNIDTACGLSRSMASKTPVGFIGLGNMGSPMAKNLLKNGYPIIATDLFPESCKELQDIGAQVVDSPGEVAERADRIITMLPSTPNVLEVYTGPNGILKKVKKGTLLIDSSTIDPAVSKEMAVAAEKMGAVFMDAPVTGGVGAASLAKLSFMVGGVEEEYQAAQELLTCMGANVVYCGQVGTGQAAKICNNMLLAIGMIGTAETMNLGIRLGLDPKLLTKILNMSSGRCWSSDTYNPVPGVMEGVPSANNYQGGFGTTLMAKDLGLAQNTATNTKTPIPLGSLAHQIFRVMCSRGYANKDFSSVFQFLREEEGQ Sequenced Peptides MNLFMDAPVTGRKWRR MPGLAQNTATDTK DWPLSSLAHKLYR Spot 1393 >gi|47937924 Short-chain dehydrogenase/reductase [Danio rerio] MFSWIKAQHKGVDVCINNAGLALPEPLLNGKTSGWRTMMNVNVIGLAVCTREAYQSMKERNIDDGHIININSMSGHRVVNSAFTHFYTATKYAVTALTEGLRQELREAKTHIRATSISPGLVETEFAYRLFSENQDKASATYKSIKCLQPDDLANAVVYVLSAPHHVQIGDIQMRPVEQLT Sequenced Peptides YAVTALTEGLR VTSLSPGLVETEFAFR >gi|47227808| short-chain dehydrogenase/reductase[Tetraodon nigroviridis] MERWRGRVALVTGASVGIGAATAVALVRSGMKVVGCARDVDKVQKLSTECQVRGHSGVLVPFKCDLSNEEEILAMFAAIKAQHGGVDVCINNAGLAHPEPLLNGKTSGWKNMLDVNVLALCVCTREAYQSMKERNVDDGHIIHINSMSGHRVVPSADIHFYSATKYAVTALTEGLRQELRDANTHIRVTVRWEFLLVWWKQNLLPDCTVMTLTKLLLCTLNLSLWTLSMSPTLSFTPWVPLLMCRLVTFRCGLWGRCHSDTTWEFFF Sequenced Peptides VALVTGASVGLGAATAR MQESNEEELLSMFRDK WGDDVNVLALPVHRK YAVTALTEGLR Spot 1409 >gi|51858534|gb|AAH81655.1| LRP16 protein [Danio rerio] MSARPELNLESDRSDWKQAKTKLCSMDKEKRRELYRVDFIPLEDVPVWSPSGDSSCKPRCEVNEELNMKVSLFGGDITKLEIDAVANAANKTLLGGGGVDGAIHRGAGPLLRKECATLNGCETGEAKITGAYGLPARYVI HTVGPIVHDSVGEREEEALRNCYYNCLHTATKHHLRTVAFPCISTGVYGYPPDQAVEVALKTVRDYLEQN PEKLDRVIFCVFLKSDKQLYENLLPAYFPRGSPPKSKL Sequenced Peptides WAFP(CamC)LSTGLYGYHWK
242

Annex III
Spot 1411 >gi|37362126| Glutathione S-transferase [Micropterus salmoides] MAKDMTLLWGSGSPPCWRVQIALEEKSLQGYNQKLLRFDKMEHKSQEVMDMNPRGQLPAFKHGNNVLNESYAACLYLESEFKSQGNKLIPDCSAEKALMYQRMFEGLTLNQKMADVIYYNWKVPEGERHDSAVKRNRDVLSAEVKLWEGYLQKASGSFFAGKNFSLADVTVYPSIAYLFHFGLCEERYPKLAAYYNSNKDRPSIKATWPPTWLENPQGQDQLKDI Sequenced Peptides SS(CamC)MMLRKALMYQR >gi|64236|emb|CAA45293.1| glutathione-S-transferase [Pleuronectes platessa] MAKDMTLLWGSGSPPCWRVMIVLEEKNLQAYNSKLLSFEKGEHKSAEVMSMNPRGQLPSFKHGSKVLNESYAACMYLESQFKSQGNKLIPDCPAEQAMMYQRMFEGLTLAQKMADVIYYSWKVPEAERHDSAVKRNKENLSTELKLWEEYLQKTSGSFVAGKSFSLADVSVFPGVAYLFRFGLTEERYPQLTAYYNSLKERPSIKASWPPTWLESPQGQDMLKDV Sequenced Peptides LFHLYYSWYVPEEER Spot 1422 >gi|56789119|gb|AAH88077.1| Peroxiredoxin 6 [Xenopus tropicalis] MSVLLGSVFPNFEAETTVGKIKFHDWLGDSWGILFSHPKDYTPVCTTELGRVVQLLDEFKKREIKLIAVS CDSVKDHEGWSEDILSYVGSTGTFPYPIIADPDRKLAKELGMIDPDEKDSTGMPLTARAVFIVGSDKRLK LSILYPATTGRNFDEILRVIDSLKLTARQKVATPVDWQPGKPCMVVPNLSNEEAKKLFPNYEQKTVPSGK NYLRFTPDY Sequenced Peptides VLDSLKLTAQK Spot 1424 >gi|47193903|emb|CAF91861.1| Peroxiredoxin 6 [Tetraodon nigroviridis] SWGILFSHPKDFTPVCTTELARAAKLSEEFKKRDVKMIALSIDSVEDHCSWSKDVMALNAEPKRPLPYPIIADDKRQLSVQLGMLDPDELDKDGIPLTARCVFVIGPDKKLKLSILYPATTGRNFDELLRVIDSLQLTAQKKVATPVDWK Sequenced Peptides VLDSLQLTAKK >gi|37748290|gb|AAH59671.1| Peroxiredoxin 6 [Danio rerio] MPGILLGDVFPNFEADTTIGKIKFHEFLGNSWGILFSHPRDFTPVCTTELARAAKLHEEFKKRDVKMIALSIDSVEDHRKWSEDILAFNQDKACCPMPFPIIADDKRELSVLLGMLDPDERDKDGMPLTARCVFVVGPDKRLKLSILYPATTGRNFDEILRVVDSLQLTATKKVATPVDWKPGQEVMVIPSLSDEEANKLFPAGFTLKEVPSGKKYIRYTKP Sequenced Peptides LSLLYPATWK RLLLGDVFPNPFVDGLFSK DFTPVCTTELACAAK NFDELLR VLDSLQLTAKK Spot 1439 >gi|57157763|dbj|BAD83854.1| apolipoprotein A-IV1 [Takifugu rubripes] MKVLAVLVLALFSGVNANILWQQPPKSNLDMVKDAFWDYVAKVTLTAEESLNQIRQSELGQEVNAKFSES ADKVNQYVVALRTQATPLTQDFITRVSQEAEQLKTRLETELSAMTTNLQPYSDMLVKLQTQLEEMKKETA SLAEAMDAEALKTILQHKSHELKKQLEHNAKELQAQMVPYTEEMKNKMEQSLEDFHSSLMPIAQSFESQL NQKTQEIQQSLIPYGEELKAKLDSSAQDVQAQLAALWEAFTKTQ Sequenced Peptides DGWVD(CamC)VNKYVVALR MQWVEAQMTPYTKEMR Spot 1439b >gi|68400425|Proteasome subunit beta type 5 precursor [Danio rerio] MALQDVCGLLEPPLFPQWTAPLSQSFMPEDSTHLFGGGIYGEAFSSWVPRRSGLNPLEFYMPISEYITKS PINFGQTPQSSNLLDVDHMHPTLPYISQSGALPFTLSHGTTTLGFAFQGGVIAAADTRSSCAGKVACPASPKVLPIHSHLVGTTSGTSADCALWKRILARELRLYQLRHRRRLSTGGAAKLLSHMLHPFKGTELCVAATLCGWDGDEDQDNAQPMTERYANTTLTSKSSSQSAASSGLSGVRGPRVVYVCSDGLRLQGALFSVGSGSPYAYSILDGGVRWGMSAQEAAAVAREAVYRPTYRDAYSGNNVDLYHVTAKGWRRRERENLKEEYYREKERRAQNNTGEKSIHSIK Sequenced Peptides WQAPLSQDFMTYEPR VEVWGENMQPYALYYSK
243

Annex III
Spot 1440 >gi|47211292| ubiquitin C-terminal hydrolase L1; UCH-L1t [Tetraodon nigroviridis] MEWTPMELNPEMLNMLMTSLGVNESWRFVDVVGLESEQLSAVPKPCCALMLLFPLTQQHESFRKQQADIVEETGVYFLKQMAPNSCGTVALLHAVANNKGKLTFASDSVLQKFLDETADMSSDDRAKHLEKN Sequenced Peptides LFDETANFSADDR MAKFMAVAVLALLHAVANNKSK >gi|37722017 ubiquitin C-terminal hydrolase L1; UCH-L1 [Danio rerio] MEWKPMEINPEMLNKVLSKLGVGSKWRFVDVLGLEDESLSGVPSPCCAMMLLFPLTQQHEDFRSKQSVGDCKDVYFLKQTVVNSCGTVGLVHAVANNQDSIDFDNNSALKKFLEATSGMSPAERAKELEQNKAIQETHDAVADEGQCRPEADKVNFHFITFVNVNGRLYELDGRIDGPVSHGPTKPDSFVMDAARVCREFMEREKGEVRFSAVALCKA Sequenced Peptides FSAVAL(CamC)R LFDETANFSADDR VDVNGQLYEFDGR YS(CamC)NS(CamC)GTLALLHAVANDWR
Spot 1507 >gi|67772036 Ferritin middle subunit [Siniperca chuatsi] MESQVRQNYHRDCEAAINRMVNMELFASYTYTSMAFYFSRDDVALPGFTHFFKENSEEEREHAQKLLSFQNNRGGRIFLQDIKKPERDEWGSGLEAMQCALQLEKNVH Sequenced Peptides LLSFKNNR >gi|51858515|gb|AAH81630.1| Zgc:92245 [Danio rerio] Ferritin heavy polypeptide MSSQVRQNFHQECEAAINRQIYLELYASYVYLSMGYYFDRDDKSLPNFAKFFRDQSKEEREHAEKLMSLQ NQRGGRIFLQDIKKPDRDEWGSGLEALECALALEKSVNLSLLELHKVATQHNDPHVCDFLETHYLDEQVK SIKELSDWVGSLRRMGAPQNNMAEYLFDRHTLGKESS Sequenced Peptides MAEYLFSR >gi|47939430|gb|AAH71455.1| Zgc:56095 protein [Danio rerio] Ferritin lower subunit MSLIKQNLHSNNEANINKLINLKLTASYVYLSLGMYFDRDDVALPNFSKFFLERSHKERDHAEDLLEYQN TRGGRILLQTVAKPSRDDWKGGIDALAFSLEHQKSINRSLLEVHRVAGDHSDPHLSDFLEGKFFTDSHET IKTLGDYLGSLSRITSSDPHGKMAEYLFDKHTLSSTQIS Sequenced Peptides MAEYLFSR LGDYLGTLTR
Spot 1512
>gi|37779086|gb|AAP20203.1| putative transient receptor protein 2 [Pagrus major] HEGAKGKTTKKRPQRATSNVFAMFDQSQIQEFKEAFNMIDQNRDGFIDKEDLHDMLASLGKNPSDEYLEGMMSEAPGPINFTMFLTMFGERLNGTDPEDVIRNAFACFDEEGSGVIHEDHLRELLTTMGDRFTDEEVDELFREAPIDKKGNFNYAEFTRILKHGAKDKDDE >gi|47213295|emb|CAG12377.1| unnamed protein product [Tetraodon nigroviridis] MSSKRAKGKTTKKRPQRATSNVFAMFDQSQIQEFKEAFNMIDQNRDGFIDKEDLHDMLASLGKNPSDEYLEGMMAEAPGPINFTMFLTMFGERLNGTDPEDVIRNAFACFDEEGSGVIHEDHLRELLTTMGDRFTDEEVDELFREAPIDKKGNFNYAEFTRILKHGAKDKDD >gi|33991794|gb|AAH56526.1| Myosin light chain (19.9 kD) (mlc-4) [Danio rerio] MSSKRAKGKITKKRPQRATSNVFAMFDQSQIQEFKEAFNMIDQNRDGFIDKEDLHDMLASLGKNPADDYLEAMMTEAPGPINFTMFLTMFGEKLNGTDPEEVIRNAFACFDEEGTGFIHEDYLRELLTTMGDRFTDEEVDELFREAPIDKKSNFNYVEFTRILKHGAKDKDD
Sequenced Peptides EAFNMLDQNR ARGTDMLPVLR FTDEEVDELFR GNFNYAEFTR
244

245
Annex III.3.- Variation between experimental and theoretical Mr and pI values. Experimental (Exper) and theoretical (Theor) Mr and pI
values of each protein were measured with software analysis and Expasy Mw/pI tool, respectively. Variation [∆ (Exp-Theor)] was
calculated as (Exper-Theor)) value and normalization [Norm ∆] as (Exper value-Theor value)/ (Exper value+Theor value).
Mr pI Spot ID Prot ID
Exp. Theor.∆(Exp-Theo) Norm ∆ Exp. Theor.
∆(Exp-Theo)
240 Alpha-2-macroglobulin-1 92 150 -58 -0,240 4,31 6,23 -1,9 250 Alpha-2-macroglobulin-1 92 150 -58 -0,240 4,38 6,23 -1,9 253 Alpha-2-macroglobulin-1 91 150 -59 -0,245 4,45 6,23 -1,8 261 Alpha-2-macroglobulin-1 90 150 -60 -0,250 4,52 6,23 -1,7 263 Alpha-2-macroglobulin-1 89 150 -61 -0,255 4,58 6,23 -1,7 265 Alpha-2-macroglobulin-1 88 150 -62 -0,261 4,65 6,23 -1,6 267 Alpha-2-macroglobulin-1 88 150 -62 -0,261 4,72 6,23 -1,5 277 Alpha-2-macroglobulin-1 88 150 -62 -0,261 4,78 6,23 -1,5 284 Alpha-2-macroglobulin-1 87 150 -63 -0,266 4,86 6,23 -1,4 298 Chaperone protein GP96 85 91 -6 -0,034 4,38 4,77 -0,4 424 Hemopexin 77 49 28 0,222 4,36 5,66 -1,3 431 Hemopexin 76 49 27 0,216 4,44 5,66 -1,2 438 Hemopexin 75 49 26 0,210 4,52 5,66 -1,1 531 Hemopexin 71 49 22 0,183 5,28 5,66 -0,4 540 Keratin 70 61 9 0,069 4,84 5,04 -0,2 541 Keratin 70 61 9 0,069 4,91 5,04 -0,1 581 Keratin 68 61 7 0,054 4,71 5,04 -0,3 801 Cytosolic nonspecific dipeptidase 58 53 5 0,045 5,27 5,18 0,1 851a ATP synthase β-subunit 56 55 1 0,009 4,64 5,09 -0,5 851b ATP synthase β-subunit 55 55 0 0,000 4,63 5,09 -0,5 932 Interferon induced protein 56 53 50 3 0,029 7,59 6,48 1,1 1017 3-hydroxyisobutyryl-Coenzyme A hydrolase 49 42 7 0,077 6,32 7,66 -1,3 1030 Keratin 18 48 45 3 0,032 4,62 5,02 -0,4

246
Annex III.3.- Variation between experimental and theoretical Mr and pI values (continuation).
Mr pI Spot ID Prot ID
Exp. Theor.∆(Exp-Theo) Norm ∆ Exp. Theor.
∆(Exp-Theo)
1031 Keratin 18 48 45 3 0,032 4,54 5,02 -0,5 1032 Proteasome 26S subunit ATPase 6 48 44 4 0,043 7,37 7,1 0,3 1102 Glyceraldehyde 3-phosphate dehydrogenase 44 36 8 0,100 7,45 6,55 0,9 1106 Keratin 8 44 58 -14 -0,137 4,41 5,15 -0,7 1119 Tropomyosin 43 33 10 0,132 4,03 4,67 -0,6 1123 Keratin S8 type I 43 79 -36 -0,295 4,49 5,14 -0,6 1134 Annexin A3 42 37 5 0,063 5,16 5,13 0,0 1139 NADH dehydrogenase 5 42 66 -24 -0,222 6,19 9,76 -3,6 1146 Tropomyosin 4 isoform 1 41 33 8 0,108 3,91 4,66 -0,8 1147 Tropomyosin 2 41 33 8 0,108 4,02 4,68 -0,7 1189 HEAT-like repeat containing 1 39 34 5 0,068 4,05 4,77 -0,7 1204 similar to oxidative-stress responsive 1 39 98 -59 -0,431 6,66 7,24 -0,6 1294 3-hydroxyisobutyrate dehydrogenase 28 35 -7 -0,111 7,95 8,09 -0,1 1393 Short-chain dehydrogenase/reductase 27 20 7 0,149 8,3 7,78 0,5 1409 LRP16 protein 26 28 -2 -0,037 5,7 6,6 -0,9 1411 Glutathione S-transferase 26 25 1 0,020 6,04 7,63 -1,6 1422 Peroxiredoxin 6 26 25 1 0,020 6,54 6 0,5 1424 Peroxiredoxin 6 25 25 0 0,000 3,89 6,1 -2,2 1439 Apolipoprotein A-IV1 24 29 -5 -0,094 4,01 4,95 -0,9 1439b Proteasome subunit beta type 5 23 40 -17 -0,270 4,13 8,76 -4,6 1440 Ubiquitin C-terminal hydrolase 25 24 1 0,020 5,02 5,2 -0,2 1507 Ferritin subunits (H, M, L) 19 21 -2 -0,050 5,22 5,51 -0,3
1512 Putative transient receptor protein 2 or Myosin
light chain 19 20 -1 -0,026 4,23 4,67 -0,4

Annex III
Annex III.4.- Variation between experimental pI value of the identified proteins measured
with the Decyder software and the theoretical pI calculated with Expasy tools. The
experimental pI of every identified spot was plotted against the theoretical pI (down).
Hormone Spot ID: Differences between experimental and theoretical pI
1439
b11
3914
24 240
250
253
261
263
265
267
277
424
284
431
1411 438
1439
1017
1146
1189
1106
1147
1119
1409
1123
1031
1512
851b
851a 298
1204
1030 531
581
1507 540
1440 541
1294
1134 801
1032
1393
1422
1102 932-0.30
-0.25
-0.20
-0.15
-0.10
-0.05
-0.00
0.05
0.10
pI
247

Annex III
Annex III.5- Variation between experimental Mr value of the identified proteins
measured with the Decyder software and the theoretical Mr calculated with Expasy
tools. The experimental Mr of every identified spot was plotted against the theoretical Mr
(down).
Hormone Spot ID: Differences between experimental and theoretical Mr
1204
1123
1439
b28
426
526
727
726
326
125
324
025
011
3911
0612
9414
3915
0714
09 298
1512
851b
1424
851a
1411
1422
1440 932
1030
1031
1032 801
581
1134
1189 540
541
1017
1102
1146
1147
1119
1393 531
438
431
424-0.45
-0.40-0.35-0.30-0.25-0.20-0.15-0.10-0.050.000.050.100.150.200.250.30
Mr
248

Annex III.6.- Detailed results for the transcriptomic analysis performed using the testis tissue from F1 S.senegalensis (Control, GnRHa
treated, GnRHA +OA treated). Two different comparisons were performed in triplicate in an array composed of 5087 transcripts: F1
GnRHa vs. F1 Control and F1 GnRHa vs. F1 GnRHa+OA.
249
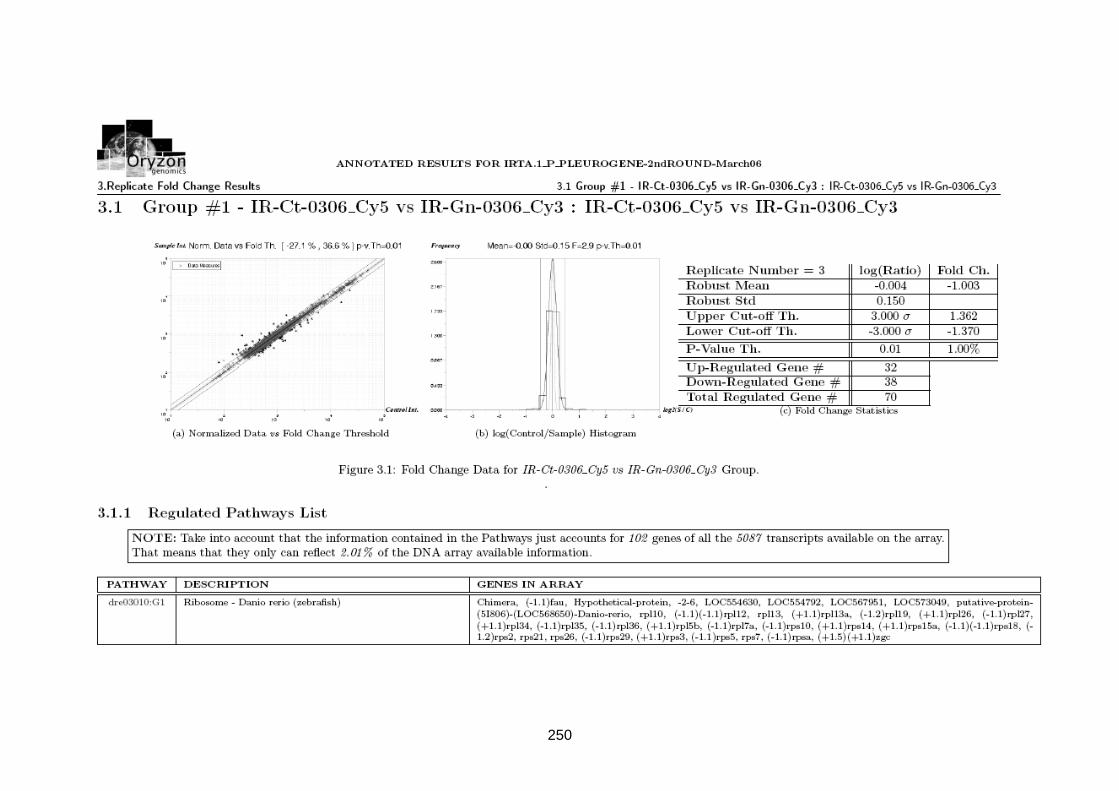
250

251

252

253

254

255

256

257
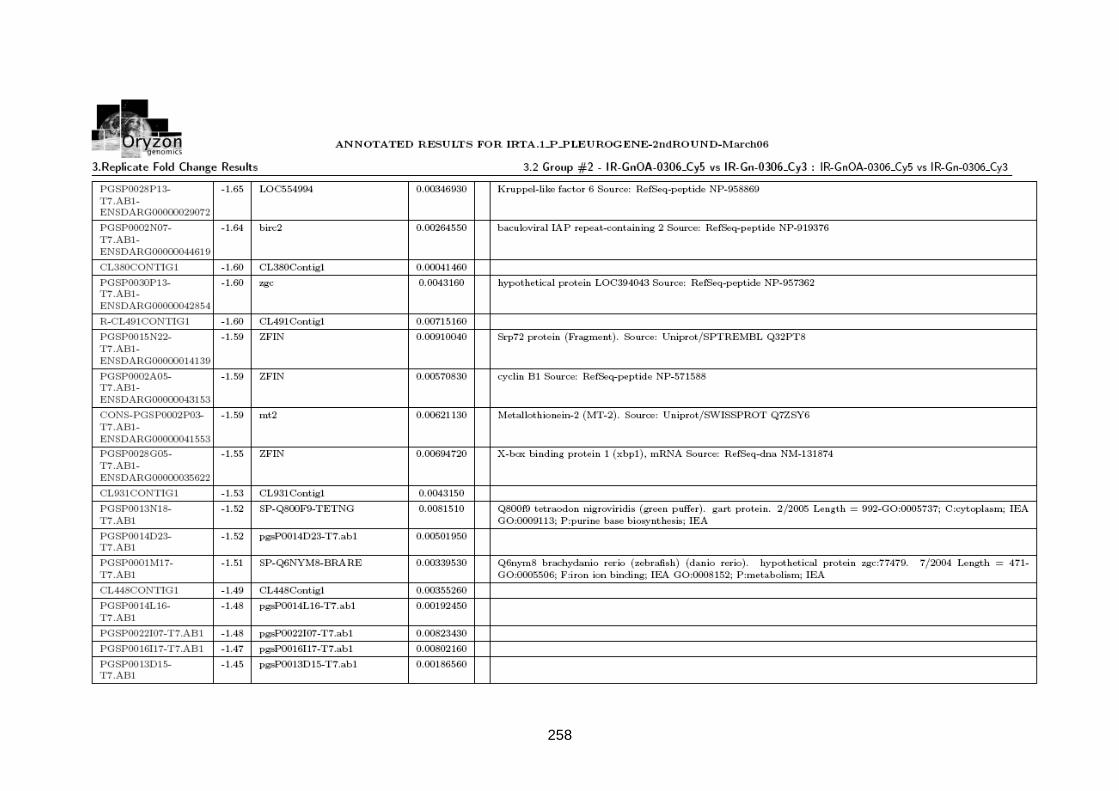
258
7