
Protein Feature Identification David Wishart Depts. Computing & Biological Science University of...
102
Protein Feature Identification David Wishart Depts. Computing & Biological Science University of Alberta [email protected]
-
date post
19-Dec-2015 -
Category
Documents
-
view
225 -
download
2
Transcript of Protein Feature Identification David Wishart Depts. Computing & Biological Science University of...

Protein Feature Identification
David WishartDepts. Computing & Biological Science
University of [email protected]

Proteins
• Exhibit far more sequence and chemical complexity than DNA or RNA
• Properties and structure are defined by the sequence and side chains of their constituent amino acids
• The “engines” of life• >95% of all drugs target proteins• Favorite topic of post-genomic era
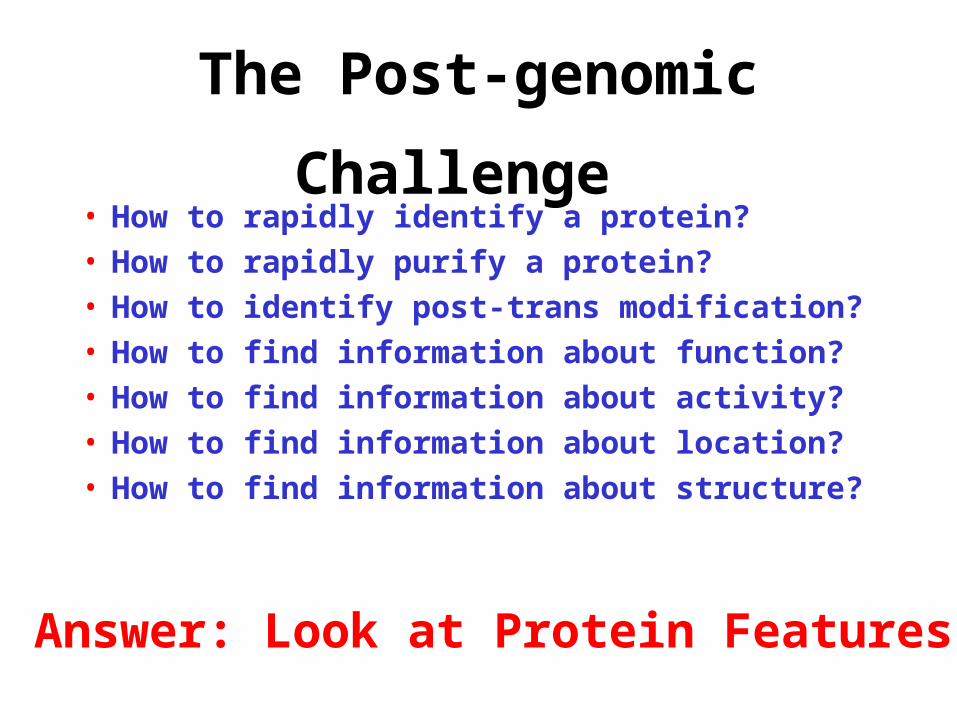
The Post-genomic Challenge • How to rapidly identify a protein?• How to rapidly purify a protein?• How to identify post-trans modification?• How to find information about function?• How to find information about activity?• How to find information about location?• How to find information about structure?
Answer: Look at Protein Features
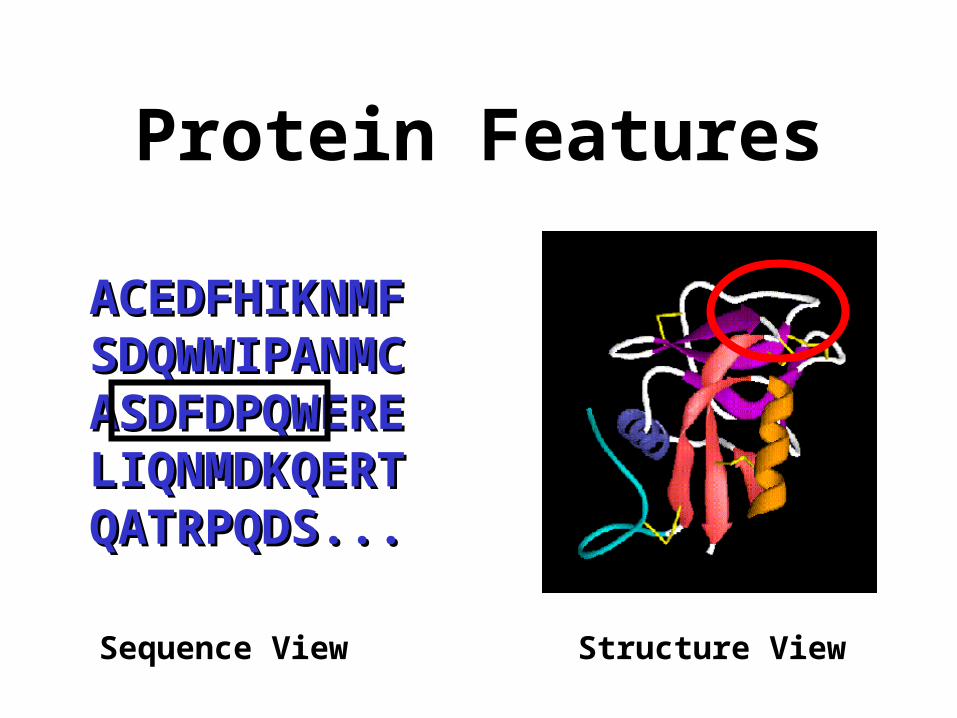
Protein Features
ACEDFHIKNMFACEDFHIKNMFSDQWWIPANMCSDQWWIPANMCASDFDPQWEREASDFDPQWERELIQNMDKQERTLIQNMDKQERTQATRPQDS...QATRPQDS...
Sequence View Structure View

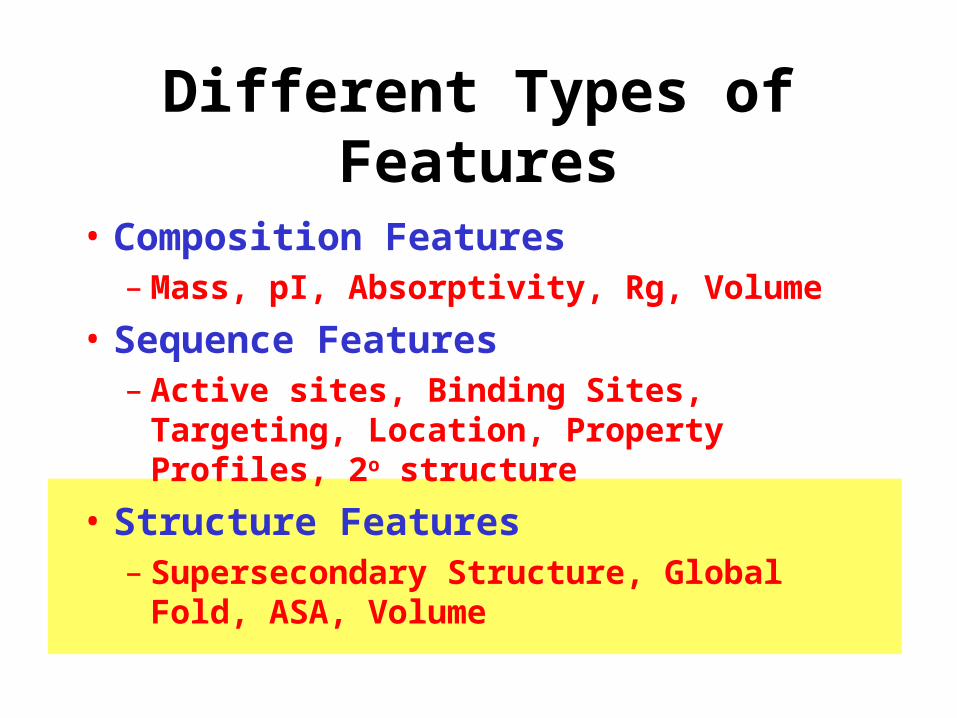
Different Types of Features
• Composition Features– Mass, pI, Absorptivity, Rg, Volume
• Sequence Features– Active sites, Binding Sites, Targeting,
Location, Property Profiles, 2o structure
• Structure Features– Supersecondary Structure, Global Fold,
ASA, Volume
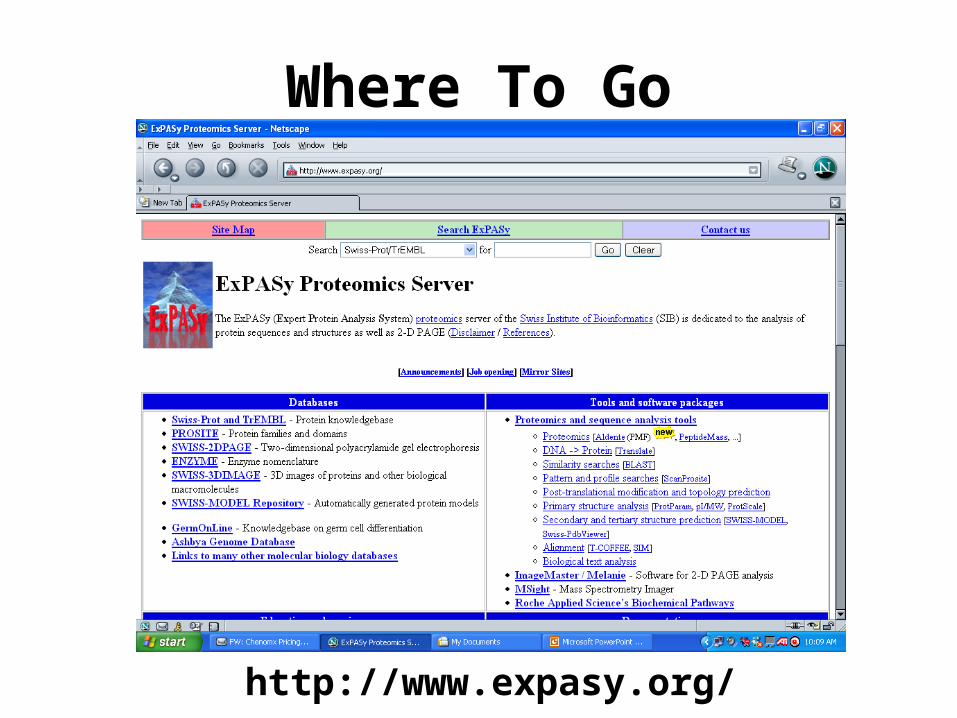
Where To Go
http://www.expasy.org/

Amino Acids (Review)
H3N+
O
O
RH

Glycine and Proline
CCOOHH2N
H
CCOOHHN
H
H
G P
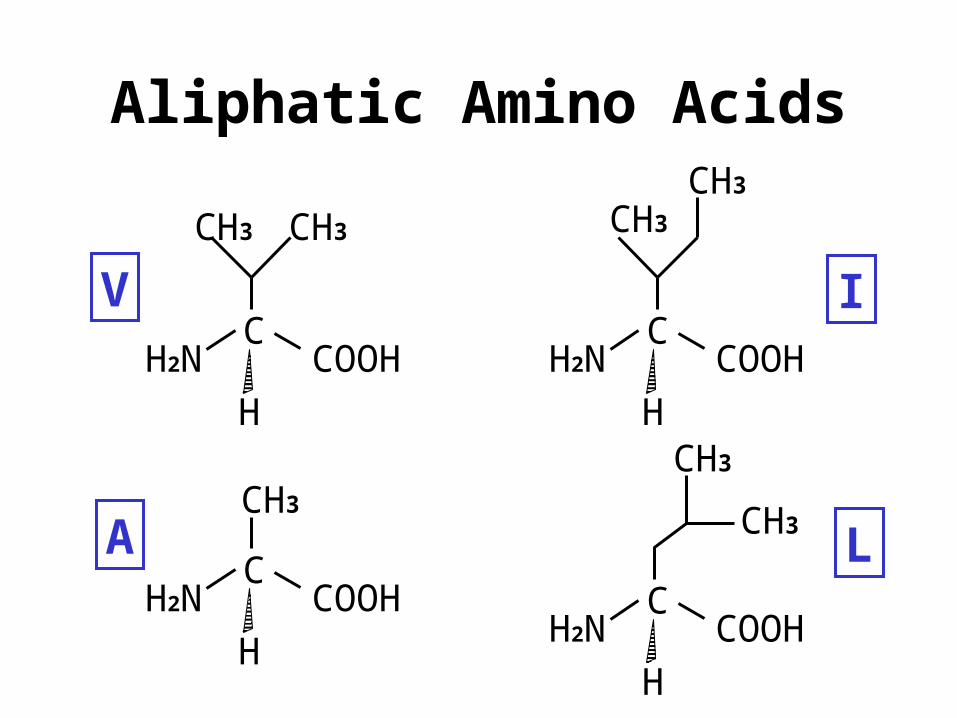
Aliphatic Amino Acids
CCOOHH2N
H
CCOOHH2N
H
CH3
CH3CH3
CCOOHH2N
H
CH3
CH3
CCOOHH2N
H
CH3
CH3
V
A L
I

Aromatic Amino Acids
CCOOHH2N
H
CCOOHH2N
H
CCOOHH2N
H
CCOOHH2N
HOH
N N N
Y
W
F
H

Charged Amino Acids
CCOOHH2N
H
COO
CCOOHH2N
H
COO
CCOOHH2N
H
CCOOHH2N
H
N NH3
NH
H+-
-NH3
+
E
D R
K

Polar Amino Acids
CCOOHH2N
H
CONH2
CCOOHH2N
H
CONH2
CCOOHH2N
H
OHCH3
CCOOHH2N
H
OH
N
Q
T
S

Sulfo-Amino Acids
CCOOHH2N
H
CCOOHH2N
H
SSH
CH3
C M
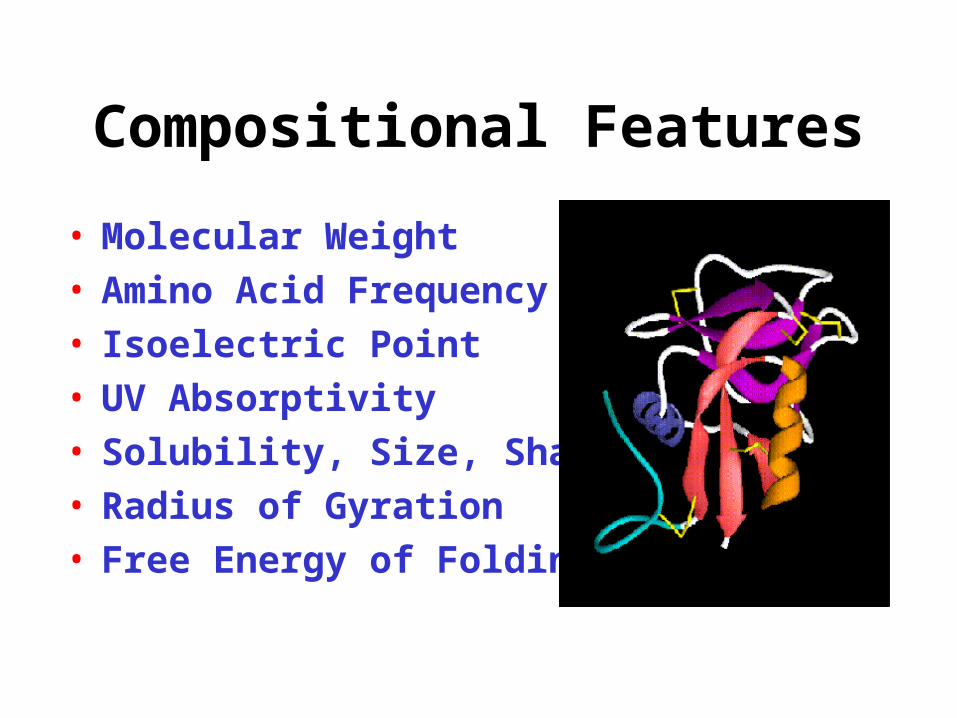
Compositional Features
• Molecular Weight• Amino Acid Frequency• Isoelectric Point• UV Absorptivity• Solubility, Size, Shape• Radius of Gyration• Free Energy of Folding
Molecular Weight

Molecular Weight
• Useful for SDS PAGE and 2D gel analysis• Useful for deciding on SEC matrix• Useful for deciding on MWC for dialysis• Essential in synthetic peptide analysis• Essential in peptide sequencing (classical
or mass-spectrometry based)• Essential in proteomics and high
throughput protein characterization
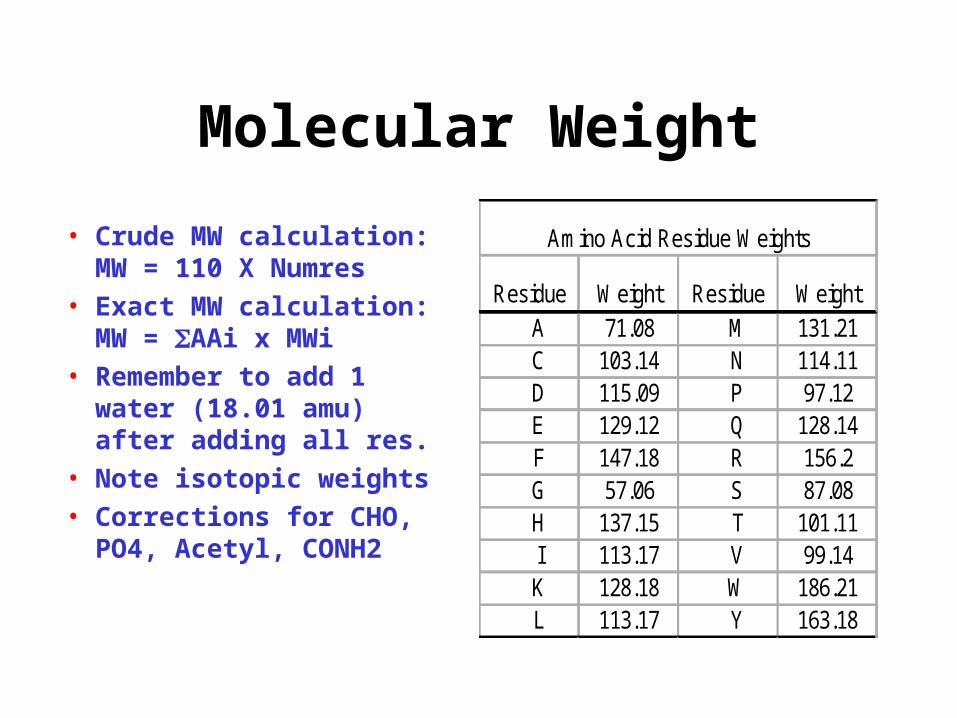
Molecular Weight
• Crude MW calculation: MW = 110 X Numres
• Exact MW calculation: MW = AAi x MWi
• Remember to add 1 water (18.01 amu) after adding all res.
• Note isotopic weights• Corrections for CHO,
PO4, Acetyl, CONH2
Residue Weight Residue Weight A 71.08 M 131.21 C 103.14 N 114.11 D 115.09 P 97.12 E 129.12 Q 128.14 F 147.18 R 156.2 G 57.06 S 87.08 H 137.15 T 101.11 I 113.17 V 99.14 K 128.18 W 186.21 L 113.17 Y 163.18
Amino Acid Residue Weights
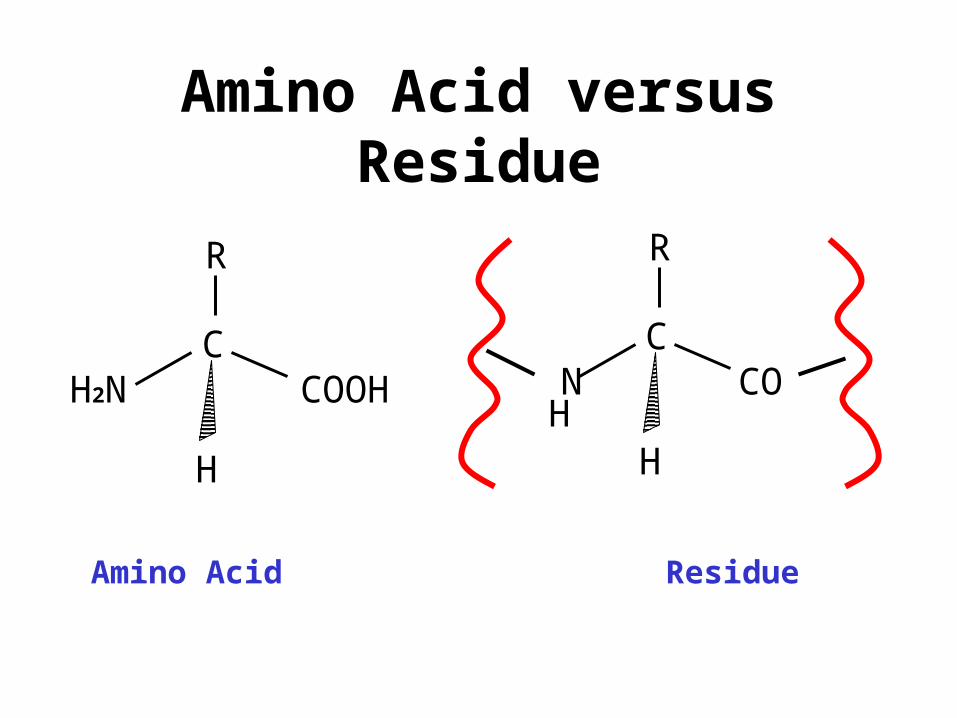
Amino Acid versus Residue
CCOOHH2N
H
R
CCO N
H
R
H
Amino Acid Residue

Protein Identification via MW
• MOWSE• http://srs.hgmp.mrc.ac.uk/cgi-bin/mowse
• CombSearch• http://ca.expasy.org/tools/CombSearch/
• Mascot• http://www.matrixscience.com/
search_form_select.html• AACompSim/AACompIdent
• http://ca.expasy.org/tools/

Molecular Weight & Proteomics
2-D Gel QTOF Mass Spectrometry
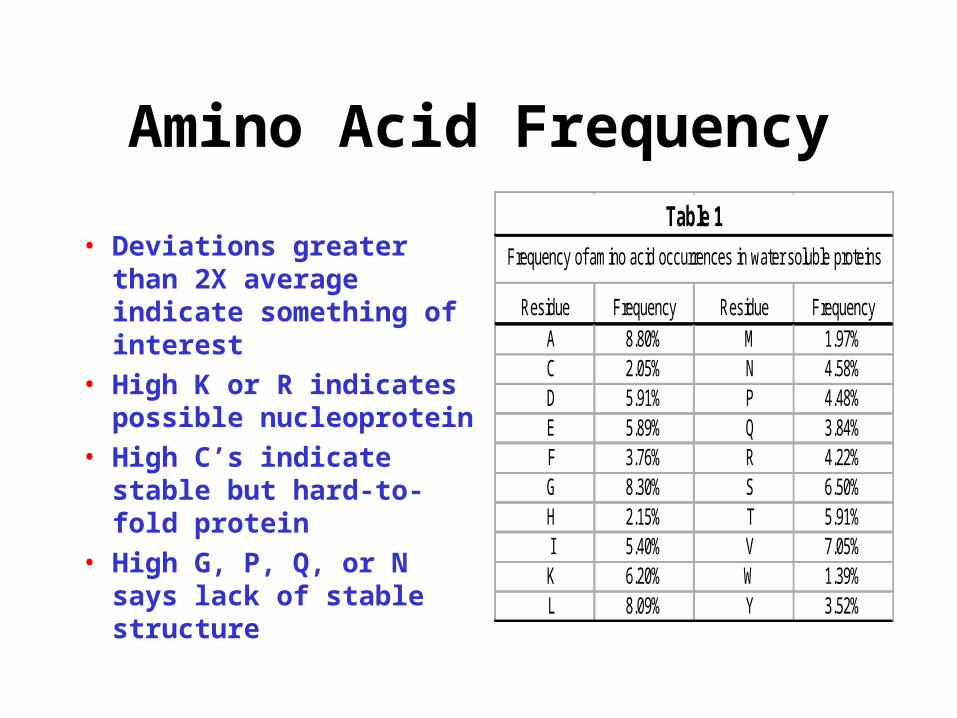
Amino Acid Frequency
• Deviations greater than 2X average indicate something of interest
• High K or R indicates possible nucleoprotein
• High C’s indicate stable but hard-to-fold protein
• High G, P, Q, or N says lack of stable structure
Residue Frequency Residue Frequency A 8.80% M 1.97% C 2.05% N 4.58% D 5.91% P 4.48% E 5.89% Q 3.84% F 3.76% R 4.22% G 8.30% S 6.50% H 2.15% T 5.91% I 5.40% V 7.05% K 6.20% W 1.39% L 8.09% Y 3.52%
Frequency of amino acid occurrences in water soluble proteins
Table 1
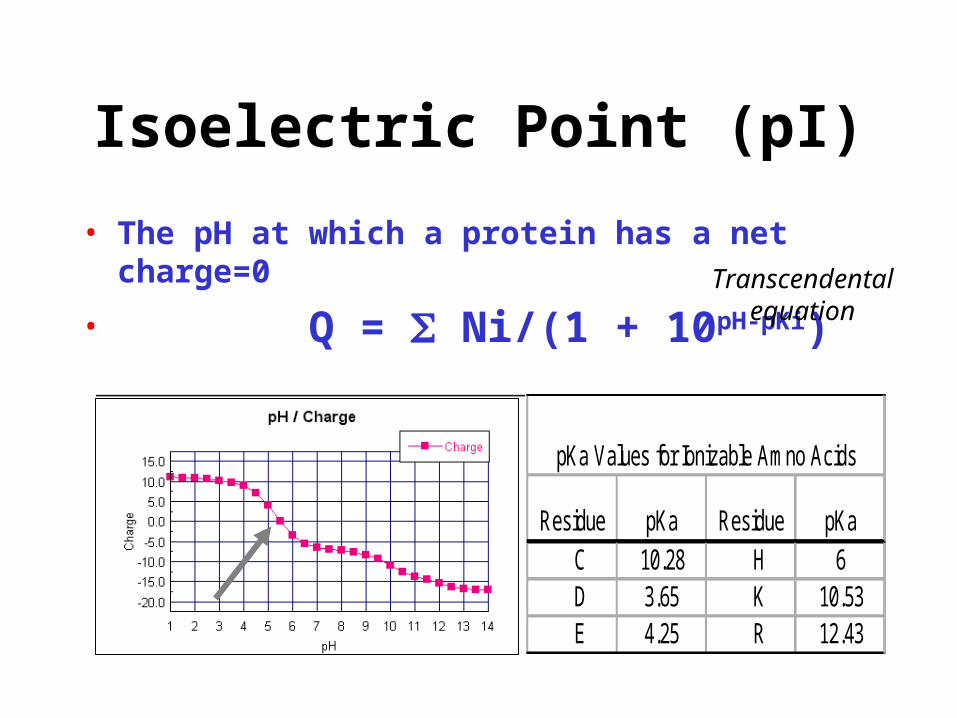
Isoelectric Point (pI)
• The pH at which a protein has a net charge=0
• Q = Ni/(1 + 10pH-pKi)
Residue pKa Residue pKa C 10.28 H 6 D 3.65 K 10.53 E 4.25 R 12.43
pKa Values for Ionizable Amno Acids
Transcendentalequation

Isoelectric Point
• Calculation is only approximate (+/- 1 pH)• Does not include 3o structure interactions• Can be used in developing purification
protocols via ion exchange chromatography• Can be used in estimating spot location for
isoelectric focusing gels• Can be used to decide on best pH to store or
analyze protein

UV Spectroscopy

UV Absorptivity
• UV (Ultraviolet light) has a wavelength of 200 to 400 nm
• Most proteins and peptides (and all nucleic acids) absorb UV light quite strongly
• UV spectroscopy is the most common form of spectroscopy performed today
• UV spectra can be used to identify or classify some proteins or protein classes

UV Absorptivity
• OD280 = (5690 x #W + 1280 x #Y)/MW x Conc.• Conc. = OD280 x MW/(5690 X #W + 1280 x #Y)
CCOOHH2N
H
CCOOHH2N
H
OH
N
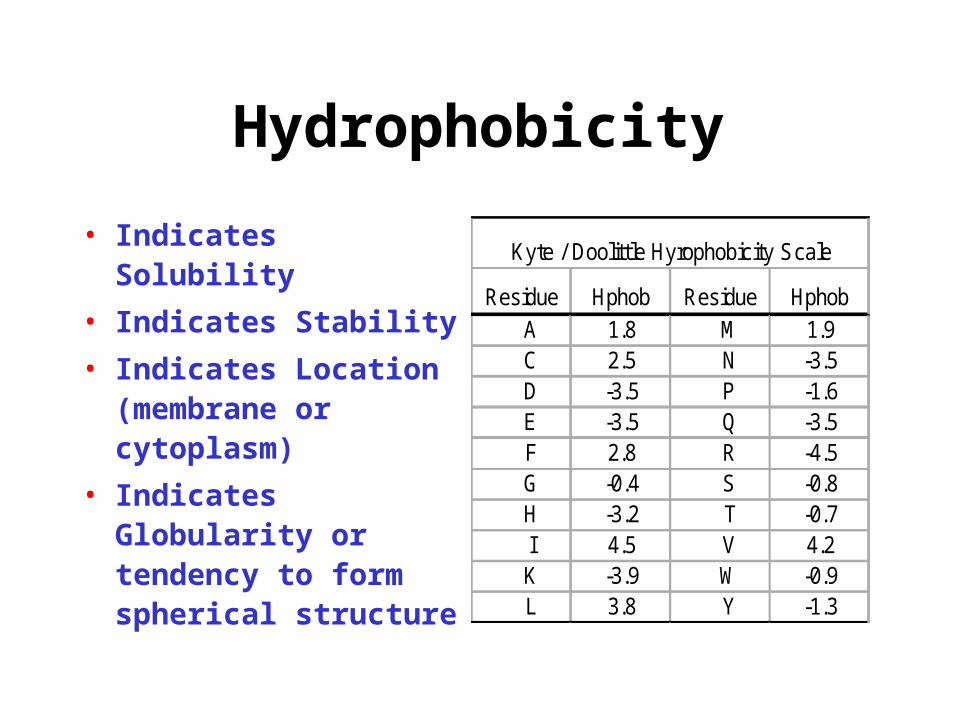
Hydrophobicity
• Indicates Solubility
• Indicates Stability
• Indicates Location (membrane or cytoplasm)
• Indicates Globularity or tendency to form spherical structure
Residue Hphob Residue Hphob A 1.8 M 1.9 C 2.5 N -3.5 D -3.5 P -1.6 E -3.5 Q -3.5 F 2.8 R -4.5 G -0.4 S -0.8 H -3.2 T -0.7 I 4.5 V 4.2 K -3.9 W -0.9 L 3.8 Y -1.3
Kyte / Doolittle Hyrophobicity Scale

Hydrophobicity
• Average Hydrophobicity AH = AAi x Hi
• Hydrophobic Ratio RH = H(-)/ H(+)
• Hydrophobic % Ratio RHP = %philic/%phobic
• Linear Charge Density LIND = (K+R+D+E+H+2)/#
• Solubility SOL = RH + LIND - 0.05AH
• Average AH = 2.5 + 2.5 Insol > 0.1 Unstrc < -6
• Average RH = 1.2 + 0.4 Insol < 0.8 Unstrc > 1.9
• Average RHP = 0.9 + 0.2 Insol < 0.7 Unstrc > 1.4
• Average LIND = 0.25 Insol < 0.2 Unstrc > 0.4
• Average SOL = 1.6 + 0.5 Insol < 1.1 Unstrc > 2.5

Protein Dimensions
• Radius and Radius of Gyration
• Molecular and Partial Specific Volume
• Accessible Surface Area• Provides a size estimate of a protein• Used in analytical techniques such as
neutron or X-ray scattering, analytical ultracentrifugation, light scattering
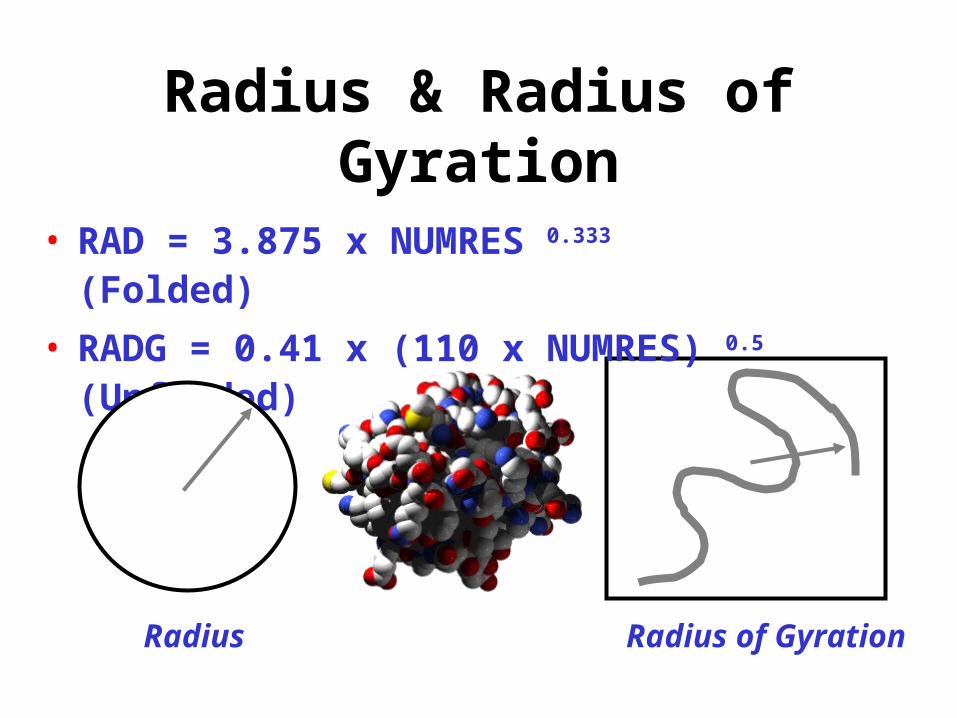
Radius & Radius of Gyration
• RAD = 3.875 x NUMRES 0.333 (Folded)
• RADG = 0.41 x (110 x NUMRES) 0.5 (Unfolded)
Radius Radius of Gyration

Partial Specific Volume
• Measured in mL/g• Inverse measure of
protein density (0.70-75)• Depends on protein’s
composition and compactness
• Measured via sedimentation analysis
• PSV = PSi x Wi
Residue PS (ml/g) Residue PS (ml/g) A 0.748 M 0.745 C 0.631 N 0.619 D 0.579 P 0.774 E 0.643 Q 0.674 F 0.774 R 0.666 G 0.632 S 0.613 H 0.67 T 0.689 I 0.884 V 0.847 K 0.789 W 0.734 L 0.884 Y 0.712
Table 6
Residue Partial Specific Volumes

Packing Volume
Loose Packing Dense Packing Protein
Proteins are Densely Packed

Packing Volume (VP)
• Determined via X-ray or NMR structure
• “True” measure of volume occupied by protein
• Approximate Value VP = 1.245 x MW
• Exact Value VP = AAi x Vi
Residue V (Å3) Residue V (Å3)
A 88.6 M 162.9 C 108.5 N 117.7 D 111.1 P 122.7 E 138.4 Q 143.9 F 189.9 R 173.4 G 60.1 S 89 H 153.2 T 116.1 I 166.7 V 140 K 168.6 W 227.8 L 166.7 Y 193.6
Amino Acid Packing Volumes
Table 7

Different Types of Features
• Composition Features– Mass, pI, Absorptivity, Rg, Volume
• Sequence Features– Active sites, Binding Sites, Targeting,
Location, Property Profiles, 2o structure
• Structure Features– Supersecondary Structure, Global Fold,
ASA, Volume
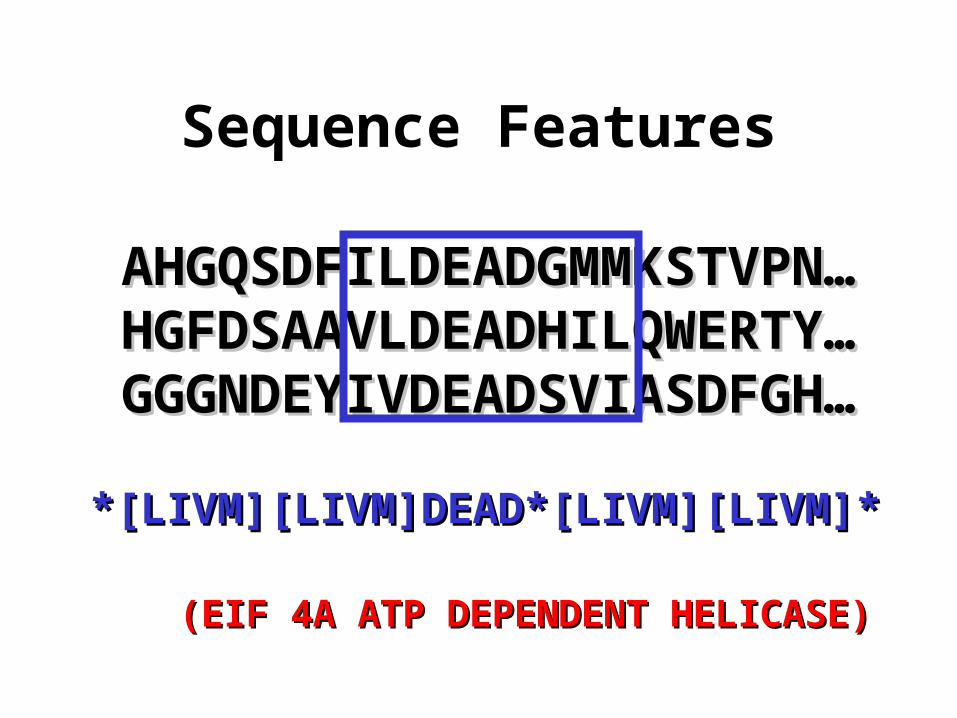
Sequence Features
AHGQSDFILDEADGMMKSTVPN…AHGQSDFILDEADGMMKSTVPN… HGFDSAAVLDEADHILQWERTY…HGFDSAAVLDEADHILQWERTY… GGGNDEYIVDEADSVIASDFGH…GGGNDEYIVDEADSVIASDFGH…
*[LIVM][LIVM]DEAD*[LIVM][LIVM]**[LIVM][LIVM]DEAD*[LIVM][LIVM]*
(EIF 4A ATP DEPENDENT HELICASE)(EIF 4A ATP DEPENDENT HELICASE)

Probability & Seq. Features
• Expectation value () is the expected number of hits for a given sequence pattern or motif
= N x f1 x f2 x f3 x .... fk
• N is the number of residues in DB (108)
• fi is the frequency of a given amino acid(s)
Residue Frequency Residue Frequency A 8.80% M 1.97% C 2.05% N 4.58% D 5.91% P 4.48% E 5.89% Q 3.84% F 3.76% R 4.22% G 8.30% S 6.50% H 2.15% T 5.91% I 5.40% V 7.05% K 6.20% W 1.39% L 8.09% Y 3.52%
Frequency of amino acid occurrences in water soluble proteins
Table 1
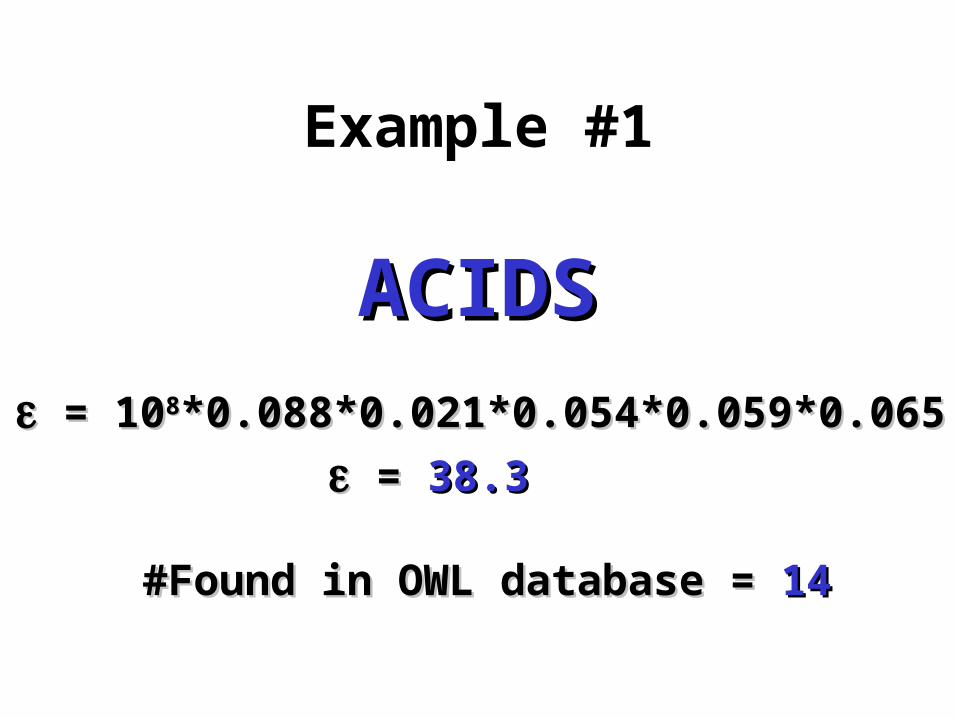
Example #1
ACIDSACIDS
= 10= 1088*0.088*0.021*0.054*0.059*0.065*0.088*0.021*0.054*0.059*0.065
= = 38.338.3
#Found in OWL database = #Found in OWL database = 1414
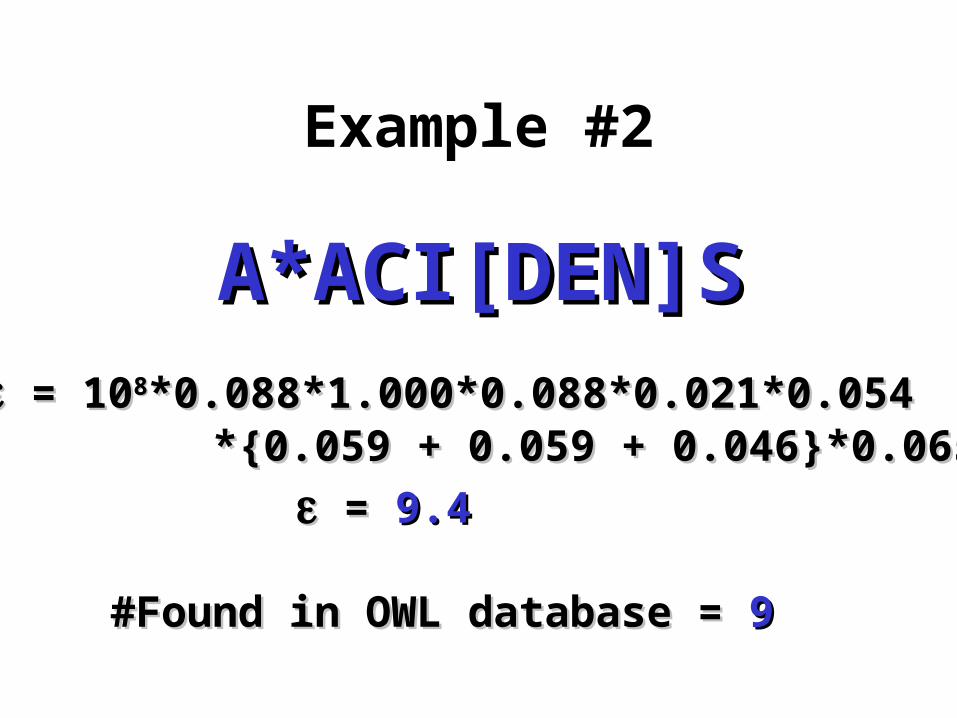
A*ACI[DEN]SA*ACI[DEN]S = 10= 1088*0.088*1.000*0.088*0.021*0.054*0.088*1.000*0.088*0.021*0.054 *{0.059 + 0.059 + 0.046}*0.065*{0.059 + 0.059 + 0.046}*0.065
= = 9.49.4
#Found in OWL database = #Found in OWL database = 99
Example #2
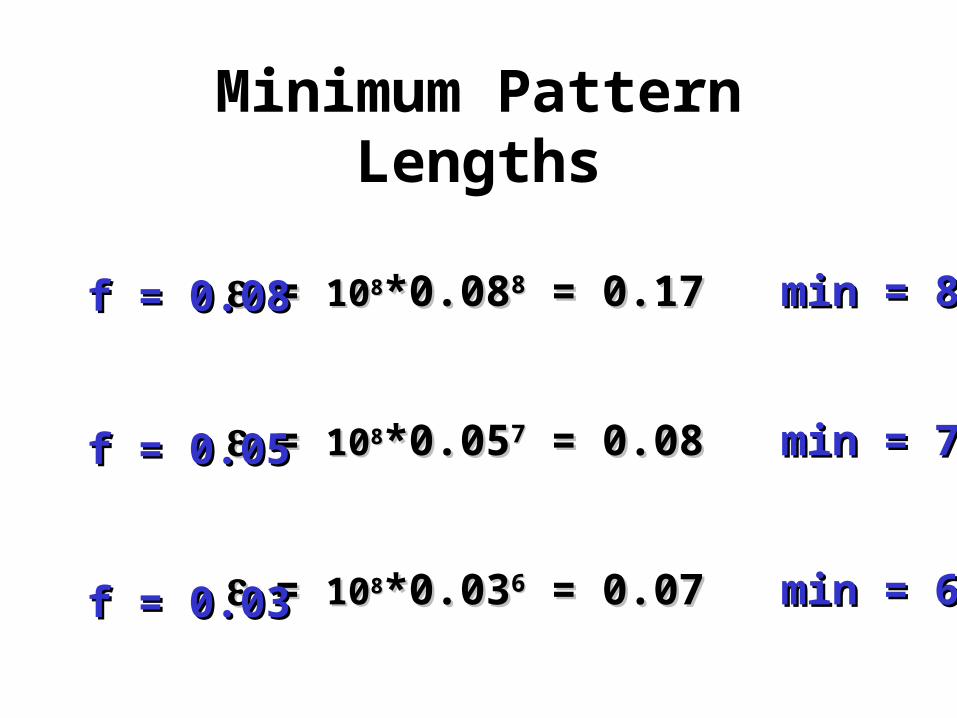
Minimum Pattern Lengths
= = 101088*0.08*0.0888 = 0.17 = 0.17 min = 8min = 8
= = 101088*0.05*0.0577 = 0.08 = 0.08 min = 7min = 7
= = 101088*0.03*0.0366 = 0.07 = 0.07 min = 6min = 6
f = 0.08f = 0.08
f = 0.05f = 0.05
f = 0.03f = 0.03

How Long Should a Sequence Motif or Sequence Block Be?
• How many matching segments of length “l” could be found in comparing a query of length M to a DB of N ?
• Answer: n(l) = M x N x fl
• Assume f = 0.05, M = 300, N = 100,000,000
n l 3,750,000 3187,500 4
9375 5469 623 71.2 8
0.058 9
Table 2
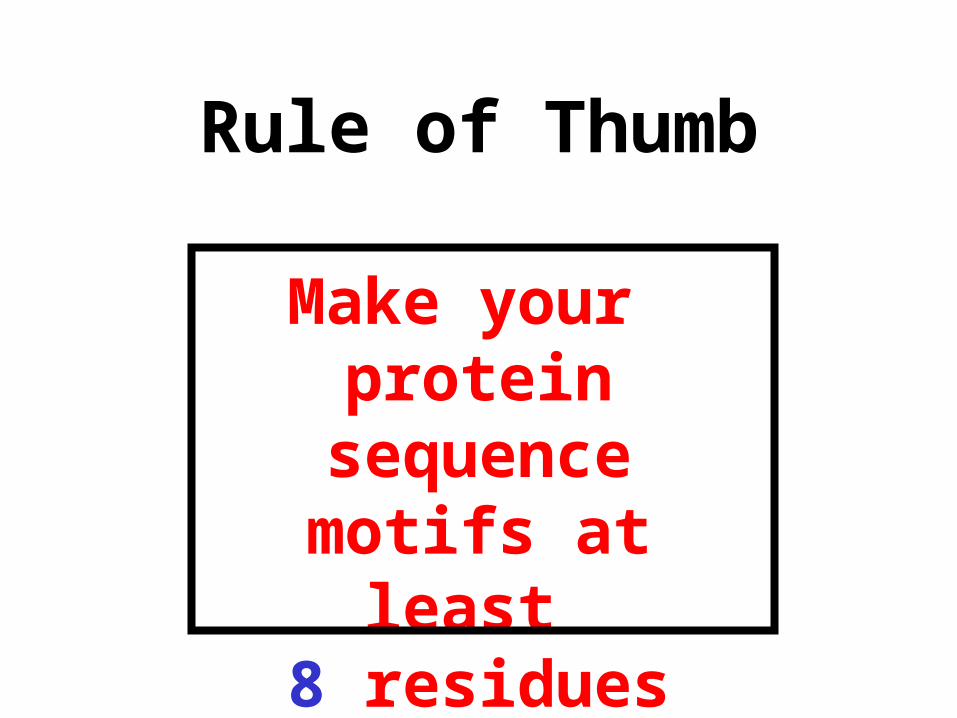
Rule of Thumb
Make your protein sequence
motifs at least 8 residues long
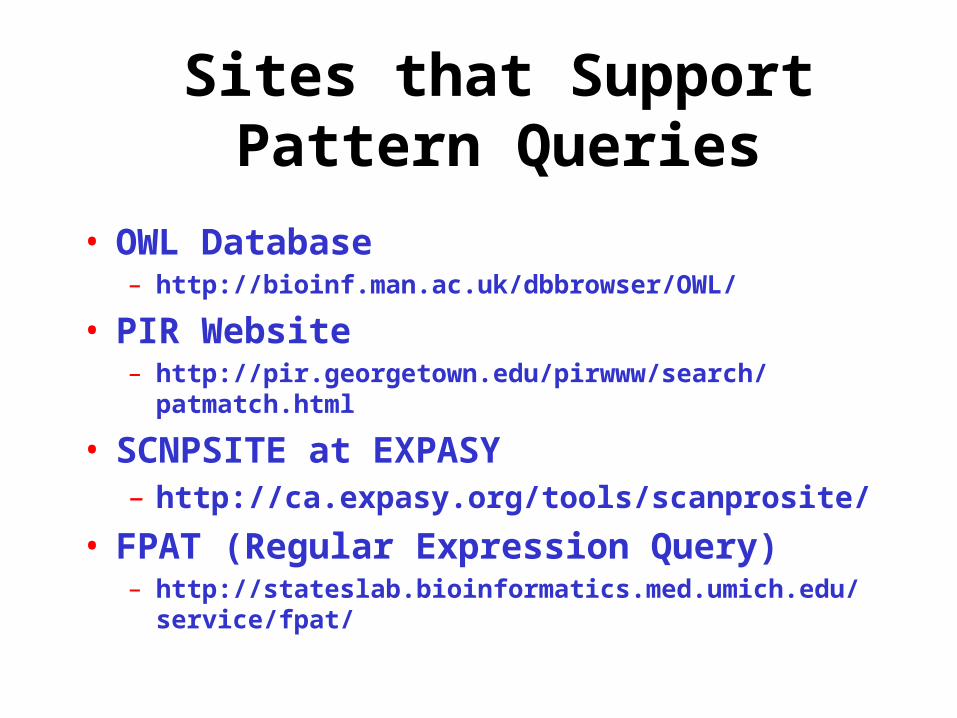
Sites that Support Pattern Queries
• OWL Database– http://bioinf.man.ac.uk/dbbrowser/OWL/
• PIR Website– http://pir.georgetown.edu/pirwww/search/patmatch.html
• SCNPSITE at EXPASY– http://ca.expasy.org/tools/scanprosite/
• FPAT (Regular Expression Query)– http://stateslab.bioinformatics.med.umich.edu/service/fpat/

Regular Expressions
• C[ACG]T - Matches CAT, CCT and CGT only
• C . T - Matches CAT, CaT, C1T, CXT, not CT
• CA?T - Matches CT or CAT only
• C+T - Matches CT, CCT, CCCT, CCCCT…
• C(HE)?A[TP] - Matches CHEAT, CAT, CHEAP, CAP
• S[A-I,L-Q,T-Z]?LK[A-I,L-Q,T-Z]?A - Matches S*LK*A
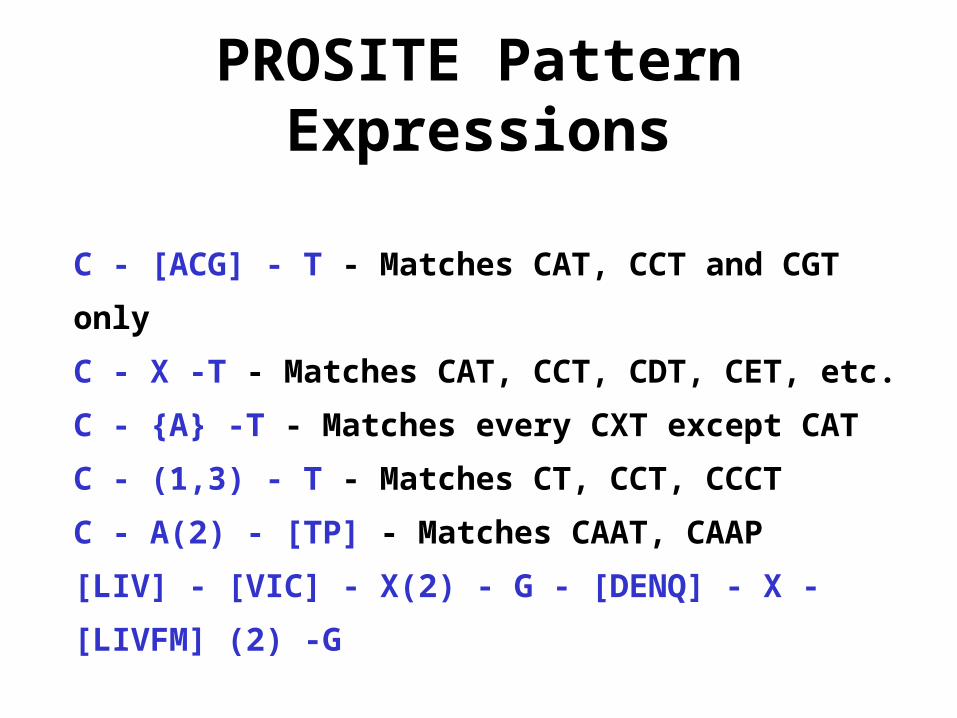
PROSITE Pattern Expressions
C - [ACG] - T - Matches CAT, CCT and CGT only
C - X -T - Matches CAT, CCT, CDT, CET, etc.
C - {A} -T - Matches every CXT except CAT
C - (1,3) - T - Matches CT, CCT, CCCT
C - A(2) - [TP] - Matches CAAT, CAAP
[LIV] - [VIC] - X(2) - G - [DENQ] - X - [LIVFM] (2) -G
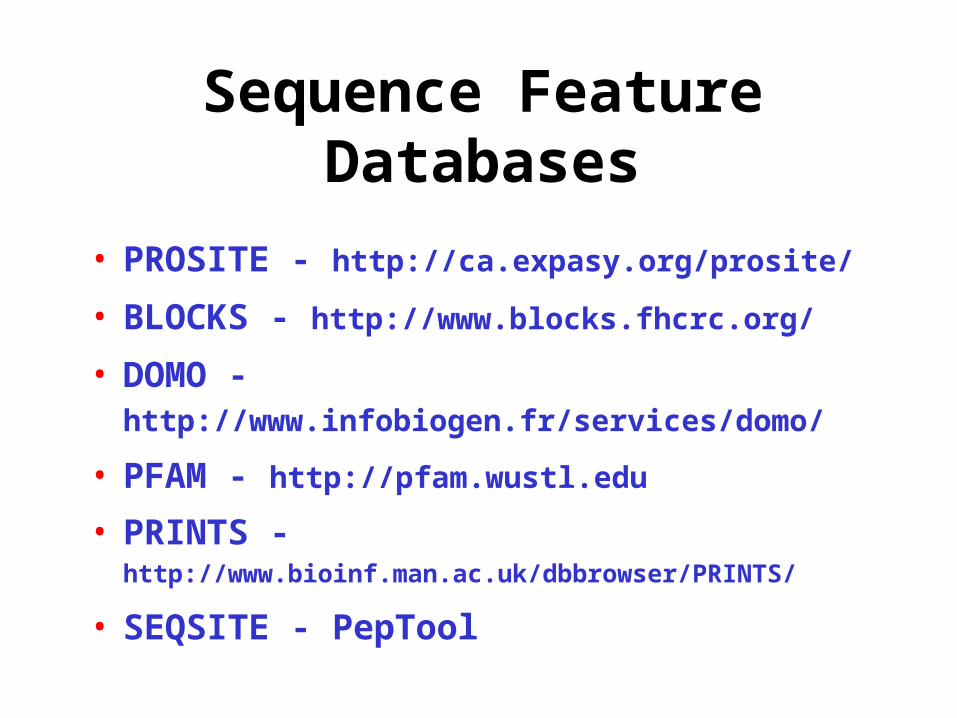
Sequence Feature Databases
• PROSITE - http://ca.expasy.org/prosite/
• BLOCKS - http://www.blocks.fhcrc.org/
• DOMO - http://www.infobiogen.fr/services/domo/
• PFAM - http://pfam.wustl.edu
• PRINTS - http://www.bioinf.man.ac.uk/dbbrowser/PRINTS/
• SEQSITE - PepTool
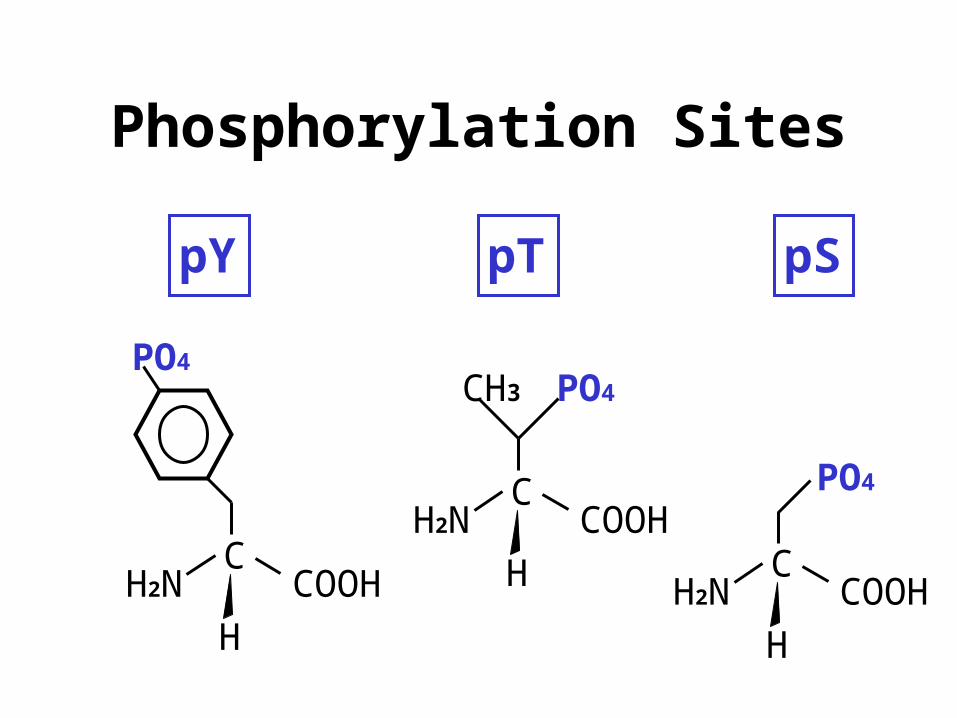
Phosphorylation Sites
CCOOHH2N
H
PO4
CCOOHH2N
H
PO4CH3
CCOOHH2N
H
PO4
pY pT pS

Phosphorylation Sites
Phopshorylation Sites>*KRKQI[ST]VR* CHAN K.F. et al., J. BIOL. CHEM. 257:3655-3659 (1982) PHOSPHORYLASE KINASE PHOSPHORYLATION SITE
>*KKR**R**[ST]* KEMP B.E. et al., PNAS 72:3448-3452 (1975) MYOSIN LIGHT CHAIN KINASE PHOSPHORYLATION SITE
>*NYLRRL[ST]DSNF* CZERNIK A.J. et al. PNAS 84:7518-7522 (1987)
CALMODULIN DEPENDENT PROTEIN KINASE I PHOSPHORYLATION SITE

Glycosylation

Glycosylation Sites
Glycosylation Sites>*N!P[ST]!P* MARSHALL, R.D.W. ANN. REV. BIOCHEM. 41:673-702 (1972) GLYCOSYLATION SITE (S AND/OR T ARE GLYCOSYLATED)
>*G*K*R* MARSHALL, R.D.W. ANN. REV. BIOCHEM. 41:673-702 (1972) GLYCOSYLATION SITE (K IS GLYCOSYLATED)
>*G*K**R* MARSHALL, R.D.W. ANN. REV. BIOCHEM. 41:673-702 (1972) GLYCOSYLATION SITE (K IS GLYCOSYLATED)

Signaling

Signaling Sites
Signaling Sites>*[KRH][DEN]EL$ SMITH M.J. et al., EMBO J. 8:3581-3586 (1989) ENDOPLASMIC RETICULUM DIRECTING SEQUENCE
>*P***KKRKAV* KALDERON, D. et al., CELL 39:400-509 (1984) NUCLEAR TRANSPORT SIGNAL OF SV40 LARGE T ANTIGEN
>${3,20}[LIVFTA][LIVFTA][LIVFTA]{3,6}[LIV]*[GA]C* VON HEIJNE, G. PROT. ENG. 2:531-534 (1989)
SIGNAL PEPTIDASE II CLEAVAGE SITE

Protease Cut Sites

Protease Cut Sites
Protease Cut Sites>*[KR]* *[KR]/* TRYPSIN CLEAVAGE SITE (CUTS AFTER [KR])
>*[FLY]![VAG] */[FLY]![VAG] PEPSIN CLEAVAGE SITE (CUTS BEFORE [FY])
>*[FWY]* *[FWY]/* CHYMOTRYPSIN CLEAVAGE SITE (CUTS AFTER [FWY])

Binding SitesBinding Sites>*RGD* RUOSLAHTII E. et al., CELL 44:517-518 (1986) FIBRONECTIN ADHESION SITE
>*CDPGYIGSR* GRAF, J. et al., CELL 48:989-996 (1987) MAMMAL LAMNIN DOMAIN III B1 CHAIN CELL ATTACHMENT SITE
>*[VIL]**[TS][DN]Y**[FY][AL]* GODOVAC-ZIMMERMANN, J., TIBS 13:64-66 (1988)
BINDING SITE FOR HYDROPHOBIC MOLECULE TRANSPORT PROTEINS

Family Signature Sequences
Protein Family Signature Sequences>*[FY]CRNPD* NAKAMURA T. et al., NATURE 342:441-445 (1989) KRINGLE DOMAIN SIGNATURE
>*[LIVM][LIVM]DEAD*[LIVM][LIVM]* CHANG T.H. et al., PNAS 87:1571-1575 (1990) EIF 4A FAMILY ATP DEPENDENT HELICASE SIGNATURE
>*C*C*****G**C* BLOMQUIST M.C. et al., PNAS 81:7363-7362 (1984)
EGF/TGF SIGNATURE SEQUENCE

Enzyme Active Sites
Enzyme Active Sites>*[MAFILV]DTG[STA][STAN]* DOOLITTLE, R.F., OF URFS AND ORFS, 1986 ACID OR ASPARTYL PROTEASE ACTIVE SITE
>*TCP&NLGT* DOOLITTLE, R.F., OF URFS AND ORFS, 1986 GUANIDINE KINASE ACTIVE SITE
>*F*[LIVFMY]*S**K****[AG]*[LIVM]L*JORIS, B. ET AL., BIOCHEM. J. 250:313-324 (1989)BETA LACTAMASE (TYPE A) ACTIVE SITE
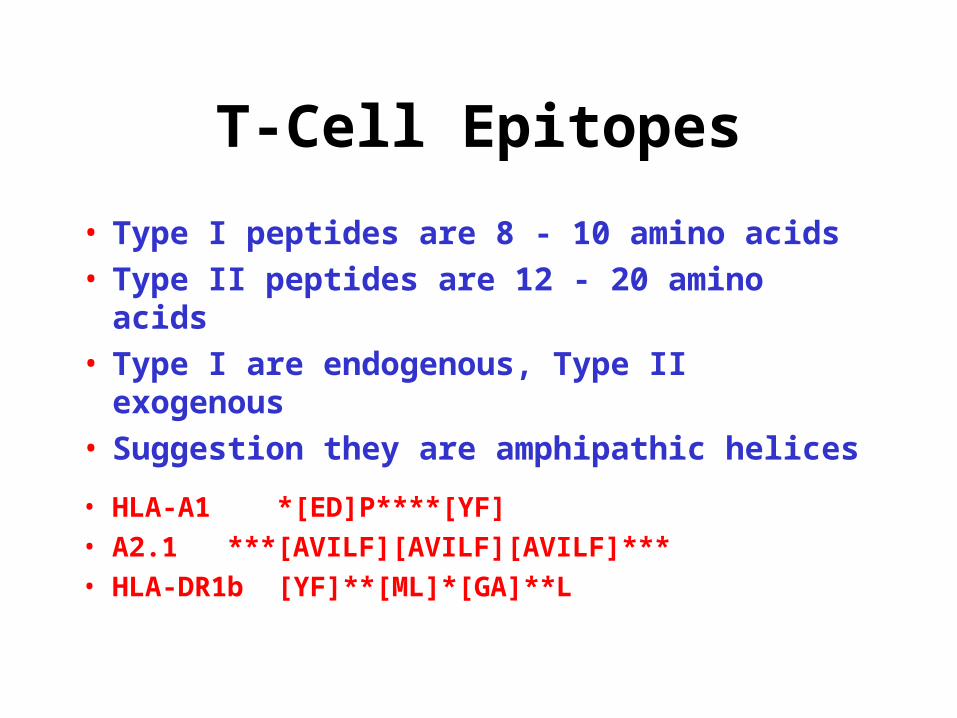
T-Cell Epitopes
• Type I peptides are 8 - 10 amino acids• Type II peptides are 12 - 20 amino acids• Type I are endogenous, Type II exogenous• Suggestion they are amphipathic helices
• HLA-A1 *[ED]P****[YF]• A2.1 ***[AVILF][AVILF][AVILF]***• HLA-DR1b [YF]**[ML]*[GA]**L

Better Methods for Sequence Feature ID
• Sequence Profiles/Scoring Matrices
• Neural Networks
• Hidden Markov Models
• Bayesian Belief Nets
• Reference Point Logistics

A Sample Sequence Profile
A C D E F G H I K L M N P Q R S T V W Y
1 W G V L V 3 -2 3 4 0 4 -1 3 -1 4 4 1 1 1 -2 1 2 6 -6 -2
2 L L S P L 2 -2 -2 -1 3 0 -1 3 -1 6 5 -1 3 0 -1 3 1 4 1 -1
3 V V V V V 2 2 -2 -2 2 2 -3 11 -2 8 6 -2 1 -2 -2 0 2 15 -9 -1
4 K E A T A 6 -2 5 6 -5 4 1 0 5 -2 0 3 3 3 1 3 6 0 -6 -4
5 A P L P P 6 -1 0 1 -2 2 0 1 0 2 2 0 8 2 0 2 2 3 -5 -4
6 G G G G G 7 1 7 5 -6 15 -1 -3 0 -4 -3 4 3 6 1 6 2 -1 -6 -5
7 S S Q E D 4 -1 7 7 -6 7 2 -2 2 -3 -2 4 3 6 1 6 2 -1 -6 -5
8 S S T P S 4 4 2 2 -4 4 -1 0 2 -3 -2 2 7 0 1 10 6 0 -2 -4
<>i = log2(qi/pi)

Calculating a Profile Score
VLVAPGDS = 6+6+15+6+8+15+7+10=66LVLGPGLA = 4+4+8+4+8+15-3+4= 44
A C D E F G H I K L M N P Q R S T V W Y
1 W G V L V 3 -2 3 4 0 4 -1 3 -1 4 4 1 1 1 -2 1 2 6 -6 -2
2 L L S P L 2 -2 -2 -1 3 0 -1 3 -1 6 5 -1 3 0 -1 3 1 4 1 -1
3 V V V V V 2 2 -2 -2 2 2 -3 11 -2 8 6 -2 1 -2 -2 0 2 15 -9 -1
4 K E A T A 6 -2 5 6 -5 4 1 0 5 -2 0 3 3 3 1 3 6 0 -6 -4
5 A P L P P 6 -1 0 1 -2 2 0 1 0 2 2 0 8 2 0 2 2 3 -5 -4
6 G G G G G 7 1 7 5 -6 15 -1 -3 0 -4 -3 4 3 6 1 6 2 -1 -6 -5
7 S S Q E D 4 -1 7 7 -6 7 2 -2 2 -3 -2 4 3 6 1 6 2 -1 -6 -5
8 S S T P S 4 4 2 2 -4 4 -1 0 2 -3 -2 2 7 0 1 10 6 0 -2 -4

Hidden Markov Models

Neural Networks
Training Layer 1 Hidden Output Set Layer
nodes

What Can Be Predicted?
• O-Glycosylation Sites• Phosphorylation Sites• Protease Cut Sites• Nuclear Targeting Sites• Mitochondrial Targ Sites• Chloroplast Targ Sites• Signal Sequences• Signal Sequence Cleav.• Peroxisome Targ Sites
• ER Targeting Sites• Transmembrane Sites• Tyrosine Sulfation Sites• GPInositol Anchor Sites• PEST sites• Coil-Coil Sites• T-Cell/MHC Epitopes• Protein Lifetime• A whole lot more….

Cutting Edge Sequence Feature Servers
• Membrane Helix Prediction– http://www.cbs.dtu.dk/services/TMHMM-2.0/
• T-Cell Epitope Prediction– http://syfpeithi.bmi-heidelberg.com/scripts/
MHCServer.dll/home.htm
• O-Glycosylation Prediction– http://www.cbs.dtu.dk/services/NetOGlyc/
• Phosphorylation Prediction– http://www.cbs.dtu.dk/services/NetPhos/
• Protein Localization Prediction– http://psort.nibb.ac.jp/
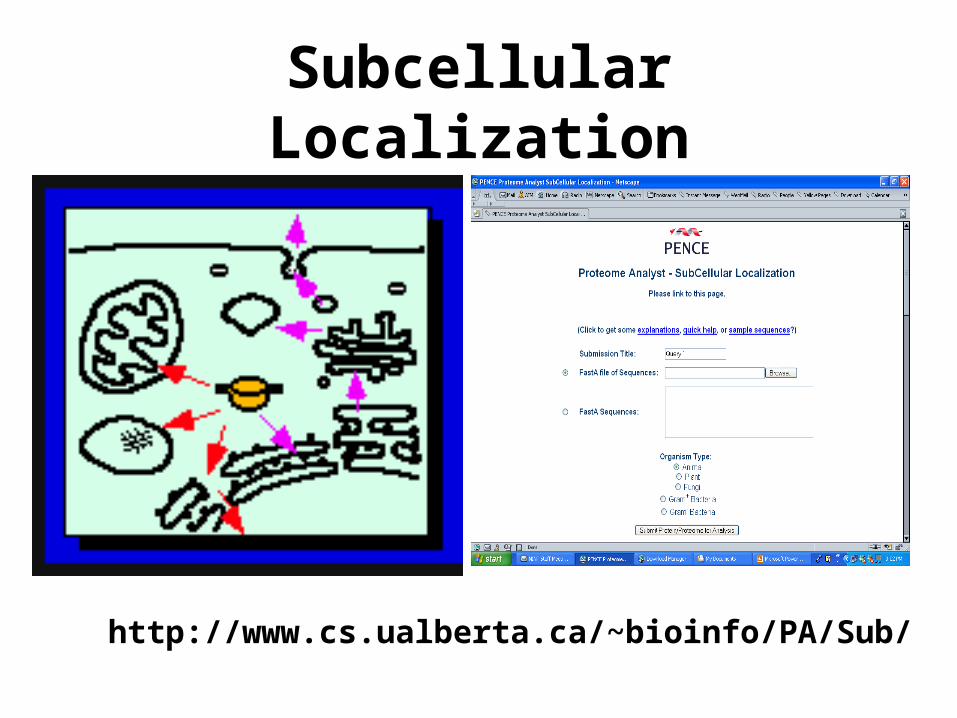
Subcellular Localization
http://www.cs.ualberta.ca/~bioinfo/PA/Sub/

Profiles & Motifs are Useful
• Helped identify active site of HIV protease
• Helped identify SH2/SH3 class of STP’s
• Helped identify important GTP oncoproteins
• Helped identify hidden leucine zipper in HGA
• Used to scan for lectin binding domains
• Regularly used to predict T-cell epitopes

Amino Acid Property Profiles
-4
-3
-2
-1
0
1
2
3
1 51 101 151 201 251 301
Score
Amino Acid Property Profiles
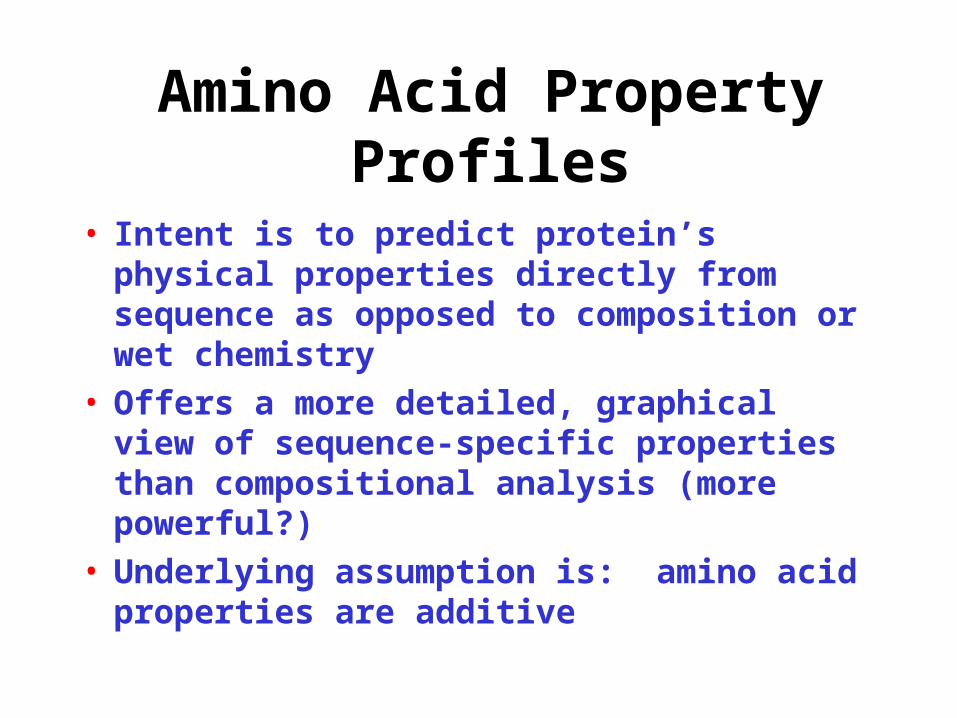
• Intent is to predict protein’s physical properties directly from sequence as opposed to composition or wet chemistry
• Offers a more detailed, graphical view of sequence-specific properties than compositional analysis (more powerful?)
• Underlying assumption is: amino acid properties are additive
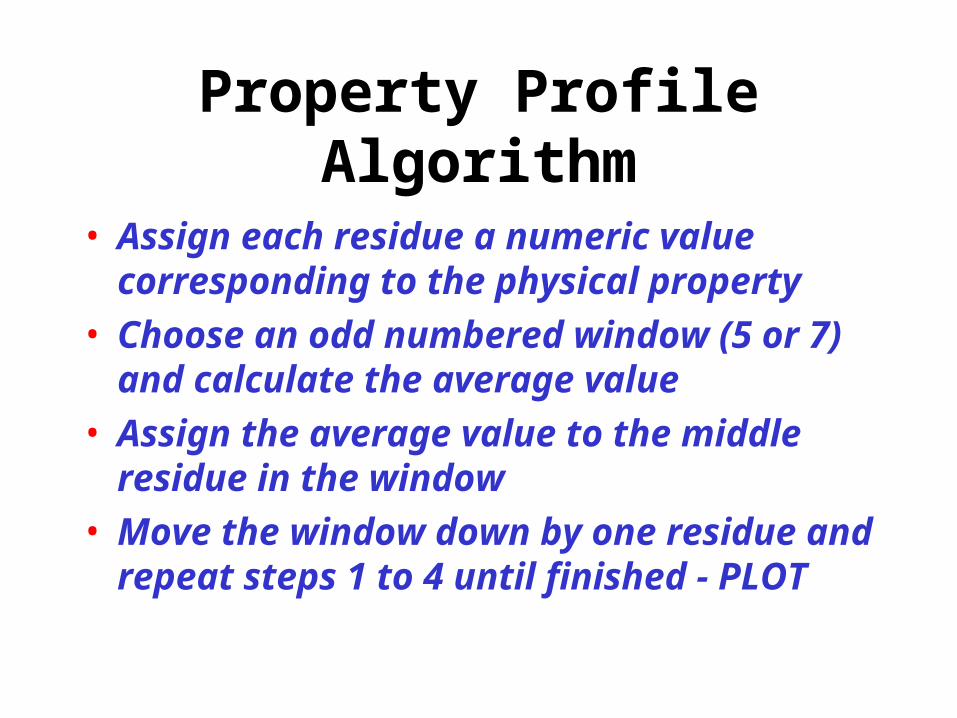
Property Profile Algorithm
• Assign each residue a numeric value corresponding to the physical property
• Choose an odd numbered window (5 or 7) and calculate the average value
• Assign the average value to the middle residue in the window
• Move the window down by one residue and repeat steps 1 to 4 until finished - PLOT

Common Property Profiles
• Hydrophobicity (Watch Scales!)
• Helical Wheel (Not a True Profile)
• Hydrophobic Moments (Helix & Beta sheet)
• Flexibility (Thermal B Factors)
• Surface Accessibility (ASA)
• Antigenicity (B-cell epitopes/T-cell epitopes)
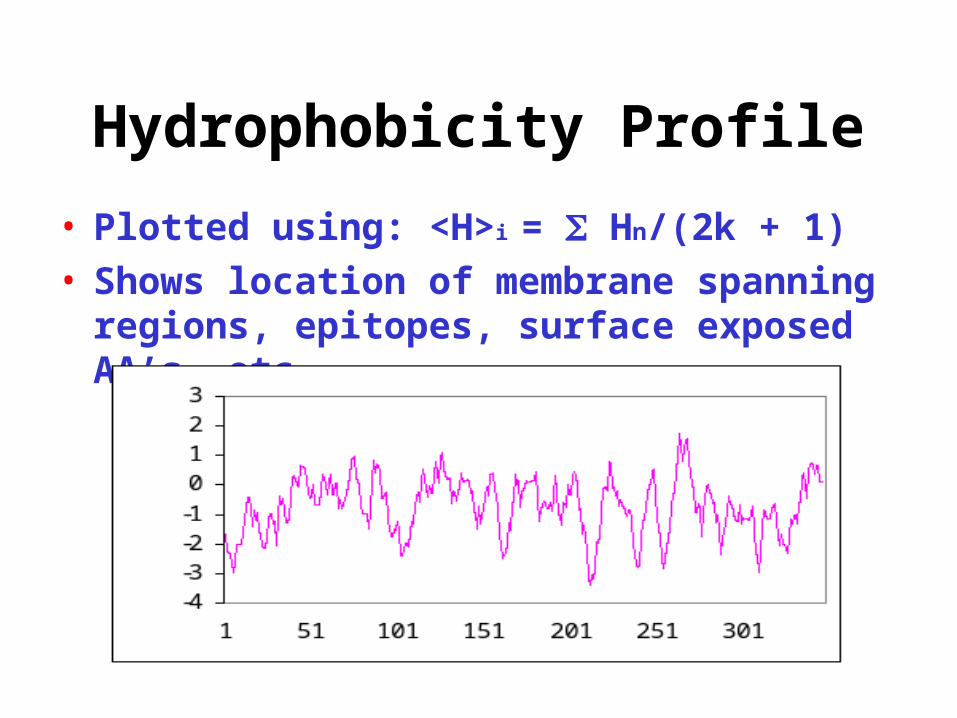
Hydrophobicity Profile
• Plotted using: <H>i = Hn/(2k + 1)• Shows location of membrane spanning
regions, epitopes, surface exposed AA’s, etc.

Helical Wheel
• Used to identify disposition of AA side chains around a helix, looking end-on
• Identifies Helical Amphipathicity

Hydrophobic Moment
• Quantitative way to measure amphipathicity• Fourier Transform of hydrophobicity

Flexibility
• B factors from X-ray crystallography• Potentially identifies antigenic and active
sites from sequence data alone
88.5
99.510
10.511
11.512
1 11 21 31 41 51 61 71 81 91 101
Flexibility (A^2)
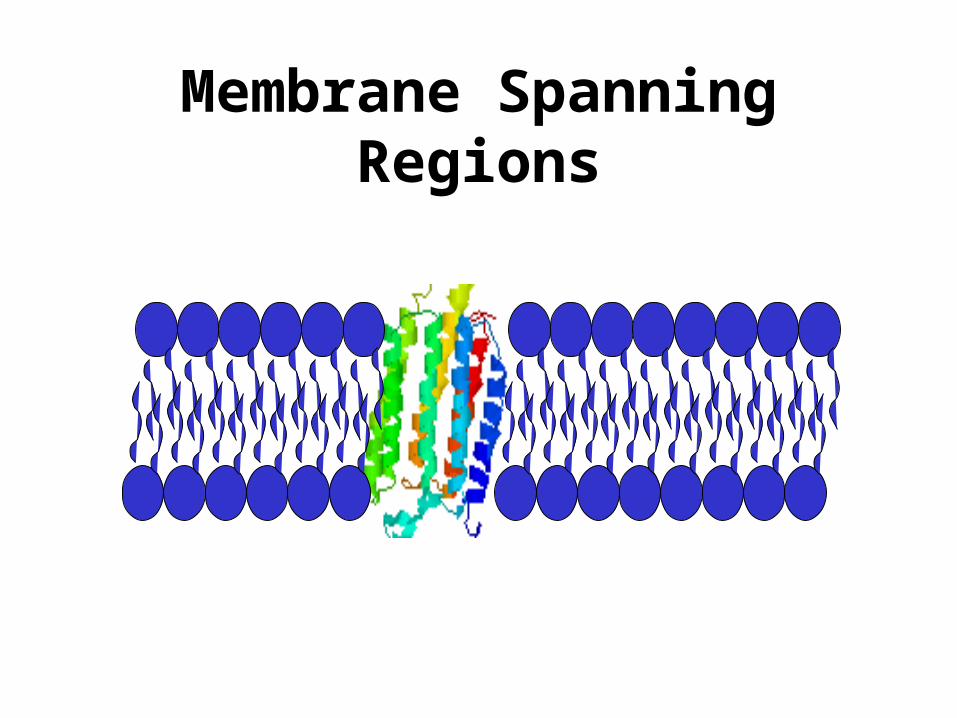
Membrane Spanning Regions

Predicting via Hydrophobicity
-3
-2
-1
0
1
2
3
4
1
Bacteriorhodopsin
-2
-1.5
-1
-0.5
0
0.5
1
1.5
2OmpA
Bacteriorhodoposin OmpA
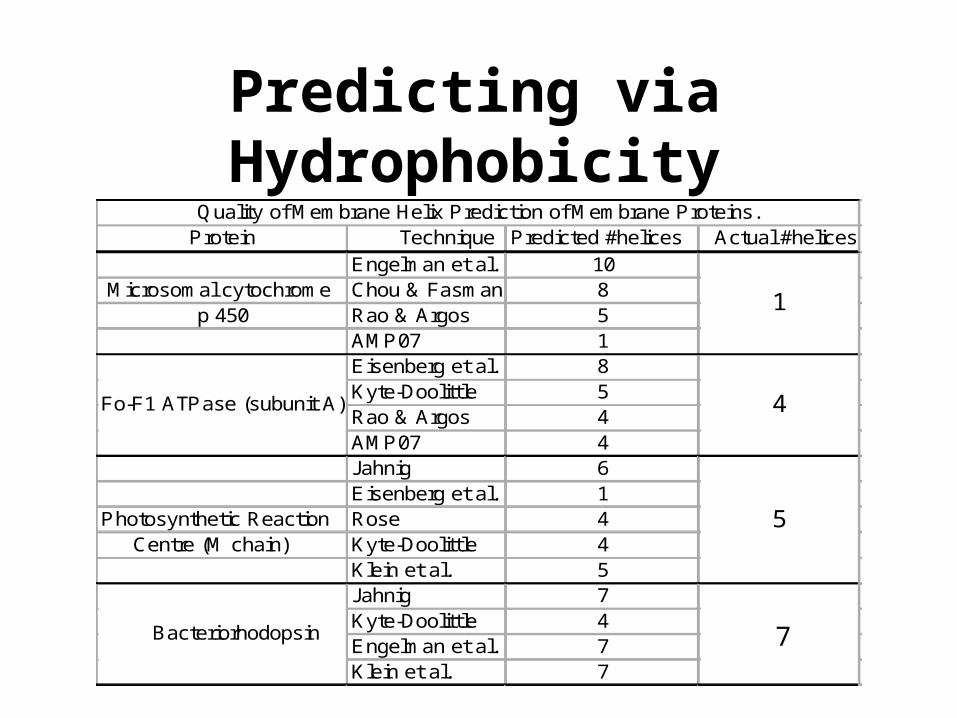
Predicting via Hydrophobicity
Protein Technique Predicted #helices Actual #helicesEngelman et al. 10
Microsomal cytochrome Chou & Fasman 8p 450 Rao & Argos 5
AMP07 1Eisenberg et al. 8Kyte-Doolittle 5Rao & Argos 4AMP07 4Jahnig 6Eisenberg et al. 1
Photosynthetic Reaction Rose 4 Centre (M chain) Kyte-Doolittle 4
Klein et al. 5Jahnig 7Kyte-Doolittle 4Engelman et al. 7Klein et al. 7
Quality of Membrane Helix Prediction of Membrane Proteins.
Fo-F1 ATPase (subunit A)
Bacteriorhodopsin
4
1
5
67

Predicting via Neural Nets • PHDhtm
http://cubic.bioc.columbia.edu/predictprotein/submit_adv.html
• TMAP http://www.mbb.ki.se/tmap/index.html
• TMPred http://www.ch.embnet.org/software/TMPRED_form.html
ACDEGF...

Prediction Performance

Secondary Structure Prediction

Secondary Structure Prediction
• Statistical (Chou-Fasman, GOR)• Homology or Nearest Neighbor (Levin)• Physico-Chemical (Lim, Eisenberg)• Pattern Matching (Cohen, Rooman)• Neural Nets (Qian & Sejnowski, Karplus)• Evolutionary Methods (Barton, Niemann)• Combined Approaches (Rost, Levin, Argos)

Chou-Fasman Statistics
Pα Pβ Pc Pα Pβ Pc
A 1.42 0.83 0.75 M 1.45 1.05 0.5C 0.7 1.19 1.11 N 0.67 0.89 1.44D 1.01 0.54 1.45 P 0.57 0.55 1.88E 1.51 0.37 1.12 Q 1.11 1.1 0.79F 1.13 1.38 0.49 R 0.98 0.93 1.09G 0.57 0.75 1.68 S 0.77 0.75 1.48H 1 0.87 1.13 T 0.83 1.19 0.98I 1.08 1.6 0.32 V 1.06 1.7 0.24K 1.16 0.74 1.1 W 1.08 1.37 0.45L 1.21 1.3 0.49 Y 0.69 1.47 0.84
Chou&FasmanSecondaryStructurePropensityoftheAminoAcids
Table8

The PhD Approach
PRFILE...

Prediction Performance
45505560657075
CFGOR I
LIMLEVIN
PTIT
JASEP7GOR IIIZHANG
PHD
Scores (%)

Best of the Best• PredictProtein-PHD (72%)
– http://cubic.bioc.columbia.edu/predictprotein
• Jpred (73-75%)– http://www.compbio.dundee.ac.uk/~www-jpred/
• SABLE (75%)
– http://sable.chmcc.org/
• PSIpred (77%)
– http://bioinf.cs.ucl.ac.uk/psipred/
• Proteus (78-90%)– http://wishart.biology.ualberta.ca/proteus/index.shtml
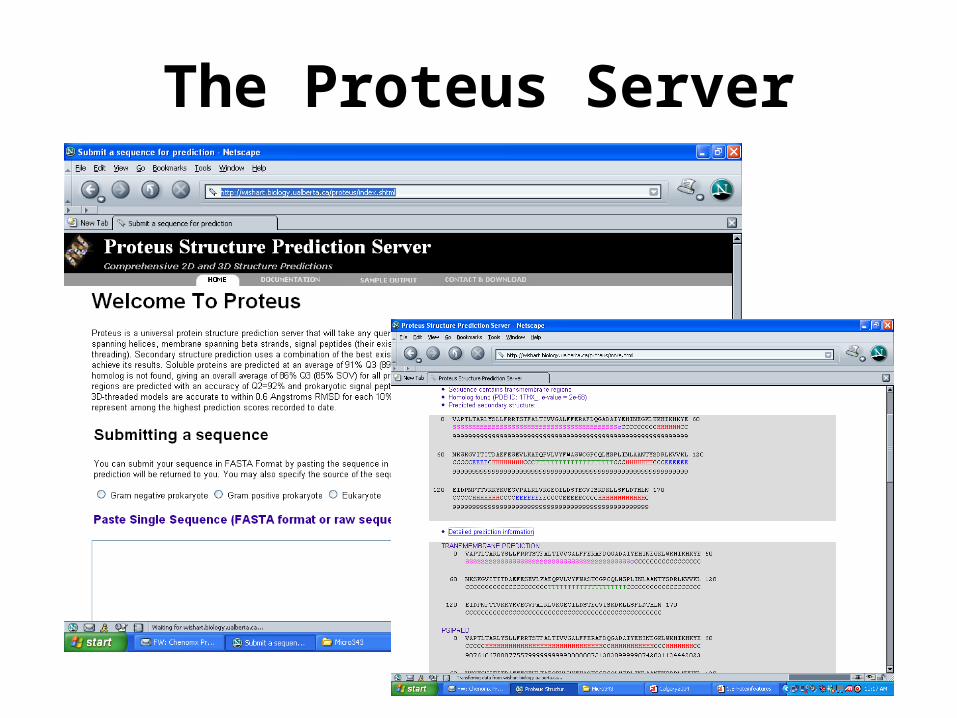
The Proteus Server
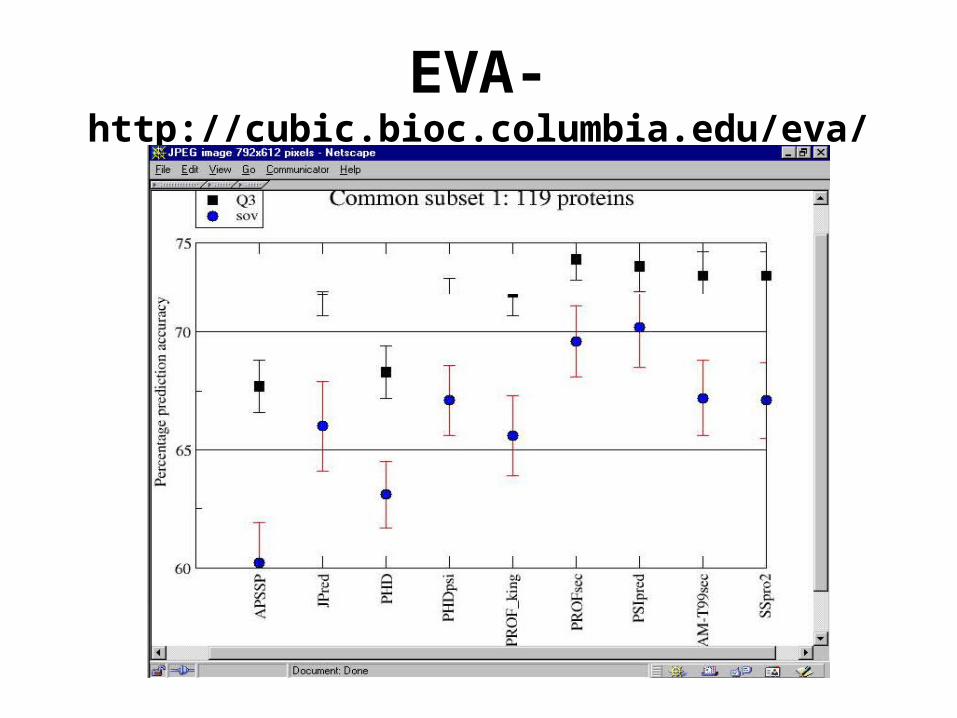
EVA- http://cubic.bioc.columbia.edu/eva/
Different Types of Features
• Composition Features– Mass, pI, Absorptivity, Rg, Volume
• Sequence Features– Active sites, Binding Sites, Targeting,
Location, Property Profiles, 2o structure
• Structure Features– Supersecondary Structure, Global Fold,
ASA, Volume

3D Protein Features

Secondary Structure
Structure Phi (Φ) Psi(Ψ)Antiparallelβ-sheet -139 +135Parallelβ-Sheet -119 +113Right-handedα-helix +64 +40310helix -49 -26πhelix -57 -70PolyprolineI -83 +158PolyprolineII -78 +149PolyglycineII -80 +150
Phi&PsianglesforRegularSecondaryStructureConformations
Table 10
- -- -

Supersecondary Structure

Global Folds
Lactate Dehydrogenase: Mixed α / β
Immunoglobulin Fold: β
Hemoglobin B Chain: α

3D Structure
• Allows direct identification and/or location of cofactors, ligands, crevices, protrusions and other features
• Allows one to identify possible function (through 3D homology)
• Allows protein to be classified into a folding family
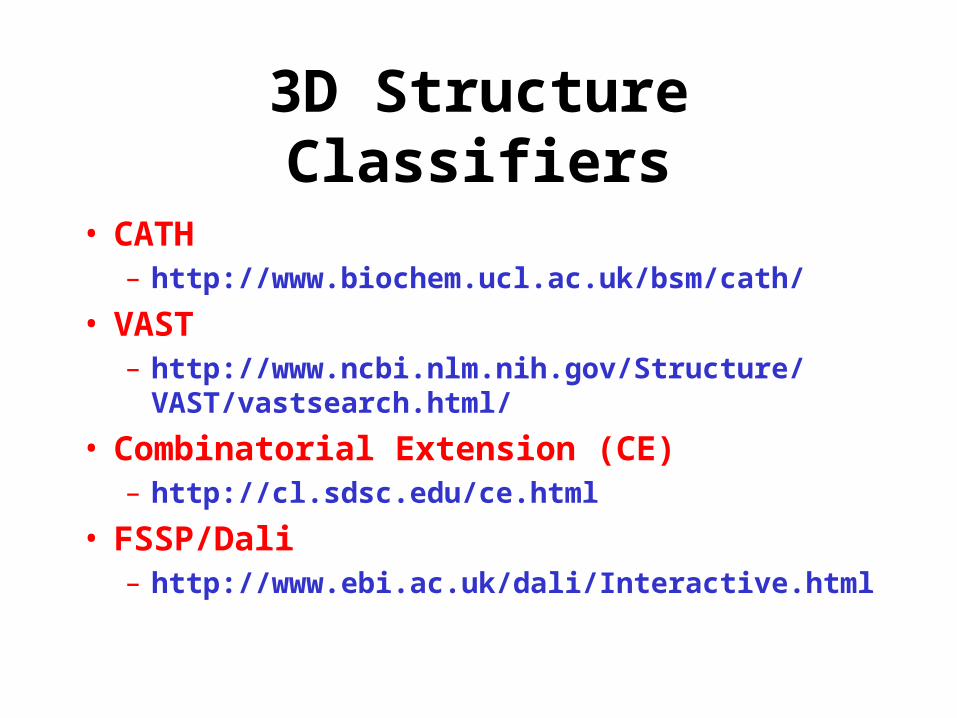
3D Structure Classifiers
• CATH – http://www.biochem.ucl.ac.uk/bsm/cath/
• VAST – http://www.ncbi.nlm.nih.gov/Structure/VAST/
vastsearch.html/
• Combinatorial Extension (CE)– http://cl.sdsc.edu/ce.html
• FSSP/Dali – http://www.ebi.ac.uk/dali/Interactive.html

Accessible Surface Area

Accessible Surface Area
Solvent ProbeAccessible Surface
Van der Waals Surface
Reentrant Surface

ASA -- A Powerful Tool
• Provides a picture of how water or other small molecules “see” the protein
• Allows identification of exterior features from interior features
• Allows identification of protrusions or crevices (i.e. active sites or binding sites)

Surface Charge Distribution

Surface Charge
• Allows positively and negatively charged structural features (protrusions, crevices) to be identified
• Can be used to ID possible active sites or probably character of ligands
• Key to many drug design efforts

Structure Features
• Secondary Structure• Supersecondary Structure• Folding Class• Polar/Nonpolar ASA• Hydrogen Bond Parameters• Stereochemistry• Packing Defects• Surface Charge Distribution• Surface Roughness
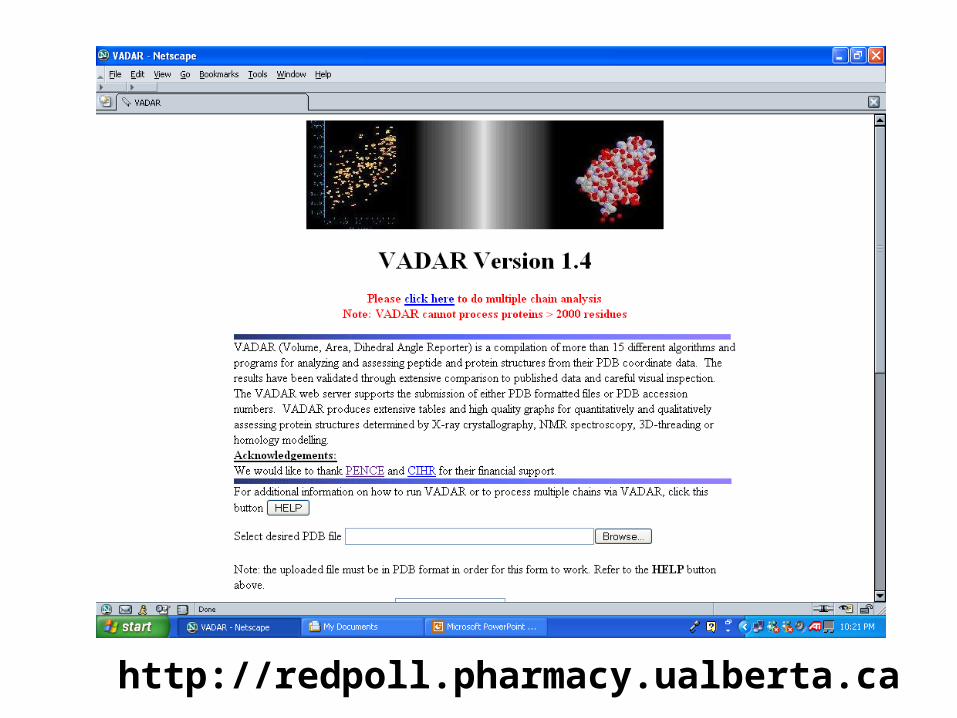
http://redpoll.pharmacy.ualberta.ca

Conclusion
• Composition Features– Mass, pI, Absorptivity, Rg, Volume
• Sequence Features– Active sites, Binding Sites, Targeting,
Location, Property Profiles, 2o structure
• Structure Features– Supersecondary Structure, Global Fold,
ASA, Volume