Protein alphabet reduction based on frequency dictionaries · 2007-11-26 · Protein alphabet...
30
Protein alphabet reduction based on frequency dictionaries Misha Kudryashev with Tatyana Popova and Alexander Gorban 1. University of Heidelberg, Germany 2. Boeringer GMBH, Germany 3. University of Leicester, UK 4. Institute of Computational Modeling SB RAS, Russia 1,4 2,4 3,4
Transcript of Protein alphabet reduction based on frequency dictionaries · 2007-11-26 · Protein alphabet...
Protein alphabet reduction based on frequency dictionaries
Misha Kudryashev
with Tatyana Popova and Alexander Gorban
1. University of Heidelberg, Germany2. Boeringer GMBH, Germany3. University of Leicester, UK
4. Institute of Computational Modeling SB RAS, Russia
1,4
2,4 3,4

2
Plan
From reality to schemes: the problem statementOptimal classification of symbolsNatural language exampleOptimal amino acids classifications for various classes of proteins, comparisons to functional classificationsWhat next?
3
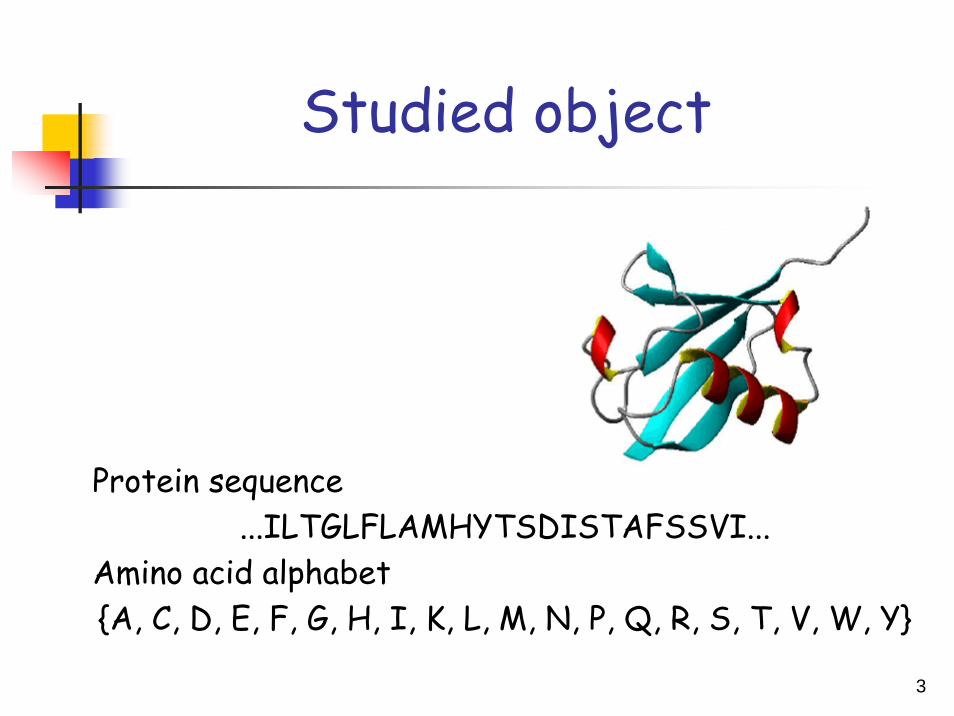
Studied object
Protein sequence ...ILTGLFLAMHYTSDISTAFSSVI...
Amino acid alphabet{A, C, D, E, F, G, H, I, K, L, M, N, P, Q, R, S, T, V, W, Y}

4
What are proteins made from?
Amino acids (AAs)?
Short sequences of AAs?
Classes of equivalent AAs?
Short sequences of such classes?
Anything else?

5
More questions
M. Gromov asked: is there a syntactic difference between Globular and Membrane proteins?
Are proteins random sequences of amino acids or they have any order?

6
How to discover non-randomness in protein sequences?
A string of length 400 in 20-letters alphabet is too short for non-randomness tests;
We can reduce the alphabet and analyse protein sequences in reduced alphabet.
With reduced alphabet we should be able to see patterns, schemes in the protein sequence.
7
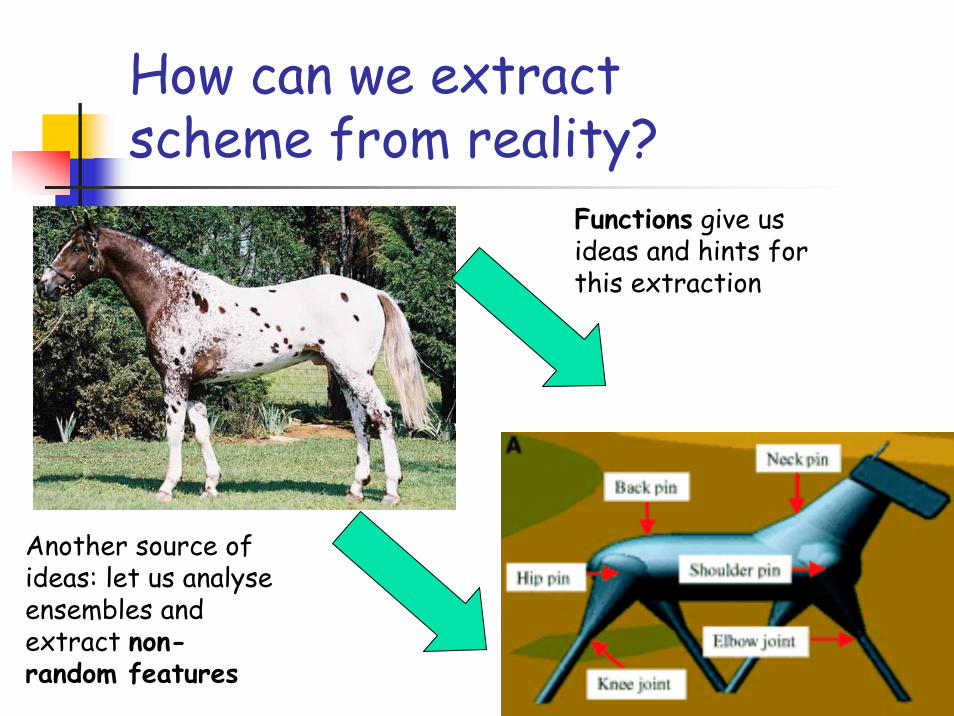
How can we extract scheme from reality?
Functions give us ideas and hints for this extraction
Another source of ideas: let us analyse ensembles and extract non-random features

8
Backgrounds of amino acids classification
The bases of theoretical grouping of amino acids mentioned in literature may be attributed to the following main features: physical, chemical properties and amino acids environment in proteins; protein alignments and substitution matrices; protein spatial structure and contact potential matrix…
9
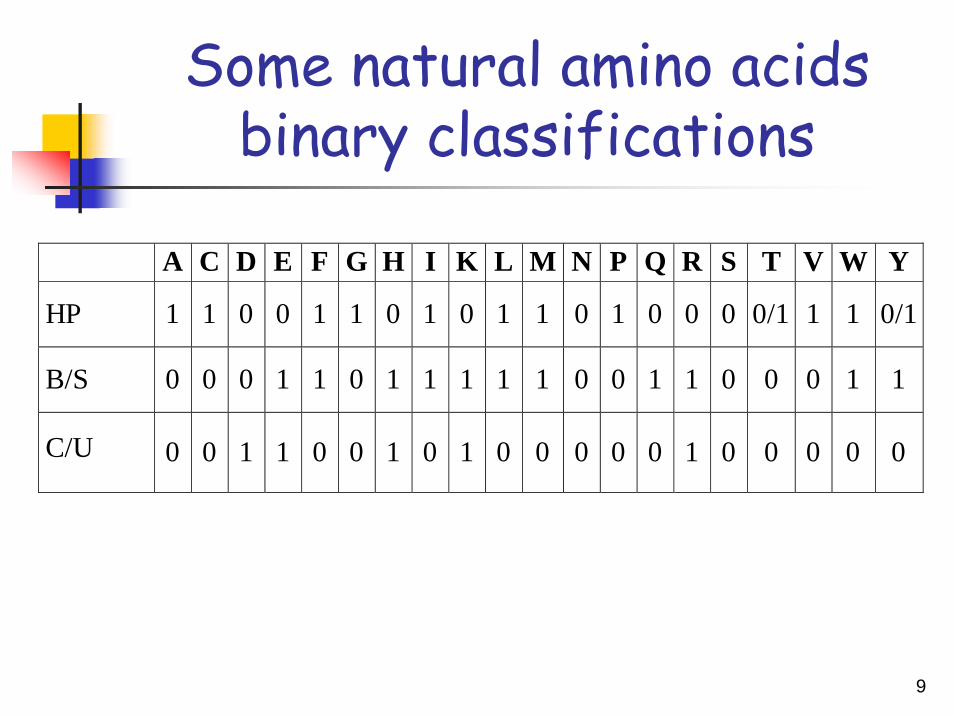
Some natural amino acids binary classifications
A C D E F G H I K L M N P Q R S T V W Y
HP 1 1 0 0 1 1 0 1 0 1 1 0 1 0 0 0 0/1 1 1 0/1
B/S 0 0 0 1 1 0 1 1 1 1 1 0 0 1 1 0 0 0 1 1
C/U 0 0 1 1 0 0 1 0 1 0 0 0 0 0 1 0 0 0 0 0
10
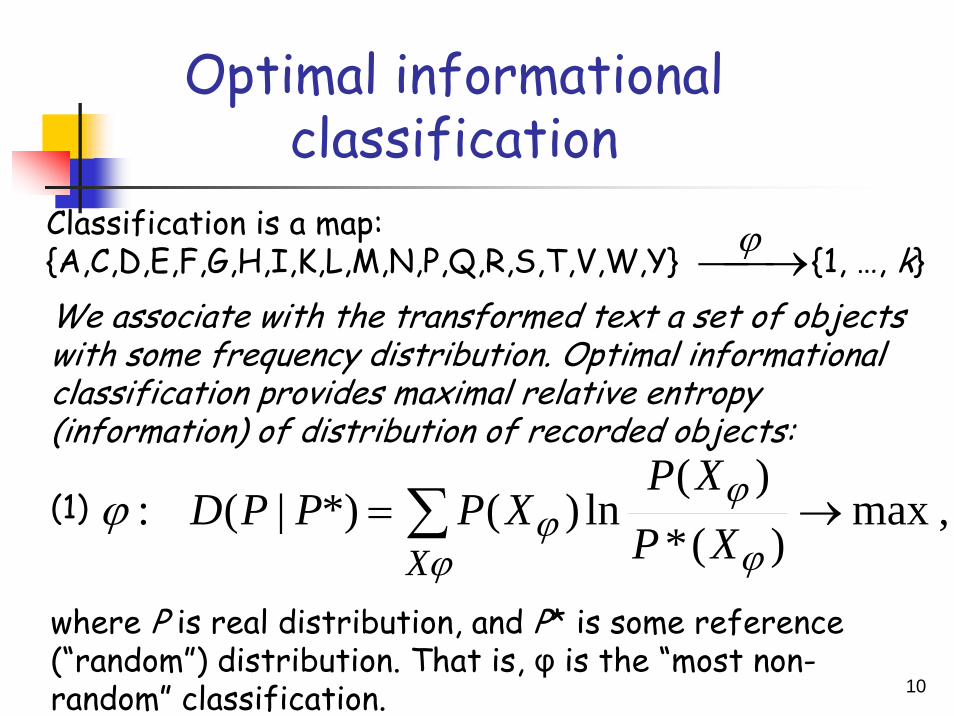
Optimal informational classification
We associate with the transformed text a set of objects with some frequency distribution. Optimal informational classification provides maximal relative entropy (information) of distribution of recorded objects:
(1)
where P is real distribution, and P* is some reference (“random”) distribution. That is, φ is the “most non-random” classification.
,max)(*
)(ln)(*)|(: →= ∑
ϕ ϕ
ϕϕϕ
X XPXP
XPPPD
Classification is a map:{A,C,D,E,F,G,H,I,K,L,M,N,P,Q,R,S,T,V,W,Y} {1, …, k} ⎯→⎯ϕ

11
Frequency dictionary
Let Xφ be a “q-letter word ensemble.” Then P(Xφ) is the q-th frequency dictionary for a text: it is a function that associates with each string of letters
qiiif ...21
its frequency in the textqiii ...21
it is a kq – dimensional real vector, where k is the number of letters in the alphabet.

12
Where do we take the reference distribution?
This is the most random distribution MaxEnt (the physical entropy, maximal randomness) for given data. For example, for given frequencies of symbols,
qqii iii ffff ⋅⋅⋅= ...21...1
*,
where i1…iq are q-letter words; qiif ...1 are frequencies of corresponding words in the symbol
sequence.

13
So, we have a problem:
For word distribution in reduced alphabet
maxln...
*...
......
21 21
21
21→∑
q q
q
qiii iii
iiiiii f
ff
qqii iii ffff ⋅⋅⋅= ...21...1
*where

14
Entropic classification of letters for English language in Bible text
Groups Relative Entropy 1 2 3 4 5 6 0.767926 aeioudgt bcfhjklmnpqrsvwxyz 0.934107 aeiou bcdfgklmnpqrstvwxyz hj 1.096432 aeiou bcfklmnpqrsvxz hj dgtwy 1.171895 aeiou bcfklmprsvxyz hj dgqtw n 1.227138 aeiou bcfklmpqrsvxyz hj tw n dg

15
In the beginning was the Word, and the Word was with God, and the Word was God (Jn. 1:1-3)
Num-ber of classes
The coded phrase
2 01 110 101011011 101 110 1011 011 110 1011 101 1011 101 011 110 1011 101 101 En nne nenennenn nen nne Nenn, enn nne Nenn nen nenn Nen, enn nne Nenn nen Nen
3 Et the tetettett tet the Teth, eth the Teth tet teth Teh, eth the Teth tet Teh
4 En the netennent ten the Tent, ent the Tent ten teth Tet, ent the Tent ten Tet
5 En the setennent tes the Test, ent the Test tes teth Set, ent the Test tes Set
6 En the setennend tes the Tesd, end the Tesd tes teth Ded, end the Tesd tes Ded
Initial phrase
In the beginning was the Word, and the Word was with God, and the Word was God
Informational classification finds syllabic structure.

16
Typical distribution of relative entropy for all possible binary classifications of amino acids.
110
1001000
10000100000
1000000
0 50% 100%=0.0066
relative entropy
number of classifications

17
The data sets of used protein sequences
Keywords
Number of
proteins Keywords
Number of
proteins
Oxidoreductase 452 Transferase 500
Cytochrome 500 Isomerase 578
Phytochrome 500 DNA polymerase 500
Nitratoreductase 197 Oxidase 500
Dataset 1 (EBI)
ATPase 500
Dataset 2 (SwissProt) Membrane 10000 Globular 5019
18
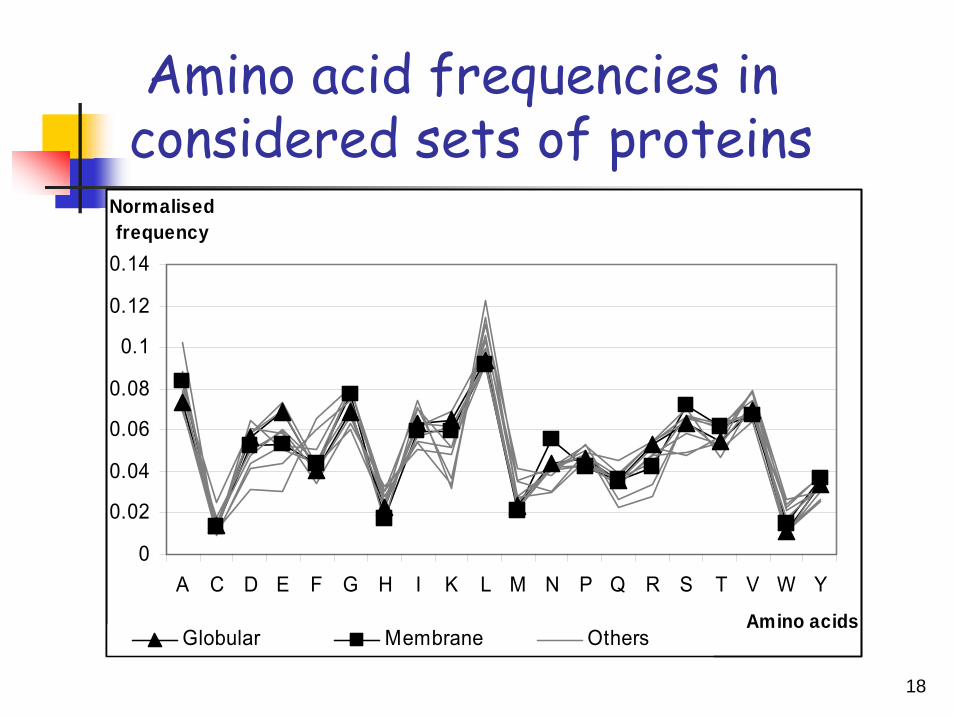
Amino acid frequencies in considered sets of proteins
0
0.02
0.04
0.06
0.08
0.1
0.12
0.14
A C D E F G H I K L M N P Q R S T V W Y
Amino acids
Normalised frequency
Globular Membrane Others

19
Binary informational classifications for Dataset 1 and 2
Protein dataset Dmax A C D E F G H I K L M N P Q R S T V W YATPase 0.002 1 1 0 0 1 1 1 1 0 1 1 0 0 0 0 1 1 1 1 1Cytochrome 0.0066 1 1 0 0 1 1 1 1 0 1 1 0 0 1 0 1 1 1 1 1Nitratoreductase 0.0027 1 0 0 0 1 1 1 1 0 1 1 0 0 0 0 1 1 1 1 1Oxidase 0.0029 1 1 0 0 1 1 1 1 0 1 1 0 0 0 0 1 1 0 1 0DNA polymerase 0.0007 1 0 0 1 0 0 0 0 1 0 1 0 0 0 1 0 0 0 0 0Isomerase 0.0006 1 0 1 1 0 0 0 1 1 1 0 0 1 1 1 0 0 1 0 0Transferase 0.0006 1 0 1 1 0 0 0 1 1 1 1 0 0 0 1 0 0 0 0 0Phytochrome 0.0074 1 1 1 1 0 0 1 1 1 0 1 1 0 0 0 0 0 1 0 0Oxidoreductase 0.0024 1 1 0 0 0 1 0 0 1 1 0 1 1 0 1 1 0 1 0 1Globular 0.0006 1 0 0 1 0 0 0 0 1 1 1 0 0 1 1 0 0 0 0 0Membrane 0.0025 1 1 0 0 1 1 0 1 0 1 1 0 1 0 0 1 1 1 0 0
20
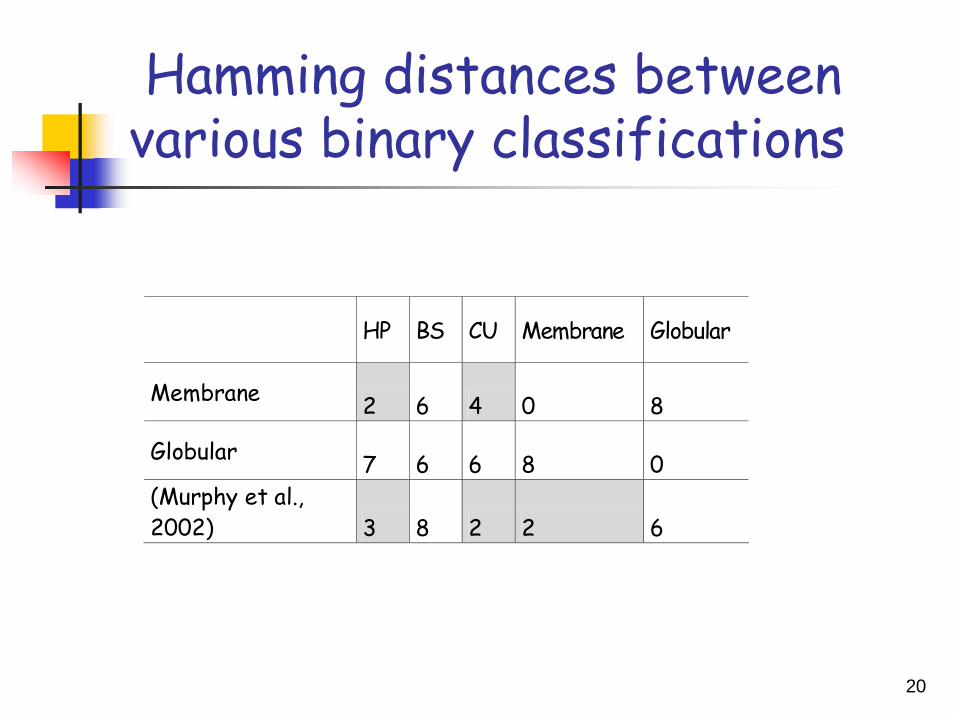
Hamming distances between various binary classifications
HP BS CU Membrane Globular
Membrane 2 6 4 0 8
Globular 7 6 6 8 0 (Murphy et al., 2002) 3 8 2 2 6

21
New dataset
KeywordsNumb. of proteins Keywords
Numb. of proteins
Dataset 3 Chloroplast 5000 Membrane 5000
(SwissProt) Cytoplasmic 2849 Mitochondrial 5000
Extracellular 5000 Nucear 5000
Goldgi 748 ATPase 5000

22
Classifications for new dataset
Dmax A C D E F G H I K L M N P Q R S T V W YChloroplast 0,0016 1 0 0 1 0 0 0 0 1 0 1 0 0 1 0 0 0 0 0 0Cytoplasmic 0,0012 1 0 0 1 0 0 0 0 1 1 1 0 0 1 1 0 0 0 0 0Extracellular 0,0013 1 0 0 1 0 0 0 0 1 1 1 0 0 1 1 0 0 1 0 0Goldgi 0,0021 1 1 0 0 1 1 1 1 0 0 0 0 1 0 0 1 1 1 1 1Membrane 0,0031 1 1 0 0 1 1 0 1 0 1 1 0 1 0 0 1 1 1 1 0Mitochondrial 0,0008 1 0 0 1 0 0 0 0 1 0 1 0 0 1 0 0 0 0 0 0Nuclear 0,0023 1 0 0 0 0 1 0 0 0 0 0 0 1 0 0 1 1 0 0 0ATPase 0,0009 1 1 1 0 1 1 1 1 0 1 1 1 1 0 0 1 1 1 1 1

23
Correlations of informational classifications with natural scales
BS CU HPChloroplast 0,06 0,01 0,25Cytoplasmic 0,10 0,30 0,26Extracellular 0,07 0,29 0,16Goldgi 0,18 0,06 0,52Membrane 0,36 0,15 0,72Mitochondrial 0,06 0,01 0,25Nuclear 0,69 0,03 0,00ATPase 0,21 0,38 0,58

24
Orthogonal classifications2nd component BS CU HP 3rd component BS CU HP
Chloroplast 0,4 0,5 0,32 Chloroplast 0,1 0,01 0,31Cytoplasmic 0,47 0,01 0,05 Cytoplasmic 0,12 0,04 0,01Extracellular 0,24 0,06 0,1 Extracellular 0,48 0,14 0,83Goldgi 0,41 0,07 0,03 Goldgi 0,21 0,32 0,22Membrane 0,32 0,03 0 Membrane 0,46 0,23 0,22Mitochondrial 0,11 0,17 0,08 Mitochondrial 0,45 0,06 0,27Nuclear 0,28 0,17 0,03 Nuclear 0 0,28 0,28ATPase 0,52 0,07 0,15 ATPase 0,34 0,53 0,2
25
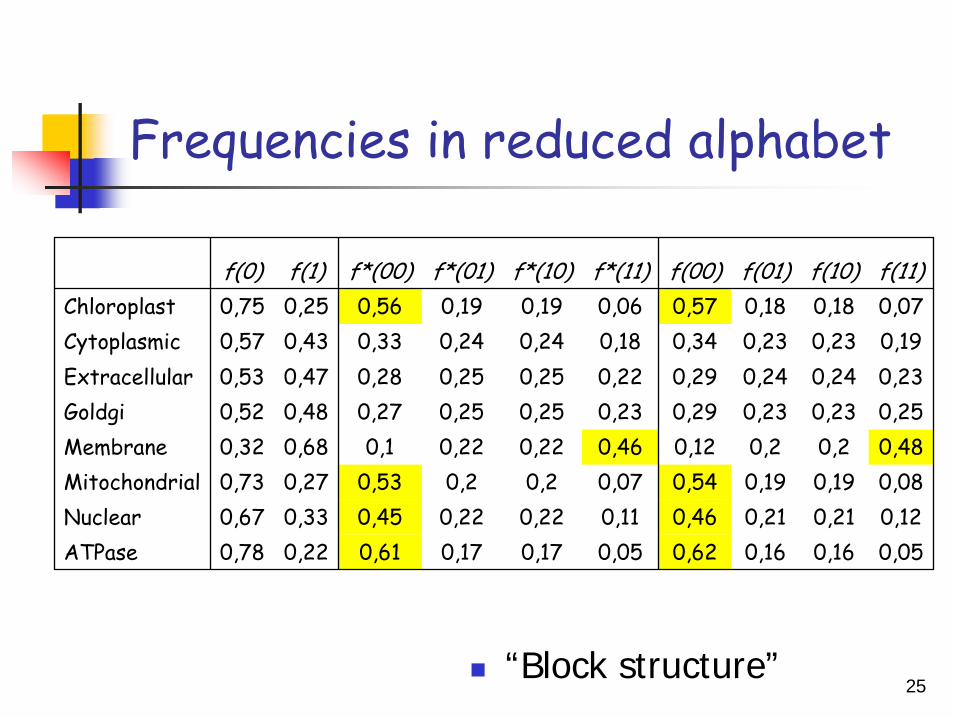
Frequencies in reduced alphabet
“Block structure”
f(0) f(1) f*(00) f*(01) f*(10) f*(11) f(00) f(01) f(10) f(11)Chloroplast 0,75 0,25 0,56 0,19 0,19 0,06 0,57 0,18 0,18 0,07Cytoplasmic 0,57 0,43 0,33 0,24 0,24 0,18 0,34 0,23 0,23 0,19Extracellular 0,53 0,47 0,28 0,25 0,25 0,22 0,29 0,24 0,24 0,23Goldgi 0,52 0,48 0,27 0,25 0,25 0,23 0,29 0,23 0,23 0,25Membrane 0,32 0,68 0,1 0,22 0,22 0,46 0,12 0,2 0,2 0,48Mitochondrial 0,73 0,27 0,53 0,2 0,2 0,07 0,54 0,19 0,19 0,08Nuclear 0,67 0,33 0,45 0,22 0,22 0,11 0,46 0,21 0,21 0,12ATPase 0,78 0,22 0,61 0,17 0,17 0,05 0,62 0,16 0,16 0,05

26
Answer 1.
There exists significant syntactic difference between Globular and Membrane proteins; hydrphobicity is resopnsible for non-randomness in sequences of membrane proteins.
27
Answer 2.
Amino acid sequences in proteins are definitely not random

28
Answer 3
Protein sequences in reduced alphabet have “block” structure as natural texts in English have “syllabic”.

29
Answer 4
What are proteins made from? We havenew candidates for a minimal set ofamino acids for each protein group.
But, perhaps, it is wiser to classify couples and triples of amino acids. Classes of such couples and triples are, perhaps, the elementarydetails of proteins.

30
To be continued…
Thank you for your attention!