Protection. - FBD Holdings 2018 Solvency … · A2. Underwriting Performance A2.1 The Undertaking...
74
FBD Holdings plc 2018 Solvency and Financial Condition Report Protection. It’s in our nature.
Transcript of Protection. - FBD Holdings 2018 Solvency … · A2. Underwriting Performance A2.1 The Undertaking...

FBD Holdings plc 2018 Solvency and Financial Condition Report
Protection. It’s in our nature.
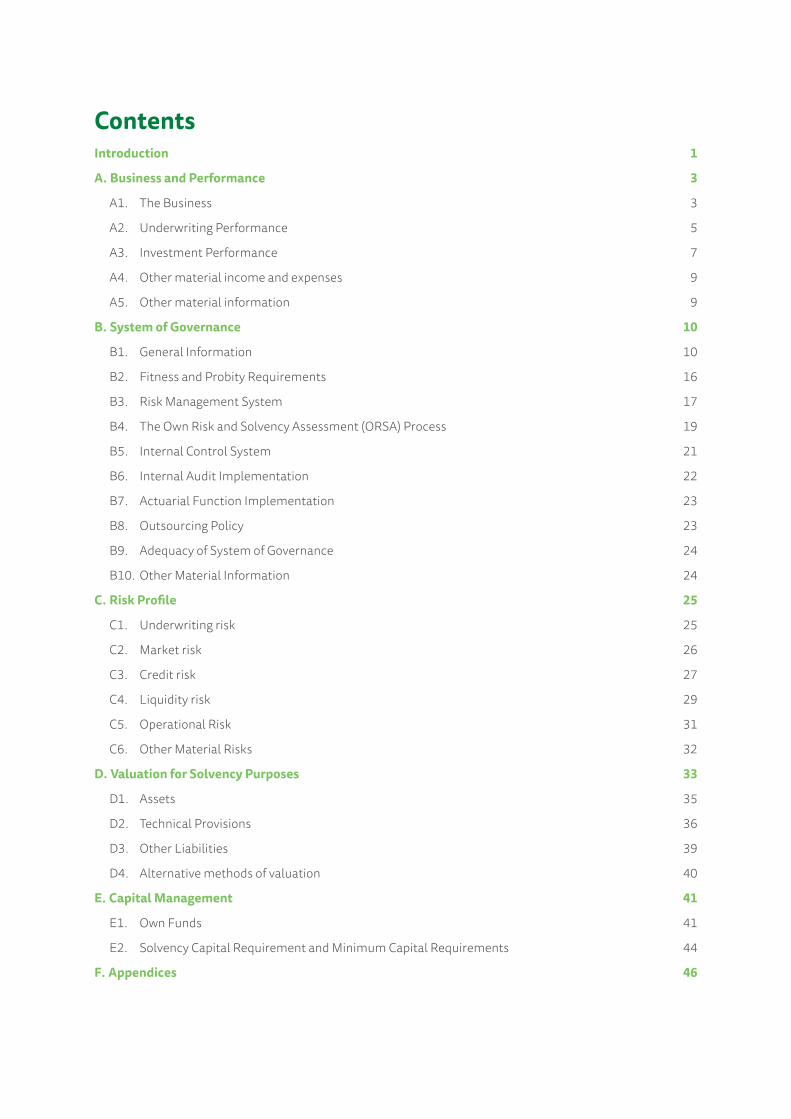
ContentsIntroduction 1
A. Business and Performance 3
A1. The Business 3
A2. Underwriting Performance 5
A3. Investment Performance 7
A4. Other material income and expenses 9
A5. Other material information 9
B. System of Governance 10
B1. General Information 10
B2. Fitness and Probity Requirements 16
B3. Risk Management System 17
B4. The Own Risk and Solvency Assessment (ORSA) Process 19
B5. Internal Control System 21
B6. Internal Audit Implementation 22
B7. Actuarial Function Implementation 23
B8. Outsourcing Policy 23
B9. Adequacy of System of Governance 24
B10. Other Material Information 24
C. Risk Profile 25
C1. Underwriting risk 25
C2. Market risk 26
C3. Credit risk 27
C4. Liquidity risk 29
C5. Operational Risk 31
C6. Other Material Risks 32
D. Valuation for Solvency Purposes 33
D1. Assets 35
D2. Technical Provisions 36
D3. Other Liabilities 39
D4. Alternative methods of valuation 40
E. Capital Management 41
E1. Own Funds 41
E2. Solvency Capital Requirement and Minimum Capital Requirements 44
F. Appendices 46
FBD Holdings plc 2018 Solvency and Financial Condition Report 1
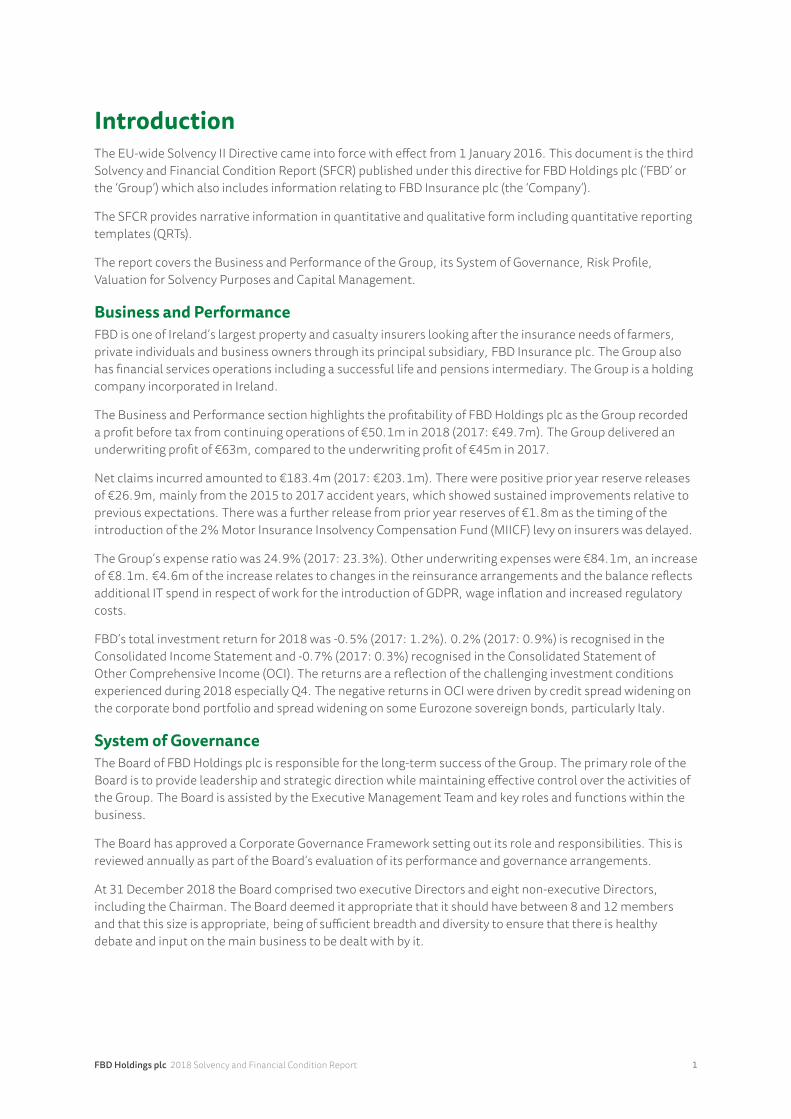
IntroductionThe EU-wide Solvency II Directive came into force with effect from 1 January 2016. This document is the third Solvency and Financial Condition Report (SFCR) published under this directive for FBD Holdings plc (‘FBD’ or the ‘Group’) which also includes information relating to FBD Insurance plc (the ‘Company’).
The SFCR provides narrative information in quantitative and qualitative form including quantitative reporting templates (QRTs).
The report covers the Business and Performance of the Group, its System of Governance, Risk Profile, Valuation for Solvency Purposes and Capital Management.
Business and PerformanceFBD is one of Ireland’s largest property and casualty insurers looking after the insurance needs of farmers, private individuals and business owners through its principal subsidiary, FBD Insurance plc. The Group also has financial services operations including a successful life and pensions intermediary. The Group is a holding company incorporated in Ireland.
The Business and Performance section highlights the profitability of FBD Holdings plc as the Group recorded a profit before tax from continuing operations of €50.1m in 2018 (2017: €49.7m). The Group delivered an underwriting profit of €63m, compared to the underwriting profit of €45m in 2017.
Net claims incurred amounted to €183.4m (2017: €203.1m). There were positive prior year reserve releases of €26.9m, mainly from the 2015 to 2017 accident years, which showed sustained improvements relative to previous expectations. There was a further release from prior year reserves of €1.8m as the timing of the introduction of the 2% Motor Insurance Insolvency Compensation Fund (MIICF) levy on insurers was delayed.
The Group’s expense ratio was 24.9% (2017: 23.3%). Other underwriting expenses were €84.1m, an increase of €8.1m. €4.6m of the increase relates to changes in the reinsurance arrangements and the balance reflects additional IT spend in respect of work for the introduction of GDPR, wage inflation and increased regulatory costs.
FBD’s total investment return for 2018 was -0.5% (2017: 1.2%). 0.2% (2017: 0.9%) is recognised in the Consolidated Income Statement and -0.7% (2017: 0.3%) recognised in the Consolidated Statement of Other Comprehensive Income (OCI). The returns are a reflection of the challenging investment conditions experienced during 2018 especially Q4. The negative returns in OCI were driven by credit spread widening on the corporate bond portfolio and spread widening on some Eurozone sovereign bonds, particularly Italy.
System of GovernanceThe Board of FBD Holdings plc is responsible for the long-term success of the Group. The primary role of the Board is to provide leadership and strategic direction while maintaining effective control over the activities of the Group. The Board is assisted by the Executive Management Team and key roles and functions within the business.
The Board has approved a Corporate Governance Framework setting out its role and responsibilities. This is reviewed annually as part of the Board’s evaluation of its performance and governance arrangements.
At 31 December 2018 the Board comprised two executive Directors and eight non-executive Directors, including the Chairman. The Board deemed it appropriate that it should have between 8 and 12 members and that this size is appropriate, being of sufficient breadth and diversity to ensure that there is healthy debate and input on the main business to be dealt with by it.
FBD Holdings plc 2018 Solvency and Financial Condition Report 2
Risk ProfileAn annual review is completed by the Risk Committee of all major risks to ensure all risks are identified and evaluated. Each risk is assessed by considering the potential impact and the probability of the event occurring. Impact assessments are made against financial, operational, regulatory and reputational criteria.
The Risk Profile details the Underwriting, Market, Credit, Liquidity, Operational and Other material risks relating to FBD Insurance plc. For each of the risks, FBD has undertaken stress testing as part of its Own Risk and Solvency Assessment (ORSA). The outcome of the stress and scenario tests was that in each case FBD would have sufficient available capital to continue to meet the Solvency Capital Requirement (SCR).
Valuation for Solvency PurposesThe Valuation for Solvency Purposes outlines the difference between the Solvency II Valuation and the Financial Statements for the Group and FBD Insurance plc. FBD Holdings plc Financial Statements are prepared in accordance with International Financial Reporting Standards (IFRS). The FBD Insurance plc Financial Statements are prepared on Financial Reporting Standard basis 102 and 103 (FRS 102 & 103). There are no significant measurement differences between the two bases.
Capital ManagementThe Capital Management section outlines the SCR and Minimum Capital Requirement (MCR) for the Group and the insurance entity. FBD measures and calculates capital using the Standard Formula. The solvency position is monitored on a regular basis to ensure compliance with the SCR and MCR.
At 31 December 2018 the Group Solvency Capital Ratio was 165% including the foreseeable dividend of €17.6m. The FBD Insurance plc ratio was 162%.
FBD Holdings plc 2018 Solvency and Financial Condition Report 3
A. Business and PerformanceA1. The BusinessA1.1 The UndertakingFBD Holdings plc is incorporated in Ireland. The only insurance entity in the Group is FBD Insurance plc, an insurer licensed in Ireland. The address of the Registered Office and Head Office is;
FBD Holdings plc FBD House Bluebell Dublin 12 D12 YOHE Ireland
A1.2 Supervisory AuthorityFBD Holdings plc and FBD Insurance plc are domiciled in Ireland and the supervisory authority responsible for financial supervision of the undertakings is:
Central Bank of Ireland New Wapping Street North Wall Quay Dublin 1 D01 F7X3
A1.3 Independent AuditorsFBD’s independent auditors are:
PricewaterhouseCoopers Chartered Accountants and Statutory Audit Firm One Spencer Dock North Wall Quay North Wall Dublin 1 D01 X9R7 Ireland
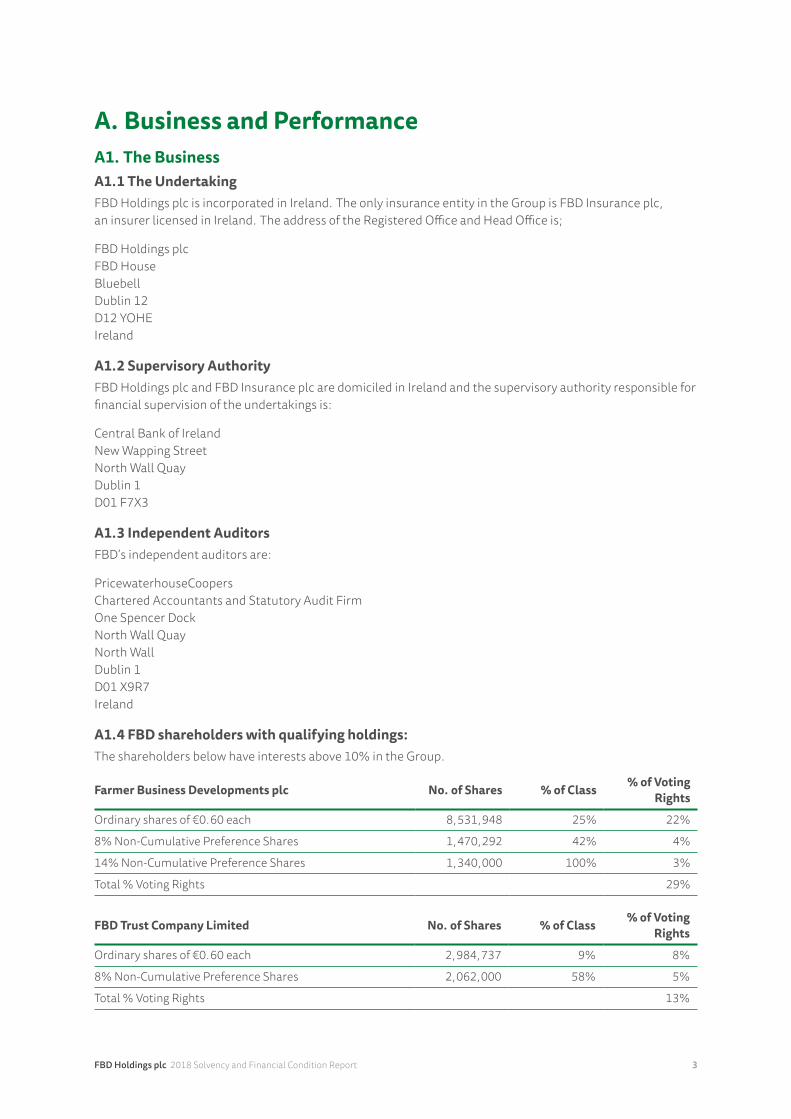
A1.4 FBD shareholders with qualifying holdings:The shareholders below have interests above 10% in the Group.
Farmer Business Developments plc No. of Shares % of Class % of VotingRights
Ordinary shares of €0.60 each 8,531,948 25% 22%
8% Non-Cumulative Preference Shares 1,470,292 42% 4%
14% Non-Cumulative Preference Shares 1,340,000 100% 3%
Total % Voting Rights 29%
FBD Trust Company Limited No. of Shares % of Class % of VotingRights
Ordinary shares of €0.60 each 2,984,737 9% 8%
8% Non-Cumulative Preference Shares 2,062,000 58% 5%
Total % Voting Rights 13%
FBD Holdings plc 2018 Solvency and Financial Condition Report 4
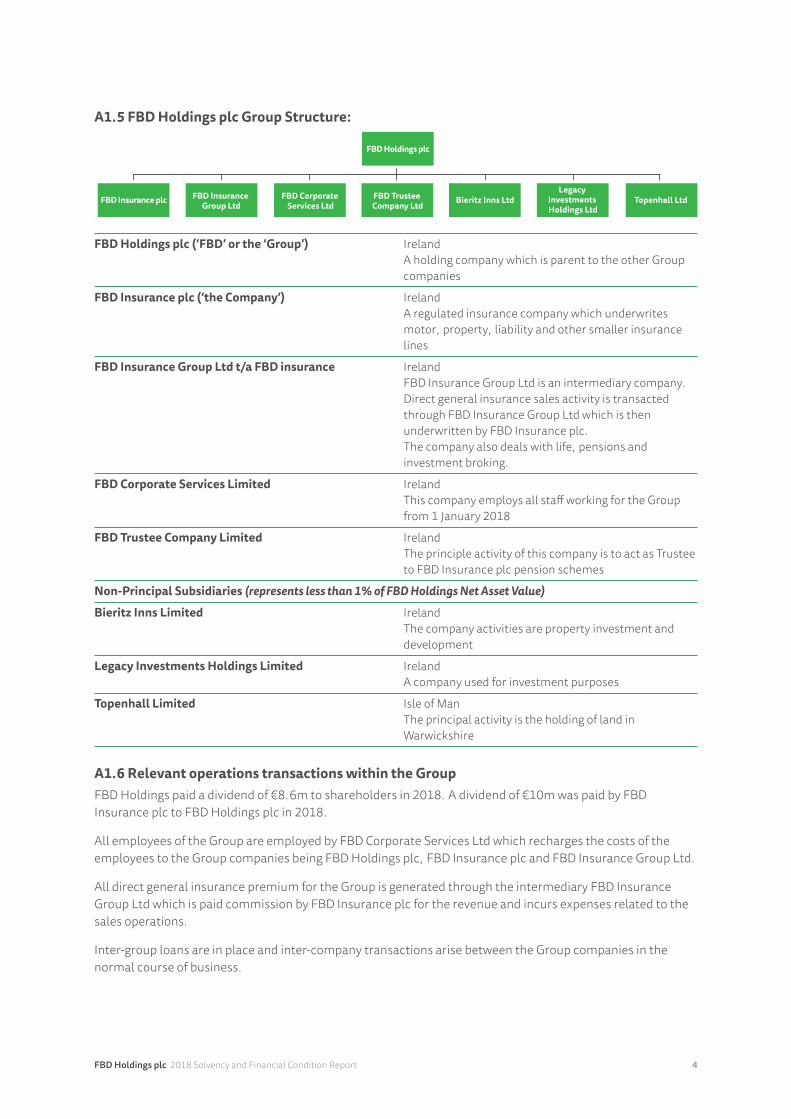
A1.5 FBD Holdings plc Group Structure:
FBD Insurance Group Ltd
FBD Corporate Services Ltd
FBD Trustee Company Ltd
Legacy Investments Holdings Ltd
FBD Insurance plc
FBD Holdings plc
Bieritz Inns Ltd Topenhall Ltd
FBD Holdings plc (‘FBD’ or the ‘Group’) IrelandA holding company which is parent to the other Group companies
FBD Insurance plc (‘the Company’) IrelandA regulated insurance company which underwrites motor, property, liability and other smaller insurance lines
FBD Insurance Group Ltd t/a FBD insurance IrelandFBD Insurance Group Ltd is an intermediary company. Direct general insurance sales activity is transacted through FBD Insurance Group Ltd which is then underwritten by FBD Insurance plc.The company also deals with life, pensions and investment broking.
FBD Corporate Services Limited IrelandThis company employs all staff working for the Group from 1 January 2018
FBD Trustee Company Limited IrelandThe principle activity of this company is to act as Trustee to FBD Insurance plc pension schemes
Non-Principal Subsidiaries (represents less than 1% of FBD Holdings Net Asset Value)
Bieritz Inns Limited IrelandThe company activities are property investment and development
Legacy Investments Holdings Limited IrelandA company used for investment purposes
Topenhall Limited Isle of ManThe principal activity is the holding of land in Warwickshire
A1.6 Relevant operations transactions within the GroupFBD Holdings paid a dividend of €8.6m to shareholders in 2018. A dividend of €10m was paid by FBD Insurance plc to FBD Holdings plc in 2018.
All employees of the Group are employed by FBD Corporate Services Ltd which recharges the costs of the employees to the Group companies being FBD Holdings plc, FBD Insurance plc and FBD Insurance Group Ltd.
All direct general insurance premium for the Group is generated through the intermediary FBD Insurance Group Ltd which is paid commission by FBD Insurance plc for the revenue and incurs expenses related to the sales operations.
Inter-group loans are in place and inter-company transactions arise between the Group companies in the normal course of business.
FBD Holdings plc 2018 Solvency and Financial Condition Report 5
A1.7 Material lines of business and geographical areasFBD Insurance plc underwrites insurance in Commercial, Agri and Consumer segments covering farm, business, home and motor insurance in Ireland.
For Solvency II purposes the company reports under the following lines of business:
1) Motor Vehicle Liability Insurance;
2) Other Motor Insurance;
3) Fire and other damage to property insurance;
4) General Liability Insurance;
5) Income Protection insurance; and
6) Marine, aviation and transport insurance.
Lines of business 5) Income Protection and 6) Marine are combined under ‘Other Insurance’ for the tables in this report.
A1.8 Significant Business or Events during the reporting periodOn 1 October 2018 FBD Holdings plc announced that its subsidiary FBD Insurance plc had entered into an agreement to purchase and cancel the €70,000,000 7% Convertible Notes which were in issue for €86,059,000.
On 2 October 2018 FBD Insurance plc successfully agreed to issue €50,000,000 of new Callable Dated Deferrable Subordinated Notes due 2028. The agreed coupon for the notes was 5%. Interest costs associated with the subordinated notes totalling €589,000 were incurred and recognised during the financial year.
From 30th April 2018, sales, renewal and marketing activity for direct operations were transacted through FBD Insurance Group Ltd trading as FBD Insurance (formerly called FBD Life and Pensions). All customers will deal with one company for all their insurance needs.
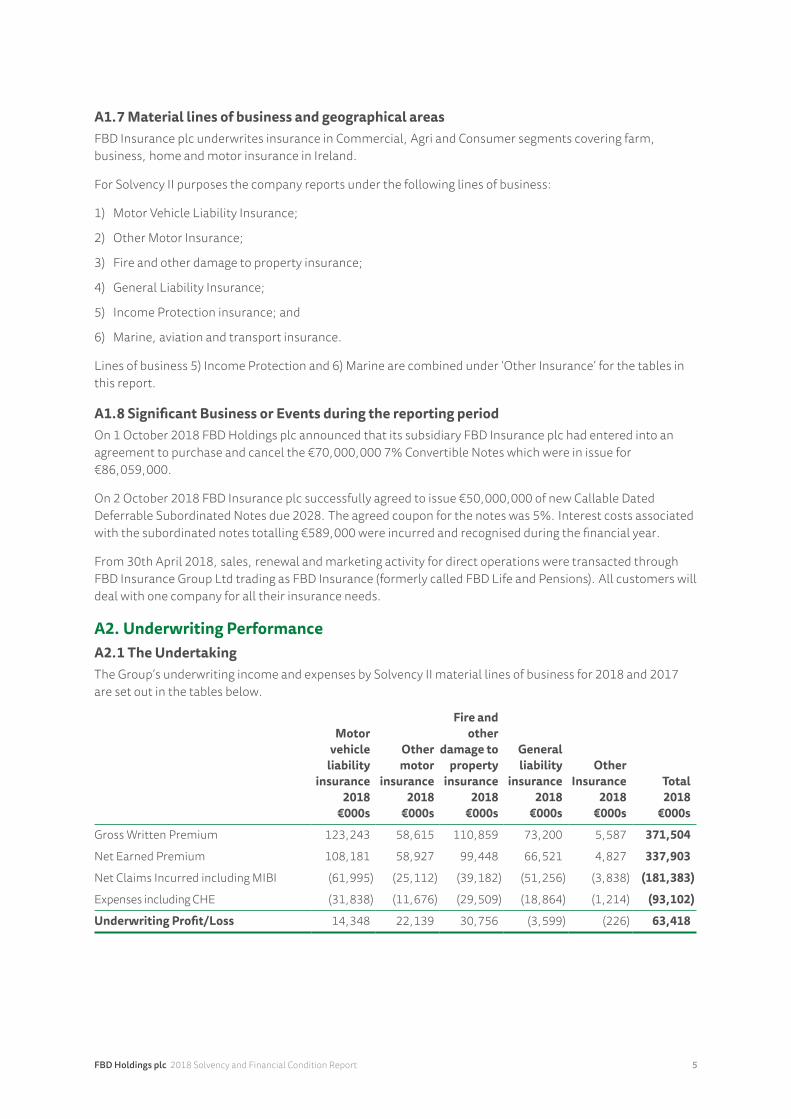
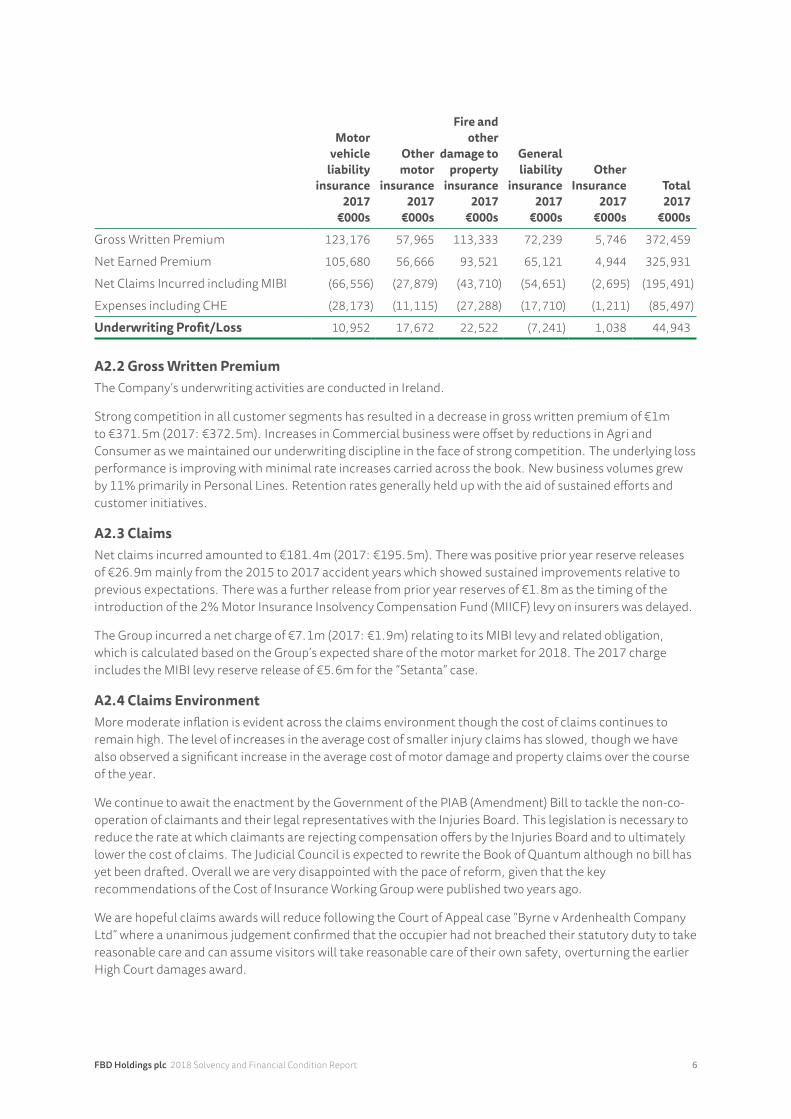
A2. Underwriting PerformanceA2.1 The UndertakingThe Group’s underwriting income and expenses by Solvency II material lines of business for 2018 and 2017 are set out in the tables below.
Motor vehicle
liability insurance
2018 €000s
Other motor
insurance 2018
€000s
Fire and other
damage to property
insurance 2018
€000s
General liability
insurance 2018
€000s
Other Insurance
2018 €000s
Total 2018
€000s
Gross Written Premium 123,243 58,615 110,859 73,200 5,587 371,504
Net Earned Premium 108,181 58,927 99,448 66,521 4,827 337,903
Net Claims Incurred including MIBI (61,995) (25,112) (39,182) (51,256) (3,838) (181,383)
Expenses including CHE (31,838) (11,676) (29,509) (18,864) (1,214) (93,102)
Underwriting Profit/Loss 14,348 22,139 30,756 (3,599) (226) 63,418
FBD Holdings plc 2018 Solvency and Financial Condition Report 6
Motor vehicle
liability insurance
2017 €000s
Other motor
insurance 2017
€000s
Fire and other
damage to property
insurance 2017
€000s
General liability
insurance 2017
€000s
Other Insurance
2017 €000s
Total 2017
€000s
Gross Written Premium 123,176 57,965 113,333 72,239 5,746 372,459
Net Earned Premium 105,680 56,666 93,521 65,121 4,944 325,931
Net Claims Incurred including MIBI (66,556) (27,879) (43,710) (54,651) (2,695) (195,491)
Expenses including CHE (28,173) (11,115) (27,288) (17,710) (1,211) (85,497)
Underwriting Profit/Loss 10,952 17,672 22,522 (7,241) 1,038 44,943
A2.2 Gross Written PremiumThe Company’s underwriting activities are conducted in Ireland.
Strong competition in all customer segments has resulted in a decrease in gross written premium of €1m to €371.5m (2017: €372.5m). Increases in Commercial business were offset by reductions in Agri and Consumer as we maintained our underwriting discipline in the face of strong competition. The underlying loss performance is improving with minimal rate increases carried across the book. New business volumes grew by 11% primarily in Personal Lines. Retention rates generally held up with the aid of sustained efforts and customer initiatives.
A2.3 ClaimsNet claims incurred amounted to €181.4m (2017: €195.5m). There was positive prior year reserve releases of €26.9m mainly from the 2015 to 2017 accident years which showed sustained improvements relative to previous expectations. There was a further release from prior year reserves of €1.8m as the timing of the introduction of the 2% Motor Insurance Insolvency Compensation Fund (MIICF) levy on insurers was delayed.
The Group incurred a net charge of €7.1m (2017: €1.9m) relating to its MIBI levy and related obligation, which is calculated based on the Group’s expected share of the motor market for 2018. The 2017 charge includes the MIBI levy reserve release of €5.6m for the “Setanta” case.
A2.4 Claims EnvironmentMore moderate inflation is evident across the claims environment though the cost of claims continues to remain high. The level of increases in the average cost of smaller injury claims has slowed, though we have also observed a significant increase in the average cost of motor damage and property claims over the course of the year.
We continue to await the enactment by the Government of the PIAB (Amendment) Bill to tackle the non-co-operation of claimants and their legal representatives with the Injuries Board. This legislation is necessary to reduce the rate at which claimants are rejecting compensation offers by the Injuries Board and to ultimately lower the cost of claims. The Judicial Council is expected to rewrite the Book of Quantum although no bill has yet been drafted. Overall we are very disappointed with the pace of reform, given that the key recommendations of the Cost of Insurance Working Group were published two years ago.
We are hopeful claims awards will reduce following the Court of Appeal case “Byrne v Ardenhealth Company Ltd” where a unanimous judgement confirmed that the occupier had not breached their statutory duty to take reasonable care and can assume visitors will take reasonable care of their own safety, overturning the earlier High Court damages award.
FBD Holdings plc 2018 Solvency and Financial Condition Report 7
We continue to vigorously contest suspect claims. We welcome the amendment to the Civil Liability and Courts Act where a judge can dismiss a claim if a claimant gives false evidence having provided a sworn affidavit. This change may act as a deterrent for dishonest or false claims.
The Personal Injuries Commission report published in September 2018 highlighted inconsistencies between Irish and international awards that must be tackled if we are to reduce insurance costs for Irish businesses, farmers and consumers alike.
A2.5 Weather, Claims Frequency and Large ClaimsIn March 2018 Storm Emma was a combination of snow and strong winds which created blizzard like conditions impacting the whole of Ireland, particularly the south. FBD received over 1,200 claims costing €6.6m net of reinsurance and reinstatement premia.
Stabilisation in motor injury frequency continued following reductions in 2016 and 2017.
The projected gross cost of large injury claims (greater than €0.5m) in 2018 is approximately in line with the five year average. While there has been a significant decrease in the number of personal motor large injury claims this year, this has been replaced by a significant increase in the number of employers liability claims, in particular large farm claims. We have also observed an improvement in the development of large claims from 2016 and 2017 relative to previous expectations.
A2.6 ExpensesThe Group’s expense ratio was 24.9% (excluding Claims handling expenses (CHE) of 2.7%) (2017: 23.3%, CHE 2.9%). Other underwriting expenses were €84.1m (excluding Claims handling expenses of €9m), an increase of €8.1m. €4.6m of the increase relates to changes in the reinsurance arrangements and the balance reflects additional IT spend in respect of work for the introduction of GDPR, wage inflation and increased regulatory costs.
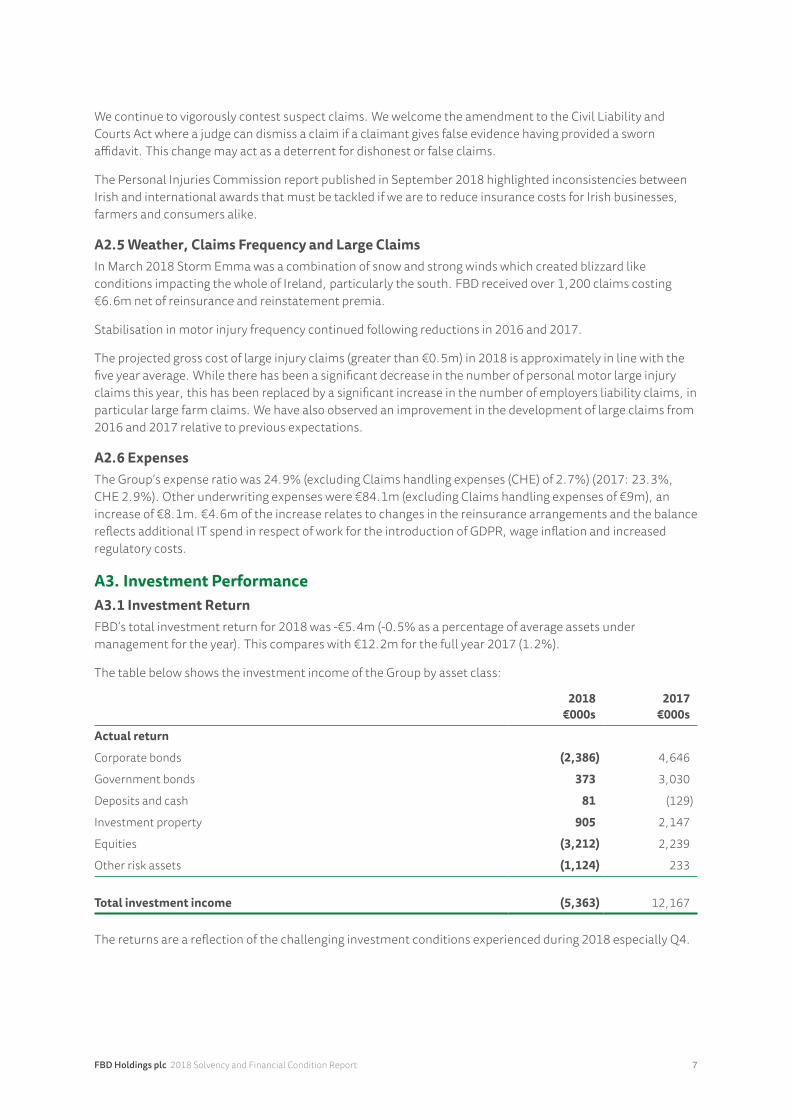
A3. Investment PerformanceA3.1 Investment ReturnFBD’s total investment return for 2018 was -€5.4m (-0.5% as a percentage of average assets under management for the year). This compares with €12.2m for the full year 2017 (1.2%).
The table below shows the investment income of the Group by asset class:
2018€000s
2017€000s
Actual return
Corporate bonds (2,386) 4,646
Government bonds 373 3,030
Deposits and cash 81 (129)
Investment property 905 2,147
Equities (3,212) 2,239
Other risk assets (1,124) 233
Total investment income (5,363) 12,167
The returns are a reflection of the challenging investment conditions experienced during 2018 especially Q4.
FBD Holdings plc 2018 Solvency and Financial Condition Report 8
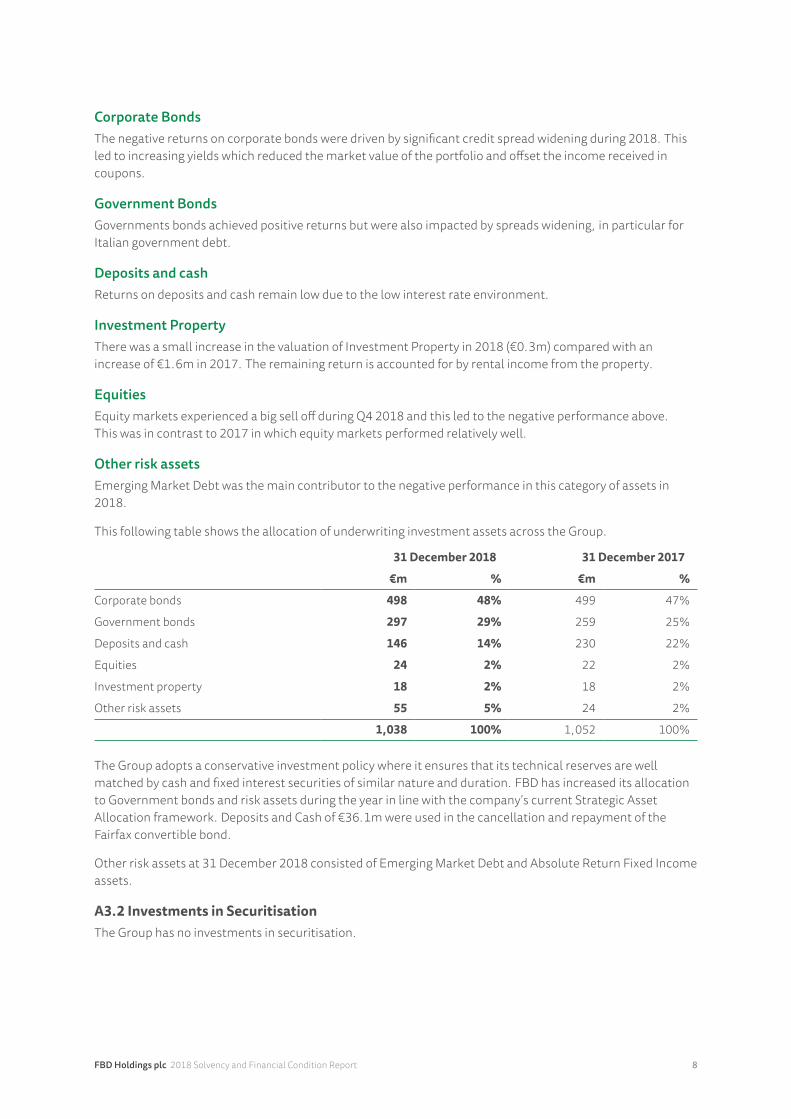
Corporate BondsThe negative returns on corporate bonds were driven by significant credit spread widening during 2018. This led to increasing yields which reduced the market value of the portfolio and offset the income received in coupons.
Government Bonds Governments bonds achieved positive returns but were also impacted by spreads widening, in particular for Italian government debt.
Deposits and cashReturns on deposits and cash remain low due to the low interest rate environment.
Investment PropertyThere was a small increase in the valuation of Investment Property in 2018 (€0.3m) compared with an increase of €1.6m in 2017. The remaining return is accounted for by rental income from the property.
EquitiesEquity markets experienced a big sell off during Q4 2018 and this led to the negative performance above. This was in contrast to 2017 in which equity markets performed relatively well.
Other risk assetsEmerging Market Debt was the main contributor to the negative performance in this category of assets in 2018.
This following table shows the allocation of underwriting investment assets across the Group.
31 December 2018 31 December 2017
€m % €m %
Corporate bonds 498 48% 499 47%
Government bonds 297 29% 259 25%
Deposits and cash 146 14% 230 22%
Equities 24 2% 22 2%
Investment property 18 2% 18 2%
Other risk assets 55 5% 24 2%
1,038 100% 1,052 100%
The Group adopts a conservative investment policy where it ensures that its technical reserves are well matched by cash and fixed interest securities of similar nature and duration. FBD has increased its allocation to Government bonds and risk assets during the year in line with the company’s current Strategic Asset Allocation framework. Deposits and Cash of €36.1m were used in the cancellation and repayment of the Fairfax convertible bond.
Other risk assets at 31 December 2018 consisted of Emerging Market Debt and Absolute Return Fixed Income assets.
A3.2 Investments in SecuritisationThe Group has no investments in securitisation.
FBD Holdings plc 2018 Solvency and Financial Condition Report 9
A4. Other material income and expensesOn 1 October 2018 FBD Holdings plc announced that its subsidiary FBD Insurance plc had entered into an agreement to purchase and cancel the €70,000,000 7% Convertible Notes which were in issue for €86,059,000.
Interest costs associated with the Notes totalling €4,864,000 (2017: €6,298,000) were incurred and recognised during the financial year up to the date of derecognition of the Notes.
Further to the loss on the debt portion of the bond of €11,477,000 in the Consolidated Income Statement, redemption costs of €359,000 were incurred in the period. The total exceptional loss included in the Consolidated Income Statement is €11,836,000.
On 2 October 2018 FBD Insurance plc successfully agreed to issue €50,000,000 of new Callable Dated Deferrable Subordinated Notes due 2028. The agreed coupon for the notes was 5%. Interest costs associated with the subordinated notes totalling €589,000 were incurred and recognised during the financial year.
A5. Other material informationThe Board of FBD Holdings plc proposes to pay a dividend of 50c per share for the 2018 financial year. This is equivalent to a pay-out ratio of approximately 40% in respect of 2018 profits.
FBD Holdings plc 2018 Solvency and Financial Condition Report 10
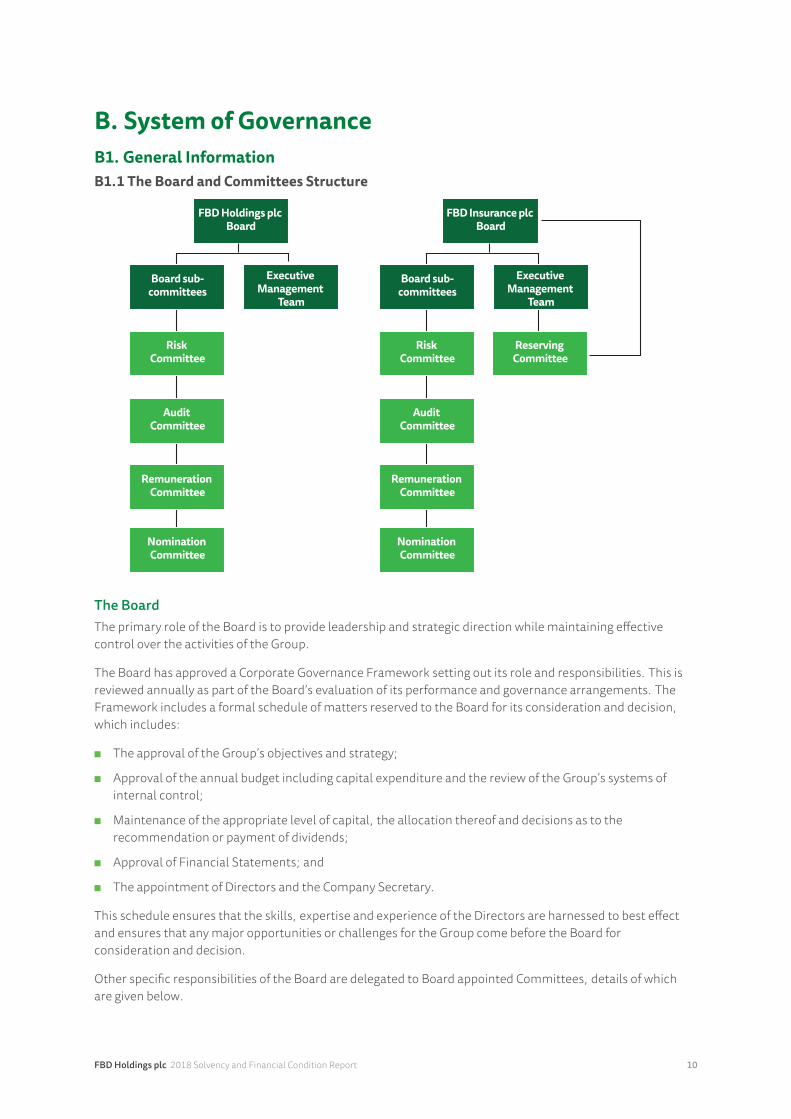
B. System of GovernanceB1. General InformationB1.1 The Board and Committees Structure
FBD Holdings plc Board
Board sub-committees
Risk Committee
Audit Committee
Remuneration Committee
Nomination Committee
Executive Management
Team
FBD Insurance plc Board
Board sub-committees
Risk Committee
Reserving Committee
Audit Committee
Remuneration Committee
Nomination Committee
Executive Management
Team
The BoardThe primary role of the Board is to provide leadership and strategic direction while maintaining effective control over the activities of the Group.
The Board has approved a Corporate Governance Framework setting out its role and responsibilities. This is reviewed annually as part of the Board’s evaluation of its performance and governance arrangements. The Framework includes a formal schedule of matters reserved to the Board for its consideration and decision, which includes:
n The approval of the Group’s objectives and strategy;
n Approval of the annual budget including capital expenditure and the review of the Group’s systems of internal control;
n Maintenance of the appropriate level of capital, the allocation thereof and decisions as to the recommendation or payment of dividends;
n Approval of Financial Statements; and
n The appointment of Directors and the Company Secretary.
This schedule ensures that the skills, expertise and experience of the Directors are harnessed to best effect and ensures that any major opportunities or challenges for the Group come before the Board for consideration and decision.
Other specific responsibilities of the Board are delegated to Board appointed Committees, details of which are given below.
FBD Holdings plc 2018 Solvency and Financial Condition Report 11
Risk CommitteeThe Committee is the forum for risk governance within FBD. It is responsible for providing oversight and advice to the Board in relation to current and potential future risk exposures of the Group and future risk strategy. This advice includes recommending a risk management framework incorporating strategies, policies, risk appetites and risk indicators to the Board for approval. The Risk Committee oversees the risk management function, which is managed by the Chief Risk Officer (CRO).
The key responsibilities delegated to the Committee are to:
n Promote a risk awareness culture within the Group;
n Ensure that the material risks facing the Group have been identified and that appropriate arrangements are in place to manage and mitigate those risks effectively;
n Advise the Board on the effectiveness of strategies and policies with respect to maintaining, on an ongoing basis, the amounts, types and distribution of capital adequate to cover the risks of the Group;
n Review and challenge risk information received by the Chief Risk Officer from the business departments to ensure that the Group is not exceeding the risk limits set by the Board;
n Present a profile of the Group’s key risks, risk management framework, risk appetite and tolerance and risk policies at least annually together with a summary of the Committee’s business to the Board.
Audit CommitteeThe objective of the Committee is to assist the Board in fulfilling its oversight responsibilities for such matters as financial reporting, the system of internal control and management of financial risks, the audit process and the Group’s process for monitoring compliance with laws and regulations.
The key responsibilities delegated to the Committee include:
n Reviewing the Group’s financial results announcements and Financial Statements;
n Reviewing the Solvency II returns;
n Overseeing the relationship with the external auditors including reviewing their terms of engagement, independence and fees;
n Reviewing the scope, resources, results and effectiveness of the Group’s internal audit function; and
n Performing detailed reviews of specific areas of financial reporting as required by the Board or the Committee.
The Committee members have been selected to ensure that the Committee has available to it the range of skills and experience necessary to discharge its responsibilities.
Remuneration CommitteeThe objective of the Committee is to assist the Board in ensuring that the level of remuneration in the Group is sufficient to attract, retain and motivate executive Directors and senior management of the quality required to run the Group in a manner which is fair and in line with market norms, while not exposing the Group to unnecessary levels of risk.
The key responsibilities delegated to the Committee include:
n Determining the broad policy for the remuneration of the Group’s executive Directors, Company Secretary and other senior executives;
n Determining the total remuneration packages for the foregoing individuals, including salaries, variable remuneration, pension and other benefit provision and any compensation on termination of office;
n Ensuring that the Group operates to recognised good governance standards in relation to remuneration;
n Making awards of shares under the Group’s approved long term incentive plan; and
n Preparation of the detailed Report on Directors’ Remuneration.
FBD Holdings plc 2018 Solvency and Financial Condition Report 12
Nomination CommitteeThe objective of the committee is to ensure that the Board and its Committees are made up of individuals with the necessary skills, knowledge and experience to ensure that the Board is effective in discharging its responsibilities.
The key responsibilities delegated to the Committee include:
n Reviewing the structure, size and composition of the Board and making recommendations to the Board for any appointments or other changes;
n Recommending changes to the Board’s committees; and
n Advising the Board in relation to succession planning both for the Board and the senior executives in the Group.
Reserving CommitteeThe Executive Management Team established a Reserving Committee for the Company with independent Non-Executive Directors as members, with formal terms of reference and with responsibility, inter alia, for the following:
n On a quarterly basis to review the adequacy of reserves and to recommend to the Board the level of Best Estimate for inclusion in the financial statements;
n The review of the adequacy of Solvency II Technical Provisions and recommend for inclusion in regulatory returns;
n The review of all reports of the Head of Actuarial Function as to the adequacy of reserves and reporting to the Board of Directors thereon;
n The review of all reports of the Peer Review Actuary and any reports made available by the external auditors; and
n Agreement of the risk appetite for reserving risk and the recommendation of said agreement to the Board Risk Committee and the Board.
The Committee has full access to the Group’s Head of Actuarial Function and any other person as deemed necessary by the Committee to effectively carry out its functions.
B1.2 Key RolesThe ChairmanThe role of the Chairman is set out in writing in the Corporate Governance Framework. He is responsible, inter alia, for:
n The effective running of the Board, setting its agenda and ensuring that it receives accurate, timely and clear information;
n Ensuring that the Board as a whole plays a full and constructive part in the development and determination of the Group’s strategy and overall commercial objectives; and
n Ensuring that the views of shareholders are communicated to the Board.
The Group Chief ExecutiveThe role of the Group Chief Executive is set out in writing in the Corporate Governance Framework. She is responsible, inter alia, for:
n Running the Group’s business;
n Proposing and developing the Group’s strategy and overall objectives in close consultation with the Chairman and the Board; and
n Implementing the decisions of the Board and its Committees.
FBD Holdings plc 2018 Solvency and Financial Condition Report 13
The Executive Management TeamThe Group Chief Executive has established an Executive Management Team (“EMT”) comprising senior Group executives to assist her in the discharge of her responsibilities for the Group’s performance, operations and compliance.
The composition of this team is a matter for the decision of the Group Chief Executive and its role and responsibilities include:
n Managing the day to day running of the Group’s business;
n Formulating the Group’s strategic plans for the approval of the Board;
n Communicating the standards of performance, strategy and goals of the Group to meet the objectives approved by the Board;
n Leading the implementation of the agreed programme of priority development initiatives;
n Reviewing and communicating progress against the goals, providing direction to the Group’s employees, removing barriers to achieving the goals and allocating the Group’s resources to the areas of greatest importance;
n Advising the Board, through the Group Chief Executive, on all matters concerning organisational strategy and performance.
B1.3 Authority and independence of key functionsThe control functions report regularly to the Board on the effectiveness of the System of Governance including the Internal Control System. The control functions are defined as the Risk Function, Compliance Function, Internal Audit Function, and Actuarial Function.
The Group uses a ‘three lines of defence’ framework in the delineation of accountabilities for internal control.
n Primary responsibility for risk management rests with line management;
n Line management is supported by the second line Risk, Actuarial and Compliance Functions;
n The third and final line of defence is the Internal Audit function, which provides independent assurance to the Audit Committee of the Board on risk taking activities.
The 2nd and 3rd Line of defence functions have defined Terms of Reference (ToR) reviewed at least annually by the appropriate committee.
Risk FunctionThe Board has established a Risk Function, headed by an appointed Chief Risk Officer. The Risk Function has independent oversight of the Group risk management activities with specific responsibility for ensuring that the Group’s risk management framework is documented and implemented and that its risk management procedures are carried out effectively. The Risk Function acts as a second line of defence in the FBD’s Risk Management Framework.
The Risk Function’s terms of reference states that the function shall have full, unrestricted access to all information, explanations, records, and personnel necessary for the purposes of the identification, assessment, monitoring and reporting of risk to the Board Risk Committee and the Board.
Compliance FunctionThe Board has established a Compliance Function, headed by an appointed Head of Compliance. The Compliance Function acts in an advisory, oversight and assurance role to ensure that the Group has the necessary systems and controls in place to ensure adherence, on an on-going basis, to its legal and regulatory requirements. The Compliance Function acts as a second line of defence in the FBD’s Risk Management Framework.
FBD Holdings plc 2018 Solvency and Financial Condition Report 14
The Compliance Function’s Terms of Reference states that the function shall have full unrestricted access to all information, explanations, records, and personnel necessary for the purposes of the identification, assessment, monitoring and reporting of compliance to Senior Management and the Board.
Actuarial FunctionThe Board has established an Actuarial Function, headed by an appointed Head of Actuarial Function. The Actuarial Function co-ordinates the calculation of Technical Provisions and provides an Opinion and accompanying report on the Technical Provisions to the Board and the Central Bank of Ireland.
In addition, the Actuarial Function prepares an Opinion on the Underwriting Policy, Reinsurance arrangements and the ORSA. The Actuarial Function acts as a second line of defence in FBD’s Risk Management Framework.
Internal Audit FunctionThe Board has established an Internal Audit Function, headed by an appointed Head of Internal Audit. Internal Audit is an independent function reporting to the Board through the Audit Committee. Internal Audit acts as the third line of defence in the FBD Risk Management Framework and examines and evaluates the functioning of the internal controls and all other elements of the system of governance, as well as the compliance of activities with internal strategies, policies, processes and reporting procedures.
B1.4 Material changes during the periodThere were no changes to the Board in 2018. The table below sets out the Directors who served during 2018:
Liam Herlihy Chairman
Walter Bogaerts Independent Non-Executive Director
Mary Brennan Independent Non-Executive Director
Dermot Browne Senior Independent Non-Executive Director
Joe Healy Independent Non-Executive Director
Orlagh Hunt Independent Non-Executive Director
Fiona Muldoon Group Chief Executive
David O’Connor Independent Non-Executive Director
John O’Grady Group Chief Financial Officer
Padraig Walshe Non-Executive Director
Ms. Orlagh Hunt and Mr. Dermot Browne have announced their intention not to stand for re-election at the AGM. The Board is in the process of replacing the retiring independent non-executive directors.
B1.5 Remuneration policy and practicesThe Group’s Remuneration Policy is determined by the Board of FBD Holdings plc through the Remuneration Committee.
It is the policy of the Group to provide all employees of FBD with appropriate remuneration and incentives to encourage high performance and to ensure that they are, in a fair and responsible manner, rewarded for their individual contributions which are aligned to the success of FBD while also ensuring that the principles of sound, prudent risk management are fully reflected and that excessive risk taking is neither encouraged nor rewarded.
The remuneration of the non-executive Directors of the Group is determined by the Board. The individual remuneration packages of Senior Executives are determined by the Remuneration Committee who report to the Board.
FBD Holdings plc 2018 Solvency and Financial Condition Report 15
B1.5.1 Components of RemunerationFixed RemunerationThe core element of the remuneration package for all employees is fixed remuneration comprising basic salary and membership of a pension scheme.
Basic salary is reviewed annually having regard to personal performance, Group performance and competitive market practice.
Variable RemunerationVariable remuneration, which is based on individual and Group performance, is available to be awarded to all eligible permanent employees and varies by amount and structure depending on role but in all cases is designed to encourage and reward enhanced performance, whilst promoting sound risk management.
1. Short Term IncentivesBonus – Head Office Employees and ManagementShort Term Incentives comprise annual bonuses.
For the majority of employees, the attainment of Group financial targets determines the amount of annual bonus which may be available to any employee. These targets encourage enhanced performance in the best interests of the Group and its Shareholders and are approved by the Remuneration Committee. After the financial targets have been measured, the individual performance of the employee will be assessed against agreed performance objectives. This will determine the amount of annual bonus available to be paid.
The Remuneration Committee approves the annual bonus payable to each of the Senior Executives.
Sales IncentivesSales employees’ bonus arrangements are based on the achievement of KPIs which are agreed annually including targets for such matters as gross written premium, retention levels, discretionary discounts ceded, compliance standards and business quality. Any bonus or variable pay proposals are in compliance with Central Bank of Ireland “Guidelines for Variable Remuneration Arrangements for Sales Staff”.
2. Long Term IncentivesUnder the Long Term Incentive Plan (LTIP), conditional awards of shares in FBD Holdings plc are made at the sole discretion of the Remuneration Committee of FBD Holdings plc to any FBD Group executive or employee so designated by it. The awards are made within the terms of the shareholder approved scheme.
The period over which the performance conditions applying to a conditional LTIP award are measured is currently over three years.
These conditions are designed to ensure alignment between the interests of the employees and those of FBD Holdings plc’s shareholders, to incentivise retention of key individuals and to encourage appropriate focus on long-term sustainable business performance.
The Chief Risk Officer of the Group is consulted prior to any proposed conditional award by the Remuneration Committee to Executives or employees of the Group to ensure that the conditions attaching to any award do not encourage excessive taking of risk.
FBD Holdings plc 2018 Solvency and Financial Condition Report 16
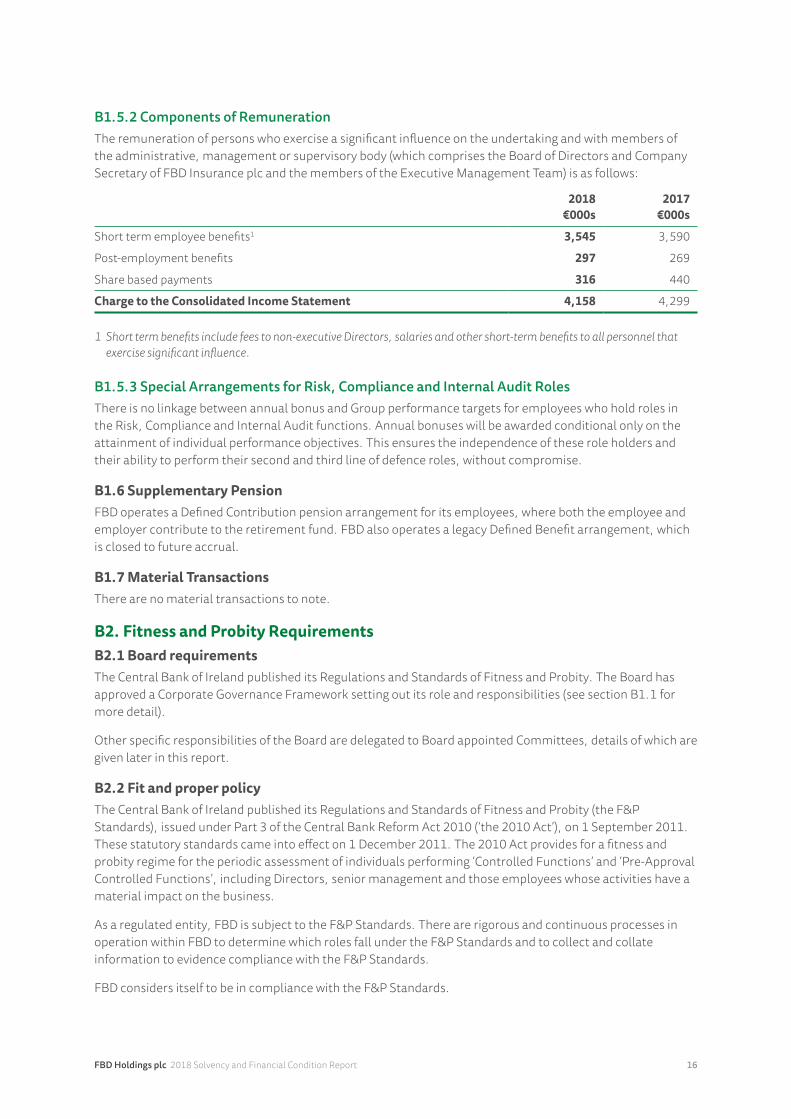
B1.5.2 Components of RemunerationThe remuneration of persons who exercise a significant influence on the undertaking and with members of the administrative, management or supervisory body (which comprises the Board of Directors and Company Secretary of FBD Insurance plc and the members of the Executive Management Team) is as follows:
2018€000s
2017€000s
Short term employee benefits1 3,545 3,590
Post-employment benefits 297 269
Share based payments 316 440
Charge to the Consolidated Income Statement 4,158 4,299
1 Shorttermbenefitsincludefeestonon-executiveDirectors,salariesandothershort-termbenefitstoallpersonnelthatexercisesignificantinfluence.
B1.5.3 Special Arrangements for Risk, Compliance and Internal Audit RolesThere is no linkage between annual bonus and Group performance targets for employees who hold roles in the Risk, Compliance and Internal Audit functions. Annual bonuses will be awarded conditional only on the attainment of individual performance objectives. This ensures the independence of these role holders and their ability to perform their second and third line of defence roles, without compromise.
B1.6 Supplementary PensionFBD operates a Defined Contribution pension arrangement for its employees, where both the employee and employer contribute to the retirement fund. FBD also operates a legacy Defined Benefit arrangement, which is closed to future accrual.
B1.7 Material TransactionsThere are no material transactions to note.
B2. Fitness and Probity RequirementsB2.1 Board requirementsThe Central Bank of Ireland published its Regulations and Standards of Fitness and Probity. The Board has approved a Corporate Governance Framework setting out its role and responsibilities (see section B1.1 for more detail).
Other specific responsibilities of the Board are delegated to Board appointed Committees, details of which are given later in this report.
B2.2 Fit and proper policyThe Central Bank of Ireland published its Regulations and Standards of Fitness and Probity (the F&P Standards), issued under Part 3 of the Central Bank Reform Act 2010 (‘the 2010 Act’), on 1 September 2011. These statutory standards came into effect on 1 December 2011. The 2010 Act provides for a fitness and probity regime for the periodic assessment of individuals performing ‘Controlled Functions’ and ‘Pre-Approval Controlled Functions’, including Directors, senior management and those employees whose activities have a material impact on the business.
As a regulated entity, FBD is subject to the F&P Standards. There are rigorous and continuous processes in operation within FBD to determine which roles fall under the F&P Standards and to collect and collate information to evidence compliance with the F&P Standards.
FBD considers itself to be in compliance with the F&P Standards.
FBD Holdings plc 2018 Solvency and Financial Condition Report 17
B2.3 Selection due diligenceThe Company operates robust HR recruitment and selection controls which ensure that we select only candidates that meet the F&P Standards. These controls include appropriate screening of candidates and the completion of the Central Bank’s Individual Questionnaire by all PCF preferred candidates prior to their engagement. This includes screening for amongst other things; educational qualification and work experience; bankruptcy and debt judgments and regulatory sanctions.
In addition, our employment contract terms require continuing adherence to all regulatory standards including, amongst others, the F&P Standards and Minimum Competency Code (MCC) obligations.
B2.4 Continuous due diligenceThe Group operates a continuous due diligence programme which covers all Directors, senior executives and employees across the Group. Under this programme, training and a questionnaire are completed annually by Controlled Function and Pre-Approval Controlled Function role holders.
Validation and assessment of completed Individual Questionnaires is independently undertaken by HR in consultation with Compliance. Where this review causes the Chief HR Officer and the Head of Compliance to form the opinion that there is reason to believe or suspect a person’s fitness and probity to perform the relevant function, a formal process may be conducted which may result in the person being removed from carrying out the regulated function. Such circumstance may include, but is not limited to, material or undeclared judgements; criminal or civil convictions or regulatory censure. In assessing the impact of these circumstances, FBD takes into consideration all relevant matters including the circumstances surrounding the issue; the length of time since the issue; the explanation given; the proposed role and its impact.
B3. Risk Management SystemB3.1 Risk Management FrameworkFBD has adopted an Enterprise Risk Management Framework which comprises of strategies, policies, processes and reporting procedures necessary to identify, assess, monitor, manage and report, on a continuous basis the risks, at an individual and at an aggregated level, to which the Group could be exposed. The key elements of the Enterprise Risk Management framework are governance, process and people. FBD has established procedures to monitor and report on the system of controls and it follows the three lines of defence model outlined previously.
Key components of monitoring and reporting of the system of control include:
n Business Unit Quality Assurance;
n Business Unit Management Information;
n Risk Control Self-Assessment;
n Error Reporting;
n First Line Reviews;
n Second Line Reviews;
n Third Line Internal Audits; and
n Board/Executive Committee Reporting.
FBD Holdings plc 2018 Solvency and Financial Condition Report 18
B3.2 Risk Implementation and IntegrationAll staff are expected to demonstrate appropriate standards of behaviour in the development of strategy and the pursuit of objectives. This philosophy is supported by the following guiding principles. Management and employees shall:
n Consider all forms of risk in decision-making;
n Create and evaluate business-unit level and Group-level risk profile to consider what’s best for their individual business unit and department and what’s best for the Group as a whole;
n Support executive management’s creation of a Group-level portfolio view of risk;
n Retain ownership and accountability for risk and risk management at the business unit or other point of influence level;
n Strive to achieve best practices in enterprise risk management;
n Monitor compliance with policies and procedures and the state of enterprise risk management;
n Leverage existing risk management practices, wherever they exist within the Group;
n Document and report all significant risks and enterprise risk management deficiencies; and
n Accept that enterprise risk management is mandatory, not optional.
Roles and ResponsibilitiesWhile the Board has ultimate responsibility for all risk-taking activity within the Group, it has delegated some risk governance tasks to a number of committees or key officers. The Group uses a ‘three lines of defence’ framework in the delineation of accountabilities for risk governance as outlined in B 1.3.
The Risk Management Function maintains a Corporate Risk Register with each risk assigned to a Risk Owner and a Risk Champion in the Business.
Line Management/Risk OwnerThe first line of defence within each business and support unit is Line Management. Line management has primary responsibility for ensuring that the business complies with their specific obligations. In addition, the first line of defence is responsible for working with the Risk Management Function to identify, assess, monitor and report risk. Line management is also responsible for ensuring that all staff members receive appropriate training.
Risk ChampionRisk Champions report to their departmental manager with a dotted line to the Chief Risk Officer. These individuals are well placed in FBD Insurance to ensure the continuous monitoring and reporting of their risk and control environment.
Risk Appetite FrameworkRisk appetite is a measure of the amount and type of risks FBD is willing to accept or not accept over a defined period of time in pursuit of its objectives. The Risk Appetite Framework defines FBD’s appetite for each main risk category describing at a high level the type of risk we are willing to take.
The Group’s appetite is to maintain sustainable profit and a strong capital position while acting in the best interests of consumers. The risk appetite in FBD is driven by an overarching desire to protect the solvency of the Group at all times. Through the proactive management of risk, FBD ensures that it does not currently have or will not take on an individual risk or combination of risks that could threaten the solvency of the Group. This ensures that FBD has and will have in the future sufficient capital to pay its policyholders and all other creditors in full as these liabilities fall due.
FBD Holdings plc 2018 Solvency and Financial Condition Report 19
The management of risks are outlined further in Section C of this report. The Risk Appetite Framework is reviewed and approved at least annually by the Board and is monitored and reported by the Risk Function in order to support and embed risk in the decision making process of the Group.
Risk PoliciesThe Group has developed a number of risk management policies which clearly set out the following:
n Definition of risk;
n Objective;
n Roles and Responsibilities;
n Processes; and
n Reporting procedures to be applied.
The risk policies are reviewed at least annually by the Board or more frequently if the system, or area concerned, undergoes significant change.
B4. The Own Risk and Solvency Assessment (ORSA) ProcessB4.1 ORSA Process OverviewAn ORSA policy has been documented and is approved by the Board annually.
The ORSA report is prepared annually and reviewed by the Board.
The Group has in place processes for managing its overall solvency needs and regulatory capital requirements and integrating the strategic development process with the management of all material risks to which it is exposed.
The Board is made aware of the implications that strategic decisions have on the risk profile, regulatory capital requirements and overall solvency needs of the Group and to consider whether these effects are desirable, affordable and feasible given the quantity and quality of its capital. The output from the ORSA assists the Board in making strategic decisions including in relation to:
n Capital Management Policy;
n Adequacy of Risk Appetite; and
n Business planning.
Following the output from the ORSA, where necessary, management actions are developed.
Any strategic or other major decisions that may materially affect the risk and/or capital position of the Group need to be considered through the ORSA process before such a decision is taken. This does not require a full performance of the ORSA. The Group consider how the output of the last assessment of the overall solvency needs changes if certain decisions are taken and how these decisions affect the regulatory capital requirements.
The ORSA provides a comprehensive view and understanding of the risks the Group is exposed to or could face in the future and how they translate into capital requirements or alternatively require mitigation actions. The ORSA process and output is communicated to the Board and Executive Management via the Internal Report on ORSA.
The Internal Report on ORSA is prepared by the Chief Risk Officer and presented to the Board Risk Committee and Board for approval. The information communicated is sufficiently detailed to ensure that the Board Risk Committee and Board is able to use it in its strategic decision-making process and that other employees can ensure that any necessary follow-up action on foot of the report is taken.
The Board is responsible for challenging and approving the results of the ORSA.
FBD Holdings plc 2018 Solvency and Financial Condition Report 20
B4.2 ORSA Approval by the Administrative, Management or Supervisory Body (AMSB)The ORSA is a top down process owned by the Board. It is an ongoing process which ensures that the business is managed soundly and prudently by identifying, assessing and monitoring current and future solvency needs in light of all the risks faced. FBD must submit at least one ORSA Report to the Central Bank of Ireland each year.
The ORSA is a very important process for the Board as it provides it with a comprehensive view and understanding of the risks to which the Group is exposed or could face in the future and how they translate into capital needs or alternatively require mitigating actions.
To aid in the assessment of the overall solvency needs and business and capital planning process, the Group will carry out a number of stress tests, reverse stress tests and scenario analyses.
The nature and number of stress and scenario tests is initially developed by the Risk Function with input from key stakeholders. The stress and scenarios chosen take into account the material risks facing the Group, external environment and likelihood of occurring based on historical analysis. These are presented to the Board Risk Committee for review and challenge and to the Board for review, challenge and approval.
The following are documented as part of the stress testing:
n Source of data used;
n Stress test assumptions used;
n Method of stress testing used; and
n Conclusion and action plan if necessary.
The ORSA Supervisory Report is prepared by the Chief Risk Officer and is subject to Board Risk Committee and Board approval prior to submission to the Central Bank. The ORSA Supervisory Report is the same as the internal report unless otherwise determined by the Board.
B4.3 Overall Solvency NeedsFBD’s overall solvency needs are assessed at least annually as part of the ORSA process. The assessment takes into account the specific risk profile, approved risk tolerance limits and the business strategy of the Group.
A key part of this assessment is to review the significance of any deviation between the risk profile of FBD and the assumptions underlying the Standard Formula SCR calculation.
Our approach to this assessment of the appropriateness of the Standard Formula is as follows:
n Assess, from a qualitative perspective, if key assumptions for each module and sub-module in the Standard Formula are appropriate for capturing the risks specific to the Company.
n For any key assumption assessed as potentially inappropriate to the Company, a further qualitative assessment is carried out to determine if any deviation is likely to materially impact the overall SCR.
n Where a key assumption is assessed as both potentially inappropriate and also likely to have a material impact on the overall SCR a quantitative assessment is carried out to better capture the risk exposure for the Company.
n On completion of the quantitative assessment the overall appropriateness of SCR is determined for the Company.
As part of the overall solvency needs assessment the Company’s Strategy and Business Plan is considered. Base case financial projections covering the FBD planning cycle period are developed. Based on these financials the Company’s capital position is projected over a three year period. This capital projection is then subjected to a number of stress tests, reverse stress tests and scenario analyses. Based on the outputs of these tests the Company reviews the appropriateness of their Capital Risk Appetite.
FBD Holdings plc 2018 Solvency and Financial Condition Report 21
B5. Internal Control SystemB5.1 Internal Control EnvironmentFBD has in place an internal control system that encompasses the policies, processes, tasks, behaviours and other aspects of the Group that, taken together:
n Facilitate its effective and efficient operation by enabling it to respond appropriately to significant business, operational, financial, compliance and other risks to achieving the Group’s objectives. This includes the safeguarding of assets from inappropriate use or from loss and fraud, and ensuring that liabilities are identified and managed;
n Help ensure the quality of internal and external reporting. This requires the maintenance of proper records and processes that generate a flow of timely, relevant and reliable information from within and outside the organisation; and
n Help ensure compliance with applicable laws and regulations, and also internal policies with respect to the conduct of business.
The Group’s system of internal control comprises:
n Internal control framework;
n Identification and evaluation of risks and control objectives;
n Control activities;
n Information and communication;
n Monitoring and reporting of controls;
n Processes for reviewing the effectiveness of the internal control system.
The Internal Control Framework is the mechanism under which internal controls are developed, implemented, and monitored. It consists of the processes and arrangements that ensure internal and external risks to which FBD is exposed are identified; appropriate and effective internal controls are developed and implemented to soundly and prudently manage these risks; and reliable and comprehensive systems are put in place to appropriately monitor the effectiveness of these controls. FBD has in place an appropriate and effective internal control environment to ensure that the Group is managed and controlled in a sound and prudent manner. The Control Framework is the foundation for all the principles of the Internal Control Policy which provides the discipline, process and structure.
The factors which together comprise the control environment are:
n A Board of Directors that is actively concerned with sound corporate governance and that understands and diligently discharges its responsibilities by ensuring that FBD is appropriately and effectively managed and controlled;
n A management that actively manages and operates FBD in a sound and prudent manner;
n The Board and all FBD employees demonstrate a commitment to integrity and values;
n Organisational and procedural controls supported by an effective management information system to soundly and prudently manage FBD’s exposure to risk; and
n The utilisation of a ‘three lines of defence’ framework in the delineation of accountabilities for internal control as outlined in B1.3, which incorporates an independent audit mechanism to monitor the effectiveness of the organisational and procedural controls.
FBD Holdings plc 2018 Solvency and Financial Condition Report 22
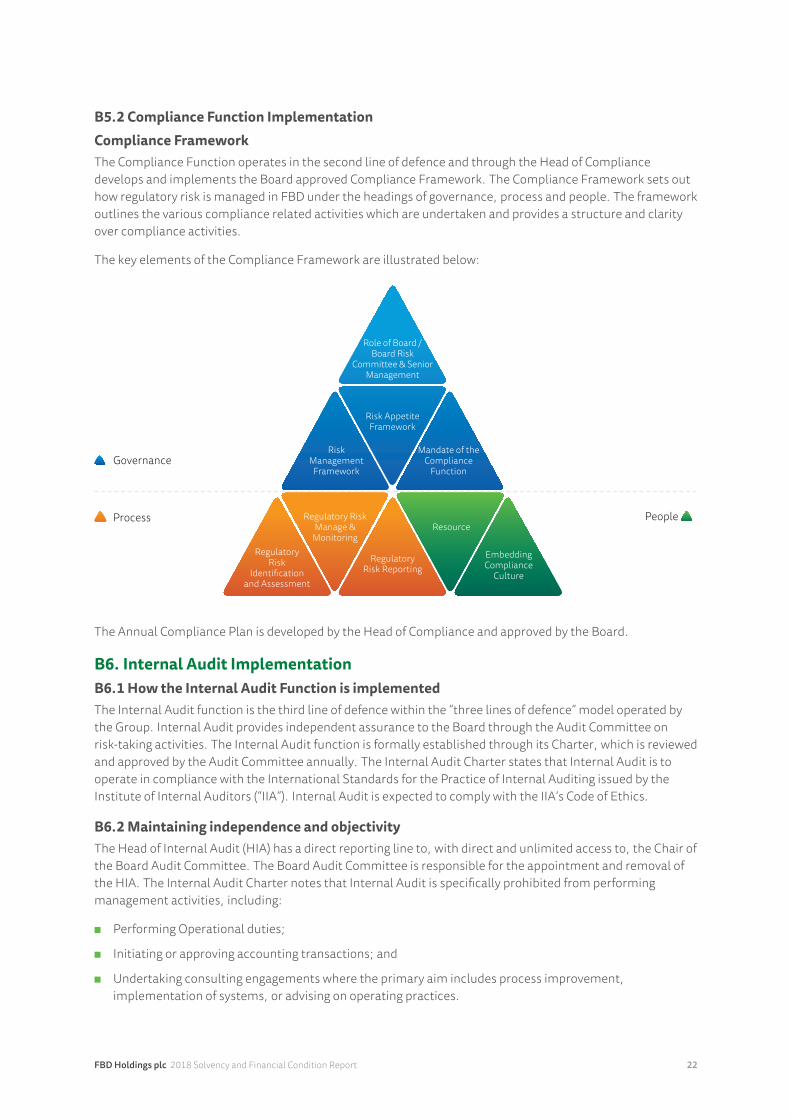
B5.2 Compliance Function ImplementationCompliance FrameworkThe Compliance Function operates in the second line of defence and through the Head of Compliance develops and implements the Board approved Compliance Framework. The Compliance Framework sets out how regulatory risk is managed in FBD under the headings of governance, process and people. The framework outlines the various compliance related activities which are undertaken and provides a structure and clarity over compliance activities.
The key elements of the Compliance Framework are illustrated below:
The Annual Compliance Plan is developed by the Head of Compliance and approved by the Board.
B6. Internal Audit ImplementationB6.1 How the Internal Audit Function is implementedThe Internal Audit function is the third line of defence within the “three lines of defence” model operated by the Group. Internal Audit provides independent assurance to the Board through the Audit Committee on risk-taking activities. The Internal Audit function is formally established through its Charter, which is reviewed and approved by the Audit Committee annually. The Internal Audit Charter states that Internal Audit is to operate in compliance with the International Standards for the Practice of Internal Auditing issued by the Institute of Internal Auditors (“IIA”). Internal Audit is expected to comply with the IIA’s Code of Ethics.
B6.2 Maintaining independence and objectivityThe Head of Internal Audit (HIA) has a direct reporting line to, with direct and unlimited access to, the Chair of the Board Audit Committee. The Board Audit Committee is responsible for the appointment and removal of the HIA. The Internal Audit Charter notes that Internal Audit is specifically prohibited from performing management activities, including:
n Performing Operational duties;
n Initiating or approving accounting transactions; and
n Undertaking consulting engagements where the primary aim includes process improvement, implementation of systems, or advising on operating practices.
Role of Board / Board Risk
Committee & Senior Management
Risk Appetite Framework
Regulatory Risk Reporting
Embedding Compliance
Culture
Regulatory Risk
Identification and Assessment
Risk Management
Framework
Regulatory Risk Manage &
MonitoringResource
Mandate of the Compliance
Function Governance
Process People
FBD Holdings plc 2018 Solvency and Financial Condition Report 23
The Charter also notes that in order to minimise the risk of conflicts of interest the HIA will, where possible taking into account the size of the audit team, rotate members of audit team assigned to audits that they have participated in previously. Lastly, the Internal Audit Manual states: “To maintain independence Internal Audit staff are required to refrain from assessing operations for which they were responsible within the preceding 12 months and specific operations where there is a personal conflict of interest”.
B7. Actuarial Function ImplementationB7.1 DescriptionThe Actuarial Function is part of the second line of defence within the “three lines of defence” model operated by the Group. The Actuarial Function is responsible for calculating the Best Estimate Technical Provisions and expressing an Opinion on the Technical Provisions, the underwriting policy, the adequacy of reinsurance arrangements and the ORSA.
The Actuarial Function annual activities are prescribed within a Terms of Reference that is reviewed by the Reserving Committee annually. The Actuarial Function shall have full, unrestricted access to all information, explanations, records, and personnel necessary for the completion of those activities.
B7.2 ReportingThe Head of Actuarial Function reports directly to the Chief Financial Officer. Also, the Head of Actuarial Function has access to the independent Non-Executive Directors of the Reserving Committee.
The Head of Actuarial Function presents all Opinions to the necessary Board Committee’s and the Board on an annual basis. In addition, results from quarterly reserving analyses and other material analyses are reported to the Reserving Committee and the Board.
B8. Outsourcing PolicyFBD Holdings plc (FBD) outsources a number of processes, services or activities to service providers to assist in achieving its strategic objectives and delivering a high level of service to its customers. The purpose of the Outsourcing Policy is to provide guidance governing the definition of outsourcing and material outsourcing:
n Policy principles;n Roles and responsibilities;n Business Case;n Due Diligence;n Business Continuity;n Contract Agreements;n Relationship Management Framework;n Management of Outsourced Activity; andn Outsourcing records.
The outsourcing arrangements in place for the Group are reviewed annually in line with the policy and the Board approve all “Material Outsourcing” arrangements.
Service Provided Jurisdiction
Co-location of the data centre, Managed Services including System Monitoring, Data Backup/Restores, Web Hosting for ecommerce and Security
Ireland
Management of the Corporate Bond Portfolio UK*
Management of the Sovereign Bond Portfolio UK**
Management of the Collective Investment Undertakings Ireland
Claims Registration/Investigation/Handling/Payment processes for property claims Ireland
* TheCorporateBondPortfolioiscurrentlymanagedbyaUKlegalentitybutthemanagerhasitsheadquartersinanEU27country.FBDhasconfirmeditwillnotexperienceanydisruptionofserviceintheeventofano-dealBrexit.
**OurSovereignBondPortfolioiscurrentlymanagedbyaUKlegalentitywhichhasapprovaltotransferitsdomiciletoIrelandifrequired.

FBD Holdings plc 2018 Solvency and Financial Condition Report 24
B9. Adequacy of System of GovernanceThe Systems of Governance is considered to be appropriate for FBD, taking into account the nature, scale and complexity of the risks inherent in the business.
B10. Other Material InformationNo other material information to be disclosed.
FBD Holdings plc 2018 Solvency and Financial Condition Report 25
C. Risk ProfileIn accordance with Group policy, business unit management has primary responsibility for the effective identification, management, monitoring and reporting of risks. There is an annual review by the Risk Committee of all major risks to ensure all risks are identified and evaluated. Each risk is assessed by considering the potential impact and the probability of the event occurring. Impact assessments are made against financial, operational, regulatory and reputational criteria.
C1. Underwriting riskUnderwritingThe Group has developed its insurance underwriting strategy to diversify the type of insurance risks written and, within each of the types of cover, to achieve a sufficiently large population of risks to reduce the variability of the expected outcome. The principal insurance covers provided by the Group include, motor, employers’ and public liability and property.
The Group manages these risks through its underwriting strategy, proactive claims handling and its reinsurance arrangements. The Group has developed its insurance underwriting strategy to diversify the type of insurance risks written and to reduce the variability of the expected outcome by each risk category. The only significant concentration of insurance risk is that all of the Group’s underwriting business is conducted in Ireland. Within Ireland there is no significant concentration risk in any one area.
The Group’s underwriting strategy is incorporated in the overall corporate strategy which is approved by the Board of Directors and includes the employment of appropriately qualified underwriting personnel; the targeting of certain types of business that conform with the Group’s risk appetite and reinsurance treaties; constant review of the Group’s pricing policy using up-to-date statistical analysis and claims experience; and the surveying of risks carried out by experienced personnel. All risks underwritten are within the Company’s underwriting policies.
ReservingWhile the Group’s underwriting risk appetite is constantly reviewed and managed, there is no certainty that the cost of claims will not rise due to abnormal weather events, increased claims frequency, increased severity, changes in regulatory environment, change in economic activity or any other reason. Such an increase could have a material impact on the results and financial condition of the Group.
The Group establishes provisions for unpaid claims, legal costs and related expenses to cover its ultimate liability in respect of both reported claims and incurred but not reported (IBNR) claims. These provisions take into account both the Group’s and the industry’s experience of similar business, historical trends in reserving patterns, loss payments and pending levels of unpaid claims and awards, as well as any potential changes in historic rates arising from market or economic conditions. The provision estimates are subject to rigorous review and challenge by senior management, the Reserving Committee and the Board.
The estimation and measurement of claims provisions is a major determining factor in the Group’s results and financial position. The Group uses statistical and actuarial methods to calculate the quantum of claims provisions and uses independent actuaries to review its liabilities to ensure that the carrying amount of the liabilities is adequate. Where the liabilities, net of any related deferred acquisition costs, are deemed to be inadequate, the deficiency is recognised immediately in the Consolidated Income Statement. There is no certainty that the amount provided is sufficient – further claims could arise or settlement costs could increase as a result of claims inflation, periodic payments or the size of court awards. Such an increase could have a material impact on the results and financial condition of the Group.
FBD Holdings plc 2018 Solvency and Financial Condition Report 26
Catastrophe RiskThe Group purchases reinsurance protection to limit its exposure to single large claims and the aggregation of claims from catastrophic events. The Group’s reinsurance is approved by the Board of Directors on an annual basis.
FBD has purchased a reinsurance programme which has been developed to meet the local domestic risk profile and tailored to FBD’s risk appetite. The programme protects, Motor, Liability, Property and other classes against both individual large loss and events.
C1.1 Concentration riskConcentration risk is the risk of loss due to overdependence on a single entity or category of business. While all of the Group’s underwriting business is conducted in Ireland, with a significant focus on the Agri sector, it is spread over a wide geographical area with no concentration in any one county or region. The resultant concentration risk from adverse weather events, i.e. floods, storms or freezes in Ireland, are mitigated by a flood mapping solution and an appropriate reinsurance strategy.
C1.2 Risk sensitivity for underwriting risksFBD carries out stress and scenario testing as part of the ORSA process which includes stress testing for the material underwriting risks. For the 2018 ORSA, the solvency position at 30 September 2018 and the projected solvency position over the business planning period were re-calculated following high impact low likelihood adverse stresses.
The outcome of the stress and scenario tests is that in each case FBD would have sufficient available capital to continue to meet the SCR.
C2. Market riskThe Group has invested in term deposits, listed debt securities, investment property and Collective Investment Undertakings (CIUs). These investments are subject to market risk, whereby the value of the investments may fluctuate as a result of changes in market prices, changes in market interest rates or changes in the foreign exchange rates of the currency in which the investments are denominated. The extent of the exposure to market risk is managed by the formulation of, and adherence to, an Investment Policy incorporating clearly defined investment limits and rules, as approved annually by the Board of Directors and employment of appropriately qualified and experienced personnel and external investment management specialists to manage the Group’s investment portfolio. The overriding philosophy of the Investment Policy is to protect and safeguard the Group’s assets and to ensure its capacity to underwrite is not put at risk.
The Group will only invest in assets the risks of which can be properly identified, measured, monitored, managed and controlled. In this regard the approach adopted by the Group is to ensure funds are allocated primarily in Euro denominated Corporate/Government bonds and deposits. This is in line with the Prudent Person Principle.
The Group monitors its allocation to the various asset classes and has a long term Strategic Asset Allocation target.
C2.1 Interest rate and spread riskInterest rate and spread risk arises primarily from the Group’s investments in listed debt securities and deposits. The level of exposure to interest rate risk from trading is reviewed regularly to ensure it is appropriate. Factors taken into consideration are yield, volatility and historical returns.
FBD Holdings plc 2018 Solvency and Financial Condition Report 27
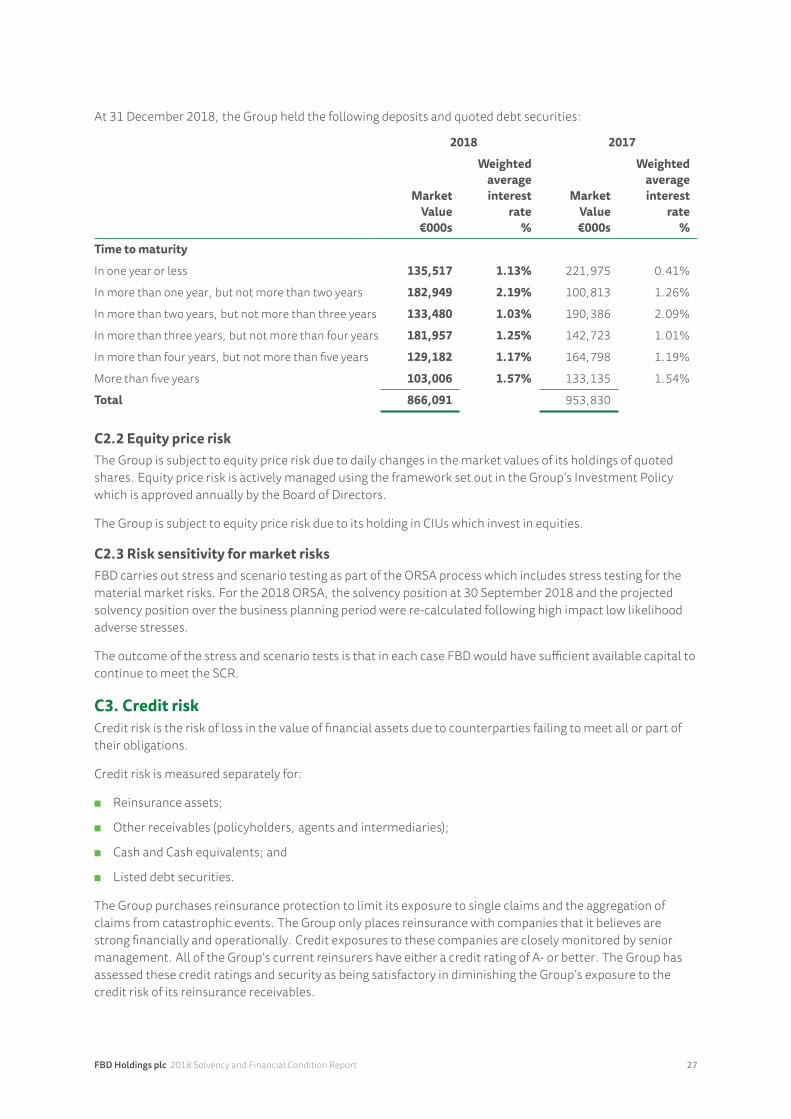
At 31 December 2018, the Group held the following deposits and quoted debt securities:
2018 2017
MarketValue€000s
Weightedaverageinterest
rate%
MarketValue€000s
Weightedaverageinterest
rate%
Time to maturity
In one year or less 135,517 1.13% 221,975 0.41%
In more than one year, but not more than two years 182,949 2.19% 100,813 1.26%
In more than two years, but not more than three years 133,480 1.03% 190,386 2.09%
In more than three years, but not more than four years 181,957 1.25% 142,723 1.01%
In more than four years, but not more than five years 129,182 1.17% 164,798 1.19%
More than five years 103,006 1.57% 133,135 1.54%
Total 866,091 953,830
C2.2 Equity price riskThe Group is subject to equity price risk due to daily changes in the market values of its holdings of quoted shares. Equity price risk is actively managed using the framework set out in the Group’s Investment Policy which is approved annually by the Board of Directors.
The Group is subject to equity price risk due to its holding in CIUs which invest in equities.
C2.3 Risk sensitivity for market risksFBD carries out stress and scenario testing as part of the ORSA process which includes stress testing for the material market risks. For the 2018 ORSA, the solvency position at 30 September 2018 and the projected solvency position over the business planning period were re-calculated following high impact low likelihood adverse stresses.
The outcome of the stress and scenario tests is that in each case FBD would have sufficient available capital to continue to meet the SCR.
C3. Credit riskCredit risk is the risk of loss in the value of financial assets due to counterparties failing to meet all or part of their obligations.
Credit risk is measured separately for:
n Reinsurance assets;
n Other receivables (policyholders, agents and intermediaries);
n Cash and Cash equivalents; and
n Listed debt securities.
The Group purchases reinsurance protection to limit its exposure to single claims and the aggregation of claims from catastrophic events. The Group only places reinsurance with companies that it believes are strong financially and operationally. Credit exposures to these companies are closely monitored by senior management. All of the Group’s current reinsurers have either a credit rating of A- or better. The Group has assessed these credit ratings and security as being satisfactory in diminishing the Group’s exposure to the credit risk of its reinsurance receivables.
FBD Holdings plc 2018 Solvency and Financial Condition Report 28
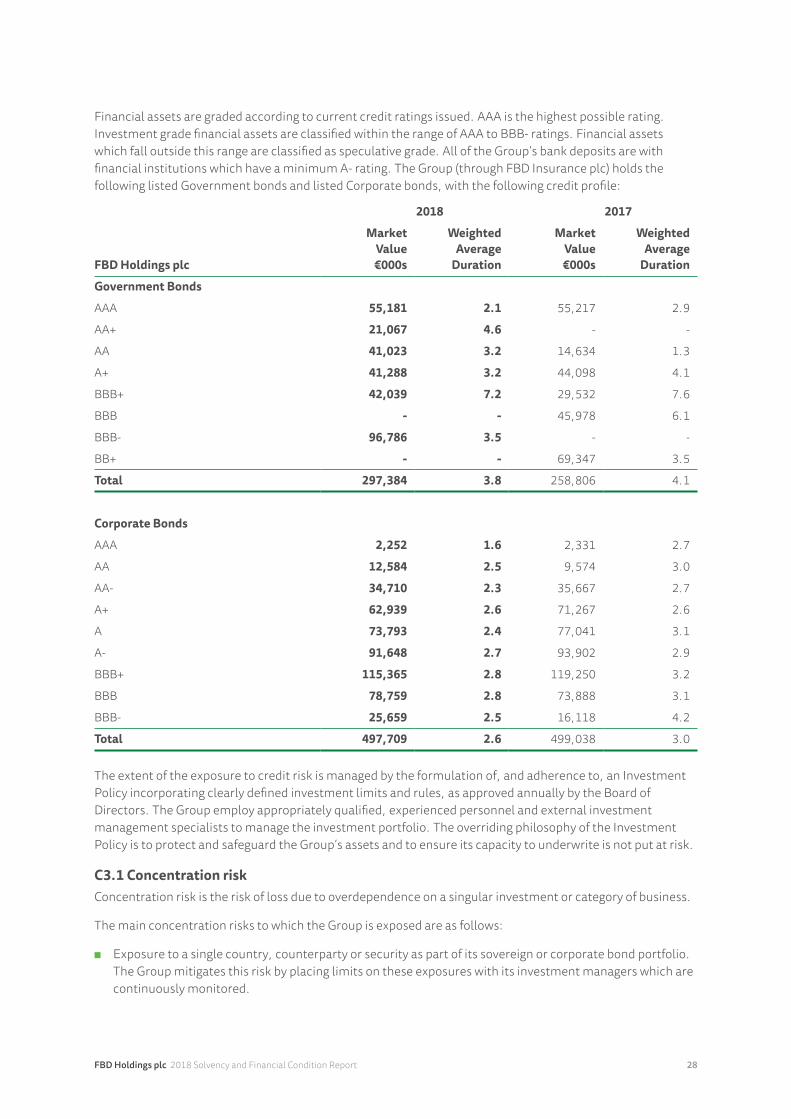
Financial assets are graded according to current credit ratings issued. AAA is the highest possible rating. Investment grade financial assets are classified within the range of AAA to BBB- ratings. Financial assets which fall outside this range are classified as speculative grade. All of the Group’s bank deposits are with financial institutions which have a minimum A- rating. The Group (through FBD Insurance plc) holds the following listed Government bonds and listed Corporate bonds, with the following credit profile:
FBD Holdings plc
2018 2017
Market Value
€000s
WeightedAverage
Duration
Market Value
€000s
WeightedAverage
Duration
Government Bonds
AAA 55,181 2.1 55,217 2.9
AA+ 21,067 4.6 - -
AA 41,023 3.2 14,634 1.3
A+ 41,288 3.2 44,098 4.1
BBB+ 42,039 7.2 29,532 7.6
BBB - - 45,978 6.1
BBB- 96,786 3.5 - -
BB+ - - 69,347 3.5
Total 297,384 3.8 258,806 4.1
Corporate Bonds
AAA 2,252 1.6 2,331 2.7
AA 12,584 2.5 9,574 3.0
AA- 34,710 2.3 35,667 2.7
A+ 62,939 2.6 71,267 2.6
A 73,793 2.4 77,041 3.1
A- 91,648 2.7 93,902 2.9
BBB+ 115,365 2.8 119,250 3.2
BBB 78,759 2.8 73,888 3.1
BBB- 25,659 2.5 16,118 4.2
Total 497,709 2.6 499,038 3.0
The extent of the exposure to credit risk is managed by the formulation of, and adherence to, an Investment Policy incorporating clearly defined investment limits and rules, as approved annually by the Board of Directors. The Group employ appropriately qualified, experienced personnel and external investment management specialists to manage the investment portfolio. The overriding philosophy of the Investment Policy is to protect and safeguard the Group’s assets and to ensure its capacity to underwrite is not put at risk.
C3.1 Concentration riskConcentration risk is the risk of loss due to overdependence on a singular investment or category of business.
The main concentration risks to which the Group is exposed are as follows:
n Exposure to a single country, counterparty or security as part of its sovereign or corporate bond portfolio. The Group mitigates this risk by placing limits on these exposures with its investment managers which are continuously monitored.
FBD Holdings plc 2018 Solvency and Financial Condition Report 29
n Exposure to a single counterparty as part of its cash and deposit holdings. The Group mitigates this risk by placing limits on its total exposures to banking counterparties as set out in the Group’s Investment Policy, which is approved annually by the Board of Directors.
Receivables arising out of direct insurance operations and other receivables have no significant concentration of risk.
C3.2 Risk sensitivity for credit risksFBD carries out stress and scenario testing as part of the ORSA process which includes stress testing for the material credit risks. For the 2018 ORSA, the solvency position at 30 September 2018 and the projected solvency position over the business planning period were re-calculated following high impact low likelihood adverse stresses.
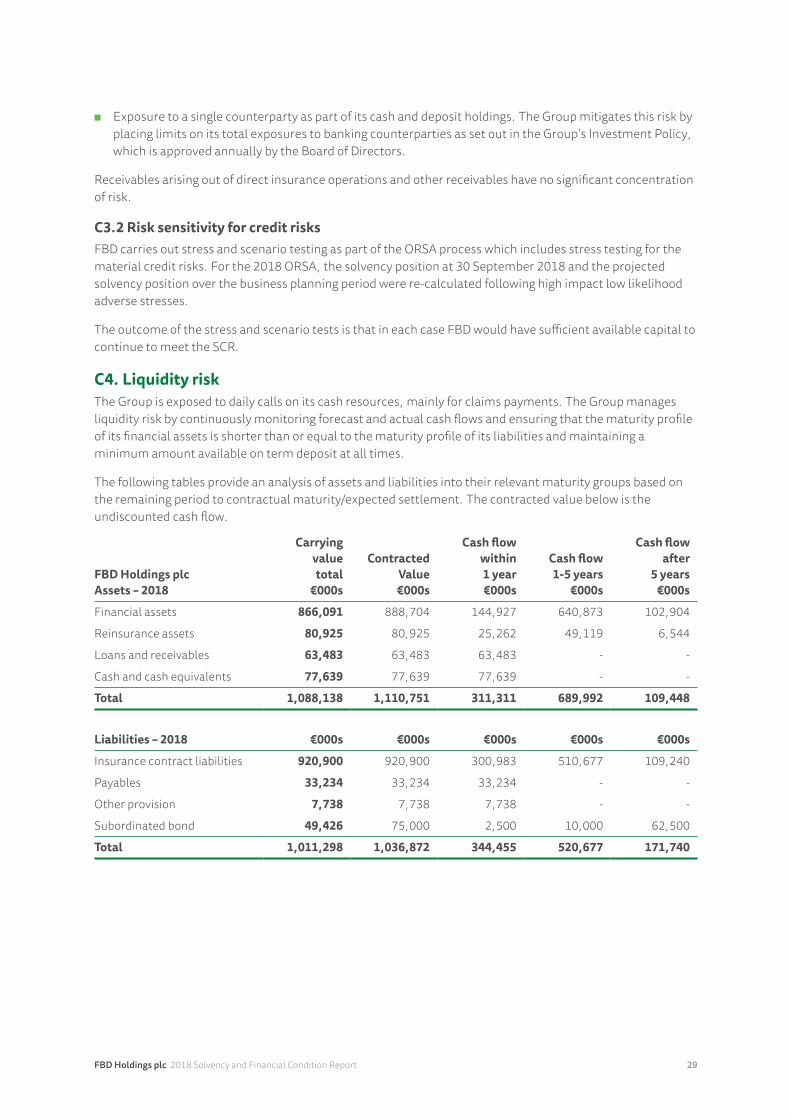
The outcome of the stress and scenario tests is that in each case FBD would have sufficient available capital to continue to meet the SCR.
C4. Liquidity riskThe Group is exposed to daily calls on its cash resources, mainly for claims payments. The Group manages liquidity risk by continuously monitoring forecast and actual cash flows and ensuring that the maturity profile of its financial assets is shorter than or equal to the maturity profile of its liabilities and maintaining a minimum amount available on term deposit at all times.
The following tables provide an analysis of assets and liabilities into their relevant maturity groups based on the remaining period to contractual maturity/expected settlement. The contracted value below is the undiscounted cash flow.
FBD Holdings plcAssets – 2018
Carrying valuetotal
€000s
ContractedValue€000s
Cash flowwithin1 year€000s
Cash flow1-5 years
€000s
Cash flowafter
5 years€000s
Financial assets 866,091 888,704 144,927 640,873 102,904
Reinsurance assets 80,925 80,925 25,262 49,119 6,544
Loans and receivables 63,483 63,483 63,483 - -
Cash and cash equivalents 77,639 77,639 77,639 - -
Total 1,088,138 1,110,751 311,311 689,992 109,448
Liabilities – 2018 €000s €000s €000s €000s €000s
Insurance contract liabilities 920,900 920,900 300,983 510,677 109,240
Payables 33,234 33,234 33,234 - -
Other provision 7,738 7,738 7,738 - -
Subordinated bond 49,426 75,000 2,500 10,000 62,500
Total 1,011,298 1,036,872 344,455 520,677 171,740
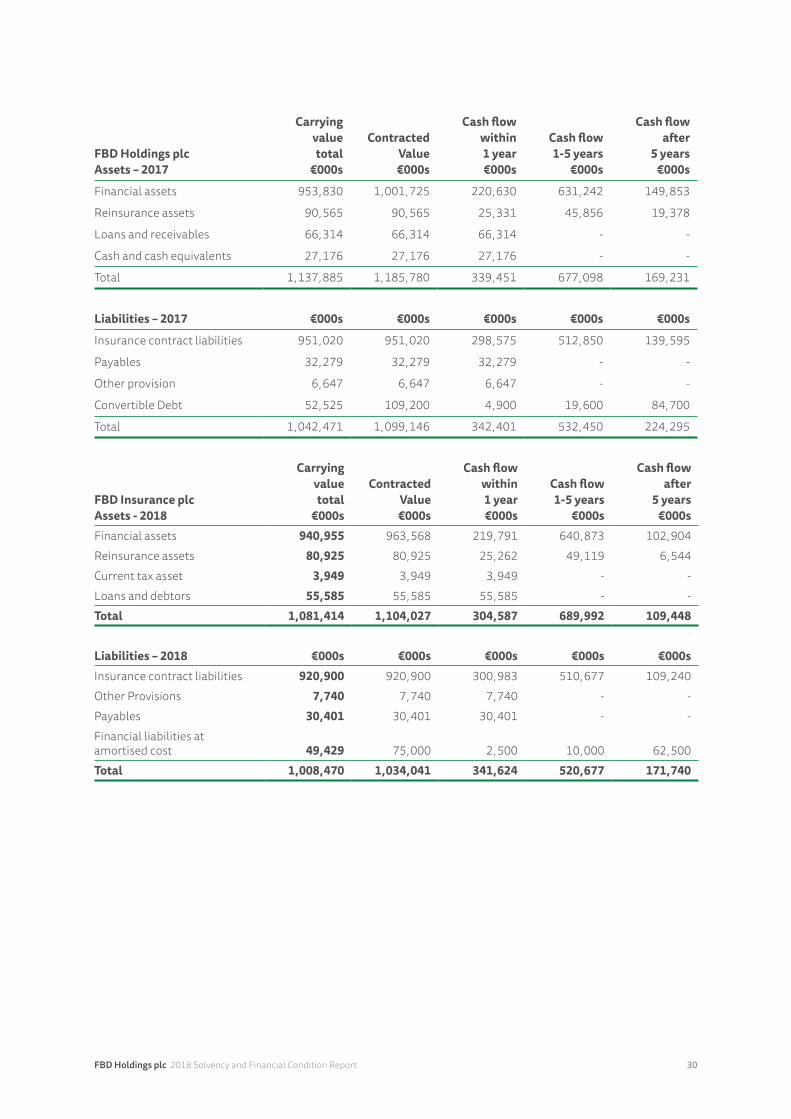
FBD Holdings plc 2018 Solvency and Financial Condition Report 30
FBD Holdings plcAssets – 2017
Carrying valuetotal
€000s
ContractedValue€000s
Cash flowwithin1 year€000s
Cash flow1-5 years
€000s
Cash flowafter
5 years€000s
Financial assets 953,830 1,001,725 220,630 631,242 149,853
Reinsurance assets 90,565 90,565 25,331 45,856 19,378
Loans and receivables 66,314 66,314 66,314 - -
Cash and cash equivalents 27,176 27,176 27,176 - -
Total 1,137,885 1,185,780 339,451 677,098 169,231
Liabilities – 2017 €000s €000s €000s €000s €000s
Insurance contract liabilities 951,020 951,020 298,575 512,850 139,595
Payables 32,279 32,279 32,279 - -
Other provision 6,647 6,647 6,647 - -
Convertible Debt 52,525 109,200 4,900 19,600 84,700
Total 1,042,471 1,099,146 342,401 532,450 224,295
FBD Insurance plcAssets - 2018
Carrying valuetotal
€000s
ContractedValue€000s
Cash flowwithin1 year€000s
Cash flow 1-5 years
€000s
Cash flow after
5 years€000s
Financial assets 940,955 963,568 219,791 640,873 102,904Reinsurance assets 80,925 80,925 25,262 49,119 6,544Current tax asset 3,949 3,949 3,949 - -Loans and debtors 55,585 55,585 55,585 - -Total 1,081,414 1,104,027 304,587 689,992 109,448
Liabilities – 2018 €000s €000s €000s €000s €000sInsurance contract liabilities 920,900 920,900 300,983 510,677 109,240Other Provisions 7,740 7,740 7,740 - -Payables 30,401 30,401 30,401 - -Financial liabilities at amortised cost 49,429 75,000 2,500 10,000 62,500Total 1,008,470 1,034,041 341,624 520,677 171,740
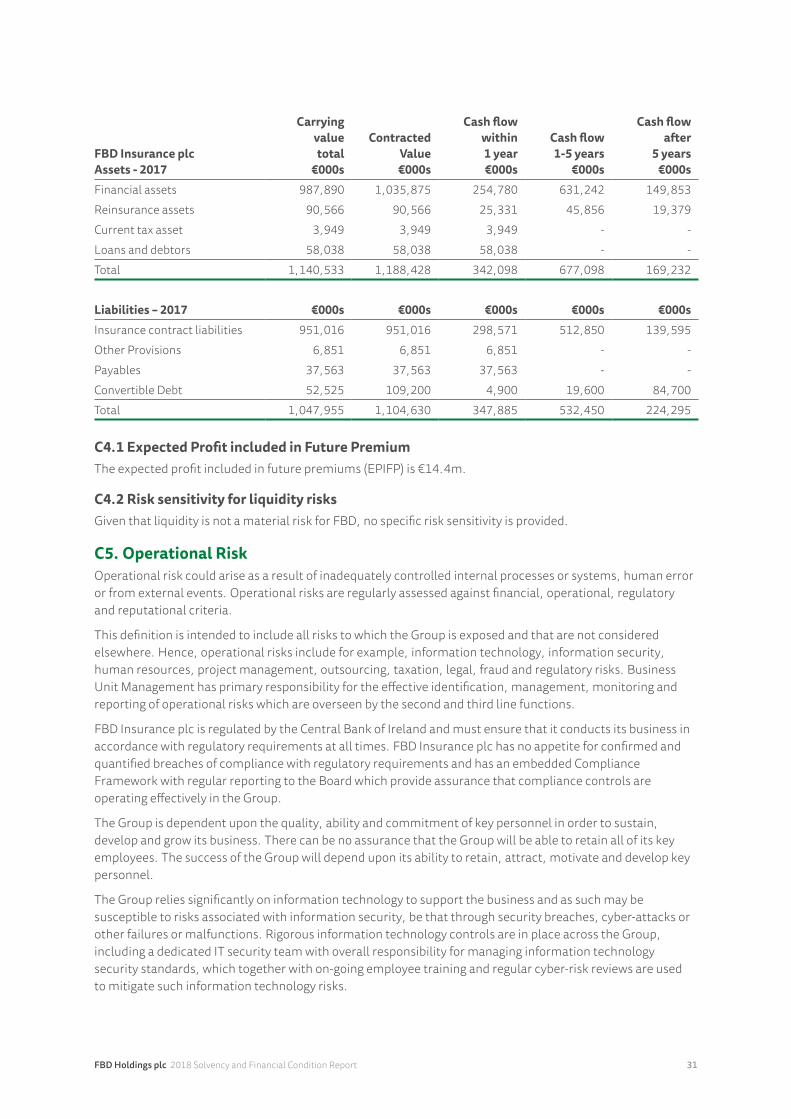
FBD Holdings plc 2018 Solvency and Financial Condition Report 31
FBD Insurance plcAssets - 2017
Carrying valuetotal
€000s
ContractedValue€000s
Cash flowwithin1 year€000s
Cash flow 1-5 years
€000s
Cash flow after
5 years€000s
Financial assets 987,890 1,035,875 254,780 631,242 149,853Reinsurance assets 90,566 90,566 25,331 45,856 19,379Current tax asset 3,949 3,949 3,949 - -Loans and debtors 58,038 58,038 58,038 - -Total 1,140,533 1,188,428 342,098 677,098 169,232
Liabilities – 2017 €000s €000s €000s €000s €000sInsurance contract liabilities 951,016 951,016 298,571 512,850 139,595Other Provisions 6,851 6,851 6,851 - -Payables 37,563 37,563 37,563 - -Convertible Debt 52,525 109,200 4,900 19,600 84,700Total 1,047,955 1,104,630 347,885 532,450 224,295
C4.1 Expected Profit included in Future PremiumThe expected profit included in future premiums (EPIFP) is €14.4m.
C4.2 Risk sensitivity for liquidity risksGiven that liquidity is not a material risk for FBD, no specific risk sensitivity is provided.
C5. Operational RiskOperational risk could arise as a result of inadequately controlled internal processes or systems, human error or from external events. Operational risks are regularly assessed against financial, operational, regulatory and reputational criteria.
This definition is intended to include all risks to which the Group is exposed and that are not considered elsewhere. Hence, operational risks include for example, information technology, information security, human resources, project management, outsourcing, taxation, legal, fraud and regulatory risks. Business Unit Management has primary responsibility for the effective identification, management, monitoring and reporting of operational risks which are overseen by the second and third line functions.
FBD Insurance plc is regulated by the Central Bank of Ireland and must ensure that it conducts its business in accordance with regulatory requirements at all times. FBD Insurance plc has no appetite for confirmed and quantified breaches of compliance with regulatory requirements and has an embedded Compliance Framework with regular reporting to the Board which provide assurance that compliance controls are operating effectively in the Group.
The Group is dependent upon the quality, ability and commitment of key personnel in order to sustain, develop and grow its business. There can be no assurance that the Group will be able to retain all of its key employees. The success of the Group will depend upon its ability to retain, attract, motivate and develop key personnel.
The Group relies significantly on information technology to support the business and as such may be susceptible to risks associated with information security, be that through security breaches, cyber-attacks or other failures or malfunctions. Rigorous information technology controls are in place across the Group, including a dedicated IT security team with overall responsibility for managing information technology security standards, which together with on-going employee training and regular cyber-risk reviews are used to mitigate such information technology risks.
FBD Holdings plc 2018 Solvency and Financial Condition Report 32
In addition, the Group has taken significant steps to minimise the impact of business interruption that could result from a major external event. A formal disaster recovery plan is in place for both workspace recovery and retrieval of communications, IT systems and data. If a major event occurs, these procedures will enable the Group to move the affected operations to alternative facilities within very short periods of time. The disaster recovery plan is tested regularly and includes disaster simulation tests.
C5.1 Risk sensitivity for operational risksFBD carries out stress and scenario testing as part of the ORSA process which includes stress testing for the material operational risks. For the 2018 ORSA, the solvency position at 30 September 2018 and the projected solvency position over the business planning period were re-calculated following high impact low likelihood adverse stresses. The stress and scenarios chosen has taken into account the material operational risks facing the Group including cyber and IT risk.
The outcome of the stress and scenario tests is that in each case FBD would have sufficient available capital to continue to meet the SCR.
C6. Other Material RisksOne key aspect of the Risk Management Framework is to identify and if necessary take appropriate action in response to future risks which could impact the Group. We have a defined process in place for the identification of Emerging Risks, which is informed through the use of subject matter experts, workshops and consulting a range of external documentation. Key Emerging Risks include:
n Technological advances changing the shape of the insurance industry and competitive environment.
n The risk that an interruption or failure of information systems, whether caused by security breaches, cyber-attacks or other failures or malfunctions, may result in a significant loss of business, assets or competitive position.
n Global deterioration in economic conditions and particularly in Ireland may lead to a reduction in revenue and profits.
n Global socio-political uncertainty that may cause an adverse impact on profitability.
n The impact of climate change may result in increasingly volatile weather patterns and more frequent severe weather events.
n Regulatory legislative landscape and its associated cost to ensure continued compliance.
n A hard “Brexit” introduces business and trading uncertainty for all indigenous Irish businesses, including FBD and the Group’s core customers in farming and other small businesses. It appears likely that Britain departing the EU will have negative effects for business and business confidence in Ireland, particularly in the medium term and FBD believes this will continue to be a significant headwind to otherwise strong Irish economic prospects.
C6.1 Off balance sheet positionsThe Group does not have any risk exposure arising from Off Balance Sheet positions.
C6.2 Special Purpose VehiclesThe Group does not have any risk exposure arising from Special Purpose Vehicles.
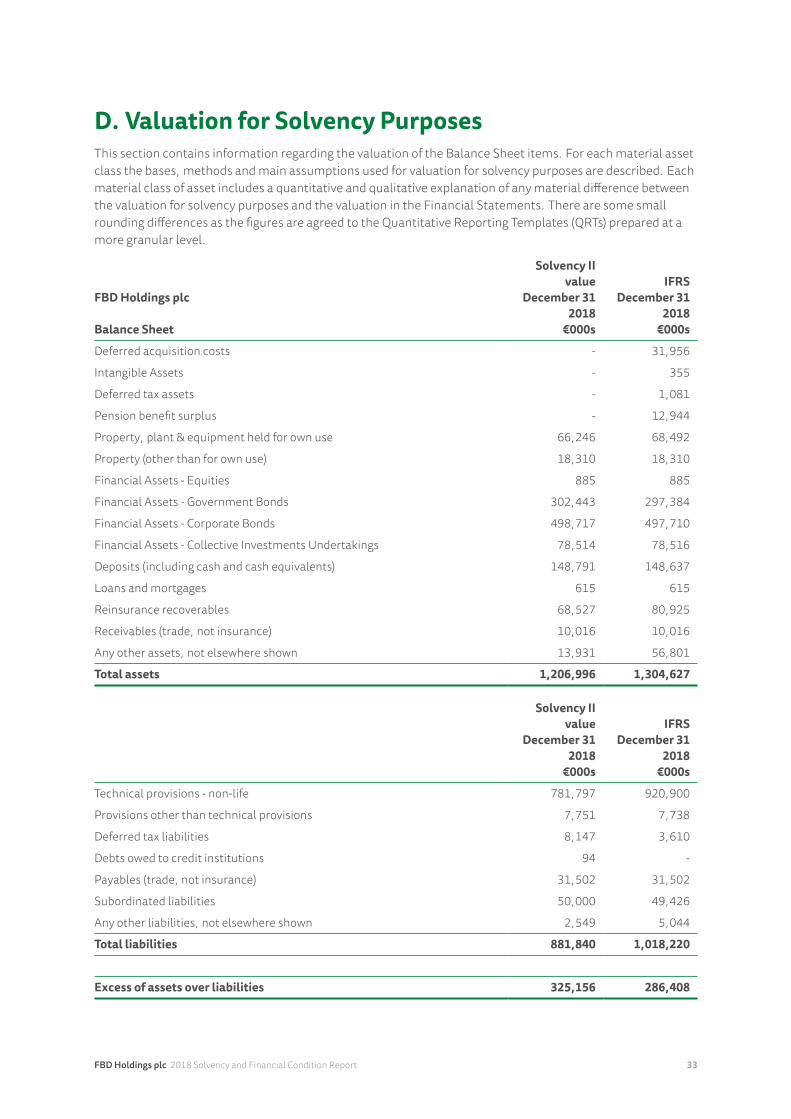
FBD Holdings plc 2018 Solvency and Financial Condition Report 33
D. Valuation for Solvency PurposesThis section contains information regarding the valuation of the Balance Sheet items. For each material asset class the bases, methods and main assumptions used for valuation for solvency purposes are described. Each material class of asset includes a quantitative and qualitative explanation of any material difference between the valuation for solvency purposes and the valuation in the Financial Statements. There are some small rounding differences as the figures are agreed to the Quantitative Reporting Templates (QRTs) prepared at a more granular level.
FBD Holdings plc
Balance Sheet
Solvency II value
December 312018
€000s
IFRSDecember 31
2018€000s
Deferred acquisition costs - 31,956
Intangible Assets - 355
Deferred tax assets - 1,081
Pension benefit surplus - 12,944
Property, plant & equipment held for own use 66,246 68,492
Property (other than for own use) 18,310 18,310
Financial Assets - Equities 885 885
Financial Assets - Government Bonds 302,443 297,384
Financial Assets - Corporate Bonds 498,717 497,710
Financial Assets - Collective Investments Undertakings 78,514 78,516
Deposits (including cash and cash equivalents) 148,791 148,637
Loans and mortgages 615 615
Reinsurance recoverables 68,527 80,925
Receivables (trade, not insurance) 10,016 10,016
Any other assets, not elsewhere shown 13,931 56,801
Total assets 1,206,996 1,304,627
Solvency II value
December 312018
€000s
IFRSDecember 31
2018€000s
Technical provisions - non-life 781,797 920,900
Provisions other than technical provisions 7,751 7,738
Deferred tax liabilities 8,147 3,610
Debts owed to credit institutions 94 -
Payables (trade, not insurance) 31,502 31,502
Subordinated liabilities 50,000 49,426
Any other liabilities, not elsewhere shown 2,549 5,044
Total liabilities 881,840 1,018,220
Excess of assets over liabilities 325,156 286,408
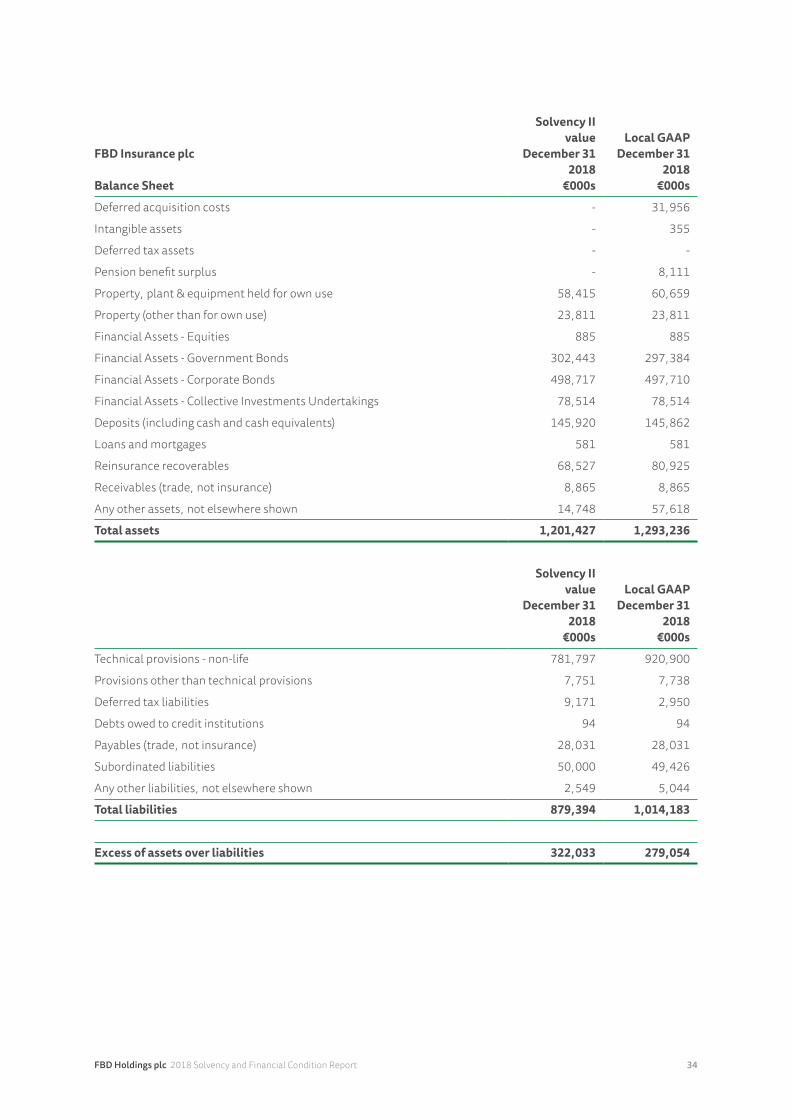
FBD Holdings plc 2018 Solvency and Financial Condition Report 34
FBD Insurance plc
Balance Sheet
Solvency II value
December 312018
€000s
Local GAAPDecember 31
2018€000s
Deferred acquisition costs - 31,956
Intangible assets - 355
Deferred tax assets - -
Pension benefit surplus - 8,111
Property, plant & equipment held for own use 58,415 60,659
Property (other than for own use) 23,811 23,811
Financial Assets - Equities 885 885
Financial Assets - Government Bonds 302,443 297,384
Financial Assets - Corporate Bonds 498,717 497,710
Financial Assets - Collective Investments Undertakings 78,514 78,514
Deposits (including cash and cash equivalents) 145,920 145,862
Loans and mortgages 581 581
Reinsurance recoverables 68,527 80,925
Receivables (trade, not insurance) 8,865 8,865
Any other assets, not elsewhere shown 14,748 57,618
Total assets 1,201,427 1,293,236
Solvency II value
December 312018
€000s
Local GAAP December 31
2018€000s
Technical provisions - non-life 781,797 920,900
Provisions other than technical provisions 7,751 7,738
Deferred tax liabilities 9,171 2,950
Debts owed to credit institutions 94 94
Payables (trade, not insurance) 28,031 28,031
Subordinated liabilities 50,000 49,426
Any other liabilities, not elsewhere shown 2,549 5,044
Total liabilities 879,394 1,014,183
Excess of assets over liabilities 322,033 279,054
FBD Holdings plc 2018 Solvency and Financial Condition Report 35
D1. AssetsSolvency II Valuation for each material class of asset is listed below. The FBD Holdings plc (Group) Financial Statements are prepared in line with IFRS and FBD Insurance plc (Company) Financial Statements are prepared in line with FRS 102 & 103. The difference in the Financial Statement valuations to Solvency II is detailed below.
D1.1 Deferred Acquisition Costs (DAC)The Group and the Company respectively recognise an asset relating to deferred acquisition costs (DAC). DAC is not recognised in the Solvency II framework and is therefore removed under Solvency II.
D1.2 Deferred Tax Asset/LiabilityThe Group has recognised a deferred tax asset in the Financial Statements however a deferred tax liability is recognised under Solvency II. This difference is due to the revaluation of the Technical Provisions under Solvency II and the non-recognition of deferred acquisition costs and the pension surplus under Solvency II.
D1.3 Pension Benefit SurplusThe pension surplus is not recognised in the Solvency II framework and was removed.
D1.4 Property, plant and equipmentD1.4.1 PropertyIn the Group, Property (other than for own use) comprises of an investment property held for rental in Ireland. In the Company there are additional properties occupied by Group companies recognised as Property (other than for own use).
Properties were valued at fair value at 31 December 2018 by independent external professional valuers, CB Richard Ellis, Valuation Surveyors. The valuations were prepared in accordance with the RICS Valuation – Professional Standards global January 2014 (Red Book).
The valuations report received from the external professional valuers states that the valuations have been prepared on the basis of “Market Value”. The properties have been valued individually and no account taken of any discount or premium that may be negotiated in the market if all or part of the portfolio was to be marketed simultaneously either as lots or as a whole.
D1.4.2 Plant and equipmentPlant and equipment is stated in the IFRS and FRS 102 & 103 financial statements at cost less accumulated depreciation and accumulated revaluation profits/(losses). Plant and equipment is stated at fair value under Solvency II as assessed by the Board on an annual basis. FBD Holdings plc has higher Property, plant and equipment held for own use than the Company as it includes the properties occupied by the Group companies.
Depreciation is provided in respect of all plant and equipment and is calculated to write off the cost or valuation of the assets over their expected useful lives. The useful life of plant and equipment is estimated to be three to ten years dependent on the asset. Depreciation on assets in development commences when the assets are ready for their intended use.
D1.5 Financial AssetsFinancial assets are quoted investments in active markets which are stated at fair value. They are recognised on a trade date basis at fair value and are revalued at subsequent reporting dates at fair value, using the closing bid price. Closing bid prices are obtained from a number of external providers in order to confirm their accuracy.
The Group assumes that the quoted closing bid price for these assets is the price that would be achievable had the assets been sold at the time of valuation.
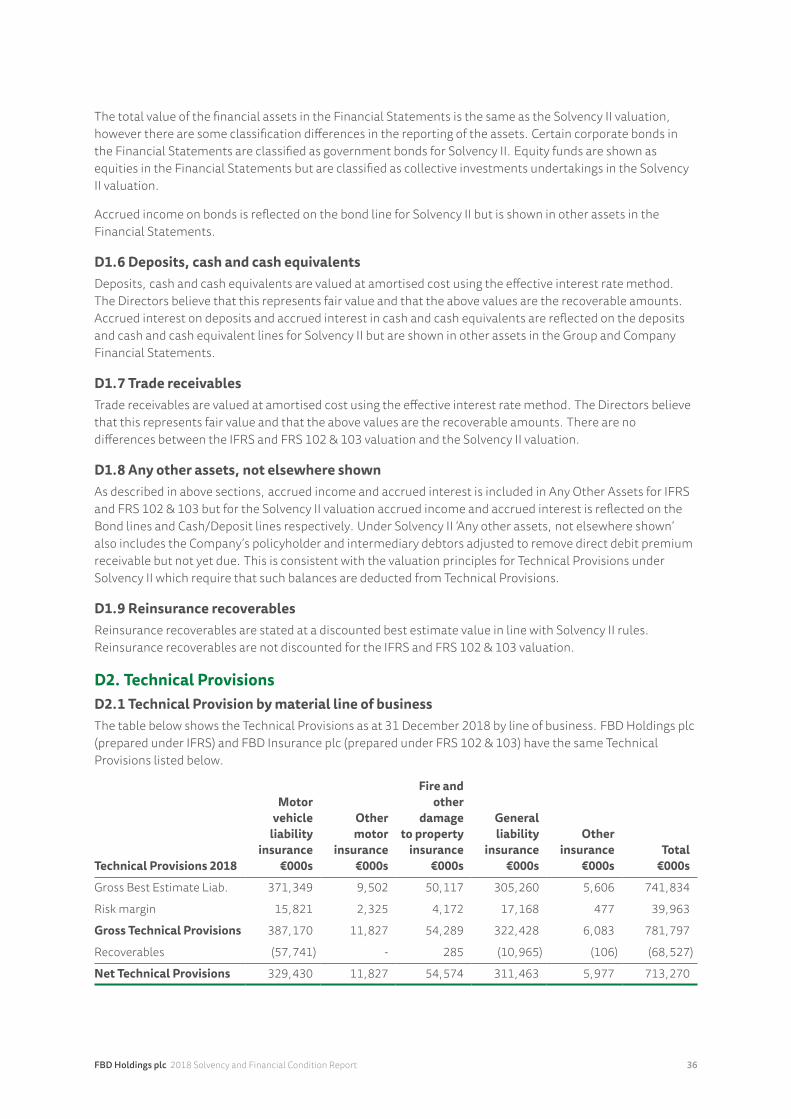
FBD Holdings plc 2018 Solvency and Financial Condition Report 36
The total value of the financial assets in the Financial Statements is the same as the Solvency II valuation, however there are some classification differences in the reporting of the assets. Certain corporate bonds in the Financial Statements are classified as government bonds for Solvency II. Equity funds are shown as equities in the Financial Statements but are classified as collective investments undertakings in the Solvency II valuation.
Accrued income on bonds is reflected on the bond line for Solvency II but is shown in other assets in the Financial Statements.
D1.6 Deposits, cash and cash equivalentsDeposits, cash and cash equivalents are valued at amortised cost using the effective interest rate method. The Directors believe that this represents fair value and that the above values are the recoverable amounts. Accrued interest on deposits and accrued interest in cash and cash equivalents are reflected on the deposits and cash and cash equivalent lines for Solvency II but are shown in other assets in the Group and Company Financial Statements.
D1.7 Trade receivablesTrade receivables are valued at amortised cost using the effective interest rate method. The Directors believe that this represents fair value and that the above values are the recoverable amounts. There are no differences between the IFRS and FRS 102 & 103 valuation and the Solvency II valuation.
D1.8 Any other assets, not elsewhere shownAs described in above sections, accrued income and accrued interest is included in Any Other Assets for IFRS and FRS 102 & 103 but for the Solvency II valuation accrued income and accrued interest is reflected on the Bond lines and Cash/Deposit lines respectively. Under Solvency II ‘Any other assets, not elsewhere shown’ also includes the Company’s policyholder and intermediary debtors adjusted to remove direct debit premium receivable but not yet due. This is consistent with the valuation principles for Technical Provisions under Solvency II which require that such balances are deducted from Technical Provisions.
D1.9 Reinsurance recoverablesReinsurance recoverables are stated at a discounted best estimate value in line with Solvency II rules. Reinsurance recoverables are not discounted for the IFRS and FRS 102 & 103 valuation.
D2. Technical ProvisionsD2.1 Technical Provision by material line of businessThe table below shows the Technical Provisions as at 31 December 2018 by line of business. FBD Holdings plc (prepared under IFRS) and FBD Insurance plc (prepared under FRS 102 & 103) have the same Technical Provisions listed below.
Technical Provisions 2018
Motor vehicle
liability insurance
€000s
Other motor
insurance €000s
Fire and other
damage to property
insurance €000s
General liability
insurance €000s
Other insurance
€000s Total
€000s
Gross Best Estimate Liab. 371,349 9,502 50,117 305,260 5,606 741,834
Risk margin 15,821 2,325 4,172 17,168 477 39,963
Gross Technical Provisions 387,170 11,827 54,289 322,428 6,083 781,797
Recoverables (57,741) - 285 (10,965) (106) (68,527)
Net Technical Provisions 329,430 11,827 54,574 311,463 5,977 713,270
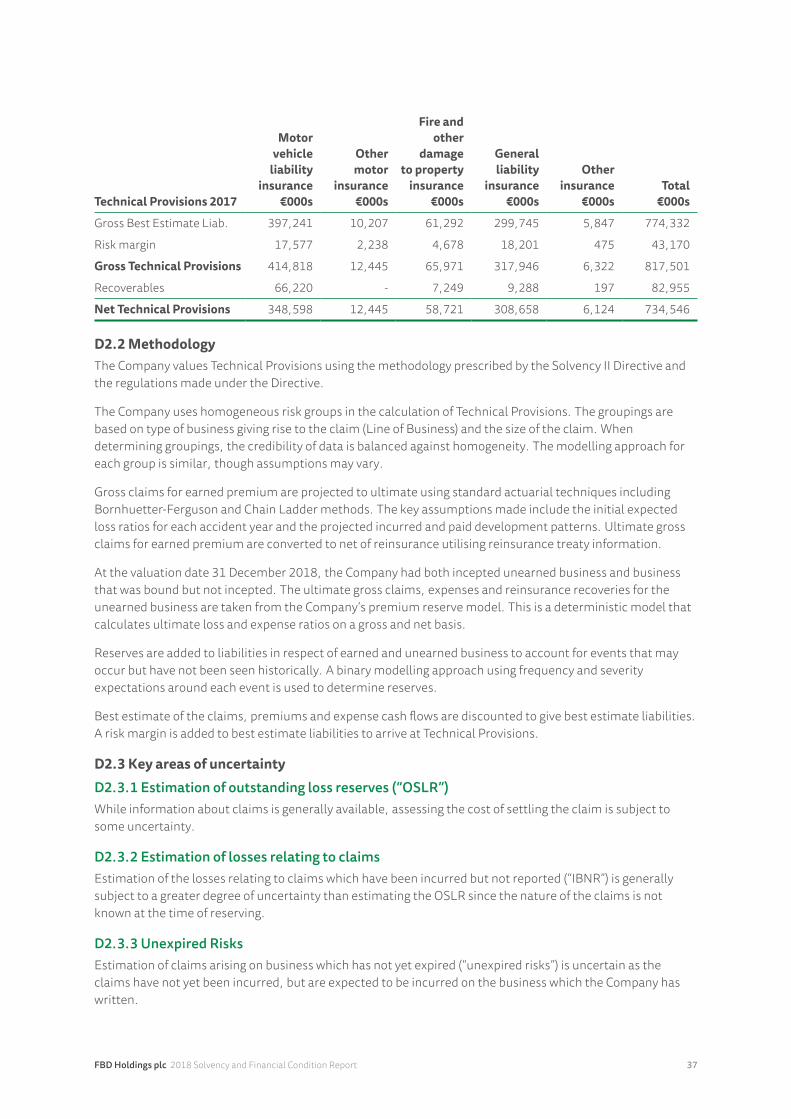
FBD Holdings plc 2018 Solvency and Financial Condition Report 37
Technical Provisions 2017
Motor vehicle
liability insurance
€000s
Other motor
insurance €000s
Fire and other
damage to property
insurance €000s
General liability
insurance €000s
Other insurance
€000s Total
€000s
Gross Best Estimate Liab. 397,241 10,207 61,292 299,745 5,847 774,332
Risk margin 17,577 2,238 4,678 18,201 475 43,170
Gross Technical Provisions 414,818 12,445 65,971 317,946 6,322 817,501
Recoverables 66,220 - 7,249 9,288 197 82,955
Net Technical Provisions 348,598 12,445 58,721 308,658 6,124 734,546
D2.2 MethodologyThe Company values Technical Provisions using the methodology prescribed by the Solvency II Directive and the regulations made under the Directive.
The Company uses homogeneous risk groups in the calculation of Technical Provisions. The groupings are based on type of business giving rise to the claim (Line of Business) and the size of the claim. When determining groupings, the credibility of data is balanced against homogeneity. The modelling approach for each group is similar, though assumptions may vary.
Gross claims for earned premium are projected to ultimate using standard actuarial techniques including Bornhuetter-Ferguson and Chain Ladder methods. The key assumptions made include the initial expected loss ratios for each accident year and the projected incurred and paid development patterns. Ultimate gross claims for earned premium are converted to net of reinsurance utilising reinsurance treaty information.
At the valuation date 31 December 2018, the Company had both incepted unearned business and business that was bound but not incepted. The ultimate gross claims, expenses and reinsurance recoveries for the unearned business are taken from the Company’s premium reserve model. This is a deterministic model that calculates ultimate loss and expense ratios on a gross and net basis.
Reserves are added to liabilities in respect of earned and unearned business to account for events that may occur but have not been seen historically. A binary modelling approach using frequency and severity expectations around each event is used to determine reserves.
Best estimate of the claims, premiums and expense cash flows are discounted to give best estimate liabilities. A risk margin is added to best estimate liabilities to arrive at Technical Provisions.
D2.3 Key areas of uncertaintyD2.3.1 Estimation of outstanding loss reserves (“OSLR”)While information about claims is generally available, assessing the cost of settling the claim is subject to some uncertainty.
D2.3.2 Estimation of losses relating to claimsEstimation of the losses relating to claims which have been incurred but not reported (“IBNR”) is generally subject to a greater degree of uncertainty than estimating the OSLR since the nature of the claims is not known at the time of reserving.
D2.3.3 Unexpired RisksEstimation of claims arising on business which has not yet expired (“unexpired risks”) is uncertain as the claims have not yet been incurred, but are expected to be incurred on the business which the Company has written.
FBD Holdings plc 2018 Solvency and Financial Condition Report 38
D2.3.4 Market environmentChanges in the market environment increase the inherent uncertainty affecting the business. In particular, claims inflation, publishing of updated Book of Quantum, discount legislation and recent introduction of Periodic Payment Orders (PPO) legislation have impacted the market environment in recent years or may impact the market environment in the coming years.
D2.3.5 Events not in data (‘ENID loading’)Estimating a provision for events not in data is subject to considerable uncertainty as the events being considered have not been observed.
D2.3.6 Run-off expensesThe estimation of the change in expense base for run-off of the Company is inherently uncertain due to the estimations around the period of the run-off, base costs and inflation.
D2.3.7 Risk MarginThe Risk Margin, being the margin payable to transfer the business to another insurance carrier, is uncertain due to the requirement to forecast future solvency capital requirements over the period of a run-off. This therefore shares the same uncertainties of the run-off expenses provision considered at D.2.3.6, as well as the inherent uncertainties around forecasting future solvency capital requirements.
D2.4 Risk ManagementThe Company manages the risks around these uncertainties via the following actions:
n On-going monitoring of claims, including regular reviews of claims handling functions;
n Maintaining a number of reinsurance arrangements to limit the impact of adverse claims development;
n Internal controls through the Reserving Committee and Actuarial Function which monitor claims development and reinsurance arrangements; and
n Regular external actuarial reviews.
D2.5 Transition from FRS to Solvency IIThe changes required to transition from FRS accounts to Technical Provisions for solvency purposes are consistent for all lines of business, and are noted below.
D2.5.1 Claims provisionsThe Company has made no adjustments to the projected claims provisions used in its FRS accounts in recording the claims provisions for solvency purposes. Gross claims provisions as at 31 December 2018 are €658.1m.
D2.5.2 Reinsurance share of claims provisionsThe Company has made no adjustments other than Reinstatement premia to the reinsurance recoveries in its FRS accounts in recording the reinsurance share of claims provisions for solvency purposes. The reinsurance share of claims provisions as at 31 December 2018 is €70.9m.
D2.5.3 Unexpired risksThe Company has estimated the claims which will be payable on unexpired risks, termed “premium provisions”, based on the ultimate loss and expense ratios from the claims provisions and premium rate adjustments related to the unearned book of business. Gross premium provisions as at 31 December 2018 are €83.7m.
FBD Holdings plc 2018 Solvency and Financial Condition Report 39
D2.5.4 Risk MarginThe Risk Margin has been considered to ensure that the value of the Technical Provisions is equivalent to the amount that would be expected to have to be paid to a third party insurance group in order to take over and meet the insurance obligations of the Company. The Risk Margin has been calculated based on the estimated capital requirements to run-off the Company’s obligations, and applying a cost of capital of 6%.
The Risk Margin is calculated using a simplified method allowed under Article 58 of Commission Delegated Regulation 2015/35. The capital required to run-off the portfolio is based on the future estimated SCRs, taking account of underwriting risk, reinsurance counterparty risk and operational risk. The Group approximates the whole SCR for each future year by using a ratio of the best estimate liabilities at each future year to the best estimate liabilities at the valuation date. This results in a Risk Margin of €40.0m.
D2.5.5 OtherThe Company has made adjustments for events not in data, reinsurance amounts recoverable on unexpired risks, policyholder receivables, reinsurance payable, counterparty default, expenses that will be incurred in servicing insurance obligations and discounting.
D2.6 Adjustments not appliedThe Company has not applied the matching adjustment, volatility adjustment, transitional risk-free interest term structure or the transitional deduction in calculating its Technical Provisions.
D2.7 Changes in AssumptionsThere were no material changes in the relevant assumptions made in the calculation of Technical Provisions compared to the previous reporting period.
D2.8 Special Purpose VehiclesThe Company does not have any Special Purpose Vehicles.
D3. Other LiabilitiesD3.1 Deferred Tax LiabilitiesThe Group and the Company have recognised a deferred tax liability under Solvency II and IFRS. The variance is due to the revaluation of the Technical Provisions and the non-recognition of deferred acquisition costs and the pension surplus under Solvency II.
D3.2 Provision other than Technical ProvisionsProvisions other than Technical Provisions include a provision for Motor Insurers’ Bureau of Ireland (“MIBI”). The provision is included under IFRS and FRS 102 & 103 at fair value and is not discounted. The provision is discounted for the Solvency II valuation.
D3.3 Reinsurance payablesReinsurance payables (excluding Reinstatement premia) not past due are included in any other liabilities. Reinsurance payables are calculated in accordance with reinsurance agreements. Reinstatement premia is included in the Technical Provisions under Solvency II.
D3.4 Payables (trade, not insurance); Debts owed to credit institutionsThere are no valuation differences between the IFRS and FRS 102 & 103 accounts and the Solvency II valuation for payables (trade, not insurance) and debts owed to credit institutions as they are held at fair value.
D3.5 Subordinated liabilitiesOn 1 October 2018 FBD Holdings plc announced that its subsidiary FBD Insurance plc had entered into an agreement to purchase and cancel the €70,000,000 7% Convertible Notes which were in issue for €86,059,000. The below table shows the loss recognised as a result of the purchase and cancellation of the Notes.
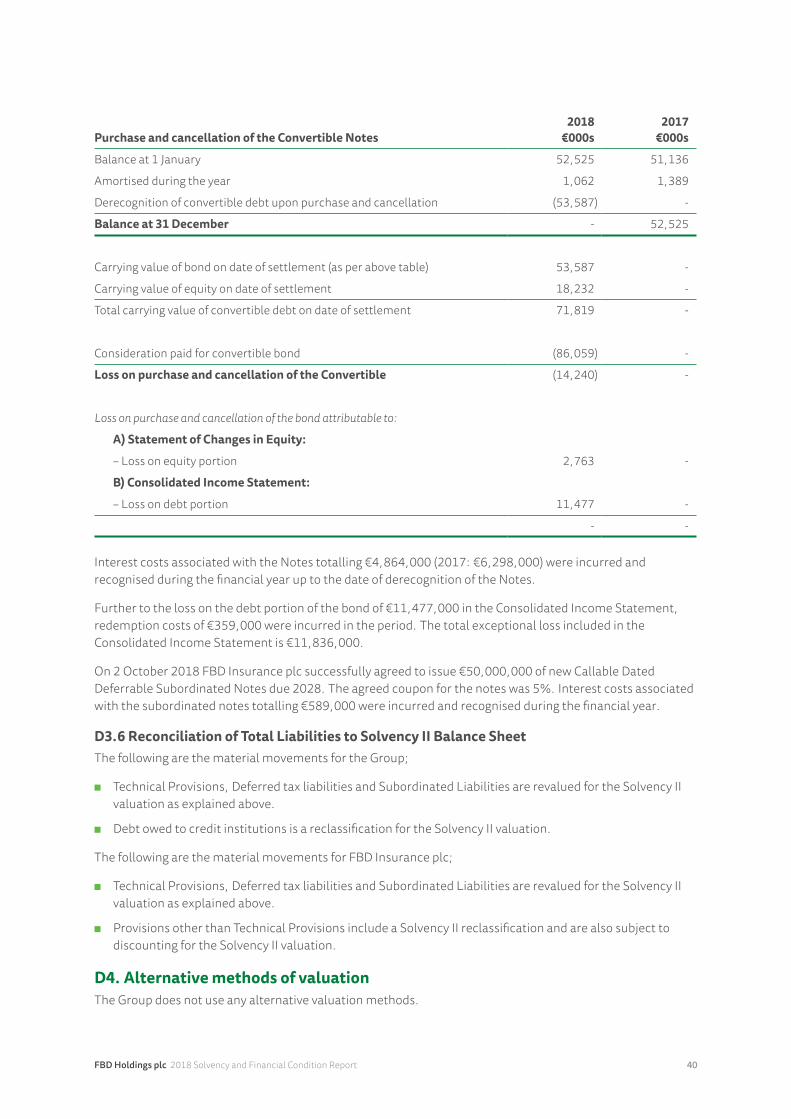
FBD Holdings plc 2018 Solvency and Financial Condition Report 40
Purchase and cancellation of the Convertible Notes2018
€000s2017
€000s
Balance at 1 January 52,525 51,136
Amortised during the year 1,062 1,389
Derecognition of convertible debt upon purchase and cancellation (53,587) -
Balance at 31 December - 52,525
Carrying value of bond on date of settlement (as per above table) 53,587 -
Carrying value of equity on date of settlement 18,232 -
Total carrying value of convertible debt on date of settlement 71,819 -
Consideration paid for convertible bond (86,059) -
Loss on purchase and cancellation of the Convertible (14,240) -
Lossonpurchaseandcancellationofthebondattributableto:
A) Statement of Changes in Equity:
– Loss on equity portion 2,763 -
B) Consolidated Income Statement:
– Loss on debt portion 11,477 -
- -
Interest costs associated with the Notes totalling €4,864,000 (2017: €6,298,000) were incurred and recognised during the financial year up to the date of derecognition of the Notes.
Further to the loss on the debt portion of the bond of €11,477,000 in the Consolidated Income Statement, redemption costs of €359,000 were incurred in the period. The total exceptional loss included in the Consolidated Income Statement is €11,836,000.
On 2 October 2018 FBD Insurance plc successfully agreed to issue €50,000,000 of new Callable Dated Deferrable Subordinated Notes due 2028. The agreed coupon for the notes was 5%. Interest costs associated with the subordinated notes totalling €589,000 were incurred and recognised during the financial year.
D3.6 Reconciliation of Total Liabilities to Solvency II Balance SheetThe following are the material movements for the Group;
n Technical Provisions, Deferred tax liabilities and Subordinated Liabilities are revalued for the Solvency II valuation as explained above.
n Debt owed to credit institutions is a reclassification for the Solvency II valuation.
The following are the material movements for FBD Insurance plc;
n Technical Provisions, Deferred tax liabilities and Subordinated Liabilities are revalued for the Solvency II valuation as explained above.
n Provisions other than Technical Provisions include a Solvency II reclassification and are also subject to discounting for the Solvency II valuation.
D4. Alternative methods of valuationThe Group does not use any alternative valuation methods.
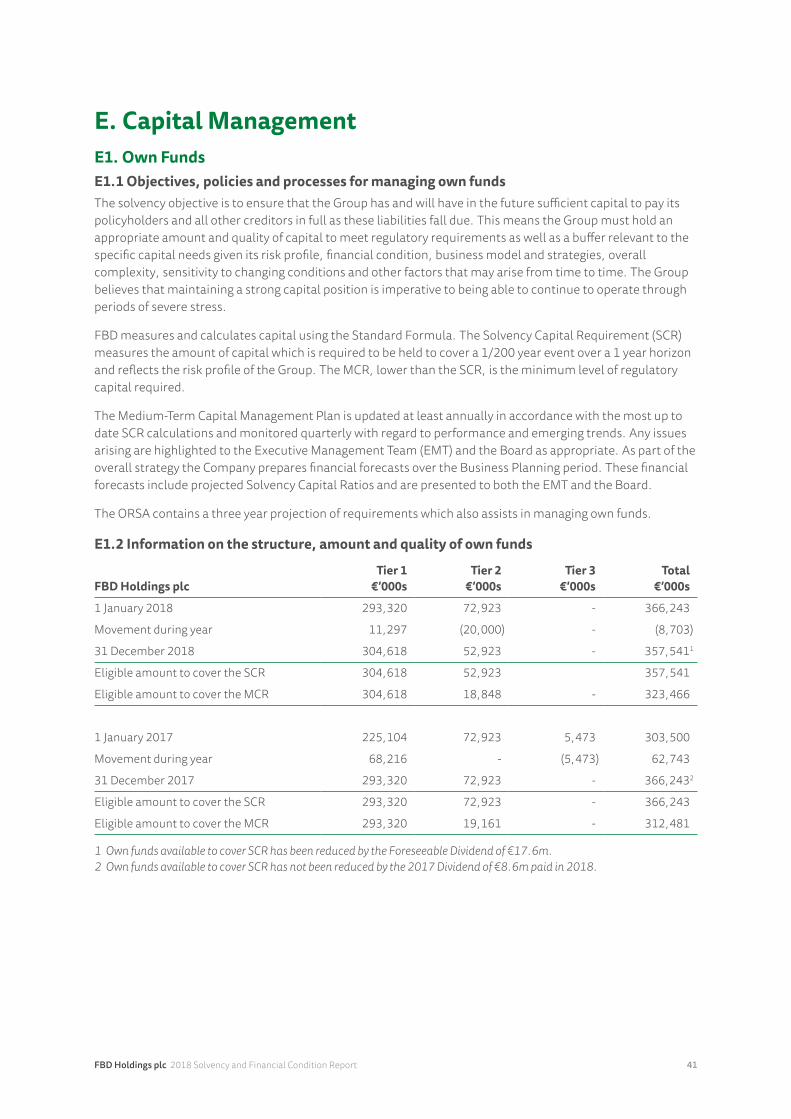
FBD Holdings plc 2018 Solvency and Financial Condition Report 41
E. Capital ManagementE1. Own FundsE1.1 Objectives, policies and processes for managing own fundsThe solvency objective is to ensure that the Group has and will have in the future sufficient capital to pay its policyholders and all other creditors in full as these liabilities fall due. This means the Group must hold an appropriate amount and quality of capital to meet regulatory requirements as well as a buffer relevant to the specific capital needs given its risk profile, financial condition, business model and strategies, overall complexity, sensitivity to changing conditions and other factors that may arise from time to time. The Group believes that maintaining a strong capital position is imperative to being able to continue to operate through periods of severe stress.
FBD measures and calculates capital using the Standard Formula. The Solvency Capital Requirement (SCR) measures the amount of capital which is required to be held to cover a 1/200 year event over a 1 year horizon and reflects the risk profile of the Group. The MCR, lower than the SCR, is the minimum level of regulatory capital required.
The Medium-Term Capital Management Plan is updated at least annually in accordance with the most up to date SCR calculations and monitored quarterly with regard to performance and emerging trends. Any issues arising are highlighted to the Executive Management Team (EMT) and the Board as appropriate. As part of the overall strategy the Company prepares financial forecasts over the Business Planning period. These financial forecasts include projected Solvency Capital Ratios and are presented to both the EMT and the Board.
The ORSA contains a three year projection of requirements which also assists in managing own funds.
E1.2 Information on the structure, amount and quality of own funds
FBD Holdings plcTier 1
€’000s Tier 2
€’000s Tier 3
€’000s Total
€’000s
1 January 2018 293,320 72,923 - 366,243
Movement during year 11,297 (20,000) - (8,703)
31 December 2018 304,618 52,923 - 357,5411
Eligible amount to cover the SCR 304,618 52,923 357,541
Eligible amount to cover the MCR 304,618 18,848 - 323,466
1 January 2017 225,104 72,923 5,473 303,500
Movement during year 68,216 - (5,473) 62,743
31 December 2017 293,320 72,923 - 366,2432
Eligible amount to cover the SCR 293,320 72,923 - 366,243
Eligible amount to cover the MCR 293,320 19,161 - 312,481
1 OwnfundsavailabletocoverSCRhasbeenreducedbytheForeseeableDividendof€17.6m.2 OwnfundsavailabletocoverSCRhasnotbeenreducedbythe2017Dividendof€8.6mpaidin2018.
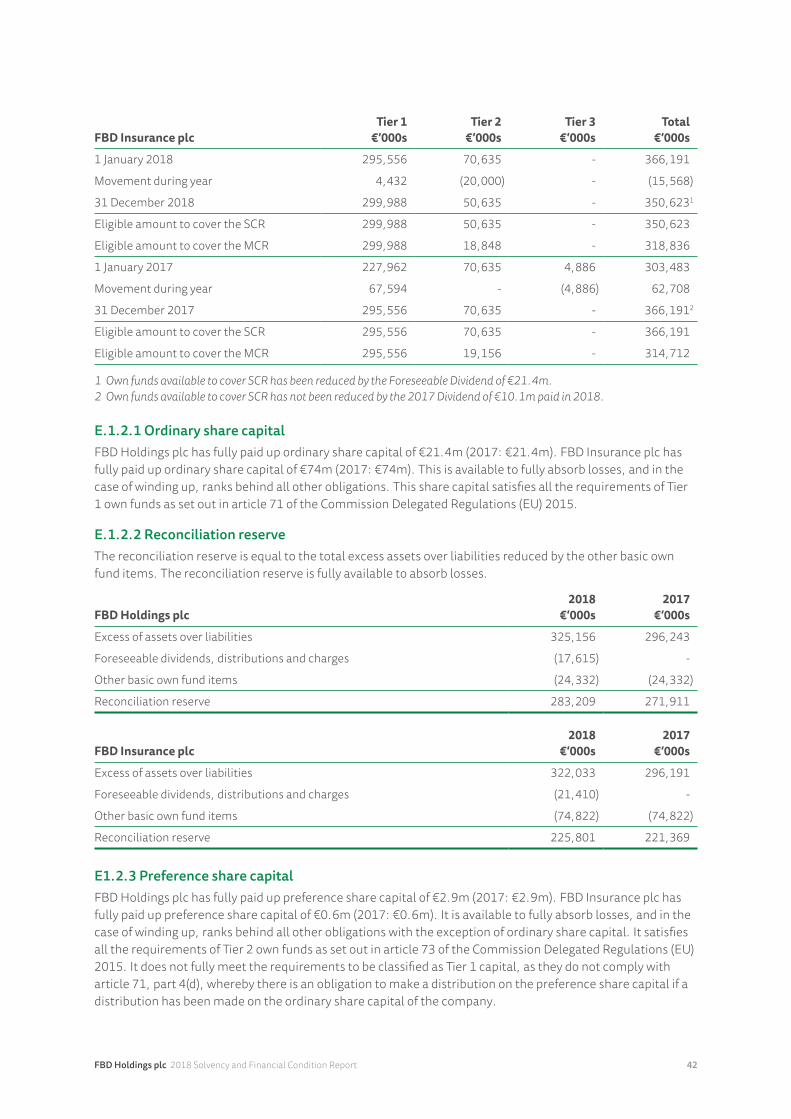
FBD Holdings plc 2018 Solvency and Financial Condition Report 42
FBD Insurance plcTier 1
€’000s Tier 2
€’000s Tier 3
€’000s Total
€’000s
1 January 2018 295,556 70,635 - 366,191
Movement during year 4,432 (20,000) - (15,568)
31 December 2018 299,988 50,635 - 350,6231
Eligible amount to cover the SCR 299,988 50,635 - 350,623
Eligible amount to cover the MCR 299,988 18,848 - 318,836
1 January 2017 227,962 70,635 4,886 303,483
Movement during year 67,594 - (4,886) 62,708
31 December 2017 295,556 70,635 - 366,1912
Eligible amount to cover the SCR 295,556 70,635 - 366,191
Eligible amount to cover the MCR 295,556 19,156 - 314,712
1 OwnfundsavailabletocoverSCRhasbeenreducedbytheForeseeableDividendof€21.4m.2 OwnfundsavailabletocoverSCRhasnotbeenreducedbythe2017Dividendof€10.1mpaidin2018.
E.1.2.1 Ordinary share capitalFBD Holdings plc has fully paid up ordinary share capital of €21.4m (2017: €21.4m). FBD Insurance plc has fully paid up ordinary share capital of €74m (2017: €74m). This is available to fully absorb losses, and in the case of winding up, ranks behind all other obligations. This share capital satisfies all the requirements of Tier 1 own funds as set out in article 71 of the Commission Delegated Regulations (EU) 2015.
E.1.2.2 Reconciliation reserveThe reconciliation reserve is equal to the total excess assets over liabilities reduced by the other basic own fund items. The reconciliation reserve is fully available to absorb losses.
FBD Holdings plc2018
€’000s 2017
€’000s
Excess of assets over liabilities 325,156 296,243
Foreseeable dividends, distributions and charges (17,615) -
Other basic own fund items (24,332) (24,332)
Reconciliation reserve 283,209 271,911
FBD Insurance plc2018
€’000s 2017
€’000s
Excess of assets over liabilities 322,033 296,191
Foreseeable dividends, distributions and charges (21,410) -
Other basic own fund items (74,822) (74,822)
Reconciliation reserve 225,801 221,369
E1.2.3 Preference share capitalFBD Holdings plc has fully paid up preference share capital of €2.9m (2017: €2.9m). FBD Insurance plc has fully paid up preference share capital of €0.6m (2017: €0.6m). It is available to fully absorb losses, and in the case of winding up, ranks behind all other obligations with the exception of ordinary share capital. It satisfies all the requirements of Tier 2 own funds as set out in article 73 of the Commission Delegated Regulations (EU) 2015. It does not fully meet the requirements to be classified as Tier 1 capital, as they do not comply with article 71, part 4(d), whereby there is an obligation to make a distribution on the preference share capital if a distribution has been made on the ordinary share capital of the company.
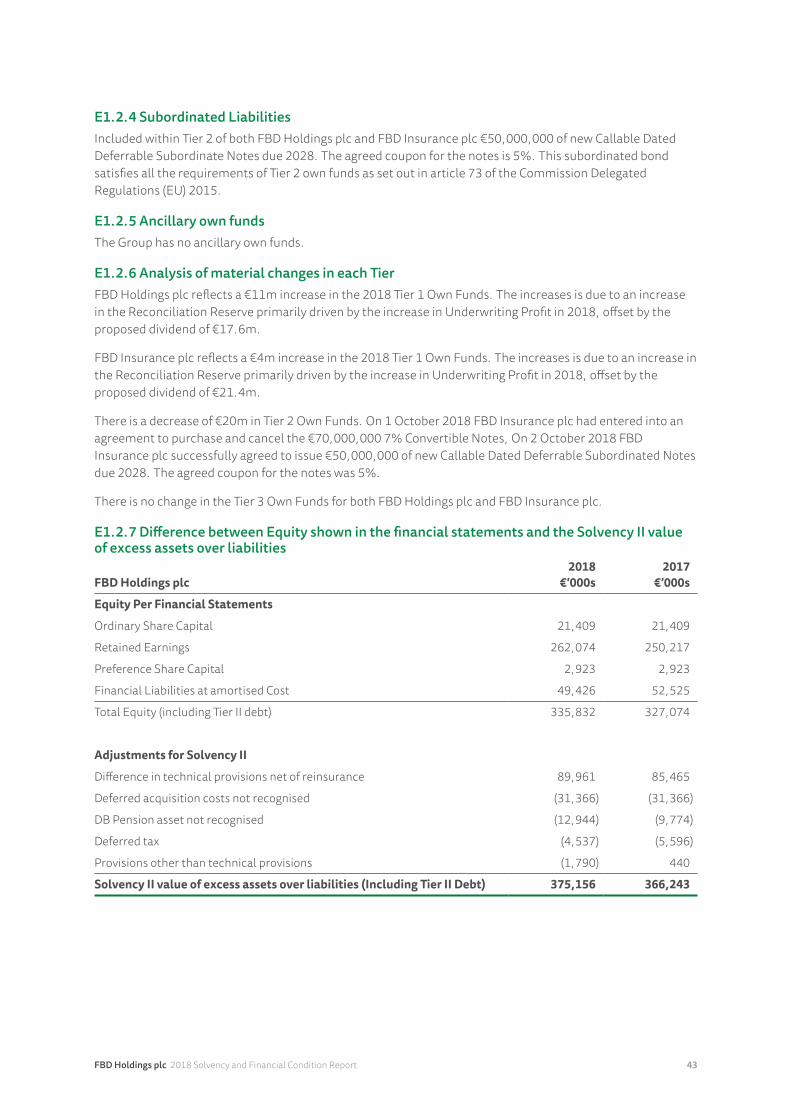
FBD Holdings plc 2018 Solvency and Financial Condition Report 43
E1.2.4 Subordinated LiabilitiesIncluded within Tier 2 of both FBD Holdings plc and FBD Insurance plc €50,000,000 of new Callable Dated Deferrable Subordinate Notes due 2028. The agreed coupon for the notes is 5%. This subordinated bond satisfies all the requirements of Tier 2 own funds as set out in article 73 of the Commission Delegated Regulations (EU) 2015.
E1.2.5 Ancillary own fundsThe Group has no ancillary own funds.
E1.2.6 Analysis of material changes in each TierFBD Holdings plc reflects a €11m increase in the 2018 Tier 1 Own Funds. The increases is due to an increase in the Reconciliation Reserve primarily driven by the increase in Underwriting Profit in 2018, offset by the proposed dividend of €17.6m.
FBD Insurance plc reflects a €4m increase in the 2018 Tier 1 Own Funds. The increases is due to an increase in the Reconciliation Reserve primarily driven by the increase in Underwriting Profit in 2018, offset by the proposed dividend of €21.4m.
There is a decrease of €20m in Tier 2 Own Funds. On 1 October 2018 FBD Insurance plc had entered into an agreement to purchase and cancel the €70,000,000 7% Convertible Notes, On 2 October 2018 FBD Insurance plc successfully agreed to issue €50,000,000 of new Callable Dated Deferrable Subordinated Notes due 2028. The agreed coupon for the notes was 5%.
There is no change in the Tier 3 Own Funds for both FBD Holdings plc and FBD Insurance plc.
E1.2.7 Difference between Equity shown in the financial statements and the Solvency II value of excess assets over liabilities
FBD Holdings plc2018
€’000s 2017
€’000s
Equity Per Financial Statements
Ordinary Share Capital 21,409 21,409
Retained Earnings 262,074 250,217
Preference Share Capital 2,923 2,923
Financial Liabilities at amortised Cost 49,426 52,525
Total Equity (including Tier II debt) 335,832 327,074
Adjustments for Solvency II
Difference in technical provisions net of reinsurance 89,961 85,465
Deferred acquisition costs not recognised (31,366) (31,366)
DB Pension asset not recognised (12,944) (9,774)
Deferred tax (4,537) (5,596)
Provisions other than technical provisions (1,790) 440
Solvency II value of excess assets over liabilities (Including Tier II Debt) 375,156 366,243
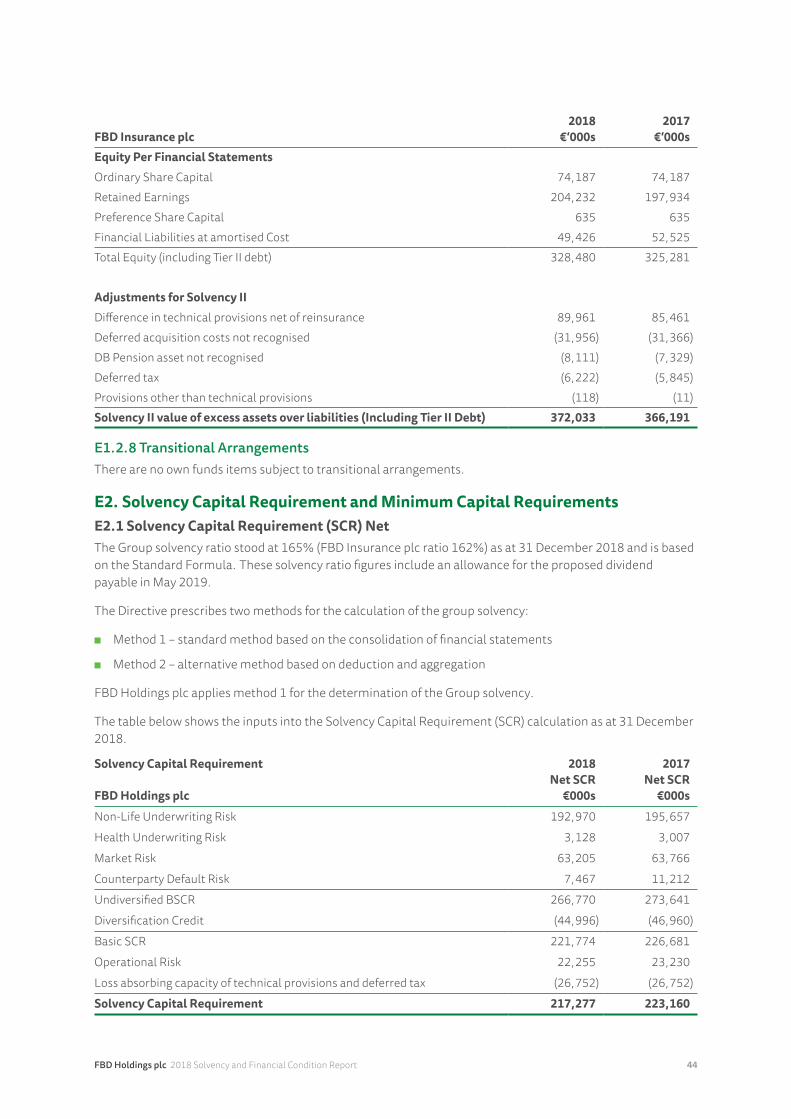
FBD Holdings plc 2018 Solvency and Financial Condition Report 44
FBD Insurance plc2018
€’000s 2017
€’000s Equity Per Financial Statements Ordinary Share Capital 74,187 74,187Retained Earnings 204,232 197,934Preference Share Capital 635 635Financial Liabilities at amortised Cost 49,426 52,525Total Equity (including Tier II debt) 328,480 325,281
Adjustments for Solvency II Difference in technical provisions net of reinsurance 89,961 85,461Deferred acquisition costs not recognised (31,956) (31,366)DB Pension asset not recognised (8,111) (7,329)Deferred tax (6,222) (5,845)Provisions other than technical provisions (118) (11)Solvency II value of excess assets over liabilities (Including Tier II Debt) 372,033 366,191
E1.2.8 Transitional ArrangementsThere are no own funds items subject to transitional arrangements.
E2. Solvency Capital Requirement and Minimum Capital RequirementsE2.1 Solvency Capital Requirement (SCR) NetThe Group solvency ratio stood at 165% (FBD Insurance plc ratio 162%) as at 31 December 2018 and is based on the Standard Formula. These solvency ratio figures include an allowance for the proposed dividend payable in May 2019.
The Directive prescribes two methods for the calculation of the group solvency:
n Method 1 – standard method based on the consolidation of financial statements
n Method 2 – alternative method based on deduction and aggregation
FBD Holdings plc applies method 1 for the determination of the Group solvency.
The table below shows the inputs into the Solvency Capital Requirement (SCR) calculation as at 31 December 2018.
Solvency Capital Requirement
FBD Holdings plc
2018Net SCR
€000s
2017Net SCR
€000sNon-Life Underwriting Risk 192,970 195,657
Health Underwriting Risk 3,128 3,007
Market Risk 63,205 63,766
Counterparty Default Risk 7,467 11,212
Undiversified BSCR 266,770 273,641
Diversification Credit (44,996) (46,960)
Basic SCR 221,774 226,681
Operational Risk 22,255 23,230
Loss absorbing capacity of technical provisions and deferred tax (26,752) (26,752)
Solvency Capital Requirement 217,277 223,160
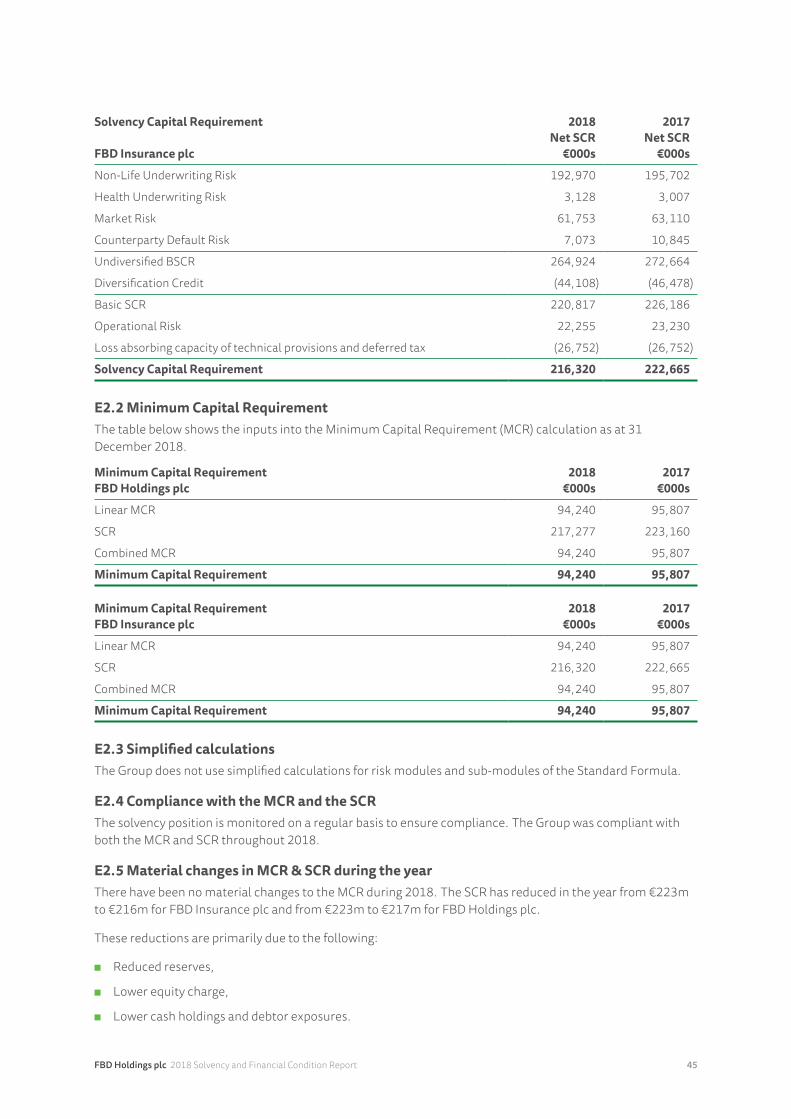
FBD Holdings plc 2018 Solvency and Financial Condition Report 45
Solvency Capital Requirement
FBD Insurance plc
2018Net SCR
€000s
2017Net SCR
€000s
Non-Life Underwriting Risk 192,970 195,702
Health Underwriting Risk 3,128 3,007
Market Risk 61,753 63,110
Counterparty Default Risk 7,073 10,845
Undiversified BSCR 264,924 272,664
Diversification Credit (44,108) (46,478)
Basic SCR 220,817 226,186
Operational Risk 22,255 23,230
Loss absorbing capacity of technical provisions and deferred tax (26,752) (26,752)
Solvency Capital Requirement 216,320 222,665
E2.2 Minimum Capital RequirementThe table below shows the inputs into the Minimum Capital Requirement (MCR) calculation as at 31 December 2018.
Minimum Capital RequirementFBD Holdings plc
2018€000s
2017€000s
Linear MCR 94,240 95,807
SCR 217,277 223,160
Combined MCR 94,240 95,807
Minimum Capital Requirement 94,240 95,807
Minimum Capital RequirementFBD Insurance plc
2018€000s
2017€000s
Linear MCR 94,240 95,807
SCR 216,320 222,665
Combined MCR 94,240 95,807
Minimum Capital Requirement 94,240 95,807
E2.3 Simplified calculationsThe Group does not use simplified calculations for risk modules and sub-modules of the Standard Formula.
E2.4 Compliance with the MCR and the SCRThe solvency position is monitored on a regular basis to ensure compliance. The Group was compliant with both the MCR and SCR throughout 2018.
E2.5 Material changes in MCR & SCR during the yearThere have been no material changes to the MCR during 2018. The SCR has reduced in the year from €223m to €216m for FBD Insurance plc and from €223m to €217m for FBD Holdings plc.
These reductions are primarily due to the following:
n Reduced reserves,
n Lower equity charge,
n Lower cash holdings and debtor exposures.
FBD Holdings plc 2018 Solvency and Financial Condition Report 46
F. AppendicesFBD Holdings plc Quantitative Reporting TemplatesS.02.01.02 – Balance Sheet
S.05.01.02 – Premiums, claims and expenses by line of business
S.05.02.01 – Premiums, claims and expenses by country
S.23.01.22 – Own Funds
S.25.01.22 – Solvency Capital Requirement – for Groups on Standard Formula
S.32.01.22 – Undertakings in the scope of the Group
FBD Insurance plc Quantitative Reporting TemplatesS.02.01.02 – Balance Sheet
S.05.01.02 – Premiums, claims and expenses by line of business
S.05.02.01 – Premiums, claims and expenses by country
S.17.01.02 – Non-Life Technical Provisions
S.19.01.21 – Non-Life Insurance Claims
S.23.01.01 – Own Funds
S.25.01.21 – Solvency Capital Requirement – for Undertakings on Standard Formula
S.28.01.01 – Minimum Capital Requirement – Only life or only non-life insurance or reinsurance activity
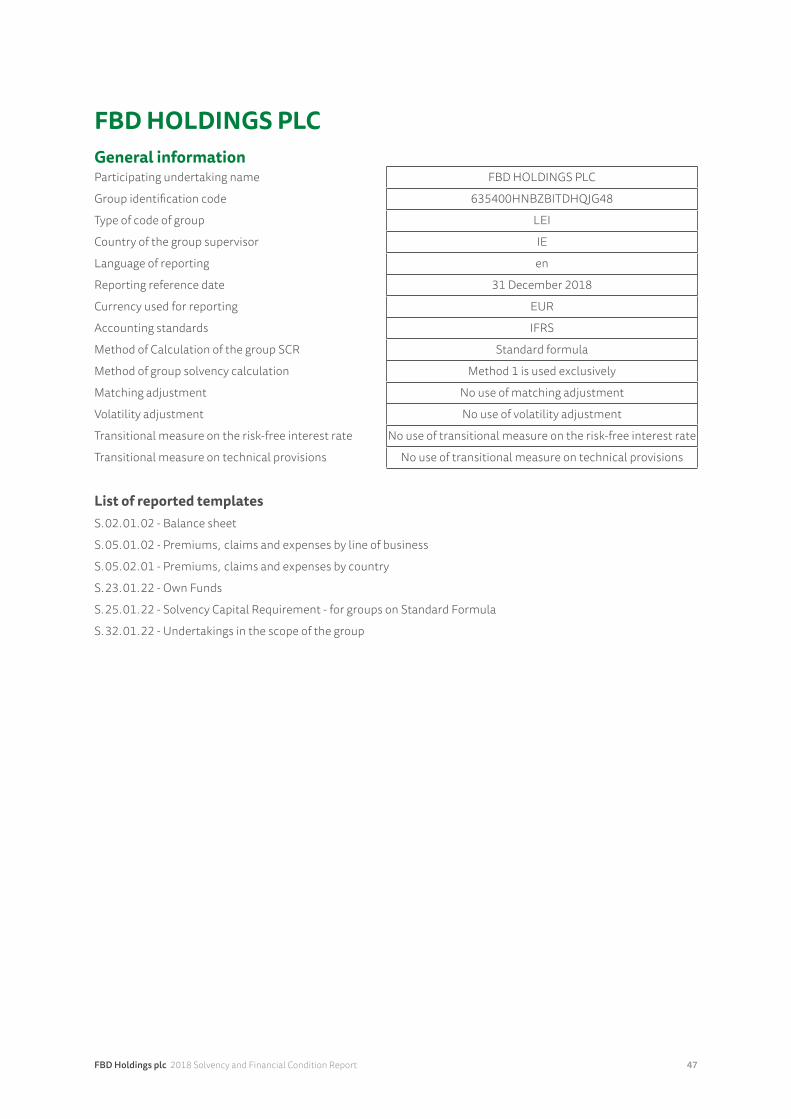
FBD Holdings plc 2018 Solvency and Financial Condition Report 47
FBD HOLDINGS PLCGeneral informationParticipating undertaking name FBD HOLDINGS PLC
Group identification code 635400HNBZBITDHQJG48
Type of code of group LEI
Country of the group supervisor IE
Language of reporting en
Reporting reference date 31 December 2018
Currency used for reporting EUR
Accounting standards IFRS
Method of Calculation of the group SCR Standard formula
Method of group solvency calculation Method 1 is used exclusively
Matching adjustment No use of matching adjustment
Volatility adjustment No use of volatility adjustment
Transitional measure on the risk-free interest rate No use of transitional measure on the risk-free interest rate
Transitional measure on technical provisions No use of transitional measure on technical provisions
List of reported templatesS.02.01.02 - Balance sheet
S.05.01.02 - Premiums, claims and expenses by line of business
S.05.02.01 - Premiums, claims and expenses by country
S.23.01.22 - Own Funds
S.25.01.22 - Solvency Capital Requirement - for groups on Standard Formula
S.32.01.22 - Undertakings in the scope of the group
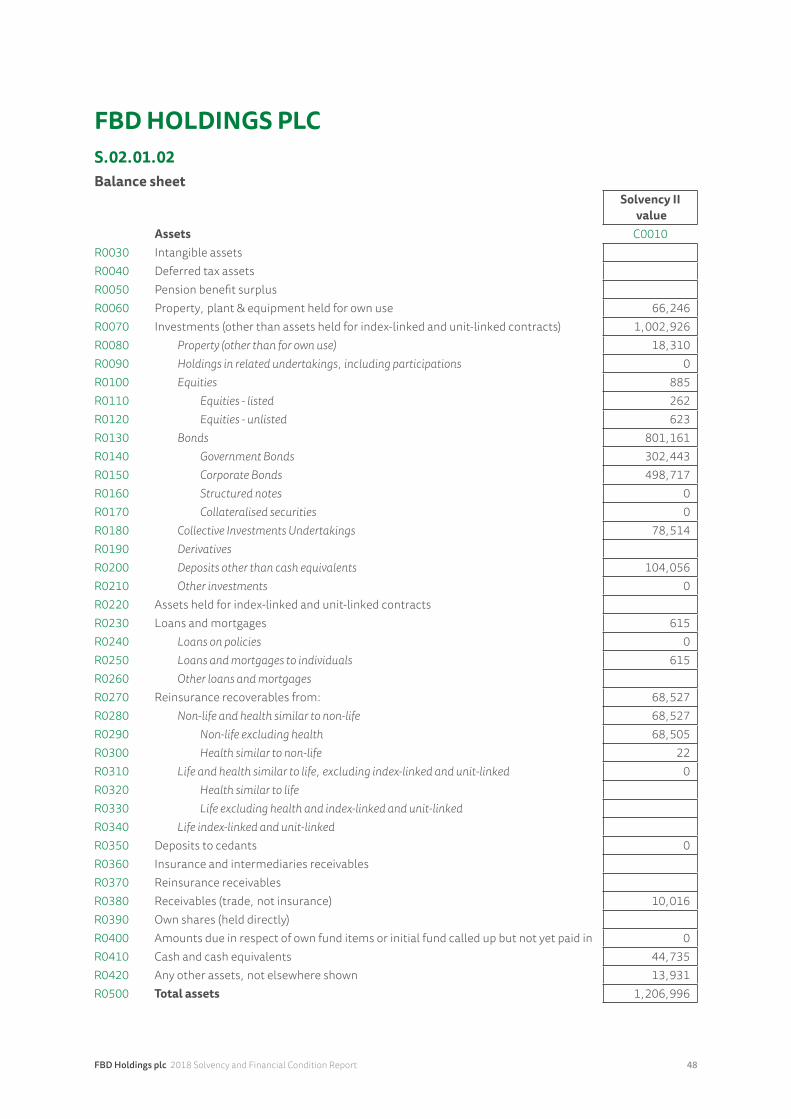
FBD Holdings plc 2018 Solvency and Financial Condition Report 48
FBD HOLDINGS PLCS.02.01.02Balance sheet
Solvency II value
Assets C0010R0030 Intangible assetsR0040 Deferred tax assetsR0050 Pension benefit surplusR0060 Property, plant & equipment held for own use 66,246R0070 Investments (other than assets held for index-linked and unit-linked contracts) 1,002,926R0080 Property(otherthanforownuse) 18,310R0090 Holdingsinrelatedundertakings,includingparticipations 0R0100 Equities 885R0110 Equities-listed 262R0120 Equities-unlisted 623R0130 Bonds 801,161R0140 GovernmentBonds 302,443R0150 CorporateBonds 498,717R0160 Structurednotes 0R0170 Collateralisedsecurities 0R0180 CollectiveInvestmentsUndertakings 78,514R0190 DerivativesR0200 Depositsotherthancashequivalents 104,056R0210 Otherinvestments 0R0220 Assets held for index-linked and unit-linked contractsR0230 Loans and mortgages 615R0240 Loansonpolicies 0R0250 Loansandmortgagestoindividuals 615R0260 OtherloansandmortgagesR0270 Reinsurance recoverables from: 68,527R0280 Non-lifeandhealthsimilartonon-life 68,527R0290 Non-lifeexcludinghealth 68,505R0300 Healthsimilartonon-life 22R0310 Lifeandhealthsimilartolife,excludingindex-linkedandunit-linked 0R0320 HealthsimilartolifeR0330 Lifeexcludinghealthandindex-linkedandunit-linkedR0340 Lifeindex-linkedandunit-linkedR0350 Deposits to cedants 0R0360 Insurance and intermediaries receivablesR0370 Reinsurance receivablesR0380 Receivables (trade, not insurance) 10,016R0390 Own shares (held directly)R0400 Amounts due in respect of own fund items or initial fund called up but not yet paid in 0R0410 Cash and cash equivalents 44,735R0420 Any other assets, not elsewhere shown 13,931R0500 Total assets 1,206,996
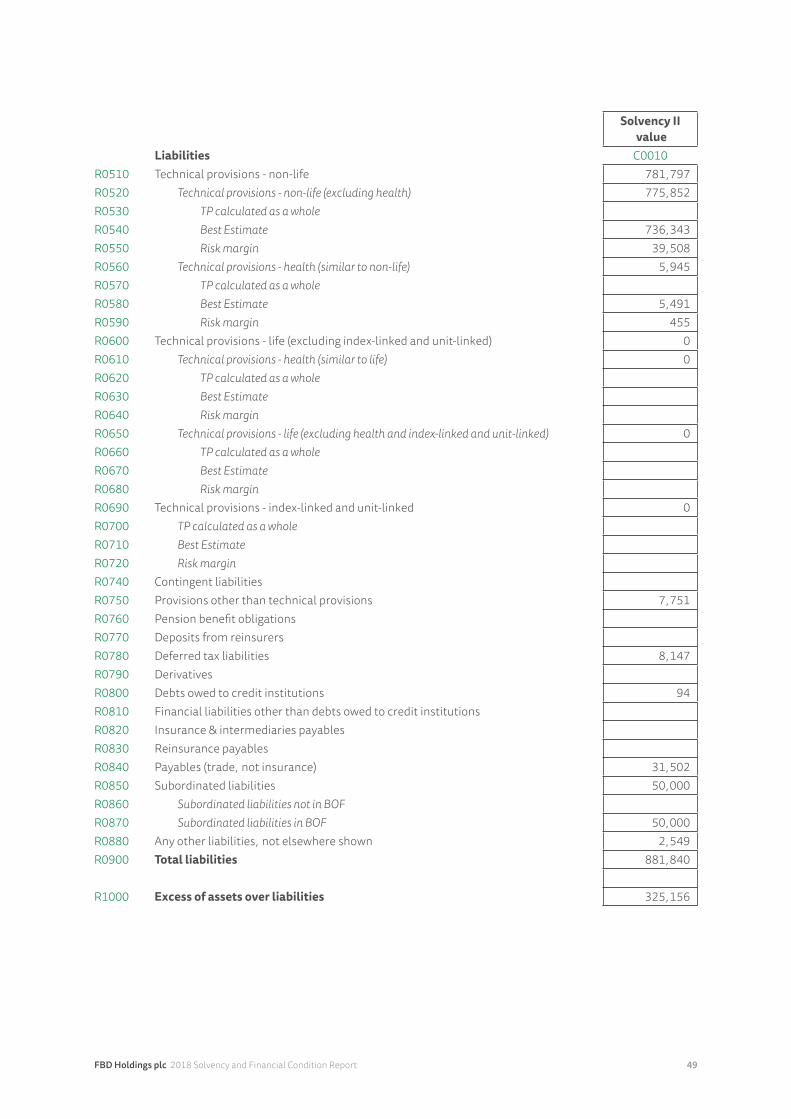
FBD Holdings plc 2018 Solvency and Financial Condition Report 49
Solvency II value
Liabilities C0010R0510 Technical provisions - non-life 781,797R0520 Technicalprovisions-non-life(excludinghealth) 775,852R0530 TPcalculatedasawholeR0540 BestEstimate 736,343R0550 Riskmargin 39,508R0560 Technicalprovisions-health(similartonon-life) 5,945R0570 TPcalculatedasawholeR0580 BestEstimate 5,491R0590 Riskmargin 455R0600 Technical provisions - life (excluding index-linked and unit-linked) 0R0610 Technicalprovisions-health(similartolife) 0R0620 TPcalculatedasawholeR0630 BestEstimateR0640 RiskmarginR0650 Technicalprovisions-life(excludinghealthandindex-linkedandunit-linked) 0R0660 TPcalculatedasawholeR0670 BestEstimateR0680 RiskmarginR0690 Technical provisions - index-linked and unit-linked 0R0700 TPcalculatedasawholeR0710 BestEstimateR0720 RiskmarginR0740 Contingent liabilitiesR0750 Provisions other than technical provisions 7,751R0760 Pension benefit obligationsR0770 Deposits from reinsurersR0780 Deferred tax liabilities 8,147R0790 DerivativesR0800 Debts owed to credit institutions 94R0810 Financial liabilities other than debts owed to credit institutionsR0820 Insurance & intermediaries payablesR0830 Reinsurance payablesR0840 Payables (trade, not insurance) 31,502R0850 Subordinated liabilities 50,000R0860 SubordinatedliabilitiesnotinBOFR0870 SubordinatedliabilitiesinBOF 50,000R0880 Any other liabilities, not elsewhere shown 2,549R0900 Total liabilities 881,840
R1000 Excess of assets over liabilities 325,156
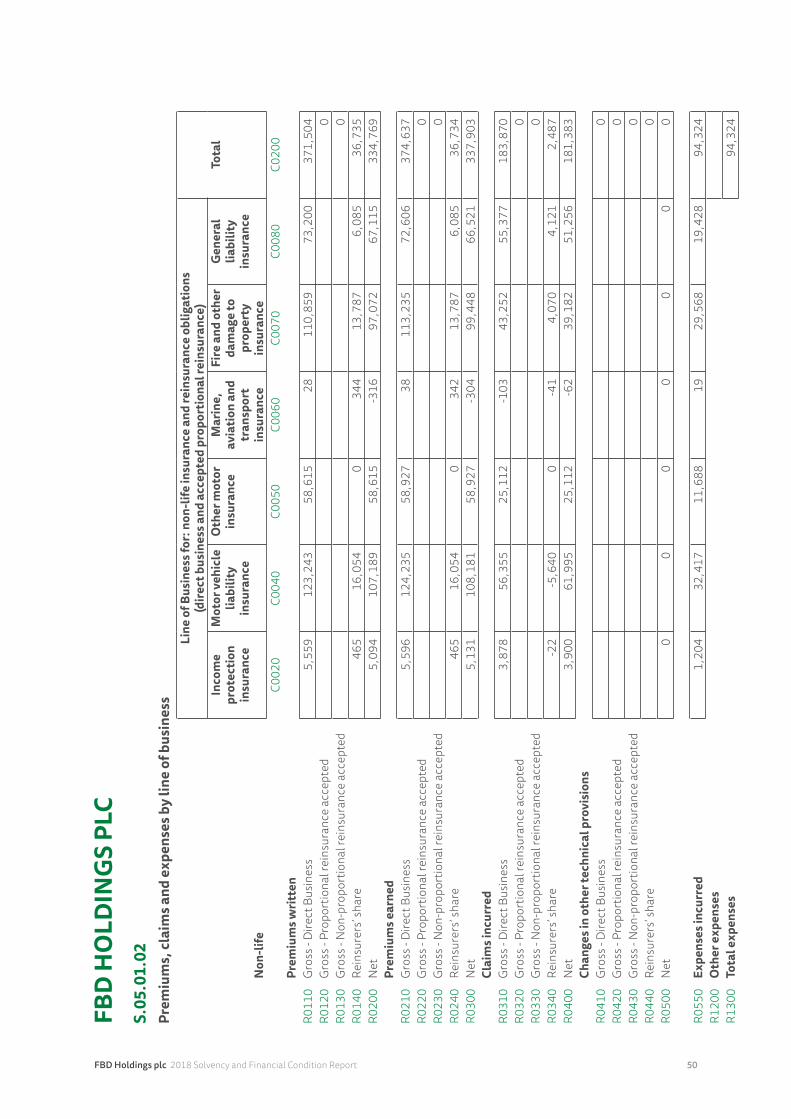
FBD Holdings plc 2018 Solvency and Financial Condition Report 50
FBD
HO
LDIN
GS
PLC
S.05
.01.
02Pr
emiu
ms,
clai
ms a
nd e
xpen
ses b
y lin
e of
bus
ines
sLi
ne o
f Bus
ines
s for
: non
-life
insu
ranc
e an
d re
insu
ranc
e ob
ligat
ions
(d
irect
bus
ines
s and
acc
epte
d pr
opor
tiona
l rei
nsur
ance
)
Non
-life
Inco
me
prot
ectio
n in
sura
nce
Mot
or v
ehic
le
liabi
lity
insu
ranc
e
Oth
er m
otor
in
sura
nce
Mar
ine,
av
iatio
n an
d tr
ansp
ort
insu
ranc
e
Fire
and
oth
er
dam
age
to
prop
erty
in
sura
nce
Gen
eral
lia
bilit
y in
sura
nce
Tota
l
C002
0C0
040
C005
0C0
060
C007
0C0
080
C020
0Pr
emiu
ms w
ritte
nR0
110
Gro
ss -
Dire
ct B
usin
ess
5,55
912
3,24
358
,615
2811
0,85
973
,200
371,
504
R012
0G
ross
- Pr
opor
tiona
l rei
nsur
ance
acc
epte
d 0
R013
0G
ross
- N
on-p
ropo
rtio
nal r
eins
uran
ce a
ccep
ted
0R0
140
Rein
sure
rs’ s
hare
465
16,0
540
344
13,7
876,
085
36,7
35R0
200
Net
5,09
410
7,18
958
,615
-316
97,0
7267
,115
334,
769
Prem
ium
s ear
ned
R021
0G
ross
- D
irect
Bus
ines
s5,
596
124,
235
58,9
2738
113,
235
72,6
0637
4,63
7R0
220
Gro
ss -
Prop
ortio
nal r
eins
uran
ce a
ccep
ted
0R0
230
Gro
ss -
Non
-pro
port
iona
l rei
nsur
ance
acc
epte
d 0
R024
0Re
insu
rers
’ sha
re46
516
,054
034
213
,787
6,08
536
,734
R030
0N
et5,
131
108,
181
58,9
27-3
0499
,448
66,5
2133
7,90
3Cl
aim
s inc
urre
dR0
310
Gro
ss -
Dire
ct B
usin
ess
3,87
856
,355
25,1
12-1
0343
,252
55,3
7718
3,87
0R0
320
Gro
ss -
Prop
ortio
nal r
eins
uran
ce a
ccep
ted
0R0
330
Gro
ss -
Non
-pro
port
iona
l rei
nsur
ance
acc
epte
d 0
R034
0Re
insu
rers
’ sha
re-2
2-5
,640
0-4
14,
070
4,12
12,
487
R040
0N
et3,
900
61,9
9525
,112
-62
39,1
8251
,256
181,
383
Chan
ges i
n ot
her t
echn
ical
pro
visi
ons
R041
0G
ross
- D
irect
Bus
ines
s0
R042
0G
ross
- Pr
opor
tiona
l rei
nsur
ance
acc
epte
d 0
R043
0G
ross
- N
on-p
ropo
rtio
nal r
eins
uran
ce a
ccep
ted
0R0
440
Rein
sure
rs’ s
hare
0R0
500
Net
00
00
00
0
R055
0Ex
pens
es in
curr
ed1,
204
32,4
1711
,688
1929
,568
19,4
2894
,324
R120
0O
ther
exp
ense
sR1
300
Tota
l exp
ense
s94
,324
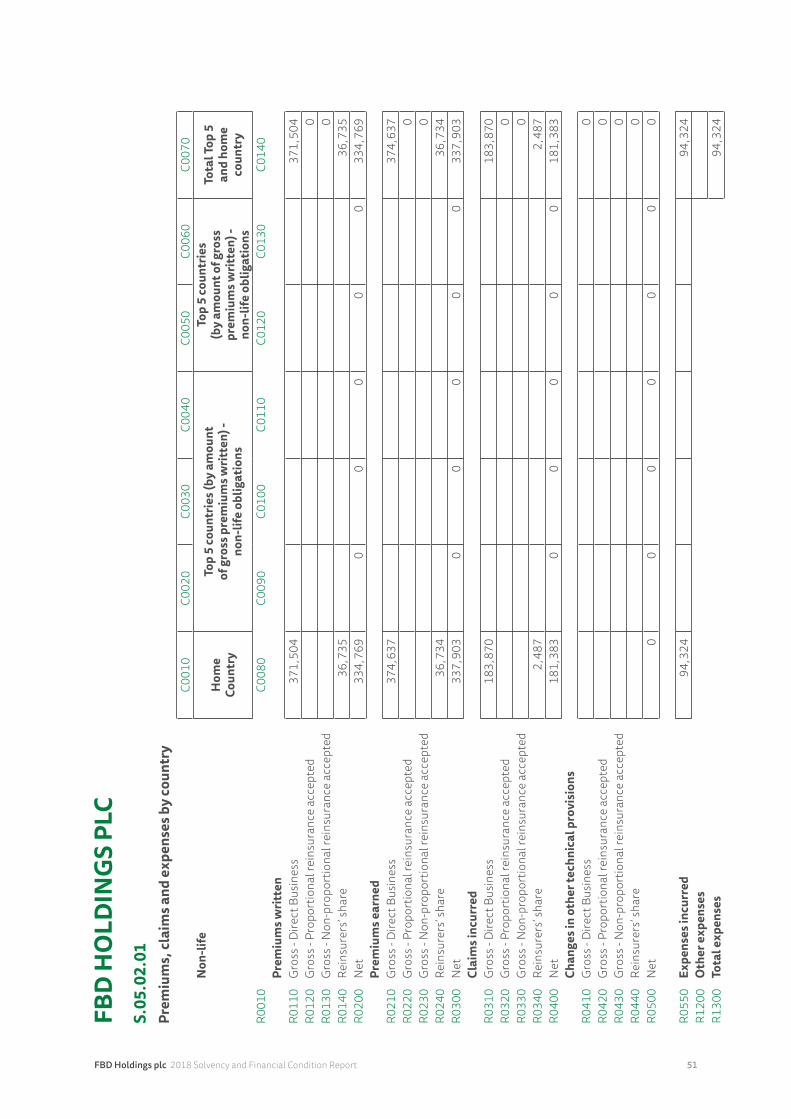
FBD Holdings plc 2018 Solvency and Financial Condition Report 51
FBD
HO
LDIN
GS
PLC
S.05
.02.
01Pr
emiu
ms,
clai
ms a
nd e
xpen
ses b
y co
untr
yC0
010
C002
0C0
030
C004
0C0
050
C006
0C0
070
Non
-life
Hom
e Co
untr
y
Top
5 co
untr
ies (
by a
mou
nt
of g
ross
pre
miu
ms w
ritte
n) -
no
n-lif
e ob
ligat
ions
Top
5 co
untr
ies
(by
amou
nt o
f gro
ss
prem
ium
s writ
ten)
-
non-
life
oblig
atio
ns
Tota
l Top
5
and
hom
e co
untr
y
R001
0C0
080
C009
0C0
100
C011
0C0
120
C013
0C0
140
Prem
ium
s writ
ten
R011
0G
ross
- D
irect
Bus
ines
s37
1,50
437
1,50
4R0
120
Gro
ss -
Prop
ortio
nal r
eins
uran
ce a
ccep
ted
0R0
130
Gro
ss -
Non
-pro
port
iona
l rei
nsur
ance
acc
epte
d 0
R014
0Re
insu
rers
’ sha
re36
,735
36,7
35R0
200
Net
334,
769
00
00
033
4,76
9Pr
emiu
ms e
arne
dR0
210
Gro
ss -
Dire
ct B
usin
ess
374,
637
374,
637
R022
0G
ross
- Pr
opor
tiona
l rei
nsur
ance
acc
epte
d 0
R023
0G
ross
- N
on-p
ropo
rtio
nal r
eins
uran
ce a
ccep
ted
0R0
240
Rein
sure
rs’ s
hare
36,7
3436
,734
R030
0N
et33
7,90
30
00
00
337,
903
Clai
ms i
ncur
red
R031
0G
ross
- D
irect
Bus
ines
s18
3,87
018
3,87
0R0
320
Gro
ss -
Prop
ortio
nal r
eins
uran
ce a
ccep
ted
0R0
330
Gro
ss -
Non
-pro
port
iona
l rei
nsur
ance
acc
epte
d 0
R034
0Re
insu
rers
’ sha
re2,
487
2,48
7R0
400
Net
181,
383
00
00
018
1,38
3Ch
ange
s in
othe
r tec
hnic
al p
rovi
sion
sR0
410
Gro
ss -
Dire
ct B
usin
ess
0R0
420
Gro
ss -
Prop
ortio
nal r
eins
uran
ce a
ccep
ted
0R0
430
Gro
ss -
Non
-pro
port
iona
l rei
nsur
ance
acc
epte
d 0
R044
0Re
insu
rers
’ sha
re0
R050
0N
et0
00
00
00
R055
0Ex
pens
es in
curr
ed94
,324
94,3
24R1
200
Oth
er e
xpen
ses
R130
0To
tal e
xpen
ses
94,3
24
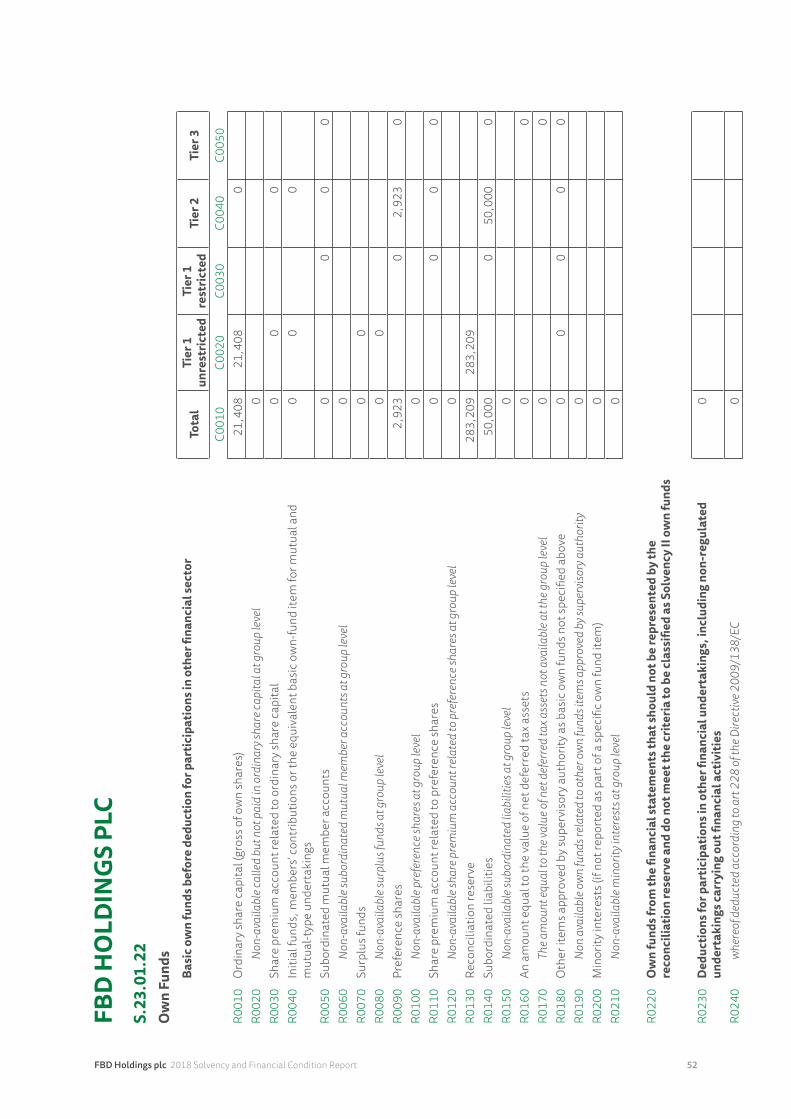
FBD Holdings plc 2018 Solvency and Financial Condition Report 52
FBD
HO
LDIN
GS
PLC
S.23
.01.
22O
wn
Fund
sBa
sic o
wn
fund
s bef
ore
dedu
ctio
n fo
r par
ticip
atio
ns in
oth
er fi
nanc
ial s
ecto
r To
tal
Tier
1
unre
stric
ted
Tier
1
rest
ricte
dTi
er 2
Tier
3
C001
0C0
020
C003
0C0
040
C005
0R0
010
Ord
inar
y sha
re ca
pita
l (gr
oss o
f ow
n sh
ares
)21
,408
21,4
080
R002
0Non-availablecalledbutnotpaidinordinaryshareca
pitalatgrouplevel
0R0
030
Shar
e pr
emiu
m a
ccou
nt re
late
d to
ord
inar
y sha
re ca
pita
l0
00
R004
0In
itial
fund
s, m
embe
rs’ c
ontr
ibut
ions
or t
he e
quiv
alen
t bas
ic o
wn-
fund
item
for m
utua
l and
m
utua
l-typ
e un
dert
akin
gs
00
0
R005
0Su
bord
inat
ed m
utua
l mem
ber a
ccou
nts
00
00
R006
0Non-availablesubordinatedmutualm
emberaccountsatgrouplevel
0R0
070
Surp
lus f
unds
00
R008
0Non-availablesurplusfundsatgrouplevel
00
R009
0Pr
efer
ence
shar
es2,
923
02,
923
0R0
100
Non-availablep
referencesharesatgrouplevel
0R0
110
Shar
e pr
emiu
m a
ccou
nt re
late
d to
pre
fere
nce
shar
es0
00
0R0
120
Non-availablesharepremiumaccountrelatedtopreferencesharesatgrouplevel
0R0
130
Reco
ncili
atio
n re
serv
e28
3,20
928
3,20
9R0
140
Subo
rdin
ated
liab
ilitie
s50
,000
050
,000
0R0
150
Non-availablesubordinatedliabilitiesatgrouplevel
0R0
160
An a
mou
nt e
qual
to th
e va
lue
of n
et d
efer
red
tax
asse
ts0
0R0
170
Thea
mounteq
ualtothevalueofnetdeferredtaxa
ssetsnotavailablea
tthegrouplevel
00
R018
0O
ther
item
s app
rove
d by
supe
rvis
ory a
utho
rity a
s bas
ic o
wn
fund
s not
spec
ified
abo
ve
00
00
0R0
190
Nonavailableo
wnfundsrelatedtootherownfundsitemsapprovedbysuperviso
ryauthority
0R0
200
Min
ority
inte
rest
s (if
not r
epor
ted
as p
art o
f a sp
ecifi
c ow
n fu
nd it
em)
0R0
210
Non-availablem
inorityinterestsatgrouplevel
0
R022
0O
wn
fund
s fro
m th
e fin
anci
al st
atem
ents
that
shou
ld n
ot b
e re
pres
ente
d by
the
reco
ncili
atio
n re
serv
e an
d do
not
mee
t the
crite
ria to
be
clas
sifie
d as
Sol
venc
y II
own
fund
s
R023
0D
educ
tions
for p
artic
ipat
ions
in o
ther
fina
ncia
l und
erta
king
s, in
clud
ing
non-
regu
late
d un
dert
akin
gs ca
rryi
ng o
ut fi
nanc
ial a
ctiv
ities
0
R024
0whereofdeductedaccordingtoart228oftheD
irective200
9/13
8/EC
0
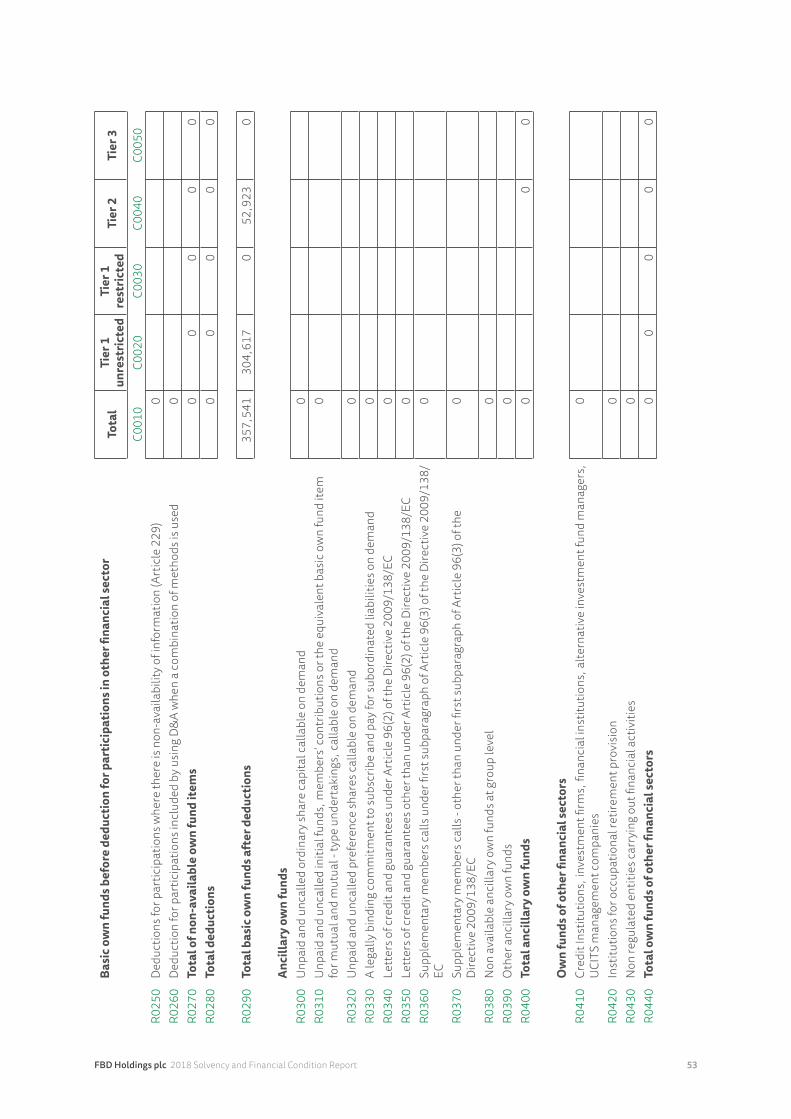
FBD Holdings plc 2018 Solvency and Financial Condition Report 53
Basi
c ow
n fu
nds b
efor
e de
duct
ion
for p
artic
ipat
ions
in o
ther
fina
ncia
l sec
tor
Tota
lTi
er 1
un
rest
ricte
dTi
er 1
re
stric
ted
Tier
2Ti
er 3
C001
0C0
020
C003
0C0
040
C005
0R0
250
Ded
uctio
ns fo
r par
ticip
atio
ns w
here
ther
e is
non
-ava
ilabi
lity o
f inf
orm
atio
n (A
rtic
le 2
29)
0R0
260
Ded
uctio
n fo
r par
ticip
atio
ns in
clud
ed b
y usi
ng D
&A
whe
n a
com
bina
tion
of m
etho
ds is
use
d 0
R027
0To
tal o
f non
-ava
ilabl
e ow
n fu
nd it
ems
00
00
0R0
280
Tota
l ded
uctio
ns0
00
00
R029
0To
tal b
asic
ow
n fu
nds a
fter
ded
uctio
ns35
7,54
130
4,61
70
52,9
230
Anci
llary
ow
n fu
nds
R030
0U
npai
d an
d un
calle
d or
dina
ry sh
are
capi
tal c
alla
ble
on d
eman
d0
R031
0U
npai
d an
d un
calle
d in
itial
fund
s, m
embe
rs’ c
ontr
ibut
ions
or t
he e
quiv
alen
t bas
ic o
wn
fund
item
fo
r mut
ual a
nd m
utua
l - ty
pe u
nder
taki
ngs,
calla
ble
on d
eman
d0
R032
0U
npai
d an
d un
calle
d pr
efer
ence
shar
es ca
llabl
e on
dem
and
0R0
330
A le
gally
bin
ding
com
mitm
ent t
o su
bscr
ibe
and
pay f
or su
bord
inat
ed li
abili
ties o
n de
man
d 0
R034
0Le
tter
s of c
redi
t and
gua
rant
ees u
nder
Art
icle
96(
2) o
f the
Dire
ctiv
e 20
09/1
38/E
C0
R035
0Le
tter
s of c
redi
t and
gua
rant
ees o
ther
than
und
er A
rtic
le 9
6(2)
of t
he D
irect
ive
2009
/138
/EC
0R0
360
Supp
lem
enta
ry m
embe
rs ca
lls u
nder
firs
t sub
para
grap
h of
Art
icle
96(
3) o
f the
Dire
ctiv
e 20
09/1
38/
EC0
R037
0Su
pple
men
tary
mem
bers
calls
- ot
her t
han
unde
r firs
t sub
para
grap
h of
Art
icle
96(
3) o
f the
D
irect
ive
2009
/138
/EC
0
R038
0N
on a
vaila
ble
anci
llary
ow
n fu
nds a
t gro
up le
vel
0R0
390
Oth
er a
ncill
ary o
wn
fund
s0
R040
0To
tal a
ncill
ary
own
fund
s0
00
Ow
n fu
nds o
f oth
er fi
nanc
ial s
ecto
rsR0
410
Cred
it In
stitu
tions
, inv
estm
ent fi
rms,
fina
ncia
l ins
titut
ions
, alte
rnat
ive
inve
stm
ent f
und
man
ager
s,
UCI
TS m
anag
emen
t com
pani
es0
R042
0In
stitu
tions
for o
ccup
atio
nal r
etire
men
t pro
visi
on0
R043
0N
on re
gula
ted
entit
ies c
arry
ing
out fi
nanc
ial a
ctiv
ities
0R0
440
Tota
l ow
n fu
nds o
f oth
er fi
nanc
ial s
ecto
rs0
00
00
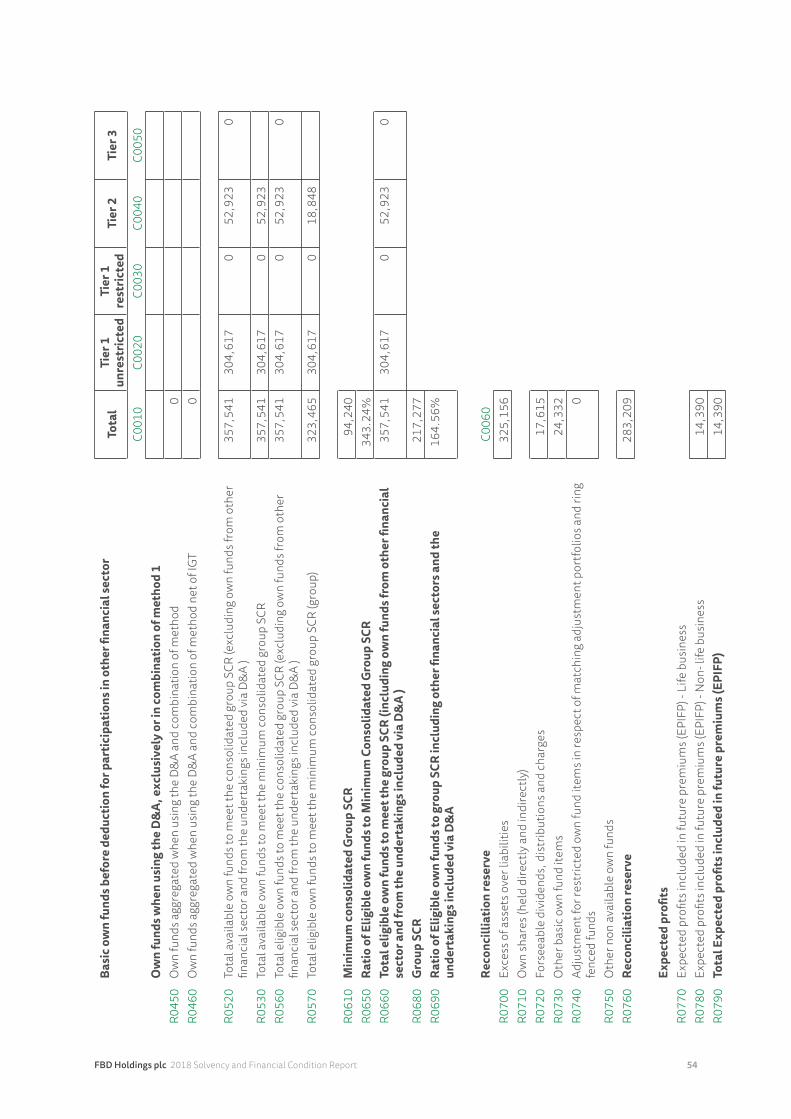
FBD Holdings plc 2018 Solvency and Financial Condition Report 54
Basi
c ow
n fu
nds b
efor
e de
duct
ion
for p
artic
ipat
ions
in o
ther
fina
ncia
l sec
tor
Tota
lTi
er 1
un
rest
ricte
dTi
er 1
re
stric
ted
Tier
2Ti
er 3
C001
0C0
020
C003
0C0
040
C005
0O
wn
fund
s whe
n us
ing
the
D&
A, e
xclu
sive
ly o
r in
com
bina
tion
of m
etho
d 1
R045
0O
wn
fund
s agg
rega
ted
whe
n us
ing
the
D&
A an
d co
mbi
natio
n of
met
hod
0R0
460
Ow
n fu
nds a
ggre
gate
d w
hen
usin
g th
e D
&A
and
com
bina
tion
of m
etho
d ne
t of I
GT0
R052
0To
tal a
vaila
ble
own
fund
s to
mee
t the
cons
olid
ated
gro
up S
CR (e
xclu
ding
ow
n fu
nds f
rom
oth
er
finan
cial
sect
or a
nd fr
om th
e un
dert
akin
gs in
clud
ed vi
a D
&A
)35
7,54
130
4,61
70
52,9
230
R053
0To
tal a
vaila
ble
own
fund
s to
mee
t the
min
imum
cons
olid
ated
gro
up S
CR
357,
541
304,
617
052
,923
R056
0To
tal e
ligib
le o
wn
fund
s to
mee
t the
cons
olid
ated
gro
up S
CR (e
xclu
ding
ow
n fu
nds f
rom
oth
er
finan
cial
sect
or a
nd fr
om th
e un
dert
akin
gs in
clud
ed vi
a D
&A
)35
7,54
130
4,61
70
52,9
230
R057
0To
tal e
ligib
le o
wn
fund
s to
mee
t the
min
imum
cons
olid
ated
gro
up S
CR (g
roup
)32
3,46
530
4,61
70
18,8
48
R061
0M
inim
um co
nsol
idat
ed G
roup
SCR
94,2
40R0
650
Ratio
of E
ligib
le o
wn
fund
s to
Min
imum
Con
solid
ated
Gro
up S
CR34
3.24
%R0
660
Tota
l elig
ible
ow
n fu
nds t
o m
eet t
he g
roup
SCR
(inc
ludi
ng o
wn
fund
s fro
m o
ther
fina
ncia
l se
ctor
and
from
the
unde
rtak
ings
incl
uded
via
D&
A )
357,
541
304,
617
052
,923
0
R068
0G
roup
SCR
217,
277
R069
0Ra
tio o
f Elig
ible
ow
n fu
nds t
o gr
oup
SCR
incl
udin
g ot
her fi
nanc
ial s
ecto
rs a
nd th
e un
dert
akin
gs in
clud
ed v
ia D
&A
164.
56%
Reco
ncill
iatio
n re
serv
eC0
060
R070
0Ex
cess
of a
sset
s ove
r lia
bilit
ies
325,
156
R071
0O
wn
shar
es (h
eld
dire
ctly
and
indi
rect
ly)
R072
0Fo
rsee
able
div
iden
ds, d
istr
ibut
ions
and
char
ges
17,6
15R0
730
Oth
er b
asic
ow
n fu
nd it
ems
24,3
32R0
740
Adju
stm
ent f
or re
stric
ted
own
fund
item
s in
resp
ect o
f mat
chin
g ad
just
men
t por
tfol
ios a
nd ri
ng
fenc
ed fu
nds
0
R075
0O
ther
non
ava
ilabl
e ow
n fu
nds
R076
0Re
conc
iliat
ion
rese
rve
283,
209
Expe
cted
pro
fits
R077
0Ex
pect
ed p
rofit
s inc
lude
d in
futu
re p
rem
ium
s (EP
IFP)
- Li
fe b
usin
ess
R078
0Ex
pect
ed p
rofit
s inc
lude
d in
futu
re p
rem
ium
s (EP
IFP)
- N
on- l
ife b
usin
ess
14,3
90R0
790
Tota
l Exp
ecte
d pr
ofits
incl
uded
in fu
ture
pre
miu
ms (
EPIF
P)14
,390
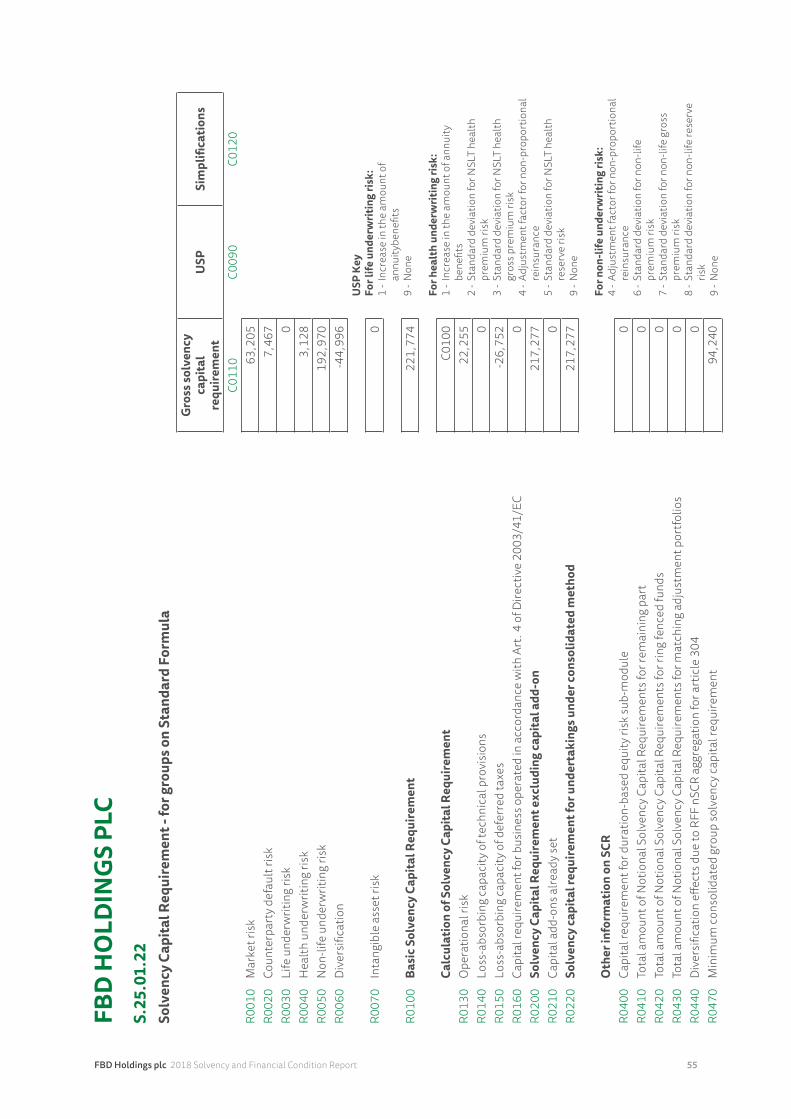
FBD Holdings plc 2018 Solvency and Financial Condition Report 55
FBD
HO
LDIN
GS
PLC
S.25
.01.
22So
lven
cy C
apita
l Req
uire
men
t - fo
r gro
ups o
n St
anda
rd F
orm
ula
Gro
ss so
lven
cy
capi
tal
requ
irem
ent
USP
Sim
plifi
catio
ns
C011
0C0
090
C012
0R0
010
Mar
ket r
isk
63,2
05R0
020
Coun
terp
arty
def
ault
risk
7,46
7R0
030
Life
und
erw
ritin
g ris
k0
R004
0H
ealth
und
erw
ritin
g ris
k3,
128
R005
0N
on-li
fe u
nder
writ
ing
risk
192,
970
R006
0D
iver
sific
atio
n-4
4,99
6U
SP K
ey
For l
ife u
nder
writ
ing
risk:
1 - I
ncre
ase
in th
e am
ount
of
annu
itybe
nefit
s9
- Non
e Fo
r hea
lth
unde
rwrit
ing
risk:
1 - I
ncre
ase
in th
e am
ount
of a
nnui
ty
bene
fits
2 - S
tand
ard
devi
atio
n fo
r NSL
T he
alth
pr
emiu
m ri
sk3
- Sta
ndar
d de
viat
ion
for N
SLT
heal
th
gros
s pre
miu
m ri
sk4
- Adj
ustm
ent f
acto
r for
non
-pro
port
iona
l re
insu
ranc
e5
- Sta
ndar
d de
viat
ion
for N
SLT
heal
th
rese
rve
risk
9 - N
one
For n
on-li
fe u
nder
writ
ing
risk:
4 - A
djus
tmen
t fac
tor f
or n
on-p
ropo
rtio
nal
rein
sura
nce
6 - S
tand
ard
devi
atio
n fo
r non
-life
pr
emiu
m ri
sk7
- Sta
ndar
d de
viat
ion
for n
on-li
fe g
ross
pr
emiu
m ri
sk8
- Sta
ndar
d de
viat
ion
for n
on-li
fe re
serv
e ris
k9
- Non
e
R007
0In
tang
ible
ass
et ri
sk0
R010
0Ba
sic S
olve
ncy
Capi
tal R
equi
rem
ent
221,
774
Calc
ulat
ion
of S
olve
ncy
Capi
tal R
equi
rem
ent
C010
0R0
130
Ope
ratio
nal r
isk
22,2
55R0
140
Loss
-abs
orbi
ng ca
paci
ty o
f tec
hnic
al p
rovi
sion
s0
R015
0Lo
ss-a
bsor
bing
capa
city
of d
efer
red
taxe
s-2
6,75
2R0
160
Capi
tal r
equi
rem
ent f
or b
usin
ess o
pera
ted
in a
ccor
danc
e w
ith A
rt. 4
of D
irect
ive
2003
/41/
EC0
R020
0So
lven
cy C
apita
l Req
uire
men
t exc
ludi
ng ca
pita
l add
-on
217,
277
R021
0Ca
pita
l add
-ons
alre
ady s
et0
R022
0So
lven
cy ca
pita
l req
uire
men
t for
und
erta
king
s und
er co
nsol
idat
ed m
etho
d21
7,27
7
Oth
er in
form
atio
n on
SCR
R040
0Ca
pita
l req
uire
men
t for
dur
atio
n-ba
sed
equi
ty ri
sk su
b-m
odul
e0
R041
0To
tal a
mou
nt o
f Not
iona
l Sol
venc
y Cap
ital R
equi
rem
ents
for r
emai
ning
par
t0
R042
0To
tal a
mou
nt o
f Not
iona
l Sol
venc
y Cap
ital R
equi
rem
ents
for r
ing
fenc
ed fu
nds
0R0
430
Tota
l am
ount
of N
otio
nal S
olve
ncy C
apita
l Req
uire
men
ts fo
r mat
chin
g ad
just
men
t por
tfol
ios
0R0
440
Div
ersi
ficat
ion
effec
ts d
ue to
RFF
nSC
R ag
greg
atio
n fo
r art
icle
304
0R0
470
Min
imum
cons
olid
ated
gro
up so
lven
cy ca
pita
l req
uire
men
t 94
,240
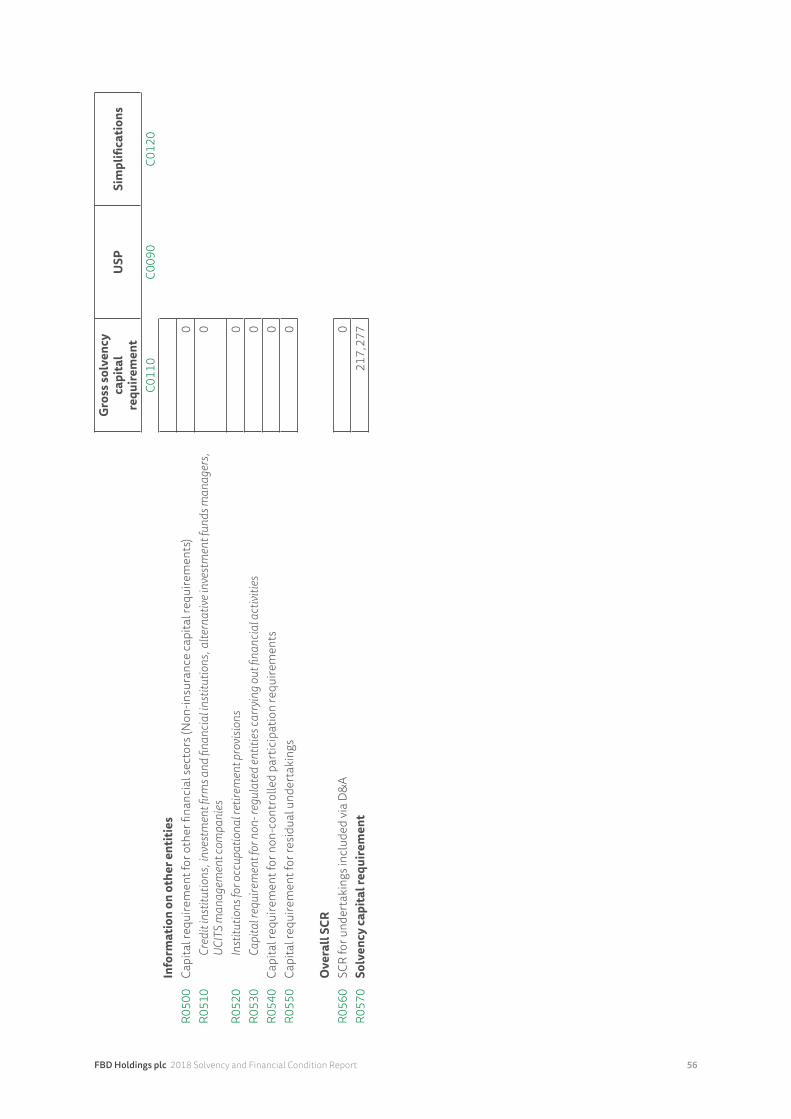
FBD Holdings plc 2018 Solvency and Financial Condition Report 56
Gro
ss so
lven
cy
capi
tal
requ
irem
ent
USP
Sim
plifi
catio
ns
C011
0C0
090
C012
0In
form
atio
n on
oth
er e
ntiti
esR0
500
Capi
tal r
equi
rem
ent f
or o
ther
fina
ncia
l sec
tors
(Non
-insu
ranc
e ca
pita
l req
uire
men
ts)
0R0
510
Creditinstitutions,investm
entfirm
sandfinancialin
stitutions,alternativeinvestmentfundsmanagers,
UCITSmanagem
entcom
panies
0
R052
0Institutionsforoccupationalretirementprovisions
0R0
530
Capitalrequirementfornon-regulateden
titiescarryingoutfinancialactivities
0R0
540
Capi
tal r
equi
rem
ent f
or n
on-c
ontr
olle
d pa
rtic
ipat
ion
requ
irem
ents
0R0
550
Capi
tal r
equi
rem
ent f
or re
sidu
al u
nder
taki
ngs
0
Ove
rall
SCR
R056
0SC
R fo
r und
erta
king
s inc
lude
d vi
a D
&A
0R0
570
Solv
ency
capi
tal r
equi
rem
ent
217,
277
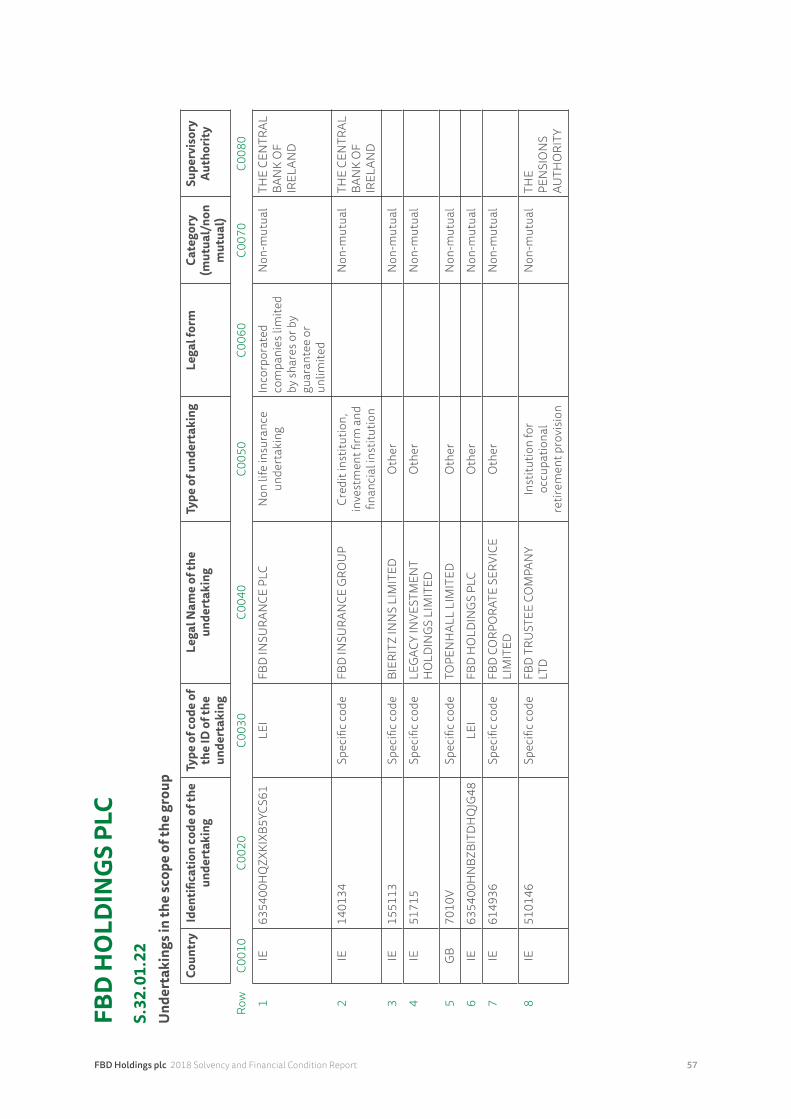
FBD Holdings plc 2018 Solvency and Financial Condition Report 57
FBD
HO
LDIN
GS
PLC
S.32
.01.
22U
nder
taki
ngs i
n th
e sc
ope
of th
e gr
oup
Coun
try
Iden
tifica
tion
code
of t
he
unde
rtak
ing
Type
of c
ode
of
the
ID o
f the
un
dert
akin
g
Lega
l Nam
e of
the
unde
rtak
ing
Type
of u
nder
taki
ngLe
gal f
orm
Cate
gory
(m
utua
l/no
n m
utua
l)
Supe
rvis
ory
Auth
ority
Row
C001
0C0
020
C003
0C0
040
C005
0C0
060
C007
0C0
080
1IE
6354
00H
QZX
KIXB
5YCS
61LE
IFB
D IN
SURA
NCE
PLC
Non
life
insu
ranc
e un
dert
akin
gIn
corp
orat
ed
com
pani
es li
mite
d by
shar
es o
r by
guar
ante
e or
un
limite
d
Non
-mut
ual
THE
CEN
TRAL
BA
NK
OF
IREL
AND
2IE
1401
34Sp
ecifi
c cod
eFB
D IN
SURA
NCE
GRO
UP
Cred
it in
stitu
tion,
in
vest
men
t firm
and
fin
anci
al in
stitu
tion
Non
-mut
ual
THE
CEN
TRAL
BA
NK
OF
IREL
AND
3IE
1551
13Sp
ecifi
c cod
eBI
ERIT
Z IN
NS
LIM
ITED
Oth
erN
on-m
utua
l
4IE
5171
5Sp
ecifi
c cod
eLE
GAC
Y IN
VEST
MEN
T H
OLD
ING
S LI
MIT
EDO
ther
Non
-mut
ual
5G
B70
10V
Spec
ific c
ode
TOPE
NH
ALL
LIM
ITED
Oth
erN
on-m
utua
l
6IE
6354
00H
NBZ
BITD
HQ
JG48
LEI
FBD
HO
LDIN
GS
PLC
Oth
erN
on-m
utua
l
7IE
6149
36Sp
ecifi
c cod
eFB
D C
ORP
ORA
TE S
ERVI
CE
LIM
ITED
Oth
erN
on-m
utua
l
8IE
5101
46Sp
ecifi
c cod
eFB
D T
RUST
EE C
OM
PAN
Y LT
DIn
stitu
tion
for
occu
patio
nal
retir
emen
t pro
visi
on
Non
-mut
ual
THE
PEN
SIO
NS
AUTH
ORI
TY
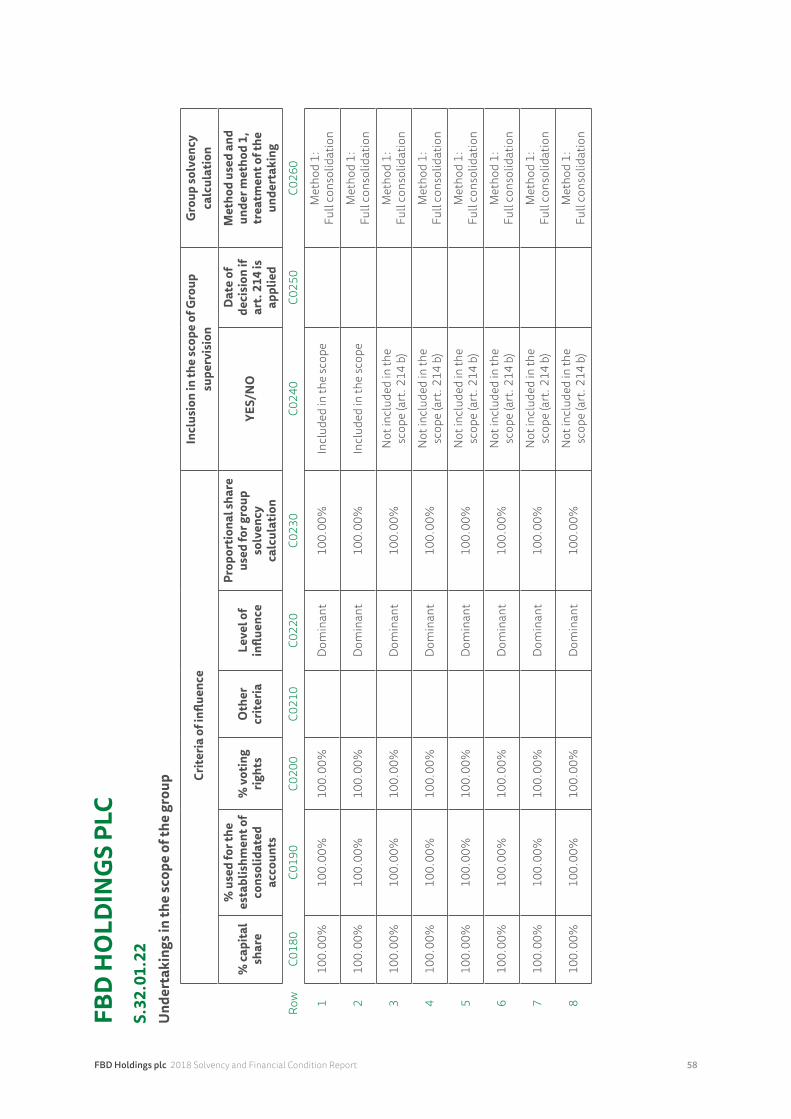
FBD Holdings plc 2018 Solvency and Financial Condition Report 58
FBD
HO
LDIN
GS
PLC
S.32
.01.
22U
nder
taki
ngs i
n th
e sc
ope
of th
e gr
oup C
riter
ia o
f infl
uenc
eIn
clus
ion
in th
e sc
ope
of G
roup
su
perv
isio
nG
roup
solv
ency
ca
lcul
atio
n
% ca
pita
l sh
are
% u
sed
for t
he
esta
blis
hmen
t of
cons
olid
ated
ac
coun
ts
% v
otin
g rig
hts
Oth
er
crite
riaLe
vel o
f in
fluen
ce
Prop
ortio
nal s
hare
us
ed fo
r gro
up
solv
ency
ca
lcul
atio
n
YES/
NO
Dat
e of
de
cisi
on if
ar
t. 2
14 is
ap
plie
d
Met
hod
used
and
un
der m
etho
d 1,
tr
eatm
ent o
f the
un
dert
akin
g
Row
C018
0C0
190
C020
0C0
210
C022
0C0
230
C024
0C0
250
C026
0
110
0.00
%10
0.00
%10
0.00
%D
omin
ant
100.
00%
Incl
uded
in th
e sc
ope
Met
hod
1:
Full
cons
olid
atio
n
210
0.00
%10
0.00
%10
0.00
%D
omin
ant
100.
00%
Incl
uded
in th
e sc
ope
Met
hod
1:
Full
cons
olid
atio
n
310
0.00
%10
0.00
%10
0.00
%D
omin
ant
100.
00%
Not
incl
uded
in th
e sc
ope
(art
. 214
b)
Met
hod
1:
Full
cons
olid
atio
n
410
0.00
%10
0.00
%10
0.00
%D
omin
ant
100.
00%
Not
incl
uded
in th
e sc
ope
(art
. 214
b)
Met
hod
1:
Full
cons
olid
atio
n
510
0.00
%10
0.00
%10
0.00
%D
omin
ant
100.
00%
Not
incl
uded
in th
e sc
ope
(art
. 214
b)
Met
hod
1:
Full
cons
olid
atio
n
610
0.00
%10
0.00
%10
0.00
%D
omin
ant
100.
00%
Not
incl
uded
in th
e sc
ope
(art
. 214
b)
Met
hod
1:
Full
cons
olid
atio
n
710
0.00
%10
0.00
%10
0.00
%D
omin
ant
100.
00%
Not
incl
uded
in th
e sc
ope
(art
. 214
b)
Met
hod
1:
Full
cons
olid
atio
n
810
0.00
%10
0.00
%10
0.00
%D
omin
ant
100.
00%
Not
incl
uded
in th
e sc
ope
(art
. 214
b)
Met
hod
1:
Full
cons
olid
atio
n
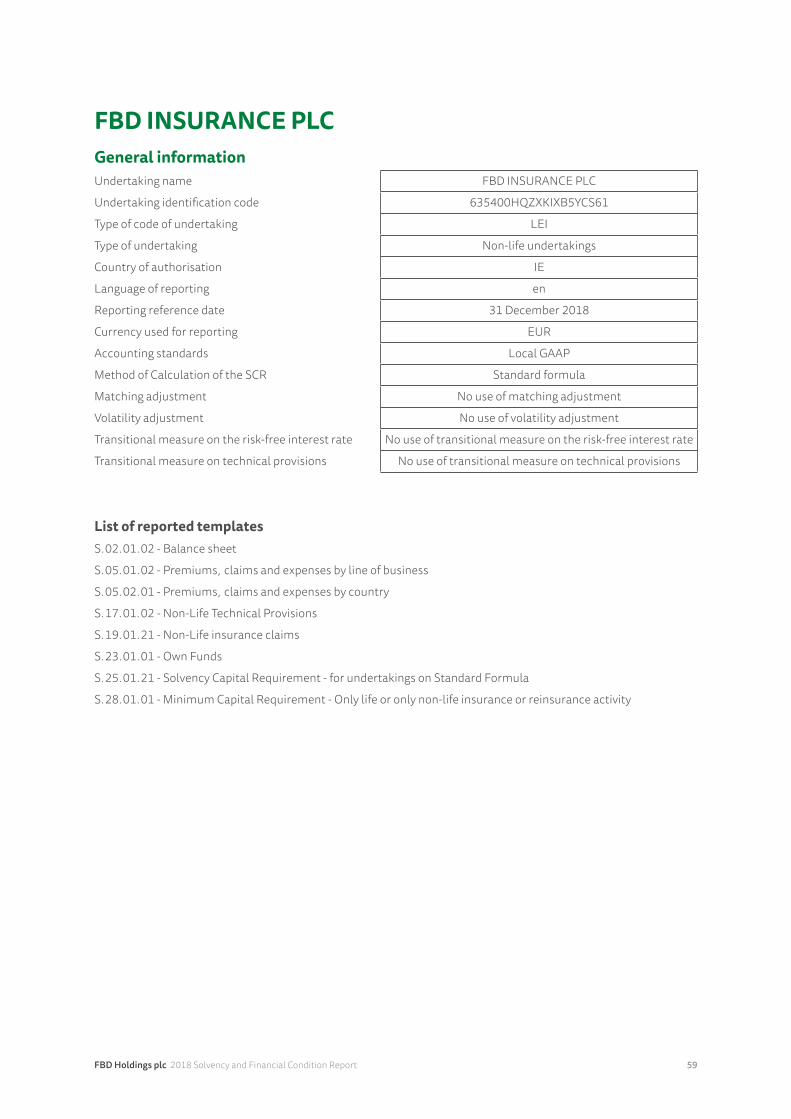
FBD Holdings plc 2018 Solvency and Financial Condition Report 59
FBD INSURANCE PLCGeneral informationUndertaking name FBD INSURANCE PLC
Undertaking identification code 635400HQZXKIXB5YCS61
Type of code of undertaking LEI
Type of undertaking Non-life undertakings
Country of authorisation IE
Language of reporting en
Reporting reference date 31 December 2018
Currency used for reporting EUR
Accounting standards Local GAAP
Method of Calculation of the SCR Standard formula
Matching adjustment No use of matching adjustment
Volatility adjustment No use of volatility adjustment
Transitional measure on the risk-free interest rate No use of transitional measure on the risk-free interest rate
Transitional measure on technical provisions No use of transitional measure on technical provisions
List of reported templatesS.02.01.02 - Balance sheet
S.05.01.02 - Premiums, claims and expenses by line of business
S.05.02.01 - Premiums, claims and expenses by country
S.17.01.02 - Non-Life Technical Provisions
S.19.01.21 - Non-Life insurance claims
S.23.01.01 - Own Funds
S.25.01.21 - Solvency Capital Requirement - for undertakings on Standard Formula
S.28.01.01 - Minimum Capital Requirement - Only life or only non-life insurance or reinsurance activity

FBD Holdings plc 2018 Solvency and Financial Condition Report 60
FBD INSURANCE PLCS.02.01.02Balance sheet
Solvency II value
Assets C0010R0030 Intangible assetsR0040 Deferred tax assetsR0050 Pension benefit surplusR0060 Property, plant & equipment held for own use 58,415R0070 Investments (other than assets held for index-linked and unit-linked contracts) 1,008,427R0080 Property(otherthanforownuse) 23,811R0090 Holdingsinrelatedundertakings,includingparticipations 0R0100 Equities 885R0110 Equities-listed 262R0120 Equities-unlisted 623R0130 Bonds 801,161R0140 GovernmentBonds 302,443R0150 CorporateBonds 498,717R0160 Structurednotes 0R0170 Collateralisedsecurities 0R0180 CollectiveInvestmentsUndertakings 78,514R0190 DerivativesR0200 Depositsotherthancashequivalents 104,056R0210 Otherinvestments 0R0220 Assets held for index-linked and unit-linked contractsR0230 Loans and mortgages 581R0240 Loansonpolicies 0R0250 Loansandmortgagestoindividuals 581R0260 OtherloansandmortgagesR0270 Reinsurance recoverables from: 68,527R0280 Non-lifeandhealthsimilartonon-life 68,527R0290 Non-lifeexcludinghealth 68,505R0300 Healthsimilartonon-life 22R0310 Lifeandhealthsimilartolife,excludingindex-linkedandunit-linked 0R0320 HealthsimilartolifeR0330 Lifeexcludinghealthandindex-linkedandunit-linkedR0340 Lifeindex-linkedandunit-linkedR0350 Deposits to cedants 0R0360 Insurance and intermediaries receivablesR0370 Reinsurance receivablesR0380 Receivables (trade, not insurance) 8,865R0390 Own shares (held directly)R0400 Amounts due in respect of own fund items or initial fund called up but not yet paid in 0R0410 Cash and cash equivalents 41,864R0420 Any other assets, not elsewhere shown 14,748R0500 Total assets 1,201,427
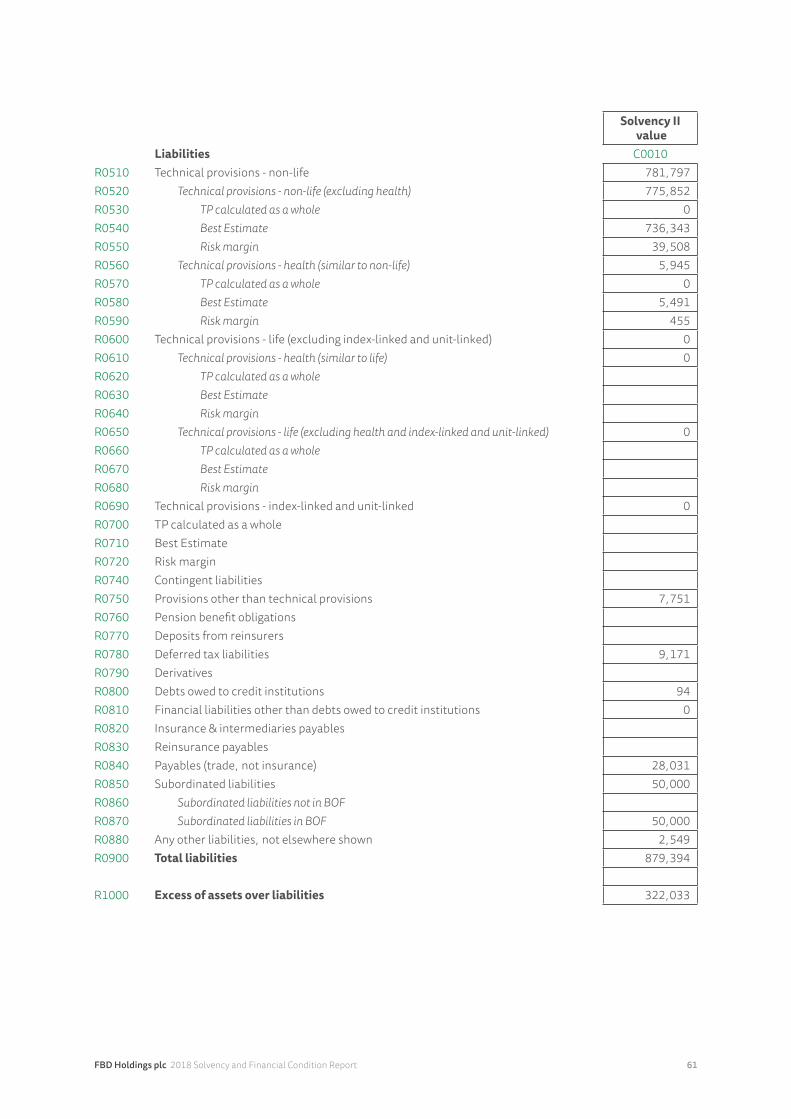
FBD Holdings plc 2018 Solvency and Financial Condition Report 61
Solvency II value
Liabilities C0010R0510 Technical provisions - non-life 781,797R0520 Technicalprovisions-non-life(excludinghealth) 775,852R0530 TPcalculatedasawhole 0R0540 BestEstimate 736,343R0550 Riskmargin 39,508R0560 Technicalprovisions-health(similartonon-life) 5,945R0570 TPcalculatedasawhole 0R0580 BestEstimate 5,491R0590 Riskmargin 455R0600 Technical provisions - life (excluding index-linked and unit-linked) 0R0610 Technicalprovisions-health(similartolife) 0R0620 TPcalculatedasawholeR0630 BestEstimateR0640 RiskmarginR0650 Technicalprovisions-life(excludinghealthandindex-linkedandunit-linked) 0R0660 TPcalculatedasawholeR0670 BestEstimateR0680 RiskmarginR0690 Technical provisions - index-linked and unit-linked 0R0700 TP calculated as a wholeR0710 Best EstimateR0720 Risk marginR0740 Contingent liabilitiesR0750 Provisions other than technical provisions 7,751R0760 Pension benefit obligationsR0770 Deposits from reinsurersR0780 Deferred tax liabilities 9,171R0790 DerivativesR0800 Debts owed to credit institutions 94R0810 Financial liabilities other than debts owed to credit institutions 0R0820 Insurance & intermediaries payablesR0830 Reinsurance payablesR0840 Payables (trade, not insurance) 28,031R0850 Subordinated liabilities 50,000R0860 SubordinatedliabilitiesnotinBOFR0870 SubordinatedliabilitiesinBOF 50,000R0880 Any other liabilities, not elsewhere shown 2,549R0900 Total liabilities 879,394
R1000 Excess of assets over liabilities 322,033

FBD Holdings plc 2018 Solvency and Financial Condition Report 62
FBD
INSU
RAN
CE P
LCS.
05.0
1.02
Prem
ium
s, cl
aim
s and
exp
ense
s by
line
of b
usin
ess
Line
of B
usin
ess f
or: n
on-li
fe in
sura
nce
and
rein
sura
nce
oblig
atio
ns
(dire
ct b
usin
ess a
nd a
ccep
ted
prop
ortio
nal r
eins
uran
ce)
Tota
l
Non
-life
Inco
me
prot
ectio
n in
sura
nce
Mot
or v
ehic
le
liabi
lity
insu
ranc
e
Oth
er m
otor
in
sura
nce
Mar
ine,
av
iatio
n an
d tr
ansp
ort
insu
ranc
e
Fire
and
oth
er
dam
age
to
prop
erty
in
sura
nce
Gen
eral
lia
bilit
y in
sura
nce
C002
0C0
040
C005
0C0
060
C007
0C0
080
C020
0Pr
emiu
ms w
ritte
nR0
110
Gro
ss -
Dire
ct B
usin
ess
5,55
912
3,24
358
,615
2811
0,85
973
,200
371,
504
R012
0G
ross
- Pr
opor
tiona
l rei
nsur
ance
acc
epte
d 0
R013
0G
ross
- N
on-p
ropo
rtio
nal r
eins
uran
ce a
ccep
ted
0R0
140
Rein
sure
rs’ s
hare
465
16,0
540
344
13,7
876,
085
36,7
35R0
200
Net
5,09
410
7,18
958
,615
-316
97,0
7267
,115
334,
769
Prem
ium
s ear
ned
R021
0G
ross
- D
irect
Bus
ines
s5,
596
124,
235
58,9
2738
113,
235
72,6
0637
4,63
7R0
220
Gro
ss -
Prop
ortio
nal r
eins
uran
ce a
ccep
ted
0R0
230
Gro
ss -
Non
-pro
port
iona
l rei
nsur
ance
acc
epte
d 0
R024
0Re
insu
rers
’ sha
re46
516
,054
034
213
,787
6,08
536
,734
R030
0N
et5,
131
108,
181
58,9
27-3
0499
,448
66,5
2133
7,90
3Cl
aim
s inc
urre
dR0
310
Gro
ss -
Dire
ct B
usin
ess
3,87
856
,355
25,1
12-1
0343
,252
55,3
7718
3,87
0R0
320
Gro
ss -
Prop
ortio
nal r
eins
uran
ce a
ccep
ted
0R0
330
Gro
ss -
Non
-pro
port
iona
l rei
nsur
ance
acc
epte
d 0
R034
0Re
insu
rers
’ sha
re-2
2-5
,640
0-4
14,
070
4,12
12,
487
R040
0N
et3,
900
61,9
9525
,112
-62
39,1
8251
,256
181,
383
Chan
ges i
n ot
her t
echn
ical
pro
visi
ons
R041
0G
ross
- D
irect
Bus
ines
s0
R042
0G
ross
- Pr
opor
tiona
l rei
nsur
ance
acc
epte
d 0
R043
0G
ross
- N
on-p
ropo
rtio
nal r
eins
uran
ce a
ccep
ted
0R0
440
Rein
sure
rs’ s
hare
0R0
500
Net
00
00
00
0
R055
0Ex
pens
es in
curr
ed1,
195
32,1
9211
,606
1929
,359
19,3
0793
,678
R120
0O
ther
exp
ense
sR1
300
Tota
l exp
ense
s93
,678
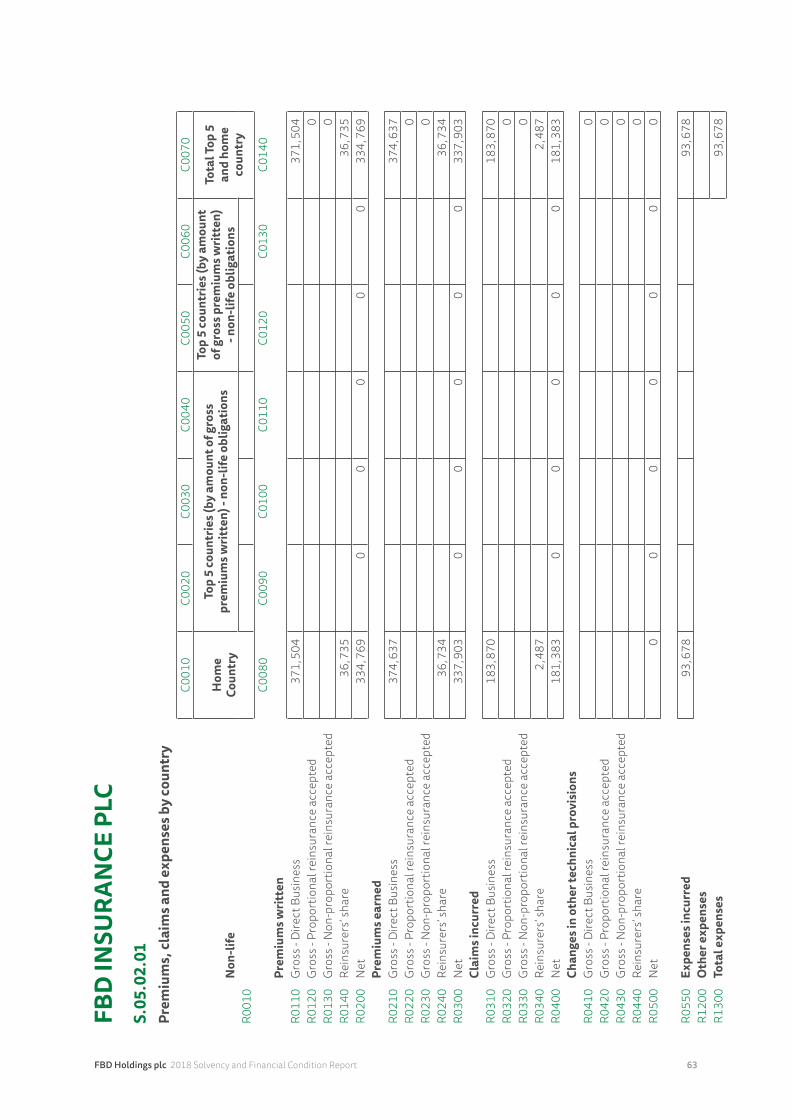
FBD Holdings plc 2018 Solvency and Financial Condition Report 63
FBD
INSU
RAN
CE P
LCS.
05.0
2.01
Prem
ium
s, cl
aim
s and
exp
ense
s by
coun
try
C001
0C0
020
C003
0C0
040
C005
0C0
060
C007
0
Non
-life
Hom
e Co
untr
y
Top
5 co
untr
ies (
by a
mou
nt o
f gro
ss
prem
ium
s writ
ten)
- no
n-lif
e ob
ligat
ions
Top
5 co
untr
ies (
by a
mou
nt
of g
ross
pre
miu
ms w
ritte
n)
- non
-life
obl
igat
ions
Tota
l Top
5
and
hom
e co
untr
yR0
010
C008
0C0
090
C010
0C0
110
C012
0C0
130
C014
0Pr
emiu
ms w
ritte
nR0
110
Gro
ss -
Dire
ct B
usin
ess
371,
504
371,
504
R012
0G
ross
- Pr
opor
tiona
l rei
nsur
ance
acc
epte
d 0
R013
0G
ross
- N
on-p
ropo
rtio
nal r
eins
uran
ce a
ccep
ted
0R0
140
Rein
sure
rs’ s
hare
36,7
3536
,735
R020
0N
et33
4,76
90
00
00
334,
769
Prem
ium
s ear
ned
R021
0G
ross
- D
irect
Bus
ines
s37
4,63
737
4,63
7R0
220
Gro
ss -
Prop
ortio
nal r
eins
uran
ce a
ccep
ted
0R0
230
Gro
ss -
Non
-pro
port
iona
l rei
nsur
ance
acc
epte
d 0
R024
0Re
insu
rers
’ sha
re36
,734
36,7
34R0
300
Net
337,
903
00
00
033
7,90
3Cl
aim
s inc
urre
dR0
310
Gro
ss -
Dire
ct B
usin
ess
183,
870
183,
870
R032
0G
ross
- Pr
opor
tiona
l rei
nsur
ance
acc
epte
d 0
R033
0G
ross
- N
on-p
ropo
rtio
nal r
eins
uran
ce a
ccep
ted
0R0
340
Rein
sure
rs’ s
hare
2,48
72,
487
R040
0N
et18
1,38
30
00
00
181,
383
Chan
ges i
n ot
her t
echn
ical
pro
visi
ons
R041
0G
ross
- D
irect
Bus
ines
s0
R042
0G
ross
- Pr
opor
tiona
l rei
nsur
ance
acc
epte
d 0
R043
0G
ross
- N
on-p
ropo
rtio
nal r
eins
uran
ce a
ccep
ted
0R0
440
Rein
sure
rs’ s
hare
0R0
500
Net
00
00
00
0
R055
0Ex
pens
es in
curr
ed93
,678
93,6
78R1
200
Oth
er e
xpen
ses
R130
0To
tal e
xpen
ses
93,6
78
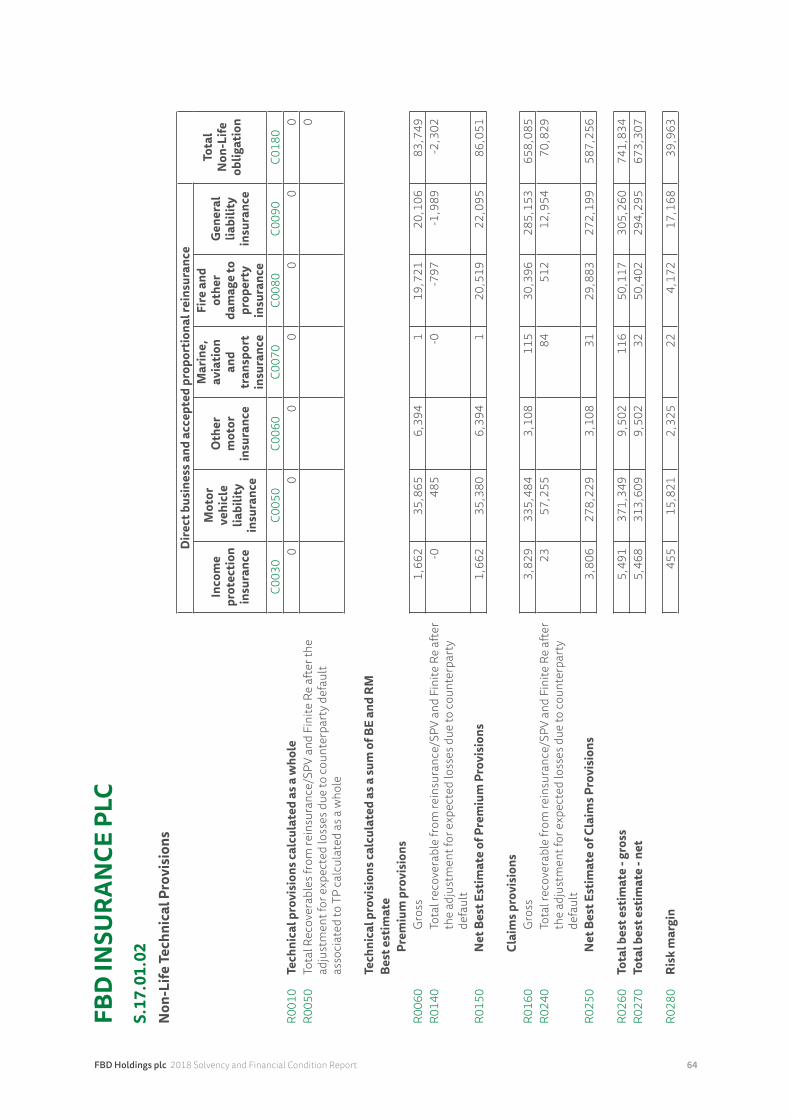
FBD Holdings plc 2018 Solvency and Financial Condition Report 64
FBD
INSU
RAN
CE P
LCS.
17.0
1.02
Non
-Life
Tech
nica
l Pro
visi
ons
Dire
ct b
usin
ess a
nd a
ccep
ted
prop
ortio
nal r
eins
uran
ce
Tota
l N
on-L
ife
oblig
atio
nIn
com
e pr
otec
tion
insu
ranc
e
Mot
or
vehi
cle
liabi
lity
insu
ranc
e
Oth
er
mot
or
insu
ranc
e
Mar
ine,
av
iatio
n an
d tr
ansp
ort
insu
ranc
e
Fire
and
ot
her
dam
age
to
prop
erty
in
sura
nce
Gen
eral
lia
bilit
y in
sura
nce
C003
0C0
050
C006
0C0
070
C008
0C0
090
C018
0R0
010
Tech
nica
l pro
visi
ons c
alcu
late
d as
a w
hole
00
00
00
0R0
050
Tota
l Rec
over
able
s fro
m re
insu
ranc
e/SP
V an
d Fi
nite
Re
afte
r the
ad
just
men
t for
exp
ecte
d lo
sses
due
to co
unte
rpar
ty d
efau
lt as
soci
ated
to T
P ca
lcul
ated
as a
who
le
0
Tech
nica
l pro
visi
ons c
alcu
late
d as
a su
m o
f BE
and
RMBe
st e
stim
ate
Prem
ium
pro
visi
ons
R006
0G
ross
1,66
235
,865
6,39
41
19,7
2120
,106
83,7
49R0
140
Tota
l rec
over
able
from
rein
sura
nce/
SPV
and
Fini
te R
e af
ter
the
adju
stm
ent f
or e
xpec
ted
loss
es d
ue to
coun
terp
arty
de
faul
t
-048
5-0
-797
-1,9
89-2
,302
R015
0N
et B
est E
stim
ate
of P
rem
ium
Pro
visi
ons
1,66
235
,380
6,39
41
20,5
1922
,095
86,0
51
Clai
ms p
rovi
sion
sR0
160
Gro
ss3,
829
335,
484
3,10
811
530
,396
285,
153
658,
085
R024
0To
tal r
ecov
erab
le fr
om re
insu
ranc
e/SP
V an
d Fi
nite
Re
afte
r th
e ad
just
men
t for
exp
ecte
d lo
sses
due
to co
unte
rpar
ty
defa
ult
2357
,255
8451
212
,954
70,8
29
R025
0N
et B
est E
stim
ate
of C
laim
s Pro
visi
ons
3,80
627
8,22
93,
108
3129
,883
272,
199
587,
256
R026
0To
tal b
est e
stim
ate
- gro
ss5,
491
371,
349
9,50
211
650
,117
305,
260
741,
834
R027
0To
tal b
est e
stim
ate
- net
5,46
831
3,60
99,
502
3250
,402
294,
295
673,
307
R028
0Ri
sk m
argi
n45
515
,821
2,32
522
4,17
217
,168
39,9
63
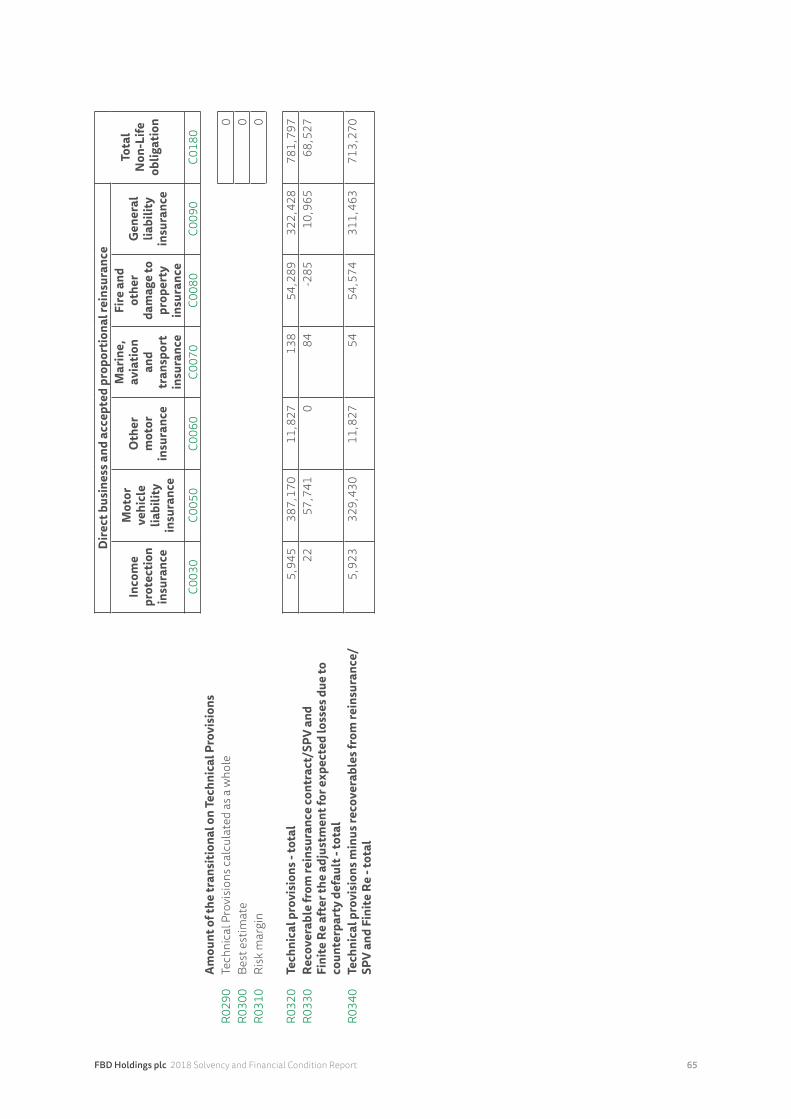
FBD Holdings plc 2018 Solvency and Financial Condition Report 65
Dire
ct b
usin
ess a
nd a
ccep
ted
prop
ortio
nal r
eins
uran
ce
Tota
l N
on-L
ife
oblig
atio
nIn
com
e pr
otec
tion
insu
ranc
e
Mot
or
vehi
cle
liabi
lity
insu
ranc
e
Oth
er
mot
or
insu
ranc
e
Mar
ine,
av
iatio
n an
d tr
ansp
ort
insu
ranc
e
Fire
and
ot
her
dam
age
to
prop
erty
in
sura
nce
Gen
eral
lia
bilit
y in
sura
nce
C003
0C0
050
C006
0C0
070
C008
0C0
090
C018
0Am
ount
of t
he tr
ansi
tiona
l on
Tech
nica
l Pro
visi
ons
R029
0Te
chni
cal P
rovi
sion
s cal
cula
ted
as a
who
le0
R030
0Be
st e
stim
ate
0R0
310
Risk
mar
gin
0
R032
0Te
chni
cal p
rovi
sion
s - to
tal
5,94
538
7,17
011
,827
138
54,2
8932
2,42
878
1,79
7R0
330
Reco
vera
ble
from
rein
sura
nce
cont
ract
/SPV
and
Fi
nite
Re
afte
r the
adj
ustm
ent f
or e
xpec
ted
loss
es d
ue to
co
unte
rpar
ty d
efau
lt -
tota
l
2257
,741
084
-285
10,9
6568
,527
R034
0Te
chni
cal p
rovi
sion
s min
us re
cove
rabl
es fr
om re
insu
ranc
e/
SPV
and
Fini
te R
e - t
otal
5,92
332
9,43
011
,827
5454
,574
311,
463
713,
270
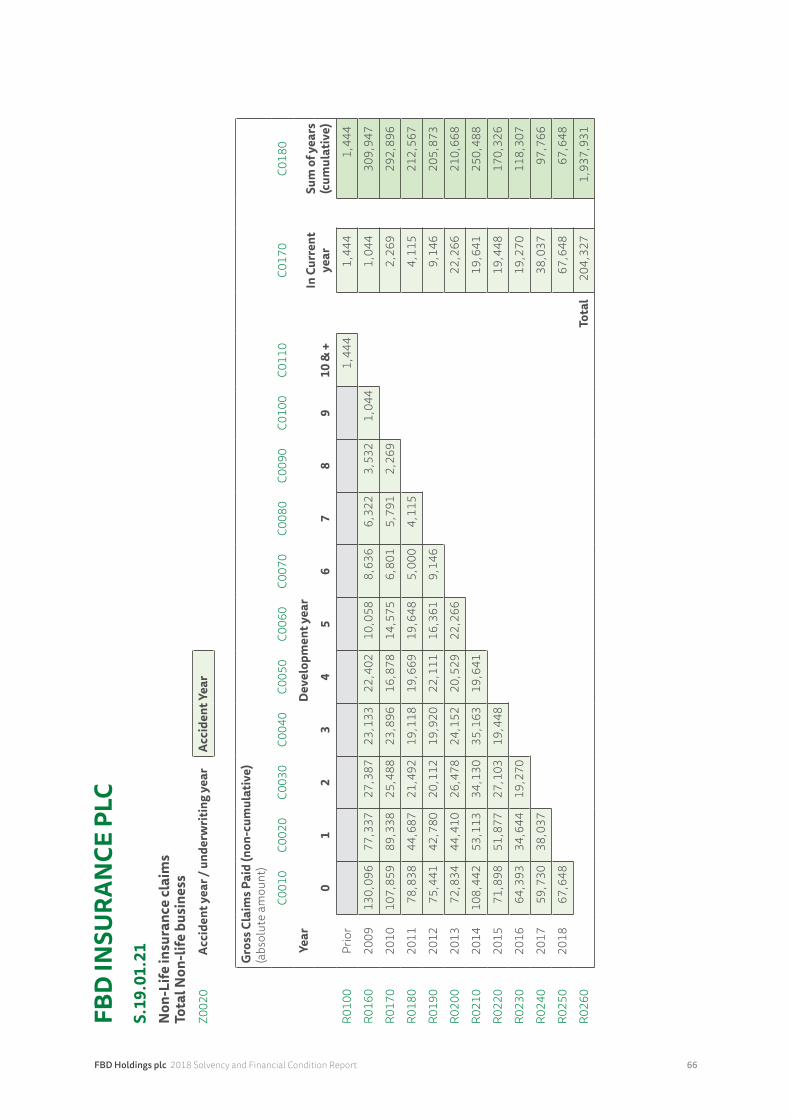
FBD Holdings plc 2018 Solvency and Financial Condition Report 66
FBD
INSU
RAN
CE P
LCS.
19.0
1.21
Non
-Life
insu
ranc
e cl
aim
s To
tal N
on-li
fe b
usin
ess
Z002
0Ac
cide
nt y
ear /
und
erw
ritin
g ye
ar
Acci
dent
Yea
r
Gro
ss C
laim
s Pai
d (n
on-c
umul
ativ
e)(a
bsol
ute
amou
nt)
C001
0C0
020
C003
0C0
040
C005
0C0
060
C007
0C0
080
C009
0C0
100
C011
0C0
170
C018
0
Year
Dev
elop
men
t yea
rIn
Cur
rent
ye
arSu
m o
f yea
rs
(cum
ulat
ive)
01
23
45
67
89
10 &
+
R010
0Pr
ior
1,44
41,
444
1,44
4
R016
020
0913
0,09
677
,337
27,3
8723
,133
22,4
0210
,058
8,63
66,
322
3,53
21,
044
1,04
430
9,94
7
R017
020
1010
7,85
989
,338
25,4
8823
,896
16,8
7814
,575
6,80
15,
791
2,26
92,
269
292,
896
R018
020
1178
,838
44,6
8721
,492
19,1
1819
,669
19,6
485,
000
4,11
54,
115
212,
567
R019
020
1275
,441
42,7
8020
,112
19,9
2022
,111
16,3
619,
146
9,14
620
5,87
3
R020
020
1372
,834
44,4
1026
,478
24,1
5220
,529
22,2
6622
,266
210,
668
R021
020
1410
8,44
253
,113
34,1
3035
,163
19,6
4119
,641
250,
488
R022
020
1571
,898
51,8
7727
,103
19,4
4819
,448
170,
326
R023
020
1664
,393
34,6
4419
,270
19,2
7011
8,30
7
R024
020
1759
,730
38,0
3738
,037
97,7
66
R025
020
1867
,648
67,6
4867
,648
R026
0To
tal
204,
327
1,93
7,93
1
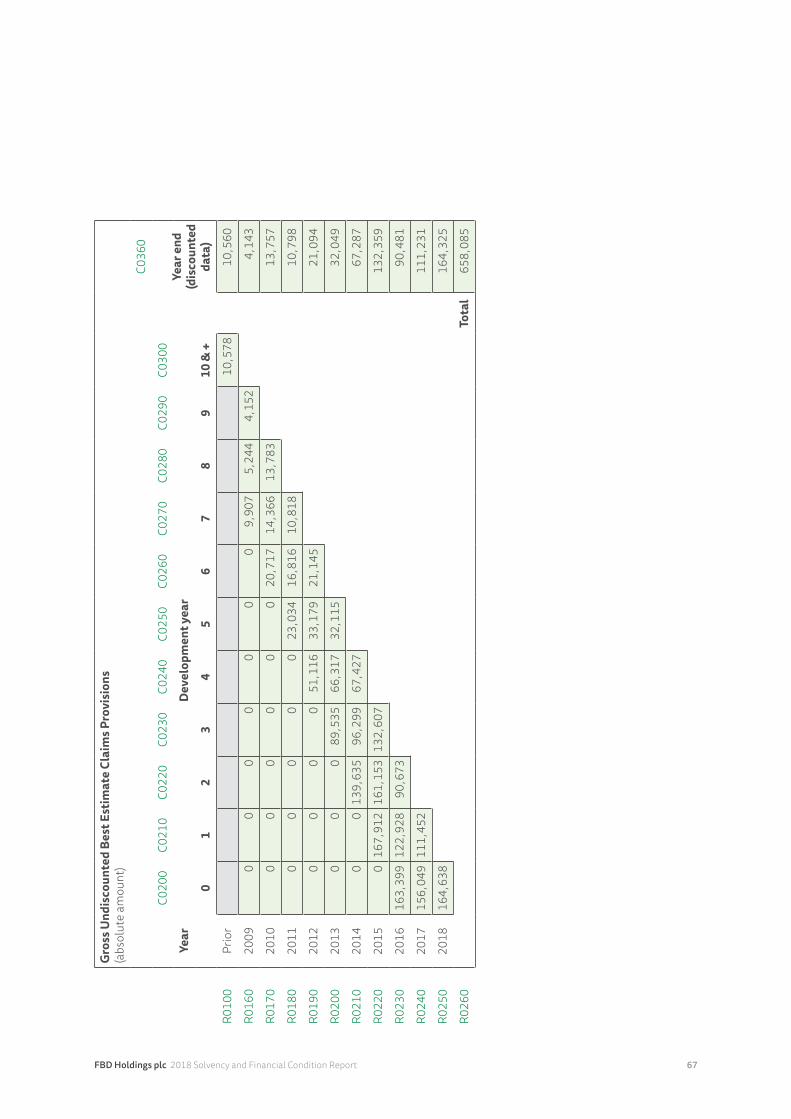
FBD Holdings plc 2018 Solvency and Financial Condition Report 67
Gro
ss U
ndis
coun
ted
Best
Est
imat
e Cl
aim
s Pro
visi
ons
(abs
olut
e am
ount
)
C036
0
C020
0C0
210
C022
0C0
230
C024
0C0
250
C026
0C0
270
C028
0C0
290
C030
0Ye
ar e
nd
(dis
coun
ted
data
)
Year
Dev
elop
men
t yea
r
01
23
45
67
89
10 &
+
R010
0Pr
ior
10,5
7810
,560
R016
020
090
00
00
00
9,90
75,
244
4,15
24,
143
R017
020
100
00
00
020
,717
14,3
6613
,783
13,7
57
R018
020
110
00
00
23,0
3416
,816
10,8
1810
,798
R019
020
120
00
051
,116
33,1
7921
,145
21,0
94
R020
020
130
00
89,5
3566
,317
32,1
1532
,049
R021
020
140
013
9,63
596
,299
67,4
2767
,287
R022
020
150
167,
912
161,
153
132,
607
132,
359
R023
020
1616
3,39
912
2,92
890
,673
90,4
81
R024
020
1715
6,04
911
1,45
211
1,23
1
R025
020
1816
4,63
816
4,32
5
R026
0To
tal
658,
085
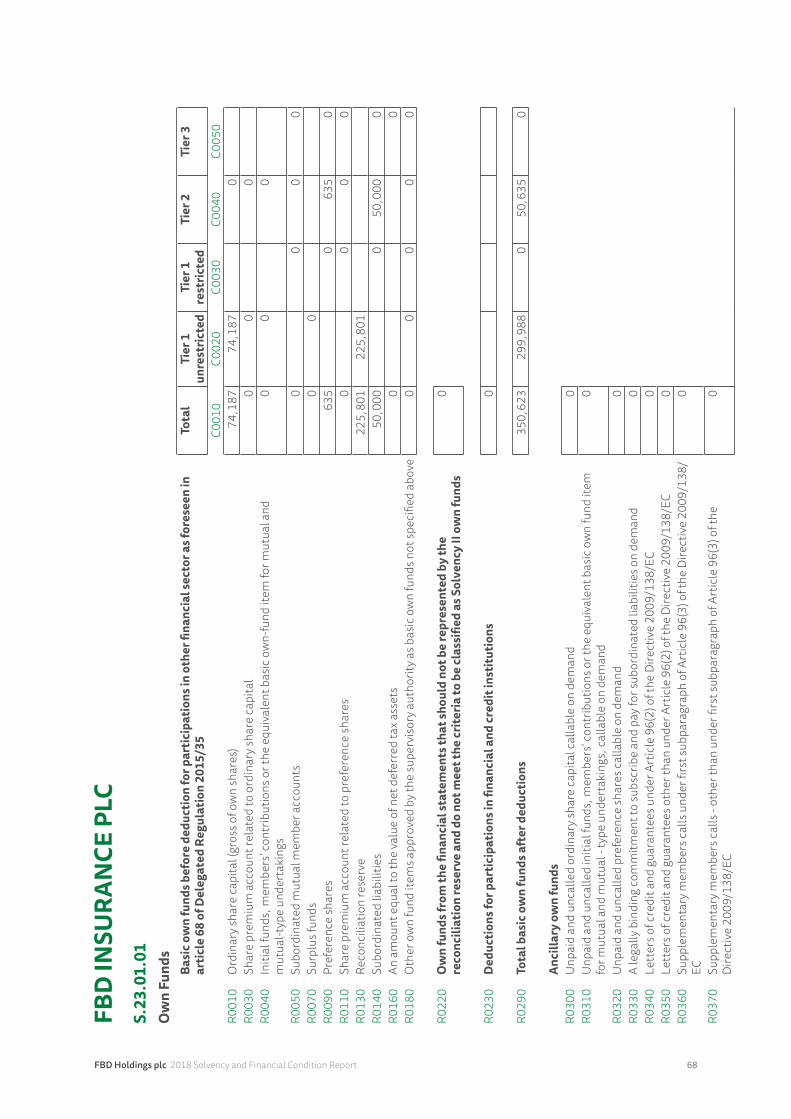
FBD Holdings plc 2018 Solvency and Financial Condition Report 68
FBD
INSU
RAN
CE P
LCS.
23.0
1.01
Ow
n Fu
nds
Basi
c ow
n fu
nds b
efor
e de
duct
ion
for p
artic
ipat
ions
in o
ther
fina
ncia
l sec
tor a
s for
esee
n in
ar
ticle
68
of D
eleg
ated
Reg
ulat
ion
2015
/35
Tota
lTi
er 1
un
rest
ricte
dTi
er 1
re
stric
ted
Tier
2Ti
er 3
C001
0C0
020
C003
0C0
040
C005
0R0
010
Ord
inar
y sha
re ca
pita
l (gr
oss o
f ow
n sh
ares
)74
,187
74,1
870
R003
0Sh
are
prem
ium
acc
ount
rela
ted
to o
rdin
ary s
hare
capi
tal
00
0R0
040
Initi
al fu
nds,
mem
bers
’ con
trib
utio
ns o
r the
equ
ival
ent b
asic
ow
n-fu
nd it
em fo
r mut
ual a
nd
mut
ual-t
ype
unde
rtak
ings
0
00
R005
0Su
bord
inat
ed m
utua
l mem
ber a
ccou
nts
00
00
R007
0Su
rplu
s fun
ds0
0R0
090
Pref
eren
ce sh
ares
635
063
50
R011
0Sh
are
prem
ium
acc
ount
rela
ted
to p
refe
renc
e sh
ares
00
00
R013
0Re
conc
iliat
ion
rese
rve
225,
801
225,
801
R014
0Su
bord
inat
ed li
abili
ties
50,0
000
50,0
000
R016
0An
am
ount
equ
al to
the
valu
e of
net
def
erre
d ta
x as
sets
00
R018
0O
ther
ow
n fu
nd it
ems a
ppro
ved
by th
e su
perv
isor
y aut
horit
y as b
asic
ow
n fu
nds n
ot sp
ecifi
ed a
bove
0
00
00
R022
0O
wn
fund
s fro
m th
e fin
anci
al st
atem
ents
that
shou
ld n
ot b
e re
pres
ente
d by
the
reco
ncili
atio
n re
serv
e an
d do
not
mee
t the
crite
ria to
be
clas
sifie
d as
Sol
venc
y II
own
fund
s0
R023
0D
educ
tions
for p
artic
ipat
ions
in fi
nanc
ial a
nd cr
edit
inst
itutio
ns0
R029
0To
tal b
asic
ow
n fu
nds a
fter
ded
uctio
ns35
0,62
329
9,98
80
50,6
350
Anci
llary
ow
n fu
nds
R030
0U
npai
d an
d un
calle
d or
dina
ry sh
are
capi
tal c
alla
ble
on d
eman
d0
R031
0U
npai
d an
d un
calle
d in
itial
fund
s, m
embe
rs’ c
ontr
ibut
ions
or t
he e
quiv
alen
t bas
ic o
wn
fund
item
fo
r mut
ual a
nd m
utua
l - ty
pe u
nder
taki
ngs,
calla
ble
on d
eman
d0
R032
0U
npai
d an
d un
calle
d pr
efer
ence
shar
es ca
llabl
e on
dem
and
0R0
330
A le
gally
bin
ding
com
mitm
ent t
o su
bscr
ibe
and
pay f
or su
bord
inat
ed li
abili
ties o
n de
man
d 0
R034
0Le
tter
s of c
redi
t and
gua
rant
ees u
nder
Art
icle
96(
2) o
f the
Dire
ctiv
e 20
09/1
38/E
C0
R035
0Le
tter
s of c
redi
t and
gua
rant
ees o
ther
than
und
er A
rtic
le 9
6(2)
of t
he D
irect
ive
2009
/138
/EC
0R0
360
Supp
lem
enta
ry m
embe
rs ca
lls u
nder
firs
t sub
para
grap
h of
Art
icle
96(
3) o
f the
Dire
ctiv
e 20
09/1
38/
EC0
R037
0Su
pple
men
tary
mem
bers
calls
- ot
her t
han
unde
r firs
t sub
para
grap
h of
Art
icle
96(
3) o
f the
D
irect
ive
2009
/138
/EC
0
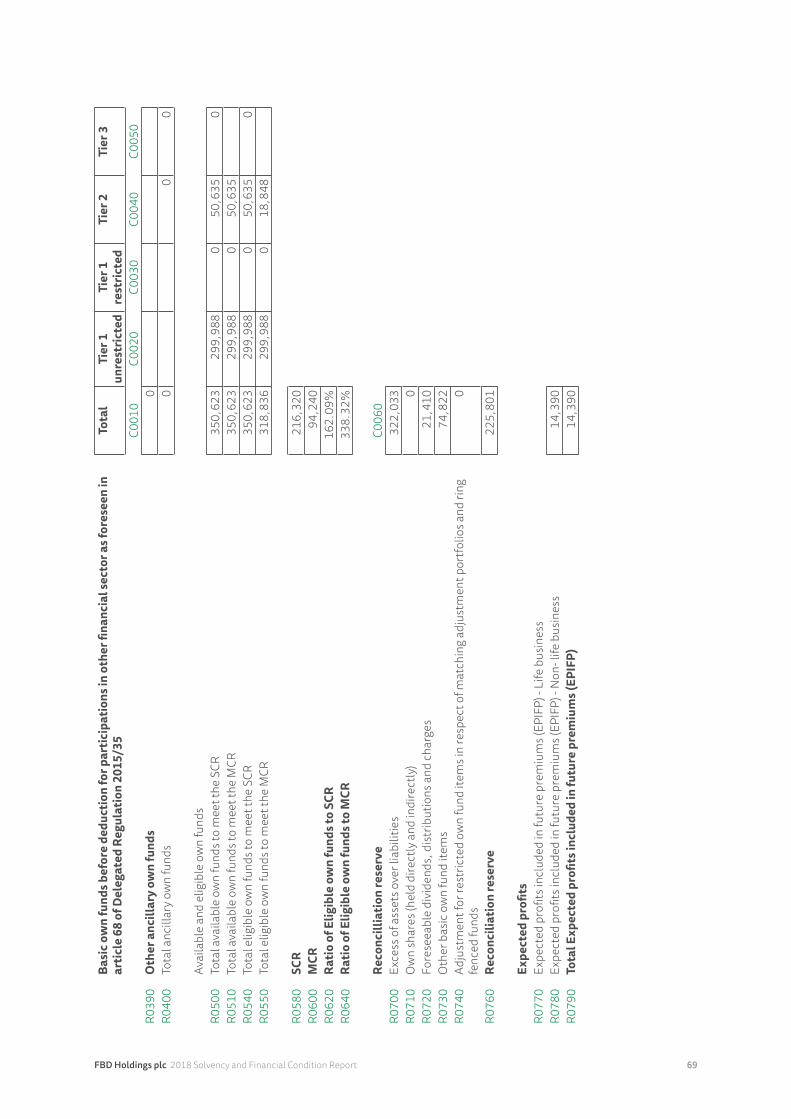
FBD Holdings plc 2018 Solvency and Financial Condition Report 69
Basi
c ow
n fu
nds b
efor
e de
duct
ion
for p
artic
ipat
ions
in o
ther
fina
ncia
l sec
tor a
s for
esee
n in
ar
ticle
68
of D
eleg
ated
Reg
ulat
ion
2015
/35
Tota
lTi
er 1
un
rest
ricte
dTi
er 1
re
stric
ted
Tier
2Ti
er 3
C001
0C0
020
C003
0C0
040
C005
0R0
390
Oth
er a
ncill
ary
own
fund
s0
R040
0To
tal a
ncill
ary o
wn
fund
s0
00
Avai
labl
e an
d el
igib
le o
wn
fund
sR0
500
Tota
l ava
ilabl
e ow
n fu
nds t
o m
eet t
he S
CR35
0,62
329
9,98
80
50,6
350
R051
0To
tal a
vaila
ble
own
fund
s to
mee
t the
MCR
350,
623
299,
988
050
,635
R054
0To
tal e
ligib
le o
wn
fund
s to
mee
t the
SCR
350,
623
299,
988
050
,635
0R0
550
Tota
l elig
ible
ow
n fu
nds t
o m
eet t
he M
CR31
8,83
629
9,98
80
18,8
48
R058
0SC
R21
6,32
0R0
600
MCR
94,2
40R0
620
Ratio
of E
ligib
le o
wn
fund
s to
SCR
162.
09%
R064
0Ra
tio o
f Elig
ible
ow
n fu
nds t
o M
CR33
8.32
%
Reco
ncill
iatio
n re
serv
eC0
060
R070
0Ex
cess
of a
sset
s ove
r lia
bilit
ies
322,
033
R071
0O
wn
shar
es (h
eld
dire
ctly
and
indi
rect
ly)
0R0
720
Fore
seea
ble
divi
dend
s, d
istr
ibut
ions
and
char
ges
21,4
10R0
730
Oth
er b
asic
ow
n fu
nd it
ems
74,8
22R0
740
Adju
stm
ent f
or re
stric
ted
own
fund
item
s in
resp
ect o
f mat
chin
g ad
just
men
t por
tfol
ios a
nd ri
ng
fenc
ed fu
nds
0
R076
0Re
conc
iliat
ion
rese
rve
225,
801
Expe
cted
pro
fits
R077
0Ex
pect
ed p
rofit
s inc
lude
d in
futu
re p
rem
ium
s (EP
IFP)
- Li
fe b
usin
ess
R078
0Ex
pect
ed p
rofit
s inc
lude
d in
futu
re p
rem
ium
s (EP
IFP)
- N
on- l
ife b
usin
ess
14,3
90R0
790
Tota
l Exp
ecte
d pr
ofits
incl
uded
in fu
ture
pre
miu
ms (
EPIF
P)14
,390
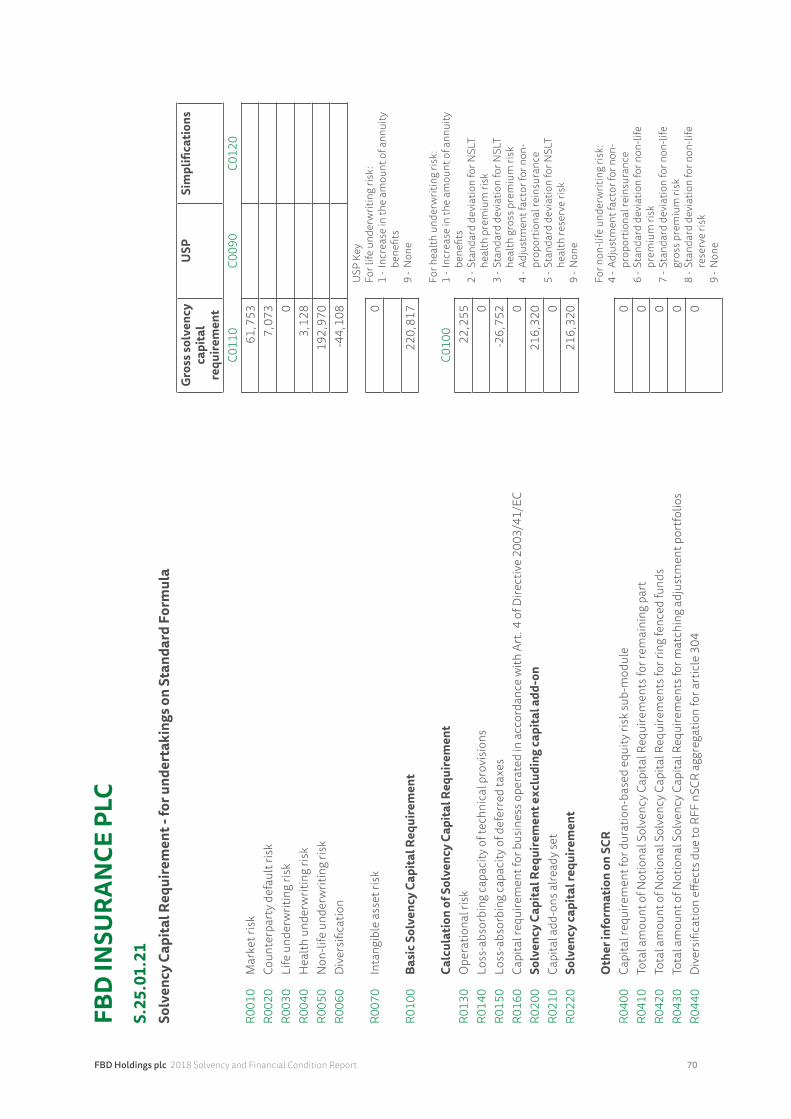
FBD Holdings plc 2018 Solvency and Financial Condition Report 70
FBD
INSU
RAN
CE P
LCS.
25.0
1.21
Solv
ency
Cap
ital R
equi
rem
ent -
for u
nder
taki
ngs o
n St
anda
rd F
orm
ula
Gro
ss so
lven
cy
capi
tal
requ
irem
ent
USP
Sim
plifi
catio
ns
C011
0C0
090
C012
0R0
010
Mar
ket r
isk
61,7
53R0
020
Coun
terp
arty
def
ault
risk
7,07
3R0
030
Life
und
erw
ritin
g ris
k0
R004
0H
ealth
und
erw
ritin
g ris
k3,
128
R005
0N
on-li
fe u
nder
writ
ing
risk
192,
970
R006
0D
iver
sific
atio
n-4
4,10
8U
SP K
eyFo
r life
und
erw
ritin
g ris
k:1
- Inc
reas
e in
the
amou
nt o
f ann
uity
be
nefit
s9
- Non
e
For h
ealth
und
erw
ritin
g ris
k:1
- Inc
reas
e in
the
amou
nt o
f ann
uity
be
nefit
s2
- Sta
ndar
d de
viat
ion
for N
SLT
heal
th p
rem
ium
risk
3 - S
tand
ard
devi
atio
n fo
r NSL
T he
alth
gro
ss p
rem
ium
risk
4 - A
djus
tmen
t fac
tor f
or n
on-
prop
ortio
nal r
eins
uran
ce5
- Sta
ndar
d de
viat
ion
for N
SLT
heal
th re
serv
e ris
k9
- Non
e
For n
on-li
fe u
nder
writ
ing
risk:
4 - A
djus
tmen
t fac
tor f
or n
on-
prop
ortio
nal r
eins
uran
ce6
- Sta
ndar
d de
viat
ion
for n
on-li
fe
prem
ium
risk
7 - S
tand
ard
devi
atio
n fo
r non
-life
gr
oss p
rem
ium
risk
8 - S
tand
ard
devi
atio
n fo
r non
-life
re
serv
e ris
k9
- Non
e
R007
0In
tang
ible
ass
et ri
sk0
R010
0Ba
sic S
olve
ncy
Capi
tal R
equi
rem
ent
220,
817
Calc
ulat
ion
of S
olve
ncy
Capi
tal R
equi
rem
ent
C010
0R0
130
Ope
ratio
nal r
isk
22,2
55R0
140
Loss
-abs
orbi
ng ca
paci
ty o
f tec
hnic
al p
rovi
sion
s0
R015
0Lo
ss-a
bsor
bing
capa
city
of d
efer
red
taxe
s-2
6,75
2R0
160
Capi
tal r
equi
rem
ent f
or b
usin
ess o
pera
ted
in a
ccor
danc
e w
ith A
rt. 4
of D
irect
ive
2003
/41/
EC0
R020
0So
lven
cy C
apita
l Req
uire
men
t exc
ludi
ng ca
pita
l add
-on
216,
320
R021
0Ca
pita
l add
-ons
alre
ady s
et0
R022
0So
lven
cy ca
pita
l req
uire
men
t21
6,32
0
Oth
er in
form
atio
n on
SCR
R040
0Ca
pita
l req
uire
men
t for
dur
atio
n-ba
sed
equi
ty ri
sk su
b-m
odul
e0
R041
0To
tal a
mou
nt o
f Not
iona
l Sol
venc
y Cap
ital R
equi
rem
ents
for r
emai
ning
par
t0
R042
0To
tal a
mou
nt o
f Not
iona
l Sol
venc
y Cap
ital R
equi
rem
ents
for r
ing
fenc
ed fu
nds
0R0
430
Tota
l am
ount
of N
otio
nal S
olve
ncy C
apita
l Req
uire
men
ts fo
r mat
chin
g ad
just
men
t por
tfol
ios
0R0
440
Div
ersi
ficat
ion
effec
ts d
ue to
RFF
nSC
R ag
greg
atio
n fo
r art
icle
304
0
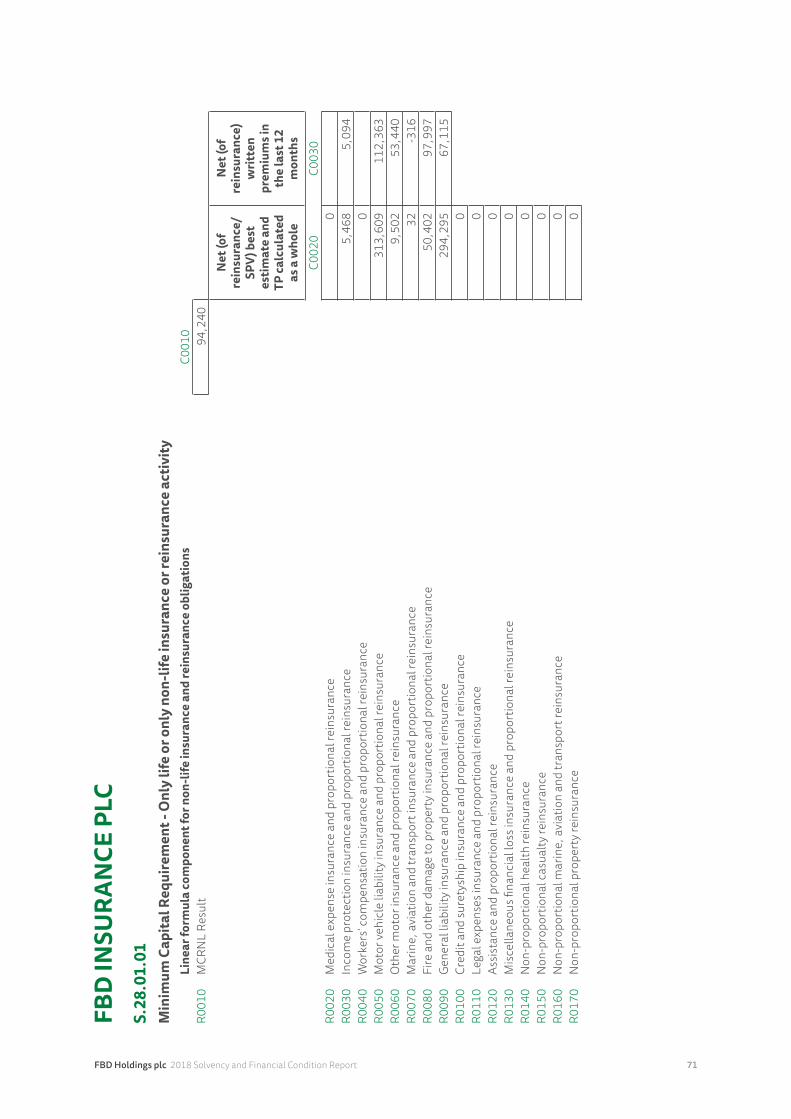
FBD Holdings plc 2018 Solvency and Financial Condition Report 71
FBD
INSU
RAN
CE P
LCS.
28.0
1.01
Min
imum
Cap
ital R
equi
rem
ent -
Onl
y lif
e or
onl
y no
n-lif
e in
sura
nce
or re
insu
ranc
e ac
tivity
Line
ar fo
rmul
a co
mpo
nent
for n
on-li
fe in
sura
nce
and
rein
sura
nce
oblig
atio
nsC0
010
R001
0M
CRN
L Re
sult
94,2
40N
et (o
f re
insu
ranc
e/SP
V) b
est
estim
ate
and
TP ca
lcul
ated
as
a w
hole
Net
(of
rein
sura
nce)
w
ritte
n pr
emiu
ms i
n th
e la
st 1
2 m
onth
sC0
020
C003
0R0
020
Med
ical
exp
ense
insu
ranc
e an
d pr
opor
tiona
l rei
nsur
ance
0R0
030
Inco
me
prot
ectio
n in
sura
nce
and
prop
ortio
nal r
eins
uran
ce5,
468
5,09
4R0
040
Wor
kers
’ com
pens
atio
n in
sura
nce
and
prop
ortio
nal r
eins
uran
ce0
R005
0M
otor
vehi
cle
liabi
lity i
nsur
ance
and
pro
port
iona
l rei
nsur
ance
313,
609
112,
363
R006
0O
ther
mot
or in
sura
nce
and
prop
ortio
nal r
eins
uran
ce9,
502
53,4
40R0
070
Mar
ine,
avi
atio
n an
d tr
ansp
ort i
nsur
ance
and
pro
port
iona
l rei
nsur
ance
32-3
16R0
080
Fire
and
oth
er d
amag
e to
pro
pert
y ins
uran
ce a
nd p
ropo
rtio
nal r
eins
uran
ce50
,402
97,9
97R0
090
Gen
eral
liab
ility
insu
ranc
e an
d pr
opor
tiona
l rei
nsur
ance
294,
295
67,1
15R0
100
Cred
it an
d su
rety
ship
insu
ranc
e an
d pr
opor
tiona
l rei
nsur
ance
0R0
110
Lega
l exp
ense
s ins
uran
ce a
nd p
ropo
rtio
nal r
eins
uran
ce0
R012
0As
sist
ance
and
pro
port
iona
l rei
nsur
ance
0R0
130
Mis
cella
neou
s fina
ncia
l los
s ins
uran
ce a
nd p
ropo
rtio
nal r
eins
uran
ce0
R014
0N
on-p
ropo
rtio
nal h
ealth
rein
sura
nce
0R0
150
Non
-pro
port
iona
l cas
ualty
rein
sura
nce
0R0
160
Non
-pro
port
iona
l mar
ine,
avi
atio
n an
d tr
ansp
ort r
eins
uran
ce0
R017
0N
on-p
ropo
rtio
nal p
rope
rty r
eins
uran
ce0
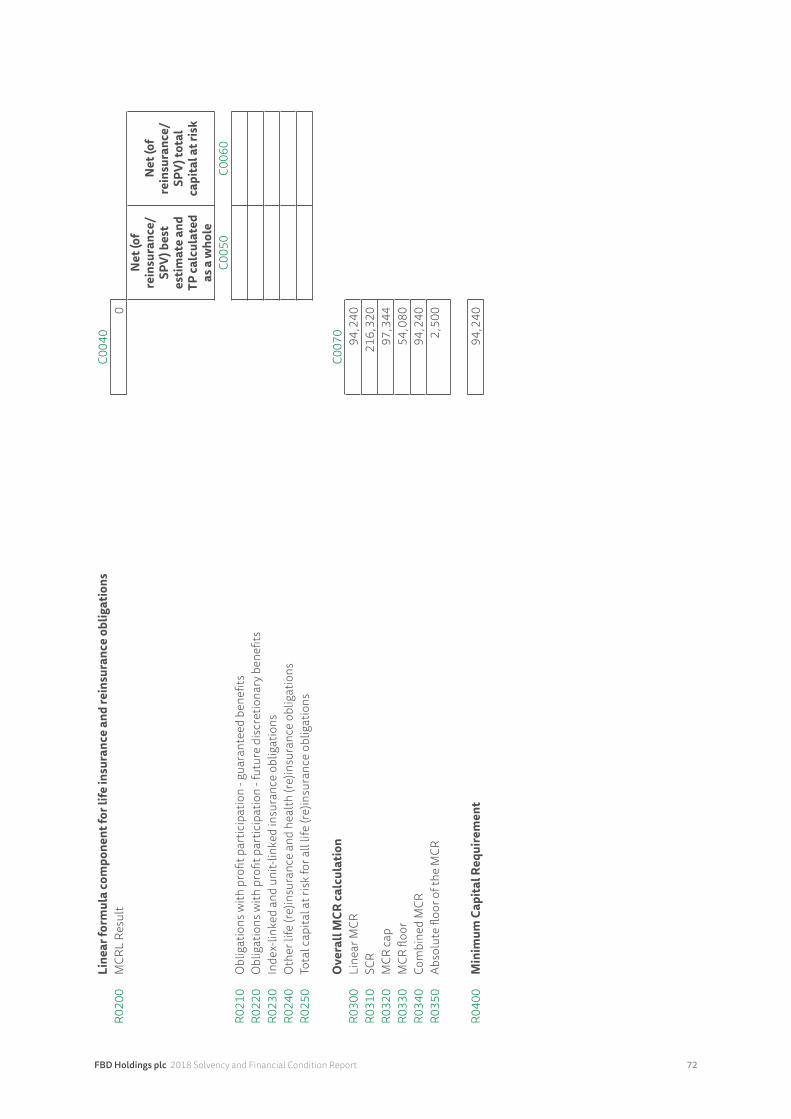
FBD Holdings plc 2018 Solvency and Financial Condition Report 72
Line
ar fo
rmul
a co
mpo
nent
for l
ife in
sura
nce
and
rein
sura
nce
oblig
atio
nsC0
040
R020
0M
CRL
Resu
lt0
Net
(of
rein
sura
nce/
SPV)
bes
t es
timat
e an
d TP
calc
ulat
ed
as a
who
le
Net
(of
rein
sura
nce/
SPV)
tota
l ca
pita
l at r
isk
C005
0C0
060
R021
0O
blig
atio
ns w
ith p
rofit
par
ticip
atio
n - g
uara
ntee
d be
nefit
sR0
220
Obl
igat
ions
with
pro
fit p
artic
ipat
ion
- fut
ure
disc
retio
nary
ben
efits
R023
0In
dex-
linke
d an
d un
it-lin
ked
insu
ranc
e ob
ligat
ions
R0
240
Oth
er li
fe (r
e)in
sura
nce
and
heal
th (r
e)in
sura
nce
oblig
atio
nsR0
250
Tota
l cap
ital a
t ris
k fo
r all
life
(re)in
sura
nce
oblig
atio
ns
Ove
rall
MCR
calc
ulat
ion
C007
0R0
300
Line
ar M
CR94
,240
R031
0SC
R21
6,32
0R0
320
MCR
cap
97,3
44R0
330
MCR
floo
r54
,080
R034
0Co
mbi
ned
MCR
94,2
40R0
350
Abso
lute
floo
r of t
he M
CR2,
500
R040
0M
inim
um C
apita
l Req
uire
men
t94
,240