Protecting soymilk flavor and nutrients from … Kraft Foods Group , ... (Webster et al. 2009 ). The...
12
319 Introduction Soymilk (SM) sales have increased significantly from $250 M/year in 1996 to $1.25 B/year in 2011 (Soyfoods Association of North America 2012). The increase in sales may be attributed to improved processing methods and sensory attributes of soymilk as well as increased consumer interest in functional foods for health value. Soymilk contains heart-healthy polyunsaturated fatty acids (PUFA; 63% of total fat), including the omega-3 fatty acid lino- lenic acid (18:3 [n-3]), which are susceptible to autoxida- tion and photooxidation (Frankel 1984; Min and Boff 2002). Photooxidation of soymilk occurs when photosensitizing molecules (e.g., riboflavin [Rb]), are activated by light en- ergy and contribute to oxidation of PUFA. This leads to decreased health value of the product as well as develop- ment of off-flavors (Chang and Duncan 2012). Bovine milk, which is composed of approximately 31% unsaturated fatty acids (Mansson 2008), is also highly susceptible to pho- tooxidation. Riboflavin is found naturally in bovine milk at a concentration of 1.87 μg/mL and occurs in soymilk naturally at 0.7 μg/mL (Gebhardt and Thomas 2002). However, riboflavin is listed as an added ingredient on soymilk food labels. Kwok et al. (2002) reported Rb in soymilk at concentrations of 2.44 mg/kg. Porphyrin ORIGINAL RESEARCH Protecting soymilk flavor and nutrients from photodegradation Laurie M. Bianchi 1 , Susan E. Duncan 2 , Janet B. Webster 3 , Daryan S. Johnson 4 , Hao-Hsun Chang 2 , Joseph E. Marcy 2 & Sean F. O’Keefe 2 1 Department of Human Nutrition, Foods and Exercise, Wallace Hall, Virginia Polytechnic Institute and State University (Virginia Tech), Blacksburg, Virginia 24061 2 Department of Food Science and Technology, Virginia Polytechnic Institute and State University (Virginia Tech),1230 Washington St. SW, Blacksburg, Virginia 24061 3 Fralin Life Science Institute, Virginia Polytechnic Institute and State University (Virginia Tech),101B Fralin, West Campus Drive, Blacksburg, Virginia 24061 4 Kraft Foods Group, Kraft Foods North America,1701 West Bradley Ave., Champaign, Illinois 61821 Keywords Light, oxidation, packaging, sensory Correspondence Susan E. Duncan, Virginia Tech, 1230 Washington St. SW, Blacksburg, VA 24061. Tel: (540) 231 8675; Fax: (540) 231 9293; E-mail: [email protected] Funding Information This project was funded, in part, by DuPont (Wilmington, Delaware), by the Virginia Agricultural Experiment Station, and the Hatch Program of the National Institute of Food and Agriculture, U.S. Department of Agriculture. Publication costs were provided by Virginia Tech’s Open Access Subvention Fund. Received: 15 November 2014; Revised: 15 February 2015; Accepted: 18 February 2015 Food Science & Nutrition 2015; 3(4): 319–330 doi: 10.1002/fsn3.222 Abstract Five different packaging treatments were studied over a 36-day period to determine if they protected soymilk from photo-oxidation. Soymilk was packaged in high-density polyethylene (HDPE) bottles with and without light protective additives (LPA). Two controls [(1) no LPA (translucent appear- ance); (2) a light-protected control (foil overwrap over no LPA control)] and three LPA-containing treatments, Low (0.6% TiO 2 ), Medium (1.3% TiO 2 ), High (4.3% TiO 2 ) were studied. Bottles were stored in a lighted refrigerated display case (average light intensity between 800 to 2200 lux; 3°C) for 36 days and evaluated weekly. Soymilk packaged in high LPA bottles was protected from devel- oping light-oxidized off-flavors and odors for a minimum of 15 days. High LPA bottles provided protection for riboflavin and controlled development of photooxidative products for approximately 29 days. © 2015 The Authors. Food Science & Nutrition published by Wiley Periodicals, Inc. This is an open access article under the terms of the Creative Commons Attribution License, which permits use, distribution and reproduction in any medium, provided the original work is properly cited.
Transcript of Protecting soymilk flavor and nutrients from … Kraft Foods Group , ... (Webster et al. 2009 ). The...

319
Introduction
Soymilk (SM) sales have increased signifi cantly from $250 M/year in 1996 to $1.25 B/year in 2011 (Soyfoods Association of North America 2012 ). The increase in sales may be attributed to improved processing methods and sensory attributes of soymilk as well as increased consumer interest in functional foods for health value. Soymilk contains heart- healthy polyunsaturated fatty acids (PUFA; 63% of total fat), including the omega- 3 fatty acid lino-lenic acid (18:3 [n- 3]), which are susceptible to autoxida-tion and photooxidation (Frankel 1984 ; Min and Boff 2002 ).
Photooxidation of soymilk occurs when photosensitizing molecules (e.g., ribofl avin [Rb]), are activated by light en-ergy and contribute to oxidation of PUFA. This leads to decreased health value of the product as well as develop-ment of off- fl avors (Chang and Duncan 2012 ). Bovine milk, which is composed of approximately 31% unsaturated fatty acids (Mansson 2008 ), is also highly susceptible to pho-tooxidation. Ribofl avin is found naturally in bovine milk at a concentration of 1.87 µ g/mL and occurs in soymilk naturally at 0.7 µ g/mL (Gebhardt and Thomas 2002 ). However, ribofl avin is listed as an added ingredient on soymilk food labels. Kwok et al. ( 2002 ) reported Rb in soymilk at concentrations of 2.44 mg/kg. Porphyrin
ORIGINAL RESEARCH
Protecting soymilk fl avor and nutrients from photodegradation Laurie M. Bianchi 1 , Susan E. Duncan 2 , Janet B. Webster 3 , Daryan S. Johnson 4 , Hao-Hsun Chang 2 , Joseph E. Marcy 2 & Sean F. O ’ Keefe 2
1 Department of Human Nutrition, Foods and Exercise , Wallace Hall , Virginia Polytechnic Institute and State University (Virginia Tech) , Blacksburg , Virginia 24061
2 Department of Food Science and Technology , Virginia Polytechnic Institute and State University (Virginia Tech) , 1230 Washington St. SW , Blacksburg , Virginia 24061
3 Fralin Life Science Institute , Virginia Polytechnic Institute and State University (Virginia Tech) , 101B Fralin, West Campus Drive , Blacksburg , Virginia 24061
4 Kraft Foods Group , Kraft Foods North America , 1701 West Bradley Ave. , Champaign , Illinois 61821
Keywords Light , oxidation , packaging , sensory
Correspondence Susan E. Duncan, Virginia Tech, 1230 Washington St. SW, Blacksburg, VA 24061. Tel: (540) 231 8675; Fax: (540) 231 9293; E-mail: [email protected]
Funding Information This project was funded, in part, by DuPont (Wilmington, Delaware), by the Virginia Agricultural Experiment Station, and the Hatch Program of the National Institute of Food and Agriculture, U.S. Department of Agriculture. Publication costs were provided by Virginia Tech’s Open Access Subvention Fund.
Received: 15 November 2014 ; Revised: 15 February 2015 ; Accepted: 18 February 2015
Food Science & Nutrition 2015; 3(4): 319–330
doi: 10.1002/fsn3.222
Abstract
Five different packaging treatments were studied over a 36- day period to determine if they protected
soymilk from photo- oxidation. Soymilk was packaged in high- density polyethylene ( HDPE ) bottles
with and without light protective additives ( LPA ). Two controls [(1) no LPA (translucent appear-
ance); (2) a light- protected control (foil overwrap over no LPA control)] and three LPA - containing
treatments, Low (0.6% TiO 2 ), Medium (1.3% TiO
2 ), High (4.3% TiO
2 ) were studied. Bottles were
stored in a lighted refrigerated display case (average light intensity between 800 to 2200 lux; 3°C)
for 36 days and evaluated weekly. Soymilk packaged in high LPA bottles was protected from devel-
oping light- oxidized off- fl avors and odors for a minimum of 15 days. High LPA bottles provided
protection for ribofl avin and controlled development of photooxidative products for approximately
29 days.
© 2015 The Authors. Food Science & Nutrition published by Wiley Periodicals, Inc. This is an open access article under the terms of the Creative Commons Attribution License, which permits use, distribution and reproduction in any medium, provided the original work is properly cited.

320 © 2015 The Authors. Food Science & Nutrition published by Wiley Periodicals, Inc.
L. M. Bianchi et al.Protecting Soymilk Flavor and Nutrients
structures, such as chlorophyll, also may function as pho-tosensitizers; their presence in milk is suggested but not confi rmed (Wold et al. 2005 ; Webster et al. 2011 ) nor is there any reported concentration of chlorophyll in soymilk.
Because soymilk is higher in PUFA and Rb than bovine milk, the potential for photooxidation is higher. This suggests that photooxidation, which results when singlet oxygen is produced, could rapidly decrease shelf- life of soymilk due to degradation of fl avor quality. Other com-ponents of soymilk complicate this theory, however. Soymilk contains polyphenols that are also known to be antioxidants; however, under certain conditions, such as higher concentrations or interactions with other com-ponents, these polyphenols can act as prooxidants (Sisa et al. 2010 ). Additionally, the carotenoid vitamin A, which is enriched in bovine milk (2.08 IU/mL) and in soymilk (O.87 IU/mL), behaves as an antioxidant, but is present at different levels. Therefore, there are many factors in these two beverages that may result in different responses to light.
Soymilk and bovine milk are commonly packaged in paperboard or high- density polyethylene (HDPE) packag-ing. Packaging for light- sensitive products often has light protective additives (LPA), such as titanium dioxide (TiO
2 ),
added. LPA molecules interfere with light transmission, creating a visually opaque or colored packaging material that limits light penetration into the product. Novel ap-proaches for modifying polymer material opacity and light interference for protecting food quality can improve product quality (Webster et al. 2009 ).
The purpose of this study was to determine the effect of light on the oxidative stability of soymilk and subsequent quality, as measured with sensory testing and chemical analyses. Effi cacy of LPA in HDPE packaging in protecting soymilk quality was assessed.
Materials and Methods
Packaging
HDPE bottles (dimensions: 7.16”ht × 3.29”w × 2.1” deep; volume to overfl ow: 528 mL) were manufactured with three experimental TiO
2 characteristics (DuPont ™ ,
Wilmington, DE) as well as an HDPE control with no LPA. Titanium dioxide, especially the rutile crystalline form, has the ability to attenuate various wavelengths of light. Pigmentary size rutile has the ability to attenuate light via absorption and scattering due to the particle size range (Egerton 2014 ). Rutile attenuation for wave-lengths less than 380 nm (UV attenuation) is achieved via the absorption mechanism while the scattering phe-nomenon is related to the wavelengths greater than 380 but less than 700 nm (visible attenuation). Many ingredients
present within fl uid dairy applications have sensitivity to both UV and visible wavelengths. As such, a pigmentary size rutile, one that absorbs and scatters, is required for this evaluation.
The three experimental treatments were differentiated by LPA contained within the bottle resin, yielding bot-tles with different levels of light protection. For experi-mental purposes, LPA- containing treatments were identifi ed as Low (0.6% TiO
2 ), Medium (Med; 1.3%
TiO 2 ), and High (4.3% TiO
2 ), to indicate the targeted
level of light protection. The transmittance spectra for each treatment bottle are shown in Fig. 1 . Control pack-aging treatments included foil- wrapped light- protected control bottles (F = foil- wrapped; 0% TiO
2 ), which
provided no light penetration to the product, and control bottles (no LPA, no foil overwrap; 0% TiO
2 ), identifi ed
as clear (C) because the product could be readily seen through the bottle although the package was translucent. Milk in the treatment bottles was not readily visible as the bottles were opaque. Bottles and caps were sanitized with 100 ppm chlorine solution, rinsed with deionized distilled water, and drained prior to fi lling with soymilk product.
Product
Soymilk (PS Lite, 128 one- half gallon paperboard contain-ers, Kroger Co., Cincinnati, OH) was purchased from a local supermarket on the delivery date and transported immediately (5 min drive) to the Virginia Tech Food Science and Technology Department in chilled portable coolers. The product label stated the following ingredients: fi ltered water, whole organic soybeans, organic evaporated cane syrup, calcium carbonate, natural fl avors, sea salt, carrageenan, vitamin A palmitate, vitamin D
2 , Rb, and
vitamin B 12.
Package fi lling and product storage
Package fi lling
Half- gallon cartons of soymilk ( n = 128) were commingled into a clean, sanitized bucket (5 gallon GeFcontainer, General Films, Inc. Covington, OH) throughout the fi lling process. The product was kept covered and cold on ice throughout the fi lling operation. Each bottle was fi lled with soymilk (450 mL), using a peristaltic pump (Wheaton Unispense II, Millville, NJ) and sanitized tubing, under a positive airfl ow hood (Atmos Tech Industries, Ocean NJ) to minimize incidental microbial contamination from the air. Packages were immediately capped and stored in a darkened portable cooler on ice, then transferred to a refrigerated cooling system. Product was stored under

321© 2015 The Authors. Food Science & Nutrition published by Wiley Periodicals, Inc.
Protecting Soymilk Flavor and NutrientsL. M. Bianchi et al.
refrigerated conditions, with product evaluation occurring at seven intervals over 36 days.
Shelf- life storage conditions for sensory testing
Filled bottles were placed into a refrigerated Friedrich Floating Air beverage case (Friedrich 60- 10- 1056; San Antonio, TX) to simulate retail conditions. The cooler was glass fronted with 5 doors and equipped with cool white, 32- watt fl uorescent light bulbs (Alto II, Panasonic, Maple Grove, MN), simulating retail conditions. Above each of three shelves, 2 fl uorescent light bulbs ran the horizontal length of the dairy case over each shelf at one- fi fth and four- fi fth the distance from the front of the shelf. Bottles were 11.43 cm below horizontal lights. Six light bulbs were positioned vertically at the front of the dairy case, at each end of the case and between each door junction.
Bottle placement was randomized so that all treatments were distributed randomly within the dairy case to reduce the effects of different lighting intensity within the case. Temperature and light intensity were measured routinely. The average temperature of the dairy case was 2.7°C ± 0.8. Over the 5- week storage study, light intensity measure-ments were taken in three general locations on each treat-ment for each day of analysis. Light intensity averaged 1122 lux ± 439 (range: 355–1942 lux), depending on sampling location. Because of this broad range of light intensity, 10 bottles of each treatment and 20 bottles of each control were randomly selected for sampling on each day of analyses. Product from at least two bottles per treatment was used for each analytical assay.
Shelf- life storage conditions for analytical testing
Chemical analyses were completed in two experimental blocks (A, B) and were separate from the sensory study. Block A was completed in April and block B was com-pleted in August. A failure of the refrigerated dairy case to maintain temperatures under the conditions of the summer heat required a change in sample storage; this situation created the need for blocking.
Soymilk was obtained and fi lled into bottles as described previously. Each bottle was labeled on the bottom, fi lled, and randomly placed into the same dairy case as used for the sensory tests (block A) or a walk- in cooler (block B) (Tonka, Hopkins, MN). Randomization was completed to ensure that bottles from each treatment group were pulled out from random areas of the cooler on each day of analysis. In the fi rst study (Block A), light intensity was measured over each bottle and averaged 2186 lux ± 867 with a range from 396 to 3970 lux, depending on sam-pling location. Temperature averaged 3.0°C ± 0.87. For the second study (Block B), temperature was taken in two different areas of the walk- in cooler. For Block B, temperatures ranged from 5 to 8°C with an average of 5.7°C ± 0.9. Light intensity was measured in fi ve random locations above the bottles on day 1, with an average light intensity of 794.2 lux ± 43.1. Philips 34- W fl uorescent light bulbs (Panasonic, Maple Grove, MN) were placed 12.7 cm over the bottles on two length sides of the area of the treatment bottles. Treatment bottles were pulled out of the dairy case/cooler on days 1, 4(block A)/3(block B), 8, 15, 22, 29, and 36. Averages of all data for both blocks are presented.
Figure 1 . Percent transmittance spectra of the different levels of TiO 2 added to the HDPE treatment bottles.
322 © 2015 The Authors. Food Science & Nutrition published by Wiley Periodicals, Inc.
L. M. Bianchi et al.Protecting Soymilk Flavor and Nutrients
Sensory testing
Sensory testing
IRB approval for use of human subjects in research was obtained from the Virginia Tech Institutional Review Board (IRB #11- 477, approved Oct 14, 2011). Panelists were re-cruited from student, faculty, and staff at VT and the local community members. Ninety- eight panelists were targeted to complete the sensory testing for each day of evaluation to achieve targeted statistical parameters (alpha, beta, and proportion of discriminators [ p
d ]) as described below.
Panelists completed informed consent prior to initiating the sensory test. Panelists evaluated the samples in parti-tioned sensory booths, equipped with a touch screen monitor for data collection, under white lighting. Data were collected using Sensory Information Management Software (SIMS 2000; Sensory Computer Management, Morristown, NJ).
Triangle tests for difference as well as for similarity were completed on each day of evaluation using the unifi ed ap-proach to similarity and difference testing (Meilgaard et al. 2007 ). Testing for similarity in soymilk fl avor was completed for the three LPA experimental treatments compared to the foil- wrapped light- protected (F) control (F:Low, F:Med, F:High); testing for difference was completed for all ex-perimental treatments compared to the no LPA light- exposed (C) bottles (C:Low, C:Med, C:High). A comparison of the two controls (F:C) was also completed. Testing for similarity provided determination that the opacity of the package protected as well as light- protected control bottles. Testing for difference allowed determination that the packaging opacity protected better than light- exposed controls.
Sensory statistical design and parameters
An incomplete randomized block design was used, with each panelist receiving three 3- sample sets (nine total sam-ples) on each testing date. This design reduced biases due to sensory fatigue. The order of samples within a com-parison set was organized in a balanced order so that all possible combinations were presented an equal number of times. The order of the three sample sets was rand-omized so that there would be no bias based on the order of presentation, to reduce the infl uence of fatigue. Each set of three samples had two identical samples from one packaging treatment and one sample from a different treat-ment. The panelists were instructed to smell and taste the samples from left to right and choose the sample that was different, using the touch screen monitor. Panelists were required to choose a sample even if they could not detect a difference. Water and unsalted oyster crackers were given to each panelist for consumption to cleanse the palette between each triangle test.
Statistical parameters for the triangle test for similarity were established prior to beginning the study, comparing treatment packages to foil- wrapped controls, based on an α of 0.20, β of 0.05, and a p
d of 0.30. For triangle test
for difference, comparing treatment packages to clear controls, an α of 0.05, a β of 0.20, and a p
d of 0.30 was
preestablished. However, because the number of panelists participating on any given day of evaluation varied, the actual post hoc calculated parameters varied. Analysis of data was completed as described by Meilgaard et al. ( 2007 ).
Chemical analysis
Analytical assessment
Chemical analyses included Rb degradation, thiobarbituric acid- reactive substances (TBARS), and GC- MS analysis of selected headspace volatiles. Analysis of bacterial contamina-tion was completed on 3M Petrifi lm™ aerobic petri fi lm (3M, St. Paul, MN) on each day of chemical analysis. Bottles were pulled out each morning and soymilk portioned into appropriate vials for analysis.
Rb analysis was done according to a modifi ed assay of AOAC number 960.65 in which the fl uorescence of Rb was measured on a spectrofl uorometer with excitation at 450 nm and emission at 520 nm (Shimadzo Scientifi c Instrument, Inc., Columbia, MD) (AOAC 1998 ).
Thiobarbituric- reactive substances (TBARS), reported as mg/kg product, were assayed in each sample. The TBARS assay is a measurement of formation of malondialdehyde, a secondary product of oxidation and an indicator of the production of other secondary volatile oxidation products. The procedure was modifi ed from Spanier and Taylor ( 1991 ) for milk analysis.
Volatile analysis was completed on control and treat-ment samples. Volatile compounds from the soymilk were extracted and separated using solid phase microextraction- gas chromatography (SPME- GC). An HP 5890 GC with 5972 series mass selective detector HP5MS (Hewlett Packard, Palo Alto, CA) was used to separate and identify volatile headspace compounds. Samples (8 mL) were heated in 20- mL amber glass vials to 45°C on an RCT basic heater with an ETS- D4 Fuzzy Controller (IKA Werke, Wilmington, NC), while being stirred. An 85um carboxen- polydimethyl siloxane (PDMS) solid- phase microextraction (SPME) fi ber (Supelco, Bellefonte, PA) was used to adsorb volatile com-pounds. The fi ber was exposed to the headspace for 20 min. Volatiles were desorbed from the fi ber onto an HP- 5MS capillary column (30 m × 0.25 mm id × 0.25 µ m fi lm thickness) to separate and analyze volatiles. The following procedure was used: Helium gas fl ow: 28–36 cm/sec; injec-tor temperature: 280°C; and detector temperature: 280°C. The initial temperature of 35°C was held for 0.5 min then

323© 2015 The Authors. Food Science & Nutrition published by Wiley Periodicals, Inc.
Protecting Soymilk Flavor and NutrientsL. M. Bianchi et al.
ramped by 15°C/min to 180°C and held for 0.5 min. The temperature then was ramped by 20°C/min to 260°C with the fi nal temperature held for 0.5 min. The total run time was 15.17 min and the program was run in the splitless mode. The chromatograms were integrated using HP ChemStation software (Hewlett Packard, Palo Alto, CA). The identifi cation of the compounds was made by the combination of Wiley275 Mass Spectral Library software and retention time of an authentic standard compound, hexanal (98%, Sigma Aldrich, St. Louis, MO ).
Statistical analyses
Results of the chemical analyses of the soymilk were evalu-ated using ANOVA with a two factorial design and block-ing for each experimental block. Main effects of package and time were the two factors. Interaction was tested as was each individual factor using α = 0.05 (JMP 9.0 soft-ware, SAS Institute Inc, Cary, NC). Contrasts were per-formed for all bottle treatments to determine failures over time compared within treatment, against foil- wrapped and clear controls on each day, and against foil- wrapped con-trol, day 1 for each response of Rb, TBARS, and hexanal. These are described in detail in results and discussion.
Results and Discussion
Effectiveness of packaging in protecting sensory quality
Packaging treatments were tested for similarity of soymilk sensory quality ( β = 0.05, α = 0.30, p
d = 0.30) compared
to soymilk in foil- wrapped (F) packages to test the hy-pothesis that LPA packaging treatments protected the milk as well as an optimal light- protected condition. The
statistical parameters for similarity testing were set to reduce type II error. Difference testing was performed against the no LPA bottles (C) to test the hypothesis that LPA- packaging treatments provided better protection to oxidation than no LPA control. The statistical parameters ( α = 0.05, β = 0.30, and p
d = 0.30) for difference testing
were set to reduce Type I error. A reasonable estimate for proportion of discriminators is that 30% of the popu-lation would be able to discriminate oxidized fl avor and odor in soymilk; this estimate was based on previous experience in our laboratory. It also must be noted that some of the panelists consistently participated in sensory tests over the testing period where as others participated only a limited number of times.
Sensory difference testing illustrated that experimental packaging treatments protected soymilk from photooxida-tion related to the LPA design and the duration of light exposure (Table 1 ).
As expected, there were signifi cant differences between the control (F:C) packaging treatments within 20 h of light exposure (day 1; P = 0.044) and consistently (excep-tion on day 4 (92 h); P = 0.075) from day 8 (188 h). This indicates that soymilk is photo- responsive to low to moderate retail lighting conditions within relatively short storage times with a resulting impact on sensory quality. Similarity testing showed the High LPA treatment was as effective as the light- protected control (F) in protecting soymilk fl avor for at least 15 days, but was differentiated on day 22; however, this treatment package still afforded some protection as the soymilk was still differentiated from the soymilk packaged in the clear control during the latter part of the storage study. With the exception of day 4, the other two treatments (Low and Med LPA) were statistically different ( P < 0.05) by day 8 from light- protected control (F), indicating that they did not protect
Table 1 . Summary table of statistical signifi cance ( P < 0.05) for evaluation of sensory difference and sensory similarity of soymilk for each packaging treatment (Low, Med, High) 1 compared to controls (Clear: C; Foil- wrapped: F) over extended shelf- life lighted storage (1122 lux; 2.7°C) 2 .
Package treatment comparison
Day 1 Day 4 Day 8 Day 15 Day 22 Day 36
Difference test: α = 0.05, β = 0.30, p d = 0.30 C: low 0.15 0.42 0.84 0.56 0.001 * 0.000 * C: med 0.78 0.84 0.34 0.008 * 0.02 * 0.17 C: high 0.009 * 0.56 0.05 0.038 * 0.004 * 0.02 * F: C 0.04 * 0.08 0.01 * 0.0001 * 0.000 * 0.003 *
Similarity test: α = 0.30, β = 0.05, p d = 0.30 F: low 0.08 0.77 0.01 * 0.03 * 0.000 * 0.003 * F: med 0.05 0.65 0.01 * 0.56 0.000 * 0.008 * F: high 0.25 0.14 0.76 0.56 0.02 * 0.001 * Panelist/test 35 36–38 37–41 41–42 40–42 41–42
* P < 0.05. 1 Controls: F = Foil (HDPE (0% TiO 2 with foil overwrap); C = Clear (HDPE bottles with no TiO 2 or foil); Treatments: Low (0.6% TiO 2 ), Med (1.3% TiO 2 ), High (4.3% TiO 2 ). F:C provides defi nition of how controls are differentiated within testing conditions. 2 Exposure to light (1172 lux ± 439) in hours: day 1 = 20, day 4 = 92, day 8 = 188, day 15 = 356, day 22 = 524, day 36 = 860.
324 © 2015 The Authors. Food Science & Nutrition published by Wiley Periodicals, Inc.
L. M. Bianchi et al.Protecting Soymilk Flavor and Nutrients
from off- fl avors or aromas as well as full light protection and were no more effective than the light- exposed no LPA (C) packaging for the fi rst two weeks. However, soymilk packaged in Low and Med LPA treatments did not change in fl avor as extensively as product packaged in the clear control, as there were product differences at days 15 (Med) and 22 (Low). Soymilk within the clear (no LPA) packaging had signifi cant photooxidation oc-curring within these bottles that exceeded that of the product in the Low and Med LPA packaging.
The lack of sensory difference between the two controls (F:C) on day 4 appears to be an anomaly, which may be partially explained by the participants on that day of evaluation. When the portion of discriminators was as-sessed for each sensory day, the number of discriminators was lower on day 4 of sensory testing, indicating that not as many panelists were able to discriminate the oxi-dized aroma/fl avor of the soy milk. The challenge is to determine whether that is because there truly was no difference among the products or whether the portion of the population that completed the test on that day were less sensitive (than the population on day 1, for example). Although many participants routinely participated through-out the study, there was no way to get 100% compliance in participation so there were some changes in the par-ticipant pool on each date.
While changes in product quality were obvious over time, we also acknowledge that participants also learned from experience. We are 95% confi dent that the true population that can distinguish differences is lower at the beginning of the study, when sensory differences are relatively small, and increases with time as product quality changes with light exposure. We also acknowledge, however, that inad-vertent “training” of the panelists may also occur over time. As many of the panelists returned throughout the study, they may have become more adept at detecting dif-ferences. There also appears to be a pattern in which the true populations that can distinguish between the foil- wrapped and clear control treatments is higher than the other comparisons, as there would be greater difference in sensory quality between products in these two controls.
Effectiveness of packaging at protecting ribofl avin and limiting oxidative degradation
The chemical analyses of the evaluation were treated as blocks because there were differences in experimental conditions and to reduce effects associated with greater light intensity and variation in the fi rst study (block A) compared to the second study (block B). Nonetheless, each block demonstrated similar trends. Furthermore, statistical analysis of block effects indicated that each block
did not differ from one another signifi cantly (Table 2 ). Power was determined for each block and each had a power estimate of 1, demonstrating that the blocks can stand independently. This indicates that the treatment packages are effective for the lower, less variable light intensity (block B) as well as under conditions of higher light intensity and greater variability in intensity (block A). Both block A and B showed that the High LPA treat-ment provided better protection for Rb degradation and photooxidation products (TBARS, hexanal). Results shown are the average of all data from both blocks. However, because the lighting conditions of block B were dissimilar from the lighting conditions of the sensory experiment, comparisons between sensory analysis and chemical analysis were only discussed regarding block A.
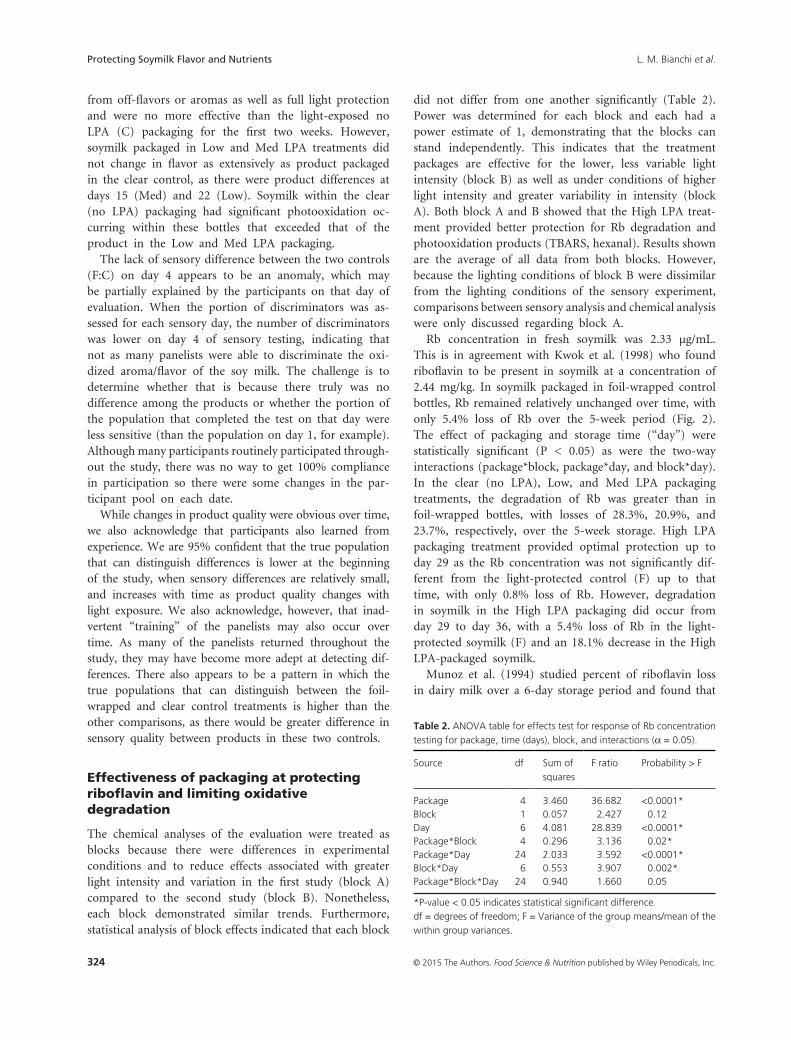
Rb concentration in fresh soymilk was 2.33 µ g/mL. This is in agreement with Kwok et al. ( 1998 ) who found ribofl avin to be present in soymilk at a concentration of 2.44 mg/kg. In soymilk packaged in foil- wrapped control bottles, Rb remained relatively unchanged over time, with only 5.4% loss of Rb over the 5- week period (Fig. 2 ). The effect of packaging and storage time (“day”) were statistically signifi cant ( P < 0.05) as were the two- way interactions (package*block, package*day, and block*day). In the clear (no LPA), Low, and Med LPA packaging treatments, the degradation of Rb was greater than in foil- wrapped bottles, with losses of 28.3%, 20.9%, and 23.7%, respectively, over the 5- week storage. High LPA packaging treatment provided optimal protection up to day 29 as the Rb concentration was not signifi cantly dif-ferent from the light- protected control (F) up to that time, with only 0.8% loss of Rb. However, degradation in soymilk in the High LPA packaging did occur from day 29 to day 36, with a 5.4% loss of Rb in the light- protected soymilk (F) and an 18.1% decrease in the High LPA- packaged soymilk.
Munoz et al. ( 1994 ) studied percent of ribofl avin loss in dairy milk over a 6- day storage period and found that
Table 2 . ANOVA table for effects test for response of Rb concentration testing for package, time (days), block, and interactions ( α = 0.05).
Source df Sum of squares
F ratio Probability > F
Package 4 3.460 36.682 <0.0001 * Block 1 0.057 2.427 0.12 Day 6 4.081 28.839 <0.0001 * Package*Block 4 0.296 3.136 0.02 * Package*Day 24 2.033 3.592 <0.0001 * Block*Day 6 0.553 3.907 0.002 * Package*Block*Day 24 0.940 1.660 0.05
* P - value < 0.05 indicates statistical signifi cant difference. df = degrees of freedom; F = Variance of the group means/mean of the within group variances.

325© 2015 The Authors. Food Science & Nutrition published by Wiley Periodicals, Inc.
Protecting Soymilk Flavor and NutrientsL. M. Bianchi et al.
ribofl avin suffered losses of 16% to 23.4% after only 6 days in dairy milk. In a previous study in our laboratory (Johnson et al. 2015 ), using the same packaging and stor-age conditions as our soymilk study, dairy milk (2% milkfat) decreased in Rb concentration by approximately 5% in foil- wrapped HDPE and 16% in high LPA pack-ages at day 8; Rb losses were approximately 45% in the clear package. Our soymilk study shows losses of ribofl avin of 14.3% in product in clear packages and only 2.4% in the high LPA packages at day 8. It should be noted that Munoz et al. ( 1994 ) stored the milk in open packages and our packages were sealed.
Statistical contrasts that compared the Rb concentration of the light- protected soymilk (F) from day 1 to the con-centration on each subsequent day of analysis and all of the other bottles on all days were completed. As expected, a contrast completed between foil- wrapped control, day 1 (F1) versus other TiO
2 - packages demonstrated signifi cant
differences. However, comparison of the Rb concentration in F1 indicated no differences compared to High LPA bottles. There were no differences in Rb concentration among any of the packaging treatments at the beginning of the study. Differences in Rb concentration in High LPA- packaged soymilk were not evident compared to F1 control until day 36.
We also measured oxidation using TBARS values as an indication of aldehydes, which are secondary products of photooxidation. This method has been studied extensively
in meat and milk oxidation and been shown to increase in concentration as photooxidation occurs. It has also been shown to correlate with changes in sensory charac-teristics of rancidity (Wang et al. 2001 ; van Aardt et al. 2005 ; Johnson et al. 2015 ). TBARS values for both block A and B of the study increased over time, as shown in Fig. 3 . As expected, foil- wrapped packages protected the soymilk optimally as TBARS was lowest in soymilk from this packaging treatment over time; signifi cant differences did not occur until day 36. Soymilk in High LPA pack-ages had low- TBARS values, mimicking TBARS of soymilk in foil- wrapped bottles up to day 29. However, between day 29 and 36, TBARS values increased in soymilk in High LPA packages, following the trend observed for Rb, and still signifi cantly lower than clear packages. Differences were noted in TBARS values at day 29 (Table 3 ). In a previous study in our laboratory on fl uid milk (Johnson et al. 2015 ), sensory detection between control and pack-aging treatments were frequently associated with TBARS levels of 1.3 mg/L in the product. TBARS values in the soymilk were 1.3 mg/L on day 15 in soymilk in Low and 0.9 mg/L in Med LPA bottles and this is the point at which sensory differences were fi rst detected. Although Rb degradation was not signifi cantly different at day 29, the secondary products of photooxidation increased in High LPA bottles compared to foil- wrapped day 1 con-centrations. Other components of soymilk, such as protein, may be undergoing oxidation (Karel et al. 1975 ), or
Figure 2 . Rb degradation in packaging treatments, Low (0.6% TiO 2 ), Med (1.3% TiO 2 ), and High (4.3% TiO 2 ), compared to foil- wrapped and clear packaging over a 36- day period. 1 Average of data in both Block A and Block B. 1 Exposure to light in hours: day 1 = 23.5, day 4 = 84, day 8 = 191, day 15 = 359, day 22 = 527, day 29 = 696, day 36 = 864.

326 © 2015 The Authors. Food Science & Nutrition published by Wiley Periodicals, Inc.
L. M. Bianchi et al.Protecting Soymilk Flavor and Nutrients
chlorophyll, another known photosensitizer, may be con-tributing to additional photooxidation pathways of com-ponents in the soymilk. Measuring chlorophyll in complex beverage systems is challenging. Mendiola et al. ( 2008 ) attempted to determine chlorophyll concentration in a mixture of orange juice and soymilk; however, they could not detect it under their specifi c HPLC conditions. Wold et al. ( 2005 ) suggests that chlorins in dairy- based cheese contributed to photooxidized off- fl avors based on fl uo-rescence spectroscopy. Intawiwat et al. ( 2010 ), using fl uo-rescence spectroscopy, identifi ed very small peaks in the 630 to 680 nm range in bovine milk as protoporphyrins and chlorophyllic compounds. We did not measure
chlorophyll in soymilk for this study but determining if or how chlorophyll contributes to off- fl avors associated with photooxidized soymilk is important for optimizing packaging for protecting soymilk fl avor and nutrient qual-ity. Additionally, soymilk contains a complex mixture of antioxidants including isofl avones (Gebhardt and Thomas 2002 ; Chiarello et al. 2006 ). These antioxidants may also play a role in the inhibition of photooxidation, which may help explain why the comparable studies of dairy milk (Johnson et al. 2015 ) and soymilk showed differences in Rb concentration over the shelf- life. Antioxidant com-pounds in soymilk, however, may also be sensitive to photooxidation after some degree of light exposure. In soymilk, how all these photosensitizers and antioxidants should best be protected from light using packaging is a relevant question. Integrating the understanding of polymer chemistry, photochemistry, oxidation chemistry, volatile chemistry, and sensory evaluation is valuable in developing packaging solutions (Fig. 4 ).
There is a dip in TBARS at day 22. This trend has been seen before (Wang et al. 2001 ). These authors studied characteristics of fl avored soymilk over time and demon-strated a decrease in TBARS values in refrigerated soymilk by day 14 and also at day 28. They hypothesize that the decrease is due to secondary photooxidation reaction prod-ucts binding to proteins in the soymilk. They further postulate that this binding may be the formation of Schiff bases due to Strecker degradation in which carbonyls formed
Figure 3 . TBARS values in packaging treatments, Low (0.6% TiO 2 ), Med (1.3% TiO 2 ), and High (4.3% TiO 2 ), compared to foil- wrapped and clear packaging over a 36- day period. 1 Average of data in both block A and B. 1 Exposure to light in hours: day 1 = 23.5, day 4 = 84, day 8 = 191, day 15 = 359, day 22 = 527, day 29 = 696, day 36 = 864
Table 3 . ANOVA table for effects test for response of TBARS values testing for package, time (days), and block and interactions ( α = 0.05).
Source df Sum of squares
F ratio Probability > F
Package 4 4.906 124.750 <0.0001 * Block 1 0.024 2.393 0.1264 Day 6 8.324 141.104 <0.0001 * Package*Block 4 0.504 12.821 <0.0001 * Package*Day 24 2.743 11.626 <0.0001 * Block*Day 6 2.076 35.194 <0.0001 * Package*Block*Day 24 0.985 4.175 <0.0001 *
* P - value < 0.05 indicates statistical signifi cant difference. df = degrees of freedom; F = Variance of the group means/mean of the within group variances.

327© 2015 The Authors. Food Science & Nutrition published by Wiley Periodicals, Inc.
Protecting Soymilk Flavor and NutrientsL. M. Bianchi et al.
from oxidation are reacting with amine groups in the protein (Damodaran 2008 ). We saw a subsequent increase in TBARS values following the decrease at day 22. Wang et al. ( 2001 ) corrected for possible sugar oxidation that may occur from the sucrose in the soymilk, whereas we did not. Perhaps the subsequent increase in TBARS values is due to oxidation of proteins (Karel et al. 1975 ).
TBARS values that coincide with the sensory changes in soymilk are lower than what have been seen in similar studies with cow milk. Our hypothesis is that there are other changes in the soymilk that are occurring that are contributing to sensory changes, which will be discussed in more detail below.
Hexanal is also a known secondary oxidative product of photooxidation. Hexanal concentration of soymilk pack-aged in different bottles is shown in Fig. 5 . As expected, the high LPA treatment protected similarly to foil- wrapped bottles up to day 29 and even at day 36 protected sig-nifi cantly better than clear bottles. There is a wider vari-ation of hexanal concentration in the packaging treatments over the study period. This may be explained in part because SPME analysis can provide a high degree of vari-ability and we did not use internal standards in our analysis to account for this. Also, hexanal is a secondary oxidative product and it may be produced in a more variable man-ner due to possible competitive pathways. Schaich ( 2012 ) suggests that there may be alternative reactions that compete
with the traditional depiction of hydrogen abstraction dur-ing the propagation stage of lipid oxidation. If other side reactions do indeed compete with hydrogen abstractions during propagation, there could be a whole myriad of products present that affect traditional measurements of oxidation, such as hexanal. These possible alternative reac-tions of photooxidation may be nonvolatile compounds that are not detected by GC- MS (Schaich 2012 ).
The ANOVA table for interactions and effects of hexanal are shown in Table 4 . These statistics are not blocked. However, once again, the results are an indication that packaging treatment and time do have an effect on hexanal concentration and that there is an interaction of packag-ing and time.
Contrasts for hexanal are similar to the results of the Rb analysis. Hexanal concentration in soymilk in different packaging treatments as early as day 1 is not signifi cantly different from one another; over time, foil- wrapped and High LPA bottles give protection for well over a 4- week period. However, by day 36, soymilk in High LPA bottles had increased hexanal production compared to foil- wrapped bottles. The clear, Low LPA, and Med LPA TiO
2 bottles
always demonstrated higher hexanal levels than the foil wrapped bottles; thus they appear to be unable to prohibit lipid photooxidation.
While the chemical analyses are all in agreement regarding how long the high LPA package can maintain protection
Figure 4 . Integration of polymer chemistry, photochemistry, volatile chemistry, and sensory analyses provides packaging design guidance.

328 © 2015 The Authors. Food Science & Nutrition published by Wiley Periodicals, Inc.
L. M. Bianchi et al.Protecting Soymilk Flavor and Nutrients
similar to the foil- wrapped packaging, the sensory testing indicates that High LPA treatment was not able to main-tain protection. Off fl avors and aromas were detected by panelists after 15 days. Possible explanations for this include the fact that human sensory is much more sensitive than chemical analysis. Perhaps human sensory testing is de-tecting compounds that we have not yet evaluated or are simply are not yet in high enough concentrations to be detected analytically. Certainly there are other secondary products of photooxidation that we have not analyzed, including 2- pentyl furan and 2- pentenyl furan, both of which are known oxidative products that contribute to soy oil reversion fl avor (Ho et al. 1978 ; Frankel 1984 ). Furthermore, single compounds in and of themselves do not necessarily cause sensory responses, so it may be that
a combination of compounds caused detection of rancidity earlier than the chemical assays.
Another explanation is that the soymilk package indicates that natural fl avoring is added. It may be that a natural fl avoring is oxidized or undergoing time degradation. Perhaps the degradation of the added natural fl avoring is what panelists were able to detect as a difference rather than an increase in oxidized off fl avors and odors at-tributed to soymilk components.
Rb decreased and TBARS values and hexanal increased in the foil- wrapped bottles over time, but never to the point of signifi cant differences from the Foil day 1 control. In the High LPA bottles, the Rb decreased and TBARS values and hexanal increased over time, such that the High LPA bottles by day 36 were signifi cantly different from initial concentrations. However, the High LPA bottles were able to protect as well as the foil wrapped bottles for at least 29 days.
High LPA packages protected soymilk from photooxida-tion as effectively as foil- wrapped bottles for at least 15 days in terms of human detection of off fl avors and aromas. This does not necessarily mean that the High LPA package is only capable of protecting for 15 days. Normally con-sumers are not handling soymilk in their homes and com-paring to an optimal product for each use. The sensory test conducted did not assess acceptability of the products over time, so signifi cant sensory differences do not neces-sarily translate to poor quality.
Figure 5 . Hexanal concentration in packaging treatments, Low (0.6% TiO 2 ), Med (1.3% TiO 2 ), and High (4.3% TiO 2 ), compared to foil- wrapped and clear packaging over a 36- day period. 1 Average of data in both block A and B. 1 Exposure to light in hours: day 1 = 23.5, day 4 = 84, day 8 = 191, day 15 = 359, day 22 = 527, day 29 = 696, day 36 = 864.
Table 4 . ANOVA table for effects tests for response of hexanal concen-tration testing for package, time (days), block, and interactions ( α = 0.05).
Source df Sum of squares
F ratio Probability > F
Package 4 0.180 40.567 <0.0001 * Day 6 0.246 36.949 <0.0001 * Package*Day 24 0.179 6.729 <0.0001 *
* P - value < 0.05 indicates statistical signifi cant difference. df = degrees of freedom; F = Variance of the group means/mean of the within group variances.

329© 2015 The Authors. Food Science & Nutrition published by Wiley Periodicals, Inc.
Protecting Soymilk Flavor and NutrientsL. M. Bianchi et al.
Conclusions
HDPE packaging with 4.3% TiO 2 is able to protect soymilk
from sensory changes and ribofl avin degradation, which are attributed to continuous light exposure for 15 and 29 days, respectively. Other compounds in addition to hexanal and TBARS should be assessed for chemical changes in soymilk when studying oxidative contributions to sensory changes.
Acknowledgments
The authors wish to thank Jeri Kostal, Georgianna Mann, and Dr. Hengjian Wang. This project was funded, in part, by DuPont (Wilmington, Delaware), by the Virginia Agricultural Experiment Station, and the Hatch Program of the National Institute of Food and Agriculture, U.S. Department of Agriculture. Publication funding was pro-vided by Virginia Tech’s Open Access Subvention Fund.
Confl ict of Interest
None declared.
References
van Aardt , M. , S. E. Duncan , J. E. Marcy , T. E. Long ,
S. F. O ’ Keefe , and S. R. Nielsen-Sims . 2005 . Effect of
antioxidant ( α - tocopherol and ascorbic acid) fortifi cation
on light- induced fl avor of milk . J. Dairy Sci. 88 : 872 – 880 .
AOAC Offi cial Method 970.65 Ribofl avin (Vitamin B2) in
Foods and Vitamin Preparations . 1998 . In: Cunniff P, ed.
Offi cial Methods of Analysis of AOAC International. 16th
Edition Volume 1. AOAC International.
Chang , H. , and S. E. Duncan . 2012 . Implications of light
energy on food quality and packaging selection . Adv.
Food Nutr. 67 : 25 – 73 .
Chiarello , M. D. , J. L. Le Guerroue , C. M. S. Chagas ,
O. L. Franco , E. Bianchini , and M. J. Joao . 2006 .
Infl uence of heat treatment and grain germination on the
isofl avone profi le of soymilk . J. Food Biochem.
30 : 234 – 247 .
Damodaran , S. 2008 . Amino acids, peptides, and proteins .
Pp. 217 – 329 in S. Damodaran , K. L. Parkin and
O. R. Fennema , eds. Fennema ’ s food chemistry , 4th edn .
CRC Press , Boca Raton, FL .
Egerton , T. A. 2014 . UV absorption – the primary process
in photocatalysis and some practical consequences .
Molecules 19 : 18192 – 18214 .
Frankel , E. N. 1984 . Lipid oxidation: mechanisms, products
and biological signifi cance . J. Am. Oil Chem. Soc.
61 : 1908 – 1917 .
Gebhardt , S. E. , and R. G. Thomas . 2002 . Nutritive Value
of Foods USDA ARS Home and Garden Bulletin
Number 72 . http://ars.usda.gov/Services/docs.
htm?docid=6282 Accessed February 4, 2014.
Ho , H. , M. S. Smagula , and S. S. Chang . 1978 . The
synthesis of 2- (1- pentenyl) furan and its relationship to
the reversion fl avor of soybean oil . J. Am. Oil Chem.
Soc. 55 : 233 – 237 .
Intawiwat , N. , M. K. Pettersen , E. O. Rukke , M. A. Meier ,
G. Vogt , A. V. Dahl , et al. 2010 . Effect of different
colored fi lters on photooxidaton in pasteurized milk .
J. Dairy Sci. 93 : 1372 – 1382 .
Johnson , D. S. , S. E. Duncan , L. M. Bianchi , H. H. Chang ,
W. N. Eigel , and S. F. O ’ Keefe . 2015 . Packaging
modifi cations for protecting fl avor of extended shelf- life
milk from light . J. Dairy Sci. . http://dx.doi.org/ 10.3168/
jds.2014- 8857 .
Karel , M. , K. Schaich , and R. B. Roy . 1975 . Interaction of
peroxidizing methyl linoleate with some proteins and
amino acids . J. Agric. Food Chem. 23 : 159 – 163 .
Kwok , K. , Y. Shiu , C. Yeung , and K. Niranjan . 1998 . Effect of
thermal processing on available lysine, thiamine and
ribofl avin content in soymilk . J. Sci. Food Agric. 77 : 473 – 478 .
Kwok , K. , H. Liang , and K. Niranjan . 2002 . Optimizing
conditions for thermal processes of soy milk . J. Agric.
Food Chem. 50 : 4834 – 4838 .
Mansson , H. L. 2008 . Fatty acids in bovine milk fat . Food
Nutr. Res. , Volume 52, 3 pages . doi: 10.3402/fnr.
v52i0.1821 .
Meilgaard , M. C. , G. V. Civille , and B. T. Carr . 2007 .
Sensory evaluation techniques . 4th edn . Taylor and
Francis Group , Boca Raton, FL .
Mendiola , J. A. , F. R. Marin , F. J. Senorans , G. Reglero ,
P. J. Martin , A. Cifeuentes , et al. 2008 . Profi ling of
different bioactive compounds in functional drinks by
high- performance liquid chromatography . J. Chromatogr.
A 1188 : 234 – 241 .
Min , D. B. , and J. M. Boff . 2002 . Chemistry and reaction
of singlet oxygen in foods . Compr. Rev. Food Sci. Food
Saf. 1 : 58 – 72 .
Munoz , A. , R. Ortiz , and M. A. Murcia . 1994 .
Determination by HPLC of changes in ribofl avin levels in
milk and nondairy imitation milk during refrigerated
storage . Food Chem. 49 : 203 – 206 .
Schaich , K. M. 2012 . Thinking outside the classical chain
reaction box of lipid oxidation . Lipid Technol. 24 : 55 – 58 .
Sisa , M. , S. L. Bonnet , D. Ferreira , and J. H. Van der
Westhuizen . 2010 . Photochemistry of fl avonoids .
Molecules 15 : 5196 – 5245 .
Soyfoods Association of North America . 2012 . Soy products
sales and trends . http://www.soyfoods.org/soy-products/
sales-and-trends . Accessed on January 13, 2014.
Spanier , A. M. , and R. D. Taylor . 1991 . A rapid, direct
chemical assay for the quantitative determination of
thiobarbituric acid reactive substances in raw, cooked, and
cooked/stored muscles foods . J. Muscle Foods 2 : 165 – 176 .

330 © 2015 The Authors. Food Science & Nutrition published by Wiley Periodicals, Inc.
L. M. Bianchi et al.Protecting Soymilk Flavor and Nutrients
Wang , B. , Y. L. Xiong , and C. Wang . 2001 . Physiochemical
and sensory characteristics of fl avored soymilk during
refrigeration storage . J. Food Qual. 24 : 513 – 526 .
Webster , J. B. , S. E. Duncan , J. E. Marcy , and
S. F. O ’ Keefe . 2009 . Controlling light oxidation
fl avor in milk by blocking ribofl avin excitation
wavelengths by interference . J. Food Sci. 74 : 340 – 398 .
Webster , J. B. , S. E. Duncan , J. E. Marcy , and
S. F. O ’ Keefe . 2011 . Effect of narrow wavelength
bands of light on the production of volatile and
aroma- active compounds in UHT milk . Int. Dairy J.
21 : 305 – 311 .
Wold , J. P. , A. Veberg , A. Nilsen , V. Iani , P. Juzenas , and
J. Moan . 2005 . The role of naturally occurring
chlorophyll and porphyrins in light- induced oxidation of
dairy products. A study based on fl uorescence
spectroscopy and sensory analysis . Int. Dairy J.
15 : 343 – 353 .