
Protecting Natural Wetlands - Davey protecting natural wetlands.pdfWetland Type.. ... Dry Wells or...
181
United States Environmental Protection Agency Office of Water (4502F) Washington, DC EPA-843-B-96-001 October 1996 Protecting Natural Wetlands A Guide to Stormwater Best Management Practices Internet Address (URL) l http://www.epa.gov Recycled/Recyclable l Printed with Vegetable Oil Based Inks on Recycled Paper (20% Postconsumer)
Transcript of Protecting Natural Wetlands - Davey protecting natural wetlands.pdfWetland Type.. ... Dry Wells or...

United StatesEnvironmental ProtectionAgency
Office of Water(4502F)Washington, DC
EPA-843-B-96-001October 1996
Protecting NaturalWetlandsA Guide to StormwaterBest Management Practices
Internet Address (URL) l http://www.epa.gov
Recycled/Recyclable l Printed with Vegetable Oil Based Inks on Recycled Paper (20% Postconsumer)

Protecting Natural Wetlands:
A Guide to StormwaterBest Management Practices
Office of Water (4502F)United States
Environmental Protection AgencyWashington, DC 20460
Contents
ContentsACKNOWLEDGEMENTS .............................................................................................. vi
1. INTRODUCTION . . . . . . . . . . . . . . . . . . . . . . . . . . . . . . . . . . . . . . . . . . . . . . . . . . . . . . . . . . . . . . . . . . . . . . . . . . . . . . . . . . . . . . . . . . . .l - l
2 . FACTORS TO CONSIDER WHEN SELECTING BMPS ........................................ 2-1Introduction .............................................................................................................................2-lWetland Factors.. ...................................................................................................................... .2-2
Wetland Type..................................................................................................................... .2-2Hydrology ...........................................................................................................................2-3Biological Functions ...........................................................................................................2-6Microbes .............................................................................................................................2-6Vegetation ...........................................................................................................................2-6Animals ...............................................................................................................................2-7Site-Specific Conditions ....................................................................................................2-7Soils .....................................................................................................................................2-7Climate ...............................................................................................................................2-9Landscape Position.............................................................................................................2-9
Descriptions of SpecificWetland Types ................................................................................2-10PocosinWetlands..............................................................................................................2-10Cienegas.. ..........................................................................................................................2-10Playa Lakes........................................................................................................................2-11Riverine or Riparian Wetland Areas of the Southwest.. ...............................................2-12Prairie Potholes .................................................................................................................2-12Sand Hills Wetlands.........................................................................................................2-13Peatlands of the North-Central States ...........................................................................2-14Bottomland Hardwoods ..................................................................................................2-14Swamps and Bogs of the Northeast ...............................................................................2-15Cypress D o m e Wetlands.. ............................................................................................... .2-16Permafrost/Tundra Wetlands.. ........................................................................................ .2-16
Stormwater Factors.. .............................................................................................................. .2-17Stormwater Quantity.. ....................................................................................................2-17Runoff and Peak Flow..................................................................................................... .2-17Rainfall ..............................................................................................................................2-19Stormwater Quality.. .......................................................................................................2-19
Overview o f BMPCapabilities ...............................................................................................2-27Assessing the Ability of a BMP to Protect a Wetland....................................................2-27Nonstructural Controls ...................................................................................................2-28Watershed Planning .........................................................................................................2-29Permitting Programs ........................................................................................................2-30Preventive Construction Techniques ..............................................................................2-30Operation and Maintenance ...........................................................................................2-30Outreach and Educational Programs ..............................................................................2-31
Structural Controls .................................................................................................................2-31BMPs in Series..................................................................................................................2-32B M P Maintenance Requirements...................................................................................2-32
Page iii

Protecting Natural Wetlands: A Guide to Stormwater Best Management Practices
Maintenance Factors ........................................................................................................2-33Implementation ...............................................................................................................2-34Development of an Effective Maintenance Plan ...........................................................2-35Components of an Effective Maintenance Plan ............................................................2-36
Funding Sources ......................................................................................................................2-37Taxes ..................................................................................................................................2-37Fees ....................................................................................................................................2-38Capacity Credits.. .............................................................................................................2-39Fee-in-Lieu.. .......................................................................................................................2-39Bonds/Debt Financing .....................................................................................................2-39State Revolving Funds .....................................................................................................2-40Grants ...............................................................................................................................2-40Leases ................................................................................................................................2-40
Matching Wetland/Stormwater Factors to BMP Design .....................................................2-41Preliminary Treatment of Stormwater.. .........................................................................2-41Matching Wetland Characteristics to BMP Design.. .....................................................2-41Hydrology .........................................................................................................................2 -41Climate .............................................................................................................................2-43Water Quality ...................................................................................................................2-44Monitoring .......................................................................................................................2-44
Summary .................................................................................................................................2-46References ................................................................................................................................2-47
3. CASE STUDIES ....................................................................................................... 3-1Introduction ..............................................................................................................................3-1Regional Case Studies ...............................................................................................................3-5
EPA Region 1 - Narrow River Special Area Management Plan, Rhode Island.. ........... .3-5EPA Region 2 - Freshwater Wetlands Protection Act, State of New Jersey ................. .3-8EPA Region 3 - Watershed Management Study, Prince William County Virginia.. .. .3-11EPA Region 4 - Hidden River Wetland Stormwater Treatment Site, Tampa,
Florida.. ..............................................................................................................3-16EPA Region 5 - Lake McCarrons Wetland Treatment System, Roseville,
Minnesota .........................................................................................................3-17- The Phalen Chain of Lakes Watershed Project, Ramsey and Washington
Counties, Minnesota .......................................................................................3-20- The Prairie Wolf Slough Project, Chicago, Illinois ..............................................3-23
EPA Region 6 - Tensas Cooperative River Basin Study, Louisiana .............................. .3-24EPA Region 7 - Multi-Species Riparian Buffer Strips, Bear Creek Watershed, Iowa.. .3-30EPA Region 8 - Watershed Approach to Municipal Stormwater Management,
Fort Collins, Colorado.. ....................................................................................3-36- Lemna Nonpoint Source Treatment System, Chatfield Reservoir, Colorado .3-41
EPA Region 9 - Lincoln-Alvarado Project, Union City, California .............................. .3-46EPA Region 10 - Riparian Area Wetland Restoration Project, Sawmill
Creek, Idaho.. ....................................................................................................3-46- Sublett Creek Restoration Project, Idaho ............................................................3-47- Bear Creek Restoration Project, Crook County, Oregon.. .................................. .3-48- Camp Creek Restoration, Crook County, Oregon ............................................. .3-50- The Chewaucan River Project, Lake County, Oregon ........................................ 3-51
4. BEST MANAGEMENT PRACTICES ...................................................................... 4-1Introduction ..............................................................................................................................4-1
Nonstructural BMPs - Pollution Prevention ....................................................................4-2
Page iv

Contents
Nonstructural BMPs - Watershed Management Plans...................................................4-8Nonstructural BMPs - Preventive Construction Techniques .......................................4-12Nonstructural BMPs - Outreach and Educational Programs .......................................4-13Nonstructural BMPs - Riparian Areas ............................................................................4-18Structural BMPs - Infiltration Basins .............................................................................4-20Structural BMPs - Infiltration Trenches.. .......................................................................4-25Structural BMPs - Sand Filters.. ......................................................................................4-29Structural BMPs - Grassed Swales ..................................................................................4-32Structural BMPs - Vegetative Filter Strips .....................................................................4-35Structural BMPs - Vegetative Natural Buffers ...............................................................4-38Structural BMPs - Open Spaces ......................................................................................4-41Structural BMPs - Extended Detention Dry Basins ......................................................4-43Structural BMPs - Wet Ponds ..........................................................................................4-47Structural BMPs - Constructed Wetlands .....................................................................4-50Structural BMPs - Porous Pavement and Concrete Grid Pavemem .............................. 4-54Structural BMPs - Oil/Grit Separators or Water Quality Inlets ...................................4-58Structural BMPs - Level Spreaders ..................................................................................4-61Structural BMPs - French Drains ....................................................................................4-63Structural BMPs - Dry Wells or Roof Downspout Systems ..........................................4-65Structural BMPs - Exfiltration Trenches .........................................................................4-68BMPs in Series - ................................................................................................................4-70
Page v

Acknowledgement
AcknowIedgements
This document was prepared by Tetra Tech, Inc., for the Wetlands Division in EPA’s Office ofWetlands, Oceans and Watersheds. Fran Eargle was the EPA project manager. She was assistedby Michael Plehn.
Tetra Tech project staff included Shannon Cauley, Jim Collins, Mary Beth Corrigan, EmilyFaalasli, Kelly Gathers, John Hochheimer, Robert Johnson, Marti Martin, Paula Proctor, DaveSkibiak, Victoria Tanga, and Sharon Thorns. Subcontractual support was provided for several ofthe case studies by Gary Bentrup of Aquatic and Wetland Consultants, Inc.
Page vi

Overview
Introduction
Section 1Introduction
lthough wetlands have long been recognized for their flood control and water qualityimprovement functions, there is an increasing concern that unrestricted use of natural
wetlands as receptacles for point and nonpoint sources of pollution, such as urbanormwater and other diffuse sources of runoff, will have an adverse effect on wetlands and
wetland biota. As a result of this concern, the U.S. Environmental Protection Agency (EPA), incooperation with the State of Florida, the Association of State Floodplain Managers, Inc., andthe Association of State Wetland Managers, sponsored a workshop in January 1992 on wet-lands and stormwater. The purpose of the workshop was to investigate various issues related tothe management of stormwater and wetlands, explore potential options, and learn from theexperiences of the participants (wetland scientists, engineers, and environmental managers)about protection of natural wetlands that receive stormwater runoff.
One of the major findings of the workshop was that wetlands in urban areas can bedramatically altered by uncontrolled runoff resulting from natural drainage or direct dischargeto wetland systems. Consequently, workshop participants included in their final recommenda-tions a need for guidelines to provide a framework for baseline protection of wetlands thatreceive stormwater runoff. This document is a first step toward providing such guidelines. The
purpose of this document is to describe the potential benefits, limitations, andappropriate application of best management practices (BMPs)1 that can be
. . . wetlands implemented to protect the functions of natural wetlands from the impacts of
in urban areasurban stormwater discharges and other diffuse sources of runoff. This docu-ment is not designed to recommend specific management practices that
can be would be applicable under all circumstances. Instead, it presents information
dramatically to assist managers in making informed decisions concerning the appropriate
altered by use of BMPs to protect existing wetland resources.
uncontrolled Land use changes within a watershed that accompany urbanization canresult in a variety of impacts to wetlands and other receiving waters. As thepercentage of impervious surface increases with the building of roads, parking
lots, and buildings, resulting runoff volume, velocity, and pollutant loads can increase dramati-cally. Increases in impervious surfaces also reduce the opportunity for the rainfall or snowmelt
1BMPs can include planning, schedules of activities, prohibitions of practices, maintenance procedures, and other managementapproaches necessary to prevent or reduce the pollution of waters of the United States.
Page l-l

Protecting Natural Wetlands: A Guide to Stormwater Best Management Practices
to infiltrate, thereby lowering groundwater levels. The impacts of these changes on wetlandscan be severe, but they will vary depending on a number of factors including the naturalhydrology of the system, the degree of change in the landscape, and the size and type ofwetland being affected.
Where natural wetlands are the ultimate receivers of stormwater, either inadvertently orby design, the potential for impacts to the wetlands (through changes in hydrology or waterquality) exists, and BMPs may be necessary to minimize these impacts. Existing wetlandcharacteristics need to be matched with site characteristics as well as stormwater characteristicswhen selecting BMPs. Management practices can be designed to preserve existing wetlands in awatershed in their current state so they can continue to provide water quality improvementand other functions and/or to restore degraded wetlands. BMPs designed to control stormwatercan result in potential impacts on downstream wetlands as well as the wetlands directlyreceiving stormwater discharge. Therefore, the impacts to both onsite and offsite wetlandsshould be considered when determining the suitability of wetlands for receiving stormwaterand when selecting and designing stormwater BMPs to protect the functions of natural wet-lands.
The ecological attributes of natural wetlands can be adversely affected as watershedsdevelop and stormwater flows increase. Wetlands tend to exist in dynamic equilibrium withsurrounding conditions when activities in a watershed remain constant. Changes in thevolume or quality of stormwater runoff resulting from changing activities in a watershed canaffect the functions and values of a natural wetland by altering the hydrologic, water quality,and sediment or soil characteristics of a wetland. Alteration of the physical and chemicalcharacteristics of a wetland can adversely affect the biological community and result innegative impacts to the ecological functions of a wetland.
As discussed in Section 2 of this document, the hydrologic conditions in a wetland affectabiotic factors such as salinity, soil oxygen availability, and nutrient availability These factorsin turn greatly influence the flora and fauna present in a wetland. Water depth and the naturalhydroperiod in a wetland also directly influence vegetative composition and density, primaryproductivity, organic accumulation, nutrient cycling and availability, and the types and densityof aquatic and terrestrial fauna in a wetland. Stormwater inflows to wetlands can directlyaffect the natural hydrology of wetlands by changing water depths and altering thehydroperiod of the systems.
The impacts of stormwater runoff on the water quality in a wetland are dependent onthe volume and composition of the stormwater. Pollutants found in runoff from urban areastend to include sediments, oxygen-demanding substances, nutrients, heavy metals, pesticides,hydrocarbons, increased temperature, and trash and debris (see Section 2). Changes in turbidity,oxygen levels, and water temperature in a wetland can have direct impacts on the flora andfauna in the wetland. In addition, the assimilation of heavy metals, pesticides, and hydrocar-bons associated with stormwater runoff by the flora and fauna in a wetland can result innegative impacts to the ecological characteristics of the wetland.
The morphological characteristics of the soils in a wetland can also be changed as a resultof introducing stormwater runoff into a wetland system. Changes in the texture of a wetlandsoil can result from changes in the amount or particle size of sediments that enter the wetlandsystem. Changes in the texture of a wetland soil can affect the hydrology of the system bychanging wetland drainage characteristics. Adsorption of pollutants in stormwater runoff bysuspended sediments can result in the incorporation of heavy metals, hydrocarbons, nutrients,
Page l-2

Introduction
and bacteria into the soil when the sediments settle out of suspension. The pollutants can laterreappear throughout the wetland ecosystem via chemical transformations, vegetative uptake, orresuspension.
The Code of Federal Regulations (CFR) provides definitions of “waters of the UnitedStates” and “wetlands” at 40 CFR 122.2 (a) through (g). Because wetlands are included underthis definition of waters of the United States, their water quality must be protected to meetthe mandate of the CWA articulated in sectionl0l(a) "to restore and maintain the chemical,physical, and biological integrity of the nation’s waters.” The protection of water quality mustaddress not only the water chemistry, but also the multiple elements, including aquatic life,wildlife, habitat, vegetation, and hydrology, that together make up aquatic systems. Therefore,relevant issues to address with respect to wetlands protection include the toxicity andbioaccumulation of pollutants, diversity and composition of aquatic species, entrapment ofpollutants in sediment, habitat loss, and hydrologic changes.
Controlling stormwater runoff into natural wetlands can benefit the ecosystem byhelping to maintain natural conditions in the system. As mentioned, changes in the hydrology,water quality, and/or soil characteristics of a wetland resulting from stormwater inflows canresult in shifts in the character of the wetland habitat, which in turn changes the overallecological characteristics of the system. Maintaining natural conditions in a wetland bycontrolling upstream stormwater runoff can mitigate the impacts of a developing watershedon the ecological attributes of a wetland by helping to maintain predevelopment hydrologic,water quality, and soil conditions.
Implementation of BMPs to protect wetlands from runoff can include watershed planningtechniques and also site-specific structural approaches. The planning approaches are generallypreferable to the structural practices. However, where planning has failed or is no longer anoption, implementation of structural controls, including retrofitting stormwater managementfacilities into BMPs, may be appropriate.
Some general guiding principles to use in protecting wetlands from stormwater andnonpoint source runoff include the following:
l Wetlands serve valuable water quality functions; however, wetlands have a limitedcapacity for handling increased flows or additional pollutants.
l The use of BMPs specifically designed to mitigate impacts to wetlands might offsetsome of the impacts of stormwater runoff by controlling increased volumes andvelocities of runoff. However, BMP discharges to wetland can adversely affect wetlandfunctions and values.
l BMPs have the potential to reduce impacts to downstream wetlands or wetlandsdirectly receiving stormwater discharges. To reduce the impacts to a receiving wetland,BMPs should be selected based on site-specific conditions, as well as regional variabilityin stormwater characteristics, climate conditions, urban development patterns, soiltypes, and wetland types.
l There might be opportunities to use degraded urban wetlands or wetlands in aridareas to provide final polishing treatment or to restore some wetland functions (e.g.,hydrology), provided there is adequate treatment of the stormwater before it isdischarged to a wetland.
l Stormwater management should be integrated within other programs at the federal,state, and local levels. Basinwide planning is needed to address stormwater manage-
Page l-3

Using his Manual
Protecting Natural Wetlands: A Guide to Stormwater Best Management Practices
ment objectives and wetland protection goals (i.e., advance planning, watershedmanagement plans, state wetlands conservation plans, or other planning tools).
l Because wetlands have a limited capacity to mitigate increased flows of stormwater andincreased pollutants, any proposal to use natural wetlands for final polishing of treatedstormwater discharges should include monitoring and maintenance as components of theplan.
l In urbanizing areas, former wetlands whose vegetation has been removed and hydrologyaltered to the extent that they no longer function as wetlands (e.g., prior convertedcroplands), can offer valuable opportunities to restore wetland functions.
l While additional research is needed, existing studies suggest that constructed wetlandscan provide better pollutant removal and more consistent, predictable filtering ofstormwater than natural wetlands. Constructed wetlands should therefore be locatedupstream of natural wetland locations, so their treated discharges can be directed tonatural wetlands or other waters.
l Multiple BMPs in series, or the ‘treatment train” approach, whereby a series of BMPsprovide alternative nonstructural approaches (e.g., watershed planning) or variousstructural control techniques (i.e., grassed swales or longer flow paths to settle solids,regulate flow, and reduce pollutants), may provide greater protection for naturalwetlands than individual BMPs.
Although a number of manuals describe best management practices to be used to addressstormwater runoff, this manual is a first attempt at addressing the specific water qualityconcerns related to wetlands. It is intended for use by anyone addressing potential impacts towetlands from stormwater runoff, and it presents a wide range of planning approaches as wellas specific BMPs that can be employed in a variety of situations. Regardless of what type ofapproach is taken, and at what level, this manual should be used as a starting point in a processto identify and evaluate appropriate BMPs to protect wetland resources (see Figure l-l).
The information in this document is presented in four sections. Section 2 describes thefactors (wetland and stormwater characteristics) that should be considered when developingBMPs to protect wetlands and their natural functions from the potential impacts of stormwaterdischarges and other diffuse sources of runoff. Wetland factors to consider include wetland type,
hydrology, climate, and site-specific conditions. Stormwater factors to
...this manual is aconsider include the quantity and quality of runoff and the frequency ofrunoff events.
starting pointto identify
Although they are described separately, the wetland factors and
appropriate BMPs tostormwater factors are closely related. For example, climate influences thefrequency and intensity of storm events; the wetland type affects the
protect wetland capacity of the wetland to handle a given quantity or quality of stormwater
resources. runoff; and the functional attributes of a particular wetland can be severelyaffected by the introduction of even small amounts of certain contaminants.When deciding what BMPs may be appropriate for a particular situation,
both sets of variables-wetland factors and stormwater factors-should be considered individuallyand in combination. Helpful tables that detail these factors (for example, wetland types or typical
Page l-4

Introduction
I Identify/Evaluate desirednatural wetland functions
I Identify potential threatsto wetland functions
ldentlfy watershed managementmeasures to prevent uncontrolled
runoff to wetlands.Select BMPs to address potential
threats to wetland functions
No Are BMPs effective?Are wetland functions
See discussion of wetland factorsand types (consider wetlandfunctions, soils, climate,hydrology, etc.), pp. 2-2 to 2-17.
See discussion of stormwaterfactors (land use, climate, etc.)pp. 2-17 to 2-26.
See benefits to wetland functions(Table 2-7) p. 2-42.
See description of BMPs andBMPs in series in Section 4.Consider potential impacts towetland functions, and capitaland maintenance costs.
See Case Studies (Section 3) andBMP Fact Sheets (Section 4) forinformation on implementationof BMPs.
See page 244 for overview ofmonitoring.
Figure l-l. How to use this manual.
Page l-5

Protecting Natural Wetlands: A Guide to Stormwater Best Management Practices
pollutants found in stormwater runoff) are provided in Section 2 to assist managers in consideringthe factors in depth. A third set of factors-the characteristics of potential BMPs-should alsobe considered in combination with the wetland and stormwater factors. An overview of BMPsfor controlling the effects of stormwater on the functions of natural wetlands is provided inSection 2; details are provided in the BMP fact sheets in Section 4.
Section 3 of this document presents several case studies that describe examples of situa-tions where BMPs were used to protect natural wetland functions from the impacts of runoffand to restore the functional quality of degraded wetlands. Case studies were selected fromboth arid and nonarid climates, as well as from temperate and colder climates. Some of the casestudies include an in-depth overview of a particular experience using BMPs to protect wetlands,whereas others present only anecdotal information. Since states have only recently hadstormwater management programs in place, or will begin implementation of such programswithin the next decade, only a limited number of well-documented case studies show theeffectiveness of stormwater management BMPs and natural wetlands.
Section 4 presents fact sheets describing specific BMPs and their potential relationship tonatural wetlands. For each BMP, a fact sheet is provided with the following information:definition and purpose of the BMP, its scope and applicability, design criteria considerations,potential effects on wetlands (i.e., benefits and limitation for use), cost-effectiveness (whereapplicable), maintenance, and sources of additional information. BMPs included in this docu-ment represent examples of some of the more commonly used practices. Numerous BMPmanuals from state and local governments throughout the country were used to gather theinformation presented in the fact sheets.
Page 1-6

Factors to Consider When Selecting BMPs
Section 2
Factors to ConsiderWhen Selecting BMPs
Introduction
est management practices (BMPs)-both structural and nonstructural1- are used toprotect natural wetlands from the impacts of stormwater and other diffuse or nonpointsources of runoff,2 including changes in wetland hydrology or water quality When natural
wetlands are the final discharge point, BMPs may be used to provide preliminary treatmentof runoff that might impact the receiving natural wetland. Natural wetlands, usually by
virtue of their position in the landscape, directly receive stormwater runoff. In this case, BMPsshould be used to control the runoff-outside the wetland-to maintain the wetland’s existinghydrology and functions. BMPs should be selected after carefully considering the combination ofvariables that influence a potentially impacted wetland and the characteristics of the runoffentering that particular wetland, as well as the capabilities and applicability of the potentialBMPs.
Wetland factors to consider include wetland type, hydrology, biological functions, and site-specific conditions. A consideration of stormwater factors should consist of an evaluation of thegeographical area producing runoff, including existing and future impervious surfaces andstormwater infrastructure, quantity and quality of runoff, and the frequency of runoff events.Factors like zoning and changes in planned land use should also be considered to evaluate thepotential impacts from future development on the quantity and quality of stormwater and theability of existing treatment systems to control the runoff adequately. BMP capabilities includefactors such as flood storage; infiltration; and sediment, nutrient, and pollutant removal.
By evaluating the wetland characteristics in concert with the stormwater characteristics,and applying the appropriate BMPs described in Section 4, the effects on the wetland system canbe minimized. For example, if it is anticipated that a certain type of development will causehigher sediment loading to receiving waters and the wetland on the site is sensitive to increasedsedimentation, BMPs that control sedimentation should be employed to minimize the effects onthe wetland.
Wetland factors, stormwater factors, and BMP capabilities are described in this section. Thisinformation can be used when evaluating the BMPs presented in Section 4.
1Structural best management practices are those practices which entail construction of human-made structures (USEPA,1992b). Examples of structural BMPs include infiltration basins, sand filters, vegetated filter strips, and constructed wetlands.Nonstructural best management practices are regularly scheduled activities or programmatic actions (USEPA, 1992b). Examplesof nonstructural BMPs include pollution prevention, watershed planning, vegetated buffer areas, street sweeping, inspections, andimproved materials-handling practices.
2For the purpose of this document, the term runoff should be interpreted to include stormwater discharges and nonpointsources of pollution, including urban sources. These other sources of nonpoint pollution can include agriculture, forestry, marinas,and hydromodification activities. The reader should refer to Guidance Specifying Management Measures for Sources of NonpointPollution in Coastal Waters (USEPA, 1993) for additional information on all sources of nonpoint pollution.
Page 2-l

Wetland Factors
Protecting Natural Wetlands: A Guide to Stormwater Best Management Practices
Wetlands are integral parts of a watershed; their position in the landscape is influenced byand influences the characteristics of a watershed. Wetlands can function as nutrient sinks,temporary water storage areas, groundwater recharge areas, and critical wildlife habitat. Naturaland anthropogenic (human-induced) activities within a watershed influence the functions ofnatural wetlands. When these activities remain relatively constant, the functions of naturalwetlands tend to exist in dynamic equilibrium with the surrounding conditions. However,changes in the established combination of natural and anthropogenic activities within awatershed can result in dramatic changes in the functions of natural wetlands.
The physical, chemical, and biological characteristics of natural wetlands combine todetermine unique wetland types. Differences in these characteristics range from subtle to obviousamong different wetland types depending on many factors associated with wetlands that include,but are not limited to, hydrology, biological functions, site-specific factors, the climate andgeology of the region, landscape position, and soils. These factors are not independent, but form acomplex interrelationship to make each wetland type unique.
An assessment of the current status of these factors for a particular wetland is important tounderstand the effects of certain factors, such as increased or decreased quantities of stormwaterrunoff, on an individual wetland. Understanding the interactions of a particular wetland with theother watershed features provides a broader and more comprehensive perspective of impacts ofvarious activities within the wetland and the watershed as a whole. For example, by changing thehydrology of a wetland, the water retention and sediment attenuation functions can be lost,resulting in downstream hydrological and water quality impacts; or vegetative species andcomposition within and surrounding a wetland might change, resulting in habitat qualitychanges.
Some of the factors affecting wetland type are influenced more by stormwater runoff thanothers. For the purpose of this document, hydrology, biological functions, soils, and site-specificconditions are considered to be factors that can be significantly affected by stormwater runoff.Other factors, such as climate and landscape position (which might be linked to hydrology), are afunction of the location of a particular wetland. They are not affected by stormwater runoff, butthey contribute significantly to the determination of wetland type.
Selection and design of stormwater BMPs should consider the wetland type, hydrology,biological functions, site-specific features, and other wetland factors, as well as the relationshipof the wetland to other watershed features, including climate. Additionally, the impacts of aparticular BMP need to be considered in the context of both the individual wetland and theentire watershed to determine potential impacts on other resources.
Wetland Type
The effects of stormwater on a particular wetland depend, in part, on the type of wetland inquestion. Wetland type can be defined as the combination of attributes (e.g., physical, chemical,and biological) that make a particular wetland different from other wetlands. A wide range ofwetland types, which are the result of the cumulative effect of many environmental variables,exist in the United States. In an effort to bring precision and standardization to the classificationof wetland types, Cowardin and others (1979) developed Classification of Wetlands and DeepwaterHabitats of the United States for use in the National Wetlands Inventory Their classification
Page 2-2

Factors to Consider When Selecting BMPs
system breaks wetlands into systems, subsystems, and classes analogous to plant or animaltaxonomic classifications.
The classification system developed by Cowardin and others (1979) is very comprehensive.However, because it contains too much detail for this document, a simpler classification system,proposed by Mitsch and Gosselink (1993), is used here. 3 In their classification system, Mitschand Gosselink (1993) divided wetlands into two major groups--coastal and inland-as shown inTable 2-1. Some wetlands in the United States are not adequately described by the Mitsch andGosselink (1993) classification system, but the system is intended as only a preliminary guide toevaluate wetlands.
Hydrology
Hydrology is described by Mitsch and Gosselink (1986) as probably the most important factor inthe establishment and maintenance of specific types of wetlands and wetland processes. Precipitation,surface water inflow and outflow, groundwater exchange, and evapotranspiration are the majorfactors influencing the hydrology of most wetlands. Figure 2-l shows a simplified diagram of awetland hydrologic cycle.
Mitsch and Gosselink (1986) concluded that hydrologic conditions are extremely important for themaintenance of a wetland’s structure and function, although simple cause-and-effect relationships aredifficult to establish. Hydrologic conditions affect many abiotic factors, including salinity, soiloxygen levels (which can cause anoxia), and nutrient availability. These abiotic factors, in turn,determine the flora and fauna that develop in a wetland. Finally, biotic components are active inaltering the wetland hydrology completing the cycle.
3 The reader should refer to Cowardin and others (1979) if a more detailed classification system is needed
Page 2-3

Protecting Natural Wetlands: A Guide to Stormwater Best Management Practices
Figure 2-1. Wetland Hydrological Cycle.
Some wetlands remain permanently inundated or saturated, some are wet for only a shortperiod during the year; and others may remain dry over periods of several years. The periods ofsaturation or dryout in wetlands have strong implications for the characteristic structures thatdevelop in wetlands (Kadlec and Knight, 1996). Each wetland type exhibits a unique hydroperiodthat is fundamental in the stability of a wetland system. Hydroperiod is defined as the periodic orregular occurrence of flooding and/or saturated soil conditions (Marble, 1992). Mitsch andGosselink (1986) suggested characterizing hydroperiod as the ratio of flood duration divided byflood frequency over a given period of time. Cowardin and others (1979) provided generaldescriptions of hydroperiod for both tidal and nontidal wetland systems (listed in Table 2-2). Thehydroperiod for a particular wetland is a function of the water budget (i.e., inflow and outflowwater balance) and storage capacity, which is affected by the surface contours of the landscapeand subsurface soil, geology, and groundwater conditions (Mitsch and Gosselink, 1986).
Since wetlands typically represent a transition between terrestrial and open-waterecosystems, the effects of changed hydrology are extremely variable. Several principles outliningthe importance of hydrology to wetlands have been described by Mitsch and Gosselink (1986)and include the following:
1. Hydrology leads to a unique vegetation composition, but can limit or enhance speciesrichness. For example, different species of vegetation respond differently to floodingand large trees tolerate flooding better than seedlings.
2. Primary productivity in wetlands is enhanced by flowing conditions and a pulsinghydroperiod. Primary productivity is often depressed by stagnant conditions.
Page 2-4

Table 2-2. Definitions of Wetland Hydroperiods
Hydroperiod Definition
Factors to Consider When Selecting BMPs
Tidal wetlands
Subtidal
Irregularly Exposed
Regularly Flooded
Irregularly Flooded
Nontidal Wetlands
Permanently Flooded
lntermittently Exposed
Semipermanently Flooded
Seasonally Flooded
Saturated
Temporarily Flooded
Intermittently Flooded
Artificially Flooded
The substrate is permanently flooded with tidal water.
The land surface is exposed by tides less often than dally.
Tidal water alternately floods and exposes the land surface atleast once dally.
Tidal water floods the land surface less often than dally.
Water covers the land surface throughout the year in all years.Vegetation is composed of obligate hydrophytes.
Surface water is present throughout the year except in yearsof extreme drought.
Surface water persists throughout the growing season in mostyears. When surface water is absent, the water table is usuallyat or very near the land surface.
Surface water is present for extended periods, especially earlyin the growing season, but is absent by the end of the seasonin most years. When surface water is absent, the water table isoften near the land surface.
The substrate is saturated to the surface for extended periodsduring the growing season, but surface water is seldompresent.
Surface water Is present for brief periods during the growingseason, but the water table usually lies well below the soilsurface for most of the season. Plants that grow both inuplands and wetlands are characteristic of the temporarllyflooded regime.
The substrate is usually exposed, but surface water is presentfor variable periods without detectable seasonal periodicity.Weeks, months, or even years may intervene between periodsof inundation. The dominant plant communities under thisregime may change as soil moisture conditions change.
The amount and duration of flooding are controlled by meansof pumps or siphons in combination with dikes or dams.Vegetation present cannot be considered a reliable indicatorof water regime.
Source: Adapted from Mitsch and Gosselink, 4993; Cowardin et al., 1979.
3. Organic accumulation in wetlands is controlled by hydrology through its influence onprimary productivity, decomposition, and export of particulate organic matter.
4. Nutrient cycling and nutrient availability are both significantly influenced byhydrologic conditions.
Page 2-5

biological Functions
Microbes
Vegetation
Protecting Natural Wetlands: A Guide to Stormwater Best Management Practices
Changes in the natural hydrology of a wetland can therefore affect many of the functions ofa wetland. When volumes of stormwater runoff to a wetland increase, or when a wetland isimpounded to treat stormwater runoff, changes to the biotic and abiotic characteristics can occur.For example, hydrologic disturbance of a wetland can cause a shift from a function as a sink fornutrients and metals toward a function as a source of these materials, thereby affecting otherfunctions within the wetland and in downstream communities (Brinson, 1988).
Because wetlands are transition zones between uplands and aquatic systems, they can serveas exporters of organic materials and sinks for inorganic matter (Mitsch and Gosselink, 1993).Because of this transitional position in the landscape, some wetlands have high biodiversity,whereas others are very productive in terms of biomass. Wetlands typically provide habitat to avariety of microbial and plant species due to presence of ample water. The diversity of physicaland chemical interactions that occur in wetlands results in a continuum of flora and fauna fromthe smallest of microbes to large trees. Interactions resulting from the biological diversity inwetlands results in greater diversity, more complete utilization of energy inflows, and ultimatelythe emergent properties of the wetland ecosystem (Kadlec and Knight, 1996). The biologicalcommunities that become established in wetlands are typically made up of a rich mixture ofmicrobes, plants, and animals.
The established biological community in a particular wetland exists in a state of dynamicequilibrium with the physical and chemical properties associated with that wetland. Actions thatupset the established balance found in the biological community, such as changes in thehydroperiod, volume of runoff, or water quality, lead to significant changes in the functions of awetland. For example, increasing the volume of stormwater runoff that enters a wetland canstress indigenous vegetation and allow more flood-tolerant species of vegetation (e.g., Typha) totake over a wetland.
In wetlands, microbes are major transformers of organic and inorganic materials. Thepopulation of microbes in a wetland varies according to many factors, but usually it is composedof aerobic species at the surface of the substrate and shifts to anaerobic species as the depthincreases. As facilitators for the many biochemical reactions that occur in wetlands, wetlandmicrobes have adapted to a wide range of substrate conditions. Aerobic bacteria colonize areasaround plant roots to take advantage of the oxygen-rich rhizosphere surrounding the roots ofwetlands vegetation. Other anaerobic microbes play important roles in the chemical reactionsthat produce methane, nitrogen gas, and hydrogen sulfide. Mychorrhizial fungi facilitate nutrientuptake, reduce stress, enhance salt tolerance, and increase the initial growth and survival ofwetland plants (USDA-SCS, 1992).
Wetland vegetation comes in many forms, including floating, rooted, emergent,submergent, herbaceous, and woody. Wetland plants transport oxygen from their leaves to therhizosphere surrounding their roots. This soil oxygenation process is important for many of the
Page 2-6
Animals
Site-Specific Conditions
Factors to Consider When Selecting BMPs
microbial reactions that take place in wetlands. Other functions of wetland vegetation includetrapping sediment and removing nutrients or other pollutants from the water column andsubstrate (USDA-SCS, 1992). Wetland plants provide habitat for a variety of fish and wildlife. Allspecies of fish and wildlife need habitat-food, water, and cover-for survival. The habitat valueof a particular wetland site depends on the quantity, quality, diversity, and seasonality of the food,water, and cover that it offers (PSWOA, 1990).
Wetlands support many different types of animals, including invertebrates, fish,amphibians, reptiles, birds, and mammals. Because of the transitional nature of wetlands,both aquatic and terrestrial animals live in wetlands. Wetlands provide food sources,protection from weather and predators, resting sites, reproductive sites, and molting groundsfor wildlife (Cooper, 1989). Wetlands provide this habitat function for many species of fishand wildlife, including some that are threatened or endangered. Many species of animalsthat are not typically considered to be wetland species spend a part of their life-cycle orfulfill daily requirements in wetlands. Other species like the beaver and muskrat can alterwetlands as a result of their activities (USDA-SCS, 1992).
Although wetlands in rural or undeveloped areas might be relatively pristine, they can beaffected by agricultural activities, particularly sedimentation and drainage. Wetlands in previouslydeveloped urban areas can be affected by changes in surface water and groundwater hydrology orwater quality. In drier areas, some existing urban wetlands are hydrologically dependent ontreated wastewater inputs, which are subject to variable water use practices. Wetland plantcommunities can be altered as a result of hydrologic or physical disturbances. Exotic or invasiveplant species, which become established more easily in disturbed ecosystems, might be present,affecting the existing plant species and habitat functions of the wetland. Also, natural bufferareas surrounding urban wetlands might have been eliminated, lowering the diversity of thewetland system and reducing areas for wildlife refuge.
Wetlands in temperate climates undergo seasonal variation in biological activity, which is amajor factor in many wetland processes involving the retention or transformation of pollutants.Some wetland types can serve as a sink for nutrients during the growing season and as a source atother times of the year (Mitsch and Gosselink, 1986), making consideration of the seasonaldistribution of runoff important.
S o i l s
Soils and their characteristic properties develop as the result of interactions between parentmaterial, climate, plant and animal life, relief, and time. The degree of influence of each of the fivefactors generally varies from place to place. In a given location one factor can dominate in theformation of a soil and determine most of its properties (Smith and Matthews, 1975).
Soils that form in a wetland environment are classified as hydric and have morphologicalcharacteristics that result under wet conditions. Hydric soils are defined by the Natural Resources
Page 2-7

Protecting Natural Wetlands: A Guide to Stormwater Best Management Practices
Conservation Service (NRCS) as soils that are saturated, flooded, or ponded long enough during thegrowing season to develop anaerobic conditions in their upper part. Hydric soils are classified aseither organic or mineral soils based on the percentage of organic material in their upper part (seeTable 2-3). General differences in physicochemical characteristics between organic and mineral soilsinclude percentage of organic content, pH, bulk density, porosity, hydraulic conductivity, waterholding capacity nutrient availability, and cation exchange capacity (see Table 2-3).
Changes in the characteristics of a soil during its formation result from processes that includeadditions, removals, transfers, and transformations (Hall and Matthews, 1974). Modifying existingprocesses by placing BMPs adjacent to or upstream of a wetland can result in changes in wetland soilcharacteristics. For example, changes in the textural characteristics of a wetland soil can result fromchanges in the amount, type, and/or particle size of sediments that enter a wetland. The modificationof soil textural characteristics can result in changes in the drainage characteristics of the wetland. Forexample, the percentage of coarse-grained sediments deposited in a wetland could be reduced by astormwater BMP, resulting in a reduction of the soil’s permeability over time. The reducedpermeability could result in a reduction in the soil’s ability to infiltrate water, therebychanging the character of the wetland.
The placement of BMPs adjacent to wetlands can result in changes to the chemicalcharacteristics of the wetland soil if stormwater is not adequately treated prior to itsdischarge to the wetland. Suspended organic and inorganic particles tend to adsorb pollutants,such as heavy metals, nutrients, hydrocarbons, and bacteria (Stockdale, 1991). If the suspendedparticles are deposited in the wetland, the pollutants can become incorporated into the soils.Over a period of time pollutants that have accumulated in the soil can appear throughout thewetland environment via chemical transformations, vegetative uptake, or resuspension.
Additional changes to the chemical and morphological characteristics of a wetland soil canoccur as the result of alterations to the natural factors affecting the soil’s development. Changesto the natural characteristics (e.g., hydrology or vegetation) of a wetland can result in changes to
Table 2-3. Comparison of Mineral and Organicfoils in Wetlands
Parameter Mineral Soil organic soil
Organic content Less than 20%-35% Greater than 20%-35%
pH Usually circumneutral Acid
Bulk Density High LOW
Porosity LOW (45%-55%) High (80%)
Hydraulic Conductivity High (except for clays) Low to high
Water Holding Capacity LOW High
Nutrient Availability Generally high Generally low
Cation Exchange Capacity low, dominated by major cations High, dominated by hydrogenion
Typical Wetland Type Riparian forest, some marshes Northern peatland
Source: Adapted from Mitsch and Gosselink, 1993.
Page 2-8

Climate
Factors to Consider When Selecting BMPs
the chemical transformations and nutrient cycling in a wetland soil. Redox potential, cationexchange capacity, pH, porosity, hydraulic conductivity, and the organic content of a soil canchange as a result of altering the natural conditions within, or affecting, a wetland. Conversely,changes in the chemical and morphological characteristics of the soil in a wetland affect theoverall characteristics of the existing wetland habitat.
Climate is defined as the average state of the atmosphere during a period of time-days,weeks, years, etc. (Rasmusson et al., 1993). Solar radiation is the primary external source ofenergy However, other external natural events (e.g., volcanic eruptions) and human-inducedchanges (e.g., land surface changes) also can affect climate (Rasmusson et al., 1993). Naturallyoccurring quantities and variations in rainfall and runoff are essential to the maintenance ofmany wetland types. Both the amount and seasonal distribution of rainfall and resulting runoffcan play a role in determining the species composition, soil characteristics, and ecological func-tioning of inland wetlands. Factors such as precipitation patterns, including the frequency,intensity, and duration of storm events, determine the quantity and timing of runoff (Hammer,1992). Other climatic factors, such as temperature, winds, relative humidity, and incident solarradiation, also affect wetlands.
Because hydrology is a particularly important factor, wetlands in arid and semiarid climatesrequire water source investigations before a stormwater pretreatment strategy can be chosen.Whether wetlands in arid or semiarid climatic regions receive water from groundwater sources orfrom surface flows, maintaining adequate and natural inundation periods is crucial to theirsurvival. Despite the significant reduction of hydrologic flows to wetlands by agriculturaldiversions, climate determines the fate of most aquatic habitats in arid and semiarid regions(Hutchinson et al., 1992). In arid and semiarid regions, precipitation should be considered avariable rather than a constant when planning surface water controls. Arid and semi-arid climatesare largely responsible for the three distinct types of wetlands found in the American Southwest:ciengas, playas, and riverine wetlands.
Landscape Position
The location of a wetland in the landscape plays a role in the natural hydroperiod of thewetland, its retention of pollutants, and the effects of increased stormwater inputs. Brinson(1988) defined three major geomorphic wetland types based on location in the watershed:
l Basin -Wetlands typically in headwater regions that capture drainage from small areas andmay receive precipitation as the primary source of water. Basins are characterized byfluctuations of the water table, a long hydroperiod, low hydrologic energy, and low nutrientlevels. Plant communities usually consist of concentric zones of similar vegetation.
Riverine -Wetlands that occur throughout the landscape and are primarily influenced bywater flowing downstream. Riverine wetlands typically have short hydroperiods, highhydrologic energy, and high nutrient levels. Plant communities are usually arrangedparallel to the direction of flow.
l Fringe -Wetlands that are usually located at the base of a drainage basin and adjacent to alarge body of water, including estuarine areas. They generally have a long hydroperiod,
Page 2-9
Cienegas
Protecting Natural Wetlands: A Guide to Stormwater Best Management Practices
high hydrologic energy, and variable nutrient loads. Fringe wetlands are often influencedby frequent flushing by bidirectional flow. Zonation of vegetation is usually perpen-dicular to the direction of water flow.
Descriptions Of Specific Watland Types
Pocosin Wetlands
Pocosin wetlands occur along the Atlantic seaboard’s lower coastal plain, from southernVirginia to northern Florida. Approximately 70 percent of pocosins are located in North Carolina.Pocosin, an Algonquin Indian word, literally means “swamp on a hill,” which is an accuratedescription because pocosin wetlands are found in ridge and swale topography, as well as in flatareas of the lower coastal plain, in depressions of the Carolina Bays, in areas of springs and seepsin the upper coastal plain, and in the floodplains of streams. Pocosins contain dense evergreenplant communities, consisting of small broad-leaved evergreen trees (pondpine) and scrub shrubs(fetterbush and inkberry), which can occur either on highly organic soils, such as mucks or peats,or on very poorly drained mineral soils. Locally, there is wide species diversity. The soils ofpocosins are acidic and low in nutrients and minerals. (Phosphorus is the limiting agent due tophosphorus-reducing microbes.) Pocosins occur in many different shapes and can vary tremen-dously in size from less than an acre to several thousand acres. These wetlands are important tobirds and animals such as migratory waterfowl, herons, egrets, and muskrats.
Pocosin wetlands provide very favorable groundwater storage due to the differingpermeability properties of their organic layers. Macropores in the upper layers make the soilvery permeable, allowing for high retention of rainfall. Conversely, the reduced permeabilityof the lower layers, due to smaller pore spaces, prohibits the stored rainwater from drainingvery quickly. Because the base of a pocosin is not very permeable, the groundwater beneaththe pocosin, which has a high mineral content, does not come into contact with the low-mineral-content water and soil of the pocosin. Water movement occurs as seepage at thepocosin’s margins that flows to streams, or as direct flow to salt marshes in estuarine areas.These two principal properties of pocosins - attenuation of flow and continuous release of freshgroundwater- are essential to the estuarine ecology of the southeast Atlantic coast. These twoproperties also make pocosins particularly vulnerable to the adverse effects of stormwaterdischarges in the many areas of the lower coastal plain that are experiencing development.
Cienega is a term that usually applies to mid-elevation (1,008 to 2,000 m), or (3,281 to 6,562 ft)wetlands characterized by permanently saturated, highly organic, reducing soils (Hendrickson andMinckley, 1984). These warm, temperate habitats were most often termed cienegas by Hispanic andlater explorers and settlers, and appear to be distinctive habitats (Hendrickson and Minckley 1984).The word cienega comes from the Spanish cien aqua, meaning “hundred waters.” Cienegas areperpetuated by permanent, scarcely fluctuating sources of water, and are rarely subject to harshwinter conditions.
At mid-elevations of in semidesert grassland, cienegas are usually associated with perennialsprings and headwater streams. They are near enough to headwaters that the probability ofscouring from flood is minimal. Often, many meters of organic sediments have been deposited.
Page 2-10

Playa Lakes
Factors to Consider When Selecting BMPs
These wetlands are dominated by semiaquatic sedges, rushes, and grasses. Trees are scarce andimmediate surroundings are saline as a result of capillarity and evapotranspiration (Hendricksonand Minckley, 1984). Historically grazed, more than 95 percent of the original cienegas have beenlost (Hendrickson and Minckley, 1934). Many have been drained for development or destroyedby upstream pumping of the groundwater sources.
The term playas generally refers to areas occupied by temporary shallow lakes that haveinternal drainage, usually in arid to semi-arid regions. They are not part of an integrated surfacedrainage system, but are related to geologic fracture areas. Playas are shallow (typically less than 1lm (3.28 ft) deep), circular basins averaging 15.5 acres (6.3 hectares) in surface area (Haukos andSmith, 1992). Playa floors are plate-like with relatively constant water depth throughout much ofthe basin. Because very few playas are directly associated with groundwater, playas can usually fillonly from precipitation and irrigation runoff. Most playas are dry during one or more periods ofeach year, usually late winter, early spring, and late summer. Several wet-dry cycles during oneyear are not uncommon for a playa and depend on precipitation and irrigation patterns (Haukosand Smith, 1992). Soils of the playa are predominantly clays, differing from the loams and sandyloams of the surrounding uplands (Haukos and Smith, 1992). The climate of the region containingmost of the playa lakes in the United States (southern Great Plains) is semi-arid in the west towarm temperate in the east. Vegetation in dry playas resembles upland vegetation and includesspecies such as summer cypress, ragweed, and various prairie grasses. Moist and flooded conditionsin playas favor vegetation representative of other North American wetlands: barnyard grass,smartweed, bulrush, cattail, spikerush, arrowhead, toothcup, and dock (Haukos and Smith, 1992).
Although playas occur throughout the West, the following discussion focuses on a group ofplayas occurring in the High Plains of eastern New Mexico and northern Texas, and in an areasouth of the Arkansas River and north of the Canadian River. The playas in Texas are small marsh-like basins, 5 to 15 acres (2 to 6 hectares) in size, and are typically underlain by clay or fine sandyloam soils that are hydric. These shallow, circular lakes have individual watersheds of about 80 to120 acres; the size of the watershed determines the size of the playa. The topography is flat togently rolling, containing approximately 20,000 to 30,000 separate playa watersheds. The “wet”period of playas is seasonal, and their size and wet period depend on the intensity, duration, andfrequency of precipitation and infiltration. Vegetation is diverse because it is influenced byvarying salinity and depth and duration of saturated conditions. Tpically, playas demonstrate apattern of concentric plant zonation of submerged and emergent aquatic species, such aspondweeds, arrowheads, and cattails, and lowland plants in wet meadows that surround the lakes.Many of these lakes are important migratory bird and songbird habitat.
Precipitation, ranging from 22 to 12 inches from east to west, is the major input since thereare no permanent rivers and streams in the area. Excessive rainfall produces surface runoff in latespring and early fall. Other inputs, such as groundwater from deep aquifers and irrigation water,contribute to the permanence of standing water. Such groundwater input is uncommon becausemost playas are situated above the regional groundwater table. Because there is no surface wateroutflow, playas lose their water by evaporation, seepage, and irrigation use. However, anabundance of inflow of surface runoff in large enough quantities can result in some recharge tothe High Plains aquifer. This occurs at the margins of the impermeable playas where morepermeable sediments are found.
Page 2-11

Protecting Natural Wetlands: A Guide to Stormwater Best Management Practices
Since many of the playa watersheds function as cropland and rangeland, their vegetationserves an important purpose, helping to reduce excess nutrients from runoff and therebyimproving the quality of surface water. In an area where water is not abundant, any addition tothe groundwater will have economic significance, whether it be from irrigation water or recharge.Where playa watersheds receive stormwater discharges, the potential exists for adverse impacts tothe playa itself or for degradation of the quality of the local and/or regional groundwaterresources.
Riverina or Riparian Wetland Areas of the Southwest
Riverine or riparian wetlands exist along the margins of rivers, behind natural levees, inoxbows and floodplains. Riverine wetlands in arid climates are limited shoreward by desert andriverward by water depth and scouring. These wetlands are transitory They develop rapidly onlyto be removed by channel-straightening floods, or proceed toward an upland community afterdrying. In the American Southwest, riverine marshes are located in broad alluvial valleys distantlybounded by mountains. Like cienegas, riparian lands have been impacted by depletion of baseflowsources or by direct diversions upstream (Hawkins, 1993). A number of riparian wetlands exist,but some rely on other water sources such as treated upstream wastewater. The quality of thewastewater discharging to these wetlands plays a more important role in maintaining wetlandfunctions than do the effects of stormwater runoff.
Prairie Potholes
The prairie pothole region of the northern United States consists of North Dakota, westernMinnesota, and northeastern South Dakota. This region also extends into southern Canada.Pothole is defined as a surface depression occurring in glacial sediments, containing water fromprecipitation, surface runoff, and groundwater. Vegetation characteristics include cattails andvarious species of grasses, sedges, and rushes such as bulrushes. More ephemeral potholes arecharacterized by meadow grasses and sedges. Prairie potholes are shallow wetlands in a regionthat is fairly flat to rolling; they can occur at many different elevations. These saucer-shapeddepressions have an average depth of about 2 to 5 feet (0.6 to 1.5 m). Their appearance isdependent on the size and shape of the original stagnant ice block that formed them and onthe effects of wind-induced wave erosion. Individual potholes can range in size from a fewhundred square yards up to several thousand square miles.
Potholes are not usually associated with any regional network of stream channels, but theyare related to local and regional groundwater systems. Water input is from groundwater inflow(discharge), direct precipitation, and occasionally from surface inflow from excess stormwater orsnowmelt runoff. The hydroperiods in wetlands range from temporarily to permanently flooded.These differences cause the development of diverse vegetation zones such as wet meadow,shallow marsh, and deep marsh. Prairie potholes lose water through evaporation, transpiration,and seepage to groundwater.
Prairie potholes are extremely important wetland resources in a region with few rivers,lakes, or other productive wetland types. Approximately 50 to 75 percent of all NorthAmerican waterfowl use this region for breeding and for resting during migration. Otherbirds and mammals, such as blackbirds and deer, are also common to the pothole region.Drainage of these wetlands for commercial cropland production threatens them as limited
Page 2-12

Sand Hills Wetlands
Factors to Consider When Selecting BMPs
water resources. Degradation of prairie potholes from stormwater discharges is a growingconcern where potholes occur in urban or urbanizing areas.
The Sand Hills wetlands account for about 5 percent (1.3 million acres or 0.5 millionhectares) of the Sand Hills area, which consists of central and eastern Nebraska and a portion ofSouth Dakota. Fifteen percent (28,021 acres or 11,340 hectares) of the original wetlands were lostbefore 1970. These wetlands are a result of hilly topography in conjunction with permeablegeologic formations. Small lakes, marshes, and wet meadows occur in the interdune areas.Approximately 194 species of grasses, sedges, rushes, floating leaved, and submerged plants,such as Japanese brome, spreading bentgrass, and fox-tail barley (Segelquist et al., 1990),dominate these wetlands. These wetlands are important migration sites for waterfowl,shorebirds, and songbirds. Approximately 80 percent of the Sand Hills wetlands are less than10 acres in size. The following wetland types are typical:
l Seasonally flooded basins are flooded during spring and well drained the rest of theyear.
l Fresh (wet) meadows have no standing water but have waterlogged soils and root zoneduring the growing season; vegetation consists of sedges and grasses.
l Subirrigated meadows have plant roots in contact with the water table.
l Shallow fresh marshes have waterlogged soils for most of the year; marsh areas havestanding water and emergent aquatic vegetation.
l Deep fresh marshes have a flooding depth of up to 3 feet in spring and early summer.
l Open freshwater lakes and ponds are typically perched above local groundwaterlevels, or where topography is below the water table level; a small change in depth yieldsa large change in water area because of very shallow lakes. In the westernmost region ofthe Sand Hills, lakes and ponds are alkaline and have less diversity of wetland plantspecies.
l Wind pump wetlands are small wetlands caused by overflowing wind-powered pumpsthat tap underlying groundwater.
Most of the wetlands are influenced by local hydrogeology. There is negligible groundwaterinflow from areas beyond the Sand Hills. Annual precipitation ranges from 16 inches in the westto 24 inches in the east, and is the principal source of water. Highly permeable soils and grassydune vegetation promote high rates of water infiltration. Within the interdune valleys, theaccumulation of fine sediments and organic material has reduced permeability Therefore,snowmelts and spring rains result in the wetland formations described previously. The hydrologyof each wetland type is dependent on the rate of water input and the rate of downwardinfiltration. Other factors influencing groundwater recharge are soil characteristics, geology,and water table depth. These “subirrigated” meadows are unique because they have moreconsistent precipitation and infiltration rates than other wetland types with more seasonalvariations and their water level is almost permanently at ground level. Many have a fairlyconstant hydrologic input from groundwater. This constant inflow continues even in drieryears.
Page 2-13

Bottomland Hardwoods
Protecting Natural Wetlands: A Guide to Stormwater Best Management Practices
The Sand Hills wetlands are an integral part of the Sand Hills hydrologic system. Themeadowlands have economic significance because of hay production, as well as ecologicalsignificance related to lakes and marshes. Although the wetlands themselves play a relativelyminor role because they constitute only 5 percent of the land surface, the Sand Hills area isimportant for recharge of water to the underlying Ogallala High Plains aquifer, which extendsinto other portions of Nebraska, as well as parts of Kansas, Oklahoma, and Texas.
Peatlands of the North-central States
The peatlands of the north-central states include the Red Lakes Peatlands of northernMinnesota, one of the largest areas of peatlands in the country Peatlands in this area have lowtopographic relief and have a depth ranging from 3 to 10 feet. Peatland describes wetlands thathave soils composed of partially decomposed remains of plants. The decomposition rate is lowbecause of low oxygen concentrations and saturated soils. Bogs and fens are the predominanttypes of wetlands found in the peatlands of the north-central states.
Bogs have acidic, fibrous, spongy, nutrient-poor organic soil (phosphorus and potassium arethe limiting factors), whose organic plant material consists mostly of sphagnum moss. Because oftheir location at or above the local groundwater table, bogs acquire most of their water fromprecipitation and primarily support the growth of acid-tolerant trees and shrubs such as thetamarack, the black spruce, and the leatherleaf. Fens represent a transitional stage betweenmarshes and bogs. Fens obtain water not only directly from precipitation, but also by surfacerunoff and groundwater seepage. Fens support diverse plant communities consisting of sedges,grasses, reeds, and some woody vegetation. Both areas contain a vast number of invertebrates,insects, and amphibians.
Water chemistry determines the development of different wetland types. Acidic water witha very low mineral content is typical of bogs, while the fens are characterized by the reverse.These water chemistry differences are related to water origins. Mineralized fen water originatesfrom groundwater, whereas precipitation produces the high-acidity, low-mineral water content ofa bog.
Peatlands have a hydrogeologic flow system independent of regional groundwatermovement. Some limited groundwater recharge might occur in the sandy former shorelinesof glacial lakes, where more permeable sediments would permit the percolation of water.Some examples of particular groundwater interactions are spring fens and groundwatermounds. The former result from upward seepage of regional groundwater, and the latter are aresult of the mounding of the water table. Also, because of increased elevation of water ingroundwater mounds, a gradient is created, thereby resulting in a return of flow downward.
As a result of increased agricultural cultivation over the last 100 years, many of thepeatlands in the north-central states have been drained. The increase in impervious surfaces thatresults from development associated with urbanization has the potential to adversely impactcertain peatlands, particularly fens due to their receiving surface water flows.
Bottomland hardwoods are forested wetlands in the river valley floodplains of the AtlanticCoastal Plain (extending south from Virginia to Florida), and of the Gulf states of Alabama,
Page 2-14

Factors to Consider When Selecting BMPs
Mississippi, and Louisiana. They occupy the broad floodplains, seldom exceeding a width of5 miles. Since the settling of America, 60 to 80 percent of the original area of these wetlands hasbeen lost. Bottomland hardwoods consist of flood-tolerant species of oak, gum, cypress, elm, andash. These species are adapted for survival in areas that are flooded between 20 to 150 days a year.Vegetational characteristics are determined by the overall extent of seasonal flooding. This regionis also home to a diverse number of animal and bird species such as deer, raccoons, owls, andhawks. Forested wetlands like the bottomland hardwoods are important wood duck breedinghabitat.
This seasonal hydrology also affects surface water and groundwater movement. In drierseasons, floodwaters and lateral groundwater movement serve as the dominant inputs. Otherinput sources include overbank flooding from the main channel, flooding from small tributarystreams, lateral overland flow from valley sides, lateral groundwater flow from valley-side rockformations, and movements of groundwater parallel to the main river channel. Where there arepermeable rock formations in the local geology like limestone, groundwater helps maintainwetland characteristics through seepages and springs. Recharge can also occur in the form of bankstorage. As water levels rise, water can move laterally from the channel to the adjacent floodplain.
During floods, bottomland hardwoods trap, filter, and attenuate inputs of sediments andnutrients. In instances of high rainfall conditions they filter upslope surface runoff. They can alsoprovide continual recharge to the aquifer, raising groundwater levels up to hundreds of feet awayfrom the channel.
Swamps and Bogs of the Northeast
Two wetland types common to the Northeast are swamps and bogs. Swamps and bogs occurin the Northeast in Pennsylvania, New Jersey, New York, and New England. Swamps consist ofwoody vegetation occurring on poorly drained lowlands. Generally, they are found in valleys andvalley-side depressions that are periodically flooded. They are associated with surface drainagesystems and periodically can have standing water. Their size ranges from small depressions of lessthan an acre to many acres. Northern floodplain swamps have an abundance of hardwoods. Otherswamps, not bordering a river, may contain a mixture of evergreen and deciduous trees. Treescommon to the areas are the white cedar and the red maple. Bogs are a type of wetland dominatedby peat soils, which are nutrient-poor acidic soils dominated by sphagnum moss. Bogs can occuron flatland, on slopes, or as raised bogs as is the case in northern Maine. Bogs can support onlyhardy, acid-tolerant trees and shrubs, heath species, and sedges such as the black spruce, thetamarack, orchids, and insect-eating plants. Depending on the dominant vegetation, bogs can bedescribed as forested, scrub-shrub, or moss-lichen types. Both areas in this region harbor animalsand birds such as deer, rabbits, grouse, and owls. In addition, swamps and bogs are home to adiverse array of rare plants.
The hydrology of swamps and bogs differs greatly. Groundwater, floodwaters, and tidalinnundations provide input to swamps, while rainfall provides hydrologic input to bogs.Swamps collect groundwater from valley-side seepage, from the soil of downslope depres-sions, and through fractures in bedrock. Discharge leaves the swamp as stream flow and/orseepage. Groundwater is not a major hydrologic component of bogs, although the water thatbogs hold is considered groundwater. Bogs in the Northeast are hydrologically self-containedand are referred to as ombotrophic; there is little inflow or outflow of either surface water orgroundwater. They are isolated from the high mineral content of groundwater and are therefore
Page 2-15

Protecting Natural Wetlands: A Guide to Stormwater Best Management Practices
very acidic. Although water is not released to stream systems, it can be released as seepage duringtimes of surplus precipitation. This lateral movement, however, is very slow.
The functions of both wetlands also vary Water stored in swamps attenuates the movementof water through the complex integrated hydrological systems involving groundwater, wetlands,rivers, and lakes. During storm flooding in a dry era, the flooding of a wetland serves as a rechargesource to adjacent aquifers. Bogs, because they retain water so well, act as giant sponges and donot let much water leave as seepage. What little water is released does not necessarily increase drystream flow or recharge aquifers.
Cypress Dome Wetlands
Cypress dome wetlands occur in southern Georgia and in the Florida wetlands. The termcypress dome, also referred to as “cypress pond” and ‘cypress head,” is defined as a hardwoodforested wetland occurring in seasonally or permanently wet saucer-shaped depressions. Thesewetlands are small in scope, usually not exceeding 25 acres (10.1 hectares) and are dominated bypond cypress trees, some of which are over 400 years old. If enough light penetrates the canopy,understory vegetation like the wax myrtle can grow. Viewed from the side, these trees assume acharacteristic dome-shaped profile, with the smaller trees toward the edges and the larger trees inthe middle. The arrangement of the trees in this manner is due to the occurrence of wildfire,which often burns only the outer, smaller trees. These domes contain acidic water and organic soilthat is thickest in the middle and thinner toward the edges of the domes. Snakes, alligators, andnine species of frogs are common in this region.
Cypress domes occur in flat areas where the water table is close to the surface; this surfacewater is connected to shallow aquifers. Movement of water from cypress domes proceeds in alateral direction. Primary hydrologic inputs to cypress dome wetlands are rainfall and surfacewater inflow. Water is lost through evapotranspiration and seepage to groundwater systems. Thedeciduous leaves of cypress trees seasonally influence the water budget due to the changes in theamount of interception of rainfall and transpiration. In the summer months of maximum rainfall,a net inflow into the wetlands results. The reverse occurs during drier times, providing somerecharge. Groundwater recharge/discharge is influenced by the geologic formation beneath thecypress domes. Cypress dome wetlands located above sinkholes can create permeable pathwaysbetween the wetland and the aquifer and are capable of recharging deeper limestone aquifers.Cypress dome wetlands have been used for the natural treatment of effluent.
Permafrost/Tundra Wetlands
Permafrost/Tundra wetlands are situated in the interior of Alaska and are the westernextension of the wetland complexes of northern Canada. Severe frost is the most importantcharacteristic that distinguishes the hydrology of these wetlands. Water is frozen in the groundyear-round, resulting in impermeable layers known as permafrost. Permafrost encompasses over ahalf-million square miles in Alaska. This condition is continuous in the north, but scattered inregions farther south. Permafrost areas are very sensitive to minute changes in vegetation coverand drainage. For instance, color, thickness, and degree of saturation of the wetland determine thethermal properties of the wetland, which in turn determine summer thaw depth and winterfreeze depth. Thawing occurs at a maximum of 3 feet, and freezing can extend up to hundreds of
Page 2-16

Factors to Consider When Selecting BMPs
feet. Wetlands produced by permafrost are seasonal thaw ponds, shallow emergent wetlands,partially drained lake basins, and wetlands in wet and dry tundra. The term muskeg meanspeatland, and it constitutes the organic content of these wetlands. A brief summer growingseason produces limited vegetation consisting of mosses, lichens, and sedges. Mosses fill a particu-larly important ecological niche because of their role in peat formation; the rate of which is aboutone inch per 300 years primarily due to the cold temperatures.
The water budget of the permafrost/tundra wetlands of Alaska varies from site to site.Precipitation in the Alaskan interior yields less than 12 inches (30.5 cm) per year. However,because of limited evapotranspiration, there is a net surplus of water available. Both snowmeltand rainfall are very important water sources for wetlands. Precipitation is the main water inputbecause of impermeable conditions created by permafrost. Very little water is lost or received toor from stream and groundwater flow, although there are exceptions. Groundwater recharge canoccur in certain instances where summer snowmelt and precipitation percolate through frozen,but dry surfaces, or on the warmer southern-facing slopes that have permafrost-free zonesallowing for infiltration. In warmer areas where there is groundwater circulation, moremineralized water can emerge, resulting in the formation of arctic fenlands. Icings and icymounds are wetland features that are the result of springs that continue to flow in early winter.The timing and amount of summer rain and snowmelt have a significant impact on thecharacteristics of individual wetland areas.
Stormwater Factors
Stormwater Quantity
Changes in land use within a watershed usually result in changes to stormwater runoffvolume and quality. For example, urbanizing watersheds are characterized by increases inimpervious surfaces, which include roads, sidewalks, parking lots, and buildings, as compared torural land uses. Increased imperviousness leads to increased runoff volumes and velocities andhigher pollutant loads. Moreover, natural stormwater conveyances tend to be replaced with hardstructures such as concrete gutters or swales because of the increases in erosion that oftenaccompany increased runoff amounts and velocities.
Runoff and Peak Flow
Land use changes alter the established rainfall-runoff relationship that exists in awatershed. The most common effects are reduced infiltration and subsequent reduction inthe time of concentration (which is the time it takes surface runoff from the most distantpoint of a watershed to reach the first swale, gutter, sewer, or channel) (Maidment, 1993).Travel time, the time it takes flow to move through various conveyance elements to the nextinlet or design point, may also be decreased by urbanization. Both of these factors cansignificantly increase peak discharges and runoff (USDA-SCS, 1986). Runoff volumes areprimarily determined by the amount of precipitation and by the infiltration characteristicsof an area. For a given location, some of the factors that determine infiltration characteristics aremore likely to be influenced by human intervention than others. The amount and type ofprecipitation for a given location can be quite variable, but are not likely to be modified by
Page 2-17

Protecting Natural Wetlands: A Guide to Stormwater Best Management Practices
human actions. The infiltration characteristics are a function of soil type, soil moisture,antecedent rainfall, cover type, impervious surfaces, and surface retention (USDA-SCS, 1986).Activities that increase imperviousness, decrease surface retention, or modify cover type can leadto increases in surface runoff or peak discharge.
As mentioned above, travel time is the time it takes runoff to travel from the point wheresheetflow enters a recognizable conveyance element (e.g., culverts, swales, over land), through thevarious conveyance elements, to a specified point in a watershed (Urbonas and Roesner, 1993).Travel time is principally a function of slope, length of the flow path, depth of flow, and theroughness of the flow surfaces (USDA-SCS, 1986). As land uses in a watershed become smoother(e.g., imperviousness increases or forested areas decrease), the velocity of runoff increases, whichdecreases the travel time (Urbonas and Roesner, 1993).
Peak discharge changes are often good indicators of changes in land use within a watershed thatwill affect the hydrology of natural wetlands. The relationship between runoff volume, watersheddrainage area, relative locations of urbanized areas, effectiveness of flood control structures or otherstorage, the time distribution of rainfall during a storm event, and travel time determines peakdischarge (USDA-SCS, 1986). The estimation of peak flows on small (16.1 miles2 or<25.9 km2) tomedium-sized (321.9 mile2 or <518 km2) watersheds is a very common application of stormwaterrunoff estimation (Pilgrim and Cordery, 1993).
Mathematical relationships, or models, are used to approximate the relationship of rainfallto runoff. The results from modeling approximations used to predict runoff from a particular areaare generally much better at indicating changes in runoff, rather than absolute runoff volumes.For the purpose of determining impacts to wetlands from stormwater runoff, estimating relativechanges in runoff volume and peak discharge is sufficient.
A variety of methods exist to determine runoff volume or peak discharge for sizing anddesigning conveyance systems and detention facilities. Pilgrim and Cordery (1993) andMaidment (1993) describe several different approaches for predicting runoff volume and peakdischarge. Some of the modeling approaches focus on runoff and others on the loss, the part of therainfall that does not run off. The assumptions of the different approaches are summarized below:
Loss (and conversely runoff) is a constant fraction of rainfall in each time period, or forstorms with constant rainfall intensity, a simple proportion of the total rainfall. Anexample method using these assumptions is the rational formula.
l Runoff is the residual after a selected constant loss rate or infiltration capacity isfulfilled. Examples include use of probable maximum flood computations and theprediction of hydraulic conductivity (assuming sufficient soils data are available).
l Initial loss and continuing constant loss rate index models are similar except that the initial runoffis zero until an initial loss capacity is met regardless of the rainfall rate; then runoff is a constantr a t e .
l Runoff is estimated by an equation that represents a function of the capacity rates of lossdecreasing with time. The equations may be based on empirical relationships orphysically based models. An example is the Green and Ampt (1911) equation.
l Runoff is represented by rainfall-runoff relationships, such as the U.S. Soil ConservationService TR-55 method, a runoff curve (CN) method.
Page 2-18

Rainfall
Factors to Consider When Selecting BMPs
Rainfall and snowmelt are the basis for stormwater runoff and are variable in space andtime. In the estimation of runoff or peak flows, rainfall is represented by a hyetograph, which isthe time pattern of rainfall intensity When data are available, recorded rainfall can be used todetermine the hyetograph, which may be assumed to be constant for the entire watershed ifsufficient spatial data are not available. In the absence of sufficient local data, regional designrainfall of average intensity (found in national intensity-duration-frequency information) can beused (Pilgrim and Corder-y, 1993). National precipitation data are published in Climatological DataandHourly Precipitation Data by the National Climatic Data Center, which is part of the NationalOceanic and Atmospheric Administration in the Department of Commerce.
Storm Frequency refers to the time between rainfall events of equal intensity (return periods).Storm (and flood) frequency can also be expressed as a probability For example, a 25-year frequencystorm has a 4 percent chance of happening in any year. Storm intensity is typically defined as a volumeof rain in a given time period, Maps are available that show rainfall for durations from 30 minutes to24 hours and return periods of 1 to 100 years (Hershfield, 1961). The frequency and intensity of stormevents vary regionally and seasonally. For example, storm events in the central and southwesternUnited States typically occur less frequently than those in the East, but may occasionally produce largevolumes of runoff. Some areas may receive the bulk of their annual precipitation as snowfall, andsnowmelt would be a major contributor to streamflow and runoff in such regions. In a summary ofseveral studies related to urbanization in a watershed, the largest changes in runoff were associatedwith 2-year storm events, not l00-year events (Urbonas and Roesner, 1993).
Stormwater Quality
Runoff can be characterized by the use of the land from which the runoff comes. Forexample, the constituents of runoff from farmland are likely to be different from those in urbanrunoff. Agricultural runoff tends to be high in nitrogen, phosphorus, bacteria, and suspendedsediments. The principal types of pollutants found in urban runoff include sediment, oxygen-demanding substances, nutrients (phosphorus and nitrogen), heavy metals, pesticides,hydrocarbons, increased temperature, and trash or debris (Woodward-Clyde Consultants, 1990).
The source of sediments in stormwater might be erosion of bare soil in the watershed orchannel scouring due to increased stormwater volumes and velocities. Sediments in surface watermay settle in wetlands because of the effects of wetland morphology and vegetation on thelowering of water velocities. Some wetland types, such as tidal and riverine wetlands, mightbenefit from settling of some sediments and particulates, while other wetland types might beadversely affected by even low sediment loadings. High sediment loadings might affect plantcommunities or reduce fish spawning habitats in a wetland (Canning, 1988).
Another effect of urbanization is generally higher runoff water temperatures in the summer andcolder temperatures in the winter, primarily because of a reduction in vegetative cover and resultingrapid drainage (Galli and Debose, 1990). Higher summer water temperatures are associated withdecreased dissolved oxygen levels in surface waters, which affect the aquatic faunal community
Pollutants found in stormwater runoff are not transported in the same form; for example,phosphorus and metals are primarily transported bound to sediments, and nitrogen is often adissolved pollutant. Also, the levels of pollutants in runoff can vary according to season and landuse in a watershed (Hickock et al., 1977). Urban wetlands can be affected by increased loadings ofpollutants in runoff in comparison to predevelopment levels.
Page 2-19

Protecting Natural Wetlands: A Guide to Stormwater Best Management Practices
Wetlands that receive stormwater discharges with high sediment levels from sources such asuncontrolled construction sites can be impacted by excessive silt loads or altered flow patterns.Large flow volumes, high velocity, and long-term pollutant loads delivered by stormwater dis-charges can alter or destroy stable wetland ecosystems (USEPA, 1995).
The Nationwide Urban Runoff Program, or NURP (USEPA, 1983), although limited in scopeand purpose, is still considered by the Agency to be the most comprehensive national assessmentof pollutants in urban runoff. The major focus of NURP was to characterize the water quality ofrunoff from residential and commercial areas and from industrial park sites. The programevaluated data from 81 sites in 22 cities and covered more than 2,300 individual storm events.Because the industrial park category did not include heavy industrial activity, data from theindustrial parks were merged with the data collected from the commercial areas. It should also bepointed out that the sites evaluated in NURP were selected in part for their low probability to beinfluenced by pollutant contributions from construction sites, heavy industrial activities, illicitconnections, or other confounding influences.
The NURP study provides insight on what can be considered background levels of pollutantsfor runoff from residential and commercial land uses (USEPA, 1995). The majority of samplescollected under NURP were analyzed for seven conventional pollutants (biochemical oxygendemand, chemical oxygen demand, total suspended solids, total Kjeldahl nitrogen (TKN), nitrate plusnitrite, total phosphorus, and soluble phosphorus) and three metals (total lead, total copper, and totalzinc). Median values for the NURP pollutants are reported in Table 2-4, along with theircorresponding coefficients of variation. The original NURP data presented in Table 2-4 are reportedfor four land uses: residential, mixed, commercial, and open space. Table 2-5 summarizes the eventmean concentrations as composite results for the same four NURP land use categories.
Because the NURP sites represent average runoff conditions from a mix of residential,commercial, and industrial park sites, loading estimates based on NURP concentrations will beinfluenced by loadings from some of the sources considered in the industrial and commercialanalysis that were located in the catchments monitored (USEPA, 1995). It is, therefore, importantto consider the land use from which runoff originates, as well as other watershed-specificconditions, when evaluating BMPs to treat stormwater quality for protecting wetlands. Table 2-6shows different types of land use, the pollutants expected in runoff from those land uses, and thepotential effects of those pollutants on wetlands. This table can be used as a basis to startevaluating stormwater quality when determining potential impacts to wetlands.
Page 2-20

Table 2-4 Results of the Nationwide Urban Runoff Median Event Mean Concentrations for All Sites by Land Use Category
Factors to Consider When Selecting BMPs
Residential MixedOpen/
Commercial Nonurban
Pollutant Median CV M e d i a n C V
BOD (mg/L) 10.0 0.41 7.8 0.52
COD (mg/L) 73 0.55 65 0.58
TSS (mg/L) 101 0.96 67 1.14
Total Lead (mg/L) 144 0.75 114 1.35
Total Copper (mg/L) 33 0.99 27 1.32
Total Zinc (mg/L) 135 0.84 154 0.78
TKN (mg/L) 1900 0 . 7 3 1 2 8 8 0.50
Nitrate plus Nitrite (mg/L) 736 0.83 558 0.67
Total Phosphorus (mg/L) 383 0.69 263 0.75
Soluble Phosphorus (mg/L) 143 0.46 56 0.75
Source: USEPA. 1983 Note: CV = coeffcient of variation.
Median cv9.3 0.31
57 0.39
69 0.85
104 0.68
29 0.81
226 1.07
1179 0.43
572 0.48
201 0.67
80 0.71
Median cv- -40 0.78
70 2.92
30 1.52
- -
195 0.66
965 1.00
543 0.91
121 1.66
26 2.11
Table 2-5. Summary of Event Mean concentrationsfrom NURP for Selected Pollutants
Composite of All Land use Categories
9 0 t h9 0 t h Coefficient ofMedian Percentile Variability
Mean Site Site for Event
BOD (mg/L) 12 9 15 0.5-1
COD (mg/L) 94 65 140 0.5-1
TSS (mg/L) 239 100 300 4-2
Total Lead (mg/L) 0.24 0.14 0.35 0.5-1
Total Copper (mg/L) 0.05 0.03 0.09 0.5-1
Total Zinc (mg/L) 0.35 0.16 0.50 0.5-1
TKN (mg/L) 2.3 1.5 3.3 0.5-1
Nitrate plus Nitrite (mg/L) 0.86 0.68 1.75 0.5-1
Total Phosphorus (mg/L) 0.50 0.33 0.70 0.5-1
Soluble Phosphorus (mg/L) 0.15 0.12 0.21 0.5-1
Source: USEPA, 1983, 1995.
Page 2-21
Constituent

Protecting Natural Wetlands: A Guide to Stormwater Best Management Practices
Table 2-6. Effects of Pollutants from DifferentLand Uses/Sources on Wetlands
Land Uses/SourcesAgricultural runoff (cattle)grazing land, manure)
Typical Pollutants Effect on WetlandBacteria (coliform, Contamination of shellfish, rendering themstreptococcus) inedible
Sediment Clogged bottom sediments, interferingwith fish spawning and benthicinvertebrates
Nutrients Increased vegetative productivity, resultingin increased standing stocks of vegetation,followed by increased rates of vegetativedecay and higher Community respirationrates
AgriculturaI runoff feedlots)
Organic matter
Pesticides, salts
Nitrogen, phosphorus
Greater oxygen demand/depletion
Alteration of species distribution
Increased vegetative productivity, resultingIn increased standing stocks of vegetationfollowed by increased rates of vegetativedecay and higher community respirationrates
Commercial stormwaterrunoff
Total nitrogen Increased vegetative productivity resultingIn increased standing stocks of vegetation,followed by Increased rates of vegetativedecay and higher community respirationrates
Heavy metals(Pb, Zn, Cu, Cd)
Petroleum residues
Residential stormwater runoff Total nitrogenlow to moderate density)
Alteration of Species distribution
Decreased growth and respiration rates(Chronic toxicity)
Increased vegetative productivity, resultingIn increased standing stocks of vegetation,followed by increased rates of vegetativedecay and higher community respirationrates
Bacteria (coliform) Contamination of shellfish, rendering themInedible
Heavy metals(Pb, Zn, Cu, Cd)
Petroleum residues
Alteration of species distribution
Decreased growth and respiration rates(chronic toxicity)
Urban runoff(developing Areas)
Pesticildes (diazinon)
Suspended solids
Alteration of specks distribution
Clogged bottom sediments. lnterferingwith fish spawning and benthicInvertebrates (smothering)
Nitrogen, phosphorus Increased vegetative productivity, resultingIn increased standing stocks of vegetation,followed by increased rates of vegetativedecay and higher community respirationrates
lead Alteration of species distribution; decreasedgrowth and respiration rates(chronic toxicity)
Highway stormwater runoff BODSheet flow blockage byembankments
Greater oxygen demand/depletion
Sheet flow reduced by embankments,decreasing the sediment supply to wetlandsand making the waters more likely to stag-nate when fully flooded.
Page 2-22

Tabe 2-6. (continued) Land use/Source Typical Polluants Effect on Wetlands
Factors to Consider When Selecting BMPs
Highway Stormwaterrunoff (cont.)
Multifamily residential area Nitrogen, Phosphorus Increased vegetative Productivity. resulting inStormwater runoff Increased standing stocks of Vegetation,
followed by increased rates of vegetative decayand higher community respiration rates
Urban stormwaterrunoff (developed)
Pasture stormwaterrunoff
Cultivated landstormwater runoff
Industrial area runoff
Alternation of me hydrologic regime, sedimentloading, and direct wetlands removal;hydrologic isolation, decreased salinity intidal marshes, and increase in vegetative cover;nutrient retention and signs of eutrophication
Oil and grease; polyaromatic Reduced species diversityhydrocarbons
Heavy metals (Pb, Zn) Alteration of species distribution and replace-and deicing salt/sand ment of sensitive species with tolerant species;
Decreased growth and respiration rates(chronic toxicity)
Suspended solids
BOD
Clogged bottom sediments, Interfering withfish spawning and benthic invertebrates(smothering)
Greater oxygen demand/depletion
Bacteria (coliform) Contamination of shellfish,rendering them inedible
Heavy metalsKu. Pb, Zn, NI, As, Be)
Organics (bls-2-ethylhexyl phthalate)
Pesticides (a-BHC)
Nitrogen, phosphorus
Reduced species diversity
Replacement of sensitive species withtolerant species.Alteration of species distribution
Decreased growth and respiration rates(chronic toxicity)
Increased vegetative productivity, resulting inincreased standing stocks of vegetation,followed by increased rates of vegetative decayand higher community respiration rates
BOD Greater oxygen demand/depletion
Suspended solids Clogged bottom sediments, interfering withfish spawning and benthic invertebrates
Heavy metals (Pb, Zn, Cu, Cd) Alteration of species distribution
Suspended solids Clogged bottom sediments, interfering withfish spawning and benthic invertebrates(smothering)
Nitrogen Increased vegetative Productivity, resulting inIncreased standing stocks of vegetation,followed by increased rates of vegetative decayand higher community respiration rates
Suspended solids
Hydrocarbons
Clogged bottom sediments, interfering withfish spawning and benthic invertebrates
Reduced species diversity; replacement ofsensitive species with tolerant species; alterationof species distribution; decreased growth andrespiration rates (chronic toxicity)
BOD Greater oxygen demand/depletion
COD Greater oxygen demand/depletionSuspended solids Clogged bottom sediments. lnterfering with
fish spawning and benthic invertebrates(smothering)
Sources: USEPA, 1983 1993, 1995.
Page 2-23

Protecting Natural Wetlands: A Guide to Stormwater Best Management Practices
Factors contributing to the variability of pollutant types and loadings from similar land usescould include the following (Driver and Tasker, 1988):
Physical and Land-Use CharacteristicsTotal contributing drainage area - a factor in determining the amount of runoff
Percentage of total drainage area that is impervious - a factor in determining theamount of rainwater that runs off as opposed to being absorbed into the ground
Percentage of total drainage area that is industrialized - a factor in determining thetypes of constituents likely to be present in runoff
Percentage of total drainage area that is commercialized - a factor in determiningthe types of constituents likely to be present in runoff
Percentage of total drainage area that is residential - a factor in determining thetypes of constituents likely to be present in runoff
Percentage of total drainage area that is nonurban - a factor in determining thetypes of constituents likely to be present in runoff
Population density - a factor in determining the amount of pollution per unit area thatmight be expected
Stream flow - an influence on the amount of likely dilution
Climatic Characteristics
l Total storm rainfall - a factor in determining the amount of rain available to run off
l Duration of each storm - a factor affecting the amount of rain running off balanced bythe amount that can be retained in the ground or channeled into another water body in agiven amount of time
l 2-year maximum daily precipitation - a factor explaining the expected climaticpattern for a geographic area
l Mean annual rainfall - a factor in determining the amount of rain available to run off
l Mean annual nitrogen load in precipitation - a factor explaining some of the sourcesof pollution to wetlands
l Mean annual January temperature - a factor explaining the expected climatic patternfor a geographic area
l Surface water hardness - an influence on the toxicity of certain hazardous substances(Owe et al., 1982)
Pollutant loadings-nitrogen, phosphorus, sediment, and lead-from urban, agricultural,and open space land uses were evaluated and plotted to aid in the selection of stormwater BMPs.Figures 2-2 through 2-5 show the median, maximum, and minimum pollutant loadings reportedfor several locations around the United States. Although these figures cannot be used to replace athorough evaluation of site-specific conditions, they can be used initially to screen BMPs toshorten a list of potential BMPs to protect a wetland. For example, a wetland that is downstreamfrom a predominantly urban area could potentially need to be treated for lead, whereas if the
Page 2-24

Factors to Consider When Selecting BMPs
predominant land use were forest, lead would presumably not be a problem. Sedimentloadings would be an important consideration for all land uses, but loading rates can varywidely within a land use category. The above-mentioned factors could account for the rangesof pollution from different land uses and from within the same land use category, as shownin Figures 2-2 through 2-5.
Figure 2-2. Sediment loading rates for various land uses.
Urban
Figure 2-3. Nitrogen loading rates for various land uses.
Page 2-25

Protecting Natural Wetlands: A Guide to Stormwater Best Management Practices
Figure 2-4. Phosphorus loading rates for various land uses.
Figure 2-5. Lead loading rates for various land uses.
Sources for Figures for 2-2 through 2-5: Novotny and Chesters, 1981: Shahane, 1982; Sweeten and Melvin. 1985; USEPA 1983.
Page 2-26

Overview of BMP Capabilities
Factors to Consider When Selecting BMPs
Assessing the Ability of a BMP to Protect a Wetland
Wetlands can provide water quality benefits that should be considered when developing orimplementing watershed planning. However, because natural wetlands are waters of the UnitedStates they must be afforded the same protection from degradation as any other receiving water.The wide variability of wetland types and the range of potential impacts from runoff make itvery difficult to recommend a particular methodology to protect wetlands. EPA believes, however,that the use of natural wetlands for control of runoff should be avoided.
Different wetland types vary in their ability to handle the changes caused by stormwaterflows and pollutant levels. Where runoff is specifically channeled or routed to wetlands, BMPsshould be implemented to maintain the natural functions of the wetland. This might require theuse of BMPs for water quality improvement, techniques to minimize changes in the naturalhydrology of a system, or both. The principal question to be answered is whether the BMP isproviding the level of protection necessary to ensure that the wetland retains its natural healthand functions. Therefore, unlike other manuals that use end-of-pipe approaches, this manualfocuses attention on the resource. To the resource manager this approach could be viewed bystanding in the wetlands.
A variety of physical, chemical, morphological, and biological wetland functions could serveas appropriate indicators of the wetland’s continued health and sustainability. These include:
l Groundwater quality and recharge
l Groundwater discharge
l Flood flow alteration
l Shoreline stabilization
l Sediment/toxicant retention
l Nutrient uptake, transformation, and removal
l Vegetative diversity, biomass production, and export
l Aquatic diversity and abundance
l Terrestrial wildlife diversity and abundance for breeding, migration, and wintering
l Stable recreational opportunity, uniqueness, heritage
The wetland’s continued function and sustainability should be assessed. If it can bedetermined that the wetland is healthy, this might also be an indication that the proper BMP hasbeen selected, has been well designed for the site and specific application, and has been wellmaintained (assuming other objectives of the BMP are being achieved, such as water quality). Ifthere is some problem with the wetland (i.e., its function, health, or sustainability), the cause ofthe problem should be evaluated. Any combination of a number of causal factors could beresponsible for the problem. These include, among others, choice of BMP, design, operation, andmaintenance.
Page 2-27

Nonstructural Controls
Protecting Natural Wetlands: A Guide to Stormwater Best Management Practices
The evaluation should follow a logical, decision-tree-type sequence, working in reverseorder (selection, design, operation, and maintenance). For example, if the improper BMP wasselected for the site, none of the other factors would be likely to solve the problem, although theymight help to some degree. Or, it might be determined that the proper BMP was selected but thedesign was not tailored to the site conditions (i.e., considering stormwater discharge factors andwetland factors like hydrology, soils, and vegetation). In other cases, an operational flaw might bealtering the wetland’s hydrology, or perhaps the BMP is not being maintained in the manner bestsuited to ensuring the continued health and function of the wetland.
It is likely that the same decision makers and technical personnel will be responsible forimplementing both stormwater BMPs that discharge to wetlands and BMPs that do not dischargeto wetlands. Therefore, these considerations should be emphasized to the appropriate staff so thatthe aspects of stormwater BMP selection, design, operation, and maintenance unique to practicesused to protect wetlands are not inadvertently disregarded.
Although a number of manuals describe BMPs to be used to address stormwater runoff, thismanual is a first attempt at addressing the specific water quality concerns related to wetlands. Itis intended for use by anyone addressing potential impacts to wetlands from stormwater runoff,and it presents a wide range of planning approaches as well as specific BMPs that can be employedin a variety of situations. Although these are all discussed as BMPs for the purposes of this manual,some approaches might be more relevant and useful for large-scale planning efforts, whereasothers are more appropriate for very specific localized problems.
Nonstructural controls are techniques used to manage stormwater runoff that do notrequire physical alteration of the land (USEPA, 1993). The prevention and minimization ofpollutant loadings through source reduction and watershed planning are preferred over treatingthe unavoidable loadings that occur following urbanization. Watershed planning can help toreduce the need for expensive construction and maintenance of permanent structures ifdevelopment in the watershed is accomplished in an environmentally sensitive manner thatminimizes impacts. Obviously, opportunities for watershed planning will be limited by thecurrent level and pace of development in a given watershed.
Nonstructural control practices applicable to wetlands include:
. Pollution prevention
l Watershed planning
l Advance identification of wetlands
l Permitting programs
l Preventive construction techniques (minimal impact development)
l Retaining open spaces, vegetated natural buffers, and riparian areas
l Inspection and maintenance of existing stormwater and erosion controls
l Education programs
Page 2-28

Factors to Consider When Selecting BMPs
Watershed PlanningWatershed planning involves the development of a watershed management plan, often as
part of a comprehensive plan, The watershed management plan that describes existing patterns ofenvironmental quality and community life in a watershed (including demographic trends,housing, infrastructure, economic activity, natural resources, and wildlife) and recommends goalsand policies (including protection of drinking water sources and control of land uses) to managefuture development to minimize impacts on water resources. A watershed management planconsists of maps of the watershed and its resources and text that explicitly addresses conflicts andtrade-offs among development, environmental protection, social issues like as affordable housing,transportation, and many other factors. Watershed management plans also consider alternativeactions and methods of measuring progress (CTIC, n.d.). Special-purpose planning, e.g., wetlandsmanagement planning, is one component of a watershed plan (USEPA, 1992c). Other componentsare wellhead protection and Class V (underground injection) well management.
Resource inventory and information analysis provide the basis of watershed managementplanning. For a plan to be effective, it should have measurable goals describing desired outcomes;for example, “Reduce loads to wetlands and surface waters by 25 percent.” The process ofdeveloping a watershed plan should also identify how wetland protection goals and otherconcerns of the plan will be addressed, and should identify information gaps. Coal setting mustthen be followed by developing means of measuring progress. For example, sediment input andspecific pollutant loads can be assessed to determine whether the plan is being successfullyimplemented.
Watershed planning also allows stormwater managers to determine how best to control thequality and quantity of surface waters within a watershed after development has commenced.Ideally, this process will attempt to replicate, to the extent possible, the predeveloped hydrologyof the watershed, including how wetlands function for flood storage as well as their water qualityfunctions. Watershed planning is an opportunity for wetland managers to assess wetlandprotection needs, develop wetland restoration goals, plan mitigation strategies, and determineimpacts from land use changes to wetland resources. When wetland resources are identified on awatershed (or landscape) scale, factors such as location of individual wetlands with respect toother wetlands, adjacent land uses, or water bodies can be factored into the decision-makingprocess of a wetland resource assessment and the design of appropriate controls (structural ornonstructural) for preventing or treating stormwater discharges to natural wetlands.
Some increase in impervious surfaces, resulting hydrological changes, and a related additionof pollutant sources are inevitable results of urban and suburban development. BMPs attempt tomitigate these hydrological modifications and pollutant inputs. Without BMPs, wetlandsreceiving flows of uncontrolled runoff would likely become severely degraded. Therefore, thechanges in hydrology rather than the BMPs are the cause of the problem. Nonetheless, wherewetlands occur within a watershed, planning for BMPs needs to consider the impact of each BMPon wetlands and related groundwater resources.
A modeling mechanism may be incorporated into the watershed management plan. Such amodel shows the cause-and-effect relationships within a watershed and can be used to test variousland use/stormwater control scenarios to determine which option best preserves overall wetlandfunctions or improves the health of a degraded wetland system.
The Maryland Nontidal Wetlands Program calls for watershed management plans thatcontain, at a minimum, a functional assessment of nontidal wetlands within a watershed; the
Page 2-29

Protecting Natural Wetlands: A Guide to Stormwater Best Management Practices
location of potential mitigation sites; and plans for the protection of nontidal wetlands, limitingcumulative impacts, water supply management, and flood management (MDDNR, 1991). Aneffective wetlands watershed management plan may also include wetlands and floodplainprotection ordinances, river corridor programs, sewer overflow provisions and siting controls,control of septic systems, requirements for pumpout stations for small boats, designing and sitingof wastewater treatment facilities, surface water and groundwater quality controls; and non-point source pollution controls (USEPA, 1992c).
Once wetland resources and existing land use designations have been identified and thegoals for wetland protection have been determined, implementation strategies can be developedto guide activities in the watershed. Nonstructural control practices (as opposed to structuralpractices) are the preferred technique for protecting wetlands because they are based on pollutionprevention and reduction. Nonstructural control practices can be used within four program areas:permitted uses, preventive construction techniques, operation and maintenance, and education.
Permitting ProgramsPermitting ProgramsThe goals of a watershed management plan, such as wetland protection and water quality
improvement, can be implemented through various permitting programs such as land-useplanning and zoning, natural resource/wetland protection ordinances, stormwater permittingprograms, and other pollution control programs. Land development regulations may also requirenatural performance standards such as limiting rates of runoff, soil loss, or pollutant loadings intowetlands and the completion of environmental impact assessment statements prior toconstruction plan approval.
Preventive Construction TechniquesStormwater quality and wetland protection can be improved through the implementation
of numerous nonstructural preventive construction techniques for new development andredevelopment that help to minimize impacts, such as:
l Limiting the amount of impervious surface
l Requiring setbacks from wetlands, riparian areas, and surface waters
l Preservation of natural vegetation
l Open space requirements and slope restrictions
l Siting infrastructure so as not to adversely affect wetland and water resources
l Discouraging development in environmentally sensitive areas that are critical tomaintaining water quality
l Site plan review procedures
l Performance standards for stormwater and wetlands
Operation and MaintenanceMaintenance of existing stormwater controls ensures continuing operation, effective
pollutant removal, and the protection of wetland and surface water resources. Maintenance, suchas the removal of sediments from detention and infiltration devices, the replanting of vegetationas upkeep within buffer and open space areas, and the maintenance of erosion and sedimentcontrol structures, is essential to the success of most structural and vegetation-dependent NPS
Page 2-30

Factors to Consider When Selecting BMPs
pollution controls. Maintenance programs should require the prior designation of an entity orindividual who is responsible for maintenance, and should stipulate the funding source or sources.
Outreach and Education Programs
Outreach programs can be designed to reduce individual contributions to stormwaterproblems and improve program implementation by maintenance personnel and governmentofficials. Training programs and educational materials for public officials, contractors, and thepublic are also crucial to implementing effective urban runoff management programs. Contractorcertification, inspector training, and competent design review staff are important to the successof a stormwater management program. The states of New Jersey, Virginia, Maryland, Washington,Delaware, and Illinois; NRCS; and the city of Alexandria, Virginia, have developed manuals andtraining materials to assist in implementation of urban runoff requirements and regulations(USEPA, 1993).
Education programs should be implemented in homes, in residential communities, and at theworkplace. At a minimum, they should educate and encourage the public to participate in andsupport local pollution prevention programs. Such programs might include storm drain stenciling,used oil and hazardous chemical recycling, litter control, street sweeping, lawn management andlandscaping, safe use and disposal of household hazardous materials and chemicals, correctoperation of onsite disposal systems, including the danger of industrial wastewater discharges toseptic systems, proper disposal of pet excrement, and water conservation.
Structural ControlsStructural controls are methods for managing stormwater that involve altering the flow,
velocity, duration, and other characteristics of runoff by physical means (USEPA, 1993).Structural controls can be used for both stormwater volume control and water qualityimprovement. A fundamental consideration for design or selection of a particular BMP is whetherthe wetland hydrology is dependent on surface water flow, groundwater flow, or somecombination of the two. Most structural controls are engineered structures that require regularmaintenance. Structural controls that can commonly be used to protect wetlands include:
l Infiltration basins
l Infiltration trenches
l Sand filters
Level spreaders (may be associated with gabions)
l French drains
l Grassed swales
l Vegetated filter strips
l Open spaces
l Extended detention dry basins
l Wet ponds
l Constructed wetlands
Page 2-31

BMPs In Series
Protecting Natural Wetlands: A Guide to Stormwater Best Management Practices
Less common controls may be used in special situations and for special purposes, usually toimprove stormwater quality. These controls generally have limitations regarding applicability andmaintenance. For example, untreated stormwater directed to a separator, dry well, or othershallow disposal system will eventually find its way to a water-table aquifer. Examples of theseless commonly used controls include:
l Porous pavement and concrete grid pavement
l Oil/grit separators or water quality inlets
l Dry wells or roof downspout systems
l Exfiltration trenches
BMPs in series incorporate several stormwater treatment mechanisms in a sequence toenhance the treatment of runoff where determined necessary. By combining treatmentmechanisms in series rather than using a single method of treatment for stormwater runoff, theoverall levels and relability of pollutant removal can be improved. Some examples of serial BMPsinclude the use of multiple pond systems, the combination of vegetated filter strips with grassedswales and detention ponds, and the combination of grassed swales or vegetated filter strips withinfiltration trenches. (For more information, see the fact sheet “BMPs in Series” in Section 4 ofthis manual.)
BMP Maintenance Requirements
When properly designed and located, BMPs can protect wetlands by providing preliminarytreatment of stormwater to (1) restore or maintain predevelopment hydrology and hydroperiodby providing a balance between infiltration and detention or retention, (2) reduce fluctuations innutrient levels, and (3) remove excessive levels of nutrients and sediments. The ability ofstormwater pretreatment systems to provide these functions depends on both the effectivenessand reliability of individual BMPs or BMPs in series. Regular inspections and maintenance areessential to good performance for all BMPs (Washington State Department of Ecology, 1991).Failure to provide proper maintenance can result in reductions in the pollutant removalefficiency or reductions in hydraulic capacity of stormwater treatment systems (WashingtonState Department of Ecology, 1992).
If stormwater BMPs are not functioning properly due to inadequate maintenance, the resultcan be flooding problems and in some cases even an increase in the pollutant load of stormwaterdischarges (Washington State Department of Ecology, 1992). Effective maintenance can beensured by clearly defining maintenance responsibilities and performing regular inspections todetermine maintenance needs (Washington State Department of Ecology, 1992). Apart fromachieving the required effectiveness and reliability, BMP maintenance and longevity areimportant considerations in the selection of a BMP not only because longevity variesconsiderably between treatment options, but also because maintenance costs may be high, insome cases rivaling construction costs over the design life of the BMP (Schueler et al., 1992).
Page 2-32

Maintenance Factors
Factors to Consider When Selecting BMPs
Maintenance and maintenance costs can be reduced if maintenance needs are anticipated inthe design stage (Schueler, 1987). The need for incorporation of maintenance provisions infacility designs is especially important when anticipating removal of sediment and debris frombasins. Two specifics to be incorporated into site plans are access for maintenance equipment andeasements. Easements are necessary around the perimeter of stormwater facilities to allow formaintenance and to provide a buffer from encroachment (Washington State Department ofEcology, 1992).
Maintenance is necessary to ensure that the storage and infiltrative capacity of the BMP isnot compromised so that the BMP can effectively buffer wetlands from the detrimental effects ofstormwater. The temporary storage and infiltration functions of pretreating stormwater can bepartially accommodated by the wetland if not provided by the BMP, but not without potentialdamage to the wetland. Furthermore, stormwater might not be sufficiently treated before itenters the wetland. Regular maintenance is used to ensure that the BMP continues to functionaccording to design specifications. Specific design variables that regular maintenance is intendedto maintain include the detention time of pond systems; the flow path of stormwater to, from,and within the BMP (preventing erosion); the water level; and vegetative cover in andsurrounding the device. Frequent problems that maintenance is targeted to address includeclogging of infiltrative surfaces; blockage of inlet or outlet structures by debris; erosion of pilotchannels, side slopes, embankments, and emergency spillways; sedimentation; accumulation ofpollutants; overgrown or patchy vegetation; and nuisance insects.
The major mechanism by which pollutants are removed by BMPs is through sedimentationof sediment particles and pollutants attached to sediments. The more efficient a BMP is atremoving sediments, the more frequently sediments and pollutants that have accumulated in thetreatment device will need to be removed to ensure that the system continues to functionproperly (Washington State Department of Ecology, 1992). It is beneficial not to allow sedimentsto stand in the system for long because the longer the wastes accumulate in the system the morelikely they are to become contaminated to the point where they might no longer be accepted fordisposal at a landfill (Washington State Department of Ecology, 1992). Frequent sedimentremoval from catch basins, detention vaults, pretreatment inlets, oil/grit separators, vegetativeBMPs, and pond forebays prevents sediments from being scoured by storms, which could result inshock loadings to receiving waters or clogging of a downstream BMP if BMPs occur in series. Pondsystems require less frequent sediment removal; however, flooding can result if pond capacity isreduced by accumulated sediment. Infiltration devices that become clogged with sediment canalso cause flooding.
The degree and type of maintenance required depend on the BMP type, design, managementobjectives, climate, and surrounding land use. For instance, infiltration BMPs, although effectivein removing pollutants, are usually less reliable than other types of BMPs due to poor longevity(Schueler et al., 1992). Specific management requirements for each of the stormwaterpretreatment systems described in this document are provided in Section 4.
The type of maintenance depends on management objectives. For instance, pond systemscomposed of wet meadow or wetland marsh and constructed stormwater wetlands, adjacent tonatural wetlands, may be managed for the dual purpose of promoting wildlife habitat andremoving pollutants. Creation of wetland habitat within a stormwater treatment pond is
Page 2-33
Protecting Natural Wetlands: A Guide to Stormwater Best Management Practices
especially important in areas where the value of natural wetlands has been diminished byconstruction of stormwater treatment systems adjacent to or in natural wetlands (South CarolinaCoastal Council, 1988). Benefits of wetland creation include removal of soluble pollutants,provision of wildlife habitat, and disguise of unsightly debris and sediment deposits (Schueler,1987). When a constructed wetland is placed adjacent to a natural wetland, the two wetlandsform an integrated system, the function of which is significantly influenced by the managementof the constructed wetland (DeVoe and Baughman, 1986). Management for waterfowl, the mostcommon natural habitat objective, may employ some combination of water level manipulation,bed disturbance, and salinity manipulation in coastal areas. The goal of these practices is topromote the growth of aquatic plants that attract migrating waterfowl. The degree and timing ofexchange of water between adjacent creeks, the constructed wetland, and the natural wetlandinfluence dissolved oxygen, temperature, and aquatic species (such as fish and crayfish)recruitment (DeVoe and Baughman, 1986). Usually water levels of ponds and wetlandsexclusively managed for waterfowl are maintained in the spring and fall for waterfowl migration.During the late spring, water is drained so the beds can be plowed in June. In October, the beds areflooded again (DeVoe and Baughman, 1986). There might be conflict of use between the need tomaintain low water levels to capture stormwater and the need to maintain higher water levels toattract waterfowl. In addition, an objective might be to discourage waterfowl from using theconstructed wetland if pollutant concentrations are expected to be high.
Mosquito control and frequent mowing will not be as important in an area managed forwildlife as in a residential neighborhood. Mosquitoes are a problem in wet meadows becauserainfall pools in areas, allowing mosquito eggs to develop and hatch. Constructed wetlands andpond systems can be managed to minimize the production of mosquitoes by maintaining a systemof ditches or canals for drainage. An aquatic weed control program can control mosquitoes bypreventing an overgrowth of vegetation in the pond. Fish stocks can be maintained in thepermanent pool of retention ponds (South Carolina Coastal Council, 1988). A pond that isscheduled to be filled for waterfowl use can be filled and emptied first to flush out residentmosquito populations (DeVoe and Baughman, 1986).
Implementation
Frequently, more attention is placed on design and location of structures than onmaintenance. In addition, many jurisdictions do not have required BMP maintenance programsto ensure the adequate performance of BMPs (Schueler et al., 1992). The lack of routineinspection and maintenance is especially evident in the case of small, privately owned localdisposal facilities, such as grassed swales, infiltration trenches, and infiltration basins, that are toosmall to justify a full-time staff person. The long-term effectiveness and reliability of BMPs canbe enhanced through implementation of a maintenance and operation schedule for each BMP thatexplains routine and nonroutine maintenance tasks and identifies the party (or parties)responsible for performing them (Washington State Department of Ecology 1991). Amaintenance plan developed for the life of the stormwater treatment facility can be requiredbefore the certification of a project (South Carolina Coastal Council, 1988). Inspectors need to betrained to know how the stormwater treatment system is designed to function and what the earlywarning signs of problems are. In addition to the brief overview of maintenance requirements ofvarious types of BMPs, specific information is provided in Section 4 for each BMP to assistmanagers in developing their operation and maintenance plans.
Page 2-34
Factors to Consider When Selecting BMPs
Development of an Effective Maintenance Plan
Development of an effective maintenance plan requires site-specific information and aconsiderable amount of planning and foresight, beginning with the establishment of broad goalsand objectives and ending with the scheduling of staff and equipment. Activities involved indesigning an effective maintenance program include developing goals, reviewing existing policies,assigning responsibilities, planning the frequency of inspections, scheduling inspections,determining staffing needs, and determining enforcement procedures (Washington StateDepartment of Ecology, 1992). Each component of the planning phase is discussed separately.
An effective maintenance plan reflects the specific priorities and goals of the communityserved by the stormwater treatment program, as well as watershed characteristics and existingpolicies within the jurisdiction (Washington State Department of Ecology, 1992). Therefore,development of a management plan begins with arriving at policies that outline who should beresponsible for maintaining BMPs on private and public lands and how these policies will beenforced. The goal-setting stage differs from the final stages of maintenance plan development inthat here utility officials should not constrain themselves to consideration of goals limited bycurrent practices and policies but rather should consider how maintenance ideally should beperformed, looking beyond the next 5 to 10 years to anticipate how decisions made now willaffect future courses of action and alternatives (Washington State Department of Ecology, 1992).
Existing policies within a jurisdiction can either facilitate or impede an effectivemaintenance program. Once the goals of the maintenance program are identified, managersshould review existing statutes, ordinances, and policies to assess how these complement theestablished goals of the maintenance program. In this manner, options for revising these policieswhere shortfalls are uncovered can be identified early (Washington State Department of Ecology,1992). Design requirements for maintenance (e.g., access, clean-out traps, sediment disposal areas)should be included in ordinances and policies.
During the planning stage of the maintenance plan, staffing needs and limitations should beconsidered prior to deciding who will be responsible for performing maintenance tasks,specifically whether they will be performed privately or by the local government. Somedistinctions may be made between routine and nonroutine maintenance activities or betweenfacilities located on rights-of-way and those on private lands. If private individuals ororganizations will perform the maintenance, an ordinance that requires owners to be informed ofoperation and maintenance frequency, schedules, procedures, responsibilities, and enforcementwill be necessary For example, an ordinance might require that new owners be notified at thetime of sale that they are owners of a stormwater treatment device and that they be providedwith the operation and maintenance instructions (Urbonas and Stahre, 1993). An ordinancemight not be required if local government will perform the bulk of the maintenance. If anordinance is not used to assign responsibilities, consideration should be given to staffing needsand limitations, merits of alternative funding mechanisms, provisions for intergovernmentcooperation, and specific needs or limitations (Washington State Department of Ecology, 1992).
Maintenance inspections need to be planned, including inspection frequency, scheduling,and staffing needs. In general, BMPs should be inspected and maintained once a year, at the veryleast, to remove debris, sediment, and vegetation that threaten the function or capacity of thefacility and to replant damaged vegetation on grassed swales, vegetated filters, and buffer strips(Washington State Department of Ecology, 1992). The frequency of inspection depends on the ageof the stormwater BMP, the occurrence of large runoff events that could damage the BMP, thehistory of problems encountered, and whether inspectors will perform routine maintenance.
Page 2-35

Fees
Protecting Natural Wetlands: A Guide to Stormwater Best Management Practices
Real estate transfer taxes are assessed as a percentage of property values when property issold. These taxes are imposed on property buyers, sellers, or both. Funds raised by such taxes canbe dedicated to help purchase environmentally sensitive lands or to support resource conservationprograms.
The Prince William County,Virginia, watershed managementstudy is a project that is attemptingto develop an innovativestormwater management planthrough the use of BMPs and therestoration of riparian habitats. A5-year, multimillion-dollar programto study the three urban Water-sheds is being funded through afederal-state-local cost-sharingapproach. The Prince WilliamCounty government Is funding 50to 60 percent of the entireproject. The remainder of thefunding is being provided by theU.S. Fish and Wildlife Service, theU.S. Geological Survey, the ArmyCorps of Engineers. and theEnvironmental Protection Agency.The Prince William Countygovernment is helping to fund theproject through a stormwaterutility fee. Utility taxes can beimposed on property ownersbased on a variety of factors, suchas the amount of runoff gener-ated on a piece of property. (Thefee can be calculated by thepercent of the property that Isimpervious.) Impact fees areusually collected at one time andcan based on factors such as newland development.
(See case study on P. 3-11 formore information.)
Commodity taxes are charged on specific items (commodities) such asgasoline, liquor, or cigarettes. The money raised could be targeted forenvironmental programs or services. A tobacco tax helps finance WashingtonState’s water quality protection plan.
Tax surcharges are fees added to established tax rates. They are oftenused for sudden unforeseen events. A tax surcharge on residential sewer bills,for instance, might be used to finance the replacement of stormwaterretention basins destroyed during a hurricane.
Stormwater utility taxes are imposed on property owners to pay forstormwater treatment. The charge can be based on the amount of runoffgenerated from the property, the amount of impervious area (hard surfaces)on the property, or the assessed value of the property There are more than 100stormwater utilities in the United States. Methods of determiningstormwater utility charges vary considerably around the country, dependingon local stormwater management goals and conditions. In general, utilitiesare either publicly owned and operated enterprises or privately ownedenterprises whose ability to profit from providing public services is regulatedby a public agency. Utilities provide a more reliable source of funds for localstormwater management than do property taxes.
Tax incentives and disincentives refer to a tax system set up to encourageor discourage certain behaviors by offering tax reductions or increases.Incentives often take the form of state tax credits, deductions, or rebates. A taxcredit for the use of low-flow plumbing fixtures, for example, can encouragewater efficiency. Disincentives often take the form of fees, taxes, or priceincreases. A tax or fee, for example, can discourage the inefficient use of aproduct.
User fees are the most common way of recovering the costs of providing a service. Thesefees can tie directly to the users of a resource or facility (sportfishing license fees, for example).User fees are particularly useful at the local level, where user groups are easily identified.
An innovative example of a user fee is the State of Maryland’s license plate program to fundits Chesapeake Bay Trust. More than 40,000 "Treasure the Chesapeake” license plates have beensold, raising over $4 million. Baltimore, Maryland, area Ford dealers offered Bay license plates atno cost to their new car and truck owners by paying the $10 fee from June through July 1991,raising $20,000 for the Trust.
Plan review fees are assessed by a local government to conduct a review of developmentplans to ensure that they meet certain requirements. This technical review includes determining
Page 2-38

Capacity Credits
Fee-in-Lieu
Factors to Consider When Selecting BMPs
the adequacy of stormwater management facilities, setback requirements, and wetlandprotection. These fees help cover the cost of conducting plan reviews and inspections.
The myriad programs that havebeen established to preserve andrestore wetlands in the ChesapeakeBay watershed are an example ofa multi-stakeholder federal, state,local, and private citizen partner-ship. Private organizations andpublic agencies, such as theChesapeake Bay Foundation andthe Environmental ProtectionAgency and the states of Pennsyl-vania, Maryland, and Virginia, are,in certain instances, pooling theirresources to fund projects andcreate policies regarding theChesapeake Bay watershed. Forexample, the Sea Grant CollegeChesapeake Bay Studies Program,which researches fish stocks, fateand transport of toxic pollutants,and remote sensing, is fundedthrough a research grant from theNational Oceanic and AtmosphericAdministration. Remote sensing hasbeen used successfully foridentifying wetlands and dellneat-ing the wetland/upland boundariesin the Chesapeake Bay region.
Onsite inspection fees are charged to cover the costs of activities to makesure that development plans are properly implemented. These activities caninclude erosion and sediment control; BMP siting, implementation, andmaintenance; and wetland protection. This approach defrays the cost ofconducting inspections.
Impact fees transfer the costs of infrastructure services (roads, sewers,stormwater treatment) needed for private development directly todevelopers or property owners. Unlike user fees, which recover costs over thelife of a project, impact fees are usually collected in one lump sum at thebeginning of a project. These fees are particularly attractive to localgovernments because they relieve up-front financing pressures on localbudgets. In California, for example, several wastewater treatment plants havebeen financed with fees paid by developers on the basis of the demands fortreatment that their projects are expected to generate. Impact fees could beused for building regional stormwater management facilities.
The state governments of Marylandand Virginia have implementedIicense Plate programs that providepart of the proceeds of the platesto a Chesapeake Bay Trust. Privatecitizen associations, such as theHerring Run Watershed Associationin the Baltimore, Maryland, areacan also receive funding frombeyond their local membership.The Herring Run restorationproject is a community. state, andfederal partnership that Includesschool curricula for ‘adopting’ andinventorying land use, plantingtrees, and caring for the existingforest buffers. The MarylandDepartment of Natural Resourcesrecently accepted a grant of$22,300 from the U.S. ForestService’s Chesapeake Bay Programto help fund this effort to improveconditions within the Herring Runwatershed.
Capacity credits are a form of financing in which private interests(usually developers) purchase future capacity in a public facility such as astormwater treatment facility Applicants are guaranteed future access to theadditional capacity of that particular facility When enough credits have beensold, work on the project begins.
Fee-in-lieu is a method of easing environmental impacts on a regional orwatershed basis. If a county or municipality determines that wetlandrestoration is too costly for an individual site, a fee can be charged to theproperty owner in lieu of implementing the restoration. The funds collectedcould be used to restore a more valuable wetland elsewhere in the watershed.
Bonds/Debt Financing
Bonds or debt financing raises up-front capital and distributes theburden of repayment for capital projects over the life span of the project andamong those who benefit from it. Typically, bonds can be used only tofinance projects that have both known and proven life expectancies. Short-term bonds are usually payable within 1 year. Establishing short-term debtprovides interim funding of projects waiting to receive long-term financing.
Long-term bonds traditionally match the term of financing with the life expectancy of theproject. A stormwater treatment facility, for example, might be expected to perform adequatelyfor 30 years; therefore, the community could issue up to a 30-year bond.
Page 2-39

Grants
Protecting Natural Wetlands: A Guide to Stormwater Best Management Practices
State Revolving Funds
State Revolving Funds (SRFs), which have been established since the Clean Water ActAmendments of 1987 by grants from EPA and state matching funds, can provide states with fundsto finance NPS projects. They are generally operated by the state and provide long-term, low-interest loans to localities for major capital investments, such as stormwater retrofit projects.SRFs may also provide credit enhancement or, to a limited degree, grants. The designated stateinstitution receives an initial flow of capital from EPA; local user fees are established to coveroperation and maintenance costs and to repay loans and interest rates. As repaymentsaccumulate, the SRF is able to make more loans using those repayments. The State of California,for example, uses its SRF for nonpoint source purposes. The fund is administered by the StateWater Board, which developed a flexible program to evaluate and select for funding a wide varietyof nonpoint source pollution projects. Eligible projects include construction of demonstrationprojects, retention/detention basins, and a variety of BMPs to reduce or remove pollutants. Thenonpoint source program for the SRF also permits the establishment of substrate revolving fundsthat can provide funding to private individuals to finance new onsite septic systems.
Grants are sums of money awarded to state and local governments or nonprofitorganizations that do not need to be repaid. Grants are awarded for the purpose of financing aparticular activity or facility. EPA grants are federal grants that provide state and localgovernments funding to meet national environmental quality goals. Criteria for receiving grantmoney are established by EPA and must be met before the funds can be used for a specific activityor program. For example, section 6217 of the Coastal Zone Act Reauthorization Amendments of1990 (CZARA) requires states to establish coastal nonpoint source control programs, which mustbe approved by both the National Oceanic and Atmospheric Administration (NOAA) and EPA.Once approved, the programs will be implemented through changes to the state nonpoint sourcepollution program approved and funded by EPA under section 319 of the Clean Water Act andthrough changes to the state coastal zone management program approved by NOAA under section306 of the Coastal Zone Management Act. Section 604(b) of the Clean Water Act requires anallotment of funds to provide grants to states to carry out water quality management planning.Section 314 of the Clean Water Act provides funding for project grants to states for assessing thewater quality of publicly owned lakes, developing lake restoration and protection plans,implementing these plans to restore and preserve the lake, and performing postrestorationmonitoring to determine the longevity and effectiveness of restoration.
Leases
Leases are contracts that allow another person to use land or a building for a specific time,usually in return for repayment. Leasing obligations are not considered debt in most states andvoter approval for financing is not required. Lease-purchase agreements (municipal lease) give theperson holding the property lease, the lessee, the option of applying lease payments to thepurchase of the facility. The lessee is responsible for paying taxes. These agreements can be used tofinance wetland restoration projects or to purchase riparian areas or other environmentallysensitive areas. Sale-leaseback arrangements allow private investors to purchase public facilities orequipment on behalf of the community. Since the investors are entitled to tax benefits, they canlease the property back to the municipality at a lower cost.
Page 2-40

Hydrology
Factors to Consider When Selecting BMPs
Matching Wetland/Stormwater Factors to BMP Design
Preliminary Treatment of Stormwater
The level of treatment needed to protect a wetland that receives urban stormwater isdependent on the type and condition of the wetland; on the quality, quantity, and distribution ofrunoff; and on what levels of impacts to the wetland are considered acceptable. Ideally, allpollutants and sediments not present prior to watershed development should be removed beforethe stormwater is discharged to wetlands; however, some wetland types might be able toassimilate higher levels of certain pollutants. Some regions, such as southern Florida, parts of NewEngland, and the Southwest, have soils with high infiltration rates, and a major concern related tourban stormwater might be the potential contamination of aquifers. Instituting stormwatertreatment might be part of a larger effort to protect or restore wetland and downstreamecosystems and might involve analysis of stormwater dynamics at the watershed level and avariety of actions aimed at runoff quality maintenance or enhancement.
Matching Wetland Characteristics to BMP Design
Wetlands should be characterized with a classification system such as that of Cowardin andothers (1979) prior to introducing additional stormwater or modifying the characteristics ofexisting stormwater inflows with BMPs. The general characteristics of a wetland, used todetermine its placement in a classification system, should be considered when determining thetype and placement of BMPs adjacent to or upstream of a wetland. In addition to consideringgeneral classification characteristics, site-specific evaluations of wetlands should be made. Themodification of existing stormwater characteristics due to development or the type of BMPs usedshould be compatible with the characteristics of the existing wetlands in a system. Table 2-7shows a general comparison of various BMPs and the benefits to protecting wetland functionsthat they might offer. This table is intended to be used as a preliminary screening device toidentify potential wetland protection BMPs to treat stormwater runoff.
In addition to considering wetland type and conditions, the nature of stormwaterdischarges must be evaluated to determine the best practices for protecting urban wetlands. Boththe quantity and quality of urban runoff are significantly affected by watershed development.Increased impervious area, removal of trees and other vegetation, and soil compaction in awatershed can increase runoff volume (Schueler, 1987), altering the natural hydroperiod ofreceiving wetlands. Reduced infiltration of stormwater can reduce baseflow and alter thegroundwater hydrology of some urban wetlands. Known hydrologic impacts to wetlandsassociated with increased stormwater runoff include changes in wetland response time, changesin water levels in the wetland, and changes in the detention time of the wetland. Increasedrunoff volumes are also associated with greater water level fluctuations in receiving wetlands,which can adversely affect wetland plant and animal communities (Azous, 1991; Cooke, 1991).Large amounts of water entering a wetland at once can cause disturbance through changes incirculation and flushing characteristics and through possible erosion of wetland soils.
Page 2-41

Table 2-7. Potential Benefits to Wetland Functions from Various BMps
Protecting Natural Wetlands: A Guide to Stormwater Best Management Practices
Page 2-42

Climate
Factors to Consider When Selecting BMPs
The natural hydrologic characteristics of a wetland are of concern when designingstormwater management systems. In areas where natural wetlands are relatively unimpacted, theexisting hydroperiod of wetlands should be maintained, while in areas where wetlands have beendeprived of water, BMPs can play a role in enhancing wetland ecosystems through restoration of amore natural hydroperiod.
The source of water in a wetland is also important in designing a stormwater managementsystem. In wetlands where the source of hydrology is primarily in the form of surface waterrunoff, the use of BMPs that incorporate infiltration into the soil as the method for stormwatertreatment (e.g., infiltration trenches or infiltration ponds) might change the natural hydroperiodof adjacent or downstream wetlands. As mentioned, changes in the natural hydrologiccharacteristics can adversely affect the structure and functions of these wetlands. Stormwatertreatment systems that treat stormwater by temporary detention or retention (e.g., extendeddetention ponds, wet ponds), when properly designed, can help to restore the predevelopmenthydrologic conditions in this type of wetland. Conversely, the use of detention or retentionsystems adjacent to or upstream of groundwater wetlands can adversely affect their hydroperiodby altering natural baseflow conditions.
Local climatic conditions determine the quantity, frequency and intensity of stormwaterrunoff events. Under natural conditions, development of wetland types and functions is basedlargely on these climatic conditions. In fact, in the United States, climate variation hascontributed to the formation of distinctly different wetland types, and climate is the secondmajor controlling factor that leads to the formation of regional wetland types. Therefore, climaticconditions, precipitation, and storm events all need to be analyzed prior to selecting astormwater pretreatment strategy The placement of BMPs to treat stormwater or to protectexisting wetlands from stormwater impacts can actually harm the systems if the practices are notdesigned based on the local conditions and the natural wetland characteristics. Likewise, theselected BMP type and design should be based on both design storm requirements and adjacentwetland characteristics.
For example, stormwater in the Southwest is similar to that in other areas of the country.Some qualifications would include the following: (1) no major sodium chloride components inrunoff from deicing salts as found in snow zones; (2) an increased dust component; (3) higherfirst-flush pollutant concentrations arising from a longer accumulation time between stormevents; (4) suspended sediment sources masked by a high natural background; and (5) thedesiccation of organic material on the landscape, especially domestic animal feces (Hawkins,1993). Many urban areas in the Southwest lack storm sewers; streets and other land surfaces actas a conduit for stormwater, which enhances street runoff and contact with contaminants(Hawkins, 1993).
Any BMPs that require regular rainfall or a moist climate would not be appropriate forsouthwestern arid land conditions (Hawkins, 1993). Runoff is not frequent, stored stormwater issubject to high evaporation rates, and cover is naturally sparse. Traditional retention-type BMPsare used in the region, however, for peak flow reduction. Most of the water quality BMPs beingproposed for southwestern cities stress dust and soil control, catch basin cleaning, debris removal,street sweeping, hazardous waste disposal, and other similar pollution prevention practices(Hawkins, 1993).
Page 2-43

Water Quality
Monitoring
Protecting Natural Wetlands: A Guide to Stormwater Best Management Practices
Natural nutrient levels within a particular wetland vary widely among wetland types, andthe potential effects of loadings from stormwater must be evaluated with consideration of thetype of receiving wetland. Wetlands can vary in their ability to absorb or transform thesecompounds due to variations in hydrologic, soil, and vegetative characteristics of the wetlands,and they might be only temporary sinks for some compounds. Although nitrogen can be removedfrom wetland soils as nitrogen gas through the process of denitrification, phosphorus can be heldin wetland soils until a wetland’s natural storage capacity is reached, beyond which the wetlandmight no longer function as a sink or might even become a net exporter of phosphorus toreceiving waters (Richardson, 1989).
Pretreatment of stormwater flow prior to its inflow into existing wetlands can help inattenuating fluctuations in nutrient levels. The pretreatment of stormwater through theincorporation of BMPs can also reduce the amount of sediment that enters a wetland. If incomingsediment loads are high, the wetland’s storage capacity could be reduced over time and its abilityto function could be affected (Marble, 1992). While the increased levels of nutrient and sedimentloading to wetlands associated with stormwater can adversely affect wetland functionalcharacteristics, the removal of most or all suspended particulates through the placement of BMPscan also result in wetland degradation. Reductions in the natural levels of sediment deposition ina wetland can result in the embedding of downstream wetland substrates in some wetland typesor in erosion in other types and potentially in erosion and channel scouring in associateddownstream systems. In some systems the resuspension of downstream floodplain sediments canoccur. Natural soil and sediment conditions should be considered in a wetland or wetland systemwhen determining the feasibility, design, and types of BMPs to be used.
One strategy for determining the performance of a BMP - its effect on the wetland’swater quality, health, and functions -is through monitoring. Even though monitoring is beyondthe scope of this manual, it is worthwhile to discuss the fundamentals of a monitoring project.During the BMP planning process, the appropriate level of monitoring should be determined sothat resource requirements can be identified and factored into the overall project. Properplanning targets monitoring efforts at key elements of the project that will indicate the degreeof success and the potential need or opportunity for improvement in a particular system.
A monitoring plan should be developed based on the objectives of the BMP project and ondocumented literature or readily available monitoring results of similar projects (Kusler andKentula, 1990; USEPA, 1992). The wetland functions of concern should be identified and thecurrent level of those functions established relative to reference wetlands. For an existingwetland, functions that might be threatened by stormwater runoff (e.g., sediment retention andlong-term water storage) should be documented. Where stormwater might be used to restore aseverely degraded wetland, the desired functions of the wetland should be evaluated so progresscan be measured.
The first step in any monitoring effort, establishing baseline data, is important inevaluating the long-term effectiveness of the BMP. Obtaining as much information as possibleabout the resource to be protected or restored will allow progress or degradation to be measured.As soon as construction of the BMP is completed, monitoring of the project should begin. For athorough monitoring effort, the boundaries of the watershed in which the BMP was constructed
Page 2-44

Factors to Consider When Selecting BMPs
should be determined and the exact location of the project within that watershed should beindicated on a map. Variables that might be included in a monitoring effort include the following(North Carolina Cooperative Extension Service, 1995; USEPA, 1992a):
l Morphometry (area, slope, and perimeter-to-area ratio)
l Hydrology (water depth, flow rates, flow patterns, and indirect indicators)
. Substrate (soil depth, color, texture, source, organic matter, sediment flux)
l Vegetation (species, coverage, survivorship)
l Fauna (observations, habitat evaluation, species- or community-specific sampling)
l Water quality (pH, DO, temperature, metals, turbidity, TSS, BOD, N, P)
Monitoring strategies might range from simple visual assessments of a wetland to fullevaluations including ambient water quality analyses in the wetland and a BMP inlet/outletefficiency assessment. In some cases, the simple, visual assessments (e.g., looking at thevegetation and hydrologic changes) might be enough monitoring to determine whether the BMPis performing efficiently When this simple monitoring does not provide adequate information,more elaborate analysis is needed.
It is advisable to identify and take into account other existing information that might beavailable, such as meteorological data, data obtained from monitoring conducted under anNPDES or state permit, or volunteer monitoring data. A sampling regime including set (orrandomly selected) sampling sites and specific times to repeat the sampling (e.g., in wet and dryseasons) should be established. A site can be monitored through routine inspections or morecomprehensive, quantitative sampling events. Routine inspections are “spot checks" and areconducted as often as daily or weekly. These assessments allow the investigator to identifyproblems as they develop. Generally routine inspections are less costly and not as damaging tothe wetland or BMP because these inspections are less intrusive (i.e., they require less datacollection and less equipment to obtain the data).
Quantitative sampling events, in comparison, are periodic assessments conducted annuallyfor several years after the BMP is constructed. This type of monitoring indicates the degree towhich the goals of the project have been met (Kusler and Kentula, 1990). Comprehensiveassessments typically require more equipment and skilled personnel and therefore are morecostly and often more damaging to the wetland than are routine inspections.
Reports of monitoring efforts should include photographs of each sampling effort, adescription of the project and project site, an explanation of site preparation, and a summary ofwhat was conducted and the results. These data, once evaluated, will allow for improvements indesign guidelines for future BMP projects.
The data quality of monitoring efforts must be scientifically acceptable. Five qualityassurance components of assessments have been identified: precision of the measurements of thesame variable, accuracy of the measurements, completeness of the collected data versus what wasexpected, representativeness of the variable’s characteristics, and comparability of one data set toanother (Sherman et al., 1991, cited in USEPA, 1992a).
Page 2-45
Summary
Protecting Natural Wetlands: A Guide to Stormwater Best Management Practices
Best management practices used for the treatment of urban stormwater are commonlylocated in low topographic positions adjacent to or within existing wetlands. They can be usedprimarily to treat or pretreat stormwater or to protect existing wetlands from the effects ofstormwater runoff. The above examples represent only a few of the variables that should beconsidered when placing BMPs within or adjacent to wetland systems. When designing BMPs,the treatment of stormwater is not the sole consideration. For BMPs that are incorporated intosystems where wetland protection and optimal stormwater treatment are both objectives, thecharacteristics. of the existing wetlands must also be considered. It is most desirable to considerprotecting wetland resources from a holistic perspective. This can be accomplished through theuse of a variety of nonstructural BMPs including watershed planning, public education, andpreventive construction techniques.
Page 2-46

References
Factors to Consider When Selecting BMPs
Azous, A. 1991. An analysis of urbanization effects on biological communities. Master’s thesis, University ofWashington. Published by the Puget Sound Wetlands and Stormwater Management Program.
Brinson, M.M. 1988 Strategies for assessing the cumulative effects of wetland alteration on water quality.Environmental Management 12(5):655-662.
Canning, D.J. 1988. Urban runoff water quality: Effects and management options. Shorelands Technical AdvisoryPaper no.4, Shorelands and Coastal Management Program, Washington Department of Ecology, Olympia,WA.
Cooke, S.S. 1991. The effects of urban stormwater on wetland vegetation and soils - A long-term ecosystemmonitoring study In Puget Sound Research ‘94, Proceedings, January 4-5, 1991, Seattle, Washington, pp. 43-51.Puget Sound Water Quality Authority
Cooper, D.J. 1989. A citizen’s handbook for wetland protection. U.S. Environmental Protection Agency, Region8, Denver, CO.
Cowardin, L.M., V. Carter, EC. Golet, and E.T. LaRoe. 1979. Classification of wetlands and deepwater habitatsof the United States. Biological Services Program Report FWS/OBS-79/31, U.S. Department of the Interior,Fish and Wildlife Service, Washington DC. Reprinted 1992.
DeVoe, M.R., and D.S. Baughman, eds. 1986. South Carolina coastal wetland impoundments: Ecologicalcharacterization, management, status, and use. Vol. II: Technical synthesis. Publication no. SC-SG-TR-86-2. SouthCarolina Sea Grant Consortium, Charleston, SC.
Driver, N.E., and G.D. Tasker. 1988. Techniques for estimation of storm-runoff loads, volumes, and selectedconstituent concentrations in urban watersheds in the United States. (200)R290 No. 88-191. U.S. Department ofthe Interior, U.S. Geological Survey,
Galli, J., and R.D. Dubose. 1990. Thermal impacts associated with urbanization and stormwater management bestmanagement practices. Prepared by the Metropolitan Washington Council of Governments for the MarylandDepartment of the Environment, Baltimore, MD.
Green, WH., and G.A Ampt. 1911. Studies on soil physics I. Flow of air and water through soils. Journal ofAgricultural Science, vol 4.
Hammer, D. 1992 Creating freshwater wetlands. Lewis Publishers, Chelsea, MI.
Haukos, D.A., and L.M. Smith. 1992. Waterfront management handbook: Ecology of playa lakes. Fish andWildlife Leaflet 13.3.7. U.S. Department of the Interior, Fish and Wildlife Service, Washington, DC.
Hawkins, R.H. 1993. Draft: Reconnaissance review of ‘Best Management Practices for StormwaterDischarges to Natural Wetlands.” The University of Arizona, Tucson, AZ.
Hendrickson, DA., and W.L. Minckley. 1984. Cienegas vanishing climax communities of the AmericanSouthwest. Desert Plants 6(3):131-175.
Hershfield, D.M. 1961. Rainfall frequency atlas of the United States for durations from 40 minutes to 24 hours andreturn periods from 1 to 100 years. Technical Paper 40. U.S. Weather Bureau, Washington, DC.
Hickock, E.A., MC. Hannaman, and M.C. Wenck. 1977. Urban runoff treatment methods: Vol. I. Non-structuralwetland treatment. EPA 600/2-77-217. U.S. Environmental Protection Agency, in cooperation with MinnehahaCreek Watershed District.
Page 2-47

Protecting Natural Wetlands: A Guide to Stormwater Best Management Practices
Hutchinson, C.F., P. Warshall, E.J. Arnould, and J. Kindler. 1992. Development in arid lands. Environment34(6):16-43.
Kadlec, R.H., and R.L. Knight. 1996. Treatment wetlands. Lewis Publishers, Boca Raton, FL.
Kusler, J.A., and M.E. Kentula, eds. 1990. Wetland creation and restoration: The status of the science. Island Press,Washington, DC.
Maidment, P.R., ed. 1993. Handbook of hydrology. McGraw-Hill, Inc., New York, NY
Marble, A.D. 1992. A guide to wetland functional design. Lewis Publishers, Boca Raton, FL.
MDDNR. 1991. A guide for developing nontidal wetlands watershed management plans in Maryland. MarylandDepartment of Natural Resources, Water Resources Administration, Annapolis, MD.
Mitsch, W.J., and J.C. Gosslink 1986. Wetlands. Van Nostrand Reinhold Co., New York, NY.
Mitsch, W.J., and J.G. Gosselink 1993. Wetlands. 2nd ed. Van Nostrand Reinhold, New York, NY.
National Research Council. 1994. Ground water recharge using waters of impaired quality. ISBN 0309-05142-E.Commission on Geosciences, Environment, and Resources. Washington, DC.
North Carolina Cooperative Extension Service. 1995. Section 319 National Monitoring Program: An overview.North Carolina State University College of Agriculture & Life Sciences.
Novotny, V., and C. Chesters. 1981. Handbook of nonpoint pollution; sources and management. Van NostrandReinhold Co., New York, NY
Iverson. 1982. Contaminant levels in precipitation and urban surface runoff. Water Resources Bulletin18(5) :863-869.
Pilgrim, D.H., and I. Cordery. 1993. Flood runoff. In Handbook of Hydrology, ed. D.R. Maidment. McGrawHill, Inc., New York, NY.
PSWOA. 1990. Protecting fish and wildlife habitat in Pugct Sound. Puget Sound Water Quality Authority,Seattle, WA.
Rasmussen, E.M., R.E. Dickinson, J.E. Kutzbach, and M.K. Cleveland. 1993. Climatology. In Handbook ofHydrology, ed. D.R. Maidment. McGraw Hill, Inc., New York, NY.
Richardson, C.J. 1989. Wetlands as transformers, filters and sinks for nutrients. In Freshwater wetlands:Perspectives on natural, managed and degraded ecosystems. University of Georgia, Savannah River EcologyLaboratory, Ninth Symposium, Charleston, SC.
Schueler, T.R. 1987. Controlling urban runoff A practical manual for planning and designing urban BMP’s.Metropolitan Washington Council of Governments, Washington, DC.
Schueler, T.R., P.A. Kumble, and MA. Harity. 1992. A current assessment of urban best management practices:Techniques for reducing non-point source pollution in the coastal zone. Prepared for the U.S. EnvironmentalProtection Agency, Office of Wetlands, Oceans, and Watersheds. Technical guidance to implement section6217(g) of the Coastal Zone Management Act.
Segelquist, C.A., W.L. Slauson, M.L. Scott, and G.T Auble. 1990. Synthesis of soil plant correspondence datafrom twelve wetland studies throughout the United States. FWS Biological Report 90(19). U.S. Fish and WildlifeService, National Ecology Research Center, Fort Collins, CO.
Page 2-48

Factors to Consider When Selecting BMPs
Shahane, A.N. 1982. Estimation of pre- and post-development nonpoint water quality loadings. WaterResources Bulletin 18(2):231-237.
Sherman, A.D., S.E. Gwin, and M.E. Kentula, in conjunction with WA. Niering. 1991. Quality assuranceproject plan: Connecticut Wetlands Study. EPA 600/3-91/029. U.S. Environmental Protection Agency,Environmental Research Laboratory, Corvallis, Oregon. Cited in USEPA, 1992a.
Smith, H., and E.D. Matthews. 1975. Soil survey of Harford County area, Maryland. U.S. Department ofAgriculture, Soil Conservation Service, in cooperation with the Maryland Agricultural Experiment Station,Washington, DC.
South Carolina Coastal Council. 1988. Stormwater management guidelines. South Carolina Coastal Council.
Stockdale, E.C. 1991. Freshwater wetlands, urban stormwater, and nonpoint source pollution control: A literaturereview and annotated bibliography. Washington State Department of Ecology, Olympia, WA.
Sweeten, J.M., and S.W. Melvin. 1985. Controlling water pollution from nonpoint source livestock operations.
Urbonas, B., and L.A. Roesner. 1993. Hydrologic design for urban drainage. In Handbook of Hydrology, ed.D.R. Maidment. McGraw Hill, Inc., New York, NY
Urbonas, B., and P. Stahre. 1993. Stormwater best management practices and detention for water quality, drainage,and CSO management. Prentice Hall, Englewood Cliffs, NJ.
USDA-SCS. 1992. Wetland restoration. Chapter 13, Engineering field handbook. U.S. Department ofAgriculture, Soil Conservation Service, Washington, DC.
USDA-SCS. 1986. Urban hydrology for small watersheds. Technical Release 55. U.S. Department ofAgriculture, Soil Conservation Service, Engineering Division, Washington, DC.
USEPA. 1983. Results of the Nationwide Urban Runoff Program: vol. 4. Final Report. NTIS: PB84-185552. U.S.Environmental Protection Agency, Water Planning Division, Washington, DC.
USEPA. 1992a. An approach to approving decision making in wetland restoration and creation. EPA/600/R-92/150. U.S. Environmental Protection Agency, Washington, DC.
USEPA. 1992b. Storm water management for industrial activities. EPA 832-R-92-006. U.S. EnvironmentalProtection Agency, Office of Water, Washington, DC.
USEPA. 1992c. Protecting coastal and wetland resources. EPA 842-R-92-002. U.S. Environmental ProtectionAgency, Office of Water, Washington, DC.
USEPA. 1993. Guidance specifying management measures for sources of nonpoint pollution in coastal waters. EPA840-B-92-002. U.S. Environmental Protection Agency, Office of Water, Washington, DC.
USEPA. 1994. A state and local government guide to environmental program funding alternatives. EPA 841-K-94-001. US Environmental Protection Agency, Office of Water, Washington, DC.
USEPA. 1995. Storm water discharges potentially addressed by phase II of the National Pollutant DischargeElimination System storm water program: Report to Congress. EPA 833-K-94-002. U.S. Environmental ProtectionAgency, Office of Water, Washington, DC.
Washington State Department of Ecology. 1991. Stormwater management manual for the Puget Sound Basin.Public review draft. Document no. 90-73. Prepared by the Washington State Department of Ecology,Olympia, WA.
Page 2-49

Protecting Natural Wetlands: A Guide to Stormwater Best Management Practices
Washington State Department of Ecology. 1992. Stormwater program guidance manual. Vol. II. Prepared by theWashington State Department of Ecology, Olympia, WA.
Woodward-Clyde Consultants. 1990. Urban targeting and BMP selection, an information and guidance manualfor state nonpoint source program staff engineers and managers. Prepared for the U.S. Environmental ProtectionAgency, Region 5, Water Division, Chicago, IL, and the Office of Water Regulations and Standards,Washington, DC.
Page 2-50

Case Study-BMP Fact sheet Correlation
Case Studies
Section 3Case Studies
o illustrate how BMPs have been incorporated with wetlands into urban stormwatermanagement systems, several case studies are presented. The purpose of the case studiesis to illustrate measures that can be taken to prevent adverse impacts to wetlands from
stormwater runoff. In most of the case studies, wetlands were incorporated into thermwater management system for the site. Generally, some type of treatment was provided to
reduce pollutants in the stormwater before its discharge to natural wetlands. Available waterquality data are presented, as well as information regarding habitat change. The case studies arepresented by EPA Region, and by wetland type and BMP applicability. The following listcorrelates BMPs used in the case studies to applicable BMP fact sheets inSection 4.
EPA Region 1
Narrow River Special Area Management Plan
Watershed Management Plans (See BMP Fact Sheet p. 4-8)Preventive Construction Techniques (See BMP Fact Sheet p. 4-12)Grassed Swales (See BMP Fact Sheetp. 4-32)Extended Detention Dry-Basins (See BMP Fact Sheet p. 4-43)
EPA Region 2
Freshwater Wetlands Protection Act
Extended Detention Dry Basins (See BMP Fact Sheet p. 4-43)Contour TerracesGrassed Swales (See BMP Fact Sheet p. 4-32)Watershed Management Plans (See BMP Fact Sheet p. 4-8)Riparian Areas (See BMP Fact Sheet p. 4-18)Outreach and Educational Programs (See BMP Fact Sheet p. 4-13)Pollution Prevention (See BMP Fact Sheet p. 4-2)
Page 3-1

Protecting Natural Wetlands: A Guide to Stormwater Best Management Practices
EPA Region 3
Watershed Management Study
Watershed Management Plans (See BMP Fact Sheet p. 4-8)Vegetated Natural Buffers (See BMP Fact Sheet p. 4-38)Wet Ponds (See BMP Fact Sheet p. 4-47)Road Culvert RetrofitRiparian Areas (See BMP Fact Sheet p. 4-18)
EPA Region 4
Hidden River Wetland Stormwater Treatment Site
Vegetated Natural Buffers (See BMP Fact Sheet p. 4-38)Construction Sedimentation BasinsGrassed Swales (See BMP Fact Sheet p. 4-32)
EPA Region 5
Lake McCarrons Wetland Treatment System
Construction Sedimentation PondLevel Spreaders (See BMP Fact Sheet p. 4-61)Watershed Management Plans (See BMP Fact Sheet p. 4-8)Constructed Wetlands (See BMP Fact Sheet p. 4-50)
The Phalen Chain of Lakes Watershed Partnership
Watershed Management Plans (See BMP Fact Sheet p. 4-8)Outreach and Educational Programs (See BMP Fact Sheet p. 4-13)Grassed Swales (See BMP Fact Sheet p. 4-32)Open Spaces (See BMP Fact Sheet p. 4-41)Constructed Wetlands (See BMP Fact Sheet p. 4-50)Vegetated Natural Buffers (See BMP Fact Sheet p. 4-38)
The Prairie Wolf Slough Project
Watershed Management Plans (See BMP Fact Sheet p. 4-8)Outreach and Educational Programs (See BMP Fact Sheet p. 4-13)Constructed Wetlands (See BMP Fact Sheet p. 450)Open Spaces (See BMP Fact Sheet p. 4-41)
EPA Region 6
Tensas Cooperative River Basin Study
Watershed Management Plans (See BMP Fact Sheet p. 4-8)Vegetated Filter Strips (See BMP Fact Sheet p. 4-35)Grassed Swales (See BMP Fact Sheet p. 4-32)
Page 3-2

Case Studies
Water and Sediment Control BasinsVegetated Natural Buffers (See BMP Fact Sheet p. 4-38)Pollution Prevention (See BMP Fact Sheet p. 4-2)Constructed Wetlands (See BMP Fact Sheet p. 4-50)
EPA Region 7
Multi-Species Riparian Buffer Strips, Bear Creek Watershed
Vegetated Natural Buffers (See BMP Fact Sheet p. 4-38)Vegetated Filter Strips (See BMP Fact Sheet p. 4-35)Watershed Management Plans (See BMP Fact Sheet p. 4-8)Pollution Prevention (See BMP Fact Sheet p. 4-2)Riparian Areas (See BMP Fact Sheet p. 4-18)Constructed Wetlands (See BMP Fact Sheet p. 4-50)
EPA Region 8
A Watershed Approach to Municipal Stormwater Management
Outreach and Educational Programs (See BMP Fact Sheet p. 4-13)Watershed Management Plans (See BMP Fact Sheet p. 4-8)Riparian Areas (See BMP Fact Sheet p. 4-18)Grassed Swales (See BMP Fact Sheet p. 4-32)Infiltration Basins (See BMP Fact Sheet p. 4-20)Constructed Wetlands (See BMP Fact Sheet p. 4-50)Vegetated Natural Buffers (See BMP Fact Sheet p. 4-38)Vegetated Filter Strips (See BMP Fact Sheet p. 4-35)Pollution Prevention (See BMP Fact Sheet p. 4-2)
Lemna Nonpoint Source Treatment System
Wet Ponds (See BMP Fact Sheet p. 4-47)Watershed Management Plans (See BMP Fact Sheet p. 4-8)Constructed Wetlands (See BMP Fact Sheet p. 4-50)
EPA Region 9
Lincoln-Alvarado Project
Oil/Grit Separators (See BMP Fact Sheet p. 4-58)Vegetated Filter Strips (See BMP Fact Sheet p. 4-35)
EPA Region 10
Sawmill Creek
Riparian Areas (See BMP Fact Sheet p. 4-18)Vegetated Natural Buffers (See BMP Fact Sheet p. 4-38)
Page 3-3

Protecting Natural Wetlands: A Guide to Stormwater Best Management Practices
Watershed Management Plans (See BMP Fact Sheet p. 4-8)Fencing of Riparian PastureUpland Water Troughs for LivestockPlanting of Willow Cuttings
Sublett Creek Restoration Project
Watershed Management Plans (See BMP Fact Sheet p. 4-8)Riparian Areas (See BMP Fact Sheet p. 4-18)Grazing Allotment Management Plan (AMP)Planting of Willow CuttingsDrift FencesLog DamsUpland Water Troughs for Livestock
Bear Creek Restoration Project
Sedimentation BasinsWatershed Management Plans (See BMP Fact Sheet p. 4-8)Riparian Areas (See BMP Fact Sheet p. 4-18)Fencing Riparian PastureRiprapUpland Spring Sites for Livestock
Camp Creek Restoration
Watershed Management Plans (See BMP Fact Sheet p. 4-8)Riparian Areas (See BMP Fact Sheet p. 4-18)Sedimentation BasinsFencing Riparian PasturePlanting of Willow CuttingsRiprapLow-rock Structures and GabionsOutreach and Educational Programs (See BMP Fact Sheet p. 4-13)
The Chewaucan River
Watershed Management Plans (See BMP Fact Sheet p. 4-8)Riparian Areas (See BMP Fact Sheet p. 4-18)RiprapSnag RemovalFencing Riparian PasturePlanting of Willow CuttingsExclusion of Cattle Grazing
Page 3-4

Case Studies
Regional Case Studies
EPA Region 1
Narrow River Special Area Management Plan, Rhode IslandThe Narrow (Pettaquamscutt) River watershed is located in southern Rhode Island in the
towns of North Kingstown, South Kingstown, and Narragansett. The watershed drains intosouthwestern Narragansett Bay and encompasses several unique water bodies (Figure 3-l).
Figure 3-1. Location of the Narrow River watershed study area in the State of Rhode Island.
Page 3-5

Protecting Natural Wetlands: A Guide to Stormwater Best Management Practices
Known use of the river and its resources extends back to at least 3,000 years ago whenNative Americans hunted and gathered along the river. Other uses of the river have included shipbuilding, agriculture, dairy farming, summer housing, and permanent homes. The Narrow Riverwatershed is rich in recreational resources such as boating, camping, hiking, fishing, swimming,and birdwatching, and the river valley is considered one of Rhode Island’s most scenic areas.
Wildlife inhabit Narrow River and its watershed for breeding, nesting, spawning grounds,and migratory bird routes. Several threatened and endangered species, including species of marshgrass, osprey, Least Tern, sea cucumber, moonfish, luminescent moss, and several fern species areknown to inhabit the area.
Coastal wetlands in Rhode Island have been altered and destroyed by developmentactivities, which impact wetlands by filling, removing vegetation, grading, dredging, excavating,draining, damming, and diverting the hydrologic flows into the wetlands. Alteration of theadjacent land areas has affected local drainage patterns, thereby altering the sedimentationprocesses and salinities of waters that enter wetlands. Building practices, human encroachment,and other development pressures have caused water quality degradation, impacted critical habitatareas, reduced public access, and spoiled aesthetic values throughout the watershed.
In response to coastal wetlands loss, the Rhode Island Coastal Resources ManagementCouncil (CRMC) has set goals to protect, preserve, and where possible restore coastal wetlands.CRMC supports a policy of “no net loss” of coastal wetland acreage and functions and requires a2:1 mitigation ratio of replacement or creation of coastal wetland to areas permanently altered orlost. (Wetlands created for stormwater management, erosion control, or waste management areexempt from mitigation requirements.)
Past management efforts to protect the Narrow River and its watershed were undertaken bythe Narrow River Preservation Association (NRPA), the Narrow River Watershed AdvisoryCouncil, and the Narrow River Land Trust. NRPA, founded in 1970, initiated the first planningstudy of the watershed, which resulted in a report describing the development trends and impactsto the river, and made recommendations for development control. The Narrow River WatershedAdvisory Council, formed in 1981, was a group of representatives from North Kingstown, SouthKingstown, and Narragansett, whose objective was to promote the protection of the watershed’svalues. The Council appointed the Narrow River Watershed Advisory Committee, whichdeveloped a watershed program, recommended policies, and collected and analyzed resource data.The Narrow River Land Trust, created in 1983, is a nonprofit organization that obtains propertyand property rights for protection of natural resources.
Special Area Management plans (SAMPs) have been developed at the local and nationallevels as management strategies for environmental planning. SAMPs focus the legislative andregulatory powers of the CRMC to the specific problems of the designated resource. The effort tocreate a SAMP for the Narrow River watershed began in September 1985 as an adaptation of theSAMP that existed for the salt pond region of southern Rhode Island. It resulted from the generalbelief that activities in the Narrow River’s watershed needed stronger management.
One of the first steps in designing the plan was to create a comprehensive characterizationof the watershed. Available research conducted by consulting firms, students, scientists from theUniversity of Rhode Island, and state agencies and town records were reviewed to determine pastand present problems in the watershed and to develop management strategies and initiatives toaddress those problems.
Page 3-6

Case Studies
At the beginning of the planning process, September 24,1985, CRMC imposed a buildingmoratorium on all development applications within an area 200 ft (60.96 m) inland of mean highwater, or the inland edge of a wetland, bluff, river bank, or other coastal feature. The moratoriumalso applied to all CRMC permits required by facilities requiring a parking area (at least 1 acre insize) and by subdivisions of six units or more. Applications submitted after the end of themoratorium, December 31,1986, were subject to the guidelines and regulations set forth in theSAM plan.
The focus of the SAM plan was to address several problems that had not been adequatelyaddressed in past management efforts: degradation in water quality, development pressures andhuman encroachment into areas unsuitable for building, potential loss of wildlife species andhabitat, and loss of aesthetic values. The SAM plan for the Narrow River watershed regulates thefollowing:
l Land classification for watershed protection
l Watershed controls for stormwater management
l Watershed controls for septic system management
l Watershed controls for erosion and sedimentation
l Lands requiring special considerations (historic/archaeological value)
l Petroleum tanks and oil spills
l Community participation
l Future research efforts
Stormwater management is highlighted here because the SAM plan regulates stormwater asa means to protect wetlands. The plan defines stormwater management as the quantitativecontrol of increased volume or rate of runoff and the qualitative control of runoff through asystem of vegetative and structural measures to prevent pollutants from being transported inrunoff.
Stormwater management is required for all new residential developments six units or more,all facilities and activities requiring 20,000 ft2 (1,800 m2) or more of impermeable surface area orresulting in 20 percent or more of the project area being impervious, and all roadway constructionand upgrade projects. Stormwater management is also required for activities that will involvealteration, maintenance, or improvement to an existing stormwater management structure thatwill alter the quality, rate, volume, or location of surface water discharge.
CRMC requires the stormwater management plan to include information on existingconditions as well as predicted conditions after the activity is implemented. A stormwatermanagement plan must include maps, charts, graphs, tables, photographs, descriptions, and othersupporting documentation.
The stormwater management plan must provide evidence that structures were planned anddesigned and will be constructed to ensure that postdevelopment runoff, hydrodynamiccharacteristics of the watershed and groundwater, and wetland functions and values are the sameas predevelopment conditions. Postdevelopment conditions must also prevent increased flooding,damage, and saltwater intrusion; must protect natural fluctuating levels of salinity in estuarine
Page 3-7

EPA Region 2
Protecting Natural Wetlands: A Guide to Stormwater Best Management Practices
areas; and must minimize alterations to flora, fauna, and habitat that could result from improperconstruction, design, and location of the structures.
Design, construction, and maintenance of stormwater systems may not allow the directdischarge of runoff into Narrow River and its tributaries. CRMC also prohibits increasing thevolume or rate of runoff or further degrading the quality of existing discharges. Discharges mustbe routed through vegetated swales or other structural or nonstructural systems that increase timeof concentration, decrease velocity, increase infiltration, allow suspended solids to settle, andremove pollutants. These systems should use overland flow and reinfiltration as priority tech-niques for the treatment of runoff. Detention and retention ponds may not be located in areasthat might cause groundwater contamination.
Stormwater management is only one component of the SAM plan, and CRMC recognizesthat future management improvements and further research efforts are needed to protect thenatural resources of the Narrow River watershed. CRMC has recommended the following areasfor further research:
l Monitoring of the river’s water quality
l Development of a hydrodynamic model of the estuary
l Analysis of bottom sediment (distribution, composition, and transport dynamics)
l Studies of water quality in the northern regions of the watershed
l Determination of the current status of the quality and quantity of groundwater resources
l Initiation of water quality testing in the freshwater systems in the northern regions ofthe watershed
l The state and towns collectively undertaking stormwater management techniques toupgrade or create programs
Reference/Additional Information
Howard-Strobel, M.M., T.G. Simpson, and T.P. Dillingham. 1989. The Narrow River special area management
plan. Coastal Resources Management Council, Wakefield, RI.
Olsen, S., and G.L. Seavey 1993. The State of Rhode Island Coastal Resources Management Program as amended.
Coastal Resources Management Council, Wakefield, RI.
Freshwater Wetlands Protection Act, State of New JerseyThe protection of wetlands has long been a priority in the State of New Jersey, (NJDEP
1995). To protect these vital areas, the New Jersey legislature passed the Wet lands Act in 1970 andthe Freshwater Wetlands Protection Act in 1987. These acts and their corresponding regulationsrequire approval by the New Jersey Department of Environmental Protection (NJDEP) for anumber of proposed activities that could impact wetlands (both freshwater and saltwater). Thisdiscussion focuses on New Jersey’s Freshwater Wetlands Protection Act and its subsequent rulesregarding stormwater facilities.
Page 3-8

Case Studies
Wetlands receive the same protection granted surface waters under the state’s water qualitystandards (N.J.A.C. 13:9B-13 and N.J.A.C. 7:7A-35(a)4). In addition to restrictions protecting thewetlands themselves, restrictions placed on areas surrounding the wetlands offer furtherprotection for freshwater wetlands. These areas are designated “transition areas” in the state’sFreshwater Wetlands Protection Act Rules (N.J.A.C. 7:7A-6.1). The Freshwater WetlandsProtection Act requires a transition area adjacent to wetlands of “exceptional” or “intermediate”resource value. Freshwater wetlands of “ordinary” resource value, which constitute approximately5 percent of New Jersey’s wetland area, do not require a transition area.
The standard width of the transition area adjacent to a freshwater wetland of intermediateresource value is 50 ft (15.24 m) and for freshwater wetlands of exceptional value is 150 ft (45.72m). Wetlands of exceptional resource value require an individual permit, and mitigation must beprovided. Further, applicants for activities proposed in wetlands of exceptional resource valuemust demonstrate either that there is a compelling public need for the proposed activity which isgreater than the need to protect the wetland or that denial of the permit would imposeextraordinary hardship.
As defined in the Freshwater Wetlands Protection Act Rules, freshwater wetlands ofexceptional resource value are those which exhibit any of the following characteristics:
l Those which discharge into FW-1 waters or FW-2 trout production waters or theirtributaries (FW-1 and FW-2 are water-quality rankings for fresh surface waters in NewJersey) or
l Those which are present habitats for threatened or endangered species, or those which aredocumented habitats for threatened or endangered species, and which remain suitable forbreeding, resting, or feeding by these species during the normal period when these specieswould use the habitat.
Freshwater wetlands of ordinary resource value are those which (1) do not exhibit thecharacteristics above, (2) are isolated wetlands that are more than 50 percent surrounded bydevelopment, and (3) are less than 5,000 ft2 (450 m2) in size including but not limited to drainageditches, swales, and detention facilities. Freshwater wetlands of intermediate resource value arethose which are not defined as either exceptional or ordinary
The Freshwater Wetlands Protection Act Rules also have requirements related topretreatment practices for the protection of wetlands (N.J.A.C. 7:7A-9.2(a) 11, v, ix, and x.)Under the state’s general permit requirements, pretreatment of stormwater is required forstormwater flows entering natural wetlands regardless of resource value. All stormwaterdischarged into a freshwater wetland from a stormwater outfall must first be filtered or otherwisetreated outside the freshwater wetland (NJDEPE, 1992). Detention basins, contour terraces, andgrassed swales are examples of predischarge techniques that may be required by the NJDEP Thegeneral permit does not authorize placement of detention facilities in freshwater wetlands andrequires compensation for disturbance within the wetland transition area (see Figure 3-2). Otherstormwater facility design restrictions include the following:
l The total amount of riprap or any other material used for energy dissipation at the end ofthe headwall placed in the freshwater wetland cannot exceed 10 cubic yards per outfallstructure.
l Excavated areas for the placement of conveyance pipes must be returned to thepreexisting elevation using the original topsoil to backfill from a depth of 18 in (45.72cm) to the original grade and must be revegetated with indigenous wetland species.
Page 3-9

Protecting Natural Wetlands: A Guide to Stormwater Best Management Practices
Transition Area Compensation
TransitionReduction
NJDEP, 1995.
The square footage In the compensationarea is equal to that of the reduction area.
Figure 3-2. Example of a transition area reduction and compensation.
l Pipes used for stormwater conveyance through the wetlands must be designed not toexceed the preexisting elevation and properly sealed with anti-seep collars at a spacingsufficient to prevent drainage of the surrounding wetlands.
l If a detention basin is being proposed as the method of pretreatment for water qualityrouting calculations must show that the basin has been designed for the l-year stormevent according to the New Jersey Stormwater Management Regulations (N.J.A.C. 7:8).
l If a swale is being proposed to convey stormwater through the wetlands, profiles fromthe outlet to the receiving water body, cross-sections, and design support informationmust show that the proposed swale will not result in drainage of the wetlands. Swales inwetlands are permitted only where onsite conditions prohibit the construction of aburied pipe to convey stormwater to an outfall.
The NJDEP works with property owners on a case-by-case basis to determine the mostappropriate stormwater treatment method to protect wetlands from both physical disturbanceand potential impacts from stormwater discharges. Where new development is proposed adjacentto freshwater wetlands and preliminary treatment of stormwater is required to meet state waterquality standards, NJDEP staff make the final decisions on the location and design of each BMP.
Page 3-10

Case Studies
References/Additional Information:
NJDEP. 1995. New Jersey Coastal Nonpoint Pollution Control Program: A plan prepared in satisfaction of section62147 of the Coastal Zone Act Reauthorization Amendments of 1990. Draft. New Jersey Department ofEnvironmental Protection. April.
NJDEPE. 1992. Freshwater Wetlands Protection Act Rules N.J.A.C. 7:7A (amended March 16, 1994. New JerseyDepartment of Environmental Protection and Energy
EPA Region 3
Watershed Management Study, Prince William County, VirginiaThree watersheds in Prince William County, Virginia, are the subject of a 5-year
interdisciplinary, intergovernmental (federal-state-local) watershed management study (seeFigure 3-3). The study includes the protection of wetlands through the use of a variety of BMPsand the restoration of degraded riparian wetlands following the installation of upstream controls.The purpose of the project is to develop an innovative stormwater management plan and severaldemonstration projects that take a watershed approach to environmentally sensitive decisionmaking. The headwaters of the three watersheds being studied are located in the Piedmontphysiographic province, cross the fall line, and drain into the tidal portion of the Potomac RiverEstuary within the Mid-Atlantic Coastal Plain. The area of study within the watersheds consistsentirely of the portions to the west of Interstate 95 in the Piedmont province.
The northernmost watershed, Neabsco Creek (13,047 acres or 5,284 hectares), experiencedsubstantial urban/suburban development before stormwater and nonpoint source controlsbecame a requirement. The large planned community of Dale City is located in the Neabsco Creekwatershed, as is the Potomac Mills shopping complex. The center watershed, Powells Creek(11,762 acres or 4,764 hectares), is predominantly rural, forested land that is experiencingdevelopment pressure. The southernmost watershed, Quantico Creek (24,636 acres or 9,978hectares), the majority of which is currently owned by the National Park Service and the U.S.Marine Corps, is largely undeveloped and is likely to remain so.
All of the watersheds were extensively logged beginning in colonial times, and loggingcontinued periodically through the 19th century In addition, the Quantico Creek watershed wasthe site of both agricultural activities and active pyrite mining for sulfur into the 20th centuryNonetheless, the habitat quality of the streams and wetlands is high throughout the upperwatershed and therefore the Quantico Creek watershed has the potential to be used as a controlsite during the study The intention is for the Quantico Creek watershed riparian and wetlandhabitats to serve as benchmarks for habitat quality goals established for the Neabsco Creek andPowells Creek watersheds. Stream rapid bioassessments have been conducted in all three of thewatersheds, allowing comparisons of current habitat conditions. Water quality and quantitymonitoring is also being conducted along all three streams.
Riparian floodplain forests located along the Piedmont streams are the dominant nontidalwetland type that has been identified in the study area to date. National Wetlands Inventorymaps indicate temporarily flooded (PFOlA) and seasonally flooded (PFOlC) palustrine forestedwetland communities. Because much of the land was in agriculture relatively recently (farminggenerally ceased between 25 and 60 years ago), the forests range from successional to maturecommunities dominated by red maple (Acer rubrum), sycamore (Platanus occidentalis), and pin oak
Page 3-11

Protecting Natural Wetlands: A Guide to Stormwater Best Management Practices
Page 3-12

Case Studies
(Quercus palustris). Common understory species include musclewood (Carpinus caroliniana),spicebush (Lindera benzoin), Japanese honeysuckle (Lonicera japonica), and greenbriar (Similaxrotundifolia). Emergent wetland communities that have become established in impounded areas,such as old farm ponds and some stormwater basins, include cattail (Typha latifolia), smooth alder(Alnus serrulata), soft rush (Juncus effusus), and wool grass (Scirpus cyperinus).
A federal interagency team consisting of the U.S Army Corps of Engineers (Corps), the U.S.Fish and Wildlife Service (USFWS), and the U.S. Environmental Protection Agency (EPA)conducted preliminary wetland assessments in 1992 for portions of the Powells Creek andNeabsco Creek watersheds. The team focused its assessment on forested wetlands and relied on acombination of the Army Corps of Engineers’ Wetland Evaluation Technique (WET II) and bestprofessional judgment. Results of the assessment indicated that floodplain forests in bothwatersheds have high effectiveness and good potential for floodplain storage, sediment retention,and nutrient removal functions. Opportunity for these functions to be performed is greater in theintensely developed Neabsco Creek watershed. Because of the extensive development, thewetlands in the Neabsco Creek watershed are smaller and more fragmented than those in theadjacent, relatively undeveloped Powells Creek watershed. The riparian areas and floodplainwetlands along Powells Creek are larger and more contiguous, providing greater overall wildlifehabitat functions.
The assessment also indicated that deep stream entrenchment caused by increasedfrequency, duration, and intensity of stormwater flows in the Neabsco Creek watershed appearedto be affecting the hydrology of adjacent wetlands. Ironically, despite this degradation, theNeabsco Creek wetlands were determined to have high educational and recreational value becauseof their proximity to population centers. The U.S. Fish and Wildlife Service, in cooperation withthe Prince William County Public Works Department, is working on several stream/wetlandrestoration projects along Neabsco Creek.
The structural stormwater management facilities being evaluated as part of the studyinclude onsite and regional BMPs. Nonstructural BMPs include riparian buffers and streamrestoration techniques. Several of these practices are currently protecting downstream wetlandsfrom the impacts of urban stormwater discharges.
A regional wet pond is located immediately upstream from a substantial riparianwetland area along Neabsco Creek adjacent to a shopping center. The BMP pond, whichcontrols a drainage area of approximately 300 acres (122 hectares), is intended to protectthe downstream wetlands from erosive velocities and to improve water quality Arestoration plan has been prepared for approximately 1 mi (1.6 km) of stream channel, 6acres (2.4 hectares) of associated riparian forest, and 20 acres (8.1 hectares) of emergentwetland habitat, which are located immediately downstream of the regional BMP pond.
A "road culvert retrofit BMP” that essentially functions as an extended detention BMPfacility has been established on an unnamed tributary on Neabsco Creek. The upstreamdrainage area is more than 200 acres (81 hectares) and is intensely developed withresidential and commercial land uses. The immediate area includes a shopping centerlocated adjacent to the stream upstream of the culvert. A riser was initially constructedupstream of a wing wall (concrete apron) built in front of the existing road culvert (seeFigure 3-4). The design is being modified to incorporate a small permanent pool behindthe wing wall and the use of a hydraulic jump to provide the outlet for the 2-year stormrather than the use of the riser. The design modifications were necessary because during
Page 3-13

Protecting Natural Wetlands: A Guide to Stormwater Best Management Practices
Existing Road Culvert
BMP Riser
Low Flow Channel
Prince William County, 1994.
Figure 3-4. Isometric view of the Neabsco Creek tributary road culvert retrofit BMP.
the winter of 1994 the riser became clogged with debris and local officials perceived theponded area to be too large.
The road culvert retrofit BMP works by ponding the more frequent storms, which causesediment-laden water to overflow the stream banks in the backwater area and deposit itssolids load in the riparian floodplain. This BMP protects downstream riparian wetlandsfrom the erosive peak velocities and durations associated with frequently occurringstorm events. The specific water quality benefits of the BMP are being studied as part ofthe comprehensive 5year watershed program. Automatic sampling and flow-gaugingequipment has been installed and is providing data on hydrology and pollutant transport.The water quality monitoring information that will be collected and analyzed by theVirginia Polytechnic Institute and State University (Virginia Tech) includes:
Flow
Nutrients: total phosphorus, soluble reactive phosphorus, soluble aluminum, totalKjeldahl nitrogen, and oxidized nitrogen
Dissolved oxygen, pH, conductivity, alkalinity and hardness
Trace metals
Biochemical oxygen demand and chemical oxygen demand
Total suspended solids
Total organic carbon
Page 3-14

Case Studies
Prince William County intends to install additional road culvert retrofit BMPs in otherareas of the county during the program. Watersheds of about 80 acres (32 hectares) are beingtargeted for these BMPs. The BMPs will allow the floodplain forests that are inundated to realizethe high potential effectiveness for sediment retention and nutrient removal functions identifiedby the WET II/BPJ analysis described above. Another potential benefit of this innovative BMP isto minimize the impact on wetlands. If provided in series throughout a watershed, these BMPshave the potential to provide substantial water quality improvements and possible wetlandprotection with a minimum of disruption to the natural ecosystem (i.e., displacement of naturalwetlands by large stormwater management ponds).
Riparian wetland areas have been identified and delineated in the Powells Creek watershed.BMPs designed for the improvement of water quality and the protection of riparian wetlandshave been planned and installed to protect some of these wetland areas. These include numerousonsite BMP ponds in residential and commercial developments throughout the watershed, aregional pond currently in design, stream restoration plans, and two farm pond retrofit projects.
The multiple stakeholders, the interdisciplinary approach, and the long-term aspects of theprogram are unique. The comprehensive approach being taken in the project contains elementsthat cut across traditional federal and local roles. For example, program elements include floodprotection, stormwater management, erosion and sediment control, wetland preservation, waterquality and terrestrial as well as aquatic habitat quality. Prince William County is funding morethan 50 percent of the project. The U.S. Geological Survey (USGS) is involved in the streamgauging and water quality monitoring components of the project. In addition to the USGS, theCorps, the USFWS, and EPA are providing federal agency involvement and funding to varyingdegrees. The Virginia Department of Environmental Quality and the Chesapeake Bay LocalAssistance Department (a state agency that implements Virginia’s Chesapeake Bay PreservationAct) are providing funding and/or monitoring and other technical support. Two state universities,George Mason and Virginia Tech, are providing technical support in the form of bioassessmentsand water quality monitoring, respectively
Initial data collection for the project will continue through 1997. An environmental historyof the watersheds will be compiled using baseline water quality monitoring data, land useinformation, and an evaluation of data collected on terrestrial and aquatic resources. Traditionaland innovative BMPs for stormwater and nonpoint source controls will be tested and evaluated.The design of stormwater management facilities will attempt to replicate the hydrologiccharacteristics of the watershed based on modeled predevelopment conditions. (These resultscould ultimately be compared to field data collected in the Quantico Creek watershed, for the“predeveloped case.“) Ultimately, the project is attempting to document the cumulative impactsthat result as urbanization degrades water resources and ways in which sound watershedmanagement might mitigate water quality problems and related habitat problems. The results ofthis comprehensive approach to preserving the environmental integrity of a developing watershedshould be useful to all stakeholders. Prince William County will benefit by being able to use thedata to determine the best approach for managing its other watersheds.
References/Additional Information:
Everett, R., and T. McCandless. 1994. New watershed approach in Prince William County. In WatershedEvents, Summer 1994, pp. 9-12. EPA 840-N-94-002. U.S. Environmental Protection Agency, Office of Water,Washington, DC.
Page 3-15

EPA Region 4
Protecting Natural Wetlands: A Guide to Stormwater Best Management Practices
Getlein, S., R.S. Karalus, A Spingam, and F. Pasquel. 1993. Balancing development, water quality, andwetlands protection in a Mid-Atlantic watershed. In Proceedings of Watershed '93, A National Conference onWatershed Management, March 21-24, 1993, Alexandria, VA, p. 823. EPA 840-R-94-002. U.S. EnvironmentalProtection Agency, Office of Water, Washington, DC.
Pasquel, RF., MR. Mohan, and S.P. Cetlein. 1993. Comprehensive stormwater management planning. InEngineering Hydrology, Proceedings of the American Society of Civil Engineers Hydrology Symposium, July 25-30,1993, San Francisco, CA, pp. 832-837.
Hidden River Wetland Stormwater Treatment Site, Tampa Florida
Hidden River Wetland is a natural wetland located in the Hidden River Corporate Park inTampa, Florida. The 3-acre (1.2 hectares) wetland receives runoff from a mostly imperviousdrainage basin approximately 15 acres (6 hectares) in size that includes an office park complex,parking lots, and a central roadway The wetland-to-upland ratio of the stormwater treatment siteis approximately 15 or 20 percent (i.e., about 80 percent of the treatment site is upland). Annualprecipitation in the region is about 52 in (132.08 cm) per year. Water leaving the wetland flowsinto the Hillsborough River via an alluvial floodplain. Water quality of the Hillsborough River isgood near Hidden River; however, it becomes degraded downstream at Tampa because of factorsnot related to this site.
Hidden River Wetland is a freshwater, herbaceous marsh, classified as a palustrine emergentwetland. In southwest Florida there are many isolated wetlands of this type, known locally asFlorida flag marshes. These wetlands have highly reduced organic soils. Hidden River Wetland has95 percent vegetation cover; the plant community is dominated by maidencane (Panicumhemitomom), pickerelweed (Pontederia cordara), and waterlily (Nymphaea odorara). The wetland wasundisturbed prior to site development. Construction of a roadway filling a portion of the southend of the marsh necessitated the construction of a small mitigation area to the east side of themarsh. The north rim of the marsh is protected by a buffer of native vegetation.
Runoff enters the system through two inlets and undergoes preliminary treatment in twosedimentation basins that were built in 1987 as part of the stormwater management system toprotect the wetland. The east sediment basin consists of approximately 0.2 acre (784.08 m2) ofopen water, while the west basin, which is usually dry, covers about 0.07 acre (274.43 m2) and isvegetated with cattails (Typha latifolia) and other plant species. The west basin has a very wide,brief water level fluctuation. Rain events of over 0.5 in (1.27 cm) generally produce flows intothe wetland for less than a day; however, discharges from the wetland do not occur until July andthen are continuous until September. Wetland outflow is treated in a grassed swale before itenters a lower detention pond. After passing through a forested alluvial floodplain, the outflowenters the Hillsborough River.
After several years of use, Hidden River Wetland continues to have a beneficial effect onwater quality. Generally, inorganic nitrogen, phosphorus, and suspended solid concentrations arelower in the wetland outflow than in the inflows. Water in the wetland maintains lower pH,dissolved oxygen, and reduction/oxidation potential than the inflowing waters. Fluctuations inwater quality are much greater in the sedimentation basins than in the wetland. Water tempera-tures in the wetland are as much as 10 degrees Celsius lower than those in the sedimentationbasin.
Page 3-16

Case Studies
Although a plant survey was not conducted prior to sedimentation pond construction andsite development, a comparison of aerial imagery from 1984 and 1992 suggests that the dischargeof pretreated stormwater to the wetland has caused a reduction in open water area of the wetlandbut has had little effect on which plant species are present. The typical seasonal variation of waterlevel in Florida flag marshes, including a dry winter period, has been maintained. The pH of thewetland is slightly acidic rather than the circumneutral pH typical of Florida flag marshes, whichmight be due to acidic groundwater influences. Conductivities are also lower than usual for flagmarshes. Where the edge of the wetland vegetative community was disturbed by landscapingactivities, cattails (Typha latifolia) and primrose willow (Ludwigia peruviana) have invaded.Sedimentation of the preliminary treatment pond has not yet been a problem, possibly as a resultof the close attention paid to construction-related sediment control and site landscaping.
Continuing research on the Hidden River Wetland Treatment Site will includeinvestigations into the wetland’s hydrologic interactions with groundwater, analyses of soils andsediments, and continued analyses of water quality at wetland inlets and the outlet.
References/Additional Information:
Rushton, B. 1991. Variation in field parameters in a native wetland used for stormwater treatment. InStatewide Stormwater Management Workshop, October 2, 1994, ed. B. Rushton, J. Cunningham, and C.Dye. Southwest Florida Water Management District, Brooksville, FL.
Rushton, B. 1992. Evaluation of a wetland used for stormwater treatment: Preliminary data. SouthwestFlorida Water Management District, Brooksville, FL. Unpublished report.
Rushton, B. Southwest Florida Water Management District. Interview, November 1992.
Rushton, B., and C. Dye. 1991. Hidden River stormwater treatment. In Annual report for Stormwater
Research Program, fiscal year 1989-1990. Southwest Florida Water Management District, Brooksville, FL.
EPA Region 5
Lake McCarrons Wetland Treatment System, Roseville, MinnesotaThe Lake McCarrons Wetland Treatment System was built in 1985 in Roseville, Minnesota,
a suburb of St. Paul. About 85 percent of the runoff in the Lake McCarrons watershed is routed tothe wetland for treatment prior to discharge to the lake. The portion of the Lake McCarronswatershed draining to the wetland is approximately 636 acres (258 hectares) in size with17 percent impervious surface. Normal annual precipitation in the area is about 26 in (66.04 cm).Lake McCarrons is a eutrophic lake with a surface of 81 acres (33 hectares) and a mean depth of25 ft (7.62 m). In summer the dominant phytoplankton are blue-green bacteria and the lake’sdeeper waters become anoxic.
The two goals of the project are the improvement of the quality of stormwater runoffentering Lake McCarrons and the restoration of an existing degraded palustrine wetland. Asedimentation pond upstream of the wetland serves both as a moderator of stormwater peakflows to the wetland and as a primary pollutant removal system for water entering the wetland.The baseflow in the pond/wetland system was recorded as between 0.05 and 0.20 ft3/s (0.0014and 0.0057 m3), derived from groundwater inflows including natural springs and some stormsewer leakage. The sediment basin was intended to reduce pollutant and sediment loads to the
Page 3-17

Protecting Natural Wetlands: A Guide to Stormwater Best Management Practices
wetland, allowing the wetland to serve a “polishing” function and to restore some of the originalwetland functions.
Low berms (12 to 18 in (30.48 to 45.72 cm) high with 12-in culverts) were installed,dividing the wetland into five consecutive chambered wetlands between the sedimentation pondand Lake McCarrons (see Figures 3-5 and 3-6). An entrenched channel in the wetland, a result ofincreased runoff volume and velocity due to urbanization of the watershed, was filled. Thesemodifications brought the wetland’s hydrology closer to a natural state and allowed stormwaterentering the wetland to spread out as sheet flow through wetland vegetation and over the peat/mineral soils for greater removal of pollutants. The resulting wetland is described as a palustrineemergent marsh similar to the original marsh with a smaller palustrine scrub/shrub border thanthat present before construction.
Figure 3-5. Lake McCarrons Wetland Treament System.
Page 3-18

Case Studies
Figure 3-6. Cross section of Luke McCarrons wetland treatment system.
Lower pollutant removal efficiencies were recorded for the wetland than for the sedimentpond, probably because of removal of the most easily settled particulates in the pond and the highsorption capacity of newly exposed peat soils in the pond. Table 3-1 shows the results of waterquality monitoring for the pond, wetland, and combined system. Although the pond-to-watershedarea ratio is only 0.5 percent, the pond performed well in the reduction of pollutants monitored.The pond/wetland treatment system did result in substantial reductions in phosphorus loadingsto Lake McCarrons. However, no change in lake water quality has been detected, probablybecause of the high internal phosphorus loadings that remain in the lake.
Among problems encountered are the loss of effective pond treatment when the pond isice-covered and washouts of wetlands directly below the culverts through berms. Over a 7-yearperiod (1985-1992) there was a loss of pond storage capacity due to sedimentation, with ponddepth decreasing from 6 to 2 ft (1.83 to 0.61 m). In retrospect, a design including a drain valve for
Page 3-19

Protecting Natural Wetlands: A Guide to Stormwater Best Management Practices
easier pond maintenance and graveled spillways over wetland berms would have been desirable.Wildlife was described as abundant and the plant community was found to be very diverse in themodified wetland after 3 years; after 7 years cattails (Typha sp.) had increased substantially,
Since the completion of the original study in 1988, a sedimentation pond has been added toprovide preliminary treatment of runoff entering the lowest wetland chamber. Some road runoffthat previously entered the wetland as sheet flow over a grassed area, however, has now beenrouted directly to the wetland without preliminary treatment. A report presenting the results of arenewed 2-year study on the Lake McCarrons Wetland Treatment System will be completed inthe spring of 1997.
References/Additional Information:
Oberts, G.L. Metropolitan Council of the Twin Cities Area. Interview, November 1992.
Oberts, G.L., and R.A. Osgood. 1988. Lake McCarrons Wetland Treatment System: Final report on the function of thewetland treatment system and the impacts on Lake McCarrons. Publication no. 590-88-095. MetropolitanCouncil of the Twin Cities Area, St. Paul, MN.
Oberts, G.L., and R.A. Osgood. 1991. Water-quality effectiveness of a detention/wetland treatment systemand its effect on an urban lake. Environmental Management 15(1):131-138.
Wotzka, P., and G. Oberts. 1988. The water quality performance of a detention basin-wetland treatmentsystem in an urban area. In Nonpoint pollution: 1988-Policy, economy, management, and appropriate
technology, pp. 237-247. American Water Resources Association, Edina, MN.
The Phalen Chain of Lakes Watershed Project, Ramsey and WashingtonCounties, Minnesota
The Phalen Chain of Lakes watershed covers about 23 mi2 (36.8 km2) in Ramsey andWashington Counties. It includes five major lakes, 950 acres (385 hectares) of wetlands, andseveral connecting creeks called county ditches.
The watershed is the land area that drains to the five major lakes-Kohlman, Cervais, Keller,Round, and Phalen. The watershed includes parts of seven communities (Figure 3-7)-LittleCanada, Maplewood, North St. Paul, and smaller portions of Oakdale, St. Paul, Vadnais Heights,and White Bear Lake. The lakes follow the ancient bed of the preglacial St. Croix River. The area isconsidered unique and is heavily used for its recreational resources by local residents and the EastMetro area. The Chain of Lakes watershed is also part of a major flyway for migratory waterfowland songbirds, and it provides significant habitat for other birds and wildlife in an urban setting.
From settlement in the 1850s until World War II, the watershed was dominated byvegetable and dairy farming. Farmers drained wetlands, channelized creeks, and constructed earlyroads. In the 1970s, construction of Interstate 35E and large commercial areas like MaplewoodMall accelerated urban development in the watershed.
Urbanization has affected natural resources in the watershed in many ways. First,settlement has nearly eliminated the native vegetation of the area, replacing it with buildings,paved surfaces, and lawns. Habitat diversity and the varieties of birds and animals that inhabit thearea have been much reduced because of these changes. Non-native species like loosestrife havealso gained a foothold in the watershed and become problems.
Page 3-20

case studies
Phalen Chain of lakes Watershed
Figure 3-7. Phalen Chain of Lakes watershed.
Second, the natural drainage in the watershed has been altered. Soils, vegetation, andwetlands present at settlement easily absorbed much of the water that fell on the land. Urbandevelopment has increased soil compaction, paved surfaces, channelized creeks, and eliminatedover half the wetlands in the watershed. These changes cause more water to run off the land at afaster rate, creating flooding and erosion problems.
Higher volumes of runoff carry pollutants and nutrients to lakes, wetlands, and creeks,causing declines in water quality, and a reduction in the quality of fish and wildlife habitat. Algaeblooms on area lakes are evidence of these changes. It is apparent that without conscious effortsto manage land and water resources differently, ongoing development in the watershed willcontinue the following trends:
l Increasing volumes of stormwater runoff, with additional sediments and nutrientstransported to wetlands, creeks, and lakes.
l Loss of aquatic vegetation and reduced habitat for fish and other aquatic organisms.
l Increasing fragmentation of upland and wetland habitat and loss of plant and animaldiversity
l Loss of open space.
In early 1993, a partnership was formed to address concerns about declining naturalresources in the watershed. The partnership included local city governments, developers andbusinesses, the University of Minnesota, and the Minnesota Department of Natural Resources.The partnership received a grant to develop a comprehensive plan for the watershed. A SteeringCommittee, including representatives of all interested groups in the watershed, completed theplan in April 1994.
Page 3-21

Protecting Natural Wetlands: A Guide to Stormwater Best Management Practices
The comprehensive watershed plan includes seven major goals, BMPs, and manyrecommended action steps to protect, restore, and manage natural resources in the watershed inthe short term and long term. Major goals of the seven-point Action Plan for the Watershedinclude the following:
l Improve, restore, and protect surface water quality.
l Restore, enhance, and protect wetlands and creeks.
l Protect the groundwater resources of the watershed.
l Develop and support a connected system of “green corridors” to protect water resources,enhance fish and wildlife habitat, and provide natural resources recreation and educationopportunities.
l Restore and expand forest cover and diverse native vegetation.
l Increase public awareness and involvement in natural resources management in yards,public and private lands, and all of the watershed.
l Establish a local natural resources board to coordinate implementation of the watershedplan.
During the summer of 1994, the Watershed Project partners, local residents, cities,businesses, and others in the watershed improved natural resources through a variety of projects,including the following:
l Developing an innovative BMP to control stormwater in Maplewood. It will letstormwater infiltrate within a neighborhood and eliminate the need for new stormsewers that would empty into Lake Phalen. This neighborhood will serve as a model forstormwater management in other urban areas.
l Working with the City of St. Paul and District 2 community to obtain funding for thePhalen Wetland Park restoration as part of the Phalen Village Small Area Plan.
l Implementing projects to restore aquatic shoreline vegetation, and working with parksdepartments and landowners to manage vegetation and use BMPs around wetlands andlakes to benefit fish, wildlife, and water quality
l Completing a watershed-wide wetlands plan, based on the functions and values ofwetlands in the watershed, that will help the watershed district and local governmentsset priorities for purchase, protection, or management of wetlands.
l Completing field work to identify the remaining natural areas and prairie fragments,and inventorying open-space areas to assist in development of the “green corridors”network for the watershed.
l Completing restoration projects at the H.B. Fuller Company Willow Lake NaturePreserve to restore aquatic vegetation and other natural communities.
l Developing a workshop for teachers in five local school districts on watershed issues andidentifying student projects to benefit natural resources.
l Working with neighborhood and citizen groups on creative plantings and projects tobenefit natural resources in parks and residential areas of the watershed.
Page 3-22

Case Studies
The Phalen Project Committee will continue to work with local governments, businesses,citizens, and natural resources agencies to identify projects and opportunities to benefit land,water, plants, animals, and local communities.
The Prairie Wolf Slough Project, Chicago, IllinoisThe Prairie Wolf Slough is one of several projects aimed at addressing natural resource issues
along the 156-mile-long (249.6-km) Chicago River corridor. The 25-acre (10.1-hectare) projectinvolves the ecological restoration of a wetlands/prairie/savanna complex along the Middle Forkof the North Branch of the Chicago River and the creation of an interpretive nature trail.
The key component of the restoration is the creation of a wetland vegetation complex that,in the past, was drained by an agricultural drainage tile system. Sediments and othercontaminants used to enter the stream via a gully created by the outlet of the drainage system.After the tiles were removed and the gully was filled, water naturally returned to the floodplain.The restored wetlands help to eliminate sediments, nutrients, and residues from farm chemicalsused on the property, which is leased by a local farmer for row crops.
Water drains onto the site from a corporate complex and a shopping center, whichcontribute pollutants typical of urban runoff, such as lawn chemicals, road salts, and oil andgrease. Ponds just downstream provide some physical removal of sediment, but most of theorganic toxics and dissolved nutrients are not removed. The project diverts water from the twoupstream sources into the wetland system, which provides secondary biological treatment of therunoff. The water from the site will eventually percolate back into the river, but it will have beenpurified by the restored wetland, absorbing waterborne sediments and nutrients that reach theriver. The native wetland vegetation will also function as a filter medium to assist in removal ofdeleterious waterborne metals.
The restored wetlands will have a beneficial impact during flood events. By restoring acover of dense native vegetation to the 25-acre (10.1 hectare) parcel, many beneficial wetlandfunctions would be restored. These include an improvement in the retention of precipitation. Adense matrix of native plants would filter and hold more water than would a traditional cropfield. Increased water retention time translates into an increased ability for soil water absorptionand, therefore, decreased surface erosion.
The restoration will benefit many surrounding jurisdictions. The communities will benefitfrom the enhanced site aesthetics, improved wildlife habitat, and increased recreationalopportunities for walking and nature observation. The parcel of land is a logical link with aproposed riverside trail system and is also a part of a larger greenway that follows the Middle Forkof the North Branch of the Chicago River. This corridor provides vital habitat, foraging sites, andnesting locations for neotropical migratory birds, in addition to providing habitat for migratorywaterfowl. Local grade and high schools and a nearby college will also use the site forenvironmental education activities and the promotion of environmental awareness. Thebeneficial qualities of the wetlands will also be used by the Friends of the Chicago River to helpfocus public attention on the importance of water quality, fisheries, wildlife habitat, and openspaces along the river. The volunteer and environmental education components will buildinterest and a constituency for protecting the river and its upper reaches.
Page 3-23

Protecting Natural Wetlands: A Guide to Stormwater Best Management Practices
Tensas Cooperative River Basin Study, Louisiana
Background
The cumulative impacts of human activities have led to the reduction of bottomlandhardwood forests and wetlands, and their associated wildlife habitat, in the Tensas RiverBasin in northeastern Louisiana. Historically, over 90 percent of the 718,000-acre(290,790 hectares) basin was forested with bottomland hardwoods. Approximately 350,000of these acres (141,750 hectares) were irregularly to permanently flooded forested wetlands.Today, an estimated 85 percent of these forests have been cleared and converted to row cropagriculture, and the basin now contains only 135,000 acres (54,675 hectares) of bottomlandhardwood forests. The accelerated conversion of forestland to cropland during the 1960s and1970s has resulted in increased environmental and social problems in the basin. The naturalecosystem can no longer sustain acceptable water quality levels, provide adequate floodstorage functions, or offer the habitat diversity needed for many wildlife species.
In November 1991, various agencies met with the Natural Resources Conservation Serviceto devise a strategy for resolving water quality impairment and wetland habitat loss and decline.The group determined that an overall plan was needed for the entire basin to avoid a “piecemeal”approach to protecting the area’s natural resources. As the main sponsor of the study, the NaturalResources Conservation Service realized that for the study to be effective, a broad selection ofparticipants should be included in the process. Participants in the study included the following:U.S. Environmental Protection Agency; U.S. Fish and Wildlife Service; U.S. Army Corps ofEngineers; U.S. Geological Survey; U.S. Forest Service; Louisiana Department of Agriculture andForestry; Louisiana Nature Conservancy; Louisiana Cooperative Extension Service; LouisianaOffice of Soil and Water Conservation; East Carroll, Madison, Tensas-Concordia, and NortheastSoil and Water Conservation Districts; Fifth Louisiana Levee District; National Fish and WildlifeFoundation; and farmers of the Tensas Basin. The study began in October 1992.
The objectives of the study were to facilitate and coordinate the orderly conservation andmanagement of the basin’s land and water resources, particularly bottomland hardwoodwetlands. Specific objectives include:
l Describe the ecological, economic, cultural, and social resources of the Tensas River Basin.
l Provide a broad-scale analysis of ecological, economic, cultural, and social problems in thebasin.
Describe solutions to the basin’s problems that are environmentally, economically, andsocially sound and acceptable to local residents.
l Identify various federal, state, and local agencies and organizations that providetechnical and financial assistance for implementing solutions to water and related landresource problems.
Physical Setting
The study area is located in northeastern Louisiana in portions of East Carroll, Madison,Tensas, and Franklin Parishes and encompasses the watershed of the Tensas River from Lake
Page 3-24

Case Studies
Providence to its confluence with Bayou Macon. The Tensas River Basin is in a subtropical,transitional climatic region that is affected alternately by cool, dry air flowing southward andwarm, moist air flowing northward. Winters are usually mild with an average temperature of 47degrees Fahrenheit (0F), and the average summer temperature is 81 0F The average annualprecipitation is 55 in (139.7 cm), most of which occurs between December and May.
The Tensas River Basin is located in the Mississippi River alluvial valley, which was formedduring the early Pleistocene epoch. Following the glacial retreat of the epoch, the MississippiRiver became deeply incised within the basin area, creating a broad, entrenched valley thatgradually filled with alluvial deposits. Elevations average from about 100 ft (30 m) above sea levelalong the northern boundary to less than 50 ft (15 m) along the southern boundary The majorlandforms resulting from meanders in the course of the Mississippi River can be divided into fivecategories: abandoned courses, abandoned channels, natural levees, point bars, and back swamps(see Figure 3-8). Forested wetlands can be found in all of the major landforms except the naturallevees, which are elevated above the floodplain.
l Abandoned courses are lengthy segments of a river abandoned when the stream forms amore hydrologically efficient course in the floodplain. They can vary from a few miles totens of miles in length, but they always contain more than one meander loop. Theabandoned courses gradually fill in with sediment and are often occupied by a smallerstream or bayou.
l Abandoned channels are cut-off bends of meandering streams, commonly called oxbowlakes. A sediment plug forms in the abandoned channel immediately below the point ofcutoff. If the parent stream remains in close proximity, the oxbow quickly becomespartially or wholly filled with fine-grained sediments and is replaced by vegetatedwetlands in a few centuries. If the river channel rapidly meanders far away from theoxbow, however, sediment filing is slow and open water conditions often prevail.
Point bars are crescent-shaped ridges consisting principally of sand and silt on the insideof meander loops as the stream migrates toward the concave bank. As the processcontinues, a succession of bars can be formed, the height of which can be as much as 10 ftabove the mean low water level. The shape tends to conform to the curvature of thechannel in which they were created. The low areas between point bars constitute whatare known as swales. They develop dense willow growth that traps fine sediments, andin time they are filled with silts and clays. Many of the remaining regularly floodedforested wetlands in the basin occur in swales.
Backswamps are low, flat, featureless areas bordering natural levees and point bars.Backswamp deposits consist of fine-grained sediments laid down in broad, shallowslackwater basins during stream flooding. Historically, backswamps would remainflooded for months during high river stages and periods of heavy rainfall due toinefficient channels and low gradients. Today, most of these areas have been converted torow crop farms.
The regularly or permanently flooded bottomland hardwood forests are composed ofbaldcypress (Taxodium distichum), drummond red maple (Acer rubrum drummondii), swampblackgum (Nyssa sylvatica), and buttonbush (Cephalunthus occidentalis). Seasonally and irregularlyflooded bottomland hardwood forests are composed of overcup oak (Quercus lyrata), bitter pecan(Carya aquatica), green ash (Fraxinus pennsylvanica), willow oak (Quercus phellos), cedar elm(Ulmus crassifolia), waterlocust (Gleditsia aquatica), boxelder (Acer negundo), and hackberry (Celtislaevigata.
Page 3-25

Protecting Natural Wetlands: A Guide to Stormwater Best Management Practices
Figure 3-8. Geomorphologic features in Tensas Basin,
Page 3-26

Case Studies
The social and economic resources of the Tensas River Basin were also reviewed andincorporated into the study. The economy of the region is based primarily on row crop agriculture(see Figure 3-9). Timber harvesting has diminished since there have been no large reforestationefforts. The area experiences chronic unemployment problems and lack of job diversity and,consequently, has been undergoing an emigration of people in search of job opportunities. Forexample, prices for farm inputs have increased 46 percent more than prices received for rawagricultural products, and unemployment in the basin ranges from 10.7 to 24.1 percent. Thesecombinations result in fewer dollars being circulated in the local economy and thus reduced jobopportunities in the retail and service industries in the rural, farm-based economies.
Problem Identification and Treatment Options
A series of public meetings were held throughout the basin to identify problems andpotential solutions. Problems identified include long-term viability of row crop production,bottomland hardwood wetland decline, impaired water quality, flooding, limited recreationalopportunities, reduced fish and wildlife habitat, and socioeconomic concerns. Regarding thebottomland hardwood wetland decline, the major sources of problems are habitat fragmentation,excessive sediment loading, and nutrient and pesticide loading. Throughout the analysis andplanning process, it became apparent that the problems were usually interrelated. Water qualitywas also being impaired due to excessive sediment loading and nutrient and pesticide loading,which was reducing the profit margin for the agricultural operations. Limited recreationalopportunities and reduced fish and wildlife habitat were tied to the forested wetland decline.Flooding is also a major problem because there are fewer wetlands to provide floodwater storageand control.
Based on the identified problems, two primary methods for addressing these issues wereevaluated: BMPs and bottomland hardwood restoration. Due to the agricultural nature of theregion, row crop BMPs were determined to be the most effective. Only BMPs deemed by thestudy group to be cost-effective, efficient, and acceptable to the residents were included in thefinal plan. Row crop BMPs are categorized as follows: (1) soil management, (2) watermanagement, and (3) nutrient and pesticide management.
Soil Management BMPs
Soil erosion was determined to be linked to many of the problems identified in the basin,including the decline of bottomland hardwood wetlands. Soil particles often act as carriers ofnutrients and pesticides, which further add to water pollution problems. Soil erosion can bereduced by maintaining a protective cover of plants or plant residue, reducing the number oftillage operations, and improving soil structure. The following BMPs were determined by theTensas River Basin study to be the most effective measures in reducing soil erosion: (1) chiselingand subsoiling, (2) conservation cropping sequences, (3) conservation tillage systems, (4) contourfarming, (5) cover crop, and (6) crop residue use.
Water Management BMPs
Water management practices are applied in the fields where the crops are grown and at thefield edges where water enters and exits a field. BMPs applied in the crop field to facilitate plant .growth and to reduce sediment and water from leaving the fields include (1) land leveling,(2) irrigation water management, and (3) crop row arrangement. BMPs applied to minimize
Page 3-27

Protecting Natural Wetlands: A Guide to Stormwater Best Managemant Practices
Figure 3-9. Main land uses in Tensas Basin.
Page 3-28
Case Studies
environmental impacts before or after water reaches a field are (1) filter strips, (2) grassedwaterways, (3) irrigation tailwater recovery, (4) water and sediment control basins, and(5) water control structures.
Nutrient and Pesticide Management BMPs
Nutrient and pesticide runoff is closely tied to soil and water management. However, inmany instances excess nutrients and pesticides do not need to be applied. Prudent application ofnutrients and pesticides enables the producer to reduce expenses while having a positive impacton the surrounding wetlands. Proper nutrient management requires periodic soil testing and useof fertilization rates within a recommended range. Pesticide management requires the use of fieldscouting, safe handling and mixing procedures, and nematode assay to determine if and whenpesticides should be applied.
Bottomland Hardwood Restoration
Approximately 350,000 acres (141,750 hectares) of hydric soils occur in the Tensas RiverBasin. On some hydric soils, profitable row crop production might be limited over the long termand therefore the most prudent land use for these soils would be hardwood production because itwould allow the floodplain to function naturally Bottomland hardwood restoration wouldreduce the impacts of flooding and would improve water quality. It would improve fish andwildlife habitat while providing a higher economic return. Although not always considered aBMP to protect natural wetlands, the restoration of the forested wetlands would enhance theexisting wetlands by enlarging the resource as well as providing additional buffer zones.
Implementation
The Natural Resources Conservation Service will use the Tensas River Basin Study todevelop detailed watershed plans for implementation of BMP measures and to target potentialbottomland hardwood restoration sites. Solving the environmental and social problems of theTensas River Basin will require a concerted effort by private landowners, federal and stateagencies, local governments, and organizations. Implementation of land treatment options, to alarge extent, is dependent on the voluntary efforts of local landowners. However, bydemonstrating that protection and restoration of bottomland hardwood wetlands not only willimprove environmental quality but also will provide economic and social benefits for thelandowners, this transition should be more easily accomplished. Probably the most beneficialaspect of the basin study was the consensus building. The diversity of the participants ensuredthat a variety of viewpoints were considered, and the result is a plan that relates protection ofbottomland hardwood wetlands to the overall health of the watershed, including thesocioeconomic health.
References/Additional Information:
USDA/NRCS. 1995. Tensas Cooperative River Basin Study. U.S. Department of Agriculture, NaturalResources Conservation Service, Alexandria, LA.
Page 3-29

Protecting Natural Wetlands: A Guide to Stormwater Best Management Practices
EPA Region 7
Multi-Species Riparian Buffer Strips, Bear Creek Watershed, Iowa
Background
Most agricultural landscapes are a mosaic of croplands and residences superimposed on areasthat were previously natural prairie, wetland, and forest ecosystems. In the Corn Belt of themidwestern United States, most of these natural ecosystems have been cleared for agriculturalpurposes. In Iowa, for example, 99 percent of the prairie and wetlands have been converted toother uses. Many of the remaining riparian wetland systems are heavily impacted by nonpointsource (NPS) pollution. BMPs in the Midwest that include the protection of riparian wetlands asan objective must also address enhancement and restoration of riparian wetlands. An example ofthis type of BMP is a multi-species riparian buffer strip (MSRBS) system designed and placedalong Bear Creek in central Iowa by the Iowa State Agroforestry Research Team.
The Bear Creek Watershed is located in north-central Iowa within the Des Moines Lobe, thedepositional remnant of Wisconsinan glaciation in Iowa. Bear Creek is 2.16 mi (34.8 km) long,with 17.27 mi (27.8 km) of major tributaries. The creek empties into the Skunk River. Thewatershed drains 18,386.4 acres (7,446 hectares) of farmland, most of which has been subjectedto field tile drainage during the last 40 years. About 87 percent of the watershed is devoted to cornand soybean agriculture.
Two different levels of research activity are taking place in the Bear Creek Watershed. TheLeopold Center for Sustainable Agriculture’s Agroecology Issue Team (AIT) is using the watershedto study the condition of riparian zones at the watershed level. The AIT is developing a model toidentify critical riparian reaches along the creek that need protection and restoration. The long-term goal of the project is to help farmers who own land along Bear Creek and other streams todevelop riparian zone management systems that protect riparian wetlands and water quality byremoving sediment and agricultural chemicals.
The Iowa State Agroforestry Research Team (IstART) has been working on one farm in thewatershed to develop the MSRBS model system for use along the critical reaches of Bear Creek.This model has been developed by an interdisciplinary team of researchers with specialists inforage crops, soils, hydrogeology, forest hydrology, forest ecology, wetland ecology, economics,biometrics, wildlife management, and extension. The model can be adapted to other waterwaysin Iowa and the Midwest.
The MSRBS system is a filter strip 65.62 ft (20 m) wide consisting of three vegetative zones.The first zone consists of four to five rows of fast-growing trees planted adjacent to the stream.The second, or central, zone consists of two rows of shrubs. The third zone, planted on the outeredge of the riparian buffer, consists of a strip of switchgrass 22.97 ft (7 m) wide. The MSRBSdesign takes advantage of the different aboveground and belowground structures of each speciesto provide maximum year-round interception of sediment and agricultural chemicals from surfacerunoff and subsurface water movement. One of the innovative aspects of this design is the use offast-growing tree species that can be used as a short-rotation woody crop system. These systemscan produce biomass for energy in 5 to 8 years and timber products in 15 to 30 years. The frequentharvests help to maintain active nutrient and pesticide sequestering by the woody plantcommunity. The selected species do not have to be replanted for three to four harvests because thespecies reproduce vegetatively by stump or root sprouts. The large root systems allow very rapid
Page 3-30

Case Studies
regrowth, which provides continuity in water and nutrient uptake and physical stability of thesoil throughout the life of the stand.
The MSRBS systems also include native shrubs, which can provide biomass if harvested anddemonstrate coppice regeneration. The shrubs increase species diversity and wildlife habitat,provide yet another rooting pattern that will hold soil, intercept shallow groundwater nutrients,and provide organic matter for soil microbes. Finally, the addition of native prairie grasses such asswitchgrass will provide additional species diversity, a very high frictional surface forintercepting surface runoff, and a deep and fibrous root system that will play an important rolein improving soil quality.
Study Design
The MSRBS system lies along a 3,281-ft (1,000-m) reach of Bear Creek on a private farm(see Figure 3-10). At this location, the creek is a third-order stream with average discharge ratesvarying between 10.59 and 49.44 ft3/s (0.3 and 1.4m3/s). During the past 5 years, pesticidesapplied on the farm have included chlomazone, atrazine, cyanazine, and the herbicide EPTC.During the past 12 years, impregnated urea pellets have been applied at the rate of 122.83 lb/acre(134 kg/hectare).
The reach of the creek under study was divided into three blocks: inside bend, outside bend,and straight reaches. Five 295.29-ft (90-m) plots were located within each block. Treatmentsconsisting of three combinations of planted trees, shrubs, grass, and two controls were randomlyassigned to the plots within each block. The planted treatments consisted of five rows of treesplanted closest to and parallel to the creek with a 5.91-ft (1.8-m) spacing between rows.Different species of trees were used in each of the three treatments. One treatment consisted of a
Figure 3-10. Multi-species Riparian Buffer Strip System.
Page 3-31

Protecting Natural Wetlands: A Guide to Stormwater Best Management Practices
poplar hybrid (Populus X euramericana Eugenei) that has been extensively tested and is readilyavailable in Iowa. The second treatment contained green ash (Fraxinus pennsylvanica), and thethird treatment contained a mixture of four rows of silver maple (Acer succharinum) with a centerrow of black walnut (Juglans nigra). Upslope from the trees, a row of red-oiser dogwood (Cornusstolonifera) and a row of ninebark (Physocarpus opulifolius) were planted. The shrubs were plantedwith 3.94-ft (1.2-m) spacing between rows. Finally, a strip of switchgrass 23.95 ft (7.3 m) wide(Panicum virgatum) was planted upslope from the shrubs. Controls consisted of existing pasturegrasses. Most trees are being grown on a 6- to 8-year rotation depending on species, and blackwalnut is being grown on a 45 to 55-year rotation.
The plants for this MSRBS were selected to serve multiple purposes. Those purposesincluded rapid growth, dense rooting habits, coppice regeneration ability for the trees and shrubs,stiff stems for the grass, cover and food for wildlife, and a potential for being used as biomass forenergy The desire was to develop an effective buffer in as short a time as possible to effectivelytrap sediment and process chemicals and to demonstrate to landowners that a buffer strip withwoody plants could be grown rapidly
In the study area, an existing field drain tile was providing subsurface drainage for one ofthe fields and was discharging untreated water into Bear Creek. An approximately 0.12-acre(500-m2) wetland was constructed to process field drainage tile water from a 12.11-acre(4.9-hectare) cropped field. The wetland is 1.64 to 3.28 ft (0.5 to 1 m) deep and is surrounded by alow berm. The bottom of the wetland was sealed with clay because of the presence of anunderlying substrate of alluvial sand. Organic soil was then placed as the top layer. Theagricultural drainage tile was excavated and rerouted to enter the wetland at the point farthestfrom the creek, forcing the water to travel through the wetland before entering the creek. A gatedwater level control structure at the wetland outlet provides complete control of the levelmaintained within the wetland. Cattail (Typha glauca) rhizomes were collected from a nearbywetland during the early spring when the shoots had just begun to elongate. The wetland wasplanted in early June at a spacing of approximately 1.97 ft (0.6 m) on center. Willow cuttingswere planted on the stream side of the berm, and native grasses and forbs were planted on theconstructed berm for stabilization and to provide vegetation diversity.
Two soil bioengineering structures 262.48- to 328.1-ft (80-to l00-m)-long have beendeveloped as part of the MSRBS system. These structures used live staking and dead tree fascinesto stabilize severely eroding banks on the outside stream banks. In the spring of 1992 and 1993,cuttings of dormant willow (Salix spp.) 3.28-ft (1-m)-long and 16.41- to 24.61-ft (5- to 7.5-cm) indiameter were pounded into the creek bottom along the toe of the bank and into the stream bank.A dead fascine system using bundles of harvested silver maple was wired together and staked intothe bank to provide protection for the cuttings. Most of the cuttings took root and grew. Recordfloods occurred in the watershed in 1993, and the plantings withstood a record 500-year flood.The resulting plant material reduces the speed of channel flow on the outside of the bend, causessediment to be deposited in the plant material, and stabilizes the bank against further collapse.
Results
Survival of the trees, shrubs, and switchgrass in the MSRBS has generally been very good.Survival of the three fastest growing tree species was above 87 percent. Black walnut survival wasadversely influenced in the second year of growth because of intense grass competition. Ninebarkhas grown very well, with heights of 6.56 ft (2 m) at the end of 1993. The red osier dogwood hasshown mixed growth and has been replaced in spots with nanking cherry (Prunus tomentosa). The
Page 3-32

switchgrass is well established and has produced twice as much biomass as that of the pasturegrasses
The MSRBS was evaluated for root biomass production, and preliminary data indicate veryhigh root production (Figure 3-11). This is important because plant roots increase soil stability bymechanically reinforcing soil, and they increase the soil microbial activity that aids in theprocessing of nutrients and agricultural chemicals. The mixture of trees, shrubs, and grassesprovides a dense matrix of roots throughout the soil column, providing greater stability thansingle-species filter strips.
Water movement through the MSRBS reach of Bear Creek is sampled in the vadose zone (theunsaturated zone of the soil above the water table including the rooting zone), the unconfinedshallow aquifer (located in the alluvium and glacial till), the bedrock aquifers, the drainage tiles,and the stream channel. Various kinds of sampling equipment, including piezometers andtensiometers, have been installed to access these different sources of water. Water samples wereanalyzed for nitrate nitrogen and atrazine. The present protocol calls for monthly samplecollections between growing seasons and twice-monthly collections during the growing season.
Although early results do not accurately reflect the full remediation capability of the systemwhen it is mature, the preliminary results demonstrate that a developing MSRBS system can beeffective in reducing NPS pollutants. Results for nitrate nitrogen (NO3-N) and atrazine areshown in Figures 3-12 and 3-13. As can be seen, the NO3-N concentrations in the MSRBS neverexceeded 2 ppm (2 mg/L) even though background levels of NO3-N exceeded 12 ppm (12 mg/L) inthe field. The buffer strip also showed adequate removal rates for atrazine. Data fromminipiezometers located at a depth of 9.84 ft (3 m) below the MSRBS confirm that thesechemicals are not moving below the buffer strip.
Preliminary data from the first 4 months of operation of the field drainage tile wetlandindicate that microbial degradation of NO3-N is taking place. Measurements are greater than 15ppm (15 mg/L) at the inflow while measurements are less than 3 ppm (3 mg/L) at the outflow.Under stormflow conditions when residence times are reduced, NO3-N levels are not aseffectively reduced. Based on this initial research, constructed wetland systems can be used toprotect existing natural wetlands in agricultural settings. Wetland plant species that can tolerateexcessive nutrient loading can be used in the constructed wetland to protect the more susceptiblespecies that occur in natural wetlands.
Visual observations of sediment movement suggest that no significant sediment has movedthrough the buffer strip since the switchgrass, shrubs, and trees have become established.
Recommendations
The Iowa State University Agroforestry Research Team has developed preliminaryrecommendations for Multi-Species Riparian Buffer Strips for Iowa based on their research atBear Creek. General design recommendations include:
l The general layout should consist of three zones, starting at the stream bank edge; thefirst zone should include a strip of trees (four to five rows) 29.53- to 32.81-ft (9- to 10-m)wide, the second zone should include a strip of shrubs (one to two rows) 9.84- to 13.16-ft(3-to 4-m)-wide, and the third zone should include a strip of native warm-season grasses22.97 to 26.25 ft (7 to 8 m) wide.
Page 3-33

Protecting Natural Wetlands: A Guide to Stormwater Best Management Practices
DATE (1993)Schultz et al., 1995.
Figure 3-12. Mean nitrate-nitrogen concentrations in the buffer strip.
Schultz et al., 1995.
DATE (1993)
Figure 3-13. Mean atrazine concentrations in the buffer strip.
Page 3-34

Case Studies
l Fast-growing trees are needed to develop a functioning MSRBS in the shortest possibletime.
l Rows 1 through 3 in the tree zone should include fast-growing, riparian species such aswillow, cottonwood, silver maple, hybrid poplars, green ash, and box elder. Othermoderate-growth species include black ash, river birch, hackberry, shellbark hickory,swamp white oak, pin oak, Ohio buckeye, and sycamore. The key to tree and shrubspecies selection is to observe native species growing along existing natural riparianzones and select the faster-growing species.
l Shrubs should be included in the design to increase biodiversity and wildlife habitat.Possible species include ninebark, red osier and gray dogwood, chokecherry, Nankingcherry, nannyberry, sandbar willow, Bebb willow, peachleaf willow, pin cherry, wildplum, and blackhaw.
l Switchgrass is recommended because it produces a uniform cover and has dense, stiffstems that provide a high frictional surface to intercept surface runoff. Other permanentwarm season grass, such as Indian grass, big bluestem, and little bluestem, can be includedas long as switchgrass is the dominant species.
l Native perennial forbs may also be part of the mix, especially if they are seeded in clumps.
If wildlife habitat is an important component of the buffer strip, widths of 98.43 to295.29 ft (30 to 90 m) would provide a more suitable wildlife corridor or transition zonebetween the upland agricultural land and wetland/aquatic ecosystem.
Recommendations for tile wetland construction include:
l A small wetland can be constructed at the end of the field tiles by constructing a basinat the ratio of 1:100 (1 acre of wetland for l00-acre drainage). Thebottom of the wetlandshould be sealed with clay if the soil texture is sandy.
l Clay tile and perforated plastic tile used to drain fields might become plugged by tree andshrub roots in the buffers. Two possible solutions to this problem exist: (1) replace thetile passing through the buffer strip with solid tile or (2) plant a strip of warm seasongrass above the tile line at a width of 65.62 to 98.43 ft (20 to 30 m) depending on thewoody plants that are planted.
Costs for establishment of the MSRBS system have been estimated at $358 to $396 per acre,and annual maintenance costs are estimated at $20 per acre. The establishment and maintenancecosts do not include any existing governmental cost-share or other subsidy. Currently, there areseveral cost-share programs available that will cover up to 75 percent of the expenses. A goodcontact for information on potential cost-share programs is the local office of the USDA NaturalResources Conservation Service. Overall the MSRBS system seems to function quite well. Inaddition to protecting riparian wetlands, the MSRBS system offers farmers a way to intercepteroding soil, trap and transform NPS pollution, provide wildlife habitat, produce biomass for on-farm use, produce high-quality hardwood in the future, and enhance the aesthetics of theagroecosystem. As a streamside BMP, the MSRBS system complements upland BMPs and providesmany valuable benefits.
Page 3-35

Protecting Natural Wetlands: A Guide to Stormwater Best Management Practices
References/Additional Information:
Schultz, R.C. 1994. Design and establishment of a multi-species riparian buffer strip. Leopold Center for
Sustainable Agriculture, Ames, IA.
Schultz, R.C. 1994. Multiple benefits from constructed multi-species riparian buffer strips. Leopold Center for
Sustainable Agriculture, Ames, IA.
Schultz, R.C., J.P. Colletti, T.M. Isenhart, W.W. Simpkins, C.W. Mize, and M.L. Thompson. 1995. Designand placement of a multi-species riparian buffer strip system. Agroforestry Systems Journal (29):201-226.
EPA Region 8
Watershed Approach to Municipal Stormwater Management, Fort Collins,
Colorado
Introduction
Fort Collins, a city of 92,000 people, is located in a quickly developing area of Coloradoknown as the Front Range. The city, situated at 5,000 ft (1,524 m), has a semi-arid climate with14 in (35.56 cm) of annual precipitation and an average of 300 days of sunshine. Due to thepleasant climate, natural areas, and other factors, Fort Collins is experiencing significant growth.This increase in development led the city to create a Stormwater Utility. Within the municipalboundaries, three types of wetland communities can be found. The dominant community isseasonally flooded riparian wetlands consisting of willow (Salix spp.), narrowleaf cottonwood(Populus angustifolia), plains cottonwood (Populus sargentii), golden current (Ribes aurem), andchokecherry (Prunus virginiana). The other two wetland communities are seasonally floodedemergent marshes dominated by broad-leafed cattails (Typha latifolia) and bulrush (Scripus spp.);and seasonally saturated wet meadows consisting of sedges (Carex spp.) and rushes Juncus spp.).
The Stormwater Utility’s original mission was to create a drainage system that protectscitizens from flooding. The Utility typically manages the stormwater system by drainage basin,which is the land contributing stormwater runoff to a particular point, usually a stream. The sizeof a basin, anticipated rainfall amounts, and the type of land use (i.e., industrial, residential, ornatural) are factors used to calculate the need for flood control improvements. With theimplementation of the National Pollutant Discharge Elimination System (NPDES) permitprogram and other programs, water quality became a critical component of stormwatermanagement and required the Utility to take a new look at how drainage systems are designedand managed.
Approach
It became apparent to the city that a drainage system designed to convey flood waters canbe planned to meet objectives other than the control of water quantity. For example, drainagesystems are typically along riparian wetland corridors, which provide a multitude of functionsand values such as wildlife habitat and recreation. Consequently, it became critical to look at theprotection and enhancement of these important wetland areas. The city revised the missionstatement for the Stormwater Utility to state the “purpose for the utility is to provide stormwaterfacilities for the drainage and control of surface and floodwaters in order that . . . pollution may
Page 3-36

Case Studies
be reduced and the environment should be protected and enhanced.” Based on this new mandate,the city developed primary and secondary objectives for the Stormwater Utility.
Primary stormwater objectives include:
l Protect Fort Collins from flood waters.
l Protect and enhance water quality in creeks, lakes, and wetlands.
l Protect and restore creeks, lakes, and wetlands as critical wildlife habitat areas.
l Protect water table aquifers from stormwater contamination.
Secondary stormwater objectives include:
l Enhance a sense of community by including citizen participation in protecting localnatural areas.
Create trails to support the use of alternative transportation.
l Promote recreational opportunities associated with trails and natural areas.
To accomplish these objectives, the Stormwater Utility decided to use a watershedmanagement approach as a holistic method to manage stormwater and drainage basins. A holisticapproach requires looking at all factors that influence stormwater management, including thosefactors not typically associated with stormwater management. For example, the Utility realizedthat alternative transportation has a direct correlation to stormwater quality A reduction inautomobile use improves air quality and reduces the amount of pollutants that can beredistributed with precipitation. A reduction in automobile use also reduces the pollutants left onpavement, which can enter the stormwater system through runoff. Carried to its fullest potential,a greater reliance on alternative transportation can lead to a reduction in the amount ofimpervious surface associated with roads and parking lots, thereby reducing the overall amount ofstorm runoff contributed to the system.
Another example of looking at the system holistically is addressing the protection ofriparian wetland corridors along drainage systems. The riparian corridors provide importantbenefits such as natural filters of storm runoff, wildlife habitat, and bank stabilization. Inaddition, stormwater systems along riparian corridors can be considered as potentialgreenway parks. In times when municipal budgets are limited, integrating park facilities andstormwater systems can be an efficient way of using capital improvement resources.
A final example of how stormwater management and other issues are interrelated isenhancing a sense of community by encouraging citizen participation in protecting local naturalareas. By raising the public’s awareness of the natural areas along the stormwater system,educational efforts to encourage people not to pollute (for example, encouraging them not to pourchemicals down storm drains) become more effective because people realize the ultimate effectsof their actions (for example, they understand where those storm drains discharge). Furthermore,an awareness of why BMPs are used can decrease the likelihood that they will be vandalized.
To begin applying the watershed approach, the Utility divided the urban watershed intothree primary and interactive components: land, tributaries, and receiving waters. The urbanlandscape comprises industrial, commercial, and residential land uses and open space. Tributaries
Page 3-37

Protecting Natural Wetlands: A Guide to Stormwater Best Management Practices
Table 3-2. Concept Cost Cost Comparison 04 lssuesAssociated with Watershed Grades
Issue Grade A Grade B Grade C Grade D
Land Costs
Construction Cost
Opens Space Provided
Development Potential(along drainages)
Maintenance Cost
Highest
L o w e s t
Highest
Lowest
Lowest
Intermediate
Intermediate
lntermediate
lntermediate
lntermediate
Intermediate
lntermediate
Intermediate
lntermediate
Intermediate
Lowest
Highest
L o w e s t
H ighes t
H i g h e s t
Next Steps
For the Stormwater Utility to fully implement a watershed approach, the following stepswill need to be taken:
l Develop an integrated approach between the various municipal departments(Stormwater, Natural Resources, Parks and Recreation). Clarify implementation rolesbetween departments and eliminate cross purposes and redundancies. The city mustrealize that the drainage system can play an important role in meeting a variety of citygoals, but the city must also understand and agree on a balance between competingobjectives. Some of these are:
- Aesthetics, groomed vs. natural appearance
- Efficient stormwater flows vs. water and habitat quality
- Regulation vs. private property rights
- Service levels vs. cost
Refine the watershed rating system and develop methods to objectively measureand rank sections of the stormwater system.
l Adopt individual watershed master plans where the master planning of stormwaterfacilities and natural resource areas, including wetlands, is cooperatively completedthrough the use of geographic information system (GIS) technology.
l Modify storm drainage design criteria to include a variety of BMPs that protect waterquality and wetlands. Include components of the Natural Areas Mitigation Manual in theCity’s storm drainage design criteria.
l Formalize stormwater education efforts and integrate them with other existingmunicipal and county environmental education programs.
The Stormwater Utility is just beginning to create the framework for an integratedwatershed approach to stormwater management. At the municipal level, a successful watershedapproach relies on communication and coordination between all departments to provide for acohesive program. It also requires close communication and input from the local citizens. By
Page 3-40

Case Studies
preventing pollution on the land, addressing the ecological effects of providing drainage services,and preparing sound hydrologic analysis, objectives related to water quality, public safety, andnatural area protection can all be achieved.
References/Additional Information:
McBride, K. 1995. Stormwater quality: A watershed approach. City of Fort Collins, Colorado.
Lema Nonpoint Source Treatment System, Chatfield Reservoir, ColoradoChatfield Reservoir, located 15 mi (24 km) southwest of Denver, Colorado, impounds water
from the South Platte River drainage, a 2,969 mi2 (7,719.4 km2) watershed. The reservoir is aflood control structure built and operated by the U.S. Army Corps of Engineers, and it has becomean important recreational facility for the metropolitan region. The developed lower portion ofthis watershed system is the Plum Creek subwatershed, which is a 438-mi2 (1,338.8-km2) drainagearea in Douglas County Plum Creek and Chat field Reservoir in the Plum Creek subwatershed areidentified in the Denver Regional Council of Governments (DRCOG) regional Clean Water Planas being affected by nonpoint source (NPS) pollution, primarily high phosphorus loading.
The magnitude of the problem is reflected by the total pounds of phosphorus that reach thereservoir each year. The phosphorus loading of the reservoir is about 53,100 pounds (lb)(24,086 kg) per year from developed land and about 50,513 lbs (22,912.67 kg) per year fromundeveloped land. The total maximum allowable load that will not exceed the in-reservoirstandard is 59,000 lb (26,762.4 kg). Under normal conditions, about 48,300 lb (21,908.88 kg) ofnonpoint-source-derived total phosphorus will need to be removed from the watershed.
In addition to degrading water quality, the high phosphorus loads are negatively impactingthe fringe wetlands associated with the reservoir and the riparian wetlands along Plum Creek. Thefringe wetlands are seasonally and permanently flooded lacustrine wetland communities with amixture of broad-leafed cattails (Typha latifolia), hard-stem bulrushes, (Scripus acutus), sedges(Carex spp.), and rushes (Juncus spp,), The riparian wetlands are seasonally flooded palustrinewetland communities with cottonwoods (Populus sargentii), sandbar willows (Salix exigua), andchokecherries (Prunus virginiana). Excessive phosphorus loads are allowing pollution-tolerant andinvasive species to take over and decrease plant biodiversity. Eutrophication of the reservoir ispromoting algal blooms, which are shading out submergent wetland species.
The Chat field Basin Authority management program has identified many potentially usableBMPs that could reduce phosphorus loading and offer ancillary benefits such as protection ofexisting natural wetlands. The problem facing the Authority is predicting the effectiveness ofthese BMPs. The Authority wants highly effective, low-cost, and easily maintained BMPs for thewatershed nonpoint source control program. The placement of small BMP structures at every siteof urban development that generates nonpoint source pollution appears to be a very costlyoption. Therefore, a pilot project was selected to evaluate the effectiveness of a low-cost,biologically based system.
Lemna System
A private corporation has developed a natural biological treatment process that uses aquaticplants (duckweed) to assimilate nutrients and reduce pollutants in a pond environment.Duckweed (Lemna sp.) is a small floating plant commonly found in many lakes, ponds, and slow-
Page 3-41

Protecting Natural Wetlands: A Guide to Stormwater Best Management Practices
moving streams. It consists of one or more leaves (called fronds) but has no visible stem. Over 35species of duckweed grow worldwide in a variety of climates. Duckweed is an extremely fast-growing plant that reproduces primarily by vegetative processes. The biomass can double in lessthan 18 hours under optimal conditions. In Colorado conditions, the biomass is anticipated todouble in about 72 hours. Seasonal changes in weather and sunlight affect pond temperature andthus the growth of duckweed. Optimum growth is achieved at 68 0F (20°C) to 86°F (30 0C).Lemna is semi-tolerant of cold temperatures and will continue to grow slowly at temperaturesnear 44 0F (7 0C). Nitrogen, phosphorus, and trace metals are needed to support the growth ofduckweed, with optimum growth possible when there is a balance of available nutrients. Lowlevels of either nitrogen or phosphorus result in starved plants.
The use of Lemna has proven effective as a wastewater treatment nutrient removal system,with the added benefit of reducing metals, biological oxygen demand, and total suspended solidsalong with its constituents. The resultant effluents have low phosphorus concentrations (below1 ppm (mg/L)). The by-product of the Lemna process is plant tissue, which has been used as a foodsupplement for feedlots and as a compost product. The Chatfield Basin Authority hasimplemented a pilot system using Lemna to determine the system’s effectiveness in removingnutrients from Plum Creek before it enters Chatfield Reservoir. The pilot system is underevaluation for 1 year to assess water quality benefits; it will then be monitored longer to assessthe effectiveness under various hydrologic loading conditions naturally encountered in the PlumCreek subwatershed.
The main pollutant removal pathways are a combination of plant mat uptake andprecipitation. Management of the duckweed system for phosphorus removal maximizes growthof the plant mat. The primary method for maximizing growth is mat density management. Matdensity management uses harvesting of the biomass to optimize the uptake of phosphorus. Ayoung duckweed plant population tends to have higher phosphorus uptake rates and grows fasterthan an older plant population. Additionally, the water column can contain sufficientconcentrations of ions, which promote precipitation of insoluble salts. Some of the phosphorus,for example, will precipitate and settle as calcium phosphates. The duckweed also reduces algaegrowth by not allowing light into the water. Algae can contribute to increased total suspendedsolids within the water and subsequent effluent discharge.
The treatment system consists of three primary components:
l A patented floating-cell system that can be adapted to a wide variety of pondconfigurations. This allows the system to be adapted to existing pond structures (e.g.,gravel operation ponds). The floating cells are designed to contain and control locallyavailable Lemna plants.
l An on-shore control unit and automatic sensing probes provide nutrient circulation andassess chemical balance within the pond structure.
l An aquatic harvester is used to inoculate, distribute, and harvest Lemna plants from thepond surface. A single harvester can be used on many ponds to improve the costeffectiveness of the system.
The advantages of the Lemna system over other more conventional biologically basedBMPs include:
l Marginal, poor-quality lands can be selected for a site.
l The system can be designed to accommodate the available site.
Page 3-42

Case Studies
l The system hardware is simple and durable, which reduces future maintenance costs.
l The by-product can be used as a high-protein food supplement for feedlots.
l The by-product can be composted and land-applied for beneficial reuse.
The disadvantages of the Lemna system over other more conventional biologically basedBMPs include:
l An energy source is required for the various pieces of hardware, including the pump andaquatic harvester.
l Personnel are required to maintain and operate the system.
Pilot Scale Description
The Chatfield pilot system is located off-channel of Plum Creek with protective banks tokeep the system from being impacted by floods. The system is designed as a S-shaped pond orlagoon. The final pond is about 45 ft (13.72 m) wide and 600 ft (182.88 m) long, with an averagedepth of 5 ft (1.52 m) and maximum surface acreage of 6.2 acres (2.5 hectares) (Figure 3-15). Asmall stilling basin was created near the outflow by placing a sandbag barrier across the pond witha flow-through pipe and float release valve. Discharge into the system and outflow from thesystem pass through similarly designed concrete boxes. These boxes have built-in flow weirs formeasuring flow.
Lemna System Site Plan
DRCOG, 1994.
Figure 3-15. Lemna nonpoint source treatment system.
Page 3-43

Protecting Natural Wetlands: A Guide to Stormwater Best Management Practices
The pond system is lined with a 20-mil PVC liner. A set of barriers was installed as shown inFigure 3-15. This barrier system was anchored to the sides of the pond with a cable system andwas designed to keep the duckweed plants evenly distributed across the pond’s surface. Adiversion structure was installed in Plum Creek. The system inflow sump tank and the returnoutflow line were installed immediately above and below the diversion structure, therebypreventing any drying of the stream as a result of this diversion. A small pump with a timer liftsthe water from the sump tank to the pond. Return flow relies on gravity, and the water isdischarged directly into Plum Creek below the point of diversion.
The final cost for the pilot project was $210,510, which was $42,510 more than the originalestimate for the project. The Chatfield Basin Authority anticipates spending an additional $7,500over the next year to complete its evaluation of the system as a BMP.
Operation and Results
Inoculation with native duckweed is the primary operation necessary for successful start-upof the system. Sources of duckweed included backwaters of streams and small ponds nearChatfield Reservoir. The Chatfield system start-up in April 1994 did not produce the desired plantdensities, and additional plant material was collected and added to the system in April and May1994. It appears that a low-nutrient duckweed system is much harder to inoculate and will requirea longer start-up period. Consequently, additional duckweed plants were added to the system andundesirable algae were harvested.
Low or unbalanced concentrations of nitrogen or phosphorus can limit growth ofduckweed. Typically, this is not a problem for duckweed systems that rely on wastewater butseems to be a problem with NPS pollution systems. Plum Creek was experiencing unusually lownitrogen loading rates during the start-up period, which was resulting in poor duckweed growth.Nitrogen was applied by spraying fertilizer onto the duckweed mat to compensate for nitrogendeficiency.
Hand harvesting was used on the pilot system, although large systems usually use amechanical harvester. An investigation was made of local markets and disposal options. The planttissue is not classified as a biosolid, and the Chatfield Basin Authority has identified no apparentdisposal problems. The biomass can be composted onsite by mixing it with a carbon supplementsuch as sawdust or wood chips.
Flow rates through the pilot duckweed system were designed at 23 days. The low streamflows in Plum Creek and low nutrient loads required changes to the flow rate through the system.The flow rate was shifted to a l0-day retention time. Based on a l0- day retention time and atypical growing season extending from April to November, the duckweed system can processabout 24 pond volumes per year. Monitoring data at the end of the first growing season suggestthat the flow rate could be reduced to 5 days. Flow rate evaluation studies will be done by theChatfield Basin Authority during the 1994-1995 monitoring program.
The preliminary data from the 1994 growing season monitoring program show that thesystem is reducing total phosphorus on the average of 71 percent per pond volume with an averageinfluent concentration of 0.1 ppm (0.1 mg/L) and a discharge concentration of 0.02 ppm (0.02mg/L). The range of total phosphorus removal varied from 50 to 98 percent as shown in Figure3-16. The preliminary water quality data suggest that a duckweed system used as a BMP couldachieve consistent 50 percent removal of nonpoint source phosphorus as required in the ChatfieldBasin Control Regulation.
Page 3-44

Summer Growing Season
DRCOG. 1994.
Figure 3-16. Range of total phosphorus removed by the Lemna system.
Conclusion
Although results of this project are preliminary, it appears that a scaled-up Lemna systemcould function as a regional water quality enhancement and wetland protection system byprocessing stream flows directly from Plum Creek or the South Platte River. The next steps theChatfield Basin Authority will take with the Lemna project include detailed water and biologicalquality monitoring, cost-effectiveness evaluation of the system, a study of harvest materialdisposal options, other research applications, and implementation of a full-scale nonpoint sourcemanagement system. When completed, the study will be submitted to the Urban andConstruction Subcommittee of the Colorado Nonpoint Source Task Force for consideration as aColorado Best Management Practice.
References/Additional Information:
DRCOG. 1994. Lemna nonpoint source treatment system: Final report and operation and maintenance manual.Denver Regional Council of Governments, Denver, CO.
Page 3-45

Protecting Natural Wetlands: A Guide to Stormwater Best Management Practices
EPA Region 9
Lincoln-Alvarado Project, Union City, California
A piece of property in Union City, California, consisting of 69 acres (28 hectares) of uplandhabitat and approximately 12 acres (4.8 hectares) of wetland habitat, was proposed for amultiphase warehouse/distribution complex. A section 404 permit was required from the Corps ofEngineers, San Francisco District, because 12.5 acres (5 hectares) fell within section 404jurisdiction. The landowners proposed that 9 acres (3.6 hectares) would be developed and theremaining 3 acres (1.2 hectares) would be incorporated into a 5-acre (2-hectare) onsite mitigationarea consisting of one-third marsh, one-third seasonal wetland, and one-third upland. Afterextensive review by the Corps and other federal agencies and negotiation with the applicant, theproject was approved with the following requirements that included pretreatment of runoff: (1)rainwater flow from the roofs of major buildings would be directed to grease/sediment traps andthen to wetlands, (2) 12 acres (4.8 hectares) of jurisdictional wetland would be preserved, (3) a1.18-acre (0.47-hectare) buffer would be established, and (4) funding for the permanentmaintenance would be provided by assessments on a ‘benefits district” of all properties in thesubdivision (Association of Bay Area Governments, 1991).
References/Additional Information:
Association of Bay Governments. 1991. San Francisco Estuary Project. Status and trends report on wetlands and
related habitats in the San Francisco Bay Estuary. Third draft. Prepared under cooperative agreement with U.S.Environmental Protection Agency. Agreement No. 815406-01-0. Association of Bay Area Governments,Oakland, CA.
EPA Region 10
Riparian Area Wetland Restoration Project, Sawmill Creek, IdahoSawmill Creek is located in the Bureau of Land Management’s (BLM) Big Butte Resource
Area, 37 mi (59.2 km) northwest of Howe, Idaho. Sawmill Creek resides within a 200,000-acre(81,000-hectare) watershed that drains a high-elevation (6,400 ft (1,950 m)) desert valleysurrounded by mountains. Soils are derived from alluvial deposits consisting of limestone andvolcanic debris. The climate is semiarid, with hot summers and cold winters. Annual precipitationaverages 100 to 114 in (254 to 289.56 cm); 66 percent occurs as snow. Cattle grazing is theprimary land use activity along the creek, and fishing and camping activities are steadilyincreasing.
Prior to 1986, the combined effects of flooding, wildfires, channelization, and fall grazinghad degraded the riparian area along Sawmill Creek, causing bank instability, lateral degradationof the stream channel, and reduced fish habitat. In response, the BLM and the Idaho Departmentof Fish and Carrie (IDFG) initiated the Sawmill Creek Project to restore the riparian zone andimprove channel morphology Specific project objectives included (1) improved growth, vigor,and regeneration of the riparian zone; (2) increased bank stability; (3) increased fish populations;and (4) improved channel morphology.
Pretreatment surveys conducted by the BLM and the IDFG enabled these agencies toidentify critical areas and develop a riparian restoration plan. Approximately 8 mi (12.8 km) ofSawmill Creek were treated by implementing the following BMPs.
Page 3-46

Case Studies
l Installation of 8 mi (12.8 km) of fencing along the creek, creating an upstream and adownstream riparian pasture. The upper 5 mi (8 km) of riparian pasture has been fenced-off and allotted for spring grazing only, while the lower 3 mi (4.8 km) has been excludedfrom grazing for up to 15 years. The previous grazing plan allowed season-long grazingthroughout the riparian zone.
l Establishment of upland troughs for off-site livestock water. Planting of willow andcottonwood cuttings in the lower half of the riparian pasture.
Photodocumentation was effectively used to monitor habitat improvement in thetreatment area. Project monitoring and evaluation included (1) established photo points, (2)reconnaissance inventories every 3 years, (3) a willow survivability inventory, (4) infrared aerialphotographs of the site to be repeated every 10 years, and (5) water quality sampling. The BMPimplementation resulted in increased bank stability in both riparian pastures and expandednatural riparian vegetation, especially onto gravel bars. However, survival of willow andcottonwood plantings has been poor. Beavers have moved back into the area, and fish habitatappears to have improved. Posttreatment response has been slower on the lower pasture(compared to the upstream pasture) due to greater channel instability and pretreatmentdegradation.
Funding for the restoration came from mitigation money from the Little Lost RiverDiversion Project supplied by the BLM, USDA Soil Conservation Service, and Butte Soil andWater Conservation District. Total project costs amounted to $90,000.
References/Additional Information:
Connin, S. 1991. Characteristics of successful riparian restoration projects in the Pacific Northwest. EPA 910/9-91-033. U.S. Environmental Protection Agency Region 10, Seattle, WA.
Sublett Creek Restoration Project, Idaho
Sublett Creek is located within the Burley Ranger District on the Sublett CattleAllotment in Sawtooth National Forest, approximately 55 mi (88 km) southwest of Burley, Idaho.The Sublett drainage encompasses approximately 917 acres (371 hectares) of high desert habitatand is intercepted at its base by an irrigation reservoir. Local topography consists of moderatelydissected mountains; soils are derived from limestone. The local climate is frigid with 17 in (43.18cm) of precipitation annually; 80 percent occurs as snow. Sublett Creek drains U.S. Forest Service(USFS) land except for the lower half mile (0.8 km) above Sublett Reservoir, which is on privateland. Because Sublett Creek maintains a popular cold-water fishery, recreational use is heavy.
By 1979, impacts from cattle and camping along Sublett Creek had changed the naturalcomposition of streamside vegetation from desirable riparian species to Kentucky bluegrass,thistle, and other undesirable weeds. The creek had widened, becoming more shallow. Willowswere absent along several sections of the creek. Stream bank stability had decreased, increasinginstream sediment loads and reducing gravel beds available for spawning trout. In addition, cattlewere dying (from bloating) after grazing on watercress growing along Sublett Creek. In responseto these disturbances, the USFS and the Idaho Department of Fish and Game (IDFG) surveyed thestream to inventory fish habitat and developed measures to protect and restore the riparian zone;the USFS conducted a riparian habitat survey Both surveys indicated that the drainage had beenseverely damaged. To protect and enhance the creek, the USFS initiated the Sublett CreekRestoration Project. Specific project objectives included (1) reducing cattle losses, (2) reducing
Page 3-47

Protecting Natural Wetlands: A Guide to Stormwater Best Management Practices
the impact on canyon bottoms and riparian areas from cattle grazing, (3) stabilizing the streamchannel, (4) reducing siltation, and (5) improving fish habitat.
A new grazing allotment management plan (AMP) was developed in 1983 in conjunctionwith the grazing permittee. The old allotment plan consisted of a rest rotation system in whichcattle were allowed to remain in a unit season long. The new AMP consists of a modified four-unit rest rotation system with a 5-year rotation. Each of the units is rested 1 year out of 5 exceptalong the north fork of Sublett Creek, which is rested 2 years out of 5. Grazing on this section isnow permitted only in the spring. Other BMPs included, (1) establishment of stream bankprotection structures along unstable portions of the creek (willows were planted, but survival hasbeen poor), (2) construction of several drift fences, (3) installation of log dams to createdownstream pools, (4) installation of two cattle troughs on upland sites, and (5) improvement ofpermittee herding and salting practices.
Posttreatment monitoring (since 1987) by the Sawtooth National Forest Riparian Teamincludes (1) sampling to obtain cross section measurements, (2) green line measurement, and(3) measurement of woody-species regeneration within the watershed. Photo points wereestablished prior to treatment and have been monitored since.
Since implementation of the new AMP, water quality and habitat in Sublett Creek haveimproved and the area also looks better. Posttreatment improvements include (1) improvedquality and quantity of spawning gravel, (2) increased stream bank stability (3) increasedproductivity of riparian meadows and forage, (4) improved flow duration, (5) narrower anddeeper stream channels, and (6) decreased cattle losses. Monitoring from 1987 to 1990 indicatesthat improvements are not continuous throughout all portions of the creek (Chard, 1991).Drought conditions over the past 5 years might have contributed to the slow recovery on portionsof Sublett Creek during the last few years.
Funding for the project was provided by the USFS and the Sublett Cattle Allotment GrazingAssociation. Project costs were split equally between these organizations; total costs amounted toapproximately $70,000, $10,000 of which was invested in the riparian zone.
References/Additional Information:
Chard, Jim. U.S. Forest Service, Burley, ID. Personal communication. July 1991.
Connin, S. 1991. Characteristics of successful riparian restoration projects in the Pacific Northwest. EPA 910/9-91-033. U.S. Environmental Protection Agency, Region 10, Seattle, WA.
Bear Creek Restoration Project, Crook County, OregonThe Bear Creek watershed is located southeast of Prineville, Oregon, in Crook County The
watershed drains to the west from its origin in the Maury Mountains in the Ochoco NationalForest. The Bear Creek watershed drains approximately 55,500 acres (22,478 hectares) ofrangeland habitat; elevations range from 3,400 to 5,532 ft (1,036 to 1,686 m). Local topographyconsists of rolling hills and valleys intersected by steep basaltic ridges and incised drainages. Soilsare derived from Columbia River basalt and volcanic ash. The climate is semiarid with 12 in(30.48 cm) of precipitation annually; 40 to 60 percent occurs as snow. Approximately 75 percentof the watershed occupies public lands managed by the BLM, and the remaining 25 percent isowned by cattle ranchers. The primary land use activity is cattle grazing.
Page 3-48

Case Studies
Since the 1860s intensive cattle grazing in the Bear Creek watershed had degraded riparianareas along Bear Creek, reducing woody riparian species, lowering the water table, destabilizingstream banks, and increasing instream sedimentation. Fire suppression on upland sites, coupledwith lowered water table levels permitted juniper to invade the watershed and replace nativeherbaceous species, resulting in large areas of bare, erosive ground and reducing available forage.Subsequent to these changes, heavy flooding and overland storm flow within the watershedaccelerated erosion and resulted in heavy sediment deposition in Prineville Reservoir and theCrooked River. To control and reduce these impacts, the BLM initiated the Bear CreekRestoration Project. Project objectives included (1) reducing juniper populations and replacingthem with herbaceous species, (2) increasing infiltration of precipitation into the soil, (3)stabilizing stream banks, and (4) increasing native riparian vegetation and raising the stream-bottom.
The Bear Creek Project involved 55,490 acres (22,473 hectares), of which 41,260 acres(16,710 hectares) were administered by the BLM and funded from 1972 to 1978. Juniper treeswere cut on upland sites (approximately 14,000 acres (5,670 hectares)). Then prescribed burnswere used to inhibit further juniper invasion and to aid establishment of herbaceous species.Thirty mi (48 km) of pasture and enclosure fencing was installed on both upland and ripariansites, enclosing approximately 2.25 mi (3.6 km) of riparian area. In addition, 16 mi (25.6 km) ofjuniper riprap was placed along banks on Bear Creek and several of its tributaries, sedimentcatchment dams were installed in the creek to raise the creek bottom, springs were developed onupland sites for livestock watering, and a new allotment management plan (AMP) was developedto reduce the impacts of grazing on riparian areas. The old plan allowed season-long grazing on arest rotation basis. Under the new plan, allotments were divided into a greater number ofpastures and a deferred grazing system (20-day rotation period) was used. Crazing permittees andlocal landowners constructed the pasture fencing and also installed some riprap.
Monitoring activities included (1) photo points on riparian and upland sites, (2) soil surfacefactor transects to rate erosive potential, (3) macroinvertebrate analysis, (4) cross section streamchannel measurement, (5) riparian habitat inventories, (6) stream channel evaluation, and(7) water quality sampling.
Project successes resulted from the watershed approach adopted by the BLM to reducesedimentation and restore the health of the entire drainage. Upland juniper populations havebeen effectively reduced, and herbaceous species are more prevalent. As a result, less bare groundnow exists, erosion rates have declined, and water absorption has improved, as evidenced by theappearance of new springs. Seventeen mi (27.2 km) of stream now support vigorous ripariangrowth, bank erosion has declined, and sediment deposition behind the catchments hascontrolled stream incision by elevating the stream bottom. The new AMP has provided sufficientprotection of the riparian areas to allow their regrowth. In addition, forage productivity hasincreased from 70 to 340 animal unit months (AUMs). An AUM is defined as the amount offorage required to maintain a mature l,000-lb (453.6-kg) cow or the equivalent for a l-monthperiod (USEPA, 1993).
The BLM funded the project with $650,000. Additional costs were borne by privatelandowners and livestock grazers in the watershed.
Page 3-49
Protecting Natural Wetlands: A Guide to Stormwater Best Management Practices
References/Additional Information:
Connin, S. 1991. Characreristics of successful riparian restoration project in the Pacific Northwest. EPA 910/9-91-033. U.S. Environmental Protection Agency, Region 10, Seattle, WA.
USEPA. 1993. Guidance specifying management measures for sources of nonpoint pollution in coastal waters.. EPA
840-D-92-002. U.S. Environmental Protection Agency, Office of Water, Washington, DC.
Camp Creek Restoration, Crook County, OregonCamp Creek is located 40 mi (64 km) southeast of Prineville in Crook County, Oregon. It
originates in the Maury Mountains of the Ochoco National Forest and drains to the east. TheCamp Creek watershed drains approximately 110,710 acres (44,838 hectares) of rangelandconsisting of sagebrush, juniper, and bunchgrass. This also includes coniferous forest habitat withelevations ranging between 3,665 and 6,12 1 ft (111 and 1865 m) . The drainage basin consists offluvial valleys surrounded by more resistant basalt buttes and hills. Soils consist of highly erodiblebentonitic and montmorillanitic clays. The climate is semiarid with 12 to 14 in (30.48 to 35.56cm) of precipitation annually; 20 percent occurs as snow. Approximately 59,000 acres(23,895 hectares) of the watershed are public land, and the remainder is held by privatelandowners. Land use within the basin includes livestock and hay production.
Overgrazing, mismanagement of livestock, fire control, and intensive road/loggingdevelopment since the late 1800s have accelerated stream bank and upland erosion, channelincision, dendritic gully spread, and riparian degradation, resulting in a drop in the local watertable. As a result, sagebrush and juniper have since invaded the area, replacing native grasses andreducing available forage. In response to these disturbances, the BLM initiated the Camp CreekRestoration Project in 1965. Project objectives included (1) stabilizing the steam channel and theraising the water table on 31.6 river miles (50.844 km) and 383 acres (155 hectares) of riparianhabitat, (2) improving stream water quality and reducing sediment discharge, (3) restoring theCamp Creek channel to 60 percent of its potential condition, and (4) increasing the forageresource base for wildlife and livestock.
In 1964, the BLM developed an initial Camp Creek watershed plan. Plan implementationincluded the following: (1) several detention dams were constructed, (2) 2.7 mi (4.34 km) ofCamp Creek were fenced off, (3) 1,000 Russian olive seedlings and willow cuttings were plantedalong the upper portion of the creek, (4) severely disturbed areas were reseeded with tallwheatgrass and sweetclover, (5) stream banks were riprapped with juniper trees, (6) juniper andsagebrush were removed from several upland sites by cutting, chaining, and burning, and (7) low-rock structures and gabions were installed in the creek to trap sediment and raise the water table.In 1978 an intensive water quality and macroinvertebrate sampling survey was initiated.Following continued watershed surveys, a revised watershed plan was drafted in 1985, whichinitiated a new rest-rotation grazing plan. (Prior to this, grazing was year-round on open range.)Private landowners have also removed juniper and placed riprap along the creek on their property.
Monitoring of the Camp Creek restoration project included (1) establishment of permanentphoto points on riparian and upland sites; (2) stream channel studies initiated in 1978 whichincluded water quality and macroinvertebrate surveys; (3) permanent range condition transects;(4) upland erosion study plots; and (5) an intensive riparian zone hydrology study, which wasinitiated in 1985.
Page 3-50

Case Studies
Success of the riparian restoration varied. Two to eight ft (0.51 to 2.44 m) of sediment wasdeposited behind instream structures. One livestock crossing effectively acted as a check dam.Beaver activity increased sediment deposition. Collectively these treatments have elevated thestream bottom and raised the water table within the floodplain. Juniper removal and prescribedburning enabled grasses to reestablish on upland sites, increasing available forage and augmentinginfiltration of precipitation into the soil. Juniper riprapping stabilized stream banks andincreased sediment deposition, allowing reestablishment of riparian plant species. Gabions weredamaged by heavy flooding, however, a year after installation, and Russian olive and willowplantings were drowned out by the rising water table. Fenced enclosures have been only partiallysuccessful in limiting access of livestock to the creek. Several grazing permittees have failed toprevent their cattle from damaging fencing and grazing within the enclosures.
Juniper removal and reintroduction of fire into the ecosystem have been essential to thenatural reestablishment of herbaceous plant species. Posttreatment structural maintenance hasbeen necessary to achieve project objectives. A shift from year-round grazing to spring and latefall grazing adjacent to the riparian zone will protect fencing from damage incurred as cattle seekshade and water during the summer months. Greater supervision of the site by the BLM andgrazing permittees will be necessary to keep cattle out of the riparian enclosures. Periodic surveysand monitoring have revealed unexpected changes in the riparian habitat, allowing the BLM toadopt new BMPs in response to these changes.
Financial support was appropriated from congressional funds, the Oregon Department ofFish and Wildlife, Oregon State University, range improvement funds returned from grazingpermits, and local landowners.
References/Additional Information:
Connin, S. 1991. Characteristics of successful riparian restoration projects in the Pacific Northwest. EPA 910/9-91-033. U.S. Environmental Protection Agency, Region 10, Seattle, WA.
The Chewaucan River Project, Lake County, Oregon
The Chewaucan River is located in Lake County, Oregon, approximately 10 mi (16 km)southwest of Paisley, Oregon. The Chewaucan River Watershed drains approximately 30 m2
(78 km2) of grassland/forest habitat with an average elevation of 6,000 ft. The upper portion ofthe watershed is a grassland meadow where Dairy Creek and Elder Creek join to form ChewaucanRiver. Downstream, the river drains several steep-sided canyons separated by open meadows. Soilsconsist of alluvial material derived from adjacent highlands. The climate is semiarid with 20 in(50.8 cm) of precipitation annually; 50 percent occurs as snow. The river basin is used for cattlegrazing, and several instream irrigation structures are present in the upper meadow (Schrader,1991).
Overgrazing throughout the drainage basin degraded riparian habitat and reduced streambank stability The confluence of Dairy Creek and Elder Creek was very unstable and highlyeroded. Spring flooding accelerated bank erosion throughout much of the upper basin. In 1964, aflood event deposited flow out of the main stream channel, causing bank blowouts. A newlandowner recognized these problems and enlisted the help of the Soil Conservation Service(now the Natural Resources Conservation Service) to obtain funding and expertise to rehabilitatethe area. The two groups initiated the Chewaucan River Project. Project goals included(1) stabilizing stream banks, (2) enhancing riparian vegetation, (3) improving fish habitat, and(4) eliminating erosion caused by dead snags lodged in the lower portion of the river.
Page 3-51

Protecting Natural Wetlands: A Guide to Stormwater Best Management Practices
In 1988, approximately 2 mi (3.2 km) of riparian area in the upper meadow, includingportions of Dairy Creek and Elder Creek, and 1 mi (1.6 km) in a downstream canyon were treated.Best management practices (BMPs) that were implemented included (1) riprapping stream bankswith juniper; (2) riprapping the confluence of Dairy Creek and Elder Creek with stone material;(3) placing boulders in the river to enhance fish habitat; (4) removing snags from the lowerportion of the river; (5) treating one highly disturbed stream corner with, a geotextile mat, whichwas then seeded and watered; (6) fencing 0.25 mi (0.4 km) of riparian pasture in the uppermeadow; (7) planting willows throughout the basin, and 8) excluding the lower pasture fromcattle grazing for 3 years.
Project monitoring was designed to include the establishment of five photo points along theriver to be monitored annually for a period of 10 years. Willow growth is also to be monitored for10 years.
Project results included increased sediment deposition in back eddies caused by juniperriprap, with riparian vegetation continuing to colonize the newly deposited sediment. Streambank stability increased throughout the treated portions of the river. Stream banks that hadsloughed onto riprapped sections were more sloped than previously. The geotextile mat workedvery well to stabilize the adjacent stream bank; however, it probably will not be used againbecause of its expense. Removal of snags in the downstream reach oriented the river back into themain thalweg, reducing bank erosion. Willow plantings were not as successful as othertreatments. Survivorship in the upper meadow was approximately 10 percent due to beavercutting and 40 percent in the lower meadow (Schrader, 1991). No immediate benefits to thefishery from habitat enhancement have been recorded (Schrader, 1991).
The Chewaucan River Project cost in excess of $50,000, which was provided primarily bythe Governor’s Watershed Enhancement Board with additional help from the Oregon Departmentof Fish and Wildlife, Soil Conservation Service, U.S. Forest Service, and owners of the J-SpearRanch.
References/Additional Information:
Connin, S. 1991. Characteristics of successful riparian restoration projects in the Pacific Northwest. EPA 910/9-91-033. US. Environmental Protection Agency, Region 10. Seattle, WA.
Schrader, Bill. Soil Conservation Service, Lakeview, OR. Personal communication. July 1991.
Page 3-52

Best Management Practices
Section 4Best Management Practices
his section describes some of the best management practices (BMPs) that might be usefulin protecting natural wetlands from the effects of stormwater runoff or useful as part of astormwater runoff treatment system that includes a natural wetland. The BMPs are
grouped as follows:
l Nonstructural BMPs- Pollution Prevention-Watershed Management Plans- Preventive Construction Techniques- Outreach and Educational Programs- Riparian Areas
l Structural BMPs- Infiltration Basins- Infiltration Trenches- Sand Filters- Grassed Swales-Vegetative Filter Strips-Vegetated Natural Buffers- Open Spaces- Extended Detention Dry Basins-Wet Ponds- Constructed Wetlands- Porous Pavement and Concrete Grid Pavement- Oil/Grit Separators or Water Quality Inlets- Level Spreaders- French Drains- Dry Wells or Roof Downspout Systems- Exfiltration Trenches
l BMPs in Series
Each BMP is described in a fact sheet that includes specific information about the BMP Thefact sheet for each nonstructural BMP includes a description of the practice and sources ofadditional information. The fact sheets for the structural BMPs, unconventional BMPs, and BMPsin series are more detailed and include a definition and purpose, the scope and applicability of theBMP, considerations for design criteria, potential impacts to wetlands, maintenance require-ments, and sources of additional information, as applicable.
Page 4-l

Protecting Natural Wetlands: A Guide to Stormwater Best Management Practices
The fact sheets are intended to provide information about different BMPs for evaluationpurposes. With information such as where a BMP is most applicable or what the potential impactson wetlands might be, a planner or watershed manager can develop a stormwater managementprogram that is as effective in protecting a wetland and all of its functions as it is effective intreating stormwater runoff.
It is important to note that the fact sheets are intended to be used as a planning tool and arenot meant to be used in the design of any of the BMPs. Other sources of information, such asthose listed at the end of each fact sheet, should be consulted for design, construction, andoperation and maintenance of the BMPs. It should also be noted that the BMPs included in thisdocument were selected because they have the potential, in a variety of situations, for reducingimpacts from stormwater runoff to wetlands. There are other BMPs that are not addressed here,primarily because they might offer only one or two specialized applications to wetlands.
Remember to look at the site-specific conditions and develop a stormwater managementprogram to protect an individual wetland based on those site-specific needs. Use the informationprovided in the first section of this document to help in identifying the particular conditions thatare unique to the site and to choose one or more BMPs accordingly.
Nonstructural BMPs - Pollution Prevention
Definition/Purpose
Pollution prevention is defined as the reduction or elimination of pollutant discharges tothe air, water, or land. Pollution prevention approaches to environmental protection include:
l Elimination of pollutants by substituting nonpolluting chemicals or products (e.g.,material substitution, changes in product specification), or altering product use.
l Reducing the quantity and/or toxicity of pollutants generated by production processesthrough source reduction, waste minimization, and process modifications.
l Recycling of waste materials (e.g., reuse, reclamation).
Pollution prevention measures are used to reduce pollutant discharges and can be imple-mented to reduce nonpoint source pollutants generated from the following activities:
l The improper storage, use, and disposal of household hazardous chemicals, includingautomobile fluids, pesticides, paints, solvents, etc.
l Lawn and garden activities, including the application and disposal of lawn and gardencare products and the improper disposal of leaves and yard trimmings.
l Turf management on golf courses, parks, and recreational areas.
l Improper operation and maintenance of onsite disposal systems.
l Discharge of pollutants into storm drains, including floatables, waste oil, and litter.
l Commercial activities such as parking lots, gas stations, etc.
l Improper disposal of pet excrement.
l Industrial wastewater disposal in septic systems.
Page 4-2

Best Management Practices
Scope/Applicability
Pollution prevention practices can be applied to reduce the generation of nonpoint sourcepollution in all areas and for numerous activities (e.g., residential, commercial, industrial,institutional, transportation, public and private facilities). Pollution prevention is implementedthrough various educational, volunteer, and incentive programs and through federal, state, andlocal policies and regulations. Pollution prevention practices include the following:
l Promoting public education programs regarding proper use and disposal of householdhazardous materials and chemicals.
l Establishing programs such as Amnesty Days to encourage proper disposal of householdhazardous chemicals.
l Developing used oil, used antifreeze, and hazardous chemical recycling programs and sitecollection centers in convenient locations.
l Encouraging proper lawn management and landscaping that includes proper pesticideand herbicide use, reduced fertilizer applications and proper application timing, limit-ing lawn watering, xeriscaping, reduced runoff potential, and training, certification,and licensing programs for landscaping and lawn care professionals.
l Encouraging proper onsite recycling of yard trimmings.
l Encouraging the use of biodegradable cleaners and other alternatives to hazardouschemicals.
l Managing pet excrement to minimize runoff into surface waters,
l Using storm drain stenciling in appropriate areas.
l Encouraging alternative designs and maintenance strategies for impervious parking lots.
l Controlling commercial sources of NPS pollutants by promoting pollution preventionassessments and developing NPS pollution reduction strategies and training materialsfor the workplace.
l Promoting water conservation.
l Discouraging the use of septic system additives.
l Encouraging litter control.
Promoting programs such as Adopt-a-Stream to assist in keeping waterways free oflitter and other debris.
l Promoting proper operation and maintenance of onsite sewage disposal systems (OSDS)through public education and outreach programs.
l Encouraging closure of floor drains or shallow disposal wells that direct pollutants togroundwater.
Potential Impacts to Wetlands
Benefitsl Reduces pollutants at their source, thereby reducing pollutant loads in stormwater and
downstream wetlands.
Page 4-3

Protecting Natural Wetlands: A Guide to Stormwater Best Management Practices
l Because discharges are prevented, reduces the need for structural BMPs and stormwatercontrols designed to remove pollutants from stormwater.
Limitationsl High participation crucial to success.
l Difficult to monitor results.
Sources of Additional lnformation
Alachua County Office of Environmental Protection. 1991. Best management practices for the use and storage ofhazardous materials. Alachua County Office of Environmental Protection, Gainesville, FL.
Broward County, Florida. March 20, 1980. Determining the effectiveness of sweeping commercial parking areas to
reduce water pollution. CPP task no. 13. Broward County Planning Council, Areawide Waste TreatmentProgram, Fort Lauderdale, FL.
Cahill Associates. 1991. Limiting NPS pollution from new development in the New Jersey coastal zone. State ofNew Jersey Department of Environmental Protection, Trenton, NJ,
California State Water Resources Control Board. 1983. Lake Tahoe Basin water quality plan. California StateWater Resources Control Board, Sacramento, CA.
Carlson, L., and E. Scott. 1988. Final report: An assessment of nonpoint sources of pollution to Rhode Island’swaters. Rhode Island Department of Environmental Management, Providence, RI.
P a g e 4 - 4

Best Management Practices
Chesapeake Bay Local Government Advisory Committee. 1991. Chesapeake Bay Restoration: Innovations at the
local level. U.S. EPA Chesapeake Bay Program, Washington, DC.
Citizen’s Clearinghouse for Hazardous Wastes. Household hazardous wastes fact pack.
Citizens Program for the Chesapeake Bay. 1986. Baybook: A guide to reducing water pollution at home.
Cook College, Department of Environmental Resources. 1989. Watershed management strategies for New Jersey.
Rutgers, the State University of New Jersey, NJ Agricultural Experiment Station. Publication no. H-17505-1-
89.
Delaware Department of Natural Resources and Environmental Control. 1989. Household hazardous waste.
Clean water series. Delaware Department of Natural Resources and Environmental Control, Dover, DE.
Delaware Department of Natural Resources and Environmental Control. 1989. Oil recycling. Clean water
series. Delaware Department of Natural Resources and Environmental Control, Dover, DE.
District of Columbia Department of Consumer and Regulatory Affairs. 1989. Homeowners urban guide on
ground maintenance. District of Columbia Department of Consumer and Regulatory Affairs, Washington,DC.
Cibb, A., B. Bennett, and A. Birkbeck. 1991. Urban runoff quality and treatment: A comprehensive review.
British Columbia Research Corporation. File No. 2-51-246(242). Prepared for Greater Vancouver RegionalDistrict Municipality of Surrey, British Columbia Ministry of Transportation and Highways, and BritishColumbia Ministry of Advanced Education and Training, Vancouver, BC, Canada.
Hansen, R.C., and K.M. Mancl. 1989. Modern composting: A natural way to recycle wastes. Bulletin no. 792.Ohio State University
Hoffman, E.J. 1980. Waste lubricating oil disposal practices in Providence, Rhode Island: Potential significanceto coastal water quality Coastal Zone Management Journal 8(4).
Jackson, J.E., N.N. Lillquist, A.L. Schaedel, G.B. Sutherland, and R.S. Wood. 1989. Oregon nonpoint source
management plan. Oregon Department of Environmental Quality and the Environmental Quality Commission,Portland, OR.
Jensen, R. 1991. Indoor water conservation: Toilets, shower heads, washing machines and faucets can all useless water. Texas Water Resources 17(4): l-6.
King County, Washington. 1990. Local hazardous waste management plan for Seattle-King County. King CountySolid Waste Division, Seattle, WA.
Klein, R.D. 1990. Protecting the aquatic environment from the effects of golf courses. Community and Environmental
Defense Associates, Maryland Line, MD.
La Valle, P.D. 1975. Domestic sources of stream phosphates in urban streams. Water Research 9:913-915.
Land Management Project. Undated. The land management project completion report: LMP publication appendix.
Rhode Island Department of Environmental Management and U.S. Environmental Protection Agency, Provi-dence, RI.
Land Management Project. 1990. Alternative turf The Land Management Project - best management practices series.BMP fact sheet #7. Land Management Project, Providence, RI.
Livingston, E., E. McCarron, C. Cox, and P. Sanzone:. 1993. The Florida development manual: A guide to sound
land and water management. Stormwater/Nonpoint Source Management Section, Florida Department ofEnvironmental Regulation, Tallahassee, FL.
Page 4-5
Protecting Natural Wetlands: A Guide to Stormwater Best Management Practices
Maine State Planning Office, Maine Coastal Program. 1991. The estuary book: A guide IO promoring understand-
ing and regional management of Maine’s estuaries and embayments. Maine State Planning Office, Augusta, ME.
Minnesota Pollution Control Agency. 1989. Protecting water quality in urban areas. Minnesota Pollution
Control Agency, Division of Water Quality
Myers, J.C. 1988. Governance of nonpoint source inputs to Narragansett Bay: A plan for coordinated action. TheNarragansett Bay Project, Rhode Island Department of Environmental Management and U.S. EnvironmentalProtection Agency, Providence, RI.
Nassau-Suffolk Regional Planning Board. May 1978. Non-point source controls planning options, areawide
recommendations, legal needs, Summary plan: Interim report series: 7. Prepared pursuant to Section 208, Federal
Water Pollution Control Act Amendments of 1972 (PL 92-500). Nassau-Suffolk Regional Planning Board,Haupauge, NY
New Jersey Department of Environmental Protection, Division of Water Resources. Pamphlets promotingsolutions and suggestions for citizens concerned about clean water in New Jersey: The clean water book; Cleanocean information about: litter, plastics, animal waste, and motor oil; New Jersey Water Watch; and others.
New York Department of Environmental Conservation, Division of Water. 1986. Chapter 6: Best manage-ment practices, Stream corridor management: A basic reference manual.
Northern Virginia Planning District Commission. 1987. BMP handbook for the Occoquan Watershed. Preparedfor Occoquan Basin Nonpoint Pollution Management Program. Northern Virginia Planning District Commis-sion, Annadale, VA.
Northern Virginia Soil and Water Conservation District. 1980. You and your land: A homeowner’s guide for Fairfax
County. Northern Virginia Soil and Water Conservation District, Fairfax, VA.
Northern Virginia Soil and Water Conservation District. 1991. Please don't feed our streams. Northern Virginia Soiland Water Conservation District, Fairfax, Virginia.
Puget Sound Water Quality Authority. 1986. Issue paper: Nonpoint source pollution.
Ridgley, S. 1987. Hazardous waste from Minnesota households. Minnesota Pollution Control Agency, HouseholdHazardous Waste Pilot Collection Project, St. Paul, MN.
Robertson, D.K., J. Akagha, J. Belasco, J. Bullis, C. Byrne, J. DiPatria, W. Fisher, J. Fonzino, J. Hsu, L. Merchan, D.Oster, J. Rosenberg, S. VonAulock, and B. Vroeginday. 1987. Liquid household hazardous wastes in the UnitedStates: Identification, disposal, and management plan. Environmental Management ll(6): 735-742. Academic
Press Limited.
Robinson, J.H., and H.S. Snyder. Undated. Golf course development concerns in coastal zone managementUnpublished paper.
Salt Institute. 1991. Salt and highway deicing. Series 26, Issue 2. Salt Institute, Alexandria, VA.
Santa Clara Valley Nonpoint Source Pollution Control Program. Undated. Best management practices forautomotive-related industries. Santa Clara Valley Nonpoint Source Pollution Control Program, San Jose, CA.
University of Maryland, Cooperative Extension Service. 1983. Lawn care in Mary/and. Bulletin 171.
U.S. Department of the Interior, Undated. Pollution prevention handbook. Pollution Prevention Series. U.S.Department of the Interior, Washington, DC.
USDOC, NOAA. 1990. Coastal management solutions to nonpoint source water pollution. Tech. asst. bul. 102.51U.S. Department of Commerce, National Oceanic and Atmospheric Administration.
Page 4-6
Best Management Practices
USEPA. 1984. Report to Congress: Nonpoint source pollution in the U.S. U.S. Environmental Protection Agency,
Washington, D.C.
USEPA. 1986. Septic systems and ground-water protection: A program manager’s guide and refercnce Book. U.S.Environmental Protection Agency, Office of Ground-Water Protection, Washington, D.C.
USEPA. 1988. Used oil recycling. EPA/530-SW-89-006. U.S. Environmental Protection Agency, Office of Solid
Waste, Municipal Solid Waste Task Force, Washington, DC.
USEPA. 1989. How to set up a local program to recycle used oil. U.S. Environmental Protection Agency, Office
of Solid Waste and Emergency Response, Washington, DC.
USEPA. 1989. Recycling works: State and local solutions to solid waste management. EPA/530-SW-89-014. U.S.Environmental Protection Agency, Office of Solid Waste, Washington, DC.
USEPA. 1991. Guides to pollution prevention-The automotive refinishing industry. EPA/625/7-91/ 016. U.S. Environ-mental Protection Agency, Office of Research and Development, Cincinnati, OH.
USEPA. 1992. Stormwater management for construction activities: Developing pollution prevention plans and best
management practices. EPA 832-R-92-005. U.S. Environmental Protection ,Agency, Office of Water, Washington,
DC.
USEPA. 1993. Guidance specifying management measures for sources of nonpoint pollution in coastal waters. EPA840-B-92-002. U.S. Environmental Protection Agency, Office of Water, Washington, DC.
USEPA. 1993. Urban runoff management information/education products. U.S. Environmental Protection
Agency, Region 5, Water Division, Wetlands and Watershed Section, Watershed Management Unit, Chicago,IL.
U.S. General Accounting Office. 1990. Water pollution: Greater EPA leadership needed to reduce nonpoint sourcepollution. GAO/ RCED-91-10.
Virginia Cooperative Extension Service. 1990. Report of the Virginia Cooperative Extension Service of Virginia
Polytechnic Institute and State University on pesticides and fertilizers in the urban environment. House documentno. 14. Commonwealth of Virginia, Richmond, VA.
Virginia Department of Conservation and Recreation. 1979. Best management practices handbook: Urban.Virginia Department of Conservation and Recreation, Division of Soil and Water Conservation, Richmond,VA.
Voorhees, P.H. 1989. Generation and flow of used oil in the United States in 1988. Presented at GovernmentInstitutes/NORA Conference on Used Oil: Management & Compliance, Prepared for U.S. Environmental
Protection Agency, Office of Solid Waste, Economic Analysis Staff, Washington, DC, November 28, 1989.
Washington State Department of Ecology. 1991. Water quality guide: Recommended pollution control practices for
homeowners and small farm operators. #87-30 Washington State Department of Ecology Olympia, WA.
Whalen, J. 1989. Pest management around your home. Water quality: It’s not just a drop in the bucket - You canmake difference. University of Delaware. Fact Sheet NPS 6.
World Wildlife Fund, The Conservation Foundation. 1991. Gettlng at the source: Strategies for reducing
municipal solid waste. World Wildlife Fund, Baltimore, MD.
Young, K., and D.L. Danner. March 31, 1982. Urban planning criteria for non-point source water pollutioncontrol. Department of Civil Engineering, Catholic University.
Page 4-7

Protecting Natural Wetlands: A Guide to Stormwater Best Management Practices
Nonstructural BMPs - WatershedManagement Plans
Definition/Purpose
Watershed planning is a process for determining future activities within a watershed andshould be a first step in implementing an effective stormwater/wetlands management program.Watershed planning usually involves the development of a watershed management plan thatdescribes existing patterns of community life in a watershed-including demographic trends,housing, economic activity, natural resources, and infrastructure. In addition, watershed manage-ment plans should recommend goals and policies (including control of land use) to manage futuredevelopment that should, in turn, minimize impacts on water resources, including wetlands.
A watershed management plan is based on a series of maps of the watershed and its re-sources. The watershed management plan also contains text that explicitly addresses conflicts andtrade-offs among development, environmental protection, social issues (such as affordablehousing), transportation, and many other factors. Special-purpose planning (including wellheadprotection, underground injection control, and wetlands management planning) is one compo-nent of a watershed plan. A generalized watershed is shown in Figure 4-1.
Figure 4-1. A generalized watershed showing natural and anthropogenic features.
Page 4-8

Best Management Practices
Watershed management plans can be developed for any geographic area and are usuallyapplied through the use of watershed overlay maps or a geographic information system. Mostwatershed management plans are implemented at the state and local government levels.Figures 4-2 and 4-3 indicate varieties of watershed management planning map resources.
Potential Impacts to Wetlands
Benefitsl Allows for resource inventory, including identifying wetland resources on a watershed
scale.
l Allows for information analysis, including locating individual wetlands with respect toother wetlands, adjacent land uses, and adjacent water bodies.
l Allows wetland managers to assess wetland protection needs, develop wetland protec-tion and restoration goals, plan mitigation strategies, and determine impacts from landuse changes to wetland resources.
l Serves as a modeling mechanism to be used for testing various land use/stormwatercontrol scenarios within the watershed to determine options to best preserve overallwetland function or improve the health of a degraded wetland system.
LARGE
WATERSHED
Adapted from MWCOG, 1993.
Figure 4-2. Watersheds nest within each other. The site indicated lies within both a small watershedand larger watershed.
Page 4-9

Protecting Natural Wetlands: A Guide to Stormwater Best Management Practices
Adapted from MWCOG, 1993.
Figure 4-3. Overlay zoning adds another measure ofprotection to critical resources.
Limitationsl Watershed boundaries frequently overlap political boundaries.
Sources of Additional Information
Aldrich, J.A., K.A. Cave, J.E. Swanson, and J.P. Hartigan. 1988. Stormwater master planning in urban coastalareas: The Virginia Beach master plan. In Proceedings of the Symposium on Coastal Water Resumes, AmericanWater Resources Association.
Alexandria Department of Transportation and Environmental Services. 1992. Alexandria supplement to the
Northern Virginia BMP handbook. Alexandria Department of Transportation and Environmental Services,Alexandria, VA.
Coffey, S., W. Berryhill, M. Smolen, and D. Miller. 1989. Watershed screening for nonpoint source impacts and
controls. Document No. 87-EXCA-3-8030. North Carolina State University and U.S. Environmental Protec-tion Agency.
Franklin County, Florida. 1987. Chapter 28-22.100, 22.201, Land planning regulations for the Appalachicola
Buy Area Critical State Concern. Franklin County Administration Commission, Appalachicola, FL.
Howard-Strobel, M.M., TC. Simpson, and T.P. Dillingham. 1987. The Narrow River special area management
plan. Rhode Island Coastal Resources Management Council.
Page 4-10

Best Management Practices
Livingston, E.H. 1989. Florida nonpoint source management plan. Vol. II. Nonpoint Source Pollution Management
Programs. Florida Department of Environmental Regulation. Chapter 8.
Marsalek, J., and H.Y.F. Ng. 1989. Evaluation of pollution loadings from urban nonpoint sources: Methodol-ogy and applications. Journal of the Gear Lakes Reservoir 15(3).
Martin, S.R. 1988. An urban stormwater retrofit assessment and planning method. In Symposium on Coastal
Water Resources, American Water Resources Association.
Metropolitan Washington Council of Governments, Washington Metropolitan Water Resources Planning
Board. 1983. Urban runoff in the Washington metropolitan area; Final report. Washington D.C. Urban RunoffProject, EPA Nationwide Urban Runoff Program. Metropolitan Washington Council of Governments,
Washington, DC.
Myers, J.C. 1988. Governance of nonpoint source inputs to Narragansett Buy: A plan for coordinated action. TheNarragansett Bay Project, Rhode Island Department of Environmental Management and U.S. Environmental
Protection Agency, Providence, RI.
New York-New Jersey Harbor Estuaries Program. 1989. Nonpoint source pollution action plan.
Northern Virginia Planning District Commission. 1990. Evaluation of regional BMPs in the Occoquan Watershed.
Northern Virginia Planning District Commission. Annandale, VA.
Oregon Land Conservation and Development Commission. 1989. Chapter 660, Oregon Administrative Rules.
Puget Sound Water Quality Authority. 1989. Managing nonpoint pollution: An action plan handbook for PugetSound watersheds. Puget Sound Water Quality Authority
Schueler, TR., J. Galli, L. Herson, P Kumble, and D. Shepp. 1991. Developing effective BMP systems for urbanwatersheds. Anacostia Watershed Restoration Team. Metropolitan Washington Council of Governments,Washington, DC.
South Florida Water Management District. April 1989. Surface water improvement and management (SWIM)
plan for Biscayne Bay. South Florida Water Management District, West Palm Beach, FL.
South Florida Water Management District. 1989. Technical document in support of chapter 40E-61, works of thedistrict within the Lake Okeechobee Basin.
USEPA. 1990. The lake and reservoir restoration guidance manual. 2nd ed. EPA-440/4-90-006.
USEPA. 1991. Nonpoints Source Watershed Workshop: Seminar Publication. EPA/625/4-91/027. Prepared byEastern Research Group for the U.S. Environmental Protection Agency, Office of Research and Development,Center for Environmental Research Information, Cincinnati, OH.
Wisconsin Department of Natural Resources and Wisconsin Department of Agriculture, Trade, and ConsumerProtection. 1990. A nonpoint source control plan for the Milwaukee River South Priority Watershed Project.
Document no. WR-24590. Ozaukee County Land Conservation District and the Milwaukee River South
Advisory Subcommittee.
Page 4-11

Definition/Purpose
Protecting Natural Wetlands: A Guide to Stormwater Best Management Practices
Nonstructural BMPs - preventive Construction Techniques
Preventive construction techniques are practices applied to construction sites to controlpollution at the source. Pollution source controls are implemented throughgood management andhousekeeping techniques designed to minimize nonpoint source pollution from the sites. Typi-cally, preventive construction techniques are developed to control runoff volumes and sediment,but they can also be designed to control other NPS pollutants such as nutrients, oil and grease, andpesticides.
An overall management plan for the control of nonpoint source pollution on a constructionsite that addresses specific control measures to be implemented in an effective manner can beapplied as a preventive construction technique. The construction site pollution control planshould address specific categories including erosion and sediment controls, equipment mainte-nance and repairs, waste collection and disposal, storm sewer inlet protection, dust controls,storage of construction materials, washing areas, demolition areas, sanitary facilities, and pestcontrols. Some management and housekeeping techniques applied to these categories shouldinclude the development and implementation of an effective erosion and sediment control plan;the proper location of activities that can act as a source of pollutants to wetlands, streams, orstormwater conveyance systems in areas that are not subject to surface water runoff; the place-ment of filtering devices to protect conveyance systems from settleable pollutants duringconstruction; the proper use and storage of chemicals; proper collection and disposal of wastes ona site with adequate and properly located receptacles; and the maintenance of a site in a neat andorderly condition.
Preventive construction techniques are used to minimize the contamination of stormwateron a site by reducing the availability of construction-related pollutants that might contaminaterunoff. Where the contamination of runoff water cannot be avoided, pollutants and pollutedwater are controlled on site.
Preventive construction techniques can be applied to all construction projects. The plan-ning and management techniques applied to a location should be adapted to the site- specificcharacteristics of a project. Thedegree of planning and manage-ment necessary to prevent orminimize nonpoint sourcepollution on a site will depend,primarily, on the size and com-plexity of the project.See Figure 4-4.
Figure 4-4. Preventive constructiontechniques.
Page 4-12

Best Management Practices
Design Criteria Considerations
Develop an overall plan for the control of nonpoint source pollution that addressesspecific measures that can be described and implemented in an effective manner.
Develop a plan that is specific to the characteristics of a site.
Potential Impacts to wetlands
Benefitsl Reduction in the amount of stormwater-associated pollutants entering adjacent or
downstream wetlands.
l Reduction of construction site erosion resulting in a reduction of stormwater sedimentloads to downstream wetlands.
l Reduction in the potential for downstream wetland degradation resulting from erosionassociated with peak stormwater flows.
Limitationsl Possible reduction in the amount of surface water supplied to adjacent or downstream
wetlands as a result of rerouting.
Livingston, E., E. McCarron, C. Cox, and P. Sanzone. 1993. The Florida development manual: A guide to sound
land and water management. Stormwater/Nonpoint Source Management Section Florida Department ofEnvironmental Regulation, Tallahassee, FL.
USEPA. 1993. Guidance for specifying management measures for sources of nonpoint pollution in coastal waters.
EPA 840-B-92-002 U.S. Environmental Protection Agency, Office of Water, Washington, DC.
Washington State Department of Ecology 1992. Stormwater management manual for the Puget Sound Basin.Publication no. 91-75. Washington State Department of Ecology, Olympia, WA.
Nonstructural BMPs - Outreach and Education Programs
Definition/Purpose
Educational programs should improve wetlands protection program implementation bymaintenance personnel and government officials and should reduce individual contributions tostormwater problems. Training programs and educational materials for public officials, contrac-tors, and the public are crucial to implementing effective stormwater management programs.Educational programs for public officials, contractors, and the public are also necessary to teachthe value of natural wetlands and the potential impacts of stormwater runoff. Contractorcertification and inspector training are important educational programs that add to the success ofstormwater management programs and their continued effectiveness. Programs for the public can
Page 4-13

Protecting Natural Wetlands: A Guide to Stormwater Best Management Practices
educate and encourage participation and support for pollution prevention efforts such as stormdrain stenciling, used oil and hazardous chemical recycling, litter control, street sweeping, lawnmanagement and landscaping, safe use and disposal of household hazardous materials and chemi-cals, correct operation of onsite disposal systems, proper pet excrement disposal, water conserva-tion, and closure of shallow disposal systems that direct pollutants to groundwater.
Scope/Appilcability
Educational programs can be implemented in homes, residential communities, and at theworkplace. Training and certification programs can be implemented at all levels of governmentand through numerous private and public institutions involved in wetland and stormwatermanagement including developers, contractors, scientists, engineers, and professional associa-tions. The states of New Jersey, Virginia, Maryland, Washington, and Delaware, and the city ofAlexandria, Virginia, are examples of governments whose agencies have developed manuals andtraining materials to assist in the implementation of urban runoff requirements and regulations(USEPA, 1993).
Numerous public and private institutions are involved in or sponsor public educationprograms, such as environmental organizations; neighborhood, business, civic, and professionalassociations; school systems; churches; Boy Scouts and Girl Scouts of America; and 4-H Clubs. Acommon program is storm drain stenciling to enhance public awareness (see Figure 4-5). Educa-tional programs can be achieved through various public outreach media, including newsletters,magazines, newspaper, audiovisuals, public meetings, or workshops.
Figure 4-5. Stencil spray painting to enhance public awareness.
Page 4-14

Potential Impacts to Wetlands
Best Management Practices
Benefits
l Teaches the public the value of natural wetlands and the positive and negative impactsof stormwater.
l Teaches the public how pollutants can impact wetlands via stormwater runoff and howto prevent pollution from entering surface waters and groundwaters.
l Provides opportunities for the public to participate in decision-making activities, toobserve wetlands and other aquatic ecosystems, and to gain “hands on” experience in thefield.
l Prepares government officials and personnel to implement their stormwater and wetlandprograms effectively and consistently, to make educated decisions regarding stormwatercontrols, and to communicate the goals and objectives of stormwater/wetland policies tothe public.
Limitations
l High participation crucial to the success of many public education programs
l Difficult to monitor results.
l Program results might not be realized for some time.
l Programs require continuous funding and demands on personal time.
Barton, S.S. 1989. Landscape management. Water quality: It’s not just a drop in the bucket - You can make adifference Fact sheet NPS 10. University of Delaware.
Barton, S.S. 1989. Lawn management for conservation. Water quality: It’s not just a drop in the bucket - You canmake a difference Fact sheet NPS 11. University of Delaware.
Chesapeake Bay Foundation. 1989. Homeowner series: Septic systems and the Bay. Chesapeake Bay Foundation.
Citizen’s Clearinghouse for Hazardous Wastes. Household hazardous wastes fact pack.
Citizens Program for the Chesapeake Bay. 1986. Baybook: A guide to reducing water pollution at home.
Baltimore, MD.
Delaware Department of Natural Resources and Environmental Control. 1989. Detergents and phosphorus.
Clean water series. Delaware Department of Natural Resources and Environmental Control, Dover, DE.
Delaware Department of Natural Resources and Environmental Control. 1989. Household hazardous waste.Clean water series. Delaware Department of Natural Resources and Environmental Control, Dover, DE.
Delaware Department of Natural Resources and Environmental Control. 1989. Oil recycling. Clean water
series. Delaware Department of Natural Resources and Environmental Control, Dover, DE.
Delaware Department of Natural Resources and Environmental Control. 1989. Septic systems. Clean waterseries. Delaware Department of Natural Resources and Environmental Control, Dover, DE.
Page 4-15

Protecting Natural Wetlands: A Guide to Stormwater Best Management Practices
District of Columbia Department of Consumer and Regulatory Affairs. 1989. Homeowners urban guide on
ground maintenance. District of Columbia Department of Consumer and Regulatory Affairs, Washington, DC,
Firehock, K. 1991. Virginia’s Erosion and Sediment Control Law: A citizen’s action guide. Virginia Save OurStreams Program, Izaak Walton League of America.
Hansen, R.C., and K.M. Mancl. 1989. Modern tomposting: A natural way to recycle wastes. Bulletin no. 792.
Ohio State University.
Himelick, K. 1989. Landscape design for water conservation. Water quality: It’s not just a drop in the bucket - You
can make a difference. Fact sheet NPS 8. University of Delaware, Newark, DE.
Himelick, K. 1989. Plant selection for conservation. Water quality: It’s not just a drop in the bucket - You can make
a difference. Fact Sheet NPS 9. University of Delaware, Newark, DE.
Land Management Project. 1990. Biological mosquito control, The Land Management Project - Land use andwater quality series. Fact sheet 87. Land Management Project, Providence, RI.
Land Management Project. 1990. Stormwater and wetlands, The Land Management Project - Land Use andWater Quality Series. Fact sheet #6. Land Management Project, Providence, RI.
Land Management Project. Undated. The Land Management Project completion report: LMP publicationsappendix. Rhode Island Department of Environmental Management and U.S. Environmental Protection
Agency, Providence, RI.
Livingston, E.H. 1989. Florida Nonpoint Source Management Plan. Vol. II Nonpoint Source Pollution Manage-
ment Programs. Florida Department of Environmental Regulation. Chapter 8.
Livingston, E.H., and E. McCarron. 1992. Stormwater management: A guide for Floridians. Florida Departmentof Environmental Regulation, Stormwater/Nonpoint Source Management, Tallahassee, FL.
Maine State Planning Office, Maine Coastal Program. 1991. The estuary book: A guide to promoting understand-ing and regional management of Maine’s estuaries and embayments. Maine State Planning Office, Augusta, ME.
Mancl, K.M. 1985. Mound system for wastewater treatment. Agricultural engineering fact sheet. DocumentNo. SW-43. Pennsylvania State University, College of Agriculture, Cooperative Extension Service.
Mancl, K.M. 1985. Septic system failure. Agricultural engineering fact sheet. Document No. SW-41. PennsylvaniaState University, College of Agriculture, Cooperative Extension Service.
Mancl, K., and W.L. Magette. 1991. Correcting septic system pro&/ems. Water Resources Information, MarylandWater Resources Research Center.
Mancl, K., and W.L. Magette. 1991. Maintaining your septic tank. Water Resources Information, MarylandWater Resources Research Center.
Mancl, K., and W.L. Magette. 1991. Using septic tank-soil absorption systems in Maryland. Water ResourcesInformation, Maryland Water Resources Research Center.
Nebraska Department of Natural Resources. Undated. National Resources Districts, unique, progressive
leadership in conservarion.
New Jersey Department of Environmental Protection, Division of Water Resources. Pamphlets promotingsolutions and suggestions for citizens concerned about clean water in New Jersey: The clean water book; Clean
ocean information about: litter, plastics, animal waste, and motor oil; New Jersey Water Watch; and others.
Page 4-16

Best Management Practices
Northern Virginia Soil and Water Conservation District. 1980. You and your land: A homeowner’s guide for
Fairfax County. Northern Virginia Soil and Water Conservation District, Fairfax, VA.
Northern Virginia Soil and Water Conservation District (NVSWCD). 1991. Please don’t feed our streams
Northern Virginia Soil and Water Conservation District, Fairfax, VA.
Oregon Department of Land Conservation and Development. Undated. Oregon Coastal Management Program:
A citizen’s guide. Funded by the Office of Ocean and Coastal Resource Management, National OceanicAtmospheric Administration.
Ohio Environmental Protection Agency Division of Water Quality Planning and Assessment. 1991. Nonpoint
Source Education/Demonstration Project evaluation report, nonpoint source pollution abatement in Ohio 1984-1987.
Pitt, D.G., W. Gould, Jr., and L. LaSota. 1990. Landscape design to reduce surface water pollution in residential
areas. Water Resources 32. Water Resources Information, University of Maryland System, Cooperative
Extension Service.
Puget Sound Water Quality Authority 1989. Managing nonpoint pollution: An action plan handbook for Puget
Sound watersheds. Puget Sound Water Quality Authority
Salt Institute. 1983. Deicing salt facts (A quick reference).
Shaver, H.E., and F.M. Piorko. Undated. The role of education and training in the development of the DelawareSediment and Stormwater Management Program. Delaware Department of Natural Resources and Environmen-
tal Control, Dover, DE.
South Florida Water Management District. April 1989. Surface water improvement and management (SWIM)
plan for Biscayne Bay. South Florida Water Management District, West Palm Beach, FL.
Southwest Florida Water Management District. Undated. A citizens guide to the S.W.I.M. Priority List.
University of Maryland. 1983. Lawn care in Maryland. University of Maryland, Cooperative ExtensionService, College Park, MD. Bulletin 171.
U.S. Department of the Interior. Undated. Pollution prevention handbook. Pollution Prevention Series. U.SDepartment of the Interior, Washington, DC.
USEPA. 1988. Used oil recycling. EPA/530-SW-89-006. U.S. Environmental Protection Agency, Office of SolidWaste, Municipal Solid Waste Task Force, Washington, DC.
USEPA. 1989. How to set up a local program to recycle used oil. U.S. Environmental Protection Agency, Officeof Solid Waste and Emergency Response, Washington, DC.
USEPA. 1991. Nonpoint Source Watershed Workshop: Seminar publication. EPA/625/4-91/027. Prepared by
Eastern Research Croup for the U.S. Environmental Protection Agency, Office of Research and Development,Center for Environmental Research Information, Cincinnati, Ohio.
USEPA. 1993. Urban runoff management information/education products. U.S. Environmental ProtectionAgency, Region 5, Water Division, Wetlands and Watershed Section, Watershed Management Unit, Chicago,IL.
Washington State Department of Ecology 1991. Water quality guide: Recommended pollution control practices for
homeowners and small farm operators. No. 87-30. Washington State Department of Ecology, Olympia, WA.
Page 4-17

Definition/Purpsoe
Scope/Applicability
Protecting Natural Wetlands: A Guide to Stormwater Best Management Practices
Westchester County, New York. 1981. Water quality management program: Best management practices manual onhighway deicing storage and application methods. Westchester County, White Plains, NY.
Whalen, J. 1989. Pest management around your home. Water quality: It’s not just a drop in the bucket - You can
make a difference. Fact Sheet NPS 6. University of Delaware.
Wisconsin Legislative Council. 1991. Wisconsin legislation on nonpoint source pollution. Report no. 9. Wisconsin
Legislative Council.
Younger, L.K., and K. Hodge. 1992. 1991 International Coastal Cleanup results. Center for Marine Conserva-tion, Washington, DC.
Nonstructural BMPs - Riparian Areas
Riparian areas are vegetated ecosystems along a water body through which energy, material,and water pass. These areas characteristically have a high water table and are subject to periodicflooding and influence from the adjacent water body. Riparian areas encompass wetlands,uplands, or combinations of these areas, and environmental conditions in the zone at timesresemble both wetland and upland. The complex organizations of biotic and abiotic elements thatmake up riparian areas can be effective in removing suspended solids, nutrients, and othercontaminants from stormwater runoff.
Maintaining natural riparian areas helps to slow stormwater runoff, trap sediment, andreduce the volume of runoff by allowing some infiltration to occur. Reducing the velocity ofstormwater runoff attenuates soil erosion processes and increases runoff contact time with soiland vegetative surfaces. Increased contact of stormwater runoff with the soils and vegetation in ariparian area can result in the infiltration of runoff and the filtration or uptake of stormwater-associated pollutants.
Riparian areas are important to both the wetland and the upland as habitat for aquatic andwetland-dependent wildlife species, as refuges for wildlife species during high-water events, asseed reservoirs, and as buffers against extreme environmental conditions. Other functions ofriparian areas that contribute to water quality include shading, flood attenuation, and shorelinestabilization. A typical riparian area is shown in Figure 4-6.
Where natural riparian areas are present, they should be maintained around all wetlandsthat might be impacted by stormwater flows. The removal of trees and other vegetation in theriparian zone should be limited and heavy use should be minimized to reduce the potential for soilcompaction, which could result in decreased infiltration rates.
Page 4-18

Best Management Practices
WETLAND
GROUNDWATERFigure 4-6. A typical riparian area.
Riparian areas should be a part of a series of BMPs for treating stormwater in denselydeveloped areas where there are high percentages of impervious surfaces or where discharge ratesare high and flow is concentrated.
Riparian areas should be maintained, when possible, in all areas where they exist and can becombined with other structural or nonstructural BMPs as part of a stormwater treatment system.They are useful in separating incompatible land uses, and can be effective in protecting sensitivehabitats such as wetlands, streams, lakes, and shorelines from adjacent land uses.
Design Criteria Considerations
l Maintain natural vegetation.
l Avoid compaction of the soils.
l Consider slope, vegetation, soils, depth to impermeable layers, runoff sediment character-istics, type and quantity of stormwater pollutants, and annual rainfall when determiningwidths.
l Increase riparian area width with increased slope, where possible.
l Combine natural riparian areas with other structural or nonstructural BMPs aspretreatment where discharge rates are high or flows are concentrated.
Potential Impacts to Wetlands
Benefits
l Reduce the amount of stormwater-associated pollutants entering adjacent or down-stream wetlands.
l Reduce stormwater sediment loads to downstream wetlands.
l Reduce the potential for downstream wetland degradation resulting from erosionassociated with peak stormwater flows.
Page 4-19

Source of Additional Information
Definition/Purpose
Protecting Natural Wetlands: A Guide to Stormwater Best Management Practices
l Might result in recharge of groundwater from infiltration, benefiting adjacent baseflow-dependent wetlands.
Maintain slope stability adjacent to wetlands and streams.
l Provide a buffer between wetlands and adjacent land uses.
l Provide critical habitat adjacent to wetlands and streams.
l Protect aquatic life by preventing and reducing thermal warming impacts.
Limitationsl Might not adequately attenuate concentrated peak stormwater flows to adjacent or
downstream wetlands.
Brown, M. 1991. Vegetative buffer zones. Prepared for the Southwest Florida Water Management DistrictSurface Water Improvement and Management Program. Henigar & Ray Engineering Associates, Inc., CrystalRiver, FL.
Heraty, M. 1993. Guidance report I: Riparian buffer programs. Prepared for the U.S. Environmental ProtectionAgency, Office of Wetlands, Oceans and Watersheds. Metropolitan Washington Council of Governments,Washington, DC.
Livingston, E., E. McCarron, C. Cox, and P. Sanzone. 1993. The Florida development manual: A guide to soundland and water management. Stormwater/Nonpoint Source Management Section Florida Department of
Environmental Regulation, Tallahassee, FL.
USEPA. 1993. Guidance for specifying management measures for sources of nonpoint pollution in coastal waters.
EPA 840-B-92-002. U.S. Environmental Protection Agency, Office of Water, Washington, DC.
Washington State Department of Ecology. 1992. Stormwater management manual for the Puget Sound Basin.Publication no. 91-75. Washington State Department of Ecology, Olympia, WA.
Structural BMPs - Information Basins
Infiltration basins are stormwater impoundments that detain stormwater runoff and returnit to the ground by allowing runoff to infiltrate gradually through the soils of the bed and sides ofthe basin. Infiltration basins are flat-bottomed, have no outlet, and are usually located to collectstormwater runoff from adjacent drainage areas. Infiltration basins can be designed to controlpeak discharges from relatively large design storms.
Infiltration basins can be designed as an off-line system for treating the first flush ofstormwater flows or to treat the peak discharges of the 2-year storm event. They remove bothsoluble and fine particulate pollutants, provide groundwater recharge, and preserve the naturalwater balance of a site by diverting a signifcant fraction of the annual runoff volume back intothe soil. Infiltration basins can maintain flow levels in small headwater streams during criticaldry-weather periods. They do not produce thermal or low dissolved oxygen impacts to down-
Page 4-20

Best Management Practices
stream waters as do wet ponds. Infiltration basins can be used as sediment basins during theconstruction phase of a site as long as the sediment is removed prior to final grading of the basin.
Scope/Applicability
Infiltration basins are effective at removing both soluble and fine particulates found instormwater runoff. (Coarse-grained pollutants should generally be removed before they enter aninfiltration basin.) Unlike other infiltration devices (e.g., trenches), basins can be adapted toprovide full control of peak discharges for large design storms. Infiltration basins can also beadapted to relatively large drainage areas (up to 50 acres). Depending on the degree of storage/exfiltration achieved in the basin, significant groundwater recharge, low flow augmentation, andlocalized stream bank erosion control can be achieved (Schueler, 1987).
Infiltration basins can be used at locations with sufficient open space and proper topogra-phy to allow gravity flow of stormwater to the basin. They are usually used in commercial andlarge residential developments. Infiltration basins can serve drainage areas of 2 to 50 acres,depending on local conditions. An infiltration basin must be located in permeable soils withinfiltration rates greater than 0.5 inches per hour. Soil and water table conditions should be suchthat the system can provide for a new volume of storage through percolation or evapotranspira-tion within a maximum of 72 hours following a stormwater event.
The use of infiltration basins is not recommended in the following situations: ultra-urbanareas, watersheds with risk of chronic oil spills or other contaminant spills, regions with coldwinters and snowmelt/freeze and thaw conditions, arid regions where a dense vegetative covercannot be reliably maintained, regions with sole-source aquifers, and areas with predominantlyclay or silt soils. Soils with a combined silt/clay percentage of over 40 percent by weight aresusceptible to frost heave and are not good candidates for infiltration basin applications. Basinsare also unsuitable if the site is located over fill soils that form an unstable upgrade and are proneto slope failure.
It should be noted that infiltration basins have a high failure rate due to the tendency of thebasin soils to become clogged with sediments. Failure rates for infiltration basins in the mid-Atlantic region range form 60 to 100 percent in the first 5 years, according to studies conducted inMaryland (Schueler, 1992). Once a basin has become clogged, it is very difficult to restore itsoriginal function; thus, many infiltration basins have been converted to retention basins orconstructed wetlands.
l Detention of the 2-year, 6-hour minimum storm to 72-hour maximum drawdown time.
l Recommended size of contributing drainage area based on site-specific conditions (e.g.,soil infiltration capacity or rainfall).
l Pretreatment sediment forebay to dissipate the velocity of incoming runoff, spread theflow, and trap the sediment.
Page 4-21

Protecting Natural Wetlands: A Guide to Stormwater Best Management Practices
Offsets to waterwells, onsite disposal systems, and fundations are based on hydrologic,soil, ecologic, and topographic characteristics of the site or existing state or local require-ments.
Flat-bottomed basin floor vegetated with dense turf grass, such as reed canary grass or tallfescue.
Shallow/Basin depth with inlet level with basin floor.
Riprap apron at inlet to prevent incoming runoff from reaching erosive energy levels andscouring the pipe outfalls and to spread incoming runoff more evenly.
Emergency spillway.
Maximum side slopes of 3:l (h:v) to allow vegetative stabilization, easier mowing, andpublic safety
Riprap level spreaders.
Uniform ponding depth across entire surface of basin; low spots should be leveled.
Contributing watershed slope less than 20 percent; 5 percent optimal.
Minimum 4-ft clearance between basin floor and bedrock level.
Minimum 4-ft clearance to seasonally high groundwater table.
Minimum 100 ft from drinking water wells.
Minimum 10 ft downgradient and 100 ft upgradient of foundations.
25ft vegetated buffer around the basin perimeter; low-maintenance, water-tolerantnative plant species that provide food and cover for wildlife and act as a screen.
Initial and periodic tilling of basin floor.
Use of lightweight equipment in basin.
Maximum depth low enough to ensure complete drainage of basin within 72 hours;depends on soil types present.
Design Considerations to Improve Longevity
l Stone trenches.
l Sand surface layer.
l Underdrains below basin floor.
l Shorter dewatering rate (24 hr rather than 72 hr).
Pretreatment forebays to control sediment inputs.
l Small contributing watershed areas.
l Shallow basin depths (standing water appears to promote soil compaction).
l Off-line designs that bypass large storms and sediment inputs.
l More efficient dewatering mechanisms in basins (e.g., stone trenches rather than soil).
l Careful geotechnical investigation of soil conditions prior to excavation.
Page 4-22

maintenance Requirements
Best Management Practices
Potential Impacts to Wetlands
Benefitsl Recharge of groundwater from infiltration basins, benefiting baseflow-dependent
wetlands.
l Reduction of stormwater sediment loads to downstream wetlands.
l Reduction in the potential for downstream wetland degradation resulting from erosionand hydroperiod changes associated with stormwater flows.
l Reduction in the amount of stormwater-associated pollutants entering downstreamwetlands.
Limitationsl Reduction in the amount of surface water supplied to adjacent or downstream wet-
lands as the result of rerouting and detention.
l Short life span (5 years or less).
l Might not be applicable in cold or arid climates, areas with impermeable soils, or areasoverlying sole source aquifers.
l Filtering effect of the topsoil can be lost by distributing runoff directly into the subsoilhorizon.
Infiltration basins require relatively frequent inspection and maintenance. Infiltrationbasins require inspection, sediment removal, tilling, erosion control, and debris and litter re-moval. The frequency of sediment removal will depend on whether the basin is vegetated ornonvegetated, its storage capacity, its recharge characteristics, the volume of inflow, and thesediment load.
Infiltration basins require more frequent inspections after construction (see Figure 4-7),with inspections tapering off to twice a year once performance has been verified. Once the basinis put to use, it should be inspected after every major storm or at least once a month if no majorstorm occurs. Inspections include monitoring of water levels for drainage and checking foraccumulation of sediment or signs of erosion or contamination.
Sediment removal from infiltration basins without vegetation should be performed annu-ally or semiannually followed by tilling to maintain infiltration rates. Sediment removal shouldbe performed when the basin is dry to prevent compaction of the soils and clogging of infiltrativesurfaces. Care should be taken to avoid compaction of the basin floor by using light equipment orpossibly hand raking to remove sediments. After the sediment is removed, the basin should betilled. Rotary tillers or disk harrows are normally used, but deep plowing might be necessary ifheavy equipment has compacted the soil. Removal of sediments from vegetated basins might notneed to be performed as frequently because vegetative growth helps to prevent the formation ofimpermeable layers on the surface of the soil. Dense vegetative growth on side slopes and bufferstrips will also help to prevent erosion from occurring.
Page 4-23

Protecting Natural Wetlands: A Guide to Stormwater Best Management Practices
Top View
Side View
Back-up Underdrain Pipe In Care of Standing Water Problems
Schueler. 1997.
Figure 4-7. Two views of an infiltration basin.
The basin should be checked annually for structural stability including the erosion of sideslopes, differential settlement, cracking, leakage, or tree growth on the embankments. Erosioncontrol is very important because the associated sediments can clog the infiltration basin. Theerosion of side slopes can be prevented by the maintenance of a dense turf having extensive rootgrowth that promotes infiltration through the basin sides, promotes bed stability, and inhibitsweed growth.
Sources of Additional Information
Austin City Council. 1991. Environmental criteria manual. City Council, Austin, TX.
Gibb, A.., B. Bennett, and A.. Birkbeck. 1991. Urban runoff quality and treatment: A comprehensive review.
Prepared for the Greater Vancouver Regional District. File no. 2-51-246(242). March 15.
Land Management Project. 1990. Artificial wetlands. BMP fact sheet #6. U.S. Environmental ProtectionAgency and Rhode Island Department of Environmental Management, Land Management Project, Provi-dence, RI.
Livingston, E., E. McCarron, C. Cox, and P. Sanzone. 1993. The Florida development manual: A guide to sound
land and water management. Stormwater/Nonpoint Source Management Section Florida Department ofEnvironmental Regulation, Tallahassee, FL.
Maryland Department of Natural Resources. 1984. Maryland standards and specifications for stormwater
infiltration practices. Stormwater Management Division, Water Resource Division, Maryland Department ofNatural Resources, Annapolis, MD.
Page 4-24

Defintion/Purpose
Scope/Applicability
Best Management Practices
Milone & MacBroom, Inc. 1991. Urban stormwater quality management for public water supply watersheds.
Prepared for South Central Connecticut Regional Water Authority, New Haven, CT
Northern Virginia Planning District Commission. 1987. BMP handbook for the Occoquan watershed. Prepared
for the Occoquan Basin Nonpoint Pollution Management Program. Northern Virginia Planning DistrictCommission, Annandale, VA.
Schueler, T.R. 1987. Controlling urban runoff A practical manual for planning and designing urban BMPs.
Metropolitan Washington Council of Governments, Washington, DC.
Schueler, T.R., PA.. Kumble, and M.A.. Heraty. 1992. A current assessment of urban best management practices:
Techniques for reducing non-point source pollution in the coastal zone. Prepared for the Metropolitan WashingtonCouncil of Governments, Washington, DC.
Tahoe Regional Planning Agency, 1988. Water quality management plan for the Lake Tahoe Region, Handbook ofbest management practices. Vol 2. November 30.
Virginia Department of Conservation and Recreation, USDA Soil Conservation Service, Virginia Departmentof Transportation, Virginia Polytechnic Institute and State University College of Urban Design and Depart-ment of Civil Engineering, Occoquan Monitoring Laboratory, and the Virginia Water Control Board. 1990.Best management practices handbook: Urban.
Washington State Department of Ecology. 1992. Stormwater management manual for the Puget Sound Basin.
Publication no. 91-71. Washington State Department of Ecology, Olympia, WA.
Structural BMPs - Infiltration Trenches
An infiltration trench is an excavated trench backfilled with clean, coarse aggregate toallow for the temporary storage of runoff. Runoff stored in the trench is allowed to infiltrate intothe soil in the trench bottom or is conveyed from the trench by an outflow pipe to downstreamstormwater detention or retention systems. Infiltration trenches are designed to provide tempo-rary storage and infiltration for increased stormwater runoff associated with development.Infiltration trenches can attenuate peak discharges associated with the design storm and mayreplicate predevelopment hydrologic conditions.
Infiltration trenches remove fine particulates and soluble pollutants from runoff bytemporary storage and infiltration into the underlying soil. Pollutant removal from runoff ininfiltration trenches results from adsorption, filtration, and microbial decomposition in the soil.Temporary storage and partial or complete infiltration of runoff in an infiltration basin can alsoreduce downstream bankfull flooding and resultant stream bank erosion and can help to maintainbaseflow conditions. A typical infiltration trench is shown in Figure, 4-8.
Infiltration trenches can be used on small individual sites or can be incorporated intomultiuse sites where open area is restricted. Pretreatment devices such as grassed swales or filter
Page 4-25

Design Criteria Conditions
Protecting Natural Wetlands: A Guide to Stormwater Best Management Practices
Schueler, 1987.
Figure 4-8. Typical infiltration trench.
strips should be incorporated with infiltration trenches to remove coarse particulates from runoffprior to its entering the trench.
Infiltration trenches should not be located in areas with shallow groundwater or adjacent togroundwater-maintained wetlands because of the potential for adverse impacts resulting frompollutants in the stormwater. Potential impacts to the natural hydroperiod of existing surfacewater-maintained wetlands resulting from the rerouting of water through infiltration trenchesand away from these systems should also be considered.
Contributing areas should be less than 10 acres in size, and slopes should be less than 5percent. Infiltration trenches cannot be installed in fill and should not be used in areas with low-permeability soils. Their use may also be limited in areas where the ground remains frozen atdepth for extended periods of time or in arid areas with sparse vegetative cover.
l Location in suitable soils with sufficient infiltration rates, preferably greater than 0.5inches per hour.
l Water table offset of at least 3 ft from the bottom of the trench.
l Contributing area of less than 10 acres.
l Contributing slopes of less than 5 percent.
l Detention time of 48 to 72 hours to allow adequate pollutant removal.
l Complete drainage of trench within 72 hours of a storm event to maintain aerobicconditions
l Pretreatment of stormwater inflow to remove coarse sediments.
Page 4-26
Best Management Practices
l Sizing of trench dependent on the volume of runoff to be controlled.
l Use of observation wells to monitor performance.
l Level trench bottom.
l Offsets to waterwells, onsite disposal systems, foundations, etc. based on hydrologic, soil,ecologic, and topographic characteristics of the site or existing state or local require-ments.
Design Considerations to Improve Longevity
l Field verification of soil infiltration rates and water table location.
l Use of pretreatment systems that provide some degree of storage (e.g., sump pits,swales with check dams, plunge pools).
l A layer of filter fabric 1 ft below surface of trench.
l Use of a sand layer rather than filter fabric at the bottom of the trench.
l Avoiding construction until all contributing watershed disturbances and constructionactivities are completed.
l Rototilling of trench bottom to preserve infiltration rates.
Potential Impacts to Wetlands
Benefitsl Reduction of stormwater sediment loads to downstream wetlands.
l Reduction in the potential for downstream wetland degradation resulting fromerosion associated with peak stormwater flows.
l Reduction in the amount of stormwater-associated pollutants entering downstreamwetlands.
LimitationsReduction in the amount of surface water supplied to adjacent or downstreamwetlands as the result of rerouting.
l Embedding of downstream wetland substrates as the result of the removal of coarsesediments.
l Might not be applicable in cold or arid climates, areas with impermeable soils, or areasoverlying sole source aquifers.
l Filtering effect of the topsoil can be lost by distributing runoff directly into the subsoilhorizon.
Page 4-27

Maintenance Requirements
Protecting Natural Wetlands: A Guide to Stormwater Best Management Practices
Infiltration trenches require periodic low-level maintenance. Because trenches are typicallysmaller than other BMPs and are buried underground, they might receive little attention fromhomeowners or might be relatively inaccessible. Infiltration trenches require continued monitor-ing and maintenance according to a well-defined schedule that outlines responsibilities andenforcement. Routine maintenance activities include inspection, buffer maintenance andmowing, sediment removal, and tree pruning.
Inspections for drainage are typically performed frequently upon completion of construc-tion and annually thereafter. Water level monitoring should be conducted several times withinthe first few months of operation. The surface of the infiltration trench should be checked forstanding water after a rainstorm, and water levels in the observation well should be recorded overseveral days to check drainage rates. If there is no observation well, a small hole can be dug downto the first layer of filter fabric to observe the water level in the trench. The monitoring scheduleis reduced to an annual frequency once performance of the device has been verified.
The accumulation of sediments in the top foot of stone aggregate or the surface inlet shouldbe monitored on the same schedule as the observation well to check for surface clogging. Wheninfiltrative capacity is significantly reduced, sediment should be removed from the top of theinfiltration trench by removing the stone, replacing the filter fabric, and washing or replacing thestone. Removal of sediment from the top of the infiltration trench should be required lessfrequently if the trench is designed with a pretreatment inlet. Sediment should be cleaned out ofthe pretreatment inlet, sediment trap, or grease trap on a regular basis.
Grass buffer strips adjacent to and growing over the infiltration trench should be inspectedannually for lush, vigorous growth. Bare spots should be reseeded or resodded, and eroded areasshould be repaired. Trees adjacent to the trench should be trimmed so that their leaves will notclog the trench. Pioneer trees that start to grow near the trench should be removed to preventpuncturing of the trench by their roots,
Sources of Additional lnformation
Gibb, A., B. Bennett, and A.. Birkbeck. 1991. Urban runoff quality and treatment: A comprehensive review.
Prepared for the Greater Vancouver Regional District. File no. 2-51-246(242). March 15.
Livingston, E., E. McCarron, C. Cox, and P. Sanzone. 1993. The Florida development manual: A guide to sound
land and water management. Stormwater/Nonpoint Source Management Section Florida Department ofEnvironmental Regulation, Tallahassee, FL.
Maryland Department of Natural Resources, 1984. Maryland standards and specifications for stormwater
infiltration practices. Stormwater Management Division, Water Resource Division, Maryland Department ofNatural Resources, Annapolis, MD.
Northern Virginia Planning District Commission. 1987. BMP handbook for the Occoquan Watershed. Preparedfor Occoquan Basin Nonpoint Pollution Management Program. Northern Virginia Planning District Commis-sion, Annandale, VA.
Schueler, TR., P.A.. Kumble, and M.A.. Heraty. 1992. A current assessment of urban best management practices,
techniques for reducing non-point source pollution in the coastal zone. Prepared for the Metropolitan WashingtonCouncil of Governments, Washington, DC.
Page 4-28
Westchester County Department of Planning, 1984. Best management practices manual for stormwater runoff
control. Westchester County Environmental Management Council, White Plains, NY.

Definition/Purpose
Scope/Applicability
Design Criteria Consideraitions
Best Management Practices
Structural BMPs - Sand Filters
Sand filters are systems of underground pipes beneath a self-contained bed of sand designedto treat urban stormwater. Runoff from a developed site is routed to the filters, infiltratedthrough the sand, then collected in underground pipes and returned back to the stream or channel.Sand filters are enhanced with the use of peat, limestone, gravel, and/or topsoil layers and mayhave a grass cover. Sand filters remove sediment, trace metals, nutrients, BOD, and fecal coliformfrom the initial pulse of stormwater from a development site. They provide significant pollutantremoval and are useful for groundwater protection.
Sand filters are adaptable for urban areas. They can be used to treat stormwater from small,intensely developed sites (e.g., gas stations, convenience stores, small parking lots). Sand filtershave been used to retrofit existing stormwater management systems by locating them at the endof existing stormwater outlet pipes. Sand filters are an off-line system (i.e., they should be locatedoutside the stream channel or drainage path). Sand filters are more costly to construct thaninfiltration trenches by a factor of 2 or 3, but they have lower regular maintenance costs.
Sand filters are designed to treat stormwater quality, not quantity They have a limitedability to reduce peak discharges and do not provide detention for downstream areas such aswetlands. Average removal rates of 85 percent for sediment, 35 percent for nitrogen, 40 percentfor dissolved phosphorus, 40 percent for fecal coliform, and 50 to 70 percent for metals havebeen reported for sand filters. Two views of a sand filter design developed by the City of Austin,Texas, are presented in Figure 4-9.
l Sand filters can be used in areas with thin soils, high evaporation rates, low soil infiltra-tion rates, and limited space.
l Drainage areas can be as great as 50 acres; however, most sand filters will function wellwith contributing watersheds ranging from 0.5 to 10 acres.
l Two to 4 ft of head are needed for proper operation.
l Using a peat or limestone layer in the filter bed and a grass cover can increase the pollut-ant removal efficiency
l Minimum design depth of the filter should be 18 inches.
l Filters designed with a long drawdown time (24 to 40 hours) can increase the pollutantremoval efficiency
Page 4-29

Protecting Natural Wetlands: A Guide to Stormwater Best Management Practices
TO STORMWATERDETENTION BASIN
SEDIMENT CHAMBER PLAN VIEW
ENERGY DISSIPATORS FILTRATION BASIN
STONE RIPRAP
FILTRATED OUTFLOW
CROSS SECTIONFILTRATED OUTFLOW
UNDERDRAIN PIPING SYSTEM
City of Austin, Texas, 1991.
Figure 4-9. Two views of a sand filter design.
Design Considerations to Improve Longevity
l Quarterly maintenance of the sand filter to maintain porosity aids in keeping the filteroperating efficiently
l Designs that include a flow splitter can help to prevent clogging.
l Pretreatment to remove sediment will help to prevent clogging.
l Designs that allow for access to the filter aid in maintenance and inspection of thefilter.
l Regular removal of surface sediment increases the longevity of the filter.
Potential Impacts to Wetlands
Benefits
l Reduction in the amount of stormwater-associated pollutants entering downstreamwetlands.
Limitationsl Primarily function as a water quality BMP and might not adequately attenuate concen-
trated peak stormwater flows to adjacent or downstream wetlands.
l Might adversely affect downstream sediment or nutrient-depleted wetlands.
Page 4-30

Best Management Practices
Maintenance Requirements
Sand filters require relatively frequent yet simple inspection and maintenance to maintainperformance. When a predetermined headloss is reached, the top layer of sand is removed andreplaced to restore the filtration capacity of the filter. The frequency of sediment removaldepends on the solids content of the water being filtered. To extend the life of the filter, systemdesigns incorporate a wet pool that is used to trap the coarse sediments before they reach thefilter. Sand filters require raking, surface sediment removal, and the removal of trash, debris, andleaf litter. Peat-sand filters that have vegetation growing on their surface require vegetationmaintenance including periodic mowing. Mowing the grass short removes nutrients absorbed bythe plants and maintains a neat filter appearance.
Sand filters require monitoring for hydraulic conductivity. Routine inspections are alsoneeded for sediment accumulation in the wet pool, health of the vegetative cover, and the removalof trash deposited in the wet pond. The vegetative cover can be damaged by salt if the system isnot shut down over the winter season. Managers should select hardy vegetation that is resistantto damage by salt, disease, and flooding.
Sources of Additional Information
City of Austin, Texas. 1991. Design guidelines for water quality control basins, Public Works Department,
Austin, TX.
Galli, J. 1990. Peat-sand filters: A proposed stormwater management practice for urbanization areas. Prepared forthe Coordinated Anacostia Retrofit Program and the Office of Policy and Planning, DC Department of PublicWorks, Washington, DC.
Gibb, A., B. Bennett, and A. Birkbeck. 1991. Urban runoff quality and treatment: A comprehensive review.
Prepared for the Greater Vancouver Regional District. File No. 2-51-246(242).
Land Management Project. 1990. Artificial wetlands. BMP fact sheet #5. U.S. Environmental ProtectionAgency and Rhode Island Department of Environmental Management, Land Management Project, Provi-dence, RI.
Metcalf & Eddy, Inc. 1979. Wastewater engineering: Treatment disposal reuse. 2nd ed. McGraw-Hill BookCompany, New York, NY.
Milone & MacBroom, Inc. 1991. Urban stormwater qualify management for public water supply watersheds.
Prepared for South Central Connecticut Regional Water Authority, New Haven, CT.
Northern Virginia Planning District Commission. 1992. Northern Virginia BMP handbook: A guide to planning
and designing best management pratices in Northern Virginia. Northern Virginia Planning District Commission,
Annandale, VA.
Northern Virginia Planning District Commission. 1987. BMP handbook for the Occoquan Watershed. Preparedfor Occcquan Basin Nonpoint Pollution Management Program. Northern Virginia Planning District Commis-sion, Annandale, VA.
Schueler, T.R., P.A. Kumble, and M.A. Heraty. 1992. A current assessment of urban best management practices,
techniques for reducing non-point source pollution in the coastal zone. Prepared for the Metropolitan WashingtonCouncil of Governments, Washington, DC.
Page 4-31

Definition/Purpose
Scope/Applicability
Protecting Natural Wetlands: A Guide to Stormwater Best Management Practices
Schueler, T.R. 1987. Controlling urban runoff: A practical manual for planning and designing urban BMPs.
Metropolitan Washington Council of Governments, Washington, DC.
Washington State Department of Ecology. 1992. Stormwater management manual for the Puget Sound Basin.
Publication no. 91-75. Washington State Department of Ecology, Olympia, WA.
Structural BMPs - Grassed Swales
Grassed swales are channels lined with grass or erosion-resistant plant species that areconstructed for the stable conveyance of stormwater runoff. They use the ability of vegetation toreduce the flow velocities associated with concentrated runoff. Grassed swales are not usuallydesigned to control peak runoff loads independently and are often used in combination withother best management practices. Where slopes are excessive, grassed swales can include exca-vated depressions or check dams to enhance runoff storage or to decrease flow rates.
Grassed swales are primarily stormwater conveyance systems designed to channel andtransport stormwater without the resultant erosion associated with high-velocity runoff. Thereduction in flow velocities resulting from the conveyance of surface runoff through densevegetative cover can result in a reduction of peak discharges. Pollutants can be removed fromstormwater by filtration through the vegetation, by deposition, or in some cases by the infiltra-tion of soluble nutrients into the soil. The degree of pollutant removal in a swale dependsprimarily on the residence time of water in the swale and the extent of its contact with vegeta-tion and the soil surface. The incorporation of excavated depressions or check dams into grassedswales can enhance pollutant removal by increasing detention/retention times. An example of agrassed swale is shown in Figure 4-10.
Grassed swales can be used in large-lot single-family subdivisions and on campus-type officeor industrial sites in place of curbs and gutters. They are useful for runoff conveyance in highwaymedians and are often combined with other best management practices. They can be used in allareas of the country where the climate and soils allow for the establishment of dense vegetativecovers. Grassed swales have a limited ability to control runoff from large storms and shouldnotbe used in areas where flow rates exceed 1.5 ft per second.
Design Criteria Considerations
l Longitudinal swale slope of less than 2 percent or use of check dams or excavated depres-sions where slopes exceed 4 percent.
l Wide and shallow parabolic shape with side slopes of less than 3:1.
l Development and maintenance of dense vegetation.
l Greater than a 2-ft offset to the water table.
Page 4-32

Best Management Practices
Swales Slopesas Close toZero 16 DrainageWill Permit
Stone PreventsDownstream Scour
Schueler. 1987.
Figure 4-40. Grassed swale.
l Use of underdrains if well-drained conditions are required.
l Discharge of runoff to wetlands or adjacent BMPs at nonerosive velocities.
Potential Impacts to Wetlands
Benefitsl Potential creation of wetlands and wetland habitat in low-slope areas.
l Potential for groundwater recharge in low-flow storm events, benefiting adjacentbaseflow-dependent wetlands.
Limitationsl Reduction in the amount of surface water supplied to adjacent or downstream wetlands
as a result of the rerouting of surface water.
l Potential for the introduction of pollutants to downstream wetlands during peak stormevents if conveyance is to the wetlands.
Maintanance Requirements
Maintenance requirements for grassed swales are relatively minimal. These includecleanout of sediment trapped behind check dams, mowing, litter removal, and spot vegetationrepair. The most important objective in the maintenance of grassed swales is the maintaining of a
Page 4-33

Protecting Natural Wetlands: A Guide to Stormwater Best Management Practices
dense and vigorous growth of turf. Usually in residential subdivisions, homeowners adjacent tothe swales maintain the grass and remove litter. Education of homeowners is recommendedbecause the type of maintenance sought to maximize pollutant removal is somewhat differentfrom that used to maintain the average homeowner’s lawn. For example, grass should not be cuttoo short, excessive fertilizers should not be used so that contamination of receiving waters orgroundwater is avoided, and ditches should be kept free of lawn debris.
Periodic cleaning of vegetation and soil buildup in curb cuts is required so that water flowinto the swale is unobstructed. Sediments should be removed when they accumulate to 6 inches ormore at any spot or when they interfere with the grassed swale operation. During the growingseason, swale grass should be cut no shorter than the level of the design flow. Cuttings should beremoved promptly. Swale maintenance at the end of the growing season depends on whether theobjective is to remove nutrients or particulates. Grasses and wetland plants are mowed or cut to alow height at the end of the growing season to promote nutrient removal; for other pollutioncontrol objectives, such as sediment removal, plants are allowed to stand at a height exceeding thedesign water depth by at least 2 inches at the end of the growing season. These plants will act as afilter to screen out particles by slowing the velocity of water so that particles can settle.
Gibb, A.., B. Bennett, and A. Birbeck. 1991. Urban runoff quality and treatment: A comprehensive review.
Prepared for the Greater Vancouver Regional District. File no. 2-51-246(242).
Khan, Z., C. Thrush, P. Cohen, L. Kulzer, R. Franklin, D. Field, J. Koon, R. Horner. 1992. Biofiltration swale
performance, recommendations, and design considerations. Municipality of Metropolitan Seattle Water PollutionControl Department, Seattle, WA.
Land Management Project. 1990. Artificial wetlands. BMP fact sheet #2. U.S. Environmental ProtectionAgency and Rhode Island Department of Environmental Management, Land Management Project, Provi-dence, RI.
Livingston, E., E. McCarron, C. Cox, and P. Sanzone. 1993. The Florida development manual: A guide to soundland and water management. Stormwater/Nonpoint Source Management Section, Florida Department ofEnvironmental Regulation, Tallahassee, FL.
Long Island Regional Planning Board. 1984. Nonpoint source management handbook. Long Island RegionalPlanning Board, Hauppauge, NY.
Maryland Department of Natural Resources. 1984. Maryland standards and specifications for stormwater
infiltration practices. Stormwater Management Division, Water Resource Division, Maryland Department ofNatural Resources, Annapolis, MD.
Northern Virginia Planning District Commission. 1992. Northern Virginia BMP handbook: A guide to planning
and designing best management pratices in Northern Virginia. Northern Virginia Planning District Commission,Annandale, VA.
Northern Virginia Planning District Commission. 1987. BMP handbook for the Occoquan Watershed. Preparedfor Occoquan Basin Nonpoint Pollution Management Program. Northern Virginia Planning District Commis-
sion, Annandale, VA.
Schueler, T.R., P.A. Kumble, and M.A.. Heraty. 1992. A current assessment of urban best management practices,techniques for reducing non-point source pollution in the coastal zone. Prepared for the Metropolitan WashingtonCouncil of Governments.
Schueler, T.R. 1987. Controlling urban runoff: A practical manual for planning and designing urban BMPs.
Metropolitan Washington Council of Governments.
Page 4-34

Best Management Practices
Structural BMPs - Vegetative Filter Strips
Definition/Purpose
Vegetative filter strips are densely vegetated sections of land designed to convey runoff inthe form of sheet flow from adjacent developed sites. Level spreaders can be incorporated into thedesign of vegetated filter strips to increase their effectiveness by distributing runoff over the fulllength of the strip. Vegetative filter strips primarily function as water quality BMPs and do notprovide adequate detention or infiltration to reduce peak discharges to predevelopment levels.
Vegetative filter strips direct runoff in the form of sheet flow across grassed or forestedsurfaces (see Figure 4-11). Reduction in flow velocities resulting from the conveyance of surfacerunoff through dense vegetated cover results in the removal of particulate contaminants throughsedimentation, enhanced infiltration into the soil, and a reduction in the potential for down-stream channel degradation. Vegetative filter strips may also reduce runoff volumes and contrib-ute to groundwater recharge. Maximum water quality benefits of vegetative filter strips can beobtained if the strips include the use of native vegetation (preferably undisturbed or conservednatural areas).
A recent variation of vegetative filter strips is a technology referred to as bioretention. Thisapproach can be suitable for managing runoff from small drainage areas using a mixture of uplandplant materials and enriched soil composition. Bioretention can maximize nutrient uptake,evapo-transpiration, infiltration, microbial degradation of metals and carbon-based pollutants,and storage to help reduce peak flows from the drainage area served to predevelopment levels. Itshould be noted, however, that bioretention methods require modification of existing site gradingpractices to provide sheet flow as a runoff conveyance rather than traditional pipe inlet systems.
Schueler,l987.
Figure 4-11. Vegatative filter strip between developed area and sensitive aquatic habitat.
Page 4-35
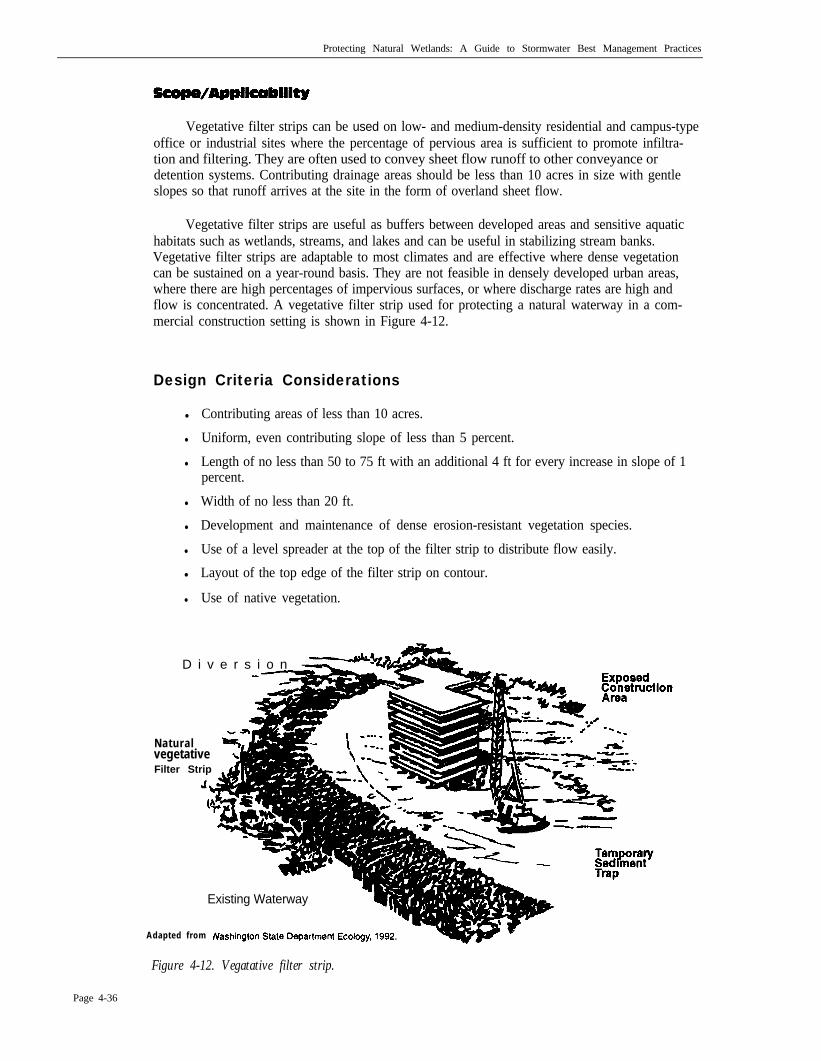
Scaope/Applicability
Protecting Natural Wetlands: A Guide to Stormwater Best Management Practices
Vegetative filter strips can be used on low- and medium-density residential and campus-typeoffice or industrial sites where the percentage of pervious area is sufficient to promote infiltra-tion and filtering. They are often used to convey sheet flow runoff to other conveyance ordetention systems. Contributing drainage areas should be less than 10 acres in size with gentleslopes so that runoff arrives at the site in the form of overland sheet flow.
Vegetative filter strips are useful as buffers between developed areas and sensitive aquatichabitats such as wetlands, streams, and lakes and can be useful in stabilizing stream banks.Vegetative filter strips are adaptable to most climates and are effective where dense vegetationcan be sustained on a year-round basis. They are not feasible in densely developed urban areas,where there are high percentages of impervious surfaces, or where discharge rates are high andflow is concentrated. A vegetative filter strip used for protecting a natural waterway in a com-mercial construction setting is shown in Figure 4-12.
Design Criteria Considerations
l Contributing areas of less than 10 acres.
l Uniform, even contributing slope of less than 5 percent.
l Length of no less than 50 to 75 ft with an additional 4 ft for every increase in slope of 1percent.
l Width of no less than 20 ft.
l Development and maintenance of dense erosion-resistant vegetation species.
l Use of a level spreader at the top of the filter strip to distribute flow easily.
l Layout of the top edge of the filter strip on contour.
l Use of native vegetation.
D i v e r s i o n -
NaturalvegetativeFilter Strip
Existing Waterway
Page 4-36
Adapted from
Figure 4-12. Vegatative filter strip.

Sources of Additional Information
Best Management Practices
Potential Impacts to Wetlands
Benefitsl Reduction of stormwater sediment and pollutant loads to adjacent and downstream
wetlands.
l Potential recharge of groundwater, benefiting adjacent baseflow-dependent wetlands.
l Provide a buffer between wetlands and adjacent development.
Limitationsl Primarily function as a water quality BMP and might not adequately attenuate concen-
trated peak stormwater flows to adjacent or downstream wetlands.
Maintenance Requirements
Frequent inspections and maintenance are required in the first few years after filter stripconstruction while vegetation becomes established. Watering, fertilizing, and reseeding might berequired during the initial establishment of the strip to maintain a dense vegetative cover.Established filter strips should be inspected on an annual basis for foot or vehicular damage.Inspectors should note encroachment, gully erosion, density of vegetation, and evidence ofconcentrated flows through or around the strip. A filter strip and its associated level spreader,when used, should be inspected periodically during storms to ensure that flow is not concentrat-ing and short circuiting through the strip.
Vegetated filter strips require periodic repair, regrading, and sediment removal to preventchannelization. Sediments accumulating near the top of the strip should be removed to maintainthe original grade. Longer buffer strips present the option of management as a lawn, or as asuccession of vegetation types from grass, to meadow, to second-growth forest. ‘Natural” filterstrips require less maintenance than grass lawns; however, corrective maintenance is still requiredto prevent the formation of concentrated flows. Shorter strips are managed as a lawn or as a shortgrass meadow and are mowed two or three times a year to suppress weeds and woody growth.
Gibb, A.., B. Bennett, and A.. Birkbeck. 1991. Urban runoff quality and treatment: A comprehensive review.Prepared for the Greater Vancouver Regional District, File no. 2-51-246(242).
Maine Department of Environmental Protection. 1992. Environmental management: A guide for town official,
best management practices to control nonpoint source pollution. Maine Department of Environmental Protection,
Augusta, ME.
Maryland Department of Natural Resources. 1984. Maryland standards and specifications for stormwater
infiltration practices. Stormwater Management Division, Water Resource Division, Maryland Department ofNatural Resources, Annapolis, MD.
Milone & MacBroom, Inc. 1991. Urban stormwater quality management for public water supply watersheds
Prepared for South Central Connecticut Regional Water Authority, New Haven, CT
Page 4-37

Protecting Natural Wetlands: A Guide to Stormwater Best Management Practices
Northern Virginia Planning District Commission. 1987. BMP handbook for the Occoquan Watershed. Preparedfor Occcquan Basin Nonpoint Pollution Management Program. Northern Virginia Planning District Commis-sion, Annandale, VA.
Northern Virginia Planning District Commission. 1992. Northern Virginia BMP handbook: A guide to planning
designing best management pratices in Northern Virginia. Northern Virginia Planning District Commission,Annandale. VA.
Prince George’s County. 1993. Design manual for use of bioretention in stormwater management. Prepared forPrince George’s County Government, Watershed Protection Branch, Landover, MD, by Engineering Technolo-gies Associates, Inc., and Biohabitats, Inc.
Schueler, T.R. 1987. Controlling urban runoff A practical manual for planning and designing urban BMPs.
Metropolitan Washington Council of Governments, Washington, DC.
Schueler, T.R., P.A. Kumble, and M.A. Heraty. 1992. A current assessment of urban best management practices,
techniques for reducing non-point source pollution in the coastal zone. Prepared for the Metropolitan WashingtonCouncil of Governments, Washington, DC.
USEPA. 1993. Guidance for specifying management measures for sources of nonpoint pollution in coastal waters.EPA 840-B-92-002. U.S. Environmental Protection Agency, Office of Water, Washington, DC.
Virginia Cooperative Extension Program. 1994. Easy reference to sustainable landscape management and waterquality protection. Publication 426-612. Virginia Cooperative Extension Program, Blacksburg, VA.
Washington State Department of Ecology. 1992. Stormwater management manual for the Puget Sound Basin.
Publication no. 91-75. Washington State Department of Ecology, Olympia, WA.
Structural BMPs - Vegetated Natural Buffers
Vegetated buffer areas are barriers of natural or established perennial vegetation managed toreduce the impact of development on the water quality of adjacent areas. They are effective inseparating incompatible land uses and in displacing activities that represent potential sources ofnonpoint source pollution from adjacent wetlands or water bodies. Vegetated buffer areas can bespatially arranged in linear strips or as free forms depending on site characteristics.
Vegetated buffer areas function primarily as water quality BMPs and usually do not provideadequate detention to reduce peak discharges to predevelopment levels. They reduce the velocityof surface runoff from adjacent developed sites and provide area for infiltration of runoff into thesoil. Reduced flow velocities result in the removal of particulate contaminants through sedimen-tation and reduce the potential for channel erosion or degradation. Vegetated buffer areas can alsoreduce runoff velocities and contribute to groundwater recharge.
Vegetated buffer areas can be used in large-lot, medium- to low-density single-familysubdivisions or campus-type office or industrial sites where the percentage of pervious area issufficient to promote infiltration. Vegetated buffer areas should be located in areas with gentle
Page 4-38

Best Management Practices
slopes where runoff is conveyed in the form of sheet flow. They are useful in separating incom-patible land uses, and they can be effective in protecting sensitive habitats such as wetlands,streams, lakes, and shorelines from the impacts of adjacent development. Vegetated buffer areasare also useful in combination with other structural BMPs. An example of a vegated buffer isshown in Figure 4-13.
Design Criteria Considerations:
l Avoid compaction of the soils.
l Consider slope, vegetation, soils, depth to impermeable layers, runoff sediment character-istics, type and quantity of stormwater pollutants, and annual rainfall when determiningbuffer widths.
l Combine vegetated buffer areas with other structural or nonstructural BMPs as pretreat-ment where discharge rates are high or flows are concentrated.
l Slope of less than 5 percent.
l Increased buffer width as slope increases.
l Intermixed zones of vegetation (particularly, native vegetation) including grasses,deciduous and evergreen shrubs, and understory and overstory trees.
Potential Impacts to Wetlands
Benefitsl Reduction of stormwater sediment and pollutant loads to adjacent and downstream
wetlands.
l Potential recharge of groundwater, benefiting adjacent baseflow-dependent wetlands.
l Provide a buffer between wetlands and adjacent land uses.
l Provide critical habitat adjacent to wetlands.
Adapted from State of Maine, DEP. 1992.
Figure 4-13. Vegetated natural buffer.
Page 4-39

Maintenance requirements
Sources of Additional Information
Protecting Natural Wetlands: A Guide to Stormwater Best Management Practices
Limitationsl Primarily function as a water quality BMP and typically do not adequately attenuate
concentrated peak stormwater flows to adjacent or downstream wetlands.
The inspection and maintenance of vegetated buffer areas are most important during theperiod of initial establishment. Maintenance requirements during the first few years of establish-ment include weed suppression and rodent protection in forested areas. Extra watering, fertiliz-ing, and grass reseeding or tree replacement might also be necessary Trees might need to be stakedto increase their survival rates. The condition of vegetated buffer areas should be inspectedperiodically, especially after heavy runoff events, during the first few years after buffer areacreation to ensure that vegetation is healthy and that channelized flows are not developing.
Maintenance requirements are relatively minimal once a vegetated buffer area is established. Routine maintenance is designed to promote the growth of dense, vigorous vegetation andincludes mowing, litter removal, repair of eroded areas, and spot vegetation repair. Sediments thataccumulate more than 6 inches at any spot should be removed. Watering and possible fertilizationmight also be required periodically.
Established buffer areas should be inspected on an annual basis for foot or vehicular damage.Inspectors should note encroachment, gully erosion, density of vegetation, and evidence ofconcentrated flows through or around the vegetated buffer area. A plan view of the use of naturalvegatated buffers to protect riparian wetland areas is shown below in Figure 4-14.
Brown, M. 1991. Vegetative buffer zones. Prepared for the Southwest Florida Water Management DistrictSurface Water Improvement and Management Program. Henigar & Ray Engineering Associates, Inc., Crystal
River, FL.
Chesapeake Bay Local Assistance Department. 1989. Local assistance manual. Chesapeake Bay Local Assitance
Department, Richmond, VA.
Heraty, M. 1993. Guidance report I: Riparian buffer programs. Prepared for the U.S. Environmental ProtectionAgency, Office of Wetlands, Oceans and Watersheds. Metropolitan Washington Council of Governments,Washington, DC.
Maine Department of Enviromental Protection. 1992. Environmental management: A guide for town officials,
best management practices to control nonpoint source pollution. Maine Department of Environmental Protection,Augusta, ME.
Schueler, T.R., P.A. Kumble, and M.A. Heraty. 1992. A current assessment of urban best management practices,
techniques for reducing non-point source pollution in the coastal zone. Prepared for the Metropolitan WashingtonCouncil of Governments, Washington, DC.
Virginia Cooperative Extension Program. 1994. Easy reference to sustainable landscape management and waterquality protection. Publication 426-612. Virginia Cooperative Extension Program, Blacksburg, VA.
Washington State Department of Ecology. 1992. Stormwater management manual for the Puget Sound Basin.Publication no. 91-75. Washington State Department of Ecology, Olympia, WA.
Page 4-40
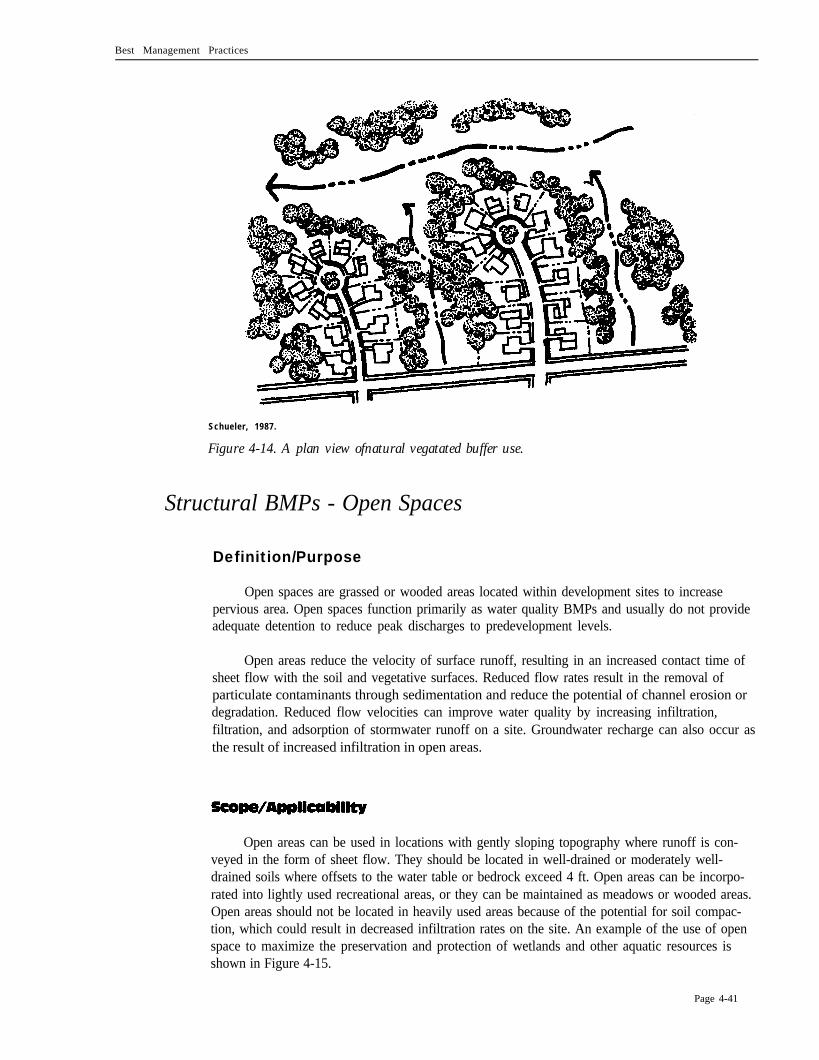
Scope/Applicability
Best Management Practices
Schueler, 1987.
Figure 4-14. A plan view ofnatural vegatated buffer use.
Structural BMPs - Open Spaces
Definition/Purpose
Open spaces are grassed or wooded areas located within development sites to increasepervious area. Open spaces function primarily as water quality BMPs and usually do not provideadequate detention to reduce peak discharges to predevelopment levels.
Open areas reduce the velocity of surface runoff, resulting in an increased contact time ofsheet flow with the soil and vegetative surfaces. Reduced flow rates result in the removal ofparticulate contaminants through sedimentation and reduce the potential of channel erosion ordegradation. Reduced flow velocities can improve water quality by increasing infiltration,filtration, and adsorption of stormwater runoff on a site. Groundwater recharge can also occur asthe result of increased infiltration in open areas.
Open areas can be used in locations with gently sloping topography where runoff is con-veyed in the form of sheet flow. They should be located in well-drained or moderately well-drained soils where offsets to the water table or bedrock exceed 4 ft. Open areas can be incorpo-rated into lightly used recreational areas, or they can be maintained as meadows or wooded areas.Open areas should not be located in heavily used areas because of the potential for soil compac-tion, which could result in decreased infiltration rates on the site. An example of the use of openspace to maximize the preservation and protection of wetlands and other aquatic resources isshown in Figure 4-15.
Page 4-41

Protecting Natural Wetlands: A Guide to Stormwater Best Management Practices
Design Criteria Considerations:
l Contributing slopes of less than 5 percent.
l Conveyance of runoff in the form of sheet flow.
l Locate in well-drained or moderately well-drained soils.
l Minimum water table and/or bedrock offset of 4 ft.
l Adequate size of open area to provide sufficient levels of treatment.
Potential Impacts to Wetlands
Benefitsl Reduction of stormwater sediment and pollutant loads to adjacent and downstream
wetlands.
l Potential recharge of groundwater, benefiting adjacent baseflow-dependent wetlands.
l Provide a buffer between wetlands and adjacent development.
Limitationsl Primarily function as a water quality BMP and might not adequately attenuate concen-
trated peak stormwater flows to adjacent or downstream wetlands.
Figure 4-1.5. A plan view for maximizing the preservation and protection ofwetlands.
Page 4-42

Maintenance Requirement
Scope/Applicability
Best Management Practices
The maintenance of open spaces is minimal once the vegetation is established. Frequentinspections are required during the first few years to ensure a healthy, dense growth of the desiredforms of vegetation. Extra watering, fertilization, and reseeding might be required. Forested areasmight require weed suppression, rodent protection, watering, or staking to increase the survival oftrees and shrubs during the first few years after establishment. Cutting and spraying with ap-proved herbicides might also be necessary to remove unwanted vegetation.
Open spaces should be inspected on an annual basis for damage by foot or vehicular traffic,encroachment, gully erosion, and vegetation density. The effectiveness of the open space willdecrease over time as sediments accumulate. Inspectors should look for accumulated sediments sothat they can be removed before they damage vegetation. Routine maintenance includes removalof trash and debris, repair of eroded areas, spot repair of vegetation, and mowing of the grass.
Sources of Additional Information
Chesapeake Bay Local Assistance Department. 1989. Local assistance manual. CBLAD, Richmond, VA.
Northern Virginia Planning District Commission. 1987. BMP handbook for the Occoquan Watershed. Prepared for
Occoquan Basin Nonpoint Pollution Management Program. Northern Virginia Planning District Commission,Annandale, VA.
Northern Viginia Planning District Commission. 1992. Northern Virginia BMP handbook: A guide to planning designing
best management pratices in Northern Virginia. Northern Vi Planning District Commission, Annandale, VA
Structural BMPs - Extended Detention Dry Basins
Definition/Purpose
Extended detention dry basins temporarily store stormwater runoff from a site and release it ata controlled rate by use of a fixed outlet. They are designed not to have permanent standing waterand are usually dry between storm events. Extended detention dry basins control water quantity bytemporarily detaining stormwater, and they reduce downstream channel erosion by reducing thefrequency of bankfull and subbankfull flooding events. Extended detention dry basins provide somewater quality benefits by removing pollutants primarily through the settling of suspended solids.They are designed and located to collect stormwater runoff from drainage areas and to control peakdischarges for one or more design storm frequencies.
Extended detention dry basins can be used in locations with sufficient open space and
without backup into surrounding areas. They can be used in combination with Permanent Pools,proper topography to allow gravity flow of stormwater to the basin and sufficient storage
or they can incorporate shallow marsh habitat in the normally inundated areas near their outlet
ing drainage areas of over 30 acres and are not usually practical for areas less than 10 acres in size.pipes to enhance pollutant removal. Extended detention dry basins are best suited for contribut-
The natural hydrologic conditions and characteristics of adjacent or downstream wetlands shou1d
Page 4-43
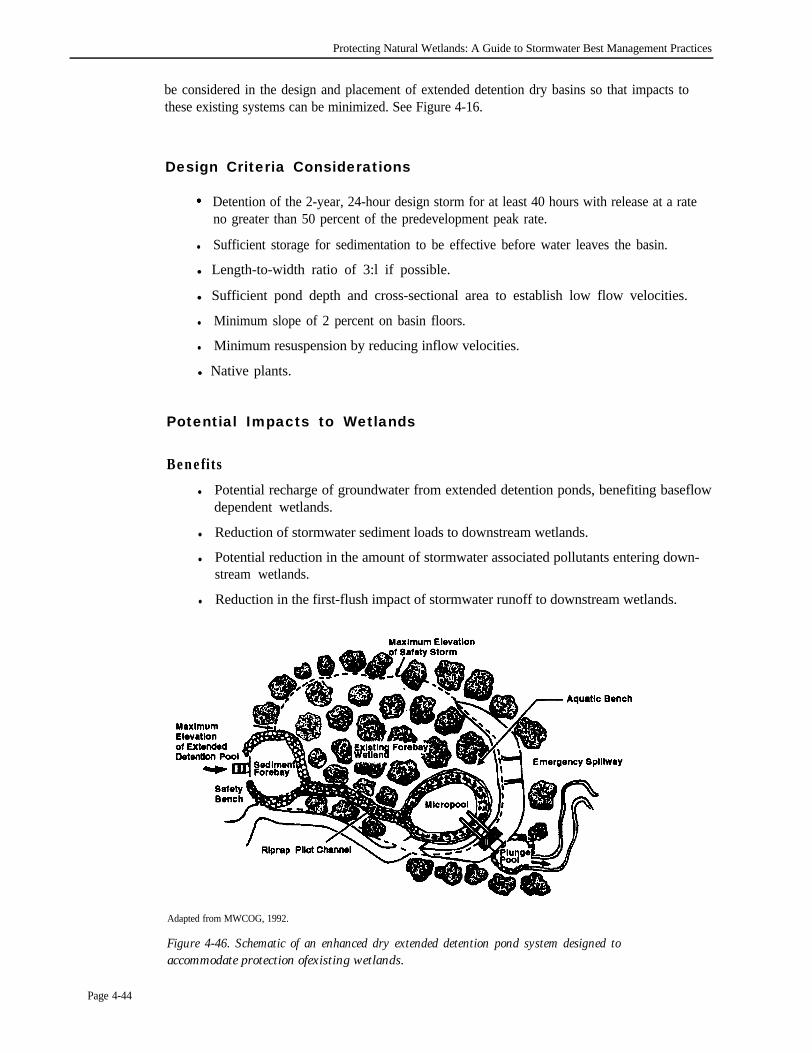
Protecting Natural Wetlands: A Guide to Stormwater Best Management Practices
be considered in the design and placement of extended detention dry basins so that impacts tothese existing systems can be minimized. See Figure 4-16.
Design Criteria Considerations
Detention of the 2-year, 24-hour design storm for at least 40 hours with release at a rateno greater than 50 percent of the predevelopment peak rate.
l Sufficient storage for sedimentation to be effective before water leaves the basin.
l Length-to-width ratio of 3:l if possible.
l Sufficient pond depth and cross-sectional area to establish low flow velocities.
l Minimum slope of 2 percent on basin floors.
l Minimum resuspension by reducing inflow velocities.
l Native plants.
Potential Impacts to Wetlands
Benefits
l Potential recharge of groundwater from extended detention ponds, benefiting baseflowdependent wetlands.
l Reduction of stormwater sediment loads to downstream wetlands.
l Potential reduction in the amount of stormwater associated pollutants entering down-stream wetlands.
l Reduction in the first-flush impact of stormwater runoff to downstream wetlands.
Adapted from MWCOG, 1992.
Figure 4-46. Schematic of an enhanced dry extended detention pond system designed toaccommodate protection ofexisting wetlands.
Page 4-44

Best Management Practices
l Elimination of the need for a permanent pool with habitat destruction potential.
l Potential for the creation of high marsh or wet meadow wetlands within the extendeddetention ponds through the incorporation of micropools.
l Potential for the incorporation of complex boundaries and microtopography in thepond design to enhance diverse vegetation and habitat.
l Reduction in the potential for downstream wetland degradation resulting from erosionassociated with peak stormwater flows.
Limitations
l Reduction in the amount of surface water supplied to adjacent or downstream wet-lands as the result of rerouting and detention.
l Embedding of downstream wetland substrates as the result of the removal of coarsesediments.
l Changes to adjacent natural wetland hydroperiods.
l Smothering of wetlands incorporated into extended detention ponds as a result ofincreased sedimentation.
l Thermal impacts to downstream wetlands resulting from the discharge of water fromextended detention ponds.
l Low habitat diversity and limited structure of wetlands created in extended detentionponds.
Extended detention dry basins can have relatively high maintenance burdens and costs.Extended detention dry basins will not achieve their intended purpose unless routine and non-routine maintenance tasks are performed on schedule. Responsibilities for maintenance need tobe clearly defined, maintenance schedules enforced, and regular inspections performed. Routinemaintenance includes mowing, debris and litter removal, erosion control, and the control ofnuisances.
Extended detention dry basins should be inspected on an annual basis to ensure that theycontinue to operate as designed. The inspector should measure and record the drainage rate ofwater after a storm to check that the design detention times are met. The flow control deviceshould be inspected regularly for evidence of clogging or too rapid release. In general, the ex-tended detention dry pond should be inspected for structural soundness, sediment accumulation,broken or missing parts, and trash and debris accumulation. The side slopes should be inspectedfor rodent holes, tree growth, subsidence, erosion, and cracking. The spillway should be inspectedfor clogging or missing rocks. The pilot channel to the upper stage, the flow path to the lowerstage, and the channel upstream and downstream of the basin should be checked for erosiondamage. The forebay/riser should be checked for sediment accumulation. Figure 4-17 indicatestypical locations for necessary maintenance access.
Trash and debris should be removed from the site. Trash should be removed from the debrisbarriers when greater than 20 percent of the openings in the barrier are plugged, and it is espe-cially important to remove floatable debris to prevent clogging of the control device or riser.
Page 4-45

Protecting Natural Wetlands: A Guide to Stormwater Best Management Practices
The grass/ground cover of basins located in nonresidential areas should be moved at leasttwice a year to control weeds and to discourage the growth of woody vegetation. Extendeddetention dry basins located in residential areas require more frequent mowing. Dense vigorousgrowth should be maintained on the bottom as well as on the sides of the extended detention drypond. The side slopes, emergency spillway, and embankment might also require periodic stabiliza-tion from erosion damage.
Nonroutine maintenance includes the removal of accumulated sediments from the basin.Accumulated sediments reduce the performance of an extended detention dry basin by graduallyreducing its capacity to treat stormwater, and by clogging the orifice or filter medium. Aftersediments are removed, the area should be stabilized immediately with vegetation to preventsediments from clogging the control device. Other nonroutine maintenance activities include theeventual replacement of the inlet, outlet, and riser works.
Sources of Additional Information
Gibb, A.., B. Bennett, and A.. Birkbeck. 1991. Urban runoff quality and treatment: A comprehensive review.
Prepared for the Greater Vancouver Regional District. File No. 2-51-246(242).
Land Management Project. 1990. Artificial wetlands. BMP fact sheet #5. U.S. Environmental ProtectionAgency and Rhode Island Department of Environmental Management, Land Management Project, Provi-dence, RI.
Livingston, E., E. McCarron, C. Cox, and P. Sanzone. 1993. The Florida development manual: A guide to sound
land and water management. Stormwater/Nonpoint Source Management Section Florida Department ofEnvironmental Regulation, Tallahassee, FL.
Milone & MacBroom, Inc. 1991. Urban stormwater quality management for public water supply watersheds.
Prepared for South Central Connecticut Regional Water Authority, New Haven, CT.
Northern Virginia Planning District Commission. 1987. BMP handbook for the Occoquan watershed. Preparedfor Occoquan Basin Nonpoint Pollution Management Program. Northern Virginia Planning District Commis-sion, Annandale, VA.
P L A N P R O F I L E
Adapted from Milone & MaBroom, Inc.. 1991.
Figure 4-17. Schematic of dry pond showing maintenance features.
Page 4-46

Scope/Applicability
Best Management Practices
Schueler, TX., P.A.. Kumble, and M.A.. Heraty. 1992. A current assessment of urban best management practices,
techniques for reducing non-point source pollution in the coastal zone. Prepared for the Metropolitan WashingtonCouncil of Governments, Washington, DC.
Washington State Department of Ecology. 1992. Stormwater Management Manual for the Puget Sound Basin.
Publication no. 91-75. Washington State Department of Ecology, Olympia, WA.
Structural BMPs- Wet Ponds
Definition/Purpose
Wet ponds are depressions constructed by excavation and embankment procedures to storeexcess runoff temporarily on a site. After a runoff event, overflow from the pond is released at acontrolled rate by an outlet device designed to release flows at various peak rates and elevationsuntil the design elevation of the pool is reached Wet ponds maintain a permanent pool of waterbetween storm events. Wet ponds are located to collect stormwater inflows from adjacentdrainage areas and are usually designed to control peak discharges from relatively large designstorms.
Wet ponds regulate stormwater runoff from a given rainfall event by the temporary storageof peak flows in order to mitigate quantity and quality impacts to downstream systems. Pollutantremoval in wet ponds results from the gravity settling of sediments/pollutants, the chemicaltransformation and biological uptake of nutrients while water is detained in the pond, and theinfiltration of soluble nutrients through the soil profile. Extended detention time in the perma-nent pool of wet ponds allows for increased sedimentation, transformation, and flocculation ofpollutants in the system. Decreased runoff rates from wet ponds reduce downstream channelerosion and resultant sediment pollution. Wet ponds have been shown to be the most efficientmeans of water quality protection when compared with other conventional BMPs.
Wet ponds can be located in areas that have topographic conditions that allow for thegravity flow of stormwater and enough open space to allow sufficient sizing of the structure sothat it can adequately treat expected flows. Wet ponds can be used in low- and high-visibilitylocations where contributing watersheds are greater than 10 acres in size or where continuousbaseflows exist to ensure dry-weather flow. They are not useful in arid regions where evapotrans-piration exceeds rainfall, and their use is limited in areas where space is a constraint such asdensely developed urban localities. Wet ponds have been used in combination with wetlands andother extended detention treatment methods. An extended detention wet pond is shown inFigure 4-18.
design Criteria Considerations
l Extended detention of a l-inch storm for 24 to 40 hours.
l Permanent pool volume of at least 2.5 times the runoff volume generated by the meanstorm.
Page 4-47

Potential Impacts to Wetlands
Protecting Natural Wetlands: A Guide to Stormwater Best Management Practices
Sufficient volume in the permanent pool to allow for low-energy settling of sedimentsbetween storms.
Use of pond liners in high-permeability soils.
Length-to-width ratio of 3:1 with a wedge shape.
Watershed area greater than or equal to 10 acres.
Access for maintenance equipment.
Enhanced conditions for biological treatment between storms (i.e., native vegetation inshallow ponds).
Inlet and outlet pipes set to discharge at or below the permanent pool surface.
Stone riprap lining, plunge pools, energy dissipators, or other acceptable means should beused below the pond outlet to prevent scouring.
Benefitsl Potential for the creation of emergent and high marsh-wetlands within the wet pond.
l Reduction of stormwater sediment loads to downstream wetlands.
l Potential for the incorporation of designs to enhance diverse vegetation and habitat.
l Reduction in the potential for downstream wetland degradation resulting from erosionassociated with peak stormwater flows.
Limitationsl Changes to the natural hydroperiod of adjacent natural wetlands.
l Reduction in the amount of surface water supplied to adjacent or downstream wetlandsas the result of rerouting and detention.
Adapted from Schueler. 1992.
Figure 4-18 Conceptual cross section view of an extended detention wet pond.
Page 4-48

Maintenance Requirement
Best Management Practices
l Potential for the introduction of pollutants to downstream wetlands during peak stormevents.
l Embedding of downstream wetland substrates as the result of the removal of coarsesediments.
l Strong shifts in the trophic status of downstream communities.
l Thermal impacts to downstream wetlands resulting from the discharge of water fromwet ponds.
l Low habitat diversity and limited structure of wetlands created in wet ponds.
Maintenance requirements for wet ponds are relatively modest. Long-term performancewill be degraded, however, by the buildup of sediments. Therefore, a firmly established mainte-nance and inspection program is required. Routine maintenance includes inspections, mowing ofthe embayment and buffers, and the removal of trash and debris from the forebay.
Wet ponds should be inspected on an annual basis to ensure that they continue to operate asdesigned. The inspector should monitor the water level after a storm to compare pond perfor-mance against the design detention time. Other factors that contribute to the performance of thepond that should be inspected are related to structural soundness, sediment accumulation,appearance, security, and the ease of maintenance. The side slopes should be inspected for rodentholes, tree growth, subsidence, erosion, and cracking. The barrel, spillway, and drain should beinspected for clogging, and the forebay/riser should be checked for sediment accumulation. Theadequacy of the erosion protection measures for the channel upstream and downstream of thebasin should be noted, as well as any modifications that have occurred to the contributingwatershed or pond structure.
Trash and debris should be removed from the site as part of the periodic mowing regimen.Maintaining a neat appearance at the site helps to discourage vandalism and illicit dumping. Allfloatable debris around the riser should be removed, and the outlet should be checked for possibleclogging.
Mowing of the upper stage, side slopes, embankment, and emergency spillway is required atleast twice a year to prevent woody growth and the excessive growth of weeds. More frequentmowing is required if the wet pond is located in a residential neighborhood. A dense vigorousgrowth of grass or ground cover should be maintained around the wet pond. The side slopes,emergency spillway and embankment might also require periodic stabilization from slumping anderosion damage.
Nuisances associated with problem wet ponds include insects, weeds, odors, and algae. Algaeand mosquitoes can be controlled by the introduction of fathead minnows and other fish. Thispractice is preferred over chemical application, especially in the case of ponds that discharge towetlands. Excessive growth of emergent, floating, and submerged vegetation can be mechanicallyharvested or controlled with herbicides.
Nonroutine maintenance includes the removal of accumulated sediments from the basin.Accumulated sediments reduce the performance of a wet pond basin by gradually reducing itscapacity to treat stormwater. Wet ponds require sediment removal when the storage capacity ofthe permanent pool is significantly reduced.
Page 4-49

Protecting Natural Wetlands: A Guide to Stormwater Best Management Practices
Actual sedimentation rates depend on the size, degree of construction, and land use in thewatershed. Other nonroutine maintenance includes structural repairs and the replacement ofvarious inlet/outlet and riser works.
Sources of Additional Information
Gibb, A.., B. Bennett, and A.. Birkbeck. 1991. Urban runoff quality and treatment: A comprehensive review.
Prepared for the Greater Vancouver Regional District. File No. 2-51-246(242).
Livingston, E., E. McCarron, C. Cox, and P. Sanzone. 1993. The Florida development manual: A guide to sound
land and water management. Stormwater/Nonpoint Source Management Section Florida Department ofEnvironmental Regulation, Tallahassee, FL.
Long Island Regional Planning Board. 1984. Nonpoint source management handbook. Long Island RegionalPlanning Board, Hauppauge, NY.
Schueler, T.R. 1987. Controlling urban runoff: A practical manual for planning and designing urban BMPs.
Metropolitan Washington Council of Governments, Washington, DC.
Schueler, T.R., P.A.. Kumble, and M.A.. Heraty. 1992. A current assessment of urban best management practices,
techniques for reducing non-point source pollution in the coastal zone. Prepared for the Metropolitan WashingtonCouncil of Governments, Washington, DC.
Washington State Department of Ecology 1992. Stormwater management manual for the Puget Sound Basin
Publication no. 91-735. Washington State Department of Ecology, Olympia, WA.
Westchester County Department of Planning. 1984. Best management practices manual for stormwater runoff
control. Westchester County Environmental Management Council, White Plains, NY.
Structural BMPs - Constructed Weltands
Definition/Purpose
Constructed wetlands are shallow pools constructed on nonwetland sites as part of thestormwater collection and treatment system. They provide growing conditions suitable for thegrowth of emergent marsh plants. These systems are designed primarily for the purpose ofstormwater management and pollutant removal from surface water flows. They are essentially atype of wet pond with greater emphasis placed on vegetation and depth/area considerations.Constructed wetlands are often used in sequence with a sediment basin, a forebay, or some typeof stormwater pond.
Constructed wetlands are designed to maximize removal of pollutants from stormwaterthrough physical, chemical, and biological mechanisms. They can be designed to store stormwaterrunoff temporarily, thereby lowering stormwater quantity and quality impacts on receivingsystems including lakes, water supply reservoirs, streams, wetlands, and recharge aquifers forwater supply wells. Physical mechanisms of pollutant removal include sedimentation, filtration,and volatilization. Chemical mechanisms include precipitation, adsorption to sediments, floccula-tion, and transformations such as reduction. Biological mechanisms include plant and bacterialnutrient uptake. Constructed wetlands can also be designed to allow for a wide diversity of plantspecies and improved wildlife habitat.
Page 4-50

Scope/Applicability
Best Management Practices
Constructed wetlands can be used in locations with sufficient open space and appropriatetopography to allow gravity flow of stormwater and sufficient sizing of the structure to ad-equately treat expected flows. They can be applied to most sites, including those with largepollution and runoff loads, provided sufficient baseflow is available to maintain proper hydrologyto support wetland vegetation. Constructed wetlands might be useful as a retrofit for older drystormwater basins. It is important to remember that the hydrology of the watershed draining tothe constructed wetland must be capable of supporting the wetland. A schematic of a constructedwetlands pond is shown in Figure 4-19.
Design Criteria Consideration
l
Volume should accommodate at least a 6-month, 24-hour storm for the watershed’sdeveloped condition.
Wetland area should be greater than or equal to 2 percent of the watershed area.
Watershed of 5 acres or more.
Length-to-width ratio of 3:l or greater; if this is not feasible, use baffles.
Vary water depth, with approximately 50 percent of the area about 0.5 ft deep and withsome open water, to provide diverse habitat.
Dry season baseflow must be adequate for vegetation maintenance, with evapotranspira-tion considered.
Minimize short circuiting by using baffles, islands, and peninsulas to ensure a longdistance from inlet to outlet.
Incorporate islands to provide habitat and refuge for birds.
Plant and soil pollutant removal effectiveness may vary with season.
Consider soil permeability and groundwater conditions. Lining may be necessary.
Organic soils provide best nutrient retention and plant substrate.
Vegetation should be selected for hydroperiod, climate, resistance to contaminants, stemdensity (to promote sedimentation), and habitat value. Consider native vegetation.
Consider plant uptake/release of nutrients and contaminants, and possible plant harvest-ing.
Use of forebay or other controls in “treatment train” design to pretreat runoff.
Erosion control should be employed in the forebay and at the outlet, preferably withvegetation.
Design for easy maintenance.
Provide access for maintenance equipment.
Page 4-51

Protecting Natural Wetlands: A Guide to Stormwater Best Management Practices
Schueler. 1992.
Figure 4-19. Schematic design ofconstructed wetland for stormwater control with an enhanced shallowmarsh system.
Potential Impacts to Wetlands
Benefitsl Reduction of flooding and erosive velocities and stormwater sediment loads to adjacent
and downstream wetlands.
l Potential for the incorporation of designs to enhance diverse vegetation and wildlifehabitat in urban areas.
l Reduction in the potential for downstream wetland degradation resulting from erosionassociated with peak stormwater flows.
Limitationsl Changes to the natural hydroperiod of adjacent natural wetlands.
Reduction in the amount of surface water supplied to adjacent or downstream wetlandsas the result of rerouting and detention.
l Smothering of vegetation in constructed wetlands resulting from sedimentation.
l Potential for the introduction of pollutants to downstream wetlands during peak stormevents.
l Embedding of downstream wetland substrates as the result of the removal of coarsesediments.
l Thermal impacts to downstream wetlands resulting from the discharge of water fromconstructed wetlands.
Page 4-52

Maintenance Requirements
Best Management Practices
l Potential takeover of vegetation by invasive aquatic nuisance plants.
l Potential for blocking fish passage if constructed in stream channel.
Maintenance requirements for constructed wetlands receiving stormwater are high duringthe first several years while vegetation is being established. Reinforcement planting and erosioncontrol BMPs might be necessary. Maintenance during the establishment phase involves frequentinspection for erosion damage or subsidence on the embankment or spillway. Rills formedthrough erosion should be filed and thoroughly compacted. It is important that the vegetatedcover on the embankment and spillway be dense and healthy Mowing and fertilizing helppromote vigorous growth of plant roots that resist erosion. Mowing also prevents the growth ofunwanted woody vegetation.
Another type of maintenance that might be necessary during the initial growing season isprotection of the first year wetland vegetation growing at the water’s edge and on the side slopesfrom birds. Birds often feed on the carbohydrate-rich shoots of the young vegetation, a problemreferred to as “eat-out.“The problem can be addressed by surrounding the open water area of theconstructed wetland with wire to limit access to the vegetation from the water, which is how thebirds get to the vegetation. The wire should be maintained until the wetland vegetation is wellestablished, which is usually by the second growing season.
Periodic inspections are necessary to ensure that the constructed wetland is operating asdesigned. Constructed wetlands should be inspected after major storms during the first year ofestablishment for the stability of banks and for flow channelization. For example, debris onplants or dead vegetation that has fallen over should be removed to minimize damage to otherwetlands vegetation. Excessive accumulation of sediments in any part of the system should benoted as well as any changes to the contributing watershed. The inspector should pay specialattention to the proper operation of pumps and water control structures, sealing, water level,flow distribution, and density of vegetation during the first years of operation. Water level is themost critical aspect of wetland plant survival within the first year after planting. Too much wateris often a greater problem than too little because the roots of plants do not receive enough oxygen.
Routine maintenance of constructed wetlands includes repair of fences, mowing of sod/ground cover on embankments, and removal of trash accumulated in trash racks, outlet structures,and valves. Burrowing animals may damage embankments and spillways. They can be discouragedby including a thick layer of sand or gravel on the fill or by installing a wire screen to inhibitburrowing. Organic matter accumulating in the wetland will eventually limit storage capacityand the capacity to treat runoff. Accumulation of organic matter can be reduced by harvesting ofvegetation or seasonal drawdown to allow organic material to oxidize. Periodic sediment removalfrom the forebay is necessary
Mosquito problems are one of the more frequently cited drawbacks of constructed wet-lands. Mosquitoes can be more of a problem in wetlands with tall cattails and bulrushes thanthose with lower-growing vegetative forms due to the protection from predators afforded by thetaller plants. Cattails can be controlled by flooding for several weeks during the growing seasonafter the stems have been cut (stems need to be cut below the water level). Biological control ofmosquitoes can be enhanced by stocking the wetland with fish that are tolerant of low dissolvedoxygen conditions. Mosquitoes can also be controlled through judicious application of mosquitolarvicide using the optimum dosage level and applying only when larval density is high.
Page 4-53

Sources of Additional Information
Definition/Purpose
Protecting Natural Wetlands: A Guide to Stormwater Best Management Practices
Davis, L. 1995. A handbook of constructed wetlands, A guide to creating wetlands for: Agricultural wastewater
domestic wastewater, Coal mine drainage, and stormwater in the Mid Atlantic region. 5 vols. U.S. Department of
Agriculture, U.S. Environmental Protection Agency, and Pennsylvania Department of Environmental Resources.
Gibb, A.., B. Bennett, and A. Birkbeck. 1991. Urban runoff quality and treatment: A comprehensive review.
Prepared for the Greater Vancouver Regional District. File no. 2-51-246(242).
Hammer, D. A. 1992. Creating freshwater wetlands. Lewis Publishers, Boca Raton, FL.
Kadlec, R. and R. Knight. 1996. Treatment wetlands. Lewis Publishers, Boca Raton, FL.
Land Management Project. 1990. Artificial wetlands. BMP fact sheet #3. U.S. Environmental Protection
Agency and Rhode Island Department of Environmental Management, Land Management Project,Providence, RI.
Schueler, T.R. 1987. Controlling urban runoff A practical manual for planning and designing urban BMPs.Metropolitan Washington Council of Governments, Washington, DC.
Washington State Department of Ecology. 1992. Stormwater management manual for the Puget Sound Basin.Publication no. 91-75. Washington State Department of Ecology, Olympia, WA.
Structural BMPs- Porous Pavement and Concrete GridPavement
Porous pavement is an alternative to conventional pavement designed to minimize surfacerunoff. It may be constructed of asphalt or concrete and is similar to regular paving materialexcept that a larger-sized aggregate is used in the asphalt or concrete mixture to provide a high-void course. Porous pavement is composed of four layers: the pavement course, the upper filtercourse, a stone reservoir, and a lower filter course and filter fabric lining over the underlying soil(see Figure 4-20).
A similar practice is concrete grid pavement, where modular, interlocking concrete blockshaving openings are used (see Figure 4-21). Runoff that permeates the porous pavement surfaceenters an underground stone reservoir and gradually exfiltrates from the reservoir into thesurrounding subsoil.
Porous pavement can help to restore or maintain predevelopment hydrology by reducing thevolume of stormwater runoff produced after development relative to runoff volumes generatedfrom roads and parking lots paved with conventional surfaces. By increasing the amount ofinfiltration, porous pavement can provide groundwater recharge, low flow augmentation, andstream bank erosion control through reduction of peak discharges. Pollutants are removed byabsorption, straining, and microbial decomposition as stormwater seeps through the subsoil.Sediments and particulate-associated pollutants are removed in the underground stone reservoir.The use of porous pavement has added advantages in that it reduces land consumption, reduces oreliminates the need for curb and gutters and conveyance systems, and reduces the tendency ofvehicles to hydroplane and skid. Other benefits can include storm detention and preservation ofwater supplies to the vegetation around parking areas.
Page 4-54

Best Management Practices
Scope/Applicability
The use of porous pavement is constrained to sites having deep and permeable soils, slopesless than 5 percent, restricted truck traffic, and suitable adjacent land uses. The use of porouspavement can also be restricted in regions with colder climates, arid regions or regions with highwind erosion rates, and areas having sole-source aquifers. It is generally used only for parking lots(between 0.25 acre and 10 acres in size) and lightly used access roads. Porous pavement is usedwhen the size of the development, or the lack of available space, limits the use of other BMPs. Ithas limited retrofit capability because most soils in urbanized areas have been previously modifiedto the extent that they are not capable of providing adequate infiltration rates. Porous pavement,designed with an underdrain, can be used in areas where underlying soils, groundwater depth, orbedrock restrict the ability of runoff to be disposed of by infiltration. Porous pavement reservoirswith underdrains serve as underground detention facilities.
Schueler. 1992.
Detail of cross section.
Filter Course (Gravel, 2Filter Fabric Layer
Undisturbed Soil
Porous Pavement Course(2.5-4.0 lnches Thick)
Filter Course(0.5 Inch Diameter Gravel,1 .0 Inch Thick)
Stone Reservoir(1.5-3.0 InchDiameter Stone)
Depth Variable Dependingon the Storage VolumeNeeded, Storage Providedby the Void Space Betweenstones
Deep)
Schueler, 1992.
Figure 4-20. Schematic cross section of a porous pavement system with storage reservoir.
Page 4-55

Protecting Natural Wetlands: A Guide to Stormwater Best Management Practices
Design Criteria Considerations
l Field-verified infiltration rates greater than or equal to 0.5 inch per hour.
l Site area of less than 10 acres with minimal contributions of runoff from the surroundingwatershed.
l Slopes less than 5 percent.
l Minimum clearance of 3 ft from the bottom of the system to the groundwater table.
l Filter fabric lining to prevent the upward piping of underlying clays.
Reservoir of variable depth containing clean, washed, l- to 2-inch-diameter stone.
l Overlying filter course of 0.5- to l-inch gravel.
l Use of underdrains if well-drained conditions are lacking at a site.
l 20-ft-wide grass buffer around the pavement to filter pollutants from runoff contributedby adjacent areas, if applicable.
Castellated Unit
Poured-in-Place Slab
Lattice Unit
Modular Unit
State of Washington, 1992.
Figure 4-21. Variations of concrete grid pavement.
Page 4-56
Maintenance
Potential Impacts to Wetlands
Limitation
Best Management Practices
Porous pavement requires quarterly vacuum sweeping and/or jet hosing to maintain poros-ity and prevent clogging. Sediments will accumulate where water is concentrated. These can beremoved by a vacuum cleaning street sweeper equipped with a brush followed by jet hosing.Porous asphalt and concrete require no more additional maintenance than conventional pavingmaterials. Buffer strips surrounding the pavement will need mowing. Surfaces paved withmodular concrete blocks with open lattice might require mowing of grass growing up between thelattice. Mowing is seldom required in areas of frequent traffic. Poured-in-place concrete gridpavements can be plowed as long as the plow blade is set high enough to prevent damage to grass.Fertilizers and deicing chemicals should not be used on concrete grid pavement because thesechemicals can damage the concrete. The application of abrasive material, such as sand or ash, intimes of heavy snowfall should be avoided due to the potential for clogging of the surface.
Cleaning techniques are effective only in restoring porous pavement that has reductions inpermeability of less than about 25 percent. Clogging may also be alleviated by drilling 0.5-inchholes through the pavement every few feet. If severe clogging should occur, complete replacementis required. Potholes and cracks can be repaired using conventional nonporous patching com-pounds as long as the cumulative area being patched is minimal.
Porous pavement should be inspected several times in the first few months after construc-tion and annually thereafter. Inspections of the pavement should be scheduled after major stormsso that areas of standing water can be identified. Water standing on the pavement might indicatelocal or widespread clogging. The condition of the buffer strips adjacent to the pavement shouldalso be checked at the time of inspection.
B e n e f i t s
l Reduction in the amount of stormwater-associated pollutants entering adjacent wet-lands.
l Reduction of stormwater sediment loads to adjacent wetlands.
l Reduction in the potential for adjacent wetland degradation resulting from erosionassociated with peak stormwater flows.
l Potential recharge of groundwater from infiltration, benefiting adjacent baseflow-dependent wetlands.
l Might not adequately attenuate concentrated peak stormwater flows to adjacentwetlands.
l Possible reduction in the amount of surface water supplied to adjacent surface-flow-dependant wetlands as a result of rerouting.
l Not appropriate for high traffic areas or surfaces receiving frequent heavy vehicle traffic.
Page 4-57

Definition/Purpose
Protecting Natural Wetlands: A Guide to Stormwater Best Management Practices
Sources of Additional Information
Commonwealth of Virginia 1990. Best management practices handbook - Urban. Published by the VirginiaDepartment of Conservation and Recreation, Division of Soil and Water Conservation. Richmond, VA.
Livingston, E., E. McCarron, C. Cox, and P. Sanzone. 1993. The Florida development manual: A guide to sound
land and wafer management. Stormwater/Nonpoint Source Management Section FIorida Department ofEnvironmental Regulation, Tallahassee, FL.
Schueler, T.R. 1987. Controlling urban runoff: A practical manual for planning and designing urban BMPs.
Metropolitan Washington Council of Governments, Washington, DC.
Schueler, TR., P.A.. Kumble, and M.A.. Harity. 1992. A current assessment of urban best management practices:
Techniques for reducing non-point source pollution in the coastal zone. Technical guidance to implement section
6217(g) of the Coastal Zone Management Act. Prepared for the U.S. Environmental Protection Agency,Office of Wetlands, Oceans, and Watersheds, Washington, DC.
Urbonas, B., and P. Stahre, 1993. Stormwater: Best management practices and detention for water quality,
drainage, and CSO management. PTR Prentice Hall, Englewood Cliffs, NJ.
Washington State Department of Ecology. 1992. Stormwater management manual for the Puget Sound Basin.Publication no. 91-75. Washington State Department of Ecology, Olympia, WA.
An oil/grit separator or water quality inlet is an underground concrete vault that can havefrom one to three chambers. These structures are designed to remove sediments and hydrocarbonsfrom stormwater runoff associated with roads and parking lots before it is discharged into thestorm sewer system or an infiltration BMP. Several different designs, which vary in their purpose,removal mechanisms, space requirements, and stormwater retention capacities, are used. Someare designed simply for spill control and have limited capacity to treat the dispersed oil found instormwater runoff from parking lots. Spill control oil/water separators consist of a chamber witha submerged orifice that allows the oil to float at the top of the chamber, where it can be removed.
Other separator designs have multiple chambers and use sophisticated equipment to removeoil from the surface and particles settled at the bottom. The American Petroleum Institute (API)oil-water separator and the Coalescing Plate Separator (CPS) are two designs used in the State ofWashington. The hydraulic conditions for oil removal by the API separator are promoted bybaffles. The CPI separator contains a series of fiberglass or polypropylene plates that promote theprocess of oil separation. Three-chambered oil/grit separators typically contain permanent poolsof water and are designed to remove oils by providing long contact times with particles so thatsorption onto particles will take place and the subsequent removal by gravity settling will occur.
A recently developed design in Canada includes a built-in diversion (bypass) structure. Thisfeature allows 80 to 90 percent of all rain hours (typically considered to capture most "first flush”events) to enter the treatment chamber. The larger, problem-causing (flushing) storms (10 to 20percent of all rain hours) are diverted around the treatment chamber.
Page 4-58

Scope/Applicability
Maintenance
Best Management Practices
Oil/grit separators are used to remove oil, grease, trash, and debris from runoff originatingfrom heavily trafficked areas such as gas stations, public works, transportation maintenancefacilities, industrial yards, loading areas, or other areas where hydrocarbon pollutant loads areexpected to be significant. Water quality inlets are frequently used to pretreat runoff before it isconveyed through the storm drain network, or before treatment by a local infiltration BMP suchas an infiltration trench. Oil/grit separators provide minimal groundwater recharge, low flowaugmentation, peak runoff attenuation, or stream bank erosion control benefits. Figure 4-22shows two views of a typical oil/grit separator.
Oil/grit separators, when used alone, are restricted to highly impervious catchments of smallsize (less than or equal to 2 acres) such as service stations, parking lots, convenience stores, andfast food outlets. Oil/grit separators are adaptable for use in all regions of the country and arefrequently used as part of a series of BMPs. They are commonly used as pretreatment devices forinfiltration BMPs. Oil/grit separators can also be used as a pretreatment device for pond-typeBMP systems, to prevent oily sheens from developing on pond surfaces, and to remove trash.
Design Criteria Considerations
Typically serve an area of less than 1 acre.
Horizontal velocity less than 3 ft per minute or 15 times the rise rate, whichever issmaller.
Depth 3 to 8 ft.
Width 6 to 16 ft.
Use of baffles to prevent resuspension.
Removal covers that allow access for observation and maintenance.
Maximum pool volume in three chambered separators in the first and second chamber.Chambers should be sized to provide at least 400 ft of wet storage per contributing acre.
Use of trash racks welded to the end plates between the first and second chambers inmultiple-chambered separators.
Upstream flow control to prevent the flushing of accumulated pollutants during majorstorms.
Although the structural failure rate of water quality inlets is very low relative to otherstormwater treatment devices, regular removal of accumulated sediments and debris is critical toachieving any degree of pollutant removal effectiveness. Material that accumulates in the oil/gritseparator must be removed promptly or it might be flushed from the device during the next storm,resulting in a pulse of highly concentrated contaminants to receiving waters. Cleanouts should beperformed at least twice a year, and weekly inspections are recommended. Separators should becleaned in time for the rainy season and after the first storm of the season.
Page 4-59

Sources of Additional Information
Protecting Natural Wetlands: A Guide to Stormwater Best Management Practices
Side View
Schueler, 1987.
Figure 4-22. Two views of an oil/grit separator.
Limitationsl Primarily function as a water quality BMP and might not adequately attenuate concen-
trated peak stormwater flows to adjacent wetlands.
l Possible reduction in the amount of surface water supplied to adjacent surface-flow-dependent wetlands as a result of rerouting.
l Potential negative impacts to adjacent or downstream wetlands from pollutantsassociated with improperly maintained separators.
Gibb, A.., B. Bennett, and A.. Birkbeck. 1991. Urban runoff quality and treatment: A comprehensive review.
Prepared for the Greater Vancouver Regional District, the Municipality of Surrey, British Columbia Ministryof Transportation and Highways, and British Columbia Ministry of Advanced Education and Training.Document no. 2-51-246 (242).
Romano, F. 1990. Oil and water don’t mix: The application of oil-water separation technologies in stormwa-
ter quality management. Published by the Office of Water Quality, Municipality of Metropolitan Seattle,
Seattle, WA.
Schueler, T.R., P.A.. Kumble, and M.A.. Harity. 1992. A current assessment of urban best management
practices: Techniques for reducing non-point source pollution in the coastal zone. Technical guidance to implementsection 6217(g) of the Coastal Zone Management Act. Prepared for the U.S. Environmental ProtectionAgency, Office of Wetlands, Oceans, and Watersheds, Washington, DC.
Page 4-60
Definition/Purpose
Scope/Applicability
Best Management Practices
Schueler, T.R. 1987. Controlling urban runoff: A practical manual for planning and designing urban BMPs.
Metropolitan Washington Council of Governments, Washington, DC.
Ontario Ministry of Transportation and National Water Research Institute, Environment Canada. 1994.Stormwater management facilities inventory study. Burlington, Ontario.
Washington State Department of Ecology. 1992. Stormwater management manual for de Puget Sound Basin.
Publication no.91-75. Washington State Department of Ecology, Olympia, WA.
Strutural BMPs -Level Spreaders
A level spreader is a hydraulic device used to convert channelized flows from an outlet pipe orculvert to sheet flow by causing the stormwater to spread out through a rock-lined trench beforedischarging over a berm, thereby dissipating energy that could cause erosion of downstream areas.The trench or channel is lined with filter fabric and covered with riprap, gabions, or a slope mattressto retard flow and provide turbulence. Energy is dissipated as stormwater spreads out over the rocksand then over the top of the berm. The berm is usually covered with riprap. Higher runoff velocitiesmay be treated by placing gabions in the trench instead of riprap.
Level spreaders are located at the outlet of channels or culverts and are used to protect areceiving channel or downstream area from erosion by dissipating fluid energy. Level spreaderscan be used to attenuate erosive flow velocities in stormwater discharges before they reach avegetated BMP. They provide a moderate amount of coarse sediment removal and infiltration, butthey are primarily a flow control device rather than a stormwater treatment system. A levelspreader is shown in Figure 4-23.
Level spreaders are used for moderate flows in small drainage areas. One of their primaryapplications is to convert channelized flows from culverts to sheet flows upstream of a vegetatedfilter strip or grassed swale. They should be constructed in undisturbed soils and discharge tostabilized areas.
Design Criteria Considerations
l Grass-lined trench used for flows up to 5 ft per second (ft/s).
l Riprap used for flows between 5 and 12 ft/s (median stone size of 8 inches, minimumthickness of 1 ft used for 5 to 8-ft/s flows; median stone size of 16 inches, minimumthickness 2 Et used for 8- to 12-ft/s flows).
l Riprap-lined channel not suitable for velocities greater than 12 ft/s or pipe diametersgreater than 3 ft.
l Gabion rock mattress or slope mattress required to transmit flows of very high energy(between 12 and 20 ft/s).
l Adjust dimensions for varying pipe sizes, flows, and velocities.Page 4-61
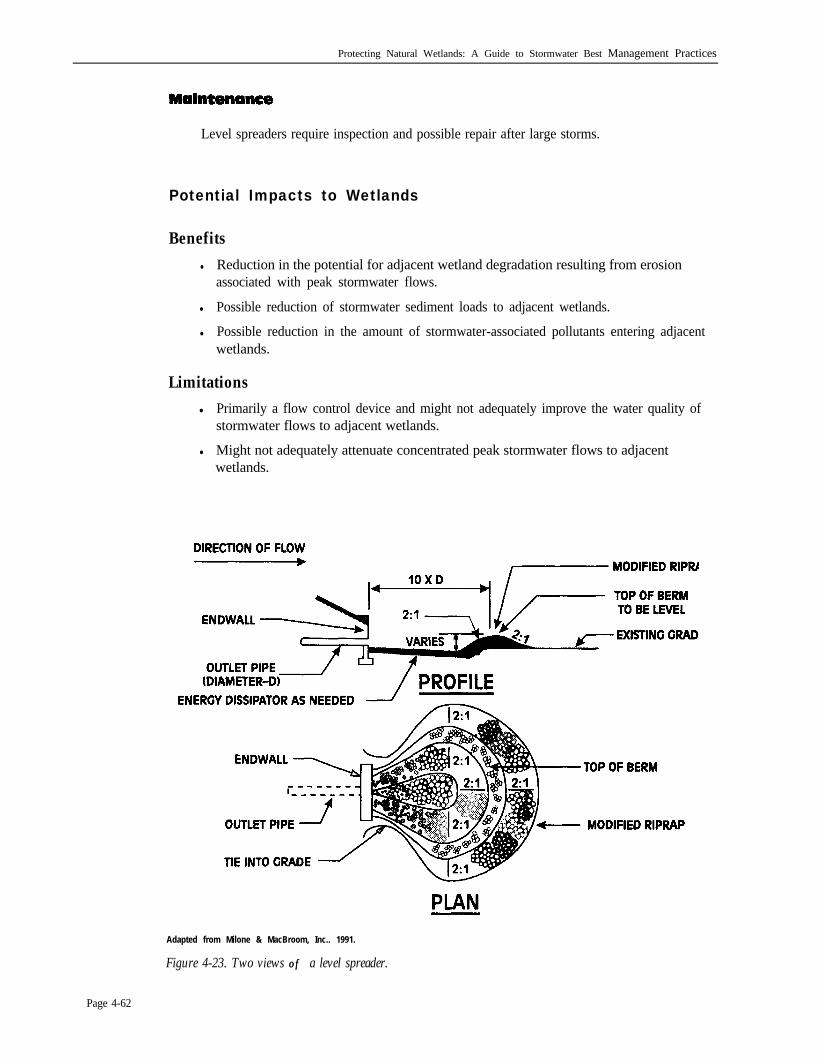
Maintenance
Protecting Natural Wetlands: A Guide to Stormwater Best Management Practices
Level spreaders require inspection and possible repair after large storms.
Potential Impacts to Wetlands
Benefitsl Reduction in the potential for adjacent wetland degradation resulting from erosion
associated with peak stormwater flows.
l Possible reduction of stormwater sediment loads to adjacent wetlands.
l Possible reduction in the amount of stormwater-associated pollutants entering adjacentwetlands.
Limitationsl Primarily a flow control device and might not adequately improve the water quality of
stormwater flows to adjacent wetlands.
l Might not adequately attenuate concentrated peak stormwater flows to adjacentwetlands.
Adapted from Milone & MacBroom, Inc.. 1991.
Figure 4-23. Two views of of a level spreader.
Page 4-62

Scope/Applicability
Best Management Practices
Sources of Additional Information:
Chow, VT. 1978. Open channel hydraulics. Bureau of Reclamation. Hydraulic design of stilling basins and energy
dissipators. Document No. EM 25.
Livingston, E., E. McCarron, C. Cox, and P. Sanzone. 1993. The Florida development manual: A guide to sound/and and water management. Stormwater/Nonpoint Source Management Section Florida Department of
Environmental Regulation, Tallahassee, FL.
Milone & MacBroom, Inc. 1991. Urban stormwater quality management for public water supply watersheds: A
guide to nonpoint source pollution and mitigation. Prepared for the South Central Connecticut Regional WaterAuthority, New Haven, CT.
U.S. Army Corps of Engineers. 1970. Hydrauric design of flood control channels. Document no. EM 1110-2-
1 6 0 1 .
U.S. Department of Transportation, Federal Highway Administration, 1983. Hydraulic design of energy
dissipators for culverts and channels. Hydraulic Engineering Circular no. 14.
Washington State Department of Ecology. 1992. Stormwater management manual fir the Puget Sound Basin.
Publication no. 91-75. Washington State Department of Ecology, Olympia, WA.
Structural BMPs - French Drains
Definition/Purpose
A French drain is a type of exfiltration system that consists of a perforated pipe drain placedin a deep pit or trench that is filled with coarse open-grade rock. The trench is lined with filterfabric and can be extended out laterally from the roadway to increase its water holding capacityWater exfiltrates from the trench and into the surrounding soil. Dutch drains are similar to Frenchdrains except that water enters the Dutch drain through a cast iron grate at the trench surfaceinstead of from a perforated pipe. Both French drains and Dutch drains are used to store runoffuntil it can percolate into the ground.
French drains require permeable, well-drained soils. Soil permeability should be sufficient toprovide a reasonable rate of infiltration, and the offset of the water table from the base of thetrench facility should be enough to prevent pollution of the groundwater. Like other infiltrationpractices, installation of a catch basin ahead of the drain will help prevent clogging by coarsesediment and debris.
French drains are typically used in areas where space is restricted. They are normally used tocatch runoff from parking lots, roadways, and roof drains. They are not recommended whererunoff contains a high volume of suspended materials. Presettling, filtering, and oil and greaseseparators are recommended for use with French drains if high volumes of suspended materials arepresent in the runoff.
Page 4-63

Design Criteria Considerations
Maintenance
Protecting Natural Wetlands: A Guide to Stormwater Best Management Practices
l Location in suitable soils with infiltration rates of at least 0.5 inch per hour.
l Clearance of 6 to 10 inches between the trench bottom and the seasonal high groundwa-ter level.
l Overflow pipe capable of handling at least a 25year storm event.
l Sediment traps located at least every 150 ft for a French drain.
l Complete drainage within 3 days after a storm to maintain aerobic conditions in thetrench.
l Presettling or filtering of stormwater to remove coarse sediments.
l Sizing of the trench based on volume of runoff to be controlled.
l Use of observation wells to monitor performance.
Newly constructed French drains should be inspected quarterly after initial installation andafter large rainstorms. The frequency of inspections may be decreased after the performance ofthe drain is verified, but inspections should be conducted on at least a yearly basis. Observationwells should be monitored to observe the functioning of the drain. If a filter strip precedes thedrain, it should be inspected for patchy vegetation and erosion or signs of channelized flows.
Sediment that accumulates in the top foot of stone or at the inlet should be checked at thetime of inspection and removed if infiltration rates have been reduced. Sediment that has col-lected in the sediment trap or pretreatment inlet should be removed periodically
Potential Impacts to Wetlands
Benefitsl Reduction in the amount of stormwater-associated pollutants entering adjacent wet-
lands.
l Reduction of stormwater sediment loads to adjacent wetlands.
l Reduction in the potential for adjacent wetland degradation resulting from erosionassociated with peak stormwater flows.
l Potential recharge of groundwater from infiltration, benefiting adjacent baseflow-dependent wetlands.
Limitationsl Might not adequately attenuate concentrated peak stormwater flows to adjacent
wetlands.
l Possible reduction in the amount of surface water supplied to adjacent surface-flow-dependant wetlands as a result of rerouting.
Page 4-64

Definition/Purpose
Scope/Applicability
Best Management Practices
Sources Of Additional Information
Commonwealth of Virginia 1990. Best management practices handbook - Urban. Published by the VirginiaDepartment of Conservation and Recreation, Division of Soil and Water Conservation.
Dennis, J., J. Noel, D. Miller, C. Eliot. 1989. Phosphorus control in lake watersheds: A technical guide to
evaluating new development. Maine Department of Environmental Protection, Augusta, ME.
Livingston, E., E. McCarron, C. Cox, and P. Sanzone. 1993. The Florida development manual: A guide to sound
land and water management. Stormwater/Nonpoint Source Management Section Florida Department of
Environmental Regulation, Tallahassee, FL.
Tahoe Regional Planning Agency. 1988. Water quality management plan for the Lake Tahoe Region: Handbook of
best management practices. Vol. 2.
Washington State Department of Ecology. 1992. Stormwater management manual for the Puget Sound Basin.
Publication no. 91-75. Washington State Department of Ecology, Olympia, WA.
Structural BMPs - Dry Wells or Roof Downspout Systems
Dry wells are infiltration pits used primarily to collect rooftop runoff from residential orcommercial buildings, although they can be used to drain small parking lots. Dry wells may beconstructed similar to infiltration trenches, using a filter fabric-lined pit filled with gravel, orthey can consist of an underground perforated concrete tank lined with gravel. The interior of theperforated concrete structure can be filled with coarse gravel to provide structural stability Somedry well designs incorporate an outlet pipe leading to a drain field.
Dry wells can be used to reduce the amount of runoff collected at storm sewers and storm-water treatment facilities, especially when runoff from roofs is expected to be relatively clean.Dry wells increase infiltration and therefore help to recharge groundwater, provide base flow instreams, and reduce peak runoff volumes and stream bank erosion.
Dry wells are suitable for use in areas where the subsoils are sufficiently permeable toprovide reasonable infiltration rates and where there is sufficient offset to the groundwater. Theiruse is restricted to small sources of runoff such as from roof drains, small parking lots, and tenniscourts. Roof downspout systems may be used to replace direct connections to sanitary sewers orstorm sewers. They are adaptable to retrofitting in subdivisions because they are small, inexpen-sive, and relatively simple to install. Because dry wells provide minimal treatment of roof runoff,they should not be used in areas where air deposition of pollutants constitutes a major portion ofthe nonpoint source pollutant loads. A typical dry well/infiltratrion pit is shown in Figure 4-24.In areas where runoff contains high concentrations of suspended materials, a method of settlingor pretreating runoff that filters out particles should be provided. Dry wells may be installedunder pavement if they are equipped with a small yard drain or grate-covered catch basin tochannel any overflow away from the overlying pavement.
Page 4-65

Maintenance
Protecting Natural Wetlands: A Guide to Stormwater Best Management Practices
Design Criteria Criteria Considerations
l Location in suitable soils having sufficient infiltration rates, preferably greater than 0.5inch per hour.
l Water table offset of at least 3 ft from the bottom of the well.
l Detention time between 48 to 72 hours to allow for adequate pollutant removal.
l Complete drainage of well within 3 days to maintain aerobic conditions.
l Use of an observation well to monitor performance.
l Filter fabric wrapped completely around the aggregate rock.
l Length not to exceed 100 ft from the inlet sump.
Line pits for precast concrete dry wells with a minimum of 1 ft of 0.75inch stone.
l Avoid placement under pavement whenever possible.
l Overflow drain for wells that are located beneath the pavement.
Dry wells and infiltration pits should be inspected frequently for proper drainage uponcompletion of construction and annually thereafter once performance of the device has beenverified. Maintenance and inspection practices differ between dry wells and infiltration pits. Drywells require periodic maintenance and inspection to prevent clogging and eventual failure.Filtering the stormwater through a fine mesh geotextile material will remove sediments andprevent premature clogging. The cap on a perforated concrete dry well can be removed for waterlevel inspection and sediment removal. If the dry well becomes clogged, the rocks inside theconcrete well will need to be removed. Sediments blocking the openings in the perforated liningshould also be removed. After the rocks are removed, the well should be tested for drainage. Ifdrainage rates are unsatisfactory, the precast concrete well might have to be removed. The pititself might need to be enlarged if the soil adjacent to the well has become clogged. The dry wellshould then be rebuilt using clean rocks.
The maintenance of dry wells and infiltration pits is similar to that for an infiltrationtrench. An observation well installed in an infiltration pit will facilitate the inspection of waterlevels after storms. Frequent inspections are required during the rainy season. The accumulationof sediments in the top foot of stone aggregate or the surface inlet should also be monitored onthe same schedule as the observation well to check for surface clogging. Clogging of the device isusually due to the accumulation of sediments between the upper layer of stone and the protectivelayer of filter fabric. When infiltrative capacity is significantly reduced, sediment should beremoved from the top of the infiltration pit by removing the stone, replacing the filter fabric, andwashing or replacing the stone.
Potential Impacts to Wetlands
Benefitsl Reduction in the potential for adjacent wetland degradation resulting from erosion
associated with peak stormwater flows.
Page 4-66

Best Management Practices
Side View
Adapted from Milone & MacBroom. Inc., 1991.
Figure 4-24. Dry well/infiltration pit.
l Possible reduction in sediment transport to adjacent wetlands resulting from reducedoverland flow.
l Potential recharge of groundwater from infiltration, benefiting adjacent baseflow-dependent wetlands.
Limitationsl tight not adequately attenuate concentrated peak stormwater flows to adjacent wetlands.
l Possible reduction in the amount of surface water supplied to adjacent surface-flow-dependent wetlands as a result of rerouting.
l May not adequately improve the water quality of stormwater flows to adjacent wetlands.
Sources of Additional lnformation
Commonwealth of Virginia 1990. Best management practices handbook - Urban. Published by the VirginiaDepartment of Conservation and Recreation, Division of Soil and Water Conservation.
Page 4-67

Definition/Purpose
Scope/Applicability
Protecting Natural Wetlands: A Guide to Stormwater Best Management Practices
Livingston, E., E. McCarron, C. Cox, and P Sanzone. 1993. The Florida development manual: A guide to sound
land and water management. Stormwater/Nonpoint Source Management Section Florida Department ofEnvironmental Regulation, Tallahassee, FL.
Schueler, T.R. 1987. Controlling urban runoff A practical manual for planning and designing urban BMPs.
Metropolitan Washington Council of Governments, Washington, DC.
Urbonas, B., and P. Stahre, 1993. Stormwater: Best management practices and detention for water quality,
drainage, and CSO management. PTR Prentice Hall, Englewood Cliffs, NJ.
Washington State Department of Ecology. 1992. Stormwater management manual for the Puget Sound Basin.
Publication no. 91-75. Washington State Department of Ecology, Olympia, WA.
Structural BMPs - Exfiltration TrencheS
Exfiltration trenches are a series of underground slotted pipe sections that temporarily storestormwater while it exfiltrates into the underlying soil through perforations or slots in the pipe. Arestrictor plate is placed at the end of the exfiltration pipe that controls the flow of water out ofthe pipe by using a high-level overflow device or a restrictive orifice. Exfiltration trenches requirepretreatment of runoff to remove large particles of sediment and debris that may clog the pipes.
Exfiltration trenches are used to provide groundwater recharge and a modest amount oftemporary runoff storage. They are frequently used under parking lots to save space and have theadvantage over infiltration basins of being hidden from sight. They can be used in situations wherebasins are visually unacceptable. Exfiltration trenches provide some reduction in peak flows espe-cially if they are oversized to store runoff. Pollutants are filtered out as water passes through the soilunder the system. Exfiltration trenches may be applied in moderately and well drained soils on lowto moderate slopes. Two views of an exfilteration system are shown in Figure 4-25.
SLOTTED PIPE SECTIONOR SLOTS
END SECTION
Adapted from Milone & MacBroom, Inc. 1991.
Figure 4-25. Two views of an exfiltration system.
Page 4-68

Maintenance
Best Management Practices
Design Criteria Considerations
l Two- to 4-ft offset from the pipe invert to groundwater.
l Two- to 4-ft offset to bedrock.
l Settle or filter runoff to remove solids.
l Level placement of pipes with no slope.
l Size for 0.5inch runoff minimum before overflow.
l Use in combination with a stone bed to increase storage capacity.
Exfiltration trenches require preventive maintenance to function effectively. Frequentcleanout of sediment traps and the maintenance or replacement of settling or filtering measuresmight be necessary If clogging of the facility occurs, replacement of the exfiltration trench might berequired.
Potential Impacts to wetlands
Benefitsl Reduction in the amount of stormwater-associated pollutants entering adjacent wetlands.
l Reduction of stormwater sediment loads to adjacent wetlands.
l Reduction in the potential for adjacent wetland degradation resulting from erosionassociated with peak stormwater flows.
l Potential recharge of groundwater from infiltration, benefiting adjacent baseflow depen-dent wetlands.
Limitationsl Might not adequately attenuate concentrated peak stormwater flows to adjacent wetlands.
Possible reduction in the amount of surface water supplied to adjacent surface-flow-dependent wetlands as a result of rerouting.
Sources of Additional Information
Livingston, E., E. McCarron, C. Cox, and P. Sanzone. 1993. The Florida development manual: A guide to sound
land and water management. Stormwater/Nonpoint Source Management Section Florida Department ofEnvironmental Regulation, Tallahassee, FL.
Milone & MacBroom, Inc. 1991. Urban stormwater quality management for public water supply watersheds: A guide
to nonpoint source pollution and mitigation. Prepared for the South Central Connecticut Regional Water Authority,New Haven, CT
Page 4-69

BMP in Series
Scope/Applicability
Protecting Natural Wetlands: A Guide to Stormwater Best Management Practices
Definition/Purpose
BMPs in series incorporate several stormwater treatment mechanisms in a sequence toenhance the treatment of runoff. Some examples of serial BMPs include the use of multiple pondsystems, the combination of vegetated filter strips withgrassed swales and detention ponds, andthe combination of grassed swales or vegetated filter strips with infiltration trenches.
By combining structural and/or nonstructural treatment mechanisms in series rather thanusing a single method of treatment for stormwater runoff, the levels and reliability of pollutantremoval can be improved. By using serial BMPs, a single desired facility that might not provide thenecessary level of stormwater treatment without sequencing can be used. The effective lifetimeof a BMP can be increased by combining it with a pretreatment device, such as a grassed swale, toremove suspended particulates prior to treatment in the downstream unit. Sequencing of BMPscan also reduce the potential for resuspension of deposited sediments by reducing flow energylevels or by providing longer flow paths for runoff. An example of using BMPs in series is shownin Figure 4-26.
The feasibility of using serial BMPs on a site depends on the characteristics of the individualcomponents in the sequence.
Top View Side View
Adapted from Schueler, 1991.
Figure 4-26. Example of BMPs in series.
Page 4-70

Sources of Additional Information
Best Management Practices
Design Criteria Considerations
Design criteria considerations depend on the requirements of the individual BMPs. Theleast expensive and most easily maintained component should be placed at the most upstreamposition in the series.
Maintenance Requirements
The maintenance requirements for serial BMPs depend on the requirements of the indi-vidual components of the system. (Refer to the individual BMP fact sheets.) A firmly establishedmaintenance and inspection program that addresses both routine and nonroutine tasks is neces-sary to ensure that the system functions as designed.
The placement of the least costly and most easily maintained BMP at the most upstreamposition in the series can reduce the maintenance requirements for the downstream componentsin the system. If the overall system is designed properly, the cost for maintenance of the indi-vidual components of the system can be reduced.
Potential Impacts to Wetlands
The potential impacts resulting from the placement of serial BMPs above, adjacent to, orwithin wetlands will depend on the components of the system. The potential positive or negativeimpacts of the individual components should be considered. The potential impacts of the indi-vidual components of the serial BMP should then be evaluated as a whole to determine theirpossible impact to adjacent or downstream wetlands.
Northern Virginia Planning District Commission. 1987. BMP handbook for the Occoquan Watershed. Preparedfor Occcquan Basin Nonpoint Pollution Management Program. Northern Virginia Planning District Commis-sion, Annandale, VA.
Northern Virginia Planning District Commission. 1992. Northern Virginia BMP handbook: A guide to planning
designing best management pratices in Northern Virginia. Northern Virginia Planning District Commission,Annandale, VA.
Schueler, TR., P.A.. Kumble, and M.A.. Heraty. 1992. A current assessment of urban best management practices,
techniques for reducing non-point source pollution in the coastal zone. Prepared for the Metropolitan WashingtonCouncil of Governments, Washington, DC.
Page 4-71


