PROTECTING INNOVATION THROUGH TRADE … Observatory on Infringements of Intellectual Property Rights...
64
www.euipo.europa.eu 1 PROTECTING INNOVATION THROUGH TRADE SECRETS AND PATENTS: DETERMINANTS FOR EUROPEAN UNION FIRMS July 2017
Transcript of PROTECTING INNOVATION THROUGH TRADE … Observatory on Infringements of Intellectual Property Rights...
European Observatory on Infringements of Intellectual Property Rights
www.euipo.europa.eu 1
PROTECTING INNOVATION THROUGHTRADE SECRETS AND PATENTS:
DETERMINANTS FOR EUROPEAN UNION FIRMS
July 2017
European Observatory on Infringements of
Intellectual Property Rights
PROTECTING INNOVATION THROUGH TRADE SECRETS AND PATENTS:DETERMINANTS FOR EUROPEAN UNION FIRMS
www.euipo.europa.eu 2
PROTECTING INNOVATION THROUGH TRADE SECRETS AND PATENTS: DETERMINANTS FOR EUROPEAN UNION FIRMS
European Observatory on Infringements of
Intellectual Property Rights
PROTECTING INNOVATION THROUGH TRADE SECRETS AND PATENTS:DETERMINANTS FOR EUROPEAN UNION FIRMS
www.euipo.europa.eu 3
PROJECT TEAM
Nathan WAJSMAN, Chief Economist Francisco GARCÍA-VALERO, Economist
ACKNOWLEDGEMENTS The authors would like to thank Professor Christian Helmers (Santa Clara University), Professor Yann Ménière (European Patent Office) and Dr. Serge Pajak (Université Paris-Sud) for helpful comments on an earlier draft of this report. Dr. Christian Rammer (Zentrum für Europäische Wirtschaftsforschung) co-authored the earlier German pilot study and provided extensive advice during the preparation of the present report. Nicole Maréchal (The European Chemical Industry Council) provided helpful information on the use of trade secrets and IP rights in the chemical industry. Last but not least, the authors express their appreciation for Eurostat’s collaboration and the statistical agencies of EU Member States which provided access to the CIS microdata on which this research is based.
DISCLAIMER This report is based on data from Eurostat Community Innovation Survey 2012. The responsibility for all conclusions drawn from the data lies entirely with the authors. The research datasets used may not exactly reproduce Eurostat statistics aggregates. This report contains statistical data provided by the UK’s Office for National Statistics (ONS) which is Crown Copyright. The use of ONS data does not imply the endorsement of ONS in relation to its interpretation or analysis of the statistical data. This work uses research datasets which may not exactly reproduce National Statistics aggregates. This report contains statistical data provided by Ireland's Central Statistics Office (CSO). The use of CSO data does not imply the endorsement of CSO in relation to its interpretation or analysis. The research datasets used may not exactly reproduce CSO statistics aggregates.
European Observatory on Infringements of
Intellectual Property Rights
PROTECTING INNOVATION THROUGH TRADE SECRETS AND PATENTS:DETERMINANTS FOR EUROPEAN UNION FIRMS
www.euipo.europa.eu 4
Contents
Abbreviation list 5
List of tables and figures 7
Executive Summary 8
1. Introduction 10
a. Protection of innovations and appropriability of returns from innovation .................................. 10 b. Trade secrets definition ............................................................................................................. 11 c. Different legal frameworks ........................................................................................................ 12 d. Trade secrets in detail ............................................................................................................... 13
2. Literature and Hypotheses 18
H1. Degree of innovation competition ................................................................................... 19 H2. Level of innovation .......................................................................................................... 19 H3. Type of innovation ........................................................................................................... 19 H4. Open innovation practices .............................................................................................. 19 H5. Financial constrains ........................................................................................................ 20 Combining patenting and secrecy ......................................................................................... 20
3. Data 21
4. A first look at the evidence: Descriptive analysis 26
a. Innovation rates by country ....................................................................................................... 26 b. Trade secrets and patents by company size ............................................................................ 29 c. Trade secrets and patents by economic sector ........................................................................ 34 d. Trade secrets and patents by type of innovation ...................................................................... 39 e. Trade secrets and patents and cooperation in innovation ........................................................ 40
5. Econometric analysis 41
a. Models ....................................................................................................................................... 41 b. Variables ................................................................................................................................... 42 c. Results of the econometric analysis ......................................................................................... 43
H1. Degree of innovation competition ................................................................................... 44 H2. Level of innovation .......................................................................................................... 47 H3. Type of innovation ........................................................................................................... 48 H4. Open innovation practices............................................................................................... 52 H5. Financial constrains ........................................................................................................ 53
Complementarity of trade secrets and patents ............................................................................. 53 Other factors influencing choice of protection method .................................................................. 54
6. Conclusions and directions for further research 57
References 58
European Observatory on Infringements of
Intellectual Property Rights
PROTECTING INNOVATION THROUGH TRADE SECRETS AND PATENTS:DETERMINANTS FOR EUROPEAN UNION FIRMS
www.euipo.europa.eu 5
Abbreviation list
CIS Community Innovation Survey
CONCORD Conference on Corporate R&D
CSO Central Statistics Office, Ireland
DG Directorate General in the European Commission
DTSA Defend Trade Secrets Act (USA)
ECLAC Economic Commission for Latin America and the Caribbean
EFTA European Free Trade Association
EIS European Innovation Scoreboard, known before 2016 as IUS (Innovation Union Scoreboard)
EPC European Patent Convention
EPO European Patent Office
ESS European Statistical System
EU European Union
EU28 All 28 Member States of the European Union
EUIPO European Union Intellectual Property Office
Eurostat Statistical Office of the European Union
FIRB Foreign Investment Review Board (Australia)
IP Intellectual Property
IPR Intellectual Property Right
ISBN International Standard Book Number
ISI Fraunhofer-Institut für System- und Innovationsforschung (Fraunhofer Institute for Systems and Innovation Research)
ISSN International Standard Serial Number
IUS Innovation Union Scoreboard, renamed in 2016 as EIS, European Innovation Scoreboard
MIT Massachusetts Institute of Technology
NACE The Statistical Classification of Economic Activities in the European Community (for the French term ‘nomenclature statistique des activités économiques dans la Communauté européenne’)
NBER National Bureau of Economic Research
NSTDA National Science and Technology Development Agency (Thailand)
OECD Organization for Economic Cooperation and Development
OLS Ordinary Least Squares
ONS Office for National Statistics (United Kingdom)
R&D Research and Development
RIETI Research institute of economy trade and industry (Japan)
SME Small and medium-sized enterprise
TRIPS Trade-Related Aspects of Intellectual Property Rights
TS Trade Secret
WTO World Trade Organisation
ZEW Zentrum für Europäische Wirtschaftsforschung (Centre for European Economic Research)
European Observatory on Infringements of Intellectual Property Rights
PROTECTING INNOVATION THROUGH TRADE SECRETS AND PATENTS:DETERMINANTS FOR EUROPEAN UNION FIRMS
www.euipo.europa.eu 6
Country codes:
AT Austria
BE Belgium
BG Bulgaria
CY Cyprus
CZ Czech Republic
DE Germany
DK Denmark
EE Estonia
EL Greece
ES Spain
FI Finland
FR France
HR Croatia
HU Hungary
IE Ireland
IT Italy
LT Lithuania
LU Luxemburg
LV Latvia
MT Malta
NL Netherlands
PL Poland
PT Portugal
RO Romania
SE Sweden
SI Slovenia
SK Slovakia
UK United Kingdom
USA United States of America
European Observatory on Infringements of
Intellectual Property Rights
PROTECTING INNOVATION THROUGH TRADE SECRETS AND PATENTS:DETERMINANTS FOR EUROPEAN UNION FIRMS
www.euipo.europa.eu 7
List of tables and figures
Tables
Table 1: Summary comparison between patents and trade secrets 16
Table 2: Core industries included in the CIS 2012, NACE classification 23
Table 3: Firms reporting product or process innovation by country and company size, 27 2010-2012
Table 4: Firms using different appropriability mechanisms for protecting product or process 28 innovations, 2010-2012
Table 5: Innovating firms using trade secrets and patents for protecting their product or 30 process innovations by country and company size, 2010-2012
Table 6: Trade secret and patent use by innovating firms by industry, 2010-2012 35
Table 7: Trade secret and patent use by innovating firms by type of innovation, 2010-2012 39
Table 8: Trade secret and patent use by innovating firms by location of cooperation partner, 40 2010-2012
Table 9: Summary of main determinants of the use of trade secrets and patents 43
Table 10: Summary of control variables influencing of the use of trade secrets and patents 44
Table 11: Result of probit regression on the use of trade secrets, with H1 variables 45
Table 12: Results of probit regression on the use of patents, with H1 variables 46
Table 13: Result of probit regression on trade secrets use without H1 & H5 variables, 49 conditional marginal effects
Table 14: Result of probit regression on patent use without H1 & H5 variables, conditional 50 marginal effects
Table 15: Results of ‘ordered probit’ regression on preference for patent over trade secret 51 use, conditional marginal effects.
Table 16: Propensity to use different combinations of trade secrets and patents, result of 52 probit regressions
Figures
Figure 1: Trade secret and patent use among innovating SMEs by country, 2010-2012 32
Figure 2: Trade secret and patent use among innovating large firms by country, 2010-2012 32
Figure 3: Trade secret vs patents use in selected Member States differences between 34 large firms and SMEs, 2010-2012
Figure 4: Innovating firms using trade secrets and patents by industry, 2010-2012 37
Figure 5: Trade secret use vs EPO Registered Patent intensity in core industry sectors by 38 NACE division, 2010-2012
Figure 6: Propensity to use trade secrets and patents by innovating firms, by country 56
European Observatory on Infringements of
Intellectual Property Rights
PROTECTING INNOVATION THROUGH TRADE SECRETS AND PATENTS:DETERMINANTS FOR EUROPEAN UNION FIRMS
www.euipo.europa.eu 8
Executive Summary
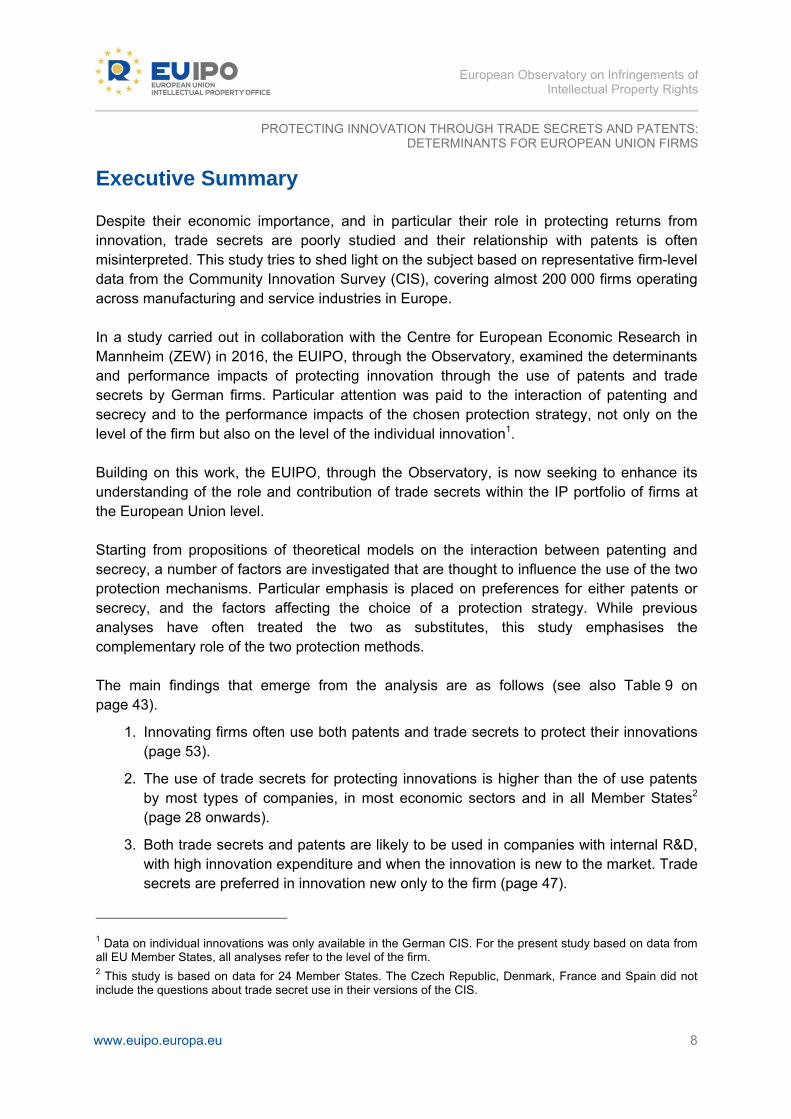
Despite their economic importance, and in particular their role in protecting returns from innovation, trade secrets are poorly studied and their relationship with patents is often misinterpreted. This study tries to shed light on the subject based on representative firm-level data from the Community Innovation Survey (CIS), covering almost 200 000 firms operating across manufacturing and service industries in Europe. In a study carried out in collaboration with the Centre for European Economic Research in Mannheim (ZEW) in 2016, the EUIPO, through the Observatory, examined the determinants and performance impacts of protecting innovation through the use of patents and trade secrets by German firms. Particular attention was paid to the interaction of patenting and secrecy and to the performance impacts of the chosen protection strategy, not only on the level of the firm but also on the level of the individual innovation1. Building on this work, the EUIPO, through the Observatory, is now seeking to enhance its understanding of the role and contribution of trade secrets within the IP portfolio of firms at the European Union level. Starting from propositions of theoretical models on the interaction between patenting and secrecy, a number of factors are investigated that are thought to influence the use of the two protection mechanisms. Particular emphasis is placed on preferences for either patents or secrecy, and the factors affecting the choice of a protection strategy. While previous analyses have often treated the two as substitutes, this study emphasises the complementary role of the two protection methods. The main findings that emerge from the analysis are as follows (see also Table 9 on page 43).
1. Innovating firms often use both patents and trade secrets to protect their innovations (page 53).
2. The use of trade secrets for protecting innovations is higher than the of use patents by most types of companies, in most economic sectors and in all Member States2 (page 28 onwards).
3. Both trade secrets and patents are likely to be used in companies with internal R&D, with high innovation expenditure and when the innovation is new to the market. Trade secrets are preferred in innovation new only to the firm (page 47).
1 Data on individual innovations was only available in the German CIS. For the present study based on data from all EU Member States, all analyses refer to the level of the firm. 2 This study is based on data for 24 Member States. The Czech Republic, Denmark, France and Spain did not include the questions about trade secret use in their versions of the CIS.
European Observatory on Infringements of
Intellectual Property Rights
PROTECTING INNOVATION THROUGH TRADE SECRETS AND PATENTS:DETERMINANTS FOR EUROPEAN UNION FIRMS
www.euipo.europa.eu 9
4. Patents are more likely to be used (alone or in combination with trade secrets), when the innovative product is a physical good rather than a service (page 48).
5. Trade secrets (often without patents) are more likely to be used for process innovation and for innovations in services (page 48).
6. Trade secrets (alone or in combination with patents) are likely to be used for maintaining or increasing the competiveness of innovations introduced by companies involved in open innovation practices such as research cooperation, especially with distant (non-European) partners (page 52).
7. There is a propensity to favour trade secrets over patents in markets with strong price competition. There is a propensity to use both trade secrets and patents in markets with strong quality competition (page 44). This is related to finding 5 above. Strong price competition is typical of commodity-type markets, where opportunities for product differentiation/innovation are scant, and margins may be enhanced with cost/process innovation.
It should be noted that as with all econometric analyses of this type, a caveat must be made in respect of the interpretation of the findings. The results in this study uncover relationships between certain characteristics of the companies and the markets in which they operate and their choice of protection strategy. However, this should not be construed as conclusive proof of cause-and-effect relationships. More in-depth research and better data are required to more clearly identify the causal factors. Nevertheless, the results of this study hopefully will provide a basis for policy-makers to further develop policies in this area following the adoption of the Trade Secrets Directive in 2016.
European Observatory on Infringements of
Intellectual Property Rights
PROTECTING INNOVATION THROUGH TRADE SECRETS AND PATENTS:DETERMINANTS FOR EUROPEAN UNION FIRMS
www.euipo.europa.eu 10
1. Introduction
Innovation is the market introduction of a technical or organisational novelty, not just its invention.
Joseph Schumpeter. The Oslo Manual3 defines innovation as ‘the implementation of a new or significantly improved product (good or service), or process, a new marketing method, or a new organisational method in business practices, workplace organisation or external relations.’ Furthermore, ‘the minimum requirement for an innovation is that the product, process, marketing method or organisational method must be new (or significantly improved) to the firm. This includes products, processes and methods that firms are the first to develop and those that have been adopted from other firms or organisations.’ Innovations can be evolutionary or revolutionary. The first can be brought about by incremental advances in technology or processes, while the latter refer to innovations which are often disruptive and can even be associated with the creation of new markets.
a. Protection of innovations and appropriability of returns from innovation
There is widespread agreement that in a perfectly competitive market in which, among other assumptions, no producer has market power, there is no product differentiation and all firms have immediate and perfect access to the same technologies, the rate of innovation would be very low. As stressed by Schumpeter J. (1942), entrepreneurs expect supernormal4 profits by enjoying some kind of exclusive market power over their inventions. That expectation would encourage them to devote time and money to innovation activities. Appropriability is the capacity of an economic agent to retain the added value created by its innovations while being able to exclude competitors from it. The term refers to environmental factors but also to methods or mechanisms that govern the innovator’s ability to gain some market power from its innovations.
3 The Oslo Manual contains guidelines for collecting and using data on industrial innovation. The manual is the result of a joint effort of the European Union and the OECD. It is the conceptual basis for the CIS and similar surveys in EU Member States as well as Norway, Iceland, Switzerland, Canada, Australia, New Zealand, Turkey, Japan, South Korea and many other countries. 4 Normal profit is defined as the minimum level of profit necessary to allow a firm to stay in the market in the long run. Supernormal profit is defined as extra profit above that level of normal profit. Supernormal profit means there is an incentive for other firms to enter the industry (if they can).
European Observatory on Infringements of
Intellectual Property Rights
PROTECTING INNOVATION THROUGH TRADE SECRETS AND PATENTS:DETERMINANTS FOR EUROPEAN UNION FIRMS
www.euipo.europa.eu 11
Nelson (1959) and Arrow (1962) highlighted the quasi-public good characteristics of knowledge as a barrier for investing in innovation. If inventors or innovators could not rely on some means to protect the knowledge they create, they would be at a disadvantage compared to their rivals that did not incur the costs of creating that knowledge. Such rivals could free ride on the innovation expenses of the innovators and imitate the new product/process at zero cost. Some kind of mechanism is therefore required to incentivise private agents to devote resources to innovation activities. Intellectual property rights (such as patents, designs, trade marks, plant varieties or copyright) are some of the appropriability mechanisms that may be used by innovators. However, there are other available mechanisms, including the exploitation of lead time advantage, complexity of design and secrecy. ‘Lead time advantage’ is the practice to commercialise an innovation as fast as possible to benefit from so-called first-mover advantages. ‘Complex design’ of a product impedes competitors from engaging in reverse engineering or ‘invent-around’ strategies. Since labour mobility is also a vector for technology imitation, labour legislation, contracts and the ability to attract and retain key human resources for a company can also be appropriability tools (Hurmelinna, P. & K. Puumalainen, 2007).
b. Trade secrets definition
An internationally agreed definition of trade secrecy can be found in Article 39 of the TRIPS Agreement (Agreement on Trade-Related Aspects of Intellectual Property Rights, 1994)5. This definition is also used in Article 2 of the recently adopted EU directive on the protection of trade secrets6:
(1) ‘trade secret’ means information which meets all of the following requirements:
(a) is secret in the sense that it is not, as a body or in the precise configuration and assembly of its components, generally known among or readily accessible to persons within the circles that normally deal with the kind of information in question;
(b) has commercial value because it is secret;
5 TRIPS is an international agreement administered by the World Trade Organization that sets minimum standards for many forms of intellectual property regulation. The areas of intellectual property covered are copyright and related rights, trademarks, geographical indications, industrial designs, patents, including the protection of new varieties of plants, the layout-designs of integrated circuits and undisclosed information including trade secrets and test data. 6 Directive of the European Parliament and of the Council on the protection of undisclosed know-how and business information (trade secrets) against their unlawful acquisition, use and disclosure. The directive was approved by the European Parliament on 14 April 2016 and adopted by the Council on 27 May 2016. Member States have two years to transpose the Trade Secrets Directive into national law.
European Observatory on Infringements of
Intellectual Property Rights
PROTECTING INNOVATION THROUGH TRADE SECRETS AND PATENTS:DETERMINANTS FOR EUROPEAN UNION FIRMS
www.euipo.europa.eu 12
(c) has been subject to reasonable steps under the circumstances, by the person lawfully in control of the information, to keep it secret.
The duration of trade secret protection is not limited to a set term as is usually the case with IP rights. Such information or knowledge can include new manufacturing processes, improved recipes, or information on customers or suppliers. Information protected through a trade secret can be strategic for decades (e.g. a recipe or a chemical compound), or ephemeral (e.g. the results of a marketing study, the name, price and launch date of a new product, or the price offered in a bidding procedure).
c. Different legal frameworks
As a consequence of historical evolution, the current situation at the EU level is that the legal protection afforded by Member States to trade secrets varies significantly notwithstanding legal instruments already in place at the international level to foster uniform standards of protection. The TRIPS Agreement aims at reducing distortions and impediments to international trade by providing adequate standards and principles concerning the availability, scope and use of trade-related intellectual property rights as well as effective and appropriate means for their enforcement. However, this potentially common benchmark does not effectively serve the purpose of fostering uniformity because it has not been fully adopted, or has been adopted with different specifications and implementation details. Within the EU, Sweden is the only Member State with specific legislation on trade secrets. All the other Member States offer protection to trade secrets through different pieces of civil and criminal legislation. Countries such as Austria, Germany, Poland and Spain rely on unfair competition law, while Italy and Portugal have specific provisions on the protection of trade secrets included in their respective Codes of Industrial Property. France has specific provisions on the protection of manufacturing trade secrets also included in its Code of Industrial Property. Civil liability law is also widely used to protect trade secrets, particularly in the Netherlands and Luxembourg. Civil liability law principles usually assist in the quantification of damages in the form of loss suffered and foregone profits. In common law countries such as the Ireland and the United Kingdom, lacking any specific legislation, trade secrets are effectively protected by the common law relating to breach of confidence and/or equity and by contract and employment law. The latter is the case also for Malta. Most Member States −with the exception of, the Czech Republic, Cyprus, Ireland, Luxembourg, Malta and the United Kingdom− have specific provisions on trade secrets in national labour laws or in their Civil Codes. Indeed, misappropriation by disaffected employees is widely recognised as a critical area for trade secrets protection. The minimum
European Observatory on Infringements of
Intellectual Property Rights
PROTECTING INNOVATION THROUGH TRADE SECRETS AND PATENTS:DETERMINANTS FOR EUROPEAN UNION FIRMS
www.euipo.europa.eu 13
common standard is prevention of trade secrets and confidential business information disclosure by employees (at least) during the employment relationship. Outside the European Union, the USA has a specific law on trade secret theft; the Defend Trade Secrets Act of 2016 (DTSA). Japan and Switzerland rely on specific provisions contained in their respective unfair competition laws. The US and Japanese laws contain a statutory definition of trade secrets. They also provide a detailed description of the conduct which amounts to trade secrets misappropriation and/or unfair competition. On the other hand, Switzerland does not consider trade secrets as IP rights and has no statutory definition. However, a certain degree of uniformity is ensured by the case-law based on the identification criteria set forth under Article 39.2 of TRIPS.
d. Trade secrets in detail
Trade secrets can be technical in nature, such as drawings and designs, prototypes, manufacturing processes, non-patentable or non-patented inventions, know-how, formulae or recipes, genetic materials and fragrances. Commercial trade secrets may consist of customer and supplier lists, business methods and strategies, and cost and price information.
The EU directive on the protection of trade secrets explains the relationship between trade secrets and other types of IP as follows:
Businesses and non- commercial research institutions invest in acquiring, developing and applying know-how and information, which is the currency of the knowledge economy. This investment in generating and applying intellectual capital determines their competitiveness in the market and therefore their returns on investment, which is the underlying motivation for business research and development. Businesses have recourse to different means to appropriate the results of their innovative activities when openness does not allow for the full exploitation of their research and innovation investments. Use of formal intellectual property rights such as patents, design rights or copyright is one of them. Another is to protect access and exploit the knowledge that is valuable to the entity and not widely known. Such know-how and business information, that is undisclosed and intended to remain confidential is referred to as a trade secret. Businesses, irrespective of their size, value trade secrets as much as patents and other forms of intellectual property right and use confidentiality as a business and research innovation management tool, covering a diversified range of information, which extends beyond technological knowledge to commercial data such as information on customers and suppliers, business plans or market research and strategies. By protecting such a wide range of know-how and commercial information, whether as a complement or as an alternative to intellectual property rights, trade secrets allow the creator to derive profit from his/her creation and
European Observatory on Infringements of
Intellectual Property Rights
PROTECTING INNOVATION THROUGH TRADE SECRETS AND PATENTS:DETERMINANTS FOR EUROPEAN UNION FIRMS
www.euipo.europa.eu 14
innovations and therefore are particularly important for research and development and innovative performance.
While all patented inventions may have been kept secret, all secret information is not eligible for patent protection because it does not pass the patentability thresholds. Therefore, the range of information that can be kept as a trade secret is indeed much broader by definition. If the intellectual technical assets of a firm were to be seen as an iceberg, patents would be the visible part and trade secrets the submerged part. Some researchers have argued that it is preferable from a social standpoint for inventions to be patented because, in addition to protecting the returns from innovation, the disclosure required by patents encourages further innovation as others build upon the original idea (even if the technical value of patent disclosures has been questioned by some researchers7). Moreover, the disclosure of patents also enables competition by imitators once the patent lapses (e.g. entry of generics). Such competition may be much more difficult if the knowledge is kept secret and never disclosed. In summary, the advantages of trade secrets include:
broad range of protectable subject matter, including inventions that may not qualify
for patent protection;
no formal registration required, avoiding the associated costs;
applies to innovation in the early stages of innovative process8;
disclosure of invention not required;
may be used in combination with other IP protection mechanisms to protect complex
innovations9;
unlimited term of protection.
Potential disadvantages of trade secrets compared to registered IPRs, especially patents,
include:
trade secrets are not IP rights as such and therefore do not benefit from the
associated protection;
problems of proof before courts in many cases if no measures have been taken to
ensure proof up front;
7 See L. Ouellette (2012), ‘Do Patents Disclose Useful Information?’ 8 Erkal (2004) stresses that trade secret law complements patent law in earlier stages of the innovation process by allowing innovators to work on their ideas until they become patentable. 9 Ottoz, E., F. Cugno (2008), ‘Patent-secret mix in complex product firms’.
European Observatory on Infringements of
Intellectual Property Rights
PROTECTING INNOVATION THROUGH TRADE SECRETS AND PATENTS:DETERMINANTS FOR EUROPEAN UNION FIRMS
www.euipo.europa.eu 15
invention not protected against reproduction through reverse engineering,
independent discovery or inadvertent disclosure;
require substantial investments and ongoing expenses for internal controls to protect
trade secrets from misappropriation in a meaningful way that would be recognised in
court;
require explicit non-disclosure and not-compete clauses in employee contracts which
may inhibit employee mobility or trigger payment of indemnification if enforceable;
application of trade secret laws uncertain and remedies vary by jurisdiction;
enforcement generally difficult10 and the firm risks being ‘revictimised’ by making the
loss public.
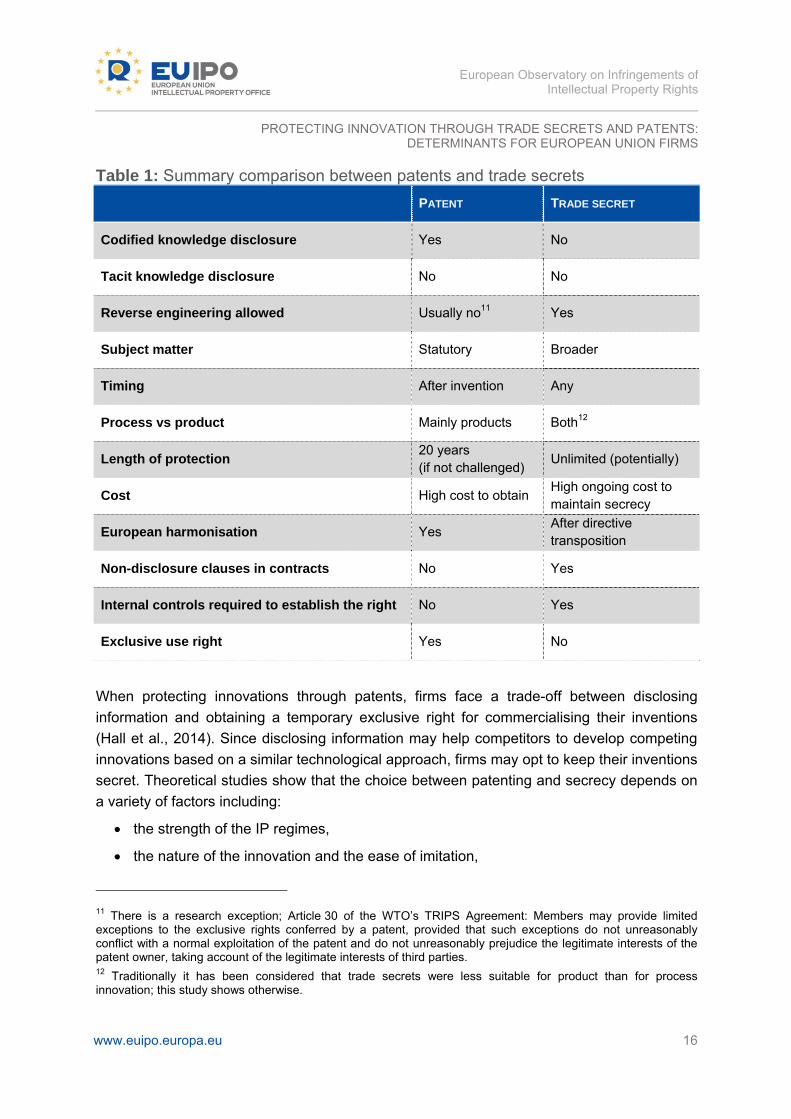
In addition, as mentioned above, from society’s point of view the non-disclosure of inventions inherent in trade secrets use may inhibit the dissemination of knowledge and technology. Table 1 summarises differences between patents and trade secrets.
10 Almeling et al (2010)
European Observatory on Infringements of
Intellectual Property Rights
PROTECTING INNOVATION THROUGH TRADE SECRETS AND PATENTS:DETERMINANTS FOR EUROPEAN UNION FIRMS
www.euipo.europa.eu 16
Table 1: Summary comparison between patents and trade secrets
PATENT TRADE SECRET
Codified knowledge disclosure Yes No
Tacit knowledge disclosure No No
Reverse engineering allowed Usually no11 Yes
Subject matter Statutory Broader
Timing After invention Any
Process vs product Mainly products Both12
Length of protection 20 years (if not challenged)
Unlimited (potentially)
Cost High cost to obtain High ongoing cost to maintain secrecy
European harmonisation Yes After directive transposition
Non-disclosure clauses in contracts No Yes
Internal controls required to establish the right No Yes
Exclusive use right Yes No
When protecting innovations through patents, firms face a trade-off between disclosing
information and obtaining a temporary exclusive right for commercialising their inventions
(Hall et al., 2014). Since disclosing information may help competitors to develop competing
innovations based on a similar technological approach, firms may opt to keep their inventions
secret. Theoretical studies show that the choice between patenting and secrecy depends on
a variety of factors including:
the strength of the IP regimes,
the nature of the innovation and the ease of imitation,
11 There is a research exception; Article 30 of the WTO’s TRIPS Agreement: Members may provide limited exceptions to the exclusive rights conferred by a patent, provided that such exceptions do not unreasonably conflict with a normal exploitation of the patent and do not unreasonably prejudice the legitimate interests of the patent owner, taking account of the legitimate interests of third parties. 12 Traditionally it has been considered that trade secrets were less suitable for product than for process innovation; this study shows otherwise.
European Observatory on Infringements of
Intellectual Property Rights
PROTECTING INNOVATION THROUGH TRADE SECRETS AND PATENTS:DETERMINANTS FOR EUROPEAN UNION FIRMS
www.euipo.europa.eu 17
the market structure,
firm capabilities and
competitor strategies.
(See Anton and Yao, 2004; Kultti et al., 2006, 2007; Mosel, 2011; Panagopoulos and Park, 2015; Ottoz and Cugno, 2011). Empirical studies frequently find that firms favour secrecy over patenting (Levin et al., 1987; Brouwer and Kleinknecht, 1999; Cohen et al., 2000, 2002; Hall et al., 2013) and some consider them to be more effective than patenting (Arundel, 2001). While many theoretical studies treat patenting and secrecy as substitutes, observed firm practices rather suggest that both protection methods are used simultaneously and in a complementary manner. At a firm level, provided that the two methods are employed for different innovations, this is straightforward. However, firms may also choose to mix both strategies at the level of individual innovations by protecting some elements of a technology through patents and keeping others secret (Belleflamme and Bloch, 2014). For example, if innovations involve both codified and tacit knowledge, firms may patent the codified knowledge and keep the tacit knowledge secret (Arora, 1997). Firms may also combine patenting and secrecy in a way that enables them to keep the codified part of an invention secret, whilst maintaining the option of later patenting the invention (Graham, 2004). In this study, the empirical analysis focuses on the choice of innovating firms to protect their innovations through patenting and/or secrecy. Starting from propositions of theoretical models on the interaction between patenting and secrecy, and in particular as formulated by Hall et al. (2013), a number of factors that are thought to influence the use of the two protection mechanisms are investigated. Particular emphasis is placed on preferences for either patents or secrecy, and the factors affecting the choice for a combined protection strategy. The present study was initially conducted for Germany as a pilot, and the methodologies developed in that pilot are here applied to the CIS data for other EU Member States. The report is organised as follows: in the following section, hypotheses on determinants of the choice between patenting and secrecy from the theoretical and empirical literature are discussed. Section 3 describes the data used as the basis for the study. Section 4 presents descriptive results, while Section 5 discusses the econometric model estimates. Finally, Section 6 provides a conclusion and discusses some perspectives for further research.
European Observatory on Infringements of
Intellectual Property Rights
PROTECTING INNOVATION THROUGH TRADE SECRETS AND PATENTS:DETERMINANTS FOR EUROPEAN UNION FIRMS
www.euipo.europa.eu 18
2. Literature and Hypotheses
The expectation that new or improved products or processes will increase profits leads firms to innovate. The successful completion of the innovation process alone, however, is not a sufficient condition to obtain the expected benefits from innovation. A firm must also be able to appropriate these benefits, that is to say, to keep its competitors from imitating the innovation. This can be achieved via various intellectual property rights and other strategies (Neuhaeusler, 2009). The appropriability problem is one of the basic economic justifications for an IP system. Nevertheless, in practice, invention and innovation do occur even if firms cannot access, or choose not to use, the IP system. Several possibilities exist to exclude third parties from the exploitation of one's own innovative endeavours, which are commonly grouped into two broad categories. The first category includes the formal protection mechanisms (e.g. patents, trade marks, registered designs or copyright) which grant innovators an exclusive (but usually time-limited) right to use the results from their innovation activities (Rammer, 2002). These formal protection mechanisms can be seen as incentives for innovators to invest in and generate new knowledge and new technologies and to foster their diffusion because their enforcement is guaranteed by the state (Rammer, 2007). The second category are the so-called informal protection instruments, which cover different
actions that firms can undertake to protect their innovations and maximise their expected
returns. In contrast to formal instruments, they are not always guaranteed by the state
(Rammer, 2002). These mechanisms include, inter alia:
secrecy: the most common informal mechanism;
lead time advantage: the practice of commercialising an innovation as fast as
possible to benefit from so-called first-mover advantages;
complex design of a product that impedes competitors from engaging in reverse
engineering or invent-around strategies.
In a recent literature survey, Hall et al. (2014) summarised the main results of theoretical and empirical work on firms’ choices to protect their innovations through various formal and informal methods. Building upon these results, and considering some more recent literature, five hypotheses on the determinants of the use of patenting and secrecy as protection mechanisms for innovation are discussed and analysed in the present study. These hypotheses are not intended to be a comprehensive theory about the determinants of patent and trade secret use, but rather a list of relevant academic hypotheses which could be tested using the CIS 2012 data. These propositions are introduced below.
European Observatory on Infringements of
Intellectual Property Rights
PROTECTING INNOVATION THROUGH TRADE SECRETS AND PATENTS:DETERMINANTS FOR EUROPEAN UNION FIRMS
www.euipo.europa.eu 19
H1. Degree of innovation competition
The assumption of a sole innovator in the model of Kultti et al. (2007) is rarely found in practice. Most technological markets are characterised by a larger number of firms with similar innovative capacities, which often enter into R&D races for the fastest technological solutions (Lemley, 2012). The degree of innovation competition is commonly seen as a driver for patenting. Where there is the possibility of simultaneous invention, the first inventor will opt for patenting (so as to be first filer and thus protected by EU law), thereby disadvantaging the others. In contrast, if an innovator has a large technological lead over its competitors, and expects to maintain this lead by soon generating new inventions, the lead innovator will prefer secrecy to patenting (Schneider, 2008; Zaby, 2010).
H2. Level of innovation
Anton and Yao (2004) model the role of the degree of innovation in terms of small v major innovations. They demonstrate that in a model with an innovator and a competitor with less innovative capacity, major innovations are not patented but kept secret to prevent imitation by competitors. Pajak (2010) uses data from the French innovation survey and finds, albeit for a very small sample of firms, that smaller innovations are patented while secrecy is used to protect large innovations.
H3. Type of innovation
Patenting is preferred over secrecy if the threat of imitation, for example by reverse-engineering, is high. In this case, applying for a patent and hence disclosing details about the invention in the patent document reveals no more information than one could obtain from looking at the innovation. In contrast, if rivals could substantially learn from the information provided in the patent document but could not reverse-engineer the innovation, firms would opt for secrecy (Hall and Harhoff, 2012). In general, reverse-engineering is easier to apply to product innovations. For process innovations that have been developed in-house, and that are not traded, reverse-engineering is largely impossible. For this reason, process innovation will be more likely subject to secrecy while product innovations will be more often protected by patenting.
H4. Open innovation practices
Following Chesbrough and Bogers (2014), ‘open innovation’, as used here (and in the CIS) is understood as ‘a distributed innovation process based on managed knowledge flows across organisational boundaries, using pecuniary and non-pecuniary mechanisms in line with the organisation’s business model’, and include active participation in innovation activities carried out by other enterprises or institutions. Open innovators rely heavily on their interaction with key users, suppliers, clients and a range of other actors inside the innovation system.
European Observatory on Infringements of
Intellectual Property Rights
PROTECTING INNOVATION THROUGH TRADE SECRETS AND PATENTS:DETERMINANTS FOR EUROPEAN UNION FIRMS
www.euipo.europa.eu 20
The way firms organise their innovation process is likely to influence their protection strategy. In the literature, there are two views as to how external knowledge sourcing and the choice of protection methods are linked (Arora et al., 2015). The ‘spillover prevention’ approach stresses that collaborating firms favour patenting in order to control spillovers to external partners (Cassiman and Veugelers, 2002), while adopting a secrecy strategy is more difficult when firms are engaged in collaboration (Giarratana and Mariani, 2014). The ‘organisational openness’ approach argues that collaborating firms will refrain from patenting (Laursen and Salter, 2014) since a focus on patenting and exclusivity makes a firm less efficient in developing collaborative innovations, and hence also, a less attractive partner.
H5. Financial constrains
Applying for patents and monitoring potential infringements is costly. Consequently, firms with financial constraints may opt for protection methods which could imply lower costs, such as secrecy13. Graham et al. (2009), as well as Cordes et al. (1999), have found that the most significant reason why start-ups and small high-tech firms refrain from patenting are the costs involved. The study by Hall et al. (2013) carried out using data from the UK innovation survey, found that firms reporting financial constraints on their innovative activity tend to prefer secrecy over patenting. In addition, patenting is often subject to economies of scale; larger businesses therefore tend to make greater use of patents (Lerner, 1995; Arundel and Kabla, 1998).
Combining patenting and secrecy
While much of the literature considers patenting and secrecy as substitutes for one another, or even as mutually exclusive protection strategies, they can also complement one another (Hall et al., 2014; Arora, 1997). Graham (2004) argues that firms may keep the codified part of an invention secret, while maintaining the option to later patent the invention. Hedge et al. (2009) stress the role of continuations in patenting which allow individual claims to be altered, thereby extending secrecy with regard to specific claims. In their empirical study, Graham and Hedge (2014) found that a small fraction of US patent applications (7.5 %) use a provision to keep their inventions secret before a patent is granted.
13 However, as noted above, maintaining secrecy generates ongoing costs of monitoring and protection.
European Observatory on Infringements of
Intellectual Property Rights
PROTECTING INNOVATION THROUGH TRADE SECRETS AND PATENTS:DETERMINANTS FOR EUROPEAN UNION FIRMS
www.euipo.europa.eu 21
3. Data
While most studies on economic contribution of formal innovation protection instruments are based on data from IPR registries (such as patent and trade mark offices), this is not possible for ‘informal’ instruments such as trade secrets. Therefore, most studies on informal protection methods are based on surveys. This approach has advantages and disadvantages compared to IPR register data.
Advantages of survey data:
allows to study both formal and informal methods and therefore compare them;
data reflects the use of the instruments at a particular moment, avoiding the possible bias associated with ownership of IP rights that are not used;
the relevant information can be related to other firm data such as its size and economic sector, its market, innovation type, R&D activity but also to strategies and obstacles for reaching firm’s goals: this is possible when access to microdata14 is available, which allows compilation of descriptive statistics and makes econometric analysis possible.
Limitations of survey data:
answers are subjective and data may not be recorded accurately;
surveys are expensive and as a consequence they usually cover small samples of the population and may lack subsequent quality controls;
survey responses usually do not offer additional information other than a binary response, whereas with a registered IPR a range of additional information on the protected invention may be available.
This study is based on data from the Community Innovation Survey using data for the reference year 2012 (CIS 2012). The CIS features many of the listed advantages while attempting to avoid the limitations. In particular, CIS is a large-scale survey (with about 197 000 responses in 2012) conducted across the EU by authoritative organisations (usually the national statistical offices) with a sound and proven methodology and quality controls. The main subject of the study is the economic significance of trade secrets but data on patents has been also used; not only because of the special relationship between trade
14 In the study of survey and census data, microdata is information at the level of individual respondents. Microdata is confidential but statistical offices allow access for research purposes under strict controls to limit the risk of disclosure of confidential data.
European Observatory on Infringements of
Intellectual Property Rights
PROTECTING INNOVATION THROUGH TRADE SECRETS AND PATENTS:DETERMINANTS FOR EUROPEAN UNION FIRMS
www.euipo.europa.eu 22
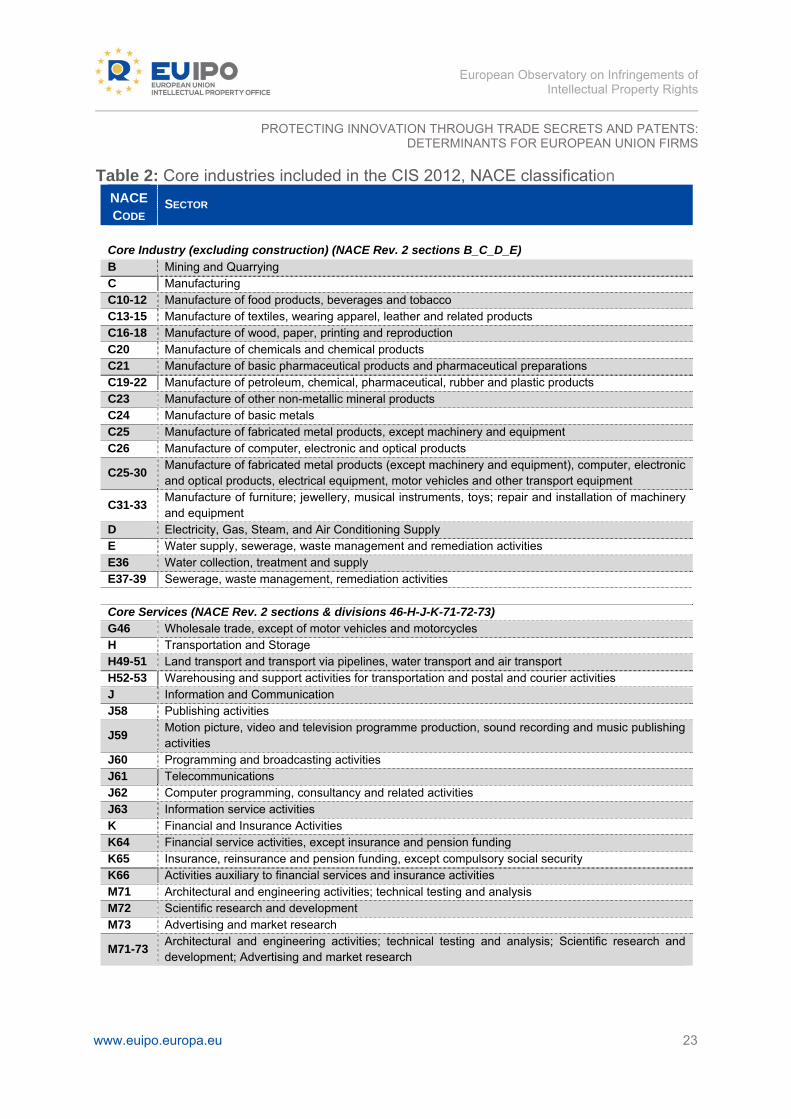
secrets and patents but also because a comparison between the two could provide a link to the patent studies based on registry data, putting into context the subjective bias of the survey data. CIS data is also used in the European Innovation Scoreboard (EIS)15. The EIS is an instrument of the European Commission, developed under the Lisbon Strategy, and revised after the adoption of the Europe 2020 Strategy, to provide a comparative assessment of the innovation performance of EU Member States. In order to ensure comparability across countries, Eurostat together with the Member States developed a standard core questionnaire accompanied by a set of definitions and methodological recommendations. CIS 2012 concepts and underlying methodology are also based on the Oslo Manual (third edition, 2005). CIS 2012 results were collected under Commission Regulation No 995/2012. This Regulation sets the mandatory target population of the survey that refers to enterprises in the Core NACE categories with at least 10 employees. Indicators related to the enterprises are classified by country, economic activity (NACE Rev. 2), size class and type of innovation activity. The group of covered sectors is restricted to those in Eurostat’s Core NACE industries for innovation statistics. In general terms, the core industries include mining and quarrying, almost all manufacturing industries and a large majority of service industries. While this provides a broad coverage of the service sector, there are a number of industries that are not covered in this classification, such as: construction, retail, hotels and restaurants, tourism, real estate, renting, other business services such as labour recruitment and industrial cleaning, public administration and a number of public, community or social services. Countries can also provide results for sectors in a more detailed form or for sectors that are not included in the Core NACE coverage on a voluntary basis. Table 2 shows the sectors included in the Core target population.
15 Known before 2016 as Innovation Union Scoreboard (IUS).
European Observatory on Infringements of
Intellectual Property Rights
PROTECTING INNOVATION THROUGH TRADE SECRETS AND PATENTS:DETERMINANTS FOR EUROPEAN UNION FIRMS
www.euipo.europa.eu 23
Table 2: Core industries included in the CIS 2012, NACE classification NACE
CODE SECTOR
Core Industry (excluding construction) (NACE Rev. 2 sections B_C_D_E)
B Mining and Quarrying C Manufacturing C10-12 Manufacture of food products, beverages and tobacco C13-15 Manufacture of textiles, wearing apparel, leather and related products C16-18 Manufacture of wood, paper, printing and reproduction C20 Manufacture of chemicals and chemical products C21 Manufacture of basic pharmaceutical products and pharmaceutical preparations C19-22 Manufacture of petroleum, chemical, pharmaceutical, rubber and plastic products C23 Manufacture of other non-metallic mineral products C24 Manufacture of basic metals C25 Manufacture of fabricated metal products, except machinery and equipment C26 Manufacture of computer, electronic and optical products
C25-30 Manufacture of fabricated metal products (except machinery and equipment), computer, electronic and optical products, electrical equipment, motor vehicles and other transport equipment
C31-33 Manufacture of furniture; jewellery, musical instruments, toys; repair and installation of machinery and equipment
D Electricity, Gas, Steam, and Air Conditioning Supply E Water supply, sewerage, waste management and remediation activities E36 Water collection, treatment and supply E37-39 Sewerage, waste management, remediation activities Core Services (NACE Rev. 2 sections & divisions 46-H-J-K-71-72-73) G46 Wholesale trade, except of motor vehicles and motorcycles H Transportation and Storage H49-51 Land transport and transport via pipelines, water transport and air transport H52-53 Warehousing and support activities for transportation and postal and courier activities J Information and Communication J58 Publishing activities
J59 Motion picture, video and television programme production, sound recording and music publishing activities
J60 Programming and broadcasting activities J61 Telecommunications J62 Computer programming, consultancy and related activities J63 Information service activities K Financial and Insurance Activities K64 Financial service activities, except insurance and pension funding K65 Insurance, reinsurance and pension funding, except compulsory social security K66 Activities auxiliary to financial services and insurance activities M71 Architectural and engineering activities; technical testing and analysis M72 Scientific research and development M73 Advertising and market research
M71-73 Architectural and engineering activities; technical testing and analysis; Scientific research and development; Advertising and market research
European Observatory on Infringements of
Intellectual Property Rights
PROTECTING INNOVATION THROUGH TRADE SECRETS AND PATENTS:DETERMINANTS FOR EUROPEAN UNION FIRMS
www.euipo.europa.eu 24
The number of countries participating has increased over time. In addition to all 28 EU Member states, EFTA members, EU candidate countries and other third countries have conducted the survey as well.
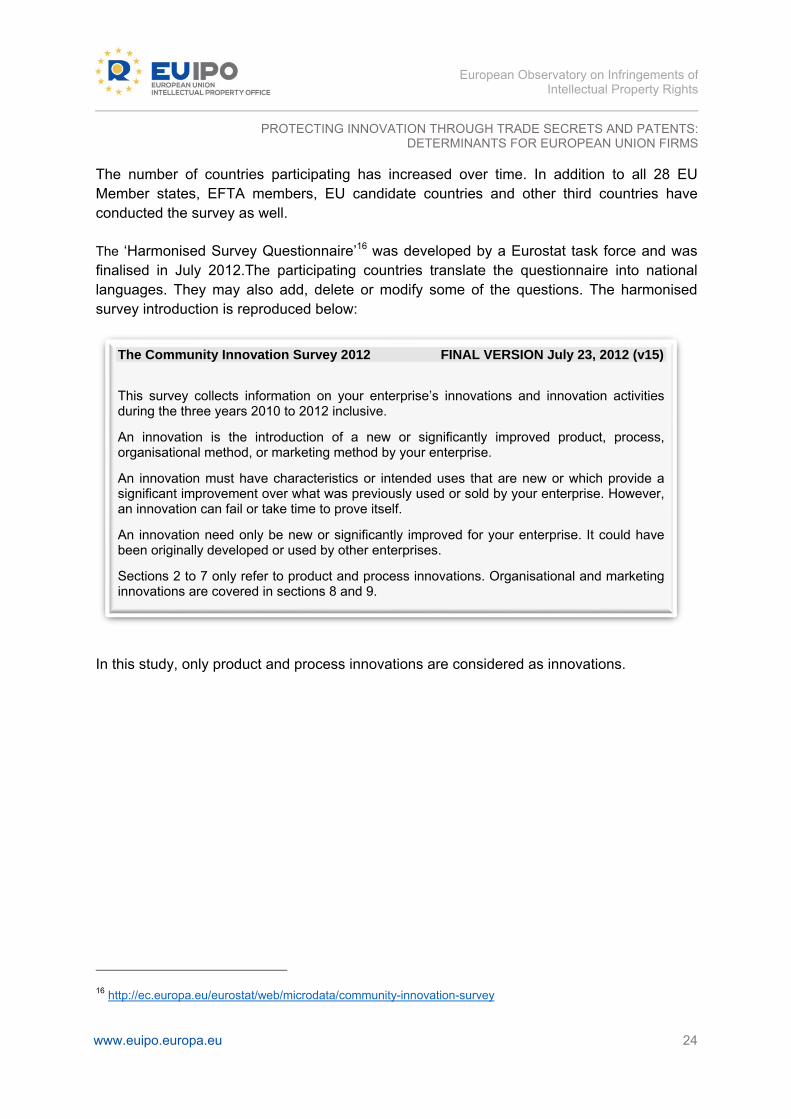
The ‘Harmonised Survey Questionnaire’16 was developed by a Eurostat task force and was finalised in July 2012.The participating countries translate the questionnaire into national languages. They may also add, delete or modify some of the questions. The harmonised survey introduction is reproduced below:
In this study, only product and process innovations are considered as innovations.
16 http://ec.europa.eu/eurostat/web/microdata/community-innovation-survey
The Community Innovation Survey 2012 FINAL VERSION July 23, 2012 (v15)
This survey collects information on your enterprise’s innovations and innovation activities during the three years 2010 to 2012 inclusive.
An innovation is the introduction of a new or significantly improved product, process, organisational method, or marketing method by your enterprise.
An innovation must have characteristics or intended uses that are new or which provide a significant improvement over what was previously used or sold by your enterprise. However, an innovation can fail or take time to prove itself.
An innovation need only be new or significantly improved for your enterprise. It could have been originally developed or used by other enterprises.
Sections 2 to 7 only refer to product and process innovations. Organisational and marketing innovations are covered in sections 8 and 9.
European Observatory on Infringements of
Intellectual Property Rights
PROTECTING INNOVATION THROUGH TRADE SECRETS AND PATENTS:DETERMINANTS FOR EUROPEAN UNION FIRMS
www.euipo.europa.eu 25
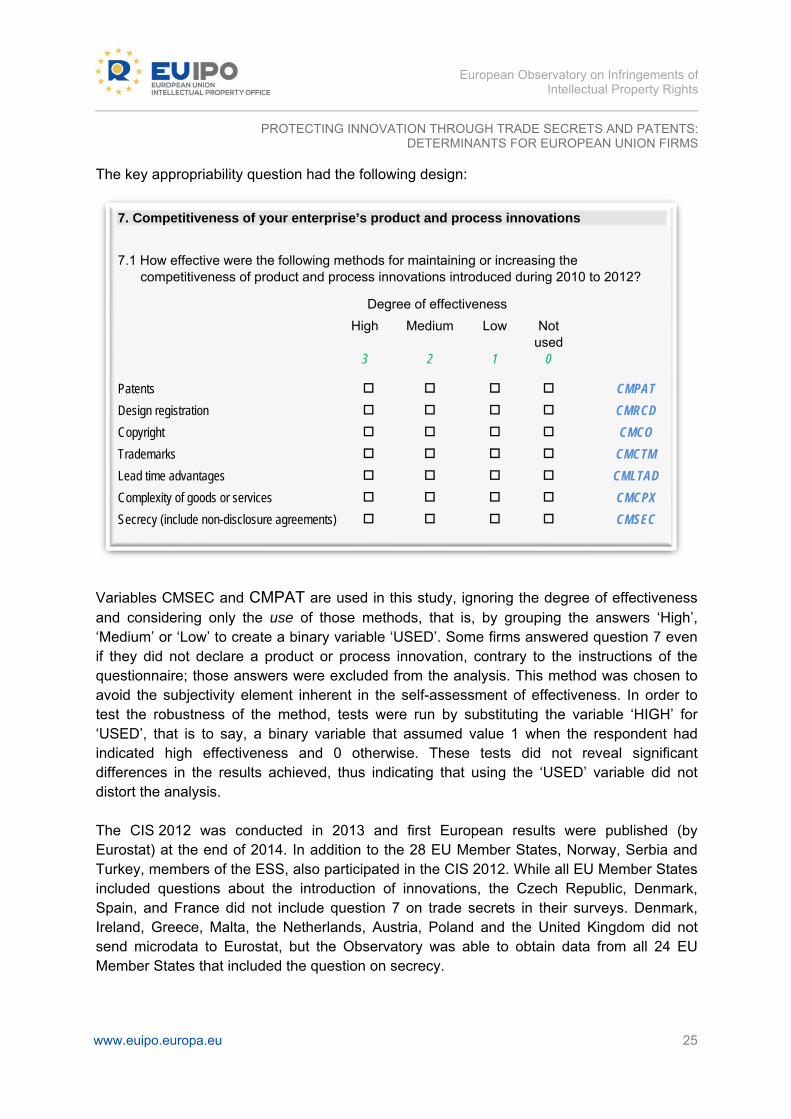
The key appropriability question had the following design:
Variables CMSEC and CMPAT are used in this study, ignoring the degree of effectiveness and considering only the use of those methods, that is, by grouping the answers ‘High’, ‘Medium’ or ‘Low’ to create a binary variable ‘USED’. Some firms answered question 7 even if they did not declare a product or process innovation, contrary to the instructions of the questionnaire; those answers were excluded from the analysis. This method was chosen to avoid the subjectivity element inherent in the self-assessment of effectiveness. In order to test the robustness of the method, tests were run by substituting the variable ‘HIGH’ for ‘USED’, that is to say, a binary variable that assumed value 1 when the respondent had indicated high effectiveness and 0 otherwise. These tests did not reveal significant differences in the results achieved, thus indicating that using the ‘USED’ variable did not distort the analysis. The CIS 2012 was conducted in 2013 and first European results were published (by Eurostat) at the end of 2014. In addition to the 28 EU Member States, Norway, Serbia and Turkey, members of the ESS, also participated in the CIS 2012. While all EU Member States included questions about the introduction of innovations, the Czech Republic, Denmark, Spain, and France did not include question 7 on trade secrets in their surveys. Denmark, Ireland, Greece, Malta, the Netherlands, Austria, Poland and the United Kingdom did not send microdata to Eurostat, but the Observatory was able to obtain data from all 24 EU Member States that included the question on secrecy.
7. Competitiveness of your enterprise’s product and process innovations
7.1 How effective were the following methods for maintaining or increasing the competitiveness of product and process innovations introduced during 2010 to 2012?
Degree of effectiveness
High Medium Low Not used
3 2 1 0
Patents CMPAT
Design registration CMRCD
Copyright CMCO
Trademarks CMCTM
Lead time advantages CMLTAD
Complexity of goods or services CMCPX
Secrecy (include non-disclosure agreements) CMSEC
European Observatory on Infringements of
Intellectual Property Rights
PROTECTING INNOVATION THROUGH TRADE SECRETS AND PATENTS:DETERMINANTS FOR EUROPEAN UNION FIRMS
www.euipo.europa.eu 26
4. A first look at the evidence: Descriptive analysis
In this section the descriptive statistics on use of trade secrets and patents among innovators are presented by country, economic sector, type of innovation and cooperation practices. All results are presented separately for large companies and SMEs.
a. Innovation rates by country
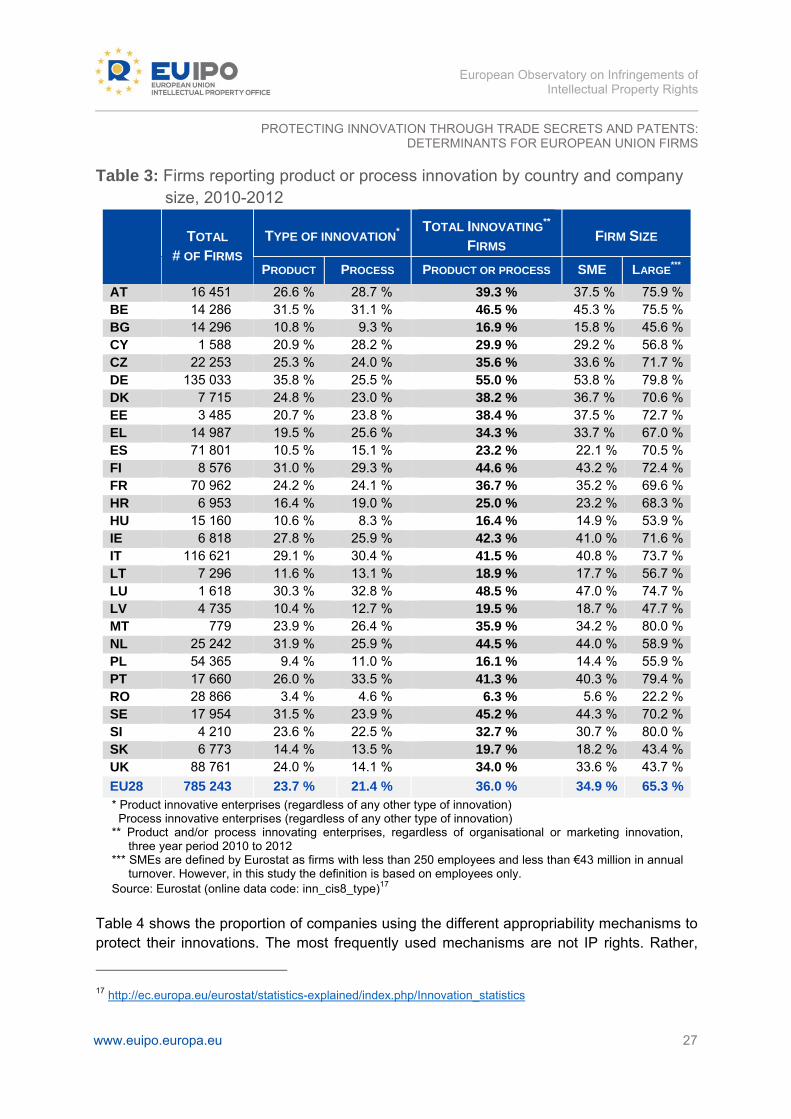
Table 3 shows the proportion of companies that declared an innovation (product or process) in the three year period 2010 to 2012. Overall, 36 % of firms in the CIS core sectors reported an innovation. At the EU level, 23.7 % of firms report product innovations while 21.4 % report innovating in processes; since a number of enterprises were both innovating in products and process, the total innovation rate of 36 % is less than the sum of these two figures. Germany is the country reporting the highest proportion of innovating companies. Firms from 12 Member States (DE, PT, AT, BE, LU, IT, EE, FI, IE, DK, SE, FR) have innovation rates above the EU average. Large companies in six additional Member States (EL, CZ, MT, SI, ES and HR) are innovating more than the EU average but the SMEs from those countries report low rates of innovation (in the case of ES and HR significantly below the EU average). In contrast, Dutch SMEs are innovating more than the EU average whereas Dutch large companies are just below the average EU innovation rate. The UK innovation rate is below the EU average, due to low innovation rates in large companies. Innovators in DE, NL, SE and UK are more orientated to product innovation whereas ES, RO, CY, EL and PT innovate significantly more in processes than in products. Firms in LV, PL, HR, EE, LT, MT, LU, AT and IT also report more innovation in processes than in products.
European Observatory on Infringements of
Intellectual Property Rights
PROTECTING INNOVATION THROUGH TRADE SECRETS AND PATENTS:DETERMINANTS FOR EUROPEAN UNION FIRMS
www.euipo.europa.eu 27
Table 3: Firms reporting product or process innovation by country and company size, 2010-2012
TOTAL
# OF FIRMS TYPE OF INNOVATION*
TOTAL INNOVATING**
FIRMS FIRM SIZE
PRODUCT PROCESS PRODUCT OR PROCESS SME LARGE***
AT 16 451 26.6 % 28.7 % 39.3 % 37.5 % 75.9 %BE 14 286 31.5 % 31.1 % 46.5 % 45.3 % 75.5 %BG 14 296 10.8 % 9.3 % 16.9 % 15.8 % 45.6 %CY 1 588 20.9 % 28.2 % 29.9 % 29.2 % 56.8 %CZ 22 253 25.3 % 24.0 % 35.6 % 33.6 % 71.7 %DE 135 033 35.8 % 25.5 % 55.0 % 53.8 % 79.8 %DK 7 715 24.8 % 23.0 % 38.2 % 36.7 % 70.6 %EE 3 485 20.7 % 23.8 % 38.4 % 37.5 % 72.7 %EL 14 987 19.5 % 25.6 % 34.3 % 33.7 % 67.0 %ES 71 801 10.5 % 15.1 % 23.2 % 22.1 % 70.5 %FI 8 576 31.0 % 29.3 % 44.6 % 43.2 % 72.4 %FR 70 962 24.2 % 24.1 % 36.7 % 35.2 % 69.6 %HR 6 953 16.4 % 19.0 % 25.0 % 23.2 % 68.3 %HU 15 160 10.6 % 8.3 % 16.4 % 14.9 % 53.9 %IE 6 818 27.8 % 25.9 % 42.3 % 41.0 % 71.6 %IT 116 621 29.1 % 30.4 % 41.5 % 40.8 % 73.7 %LT 7 296 11.6 % 13.1 % 18.9 % 17.7 % 56.7 %LU 1 618 30.3 % 32.8 % 48.5 % 47.0 % 74.7 %LV 4 735 10.4 % 12.7 % 19.5 % 18.7 % 47.7 %MT 779 23.9 % 26.4 % 35.9 % 34.2 % 80.0 %NL 25 242 31.9 % 25.9 % 44.5 % 44.0 % 58.9 %PL 54 365 9.4 % 11.0 % 16.1 % 14.4 % 55.9 %PT 17 660 26.0 % 33.5 % 41.3 % 40.3 % 79.4 %RO 28 866 3.4 % 4.6 % 6.3 % 5.6 % 22.2 %SE 17 954 31.5 % 23.9 % 45.2 % 44.3 % 70.2 %SI 4 210 23.6 % 22.5 % 32.7 % 30.7 % 80.0 %SK 6 773 14.4 % 13.5 % 19.7 % 18.2 % 43.4 %UK 88 761 24.0 % 14.1 % 34.0 % 33.6 % 43.7 %
EU28 785 243 23.7 % 21.4 % 36.0 % 34.9 % 65.3 %* Product innovative enterprises (regardless of any other type of innovation) Process innovative enterprises (regardless of any other type of innovation) ** Product and/or process innovating enterprises, regardless of organisational or marketing innovation,
three year period 2010 to 2012 *** SMEs are defined by Eurostat as firms with less than 250 employees and less than €43 million in annual
turnover. However, in this study the definition is based on employees only. Source: Eurostat (online data code: inn_cis8_type)17
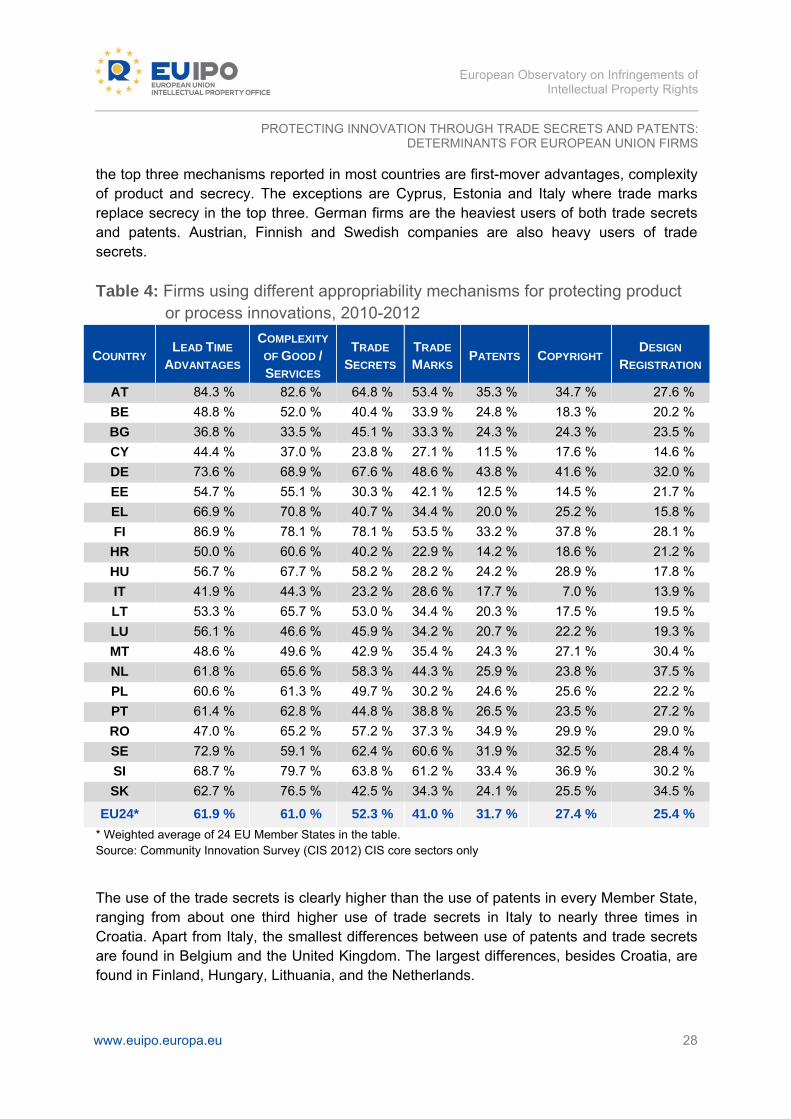
Table 4 shows the proportion of companies using the different appropriability mechanisms to protect their innovations. The most frequently used mechanisms are not IP rights. Rather,
17 http://ec.europa.eu/eurostat/statistics-explained/index.php/Innovation_statistics
European Observatory on Infringements of
Intellectual Property Rights
PROTECTING INNOVATION THROUGH TRADE SECRETS AND PATENTS:DETERMINANTS FOR EUROPEAN UNION FIRMS
www.euipo.europa.eu 28
the top three mechanisms reported in most countries are first-mover advantages, complexity of product and secrecy. The exceptions are Cyprus, Estonia and Italy where trade marks replace secrecy in the top three. German firms are the heaviest users of both trade secrets and patents. Austrian, Finnish and Swedish companies are also heavy users of trade secrets.
Table 4: Firms using different appropriability mechanisms for protecting product or process innovations, 2010-2012
COUNTRY LEAD TIME
ADVANTAGES
COMPLEXITY
OF GOOD / SERVICES
TRADE
SECRETS TRADE
MARKSPATENTS COPYRIGHT
DESIGN
REGISTRATION
AT 84.3 % 82.6 % 64.8 % 53.4 % 35.3 % 34.7 % 27.6 %
BE 48.8 % 52.0 % 40.4 % 33.9 % 24.8 % 18.3 % 20.2 %
BG 36.8 % 33.5 % 45.1 % 33.3 % 24.3 % 24.3 % 23.5 %
CY 44.4 % 37.0 % 23.8 % 27.1 % 11.5 % 17.6 % 14.6 %
DE 73.6 % 68.9 % 67.6 % 48.6 % 43.8 % 41.6 % 32.0 %
EE 54.7 % 55.1 % 30.3 % 42.1 % 12.5 % 14.5 % 21.7 %
EL 66.9 % 70.8 % 40.7 % 34.4 % 20.0 % 25.2 % 15.8 %
FI 86.9 % 78.1 % 78.1 % 53.5 % 33.2 % 37.8 % 28.1 %
HR 50.0 % 60.6 % 40.2 % 22.9 % 14.2 % 18.6 % 21.2 %
HU 56.7 % 67.7 % 58.2 % 28.2 % 24.2 % 28.9 % 17.8 %
IT 41.9 % 44.3 % 23.2 % 28.6 % 17.7 % 7.0 % 13.9 %
LT 53.3 % 65.7 % 53.0 % 34.4 % 20.3 % 17.5 % 19.5 %
LU 56.1 % 46.6 % 45.9 % 34.2 % 20.7 % 22.2 % 19.3 %
MT 48.6 % 49.6 % 42.9 % 35.4 % 24.3 % 27.1 % 30.4 %
NL 61.8 % 65.6 % 58.3 % 44.3 % 25.9 % 23.8 % 37.5 %
PL 60.6 % 61.3 % 49.7 % 30.2 % 24.6 % 25.6 % 22.2 %
PT 61.4 % 62.8 % 44.8 % 38.8 % 26.5 % 23.5 % 27.2 %
RO 47.0 % 65.2 % 57.2 % 37.3 % 34.9 % 29.9 % 29.0 %
SE 72.9 % 59.1 % 62.4 % 60.6 % 31.9 % 32.5 % 28.4 %
SI 68.7 % 79.7 % 63.8 % 61.2 % 33.4 % 36.9 % 30.2 %
SK 62.7 % 76.5 % 42.5 % 34.3 % 24.1 % 25.5 % 34.5 %
EU24* 61.9 % 61.0 % 52.3 % 41.0 % 31.7 % 27.4 % 25.4 %
* Weighted average of 24 EU Member States in the table. Source: Community Innovation Survey (CIS 2012) CIS core sectors only
The use of the trade secrets is clearly higher than the use of patents in every Member State, ranging from about one third higher use of trade secrets in Italy to nearly three times in Croatia. Apart from Italy, the smallest differences between use of patents and trade secrets are found in Belgium and the United Kingdom. The largest differences, besides Croatia, are found in Finland, Hungary, Lithuania, and the Netherlands.
European Observatory on Infringements of
Intellectual Property Rights
PROTECTING INNOVATION THROUGH TRADE SECRETS AND PATENTS:DETERMINANTS FOR EUROPEAN UNION FIRMS
www.euipo.europa.eu 29
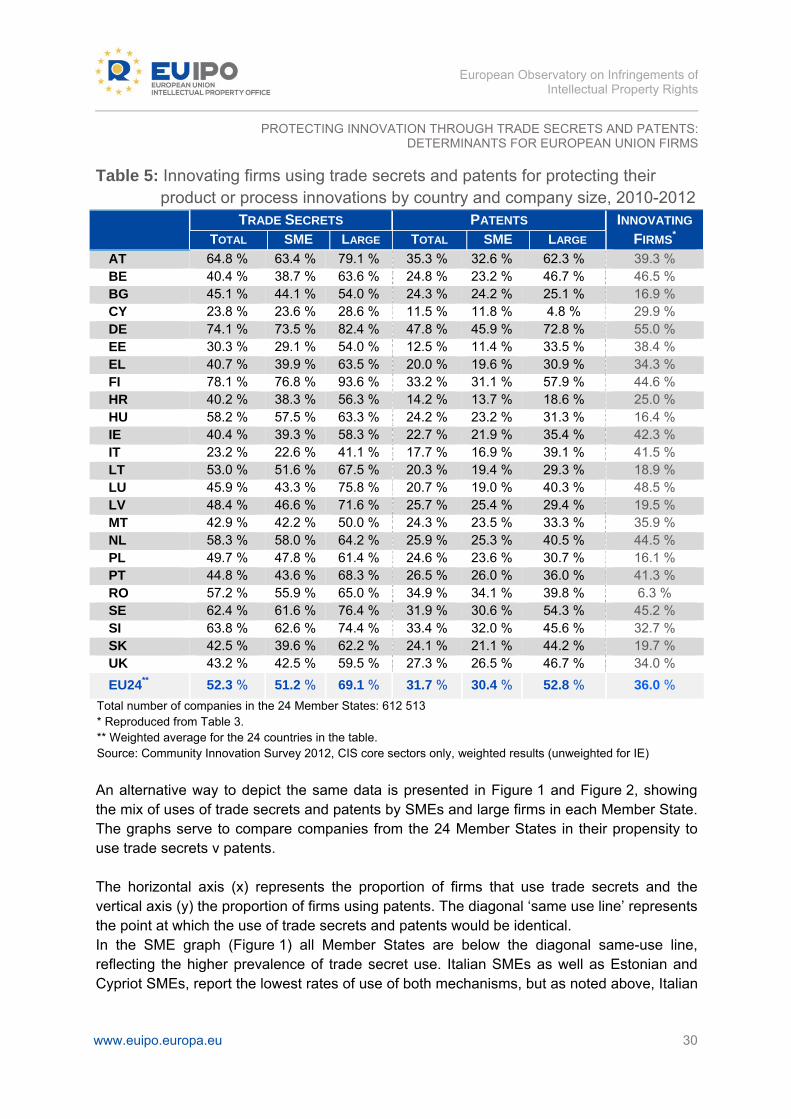
German and Finnish firms use both appropriability mechanisms heavily, with the highest use of patents in Germany and the highest use of trade secrets in Finland. Austria, Slovenia and Sweden report a high use of both IP mechanisms followed by Romania, the Netherlands and Hungary. Nevertheless this is not a uniform group; as shown in Table 5 below, Romania and Hungary report a low proportion of innovators (6.3 % and 16.4 %) whereas the Netherlands report one of the highest innovation rates at 44.5 %. In other words, there are fewer companies innovating in Romania or Hungary than in the Netherlands but the firms that do innovate use a similar mix of trade secrets and patents in the three countries. Firms in Italy have a low use of trade secrets and patents for protecting innovations, but Italian firms are among the most innovating (41.5 %).
b. Trade secrets and patents by company size Table 5 shows the use of patents and trade secrets by innovating firms in each of the 24 Member States in which the trade secrets question was included in the CIS. To put the figures in perspective the overall proportion of innovating firms is reproduced from Table 3. Trade secrets are used by 52.3 % and patents by 31.7 % of the innovating firms. The number is significantly higher for large companies: 69.1 % use trade secrets and 52.8 % use patents, compared to 51.2 % and 30.4 %, respectively, among SMEs.
European Observatory on Infringements of
Intellectual Property Rights
PROTECTING INNOVATION THROUGH TRADE SECRETS AND PATENTS:DETERMINANTS FOR EUROPEAN UNION FIRMS
www.euipo.europa.eu 30
Table 5: Innovating firms using trade secrets and patents for protecting their product or process innovations by country and company size, 2010-2012
TRADE SECRETS PATENTS INNOVATING FIRMS* TOTAL SME LARGE TOTAL SME LARGE
AT 64.8 % 63.4 % 79.1 % 35.3 % 32.6 % 62.3 % 39.3 % BE 40.4 % 38.7 % 63.6 % 24.8 % 23.2 % 46.7 % 46.5 % BG 45.1 % 44.1 % 54.0 % 24.3 % 24.2 % 25.1 % 16.9 % CY 23.8 % 23.6 % 28.6 % 11.5 % 11.8 % 4.8 % 29.9 % DE 74.1 % 73.5 % 82.4 % 47.8 % 45.9 % 72.8 % 55.0 % EE 30.3 % 29.1 % 54.0 % 12.5 % 11.4 % 33.5 % 38.4 % EL 40.7 % 39.9 % 63.5 % 20.0 % 19.6 % 30.9 % 34.3 % FI 78.1 % 76.8 % 93.6 % 33.2 % 31.1 % 57.9 % 44.6 % HR 40.2 % 38.3 % 56.3 % 14.2 % 13.7 % 18.6 % 25.0 % HU 58.2 % 57.5 % 63.3 % 24.2 % 23.2 % 31.3 % 16.4 % IE 40.4 % 39.3 % 58.3 % 22.7 % 21.9 % 35.4 % 42.3 % IT 23.2 % 22.6 % 41.1 % 17.7 % 16.9 % 39.1 % 41.5 % LT 53.0 % 51.6 % 67.5 % 20.3 % 19.4 % 29.3 % 18.9 % LU 45.9 % 43.3 % 75.8 % 20.7 % 19.0 % 40.3 % 48.5 % LV 48.4 % 46.6 % 71.6 % 25.7 % 25.4 % 29.4 % 19.5 % MT 42.9 % 42.2 % 50.0 % 24.3 % 23.5 % 33.3 % 35.9 % NL 58.3 % 58.0 % 64.2 % 25.9 % 25.3 % 40.5 % 44.5 % PL 49.7 % 47.8 % 61.4 % 24.6 % 23.6 % 30.7 % 16.1 % PT 44.8 % 43.6 % 68.3 % 26.5 % 26.0 % 36.0 % 41.3 % RO 57.2 % 55.9 % 65.0 % 34.9 % 34.1 % 39.8 % 6.3 % SE 62.4 % 61.6 % 76.4 % 31.9 % 30.6 % 54.3 % 45.2 % SI 63.8 % 62.6 % 74.4 % 33.4 % 32.0 % 45.6 % 32.7 % SK 42.5 % 39.6 % 62.2 % 24.1 % 21.1 % 44.2 % 19.7 % UK 43.2 % 42.5 % 59.5 % 27.3 % 26.5 % 46.7 % 34.0 %
EU24** 52.3 % 51.2 % 69.1 % 31.7 % 30.4 % 52.8 % 36.0 %
Total number of companies in the 24 Member States: 612 513 * Reproduced from Table 3. ** Weighted average for the 24 countries in the table. Source: Community Innovation Survey 2012, CIS core sectors only, weighted results (unweighted for IE)
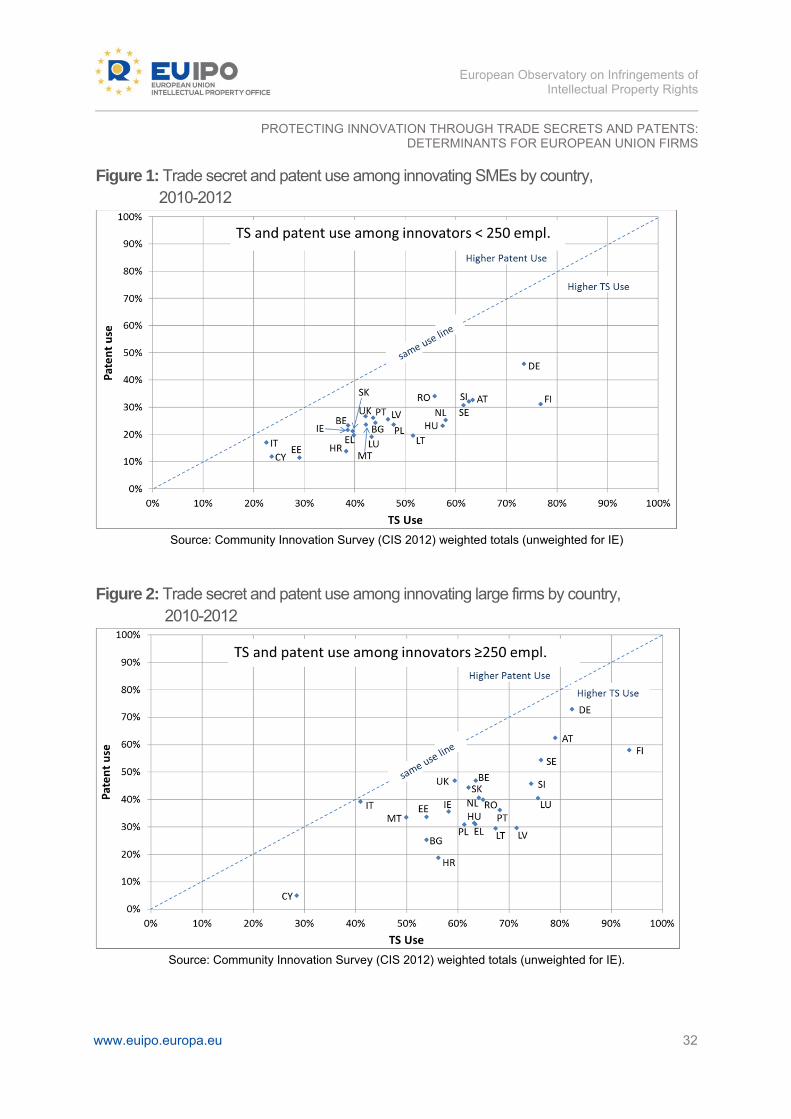
An alternative way to depict the same data is presented in Figure 1 and Figure 2, showing the mix of uses of trade secrets and patents by SMEs and large firms in each Member State. The graphs serve to compare companies from the 24 Member States in their propensity to use trade secrets v patents. The horizontal axis (x) represents the proportion of firms that use trade secrets and the vertical axis (y) the proportion of firms using patents. The diagonal ‘same use line’ represents the point at which the use of trade secrets and patents would be identical. In the SME graph (Figure 1) all Member States are below the diagonal same-use line, reflecting the higher prevalence of trade secret use. Italian SMEs as well as Estonian and Cypriot SMEs, report the lowest rates of use of both mechanisms, but as noted above, Italian
European Observatory on Infringements of
Intellectual Property Rights
PROTECTING INNOVATION THROUGH TRADE SECRETS AND PATENTS:DETERMINANTS FOR EUROPEAN UNION FIRMS
www.euipo.europa.eu 31
SMEs are closest to the same-use line, indicating a smaller difference between trade secret and patent use than in other Member States. At the other extreme are the innovating Finnish SMEs with a use of trade secrets 2.5 times that of patents. German SMEs also report a high rate of use of trade secrets (73.5 %) and the highest use of patents (49.5 %) among SMEs in the EU, as shown in the chart. SMEs in Austria, Slovenia, Sweden, Romania, the Netherlands and Hungary report high rates of use of trade secrets and patents but in Hungary and, especially, in Romania, the number of innovating SMEs is low (as is the case in Poland and Bulgaria as well).
European Observatory on Infringements of
Intellectual Property Rights
PROTECTING INNOVATION THROUGH TRADE SECRETS AND PATENTS:DETERMINANTS FOR EUROPEAN UNION FIRMS
www.euipo.europa.eu 32
Figure 1: Trade secret and patent use among innovating SMEs by country, 2010-2012
Source: Community Innovation Survey (CIS 2012) weighted totals (unweighted for IE)
Figure 2: Trade secret and patent use among innovating large firms by country, 2010-2012
Source: Community Innovation Survey (CIS 2012) weighted totals (unweighted for IE).
European Observatory on Infringements of
Intellectual Property Rights
PROTECTING INNOVATION THROUGH TRADE SECRETS AND PATENTS:DETERMINANTS FOR EUROPEAN UNION FIRMS
www.euipo.europa.eu 33
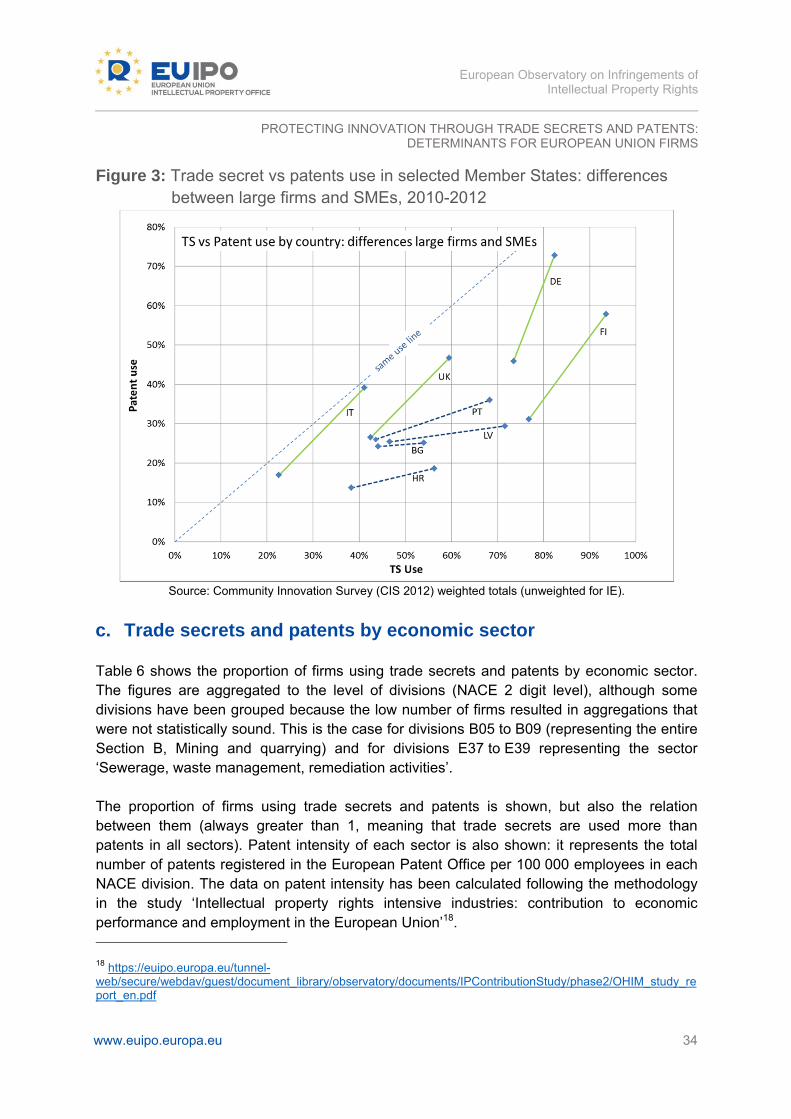
Figure 2 shows the same data as Figure 1, but for large companies (those with more than 250 employees). The use of protection tools among large firms varies more across the EU than among SMEs. With the exception of Cyprus, the use of both trade secrets and patents is significantly higher for large companies than for SMEs—the countries tend to lie further to the right in this graph than in the preceding SME graph. Once again, large Italian companies are using trade secrets and patents in similar proportions, with Italy almost on the same-use line; large German companies make heavy use of both trade secrets and patents, so that Germany is relatively close to the same-use line but at a much higher level than Italy. Together with Germany and Finland, Austria and Sweden are the countries where large companies report the highest use of trade secrets and patents. Figure 3 compares the propensity to use patents and trade secrets by SMEs and large innovating firms in selected Member States. In all cases, the lower marker corresponds to SMEs while the marker above and to the right (for the same country) corresponds to large firms. Two patterns emerge from the figure: In CY, BG, LV and HR, large innovating firms use trade secrets much more than
innovating SMEs in the same country, but only slightly more patents. Large innovating companies have a relatively stronger preference for secrecy than innovating SMEs in the same country, thus moving away from the same-use diagonal. A similar pattern is followed by companies from PT, EL, PL, LT, RO and LU.
In DE, FI, IT and UK, large innovating firms use both trade secrets and patents much more than innovating SMEs in the same country. Large innovating companies have a similar relative preference between trade secrets and patents than innovating SMEs in the same country, so that the line connecting the SME and large firm markers in those countries is parallel to the same-use diagonal or even steeper (DE and FI). A similar pattern is followed by companies from AT, SE, HU, MT and SI.
SK, BE, EE and IE exhibit an intermediate pattern.
European Observatory on Infringements of
Intellectual Property Rights
PROTECTING INNOVATION THROUGH TRADE SECRETS AND PATENTS:DETERMINANTS FOR EUROPEAN UNION FIRMS
www.euipo.europa.eu 34
Figure 3: Trade secret vs patents use in selected Member States: differences between large firms and SMEs, 2010-2012
Source: Community Innovation Survey (CIS 2012) weighted totals (unweighted for IE).
c. Trade secrets and patents by economic sector
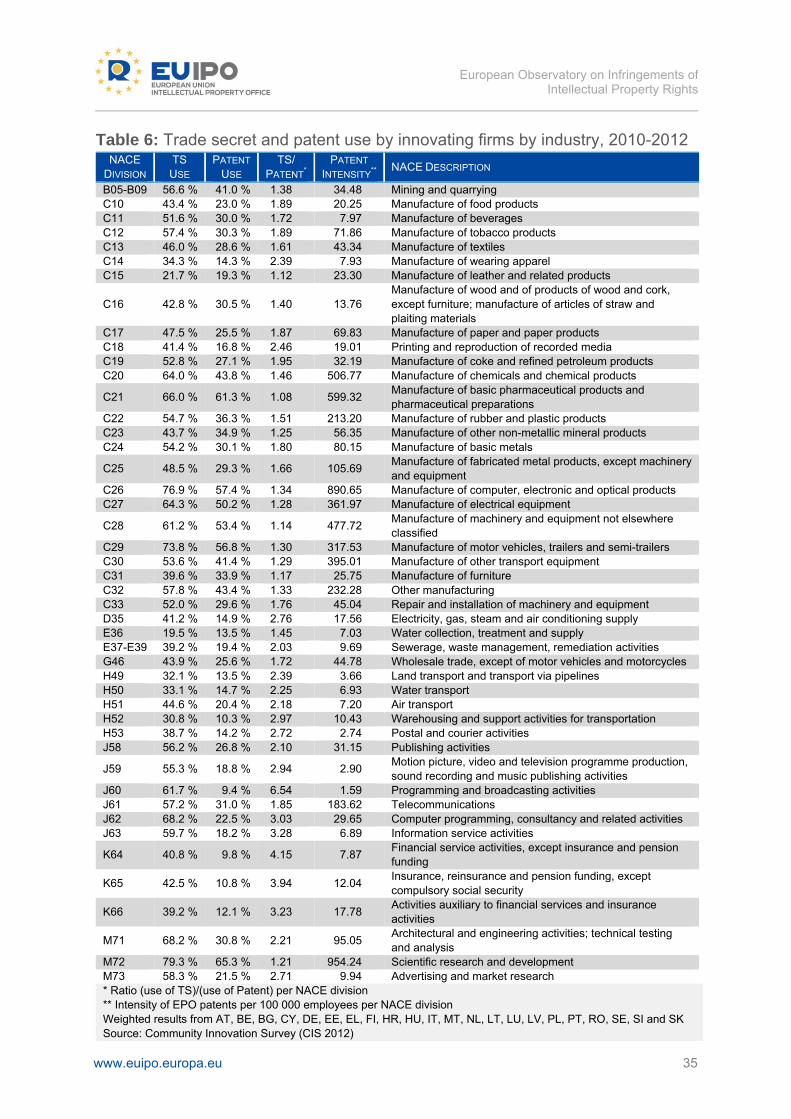
Table 6 shows the proportion of firms using trade secrets and patents by economic sector. The figures are aggregated to the level of divisions (NACE 2 digit level), although some divisions have been grouped because the low number of firms resulted in aggregations that were not statistically sound. This is the case for divisions B05 to B09 (representing the entire Section B, Mining and quarrying) and for divisions E37 to E39 representing the sector ‘Sewerage, waste management, remediation activities’. The proportion of firms using trade secrets and patents is shown, but also the relation between them (always greater than 1, meaning that trade secrets are used more than patents in all sectors). Patent intensity of each sector is also shown: it represents the total number of patents registered in the European Patent Office per 100 000 employees in each NACE division. The data on patent intensity has been calculated following the methodology in the study ‘Intellectual property rights intensive industries: contribution to economic performance and employment in the European Union’18.
18 https://euipo.europa.eu/tunnel-web/secure/webdav/guest/document_library/observatory/documents/IPContributionStudy/phase2/OHIM_study_report_en.pdf
European Observatory on Infringements of
Intellectual Property Rights
www.euipo.europa.eu 35
Table 6: Trade secret and patent use by innovating firms by industry, 2010-2012 NACE
DIVISION TS
USE PATENT
USE TS/
PATENT*
PATENT
INTENSITY**
NACE DESCRIPTION
B05-B09 56.6 % 41.0 % 1.38 34.48 Mining and quarrying C10 43.4 % 23.0 % 1.89 20.25 Manufacture of food products C11 51.6 % 30.0 % 1.72 7.97 Manufacture of beverages C12 57.4 % 30.3 % 1.89 71.86 Manufacture of tobacco products C13 46.0 % 28.6 % 1.61 43.34 Manufacture of textiles C14 34.3 % 14.3 % 2.39 7.93 Manufacture of wearing apparel C15 21.7 % 19.3 % 1.12 23.30 Manufacture of leather and related products
C16 42.8 % 30.5 % 1.40 13.76 Manufacture of wood and of products of wood and cork, except furniture; manufacture of articles of straw and plaiting materials
C17 47.5 % 25.5 % 1.87 69.83 Manufacture of paper and paper products C18 41.4 % 16.8 % 2.46 19.01 Printing and reproduction of recorded media C19 52.8 % 27.1 % 1.95 32.19 Manufacture of coke and refined petroleum products C20 64.0 % 43.8 % 1.46 506.77 Manufacture of chemicals and chemical products
C21 66.0 % 61.3 % 1.08 599.32 Manufacture of basic pharmaceutical products and pharmaceutical preparations
C22 54.7 % 36.3 % 1.51 213.20 Manufacture of rubber and plastic products C23 43.7 % 34.9 % 1.25 56.35 Manufacture of other non-metallic mineral products C24 54.2 % 30.1 % 1.80 80.15 Manufacture of basic metals
C25 48.5 % 29.3 % 1.66 105.69 Manufacture of fabricated metal products, except machinery and equipment
C26 76.9 % 57.4 % 1.34 890.65 Manufacture of computer, electronic and optical products C27 64.3 % 50.2 % 1.28 361.97 Manufacture of electrical equipment
C28 61.2 % 53.4 % 1.14 477.72 Manufacture of machinery and equipment not elsewhere classified
C29 73.8 % 56.8 % 1.30 317.53 Manufacture of motor vehicles, trailers and semi-trailers C30 53.6 % 41.4 % 1.29 395.01 Manufacture of other transport equipment C31 39.6 % 33.9 % 1.17 25.75 Manufacture of furniture C32 57.8 % 43.4 % 1.33 232.28 Other manufacturing C33 52.0 % 29.6 % 1.76 45.04 Repair and installation of machinery and equipment D35 41.2 % 14.9 % 2.76 17.56 Electricity, gas, steam and air conditioning supply E36 19.5 % 13.5 % 1.45 7.03 Water collection, treatment and supply E37-E39 39.2 % 19.4 % 2.03 9.69 Sewerage, waste management, remediation activities G46 43.9 % 25.6 % 1.72 44.78 Wholesale trade, except of motor vehicles and motorcycles H49 32.1 % 13.5 % 2.39 3.66 Land transport and transport via pipelines H50 33.1 % 14.7 % 2.25 6.93 Water transport H51 44.6 % 20.4 % 2.18 7.20 Air transport H52 30.8 % 10.3 % 2.97 10.43 Warehousing and support activities for transportation H53 38.7 % 14.2 % 2.72 2.74 Postal and courier activities J58 56.2 % 26.8 % 2.10 31.15 Publishing activities
J59 55.3 % 18.8 % 2.94 2.90 Motion picture, video and television programme production, sound recording and music publishing activities
J60 61.7 % 9.4 % 6.54 1.59 Programming and broadcasting activities J61 57.2 % 31.0 % 1.85 183.62 Telecommunications J62 68.2 % 22.5 % 3.03 29.65 Computer programming, consultancy and related activities J63 59.7 % 18.2 % 3.28 6.89 Information service activities
K64 40.8 % 9.8 % 4.15 7.87 Financial service activities, except insurance and pension funding
K65 42.5 % 10.8 % 3.94 12.04 Insurance, reinsurance and pension funding, except compulsory social security
K66 39.2 % 12.1 % 3.23 17.78 Activities auxiliary to financial services and insurance activities
M71 68.2 % 30.8 % 2.21 95.05 Architectural and engineering activities; technical testing and analysis
M72 79.3 % 65.3 % 1.21 954.24 Scientific research and development M73 58.3 % 21.5 % 2.71 9.94 Advertising and market research * Ratio (use of TS)/(use of Patent) per NACE division ** Intensity of EPO patents per 100 000 employees per NACE division Weighted results from AT, BE, BG, CY, DE, EE, EL, FI, HR, HU, IT, MT, NL, LT, LU, LV, PL, PT, RO, SE, SI and SK Source: Community Innovation Survey (CIS 2012)
European Observatory on Infringements of
Intellectual Property Rights
PROTECTING INNOVATION THROUGH TRADE SECRETS AND PATENTS:DETERMINANTS FOR EUROPEAN UNION FIRMS
www.euipo.europa.eu 36
Figure 4 shows the sectorial pattern of use of trade secrets and patents. The horizontal axis (x) represents the proportion of firms that use trade secrets and in the vertical axis (y) the proportion of firms using patents. As in Figures 1 and 2 above, the diagonal is the ‘same-use’ line, the point at which trade secrets and patents would be used equally. All sectors are below this line, indicating the greater frequency of trade secrets use. In the case of manufacturing (as well as mining and quarrying and other industries), the more innovative the sector the greater is the use of both patents and trade secrets, maintaining a ratio of approximately 1.5 in favour of trade secrets. In the case of services, the use of patents is quite flat around 20 %; the more innovative the sector the more it uses trade secrets, from a minimum of 30 % (land transport) up to nearly 70 % (computer programming). There is one important outlier: M72 ‘Scientific research and development’ is the sector with the highest use of both trade secrets and patents, exhibiting a ‘manufacturing’ profile. The two sectors with a minimum use of trade secrets and patents are E36 ‘Water collection, treatment and supply’ and C15 ‘Manufacture of leather and related product’. These patterns are consistent with previous studies19 on the use of trade secrets by economic sectors.
High use of both patent and trade secrets can also be observed in:
C26, Manufacture of computer, electronic and optical products
C29, Manufacture of motor vehicles, trailers and semi-trailers
C21, Manufacture of basic pharmaceutical products and pharmaceutical preparations
C27, Manufacture of electrical equipment
C28, Manufacture of machinery and equipment not elsewhere classified
C20, Manufacture of chemicals and chemical products.
Low use of both patent and trade secrets can also be observed in:
H52, Warehousing and support activities for transportation
H49, Land transport and transport via pipelines
H50, Water transport
C14, Manufacture of wearing apparel.
19 Morikawa (2014), Linton (2016), Cohen et al. (2000) and Levin et al. (1987)
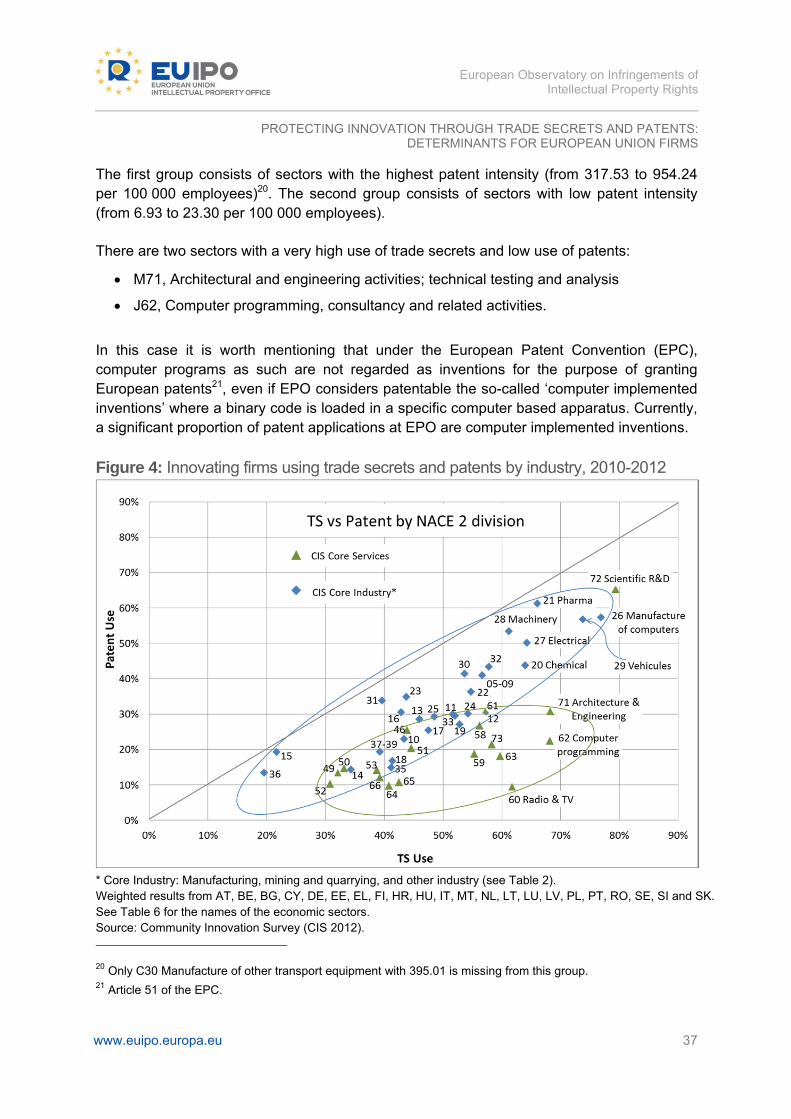
European Observatory on Infringements of
Intellectual Property Rights
PROTECTING INNOVATION THROUGH TRADE SECRETS AND PATENTS:DETERMINANTS FOR EUROPEAN UNION FIRMS
www.euipo.europa.eu 37
The first group consists of sectors with the highest patent intensity (from 317.53 to 954.24 per 100 000 employees)20. The second group consists of sectors with low patent intensity (from 6.93 to 23.30 per 100 000 employees).
There are two sectors with a very high use of trade secrets and low use of patents:
M71, Architectural and engineering activities; technical testing and analysis
J62, Computer programming, consultancy and related activities.
In this case it is worth mentioning that under the European Patent Convention (EPC), computer programs as such are not regarded as inventions for the purpose of granting European patents21, even if EPO considers patentable the so-called ‘computer implemented inventions’ where a binary code is loaded in a specific computer based apparatus. Currently, a significant proportion of patent applications at EPO are computer implemented inventions.
Figure 4: Innovating firms using trade secrets and patents by industry, 2010-2012
* Core Industry: Manufacturing, mining and quarrying, and other industry (see Table 2). Weighted results from AT, BE, BG, CY, DE, EE, EL, FI, HR, HU, IT, MT, NL, LT, LU, LV, PL, PT, RO, SE, SI and SK. See Table 6 for the names of the economic sectors. Source: Community Innovation Survey (CIS 2012).
20 Only C30 Manufacture of other transport equipment with 395.01 is missing from this group. 21 Article 51 of the EPC.
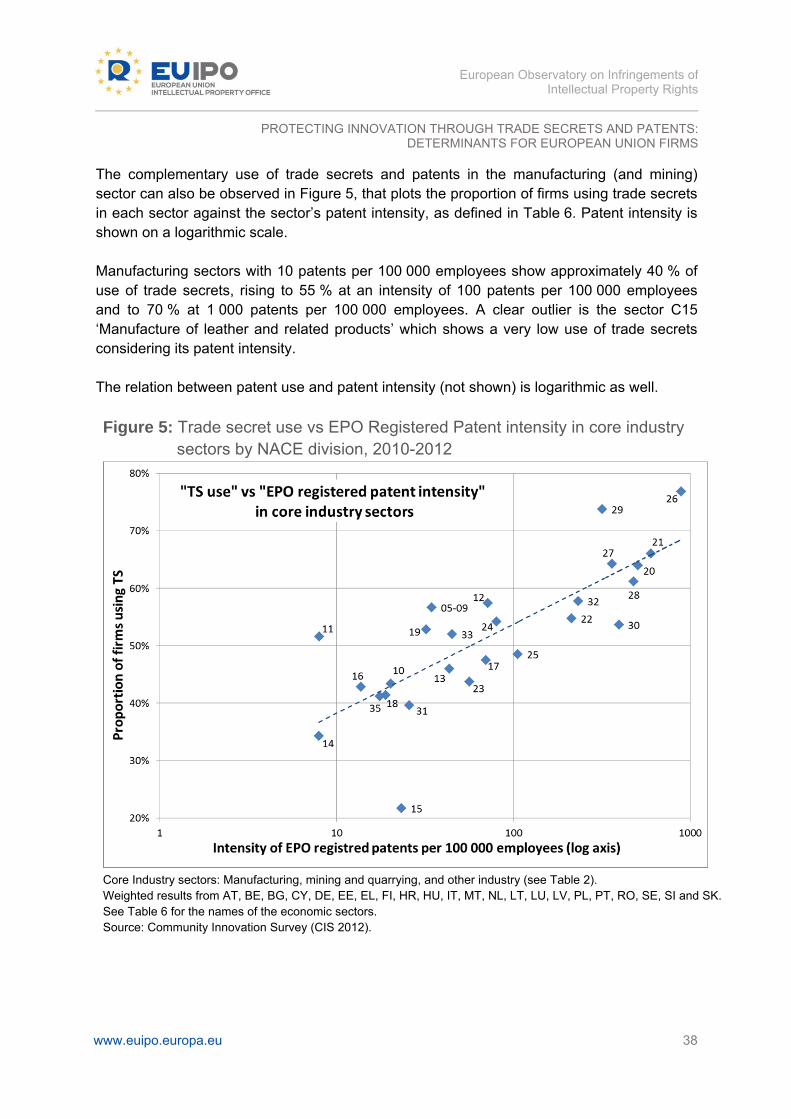
European Observatory on Infringements of
Intellectual Property Rights
PROTECTING INNOVATION THROUGH TRADE SECRETS AND PATENTS:DETERMINANTS FOR EUROPEAN UNION FIRMS
www.euipo.europa.eu 38
The complementary use of trade secrets and patents in the manufacturing (and mining) sector can also be observed in Figure 5, that plots the proportion of firms using trade secrets in each sector against the sector’s patent intensity, as defined in Table 6. Patent intensity is shown on a logarithmic scale. Manufacturing sectors with 10 patents per 100 000 employees show approximately 40 % of use of trade secrets, rising to 55 % at an intensity of 100 patents per 100 000 employees and to 70 % at 1 000 patents per 100 000 employees. A clear outlier is the sector C15 ‘Manufacture of leather and related products’ which shows a very low use of trade secrets considering its patent intensity. The relation between patent use and patent intensity (not shown) is logarithmic as well.
Figure 5: Trade secret use vs EPO Registered Patent intensity in core industry sectors by NACE division, 2010-2012
Core Industry sectors: Manufacturing, mining and quarrying, and other industry (see Table 2). Weighted results from AT, BE, BG, CY, DE, EE, EL, FI, HR, HU, IT, MT, NL, LT, LU, LV, PL, PT, RO, SE, SI and SK. See Table 6 for the names of the economic sectors. Source: Community Innovation Survey (CIS 2012).
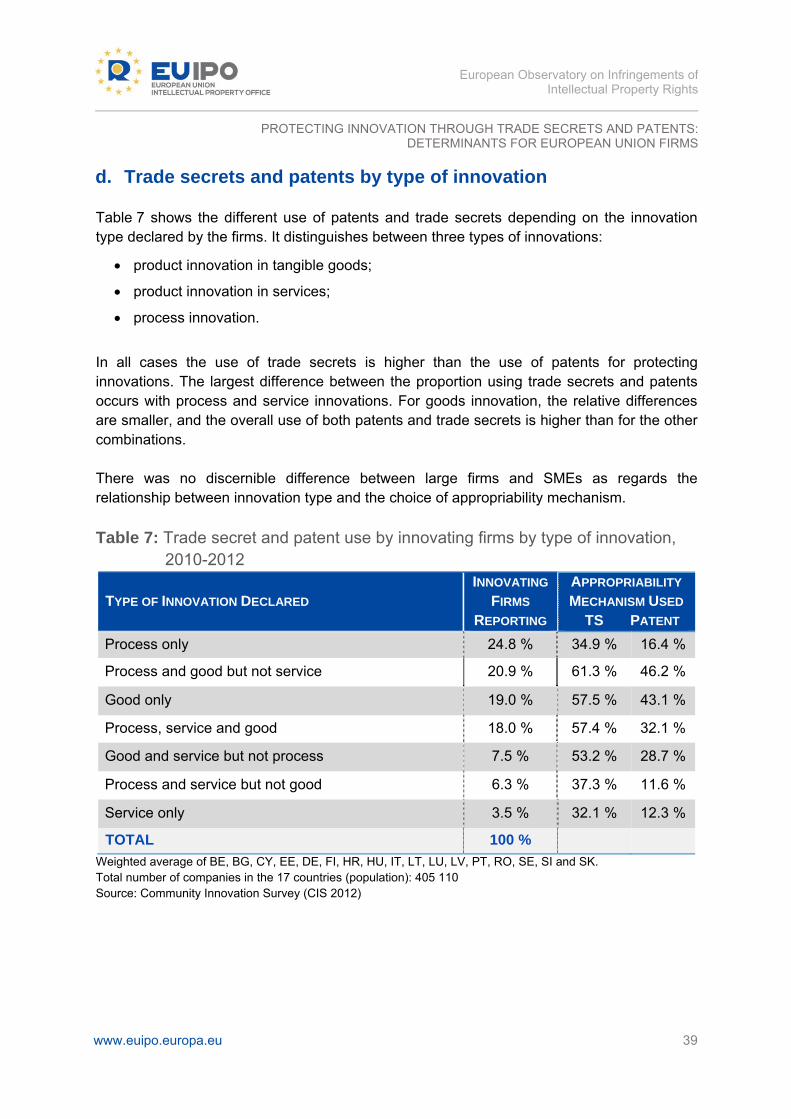
European Observatory on Infringements of
Intellectual Property Rights
PROTECTING INNOVATION THROUGH TRADE SECRETS AND PATENTS:DETERMINANTS FOR EUROPEAN UNION FIRMS
www.euipo.europa.eu 39
d. Trade secrets and patents by type of innovation
Table 7 shows the different use of patents and trade secrets depending on the innovation type declared by the firms. It distinguishes between three types of innovations:
product innovation in tangible goods;
product innovation in services;
process innovation.
In all cases the use of trade secrets is higher than the use of patents for protecting innovations. The largest difference between the proportion using trade secrets and patents occurs with process and service innovations. For goods innovation, the relative differences are smaller, and the overall use of both patents and trade secrets is higher than for the other combinations. There was no discernible difference between large firms and SMEs as regards the relationship between innovation type and the choice of appropriability mechanism.
Table 7: Trade secret and patent use by innovating firms by type of innovation, 2010-2012
TYPE OF INNOVATION DECLARED INNOVATING
FIRMS REPORTING
APPROPRIABILITY
MECHANISM USED TS PATENT
Process only 24.8 % 34.9 % 16.4 %
Process and good but not service 20.9 % 61.3 % 46.2 %
Good only 19.0 % 57.5 % 43.1 %
Process, service and good 18.0 % 57.4 % 32.1 %
Good and service but not process 7.5 % 53.2 % 28.7 %
Process and service but not good 6.3 % 37.3 % 11.6 %
Service only 3.5 % 32.1 % 12.3 %
TOTAL 100 %
Weighted average of BE, BG, CY, EE, DE, FI, HR, HU, IT, LT, LU, LV, PT, RO, SE, SI and SK. Total number of companies in the 17 countries (population): 405 110 Source: Community Innovation Survey (CIS 2012)
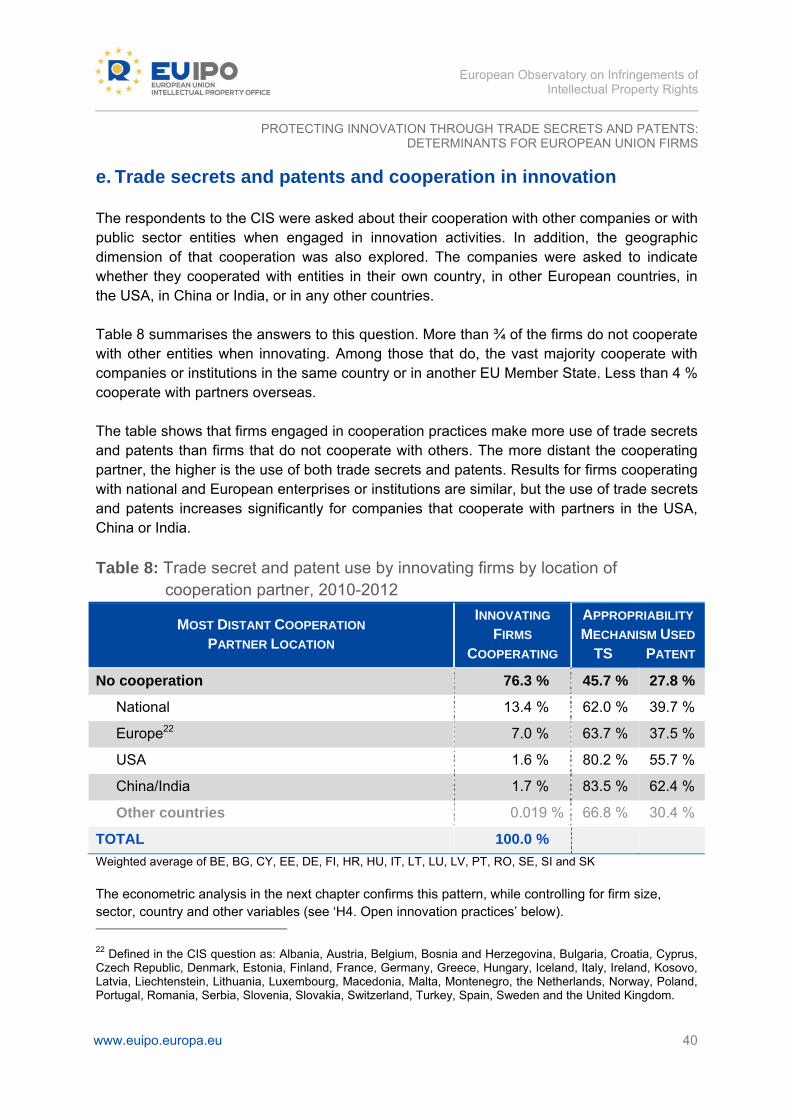
European Observatory on Infringements of
Intellectual Property Rights
PROTECTING INNOVATION THROUGH TRADE SECRETS AND PATENTS:DETERMINANTS FOR EUROPEAN UNION FIRMS
www.euipo.europa.eu 40
e. Trade secrets and patents and cooperation in innovation The respondents to the CIS were asked about their cooperation with other companies or with public sector entities when engaged in innovation activities. In addition, the geographic dimension of that cooperation was also explored. The companies were asked to indicate whether they cooperated with entities in their own country, in other European countries, in the USA, in China or India, or in any other countries. Table 8 summarises the answers to this question. More than ¾ of the firms do not cooperate with other entities when innovating. Among those that do, the vast majority cooperate with companies or institutions in the same country or in another EU Member State. Less than 4 % cooperate with partners overseas. The table shows that firms engaged in cooperation practices make more use of trade secrets and patents than firms that do not cooperate with others. The more distant the cooperating partner, the higher is the use of both trade secrets and patents. Results for firms cooperating with national and European enterprises or institutions are similar, but the use of trade secrets and patents increases significantly for companies that cooperate with partners in the USA, China or India.
Table 8: Trade secret and patent use by innovating firms by location of cooperation partner, 2010-2012
MOST DISTANT COOPERATION PARTNER LOCATION
INNOVATING
FIRMS COOPERATING
APPROPRIABILITY
MECHANISM USED TS PATENT
No cooperation 76.3 % 45.7 % 27.8 %
National 13.4 % 62.0 % 39.7 %
Europe22 7.0 % 63.7 % 37.5 %
USA 1.6 % 80.2 % 55.7 %
China/India 1.7 % 83.5 % 62.4 %
Other countries 0.019 % 66.8 % 30.4 %
TOTAL 100.0 %
Weighted average of BE, BG, CY, EE, DE, FI, HR, HU, IT, LT, LU, LV, PT, RO, SE, SI and SK
The econometric analysis in the next chapter confirms this pattern, while controlling for firm size, sector, country and other variables (see ‘H4. Open innovation practices’ below).
22 Defined in the CIS question as: Albania, Austria, Belgium, Bosnia and Herzegovina, Bulgaria, Croatia, Cyprus, Czech Republic, Denmark, Estonia, Finland, France, Germany, Greece, Hungary, Iceland, Italy, Ireland, Kosovo, Latvia, Liechtenstein, Lithuania, Luxembourg, Macedonia, Malta, Montenegro, the Netherlands, Norway, Poland, Portugal, Romania, Serbia, Slovenia, Slovakia, Switzerland, Turkey, Spain, Sweden and the United Kingdom.
European Observatory on Infringements of
Intellectual Property Rights
PROTECTING INNOVATION THROUGH TRADE SECRETS AND PATENTS:DETERMINANTS FOR EUROPEAN UNION FIRMS
www.euipo.europa.eu 41
5. Econometric analysis
This section presents the results of the econometric analysis designed to test the hypotheses outlined in Section 2 above. Following the introduction to the models and variables used in sub-sections (a) and (b), the key results are presented and interpreted in sub-section (c).
a. Models Following Hall et al. (2013), the empirical models tested aim to uncover the determinants of using patenting and/or secrecy to protect a firm’s innovations. The basic model relates a firm’s decision to use patents or trade secrets as a protection method (pm) to a set of variables that are intended to represent the five hypotheses discussed above (degree of innovation competition in_comi, level of innovation in_levi, type of innovation in_typi, open innovation practices in_opi and financial constraints fi_coni):
pmi = + 1·in_comi + 2·in_levi + 3·in_typi + 4·in_opi + 5·fi_coni + ·Xi + i [1]
where pmi represents the use of patents and trade secrets by firm i. Depending on the hypothesis being tested, this variable is operationalised in different ways. The main model variants employ binary measures (use of patents, use of trade secrets). Another model variant employs the four combinations of using patents and trade secrets (none, both, only patenting, only secrecy). In a third model variant, the structure of Arundel (2001) and Hall et al. (2013) is followed by using a measure of the relative importance of trade secrets over patents. This measure gives the difference between the use of trade secrets and the use of patents and can hence take on the values of +1 (only trade secrets used), 0 (both trade secrets and patent used) and -1 (patent use only). The vector X includes control variables such as the size of the firm as well as the industry and the country in which a firm operates. In line with Hall et al. (2013), all models are restricted to innovating firms. These are firms which have introduced a product or a process innovation in the last three years. This restriction ensures that only firms that have had to decide whether and how to protect recently introduced innovations are included in the analysis.
European Observatory on Infringements of
Intellectual Property Rights
PROTECTING INNOVATION THROUGH TRADE SECRETS AND PATENTS:DETERMINANTS FOR EUROPEAN UNION FIRMS
www.euipo.europa.eu 42
b. Variables
In order to test the five hypotheses discussed, the following variables were used in the protection method decision model:
Degree of innovation competition (H1): Two dummy variables are used to capture the perception that a ‘strong competition on product quality, reputation or brand’ and ‘strong price competition’ were factors that jeopardised meeting the firm’s goals. The first variable is a proxy for a high degree of innovation competition whereas the second represents strong price competition.
Level of innovation (H2): Following Hall et al. (2013), new-to-the-market innovations are distinguished from innovations that are new only to the firm. In addition, information on the extent of a firm’s innovation activities (innovation expenditure per employee) and the existence of internal R&D is used to control for the extent of new knowledge generated by the firm’s innovative activities. Innovation expenditure includes in-house and external R&D, acquisition of machinery, equipment, software and buildings, acquisition of existing external knowledge and other activities related to innovation, such as design, training or marketing.
Type of innovation (H3): As suggested by the theoretical literature23, product and process innovation are distinguished. Since service innovations are virtually excluded from patent protection under European patent law, a further differentiation is made between product innovation for manufactured goods and product innovation for services.
Open innovation practice (H4): A variable that indicates whether a firm engages in innovation cooperation with external business partners (clients, suppliers, competitors) is introduced. The variable is categorical and represents the region of the entities with which the firm cooperates, as defined on page 40. The base of the categorical variable is ‘no cooperation’.
Financial constraints (H5): One dummy variable was used to capture the perception that a ‘lack of adequate finance’ was a factor that jeopardised meeting the firm’s goals.
In addition, all models include size (as measured by the log of the number employees), country categorical variables, sector categorical variables (NACE) (or sometimes a ‘services’ dummy variable) and the dummy variables ‘export activities’, ‘part of a group’, ‘lack of adequate personnel’ and ‘public funding’ as further controls24.
23 Biswas and McHardy (2012) and Hall and Harhoff (2012) 24 The Stata code for the various regressions is available on request.
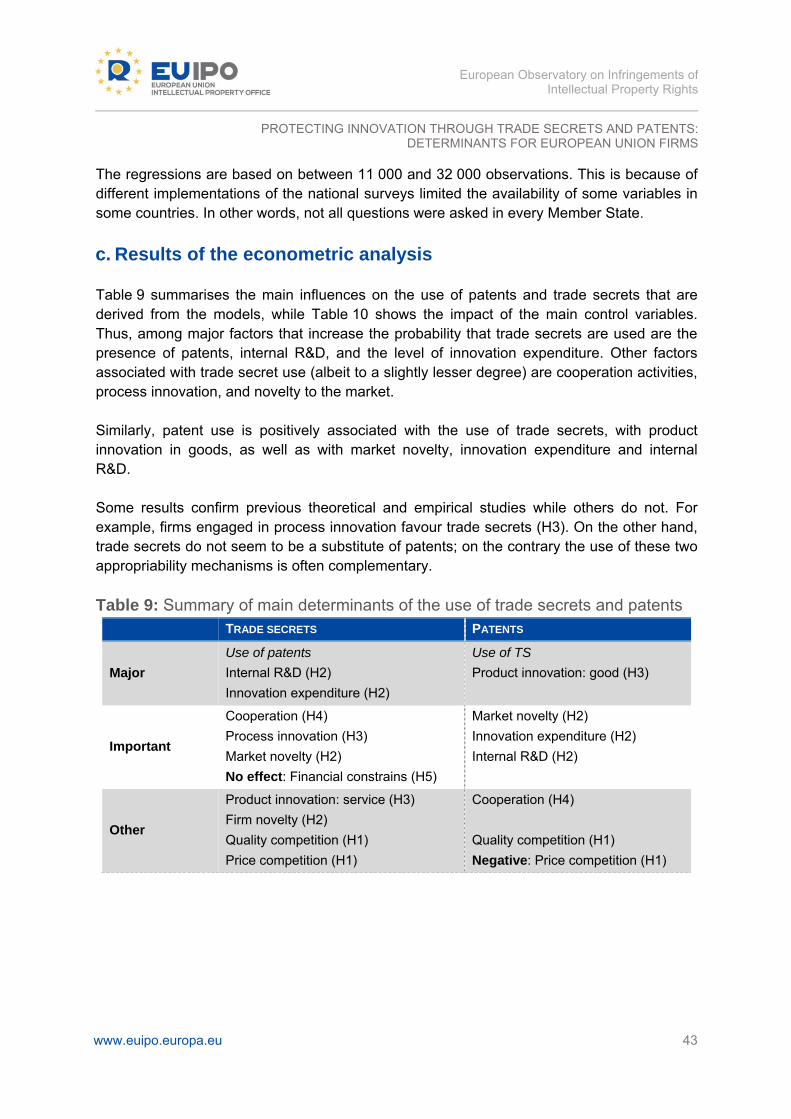
European Observatory on Infringements of
Intellectual Property Rights
PROTECTING INNOVATION THROUGH TRADE SECRETS AND PATENTS:DETERMINANTS FOR EUROPEAN UNION FIRMS
www.euipo.europa.eu 43
The regressions are based on between 11 000 and 32 000 observations. This is because of different implementations of the national surveys limited the availability of some variables in some countries. In other words, not all questions were asked in every Member State.
c. Results of the econometric analysis
Table 9 summarises the main influences on the use of patents and trade secrets that are derived from the models, while Table 10 shows the impact of the main control variables. Thus, among major factors that increase the probability that trade secrets are used are the presence of patents, internal R&D, and the level of innovation expenditure. Other factors associated with trade secret use (albeit to a slightly lesser degree) are cooperation activities, process innovation, and novelty to the market. Similarly, patent use is positively associated with the use of trade secrets, with product innovation in goods, as well as with market novelty, innovation expenditure and internal R&D. Some results confirm previous theoretical and empirical studies while others do not. For example, firms engaged in process innovation favour trade secrets (H3). On the other hand, trade secrets do not seem to be a substitute of patents; on the contrary the use of these two appropriability mechanisms is often complementary.
Table 9: Summary of main determinants of the use of trade secrets and patents TRADE SECRETS PATENTS
Major
Use of patents
Internal R&D (H2)
Innovation expenditure (H2)
Use of TS
Product innovation: good (H3)
Important
Cooperation (H4)
Process innovation (H3)
Market novelty (H2)
No effect: Financial constrains (H5)
Market novelty (H2)
Innovation expenditure (H2)
Internal R&D (H2)
Other
Product innovation: service (H3)
Firm novelty (H2)
Quality competition (H1)
Price competition (H1)
Cooperation (H4)
Quality competition (H1)
Negative: Price competition (H1)
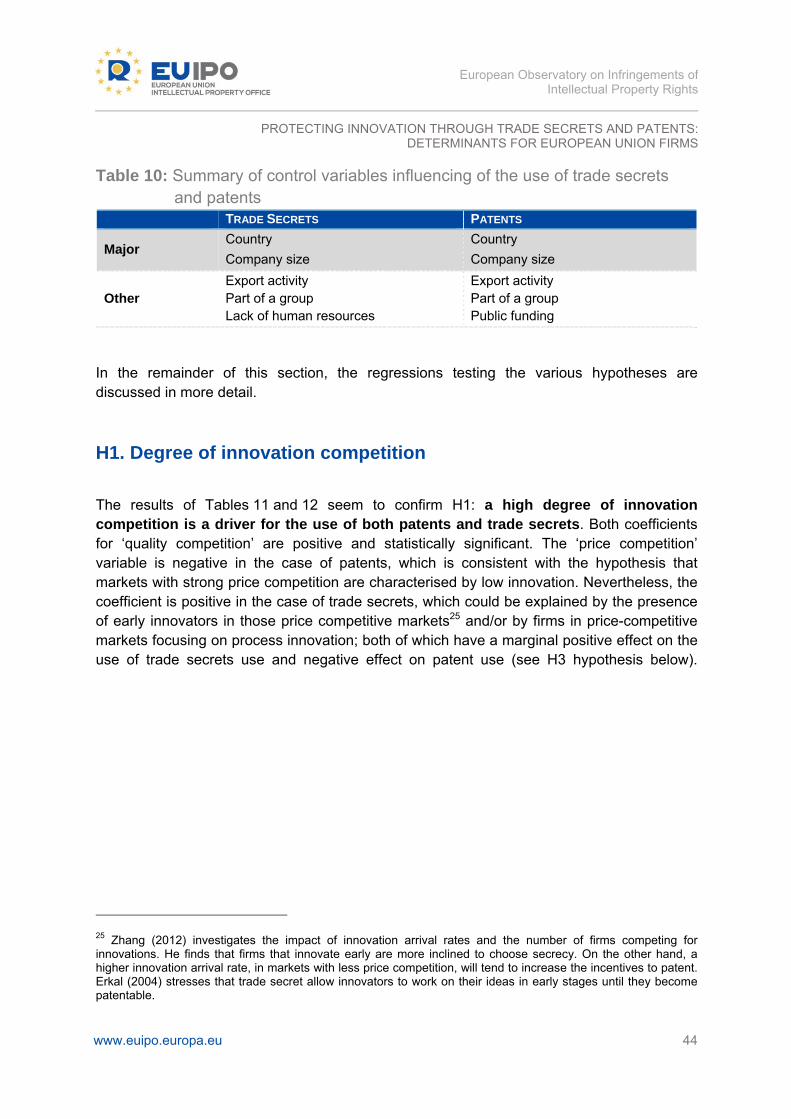
European Observatory on Infringements of
Intellectual Property Rights
PROTECTING INNOVATION THROUGH TRADE SECRETS AND PATENTS:DETERMINANTS FOR EUROPEAN UNION FIRMS
www.euipo.europa.eu 44
Table 10: Summary of control variables influencing of the use of trade secrets and patents
TRADE SECRETS PATENTS
Major Country
Company size
Country
Company size
Other Export activity Part of a group Lack of human resources
Export activity Part of a group Public funding
In the remainder of this section, the regressions testing the various hypotheses are discussed in more detail.
H1. Degree of innovation competition
The results of Tables 11 and 12 seem to confirm H1: a high degree of innovation competition is a driver for the use of both patents and trade secrets. Both coefficients for ‘quality competition’ are positive and statistically significant. The ‘price competition’ variable is negative in the case of patents, which is consistent with the hypothesis that markets with strong price competition are characterised by low innovation. Nevertheless, the coefficient is positive in the case of trade secrets, which could be explained by the presence of early innovators in those price competitive markets25 and/or by firms in price-competitive markets focusing on process innovation; both of which have a marginal positive effect on the use of trade secrets use and negative effect on patent use (see H3 hypothesis below).
25 Zhang (2012) investigates the impact of innovation arrival rates and the number of firms competing for innovations. He finds that firms that innovate early are more inclined to choose secrecy. On the other hand, a higher innovation arrival rate, in markets with less price competition, will tend to increase the incentives to patent. Erkal (2004) stresses that trade secret allow innovators to work on their ideas in early stages until they become patentable.
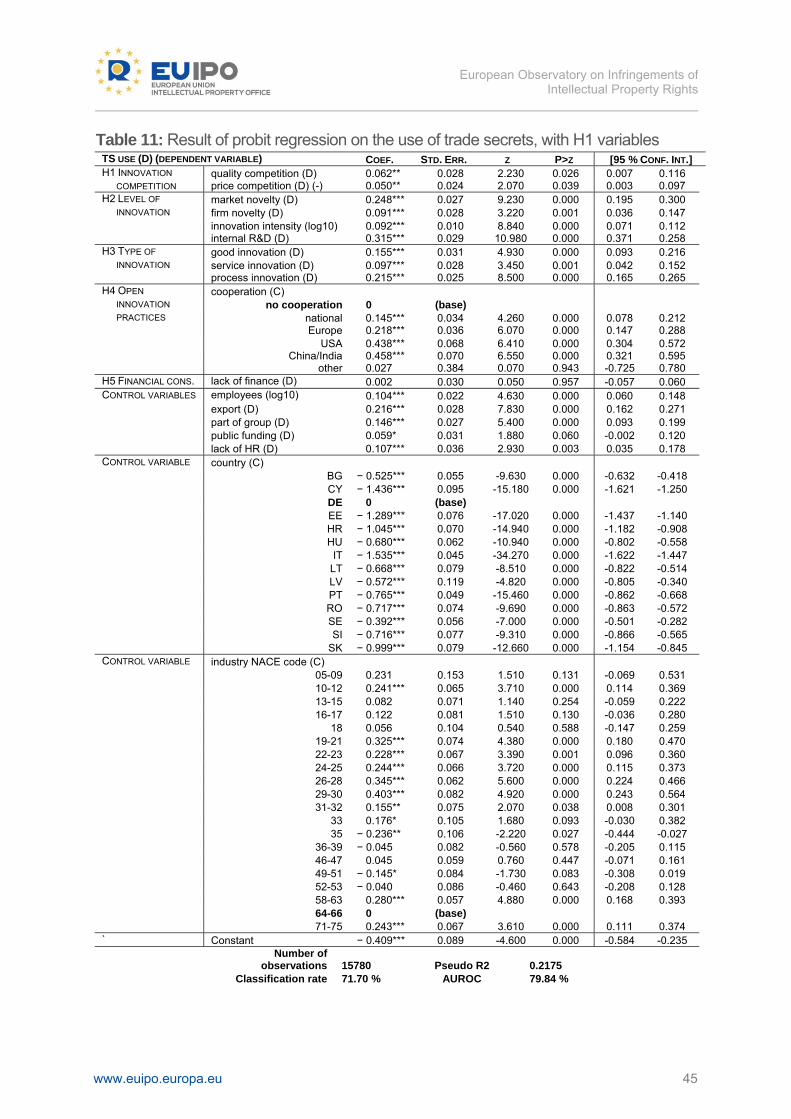
European Observatory on Infringements of
Intellectual Property Rights
www.euipo.europa.eu 45
Table 11: Result of probit regression on the use of trade secrets, with H1 variables TS USE (D) (DEPENDENT VARIABLE) COEF. STD. ERR. Z P>Z [95 % CONF. INT.] H1 INNOVATION quality competition (D) 0.062** 0.028 2.230 0.026 0.007 0.116 COMPETITION price competition (D) (-) 0.050** 0.024 2.070 0.039 0.003 0.097 H2 LEVEL OF market novelty (D) 0.248*** 0.027 9.230 0.000 0.195 0.300 INNOVATION firm novelty (D) 0.091*** 0.028 3.220 0.001 0.036 0.147 innovation intensity (log10) 0.092*** 0.010 8.840 0.000 0.071 0.112 internal R&D (D) 0.315*** 0.029 10.980 0.000 0.371 0.258 H3 TYPE OF good innovation (D) 0.155*** 0.031 4.930 0.000 0.093 0.216 INNOVATION service innovation (D) 0.097*** 0.028 3.450 0.001 0.042 0.152 process innovation (D) 0.215*** 0.025 8.500 0.000 0.165 0.265 H4 OPEN cooperation (C) INNOVATION no cooperation 0 (base) PRACTICES national 0.145*** 0.034 4.260 0.000 0.078 0.212 Europe 0.218*** 0.036 6.070 0.000 0.147 0.288 USA 0.438*** 0.068 6.410 0.000 0.304 0.572 China/India 0.458*** 0.070 6.550 0.000 0.321 0.595 other 0.027 0.384 0.070 0.943 -0.725 0.780 H5 FINANCIAL CONS. lack of finance (D) 0.002 0.030 0.050 0.957 -0.057 0.060 CONTROL VARIABLES employees (log10) 0.104*** 0.022 4.630 0.000 0.060 0.148 export (D) 0.216*** 0.028 7.830 0.000 0.162 0.271 part of group (D) 0.146*** 0.027 5.400 0.000 0.093 0.199 public funding (D) 0.059* 0.031 1.880 0.060 -0.002 0.120 lack of HR (D) 0.107*** 0.036 2.930 0.003 0.035 0.178 CONTROL VARIABLE country (C) BG − 0.525*** 0.055 -9.630 0.000 -0.632 -0.418 CY − 1.436*** 0.095 -15.180 0.000 -1.621 -1.250 DE 0 (base) EE − 1.289*** 0.076 -17.020 0.000 -1.437 -1.140 HR − 1.045*** 0.070 -14.940 0.000 -1.182 -0.908 HU − 0.680*** 0.062 -10.940 0.000 -0.802 -0.558 IT − 1.535*** 0.045 -34.270 0.000 -1.622 -1.447 LT − 0.668*** 0.079 -8.510 0.000 -0.822 -0.514 LV − 0.572*** 0.119 -4.820 0.000 -0.805 -0.340 PT − 0.765*** 0.049 -15.460 0.000 -0.862 -0.668 RO − 0.717*** 0.074 -9.690 0.000 -0.863 -0.572 SE − 0.392*** 0.056 -7.000 0.000 -0.501 -0.282 SI − 0.716*** 0.077 -9.310 0.000 -0.866 -0.565 SK − 0.999*** 0.079 -12.660 0.000 -1.154 -0.845 CONTROL VARIABLE industry NACE code (C) 05-09 0.231 0.153 1.510 0.131 -0.069 0.531 10-12 0.241*** 0.065 3.710 0.000 0.114 0.369 13-15 0.082 0.071 1.140 0.254 -0.059 0.222 16-17 0.122 0.081 1.510 0.130 -0.036 0.280 18 0.056 0.104 0.540 0.588 -0.147 0.259 19-21 0.325*** 0.074 4.380 0.000 0.180 0.470 22-23 0.228*** 0.067 3.390 0.001 0.096 0.360 24-25 0.244*** 0.066 3.720 0.000 0.115 0.373 26-28 0.345*** 0.062 5.600 0.000 0.224 0.466 29-30 0.403*** 0.082 4.920 0.000 0.243 0.564 31-32 0.155** 0.075 2.070 0.038 0.008 0.301 33 0.176* 0.105 1.680 0.093 -0.030 0.382 35 − 0.236** 0.106 -2.220 0.027 -0.444 -0.027 36-39 − 0.045 0.082 -0.560 0.578 -0.205 0.115 46-47 0.045 0.059 0.760 0.447 -0.071 0.161 49-51 − 0.145* 0.084 -1.730 0.083 -0.308 0.019 52-53 − 0.040 0.086 -0.460 0.643 -0.208 0.128 58-63 0.280*** 0.057 4.880 0.000 0.168 0.393 64-66 0 (base) 71-75 0.243*** 0.067 3.610 0.000 0.111 0.374 ` Constant − 0.409*** 0.089 -4.600 0.000 -0.584 -0.235 Number of
observations 15780 Pseudo R2 0.2175
Classification rate 71.70 % AUROC 79.84 %
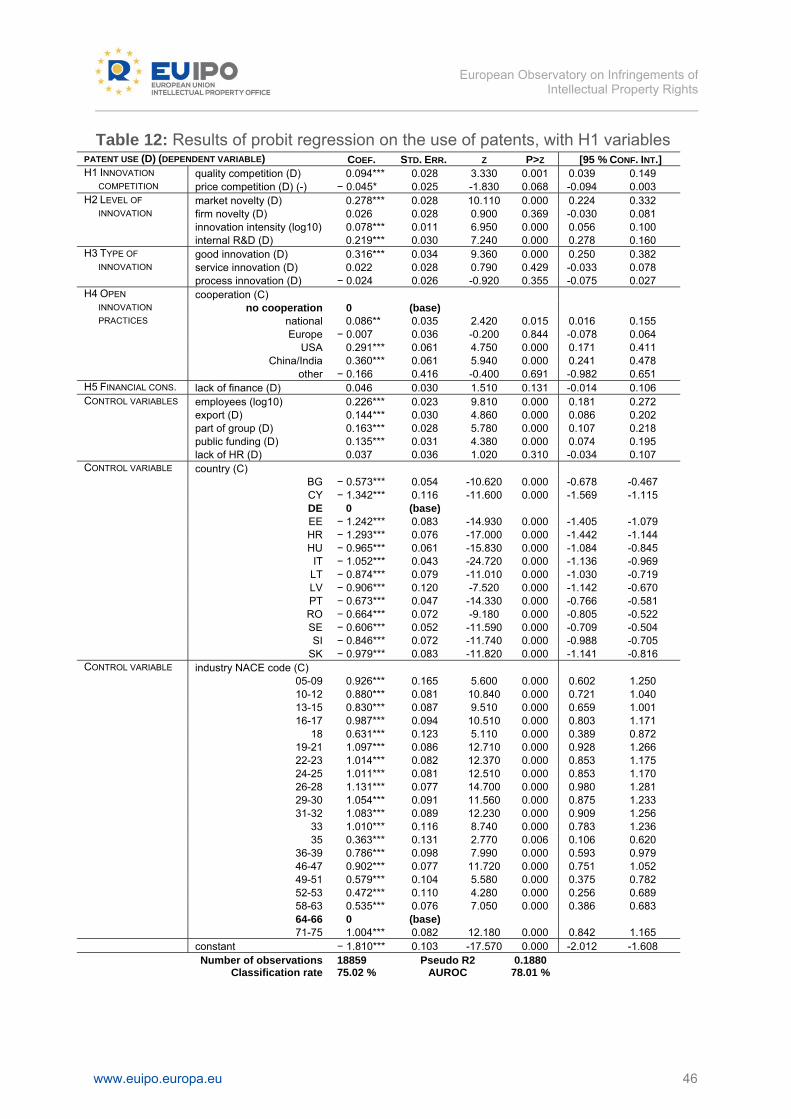
European Observatory on Infringements of
Intellectual Property Rights
www.euipo.europa.eu 46
Table 12: Results of probit regression on the use of patents, with H1 variables PATENT USE (D) (DEPENDENT VARIABLE) COEF. STD. ERR. Z P>Z [95 % CONF. INT.] H1 INNOVATION quality competition (D) 0.094*** 0.028 3.330 0.001 0.039 0.149 COMPETITION price competition (D) (-) − 0.045* 0.025 -1.830 0.068 -0.094 0.003 H2 LEVEL OF market novelty (D) 0.278*** 0.028 10.110 0.000 0.224 0.332 INNOVATION firm novelty (D) 0.026 0.028 0.900 0.369 -0.030 0.081 innovation intensity (log10) 0.078*** 0.011 6.950 0.000 0.056 0.100 internal R&D (D) 0.219*** 0.030 7.240 0.000 0.278 0.160 H3 TYPE OF good innovation (D) 0.316*** 0.034 9.360 0.000 0.250 0.382 INNOVATION service innovation (D) 0.022 0.028 0.790 0.429 -0.033 0.078 process innovation (D) − 0.024 0.026 -0.920 0.355 -0.075 0.027 H4 OPEN cooperation (C) INNOVATION no cooperation 0 (base) PRACTICES national 0.086** 0.035 2.420 0.015 0.016 0.155 Europe − 0.007 0.036 -0.200 0.844 -0.078 0.064 USA 0.291*** 0.061 4.750 0.000 0.171 0.411 China/India 0.360*** 0.061 5.940 0.000 0.241 0.478 other − 0.166 0.416 -0.400 0.691 -0.982 0.651 H5 FINANCIAL CONS. lack of finance (D) 0.046 0.030 1.510 0.131 -0.014 0.106 CONTROL VARIABLES employees (log10) 0.226*** 0.023 9.810 0.000 0.181 0.272 export (D) 0.144*** 0.030 4.860 0.000 0.086 0.202 part of group (D) 0.163*** 0.028 5.780 0.000 0.107 0.218 public funding (D) 0.135*** 0.031 4.380 0.000 0.074 0.195 lack of HR (D) 0.037 0.036 1.020 0.310 -0.034 0.107 CONTROL VARIABLE country (C) BG − 0.573*** 0.054 -10.620 0.000 -0.678 -0.467 CY − 1.342*** 0.116 -11.600 0.000 -1.569 -1.115 DE 0 (base) EE − 1.242*** 0.083 -14.930 0.000 -1.405 -1.079 HR − 1.293*** 0.076 -17.000 0.000 -1.442 -1.144 HU − 0.965*** 0.061 -15.830 0.000 -1.084 -0.845 IT − 1.052*** 0.043 -24.720 0.000 -1.136 -0.969 LT − 0.874*** 0.079 -11.010 0.000 -1.030 -0.719 LV − 0.906*** 0.120 -7.520 0.000 -1.142 -0.670 PT − 0.673*** 0.047 -14.330 0.000 -0.766 -0.581 RO − 0.664*** 0.072 -9.180 0.000 -0.805 -0.522 SE − 0.606*** 0.052 -11.590 0.000 -0.709 -0.504 SI − 0.846*** 0.072 -11.740 0.000 -0.988 -0.705 SK − 0.979*** 0.083 -11.820 0.000 -1.141 -0.816 CONTROL VARIABLE industry NACE code (C) 05-09 0.926*** 0.165 5.600 0.000 0.602 1.250 10-12 0.880*** 0.081 10.840 0.000 0.721 1.040 13-15 0.830*** 0.087 9.510 0.000 0.659 1.001 16-17 0.987*** 0.094 10.510 0.000 0.803 1.171 18 0.631*** 0.123 5.110 0.000 0.389 0.872 19-21 1.097*** 0.086 12.710 0.000 0.928 1.266 22-23 1.014*** 0.082 12.370 0.000 0.853 1.175 24-25 1.011*** 0.081 12.510 0.000 0.853 1.170 26-28 1.131*** 0.077 14.700 0.000 0.980 1.281 29-30 1.054*** 0.091 11.560 0.000 0.875 1.233 31-32 1.083*** 0.089 12.230 0.000 0.909 1.256 33 1.010*** 0.116 8.740 0.000 0.783 1.236 35 0.363*** 0.131 2.770 0.006 0.106 0.620 36-39 0.786*** 0.098 7.990 0.000 0.593 0.979 46-47 0.902*** 0.077 11.720 0.000 0.751 1.052 49-51 0.579*** 0.104 5.580 0.000 0.375 0.782 52-53 0.472*** 0.110 4.280 0.000 0.256 0.689 58-63 0.535*** 0.076 7.050 0.000 0.386 0.683 64-66 0 (base) 71-75 1.004*** 0.082 12.180 0.000 0.842 1.165 constant − 1.810*** 0.103 -17.570 0.000 -2.012 -1.608 Number of observations 18859 Pseudo R2 0.1880 Classification rate 75.02 % AUROC 78.01 %
European Observatory on Infringements of
Intellectual Property Rights
PROTECTING INNOVATION THROUGH TRADE SECRETS AND PATENTS:DETERMINANTS FOR EUROPEAN UNION FIRMS
www.euipo.europa.eu 47
H2. Level of innovation
Tables 13 and 14 show regressions that exclude the H1 variables (price and quality competition) and variable H5 (financial constraints) in order to be able to include observations from BE, FI and LU where the corresponding CIS questions were not answered. Patent Use is included as an independent variable for propensity of Trade Secrets Use, and similarly Trade Secrets Use is included as independent variable for propensity of Patent Use in order to capture the degree of their complementarity26. The tables do not show the coefficients, but rather the marginal effects at the mean values. Therefore, the results can be used with certain precautions to assess marginal effects. As predicted by Amemiya, T. (1981), the conditional marginal effects in the probit models in this study are given by:
0.4 [2]
This relation makes it possible to compare the values in Tables 11, 12 and 16 (probit coefficients) with the conditional marginal effects shown in the probit results of Tables 13, 14 and 1527. In nonlinear models, marginal effects are more informative than the ‘raw’ coefficients. The results confirm the H2 hypothesis: the level of innovation influences the use of trade secrets and patents. The regressions conducted show that both trade secrets and patents are used for market innovations but only trade secrets are used for new-to-the-firm innovations. This is further confirmed by the regression reported in Table 16. Of course, this is not surprising given that an innovation that is already in use by other firms in the market is unlikely to be patentable. In terms of the size of the effect, the introduction of a new-to-market innovation has a similar marginal effect on the use of trade secrets and patents, while the introduction of new-to-the-firm innovations increases only the propensity to use trade secrets, but to a lesser extent than the introduction of a new-to-market innovation. Innovation intensity, as measured by expenditure per employee, has a positive effect on the propensity to use both trade secrets and patents, with a higher effect in the case of trade secrets. Firms engaged in internal R&D (as indicated by the corresponding dummy variable) have a higher propensity to use patents and trade secrets; the effect is larger in the case of trade secrets.
26 The inclusion of these complementary variables can create endogeneity . Nevertheless, the models that include the common use variable (Tables 13 and 14) and the models without this potentially endogenous variable (Table 11 and 12) produce similar conclusions and help to test complementarity. 27 The relation for the three values’ ordered probit model was 0.14 instead of 0.4
European Observatory on Infringements of
Intellectual Property Rights
PROTECTING INNOVATION THROUGH TRADE SECRETS AND PATENTS:DETERMINANTS FOR EUROPEAN UNION FIRMS
www.euipo.europa.eu 48
H3. Type of innovation
The results of the regressions shown in Tables 13 and 14 support hypothesis H3: the type of innovation impacts the preference between trade secrets and patents. This is also consistent with the majority of previous studies. Process innovation has a strong marginal positive effect on the propensity to use trade secrets and a negative effect on the use of patents. The same, to a lesser extent, is true for product innovation in services. With product innovation in goods there is a positive effect on the propensity to use both patents and trade secrets. The hypothesis is further supported by the regression reported in Table 15 where the dependent variable is the preference of patents over trade secrets (so that exclusive patent use gives a value of 1, exclusive trade secret use corresponds to -1, and use of both yields a value of 0). In the case of innovation in goods, patents are preferred to trade secrets (positive sign of the marginal effect) while the opposite is true in case of innovations in services and processes (negative sign). The preference for patents over trade secrets when introducing an innovative good does not detract from the complementarity of the use of both trade secrets and patents. In general, trade secrets rather than patents are used for protecting innovative service products and processes. Table 16 also confirms the hypothesis. This table reports the results for the four combinations of using trade secrets and patenting. In particular, this model analyses the firm’s choice to use both protection methods simultaneously, or to rely only on one of them (or none). In the case of innovation in goods, the coefficient is positive for ‘patent only use’ and ‘both’ with a negative coefficient for trade secrets. Thus, trade secrets are used for protecting this type of innovation but in combination with patents. On the other hand, service innovations tend to be protected with ‘only trade secrets’, with the coefficients of ‘both’ and ‘only patent’ negative. In the case of process innovation processes there is a positive coefficient for protecting with ‘only trade secrets’ and a negative for ‘none’, indicating that innovative processes tend to be protected with trade secrets only. The coefficients for ‘patents only’ and for ‘both’ are not significantly different from zero in this case.
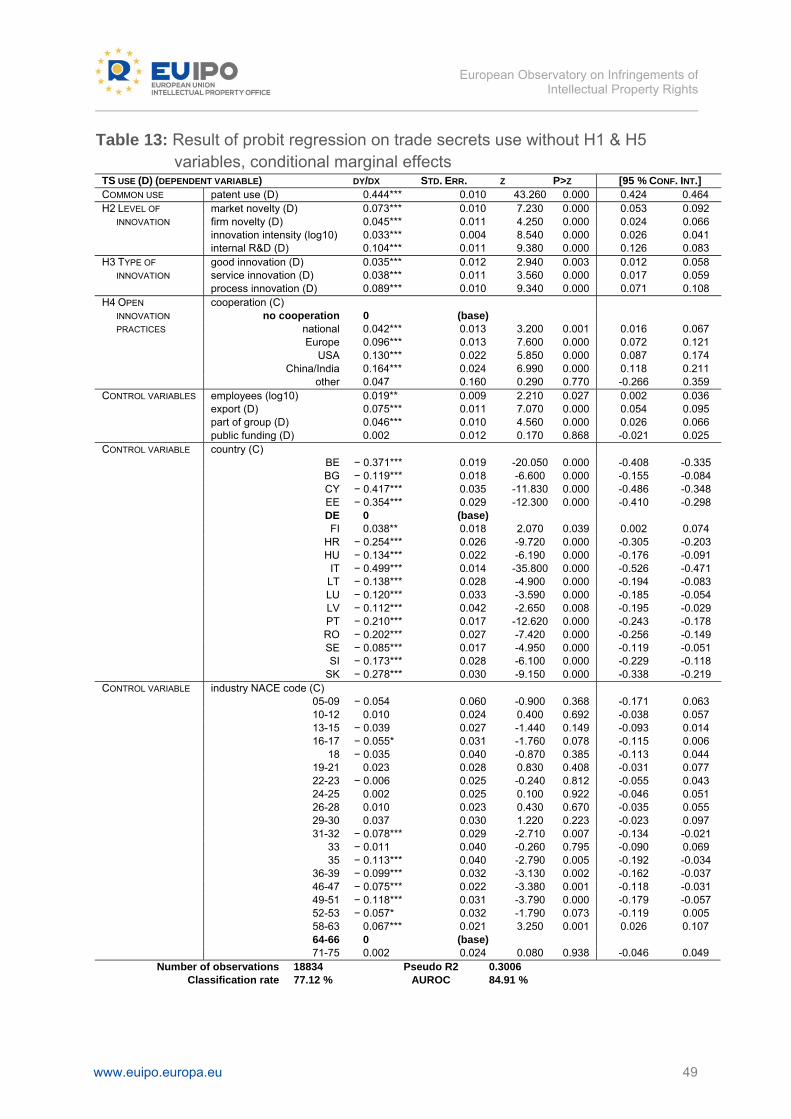
European Observatory on Infringements of
Intellectual Property Rights
www.euipo.europa.eu 49
Table 13: Result of probit regression on trade secrets use without H1 & H5 variables, conditional marginal effects
TS USE (D) (DEPENDENT VARIABLE) DY/DX STD. ERR. Z P>Z [95 % CONF. INT.] COMMON USE patent use (D) 0.444*** 0.010 43.260 0.000 0.424 0.464 H2 LEVEL OF market novelty (D) 0.073*** 0.010 7.230 0.000 0.053 0.092 INNOVATION firm novelty (D) 0.045*** 0.011 4.250 0.000 0.024 0.066 innovation intensity (log10) 0.033*** 0.004 8.540 0.000 0.026 0.041 internal R&D (D) 0.104*** 0.011 9.380 0.000 0.126 0.083 H3 TYPE OF good innovation (D) 0.035*** 0.012 2.940 0.003 0.012 0.058 INNOVATION service innovation (D) 0.038*** 0.011 3.560 0.000 0.017 0.059 process innovation (D) 0.089*** 0.010 9.340 0.000 0.071 0.108 H4 OPEN cooperation (C) INNOVATION no cooperation 0 (base) PRACTICES national 0.042*** 0.013 3.200 0.001 0.016 0.067
Europe 0.096*** 0.013 7.600 0.000 0.072 0.121 USA 0.130*** 0.022 5.850 0.000 0.087 0.174 China/India 0.164*** 0.024 6.990 0.000 0.118 0.211 other 0.047 0.160 0.290 0.770 -0.266 0.359
CONTROL VARIABLES employees (log10) 0.019** 0.009 2.210 0.027 0.002 0.036 export (D) 0.075*** 0.011 7.070 0.000 0.054 0.095 part of group (D) 0.046*** 0.010 4.560 0.000 0.026 0.066 public funding (D) 0.002 0.012 0.170 0.868 -0.021 0.025 CONTROL VARIABLE country (C)
BE − 0.371*** 0.019 -20.050 0.000 -0.408 -0.335 BG − 0.119*** 0.018 -6.600 0.000 -0.155 -0.084 CY − 0.417*** 0.035 -11.830 0.000 -0.486 -0.348 EE − 0.354*** 0.029 -12.300 0.000 -0.410 -0.298 DE 0 (base) FI 0.038** 0.018 2.070 0.039 0.002 0.074 HR − 0.254*** 0.026 -9.720 0.000 -0.305 -0.203 HU − 0.134*** 0.022 -6.190 0.000 -0.176 -0.091 IT − 0.499*** 0.014 -35.800 0.000 -0.526 -0.471 LT − 0.138*** 0.028 -4.900 0.000 -0.194 -0.083 LU − 0.120*** 0.033 -3.590 0.000 -0.185 -0.054 LV − 0.112*** 0.042 -2.650 0.008 -0.195 -0.029 PT − 0.210*** 0.017 -12.620 0.000 -0.243 -0.178 RO − 0.202*** 0.027 -7.420 0.000 -0.256 -0.149 SE − 0.085*** 0.017 -4.950 0.000 -0.119 -0.051 SI − 0.173*** 0.028 -6.100 0.000 -0.229 -0.118 SK − 0.278*** 0.030 -9.150 0.000 -0.338 -0.219
CONTROL VARIABLE industry NACE code (C) 05-09 − 0.054 0.060 -0.900 0.368 -0.171 0.063 10-12 0.010 0.024 0.400 0.692 -0.038 0.057 13-15 − 0.039 0.027 -1.440 0.149 -0.093 0.014 16-17 − 0.055* 0.031 -1.760 0.078 -0.115 0.006 18 − 0.035 0.040 -0.870 0.385 -0.113 0.044 19-21 0.023 0.028 0.830 0.408 -0.031 0.077 22-23 − 0.006 0.025 -0.240 0.812 -0.055 0.043 24-25 0.002 0.025 0.100 0.922 -0.046 0.051 26-28 0.010 0.023 0.430 0.670 -0.035 0.055 29-30 0.037 0.030 1.220 0.223 -0.023 0.097 31-32 − 0.078*** 0.029 -2.710 0.007 -0.134 -0.021 33 − 0.011 0.040 -0.260 0.795 -0.090 0.069 35 − 0.113*** 0.040 -2.790 0.005 -0.192 -0.034 36-39 − 0.099*** 0.032 -3.130 0.002 -0.162 -0.037 46-47 − 0.075*** 0.022 -3.380 0.001 -0.118 -0.031 49-51 − 0.118*** 0.031 -3.790 0.000 -0.179 -0.057 52-53 − 0.057* 0.032 -1.790 0.073 -0.119 0.005 58-63 0.067*** 0.021 3.250 0.001 0.026 0.107 64-66 0 (base) 71-75 0.002 0.024 0.080 0.938 -0.046 0.049
Number of observations 18834 Pseudo R2 0.3006 Classification rate 77.12 % AUROC 84.91 %
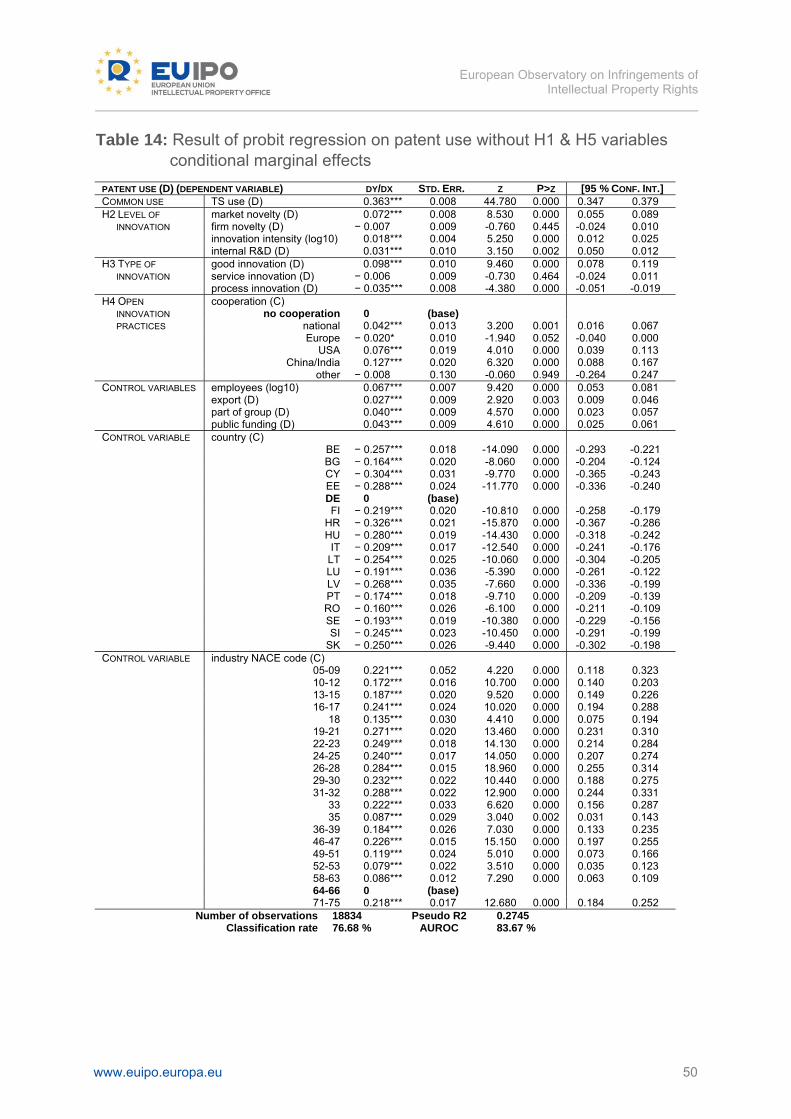
European Observatory on Infringements of
Intellectual Property Rights
www.euipo.europa.eu 50
Table 14: Result of probit regression on patent use without H1 & H5 variables conditional marginal effects
PATENT USE (D) (DEPENDENT VARIABLE) DY/DX STD. ERR. Z P>Z [95 % CONF. INT.] COMMON USE TS use (D) 0.363*** 0.008 44.780 0.000 0.347 0.379 H2 LEVEL OF market novelty (D) 0.072*** 0.008 8.530 0.000 0.055 0.089 INNOVATION firm novelty (D) − 0.007 0.009 -0.760 0.445 -0.024 0.010 innovation intensity (log10) 0.018*** 0.004 5.250 0.000 0.012 0.025 internal R&D (D) 0.031*** 0.010 3.150 0.002 0.050 0.012 H3 TYPE OF good innovation (D) 0.098*** 0.010 9.460 0.000 0.078 0.119 INNOVATION service innovation (D) − 0.006 0.009 -0.730 0.464 -0.024 0.011 process innovation (D) − 0.035*** 0.008 -4.380 0.000 -0.051 -0.019 H4 OPEN cooperation (C) INNOVATION no cooperation 0 (base) PRACTICES national 0.042*** 0.013 3.200 0.001 0.016 0.067 Europe − 0.020* 0.010 -1.940 0.052 -0.040 0.000 USA 0.076*** 0.019 4.010 0.000 0.039 0.113 China/India 0.127*** 0.020 6.320 0.000 0.088 0.167 other − 0.008 0.130 -0.060 0.949 -0.264 0.247 CONTROL VARIABLES employees (log10) 0.067*** 0.007 9.420 0.000 0.053 0.081 export (D) 0.027*** 0.009 2.920 0.003 0.009 0.046 part of group (D) 0.040*** 0.009 4.570 0.000 0.023 0.057 public funding (D) 0.043*** 0.009 4.610 0.000 0.025 0.061 CONTROL VARIABLE country (C) BE − 0.257*** 0.018 -14.090 0.000 -0.293 -0.221 BG − 0.164*** 0.020 -8.060 0.000 -0.204 -0.124 CY − 0.304*** 0.031 -9.770 0.000 -0.365 -0.243 EE − 0.288*** 0.024 -11.770 0.000 -0.336 -0.240 DE 0 (base) FI − 0.219*** 0.020 -10.810 0.000 -0.258 -0.179 HR − 0.326*** 0.021 -15.870 0.000 -0.367 -0.286 HU − 0.280*** 0.019 -14.430 0.000 -0.318 -0.242 IT − 0.209*** 0.017 -12.540 0.000 -0.241 -0.176 LT − 0.254*** 0.025 -10.060 0.000 -0.304 -0.205 LU − 0.191*** 0.036 -5.390 0.000 -0.261 -0.122 LV − 0.268*** 0.035 -7.660 0.000 -0.336 -0.199 PT − 0.174*** 0.018 -9.710 0.000 -0.209 -0.139 RO − 0.160*** 0.026 -6.100 0.000 -0.211 -0.109 SE − 0.193*** 0.019 -10.380 0.000 -0.229 -0.156 SI − 0.245*** 0.023 -10.450 0.000 -0.291 -0.199 SK − 0.250*** 0.026 -9.440 0.000 -0.302 -0.198 CONTROL VARIABLE industry NACE code (C) 05-09 0.221*** 0.052 4.220 0.000 0.118 0.323 10-12 0.172*** 0.016 10.700 0.000 0.140 0.203 13-15 0.187*** 0.020 9.520 0.000 0.149 0.226 16-17 0.241*** 0.024 10.020 0.000 0.194 0.288 18 0.135*** 0.030 4.410 0.000 0.075 0.194 19-21 0.271*** 0.020 13.460 0.000 0.231 0.310 22-23 0.249*** 0.018 14.130 0.000 0.214 0.284 24-25 0.240*** 0.017 14.050 0.000 0.207 0.274 26-28 0.284*** 0.015 18.960 0.000 0.255 0.314 29-30 0.232*** 0.022 10.440 0.000 0.188 0.275 31-32 0.288*** 0.022 12.900 0.000 0.244 0.331 33 0.222*** 0.033 6.620 0.000 0.156 0.287 35 0.087*** 0.029 3.040 0.002 0.031 0.143 36-39 0.184*** 0.026 7.030 0.000 0.133 0.235 46-47 0.226*** 0.015 15.150 0.000 0.197 0.255 49-51 0.119*** 0.024 5.010 0.000 0.073 0.166 52-53 0.079*** 0.022 3.510 0.000 0.035 0.123 58-63 0.086*** 0.012 7.290 0.000 0.063 0.109 64-66 0 (base) 71-75 0.218*** 0.017 12.680 0.000 0.184 0.252 Number of observations 18834 Pseudo R2 0.2745 Classification rate 76.68 % AUROC 83.67 %
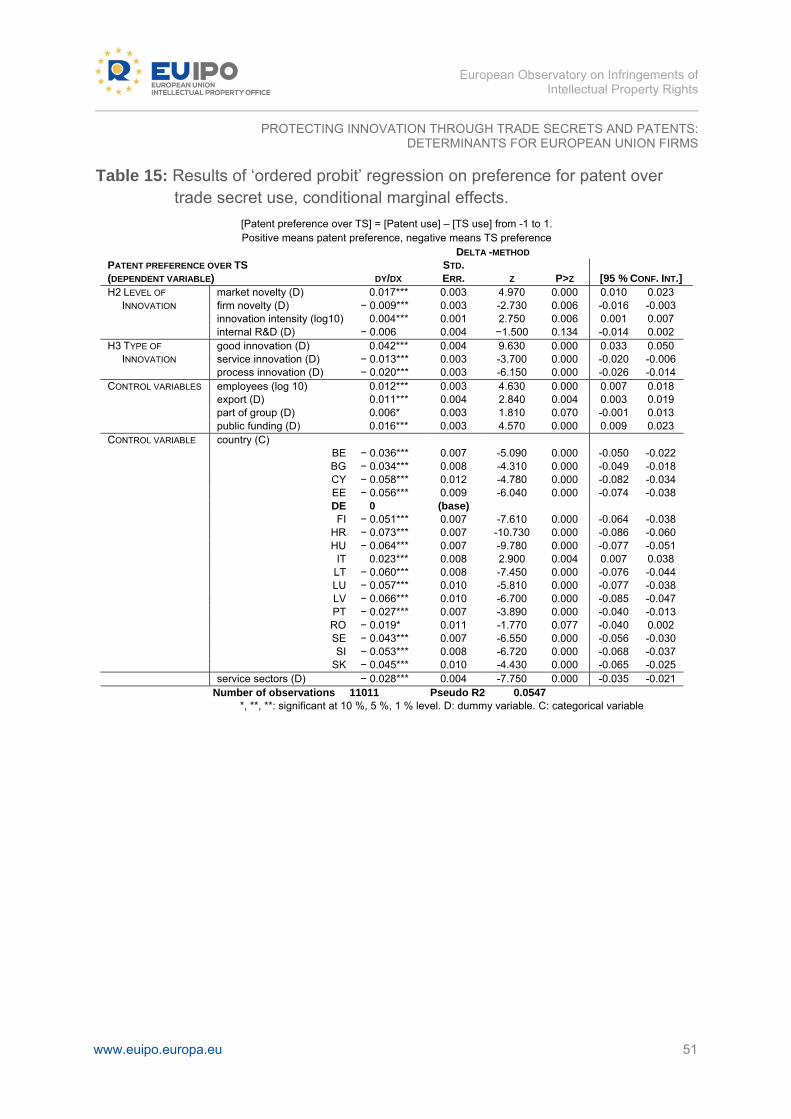
European Observatory on Infringements of
Intellectual Property Rights
PROTECTING INNOVATION THROUGH TRADE SECRETS AND PATENTS:DETERMINANTS FOR EUROPEAN UNION FIRMS
www.euipo.europa.eu 51
Table 15: Results of ‘ordered probit’ regression on preference for patent over trade secret use, conditional marginal effects.
[Patent preference over TS] = [Patent use] – [TS use] from -1 to 1. Positive means patent preference, negative means TS preference
DELTA -METHOD PATENT PREFERENCE OVER TS (DEPENDENT VARIABLE) DY/DX
STD. ERR. Z P>Z [95 % CONF. INT.]
H2 LEVEL OF market novelty (D) 0.017*** 0.003 4.970 0.000 0.010 0.023 INNOVATION firm novelty (D) − 0.009*** 0.003 -2.730 0.006 -0.016 -0.003 innovation intensity (log10) 0.004*** 0.001 2.750 0.006 0.001 0.007 internal R&D (D) − 0.006 0.004 −1.500 0.134 -0.014 0.002 H3 TYPE OF good innovation (D) 0.042*** 0.004 9.630 0.000 0.033 0.050 INNOVATION service innovation (D) − 0.013*** 0.003 -3.700 0.000 -0.020 -0.006 process innovation (D) − 0.020*** 0.003 -6.150 0.000 -0.026 -0.014 CONTROL VARIABLES employees (log 10) 0.012*** 0.003 4.630 0.000 0.007 0.018 export (D) 0.011*** 0.004 2.840 0.004 0.003 0.019 part of group (D) 0.006* 0.003 1.810 0.070 -0.001 0.013 public funding (D) 0.016*** 0.003 4.570 0.000 0.009 0.023 CONTROL VARIABLE country (C)
BE − 0.036*** 0.007 -5.090 0.000 -0.050 -0.022 BG − 0.034*** 0.008 -4.310 0.000 -0.049 -0.018 CY − 0.058*** 0.012 -4.780 0.000 -0.082 -0.034 EE − 0.056*** 0.009 -6.040 0.000 -0.074 -0.038 DE 0 (base) FI − 0.051*** 0.007 -7.610 0.000 -0.064 -0.038 HR − 0.073*** 0.007 -10.730 0.000 -0.086 -0.060 HU − 0.064*** 0.007 -9.780 0.000 -0.077 -0.051 IT 0.023*** 0.008 2.900 0.004 0.007 0.038 LT − 0.060*** 0.008 -7.450 0.000 -0.076 -0.044 LU − 0.057*** 0.010 -5.810 0.000 -0.077 -0.038 LV − 0.066*** 0.010 -6.700 0.000 -0.085 -0.047 PT − 0.027*** 0.007 -3.890 0.000 -0.040 -0.013 RO − 0.019* 0.011 -1.770 0.077 -0.040 0.002 SE − 0.043*** 0.007 -6.550 0.000 -0.056 -0.030 SI − 0.053*** 0.008 -6.720 0.000 -0.068 -0.037 SK − 0.045*** 0.010 -4.430 0.000 -0.065 -0.025
service sectors (D) − 0.028*** 0.004 -7.750 0.000 -0.035 -0.021 Number of observations 11011 Pseudo R2 0.0547
*, **, **: significant at 10 %, 5 %, 1 % level. D: dummy variable. C: categorical variable
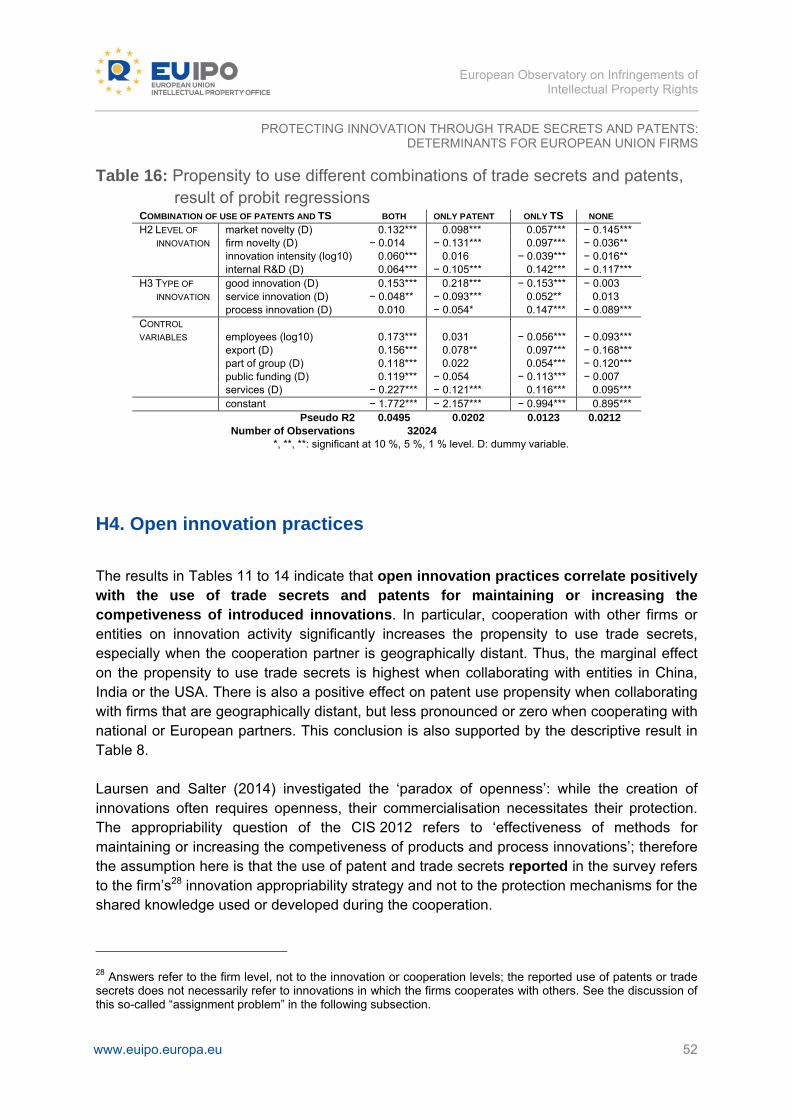
European Observatory on Infringements of
Intellectual Property Rights
PROTECTING INNOVATION THROUGH TRADE SECRETS AND PATENTS:DETERMINANTS FOR EUROPEAN UNION FIRMS
www.euipo.europa.eu 52
Table 16: Propensity to use different combinations of trade secrets and patents, result of probit regressions
COMBINATION OF USE OF PATENTS AND TS BOTH ONLY PATENT ONLY TS NONE H2 LEVEL OF market novelty (D) 0.132*** 0.098*** 0.057*** − 0.145*** INNOVATION firm novelty (D) − 0.014 − 0.131*** 0.097*** − 0.036** innovation intensity (log10) 0.060*** 0.016 − 0.039*** − 0.016** internal R&D (D) 0.064*** − 0.105*** 0.142*** − 0.117*** H3 TYPE OF good innovation (D) 0.153*** 0.218*** − 0.153*** − 0.003 INNOVATION service innovation (D) − 0.048** − 0.093*** 0.052** 0.013 process innovation (D) 0.010 − 0.054* 0.147*** − 0.089*** CONTROL
VARIABLES employees (log10) 0.173*** 0.031 − 0.056*** − 0.093*** export (D) 0.156*** 0.078** 0.097*** − 0.168*** part of group (D) 0.118*** 0.022 0.054*** − 0.120*** public funding (D) 0.119*** − 0.054 − 0.113*** − 0.007 services (D) − 0.227*** − 0.121*** 0.116*** 0.095*** constant − 1.772*** − 2.157*** − 0.994*** 0.895***
Pseudo R2 0.0495 0.0202 0.0123 0.0212 Number of Observations 32024
*, **, **: significant at 10 %, 5 %, 1 % level. D: dummy variable.
H4. Open innovation practices
The results in Tables 11 to 14 indicate that open innovation practices correlate positively with the use of trade secrets and patents for maintaining or increasing the competiveness of introduced innovations. In particular, cooperation with other firms or entities on innovation activity significantly increases the propensity to use trade secrets, especially when the cooperation partner is geographically distant. Thus, the marginal effect on the propensity to use trade secrets is highest when collaborating with entities in China, India or the USA. There is also a positive effect on patent use propensity when collaborating with firms that are geographically distant, but less pronounced or zero when cooperating with national or European partners. This conclusion is also supported by the descriptive result in Table 8. Laursen and Salter (2014) investigated the ‘paradox of openness’: while the creation of innovations often requires openness, their commercialisation necessitates their protection. The appropriability question of the CIS 2012 refers to ‘effectiveness of methods for maintaining or increasing the competiveness of products and process innovations’; therefore the assumption here is that the use of patent and trade secrets reported in the survey refers to the firm’s28 innovation appropriability strategy and not to the protection mechanisms for the shared knowledge used or developed during the cooperation.
28 Answers refer to the firm level, not to the innovation or cooperation levels; the reported use of patents or trade secrets does not necessarily refer to innovations in which the firms cooperates with others. See the discussion of this so-called “assignment problem” in the following subsection.
European Observatory on Infringements of
Intellectual Property Rights
PROTECTING INNOVATION THROUGH TRADE SECRETS AND PATENTS:DETERMINANTS FOR EUROPEAN UNION FIRMS
www.euipo.europa.eu 53
H5. Financial constrains
Contrary to hypothesis H5, financial constrains do not appear to influence the choice between trade secrets and patents. In the case of the trade secrets use model (Table 11) and the patent use model (Table 12), the coefficients of the financial constrains variable are insignificant. Thus, their effect on the propensity to use trade secrets or patents is inconclusive according to these models. This conclusion, even if partial, contradicts previous theoretical literature that has studied the adoption of trade secrets in case of financial constraints. It cannot be deducted from the data that trade secrets are a cheaper substitute of the patents. As noted in section 1, while trade secrets do not incur the fees associated with obtaining and renewing a patent, keeping them secret can be costly as well. If that is the case, then the availability of financial resources would have little bearing on the decision to use one or the other appropriability mechanism.
Complementarity of trade secrets and patents
One of the questions explored in the literature is whether trade secrets and patents are substitutes or complements. In empirical studies (including the present one), the so-called assignment problem complicates matters and alters the meaning of complementarity in the use of appropriability mechanisms. The assignment problem refers to the fact that innovation is often composed of several inventions, and a company can engage in multiple innovation activities simultaneously. The protection afforded by patents usually refers to the individual invention. Therefore, when processing data from a survey such as the CIS, it is difficult to assign the use of a protection mechanism report by a respondent to a particular invention in order to analyse the complementarity of use. For that reason, the definition of complementarity used here really refers to common adoption of trade secrets and patents. The assignment problem was addressed in the German pilot study on trade secret use by German firms29 carried out by the Observatory and ZEW in 2016. This was possible because in the German version of the CIS, firms are asked about the number of innovations, thus making it possible to limit the analysis to firms that declared a single innovation and thereby
29 Protecting innovation through Patents and Trade Secrets: Determinants and performance impacts for German firms https://euipo.europa.eu/tunnel-web/secure/webdav/guest/document_library/observatory/documents/publications/PROTECTING_INNOVATION_en.pdf
European Observatory on Infringements of
Intellectual Property Rights
PROTECTING INNOVATION THROUGH TRADE SECRETS AND PATENTS:DETERMINANTS FOR EUROPEAN UNION FIRMS
www.euipo.europa.eu 54
avoiding the assignment problem. That study concluded that while previous studies have often considered patents and trade secrets as substitutes for one another, their use is complementary in firms declaring a single innovation. However, the harmonised Eurostat CIS questionnaire, which is the basis for the present study, does not include questions about the number of innovations. Therefore, the analysis conducted here is on the level of the firm and not the individual innovation. Table 16 shows complementarity or, more precisely, common adoption, at the firm level, of trade secrets and patents. The regressions indicate that firms engaged in goods innovation use both. On the other hand, firms engaged in service or process innovation tend to rely more on trade secrets. In Tables 13 and 14 it can be observed that the largest marginal effect on the adoption of one protection mechanism is the adoption of the other.
Other factors influencing choice of protection method
The regressions reported in this study contain a number of control variables, making it possible to relate the firm’s choice of protection method to its characteristics. Thus, the propensity to use both trade secrets and patents is positively correlated with the size of the firm (as measured by the number of employees), although the effect is strongest in the case of patent use. Table 15 indicates that firms that export and firms that receive public funding have a preference for patents over trade secrets, although they tend to use both, as indicated in Table 16. The preference for patents could be due to the requirements associated with public funding. Table 11 indicates that the propensity to use trade secrets increases significantly when the ‘lack of adequate personnel’ is an ‘obstacle to meeting enterprise’s goals’.30 The ability to attract and retain key human resources has been identified by some researchers31 as an appropriability mechanism. The analysis carried out here does not allow conclusions to be drawn on this subject. For the country categorical variable, Germany was chosen as the base, so the coefficients represent the difference of propensity to use the appropriability mechanisms with respect to that country. The coefficients of all the country dummies in Tables 13 and 14 are statistically significant, indicating significant differences among countries in the propensity of use of trade secrets and patents when controlling for other factors. Figure 6 represents these coefficients
30 Question 11.3 of the harmonised survey questionnaire 31 Hurmelinna, P. & K. Puumalainen, 2007.

European Observatory on Infringements of
Intellectual Property Rights
PROTECTING INNOVATION THROUGH TRADE SECRETS AND PATENTS:DETERMINANTS FOR EUROPEAN UNION FIRMS
www.euipo.europa.eu 55
graphically, plotting the propensity to use trade secrets on the horizontal axis (x) against the propensity to use patents on the vertical axis (y). In some ways, Figure 6 is similar to Figure 1 and Figure 2 which represent the total number of firms using the two appropriability mechanisms by country, but now the comparison is between ‘similar’ firms, that is, while controlling for other characteristics of the firm. The highest propensity to use patents is still found in Germany while Finnish firms have the highest propensity to use trade secrets. Differences among countries in the use of trade secrets are greater than differences in the use of patents. The differences by country in propensity to use trade secrets or patents could be driven by several factors that cannot be isolated here, for example the nature of patent and trade secrets legislation, or management practices and skills. The marginal effects in the nonlinear regression are somewhat analogous to the coefficients in linear regression but must be interpreted with care. These effects refer to comparable firms (an average firm of the 17 countries). On the other hand, Figures 1 and 2 represent the average use for all firms in a country (and therefore the calculations are influenced by the differences in firm demographics among countries).
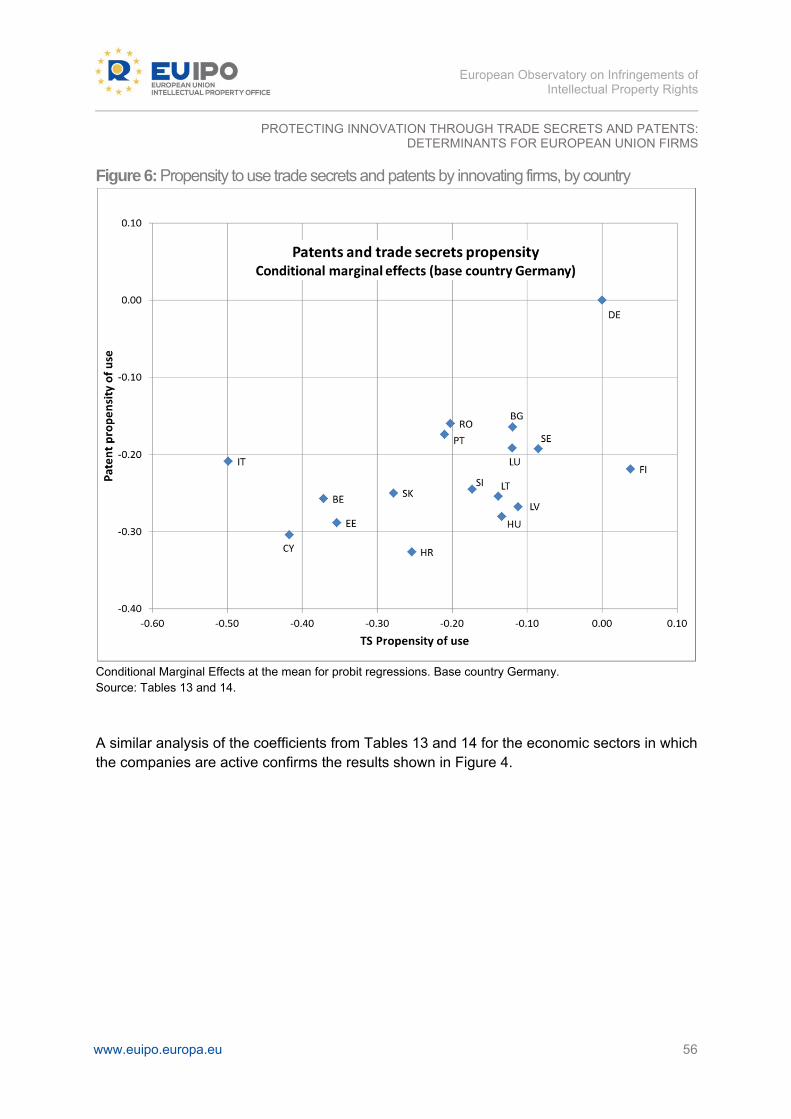
European Observatory on Infringements of
Intellectual Property Rights
PROTECTING INNOVATION THROUGH TRADE SECRETS AND PATENTS:DETERMINANTS FOR EUROPEAN UNION FIRMS
www.euipo.europa.eu 56
Figure 6: Propensity to use trade secrets and patents by innovating firms, by country
Conditional Marginal Effects at the mean for probit regressions. Base country Germany. Source: Tables 13 and 14.
A similar analysis of the coefficients from Tables 13 and 14 for the economic sectors in which the companies are active confirms the results shown in Figure 4.
European Observatory on Infringements of
Intellectual Property Rights
PROTECTING INNOVATION THROUGH TRADE SECRETS AND PATENTS:DETERMINANTS FOR EUROPEAN UNION FIRMS
www.euipo.europa.eu 57
6. Conclusions and directions for further research
Similarly to the German pilot study carried out in 2016, this study has investigated the factors that influence European firms’ choice between trade secrets and patents and their overall use of these protection mechanisms. The findings in this study are consistent with those of the earlier study. In both cases, market novelty and innovation in goods are associated with a preference for patents while process innovations and innovations in services are more often protected through secrecy. As was the case in Germany, financial constraints did not seem to affect the choice between trade secrets and patents among European firms. In carrying out future studies of this type, panel data and information on innovation-specific protection strategies of multiple innovators would make it possible to widen the understanding of the role of secrecy and patenting for increasing the returns to innovation. It is therefore important that questions on appropriability mechanisms used by firms continue to be a core part of the Community Innovation Survey in the coming years. Maintaining these questions will allow for further analysis of the development and uses of trade secrets, patents, and other forms of IP rights following the implementation of the Trade Secret Directive. The CIS would become even more useful as an evidence base for policy formulation if the question on the number of innovations initiated in a particular period were included, as was the case in the German version of the survey. Reliable indices of trade secrets and patent strength regimes could help to further understand the different preferences for appropriability mechanisms among innovating firms in the EU Member States and help illuminate how differences in legal frameworks could influence observed differences in the use of trade secrets. The analysis of the usage of IP bundles (in combination with other appropriability mechanisms) could be undertaken using the CIS data: complementarity with trade marks and designs, lead time advantages and complexity of products. In addition, further insights could be obtained by combining CIS data with other data sources, for example the database on IPR ownership used for the IP Contribution study in 201532.
32 https://euipo.europa.eu/tunnel-web/secure/webdav/guest/document_library/observatory/documents/IPContributionStudy/phase2/OHIM_study_report_en.pdf.
European Observatory on Infringements of
Intellectual Property Rights
PROTECTING INNOVATION THROUGH TRADE SECRETS AND PATENTS:DETERMINANTS FOR EUROPEAN UNION FIRMS
www.euipo.europa.eu 58
References
1. Almeling, D. S., D. W. Snyder, M. Sapoznikow, W. E. McCollum, and J. Weader (2010b). A Statistical Analysis of Trade Secret Litigation in State Courts. Gonzaga Law Review, 46(1), 57-101
2. Ameniya, T. (1981). ‘Qualitative Response Models: A Survey’. Journal of Economic Literature Vol. 19, No. 4 (Dec., 1981), pp. 1483-1536
3. Anton J. and Yao D., (2004). ‘Little patents and big secrets: managing intellectual property’ RAND Journal of Economics, Vol. 35, No. 1, Spring 2004, pp. 1–22.
4. Arora, A. (1997), Patents, licensing and market structure in the chemical industry, Research Policy 26(4–5), 391–403.
5. Arora, A., S. Athreye, C. Huang (2015), The Paradox of Openness Revisited: Collaborative Innovation and Patenting by UK innovators, UNU-MERIT Working Paper Series 2015-031, Maastricht.
6. Arrow, K. (1962). ‘Economic Welfare and the Allocation of Resources for Invention’, in The Rate and Direction of Inventive Activity, R. Nelson (ed.), Princeton University Press, Princeton, USA.
7. Arundel A. & Kabla, I. (1998). ‘What percentage of innovations are patented? Empirical estimates for European firms’. Research Policy 27: 127–141.
8. Arundel A., (2000). ‘Patents - the Viagra of innovation policy?’ Internal report to the Expert Group, MERIT.
9. Arundel, A. (2001). ‘The relative effectiveness of patents and secrecy for appropriation’. Research Policy, 30(4): 611-624.
10. Arundel, A., (1997). ‘Enterprise strategies and barriers to innovation’. In: Arundel, A., Garrelfs, R. ŽEds, Innovation Measurement and Policies. European Commission, Office for Official Publications of the European Communities, EUR 17019, Luxembourg, pp. 101–108.
11. Arvanitis S. & Bolli, T, (2013). ‘A Comparison of National and International Innovation Cooperation in Five European Countries,’ Review of Industrial Organization, Springer;The Industrial Organization Society, vol. 43(3), pages 163-191, November.
12. Belleflamme, P., F. Bloch (2014), Dynamic Protection of Innovations through Patents and Trade Secrets, mimeo, Université Catholique de Louvain.
13. Biswass, T., MacHardy, J. (2012), Secrecy Versus Patents: Process Innovations and the Role of Uncertainty Department of Economics Working Paper, 1749-8368, University of Sheffield
14. Bos, B., T.L.J. Broekhuizen, P. de Faria (2015), A dynamic view on secrecy management, Journal of Business Research (doi: 10.1016/j-jbusres.2015.04.009).
European Observatory on Infringements of
Intellectual Property Rights
PROTECTING INNOVATION THROUGH TRADE SECRETS AND PATENTS:DETERMINANTS FOR EUROPEAN UNION FIRMS
www.euipo.europa.eu 59
15. Carr, C. and L. Gorman (2001). The Revictimization of Companies by the Stock Market Who Report Trade Secret Theft under the Economic Espionage Act, The Business Lawyer, 57(1): 25-53
16. Cassiman, B., R. Veugelers (2002), R&D cooperation and spillovers: some empirical evidence from Belgium, American Economic Review 92, 1169–1184
17. Chesbrough, H., & Bogers, M. (2014). In H. Chesbrough, W. Vanhaverbeke, & J. West (Eds.), New Frontiers in Open Innovation: 3-28. Oxford: Oxford University Press
18. Cohen, W. M., R. R. Nelson, and J. Walsh (2000). ‘Protecting Their Intellectual Assets: Appropriability Conditions and Why USA Manufacturing Firms Patent (or Not)’. Cambridge, MA: NBER Working Paper No. 7552.
19. Cohen, W., A. Goto, A. Nagata, R. Nelson and J. Walsh (2001). ‘R&D Spillovers and the Incentives to Innovate in Japan and the United States’, Working Paper.
20. Cordes, J.J., F.R. Hertzfeld, N.S. Vonortas (1999), A Survey of High Technology Firms, Report to the Office of Chief Counsel for Advocacy at the United States Small Business Administration, Washington: The George Washington University.
21. Erkal N. (2004). ‘Optimal Licensing Policy in Differentiated Industries,’ The Economic Record, The Economic Society of Australia, vol. 81(252), pages 51-60, 03.
22. Faria, P. & Schmidt, T. (2007). ‘International cooperation on innovation: empirical evidence for German and Portuguese firms,’ Discussion Paper Series 1: Economic Studies 2007,30, Deutsche Bundesbank, Research Centre
23. Fromer JC. (2011). Trade Secrecy in Willy Wonka's Chocolate Factory, in The Law and Theory of Trade Secrecy: A Handbook of Contemporary Research, Rochelle C. Dreyfuss, Katherine J. Strandburg, eds., Edward Elgar Publishing, 2011; Fordham Law Legal Studies Research Paper No. 1430463
24. Giarratana, M.S., M. Mariani (2014), The relationship between knowledge sourcing and fear of imitation, Strategic Management Journal 35(8), 1144–1163.
25. Graham, S.J.H. (2004), Hiding in the Patent’s Shadow: Firms’ Uses of Secrecy to Capture Value from New Discoveries, GaTech TI:GER Working Paper Series, Georgia Institute of Technology
26. Graham, S.J.H., D. Hegde (2014), Do Inventors Value Secrecy in Patenting? Evidence from the American Inventor’s Protection Act of 1999, mimeo, New York University.
27. Graham, S.J.H., R.P. Merges, P. Samuelson, T. Sichelman (2009), High technology entrepreneurs and the patent system: results of the 2008 Berkeley Patent Survey, Berkeley Technology Law Journal 24(4), 1255–1327.
28. Hall B. H., Helmers C., Rogers M. & Sena V. (2014). ‘The Choice between Formal and Informal Intellectual Property: A Review’. Journal of Economic Literature 2014, 52(2), 1-50.
European Observatory on Infringements of Intellectual Property Rights
PROTECTING INNOVATION THROUGH TRADE SECRETS AND PATENTS:DETERMINANTS FOR EUROPEAN UNION FIRMS
www.euipo.europa.eu 60
29. Hall, B. H. & Sena V. (2014). ‘Appropriability Mechanisms, Innovation and Productivity:Evidence from the UK’. NBER Working Paper No. 20514.
30. Hall, B.H., C. Helmers, M. Rogers, V. Sena (2013), The importance (or not) of patents toUK firms, Oxford Economic Papers 65(3), 603–629.
31. Hall, B.H., D. Harhoff (2012), Recent Research on the Economics of Patents, AnnualReview of Economics 4(1), 541–565
32. Hedge, D., D.C. Mowery, S.J.H. Graham (2009), Pioneering inventors or thicket builders:which U.S. firms use continuations in patenting? Management Science 55(7), 1214-1226.
33. Hurmelinna, P. and K. Puumalainen (2005). ‘The Dynamics of Appropriability Regimes’,The DRUID Tenth Anniversary Summer Conference, Copenhagen, June 2005.
34. Hurmelinna-Laukkanen, P. & K. Puumalainen (2007). ‘Nature and dynamics ofappropriability: strategies for appropriating returns on innovation’. R&D Management37(2): 95-12.
35. Kultti, K., T. Takalo, J. Toikka (2006), Simultaneous model of innovation, secrecy, andpatent policy, American Economic Review 96(2), 82–86.
36. Kultti, K., T. Takalo, J. Toikka (2007), Secrecy versus patenting, RAND Journal ofEconomics 38(1), 22–42.
37. Laursen, K., A.J. Salter (2014), The paradox of openness: appropriability, externalsearch and collaboration, Research Policy 43(5), 867-878
38. Lemley, M.A. (2012), The myth of the sole inventor, Michigan Law Review 110(5),709-760.
39. Lerner, J. (1995), Patenting in the shadow of competitors, Journal of Law and Economics38, 463–495.
40. Levin, R.C., Klevorick, A.K., Nelson, R.R., Winter, S.G. (1987). ‘Appropriating the returnsfrom industrial research and development’.Brookings Papers on Economic Activity 3,242–279.
41. Linton, Katherine (2016). ‘The Importance of Trade Secrets: New Directions inInternational Trade Policy Making and Empirical Research’. United States InternationalCommission, Journal of International Commerce and Economics.
42. McFadden, D. (1974). ‘Conditional logit analysis of qualitative choice behavior’. InP. Zarembka (Ed.) Frontiers in Econometrics. Academic Press, New York.
43. Morikawa, M. (2014). ‘Innovation in the Service Sector and the Role of Patents andTrade Secrets’, RIETI Discussion Paper 14�E�030.
44. Mosel, M. (2011), Big Patents, Small Secrets: How Firms Protect Inventions When R&DOutcome Is Heterogeneous, Bavarian Graduate Program in Economics DiscussionPaper 105, Munich.
European Observatory on Infringements of
Intellectual Property Rights
PROTECTING INNOVATION THROUGH TRADE SECRETS AND PATENTS:DETERMINANTS FOR EUROPEAN UNION FIRMS
www.euipo.europa.eu 61
45. Nelson, R. (1959). ‘The Simple Economics of Basic Scientific Research’, Journal of Political Economy, V. 67, 297-306.
46. Neuhaeusler P. (2009). ‘Formal vs. informal protection instruments and the strategic use of patents in an Expected-Utility framework’. Fraunhofer ISI Discussion Papers Innovation Systems and Policy Analysis, No. 20 ISSN 1612-1430.
47. Ottoz E. and Cugno F (2011). Choosing the scope of trade secret law when secrets complement patents. International Review of Law and Economics, vol. 31, issue 4, pages 219-2272011
48. Ouellette L. (2012), ‘Do Patents Disclose Useful Information?’ Harvard Journal of Law & Technology, Volume 25, Number 2 Spring 2012
49. Pajak, S. (2010), Do Innovative Firms Rely on Big Secrets? An Analysis of IP Protection Strategies with the CIS 4 Survey, mimeo, Department of Economics and Social Sciences, Telecom ParisTech.(doi: 10.1080/10438599.2015.1080902)
50. Panagopoulos, A., I.-U. Park (2015), Patenting vs. secrecy for startups and the trade of patents as negotiating assets, mimeo, University of Crete
51. Rich, Giles S. (1972). ‘Laying the Ghost of the ‘Invention’ Requirement’. American Intellectual Property Law Quarterly Journal 1 (1): 26–45, page 26.
52. Rammer, C. (2002). ‘Patente und Marken als Schutzmechanismen für Innovationen (= Studien zum deutschen Innovationssystem No. 11-2003)’. Mannheim: Zentrum für Europäische Wirtschaftsforschung (ZEW).
53. Rammer, C. (2007). ‘Innovationsverhalten der Unternehmen in Deutschland 2005 - Aktuelle Entwicklungen – öffentliche Förderung – Innovationskooperationen – Schutzmaßnahmen für geistiges Eigentum (= Studien zum deutschen Innovationssystem No. 13-2007)’. Mannheim: Zentrum für Europäische Wirtschaftsforschung (ZEW).
54. Schneider, C. (2008), Fences and competition in patent races, International Journal of Industrial Organization 26(6), 1348–1364
55. Schumpeter J. (1942). ‘Capitalism, Socialism and Democracy’, Harper and Row.
56. Zaby, A.K. (2010), Losing the lead: the patenting decision in the light of the disclosure requirement, Economics of Innovation and New Technology 19(2), 147–164.
57. Zhang, T. (2012), Patenting in the shadow of independent discoveries by rivals, International Journal of Industrial Organization 30, 41–49.

PROTECTING INNOVATION THROUGHTRADE SECRETS AND PATENTS:DETERMINANTS FOR EUROPEAN UNION FIRMS

European Observatory on Infringements of Intellectual Property Rights
PROTECTING INNOVATION THROUGH TRADE SECRETS AND PATENTS:DETERMINANTS FOR EUROPEAN UNION FIRMS
www.euipo.europa.eu
PROTECTING INNOVATION THROUGH TRADE SECRETS AND PATENTS: DETERMINANTS FOR EUROPEAN UNION FIRMS
Avenida de Europa, 4,
E-03008 Alicante, Spain