Prosperity Index Eight Sub Indexes
17
THE EIGHT SUB-INDEXES The 2010 Prosperity Index consists of eight sub-indexes: Economy Entrepreneurship & Opportunity Governance Education Health Safety & Security Personal Freedom Social Capital In the following pages, for each sub-index, we have provided rankings of the top and bottom 10 countries, descriptions of the sub-index, and a table listing the variables used in the creation of that sub-index. 42 44 46 48 50 52 54 56
-
Upload
castle1925 -
Category
Documents
-
view
227 -
download
0
Transcript of Prosperity Index Eight Sub Indexes

8/6/2019 Prosperity Index Eight Sub Indexes
http://slidepdf.com/reader/full/prosperity-index-eight-sub-indexes 1/17
THE EIGHTSUB-INDEXES
The 2010 Prosperity Index consists of eight sub-indexes:
Economy
Entrepreneurship & Opportunity
Governance
Education
Health
Safety & Security
Personal Freedom
Social Capital
In the following pages, for each sub-index, we have providedrankings of the top and bottom 10 countries, descriptions of thesub-index, and a table listing the variables used in the creation of that sub-index.
42
44
46
48
50
52
54
56

8/6/2019 Prosperity Index Eight Sub Indexes
http://slidepdf.com/reader/full/prosperity-index-eight-sub-indexes 2/17
THE EIGHT SUB-INDEXES
ECONOMY
42
Stable and growing economies increase per capita incomeand promote the overall wellbeing of its citizens. TheEconomy sub-index measures countries’ performances infour areas that are essential to promoting prosperity:macroeconomic policies, economic satisfaction andexpectations, foundation for growth, and financial sectorefficiency. As illustrated in the chart below, the variablesin the sub-index are categorised into these areas.
The sub-index demonstrates that outcomes of soundmacroeconomic policies, such as robust domestic savingsrates, low rates of inflation and unemployment, and anefficient financial sector have a positive impact on bothaverage levels of income and wellbeing.It also shows that investing in physical capital per worker,innovative high-tech exports, and a competitive economythat facilitates domestic demand and attracts foreign
investment are essential to boosting per capital income.Positive expectations about the future of the economyand satisfaction with living standards also make animportant contribution to the overall wellbeing of acountry’s citizens. While our research shows thatincreased economic strength over time is generally goodfor everyone, it also finds that rapid increases in GDP arerelated to lower levels of happiness in a society as peoplegrapple with the dislocations that often accompany suchgrowth.
Senegal
Nicaragua
Zambia
Moldova
Central African Republic
Ethiopia
Kenya
Uzbekistan
Ghana
Zimbabwe
Norway
Switzerland
Netherlands
Denmark
Canada
Singapore
Sweden
Australia
Finland
Hong Kong
Bottom 10 countries
110
109
108
107
106
105
104
103
102
1011
2
3
4
5
6
7
8
9
10
Top 10 countries
Strong ranking countries (Top 30) Average ranking countries (Middle 50) Low ranking countries (Bottom 30) Insufficient data
Macroeconomic Policies
InflationGross Domestic SavingsEmployment Status
Gross Domestic SavingsUnemployment RateInflation
Economic Satisfaction and ExpectationsFoundation for Growth
Satisfaction with Standard of LivingAdequate Food and ShelterPerceived Job AvailabilityExpectations of the Economy5-year Rate of Growth
Capital Per WorkerMarket SizeHigh-Tech ExportsFDI Size and Volatility
Confidence in Financial InstitutionsNon-performing Loans
Indicates a variable that is included in both income and wellbeing regressions. Indicates a variable that is included in only one regression.
Variables have been divided into different categories within each sub-index. Variables are ordered from largest to smallest within each category. Income and wellbeing bar sizes arenot comparable due to differences in scale
INCOME WELLBEING
Financial Sector Efficiency
Ranking Distribution for Economy

8/6/2019 Prosperity Index Eight Sub Indexes
http://slidepdf.com/reader/full/prosperity-index-eight-sub-indexes 3/17 43
Norway
Switzerland
NetherlandsDenmark
Canada
Singapore
Sweden
Australia
Finland
Hong Kong
Japan
Austria
Germany
United States
South KoreaBelgium
New Zealand
United Kingdom
France
Kuwait
Malaysia
Ireland
Thailand
China
Taiwan
Czech Republic
IsraelSaudi Arabia
Italy
United Arab Emirates
Mexico
Brazil
Spain
Slovenia
Morocco
Costa Rica
Poland
Iceland
Chile
Portugal
Greece
Argentina
Indonesia
India
Algeria
Uruguay
Slovakia
Hungary
Tunisia
Panama
Kazakhstan
Philippines
Croatia
Paraguay
Colombia
Venezuela
Peru
Trinidad and TobagoEstonia
Ecuador
Belize
Vietnam
Bolivia
Russia
Guatemala
Bangladesh
Romania
Namibia
Turkey
LebanonSyria
Egypt
Botswana
Belarus
Bulgaria
Lithuania
South Africa
Iran
Jamaica
Dominican Republic
Latvia
MozambiqueSudan
Sri Lanka
Mali
Pakistan
Cameroon
Mongolia
El Salvador
Nigeria
Uganda
Cambodia
Jordan
Rwanda
Tanzania
Ukraine
Honduras
Macedonia
Yemen
Nepal
Senegal
Nicaragua
Zambia
Moldova
Central African Republic
Ethiopia
Kenya
Uzbekistan
Ghana
Zimbabwe
1
2
34
5
6
7
8
9
10
11
12
13
14
1516
17
18
19
20
21
22
23
24
25
26
2728
29
30
31
32
33
34
35
36
37
38
39
40
41
42
43
44
45
46
47
48
49
50
51
52
53
54
55
56
57
5859
60
61
62
63
64
65
66
67
68
69
7071
72
73
74
75
76
77
78
79
80
81
8283
84
85
86
87
88
89
90
91
92
93
94
95
96
97
98
99
100
101
102
103
104
105
106
107
108
109
110
3.091
2.986
2.9232.873
2.651
2.605
2.538
2.524
2.457
2.333
2.301
2.281
2.228
2.012
1.9701.950
1.942
1.842
1.829
1.812
1.779
1.710
1.687
1.655
1.574
1.563
1.5151.454
1.374
1.324
1.249
1.194
1.190
1.117
0.986
0.889
0.868
0.797
0.745
0.727
0.725
0.627
0.601
0.552
0.496
0.495
0.411
0.351
0.331
0.268
0.254
0.231
0.220
0.161
0.154
0.083
0.077
0.049-0.077
-0.110
-0.167
-0.188
-0.188
-0.241
-0.316
-0.341
-0.358
-0.389
-0.509
-0.519-0.539
-0.617
-0.664
-0.667
-0.696
-0.753
-0.755
-0.784
-0.802
-0.857
-1.021
-1.071-1.072
-1.114
-1.167
-1.254
-1.311
-1.334
-1.466
-1.563
-1.627
-1.725
-1.743
-1.748
-1.945
-1.974
-2.122
-2.146
-2.360
-2.364
-2.474
-2.489
-2.767
-2.856
-2.878
-2.986
-3.494
-3.775
-3.788
-8.458
Ranking Country CountryScore
Ranking Country CountryScore
-9
-7
-5
-3
-1
1
3
5
0
Norway
(1), 3.091
Colombia
(55), 0.154
Zimbabwe
(110), -8.458
Numbers in brackets indicateProsperity Index ranking
E c o n o m y S u b - i n d e x S c o r e s
Distribution of Country Scores

8/6/2019 Prosperity Index Eight Sub Indexes
http://slidepdf.com/reader/full/prosperity-index-eight-sub-indexes 4/17
THE EIGHT SUB-INDEXES
44
ENTREPRENEURSHIP & OPPORTUNITY
development across socioeconomic groups and whetheror not citizens believe hard work pays off in the future.
The E&O sub-index builds upon scholarship that showshow entrepreneurship drives innovation and leads toeconomic growth. It also uses research demonstrating thepositive impact of an individual realising his or herentrepreneurial potential. When a country increases thelikelihood that entrepreneurial activity will pay off, and when individuals experience the satisfaction that comesfrom earning their success, a society’s prosperity increasesoverall.
Mozambique
Zambia
Nigeria
Tanzania
Central African Republic
Yemen
Cameroon
Mali
Ethiopia
Zimbabwe
Denmark
Sweden
United States
Finland
United Kingdom
Norway
Ireland
Singapore
Iceland
Canada
Bottom 10 countries
110
109
108
107
106
105
104
103
102
1011
2
3
4
5
6
7
8
9
10
Top 10 countries
Strong ranking countries (Top 30) Average ranking countries (Middle 50) Low ranking countries (Bottom 30) Insufficient data
Entrepreneurial Environment
Secure Internet ServersMobile Phones per HouseholdGood Environment for EntrepreneursBusiness Start-up Costs
Business Start-up CostsSecure Internet ServersInternet BandwidthMobile Phones
Perception that Working HardGets You Ahead
Uneven EconomicDevelopment
Innovative Activity
R&D ExpenditureRoyalty ReceiptsICT Exports
Indicates a variable that is included in both income and wellbeing regressions. Indicates a variable that is included in only one regression.
Variables have been divided into different categories within each sub-index. Variables are ordered from largest to smallest within each category. Income and wellbeing bar sizes arenot comparable due to differences in scale
INCOME WELLBEING
Access to Opportunity
Ranking Distribution for Entrepreneurship & Opportunity
A strong entrepreneurial climate in which citizens can pursuenew ideas and opportunities for improving their lives leadsto higher levels of income and wellbeing. Specifically, theEntrepreneurship & Opportunity (E&O) sub-index measurescountries’ performance in three areas: entrepreneurialenvironment, innovative activity, and access to opportunity.As illustrated in the chart below, the variables in the sub-index are categorised into these areas.
Such factors as low costs to starting a business and publicperception of a good entrepreneurial environment areimportant to improving citizens’ economic prospects andtheir overall wellbeing. The sub-index also assesses acountry’s ability to commercialise innovation, as well asthe Information and Communication Technology (ICT)infrastructure that exists to enable productive commercialendeavours. Lastly, it captures elements of access toopportunity by tracking the unevenness of economic
8/6/2019 Prosperity Index Eight Sub Indexes
http://slidepdf.com/reader/full/prosperity-index-eight-sub-indexes 5/17 45
Denmark
Sweden
United StatesFinland
United Kingdom
Norway
Ireland
Singapore
Iceland
Canada
Switzerland
Netherlands
Australia
New Zealand
GermanyAustria
Hong Kong
South Korea
Japan
France
Belgium
Taiwan
Estonia
United Arab Emirates
Israel
Slovenia
SpainPortugal
Czech Republic
Italy
Kuwait
Latvia
Chile
Malaysia
Greece
Slovakia
Croatia
Poland
Lithuania
Trinidad and Tobago
Panama
Hungary
South Africa
Costa Rica
Tunisia
Argentina
Jamaica
Saudi Arabia
Brazil
Romania
Belize
Uruguay
Turkey
Thailand
Bulgaria
Russia
Colombia
MongoliaMexico
China
Macedonia
Dominican Republic
Moldova
Botswana
Venezuela
Peru
Belarus
Morocco
Philippines
JordanGuatemala
Kazakhstan
Ukraine
Paraguay
Ecuador
Sri Lanka
Vietnam
Namibia
Algeria
Honduras
El Salvador
IndonesiaLebanon
Egypt
Uzbekistan
Iran
Bolivia
Pakistan
Ghana
Kenya
Sudan
Syria
India
Nicaragua
Bangladesh
Nepal
Rwanda
Uganda
Senegal
Cambodia
Mozambique
Zambia
Nigeria
Tanzania
Central African Republic
Yemen
Cameroon
Mali
Ethiopia
Zimbabwe
1
2
34
5
6
7
8
9
10
11
12
13
14
1516
17
18
19
20
21
22
23
24
25
26
2728
29
30
31
32
33
34
35
36
37
38
39
40
41
42
43
44
45
46
47
48
49
50
51
52
53
54
55
56
57
5859
60
61
62
63
64
65
66
67
68
69
7071
72
73
74
75
76
77
78
79
80
81
8283
84
85
86
87
88
89
90
91
92
93
94
95
96
97
98
99
100
101
102
103
104
105
106
107
108
109
110
3.700
3.601
3.4483.411
3.309
3.235
3.203
3.185
3.181
3.157
3.144
3.078
3.051
2.920
2.8032.525
2.375
2.322
2.204
2.136
2.055
2.014
1.907
1.866
1.814
1.671
1.4871.317
1.242
1.006
0.933
0.862
0.786
0.780
0.761
0.733
0.707
0.698
0.677
0.614
0.598
0.597
0.507
0.497
0.367
0.284
0.200
0.117
0.113
0.108
0.042
-0.021
-0.051
-0.070
-0.071
-0.101
-0.166
-0.250-0.301
-0.408
-0.607
-0.649
-0.709
-0.724
-0.755
-0.794
-0.842
-0.857
-0.859
-0.868-0.950
-0.959
-0.978
-0.996
-1.047
-1.098
-1.147
-1.252
-1.317
-1.329
-1.329
-1.432-1.497
-1.512
-1.563
-1.715
-1.784
-1.856
-1.916
-1.917
-2.009
-2.079
-2.087
-2.094
-2.143
-2.220
-2.291
-2.301
-2.357
-2.436
-2.463
-2.499
-2.562
-2.729
-2.826
-2.827
-2.854
-2.977
-3.089
-3.810
Ranking Country CountryScore
Ranking Country CountryScore
-9
-7
-5
-3
-1
1
3
5
0
Denmark
(1), 3.700
Bulgaria
(55), -0.071
Zimbabwe
(110), -3.810
Numbers in brackets indicateProsperity Index ranking
E n t r e p r e n e u r s h i p & O p p o r t u n i t y S u b - i n d e x S c o r e s
Distribution of Country Scores
8/6/2019 Prosperity Index Eight Sub Indexes
http://slidepdf.com/reader/full/prosperity-index-eight-sub-indexes 6/17
THE EIGHT SUB-INDEXES
46
GOVERNANCE
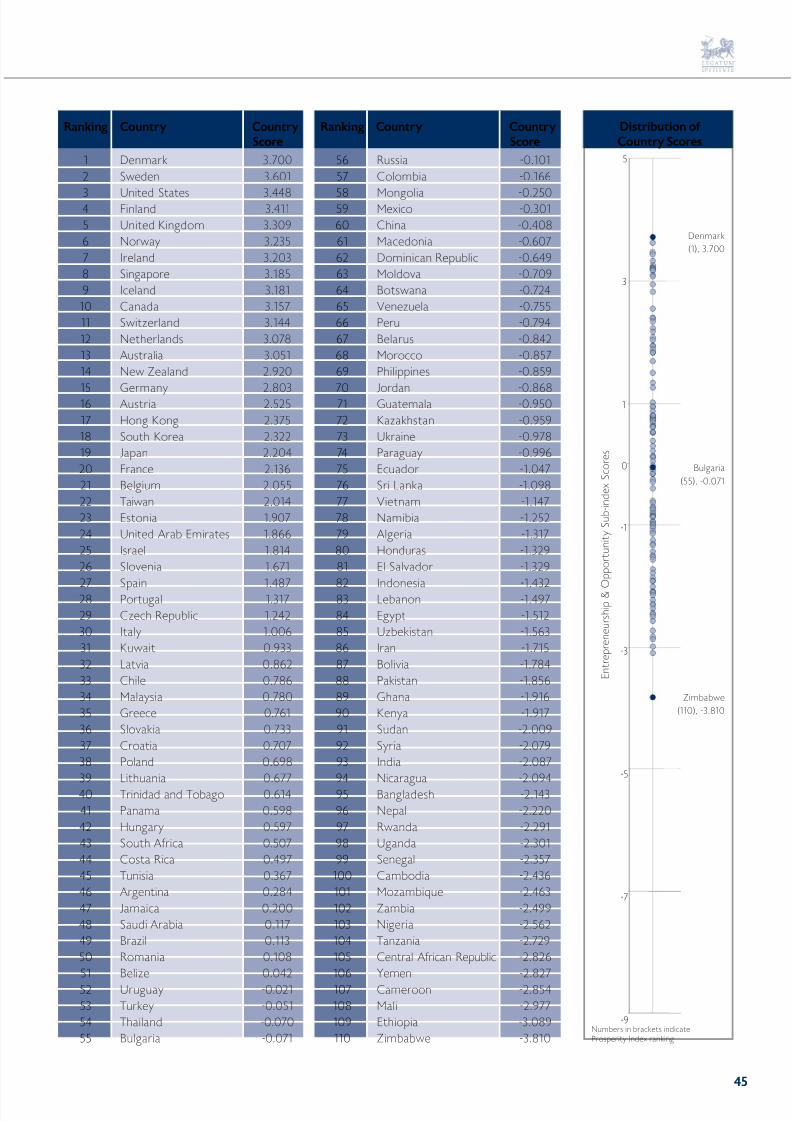
Well-governed societies enjoy national economic growthand citizen wellbeing. The Governance sub-indexmeasures countries’ performance in three areas: effectiveand accountable government, fair elections and politicalparticipation, and rule of law. As illustrated in the chartbelow, the variables in the sub-index are categorised intothese areas.
Stable and democratic governing institutions protect politicaland economic liberty and create an environmentof civic participation, leading to higher levels of income and wellbeing. The Governance sub-index measures levels of competition and corruption in the government, and citizens’confidence in elections, the judicial system, and the military.The sub-index shows that citizens prefer governments thatare stable and accountable. Public wellbeing is also relatedto people’s perceptions of how well the government
addresses societal struggles with the environment andpoverty.
Academic research has found that in general, politicalfreedom, strength of institutions, and regulatory qualityare significant contributors to economic growth. Effective,fair, and accountable governments also increase publicconfidence, leading to higher levels of life satisfactionamong citizens. Likewise, the opportunity to have a voicein their government is correlated with happier citizens.
Russia
Pakistan
Yemen
Belarus
Iran
Central African Republic
Cameroon
Nigeria
Sudan
Zimbabwe
Switzerland
Denmark
United States
New Zealand
Canada
Sweden
Finland
Australia
United Kingdom
Netherlands
Bottom 10 countries
110
109
108
107
106
105
104
103
102
1011
2
3
4
5
6
7
8
9
10
Top 10 countries
Strong ranking countries (Top 30) Average ranking countries (Middle 50) Low ranking countries (Bottom 30) Insufficient data
Effective and Accountable Government
Government EffectivenessRegime StabilitySeparation of PowersPolitical ConstraintsGovernment Type
Efforts to Address PovertyBusiness and Government CorruptionGovernment EffectivenessEnvironmental PreservationSeparation of PowersGovernment Approval
Voiced ConcernConfidence in the Honesty of Elections
Political Rights
Indicates a variable that is included in both income and wellbeing regressions. Indicates a variable that is included in only one regression.
Variables have been divided into different categories within each sub-index. Variables are ordered from largest to smallest within each category. Income and wellbeing bar sizes arenot comparable due to differences in scale
INCOME WELLBEING
Fair Election and Political Participation
Rule of LawRegulation
Rule of Law
Confidence in the Judicial SystemRegulationRule of LawConfidence in Military
Ranking Distribution for Governance

8/6/2019 Prosperity Index Eight Sub Indexes
http://slidepdf.com/reader/full/prosperity-index-eight-sub-indexes 7/17 47
Switzerland
Denmark
United StatesNew Zealand
Canada
Sweden
Finland
Australia
United Kingdom
Netherlands
Singapore
Norway
Austria
Ireland
GermanyBelgium
Iceland
Hong Kong
France
Japan
Chile
Spain
Estonia
Portugal
Botswana
Costa Rica
SloveniaIsrael
Uruguay
Czech Republic
South Korea
Italy
Hungary
Malaysia
Poland
Kuwait
Taiwan
United Arab Emirates
Slovakia
South Africa
India
Jordan
Sri Lanka
Namibia
Lithuania
Greece
Latvia
Croatia
Saudi Arabia
Tunisia
Turkey
Panama
Thailand
Trinidad and Tobago
Philippines
Ghana
Bulgaria
RwandaColombia
Brazil
El Salvador
Vietnam
Morocco
China
Romania
Mexico
Jamaica
Zambia
Peru
IndonesiaMacedonia
Cambodia
Senegal
Tanzania
Dominican Republic
Mali
Belize
Egypt
Syria
Uganda
Mongolia
MozambiqueHonduras
Uzbekistan
Nicaragua
Argentina
Kazakhstan
Guatemala
Moldova
Algeria
Paraguay
Lebanon
Bolivia
Nepal
Bangladesh
Venezuela
Ecuador
Ukraine
Ethiopia
Kenya
Russia
Pakistan
Yemen
Belarus
Iran
Central African Republic
Cameroon
Nigeria
Sudan
Zimbabwe
1
2
34
5
6
7
8
9
10
11
12
13
14
1516
17
18
19
20
21
22
23
24
25
26
2728
29
30
31
32
33
34
35
36
37
38
39
40
41
42
43
44
45
46
47
48
49
50
51
52
53
54
55
56
57
5859
60
61
62
63
64
65
66
67
68
69
7071
72
73
74
75
76
77
78
79
80
81
8283
84
85
86
87
88
89
90
91
92
93
94
95
96
97
98
99
100
101
102
103
104
105
106
107
108
109
110
4.302
3.849
3.7903.721
3.699
3.610
3.586
3.576
3.534
3.359
3.269
3.208
3.205
3.147
2.6852.669
2.527
2.344
2.203
2.186
1.931
1.677
1.665
1.447
1.398
1.392
1.2771.262
1.172
1.166
1.101
0.931
0.921
0.882
0.790
0.759
0.686
0.650
0.468
0.351
0.284
0.213
0.197
0.139
0.128
0.108
0.048
0.036
0.023
-0.025
-0.025
-0.037
-0.224
-0.272
-0.348
-0.387
-0.397
-0.522-0.528
-0.555
-0.578
-0.600
-0.604
-0.695
-0.719
-0.727
-0.886
-0.988
-1.122
-1.155-1.184
-1.224
-1.228
-1.264
-1.266
-1.310
-1.318
-1.337
-1.391
-1.548
-1.558
-1.560-1.629
-1.669
-1.686
-1.698
-1.718
-1.748
-1.809
-1.811
-1.863
-1.887
-1.892
-1.901
-1.908
-2.034
-2.035
-2.130
-2.135
-2.151
-2.216
-2.236
-2.271
-2.307
-2.505
-2.554
-2.573
-2.578
-2.813
-4.233
Ranking Country CountryScore
Ranking Country CountryScore
-9
-7
-5
-3
-1
1
3
5
0
Switzerland(1), 4.302
Philippines
(55), -0.348
Zimbabwe
(110), -4.233
Numbers in brackets indicateProsperity Index ranking
G o v e r n a n c e S u b - i n d e x S c o r e s
Distribution of Country Scores

8/6/2019 Prosperity Index Eight Sub Indexes
http://slidepdf.com/reader/full/prosperity-index-eight-sub-indexes 8/17
THE EIGHT SUB-INDEXES
48
EDUCATION
Education is a building block for prosperous societies. TheEducation sub-index measures countries’ performance inthree areas: access to education, quality of education, andhuman capital. As illustrated in the chart below, the variables in the sub-index are categorised into these areas.
The Education sub-index demonstrates how access toeducation, as measured by levels of educational enrolmentrates that are equal for both girls and boys, allows citizensto develop their potential and contribute productively totheir society. In addition, it shows that human capitalstock, which is measured by the average levels of education in the workforce, is essential for promotingprivate sector research and development as well asproducing useful knowledge for a society. Because of theimportance of citizen’s own perceptions of the educationalopportunity available to them, the sub-index uses bothobjective and subjective variables to assess the quality of
education in a given country. Global data on education islimited and, therefore, the Education sub-index uses pupilto teacher ratio, as well as measures of citizens’perception of education, to assess quality.
This sub-index is built on research on economic growththat has found human capital to be an engine for growth,making a case for the non-diminishing effect of educationon rising GDP levels. While the relationship betweenhigher levels of education and wellbeing is less clear-cut,research shows that basic education enhances people’schances in increasing their satisfaction with life.
Zimbabwe
Yemen
Pakistan
Senegal
Mozambique
Nigeria
Sudan
Ethiopia
Mali
Central African Republic
New Zealand
Australia
Finland
Norway
Denmark
Iceland
Taiwan
South Korea
United States
Sweden
Bottom 10 countries
110
109
108
107
106
105
104
103
102
1011
2
3
4
5
6
7
8
9
10
Top 10 countries
Strong ranking countries (Top 30) Average ranking countries (Middle 50) Low ranking countries (Bottom 30) Insufficient data
Access to Education
Gross Secondary EnrolmentGross Tertiary EnrolmentNet Primary EnrolmentGirls to Boys Enrolment Ratio
Gross Secondary EnrolmentNet Primary EnrolmentGirls to Boys Enrolment RatioGross Tertiary Enrolment
Quality of Education
Satisfaction with Educational QualityPerception that Children areLearning in Society
Pupil to Teacher Ratio
Secondary Education per WorkerTertiary Education per Worker Tertiary Education per WorkerSecondary Education per Worker
Indicates a variable that is included in both income and wellbeing regressions. Indicates a variable that is included in only one regression.
Variables have been divided into different categories within each sub-index. Variables are ordered from largest to smallest within each category. Income and wellbeing bar sizes arenot comparable due to differences in scale
INCOME WELLBEING
Human Capital
Ranking Distribution for Education
8/6/2019 Prosperity Index Eight Sub Indexes
http://slidepdf.com/reader/full/prosperity-index-eight-sub-indexes 9/17 49
New Zealand
Australia
FinlandNorway
Denmark
Iceland
Taiwan
South Korea
United States
Sweden
Spain
Canada
Netherlands
France
IrelandSlovenia
Austria
Belgium
Italy
Portugal
Greece
United Kingdom
Belarus
Japan
Germany
Poland
Czech RepublicIsrael
Switzerland
Singapore
Hungary
Slovakia
Latvia
United Arab Emirates
Lithuania
Estonia
Uruguay
Russia
Argentina
Ukraine
Tunisia
Jordan
Romania
Croatia
Malaysia
Kazakhstan
Thailand
Bulgaria
Mongolia
Panama
Lebanon
Chile
Hong Kong
Venezuela
Kuwait
Sri Lanka
Iran
Costa RicaChina
Philippines
Bolivia
Peru
Egypt
Uzbekistan
Saudi Arabia
Moldova
Trinidad and Tobago
Colombia
Mexico
IndonesiaMacedonia
Algeria
Ecuador
Syria
Brazil
Jamaica
Dominican Republic
South Africa
Honduras
Belize
Vietnam
TurkeyNicaragua
El Salvador
Botswana
Paraguay
Namibia
Guatemala
India
Cambodia
Bangladesh
Nepal
Morocco
Zambia
Ghana
Rwanda
Cameroon
Kenya
Tanzania
Uganda
Zimbabwe
Yemen
Pakistan
Senegal
Mozambique
Nigeria
Sudan
Ethiopia
Mali
Central African Republic
1
2
34
5
6
7
8
9
10
11
12
13
14
1516
17
18
19
20
21
22
23
24
25
26
2728
29
30
31
32
33
34
35
36
37
38
39
40
41
42
43
44
45
46
47
48
49
50
51
52
53
54
55
56
57
5859
60
61
62
63
64
65
66
67
68
69
7071
72
73
74
75
76
77
78
79
80
81
8283
84
85
86
87
88
89
90
91
92
93
94
95
96
97
98
99
100
101
102
103
104
105
106
107
108
109
110
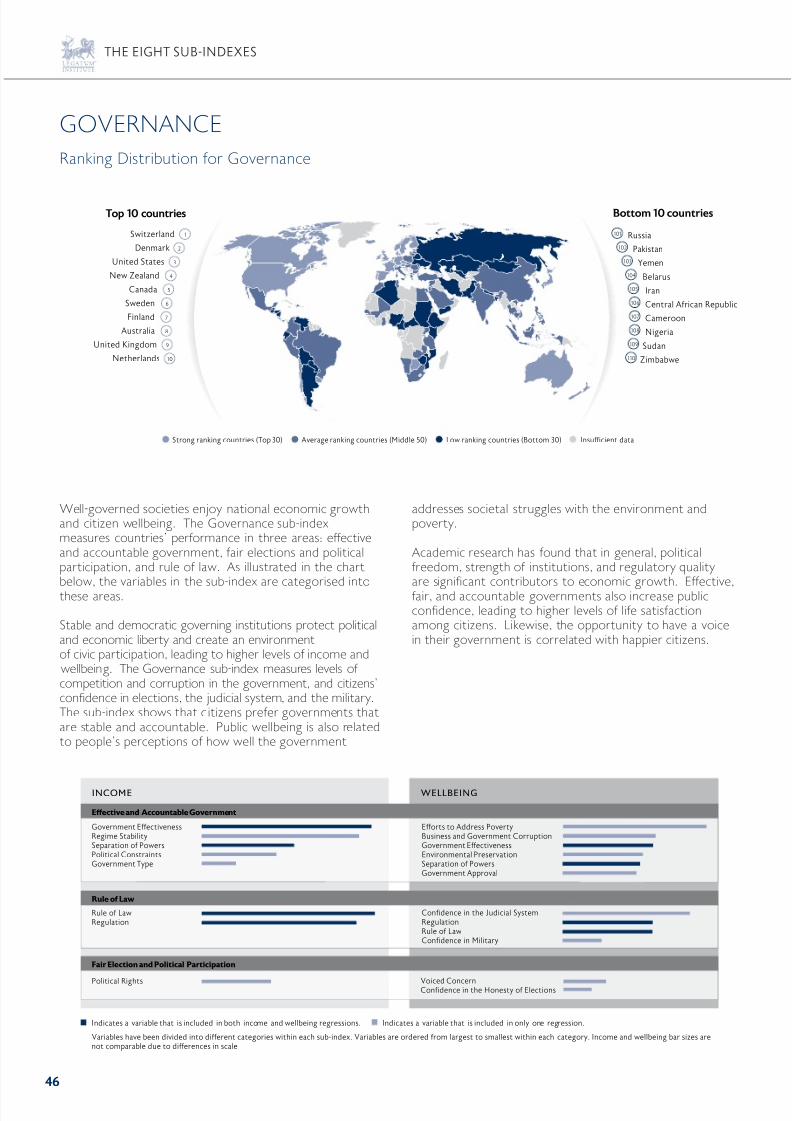
3.105
3.043
3.0362.771
2.748
2.535
2.414
2.397
2.395
2.389
2.332
2.323
2.076
2.060
2.0541.984
1.898
1.870
1.849
1.815
1.809
1.805
1.661
1.618
1.589
1.546
1.5221.519
1.479
1.433
1.355
1.354
1.313
1.279
1.213
1.192
1.125
1.061
0.909
0.872
0.871
0.866
0.848
0.784
0.782
0.705
0.698
0.665
0.660
0.612
0.579
0.485
0.439
0.375
0.295
0.218
0.184
0.1780.130
0.090
0.074
0.031
-0.012
-0.027
-0.048
-0.050
-0.083
-0.136
-0.137
-0.197-0.205
-0.280
-0.315
-0.373
-0.388
-0.458
-0.491
-0.561
-0.640
-0.706
-0.744
-0.744-1.007
-1.008
-1.100
-1.115
-1.132
-1.693
-1.855
-2.054
-2.332
-2.336
-2.407
-2.594
-2.595
-2.639
-2.732
-2.837
-2.987
-3.034
-3.136
-3.705
-3.723
-3.755
-4.090
-4.183
-4.199
-4.200
-4.486
-5.783
Ranking Country CountryScore
Ranking Country CountryScore
-9
-7
-5
-3
-1
1
3
5
0
New Zealand
(1), 3.105
Kuwait
(55), 0.295
Central African
Republic
(110), -5.783
Numbers in brackets indicateProsperity Index ranking
E d u c a t i o n S u b - i n d e x S c o r e s
Distribution of Country Scores
8/6/2019 Prosperity Index Eight Sub Indexes
http://slidepdf.com/reader/full/prosperity-index-eight-sub-indexes 10/17
THE EIGHT SUB-INDEXES
50
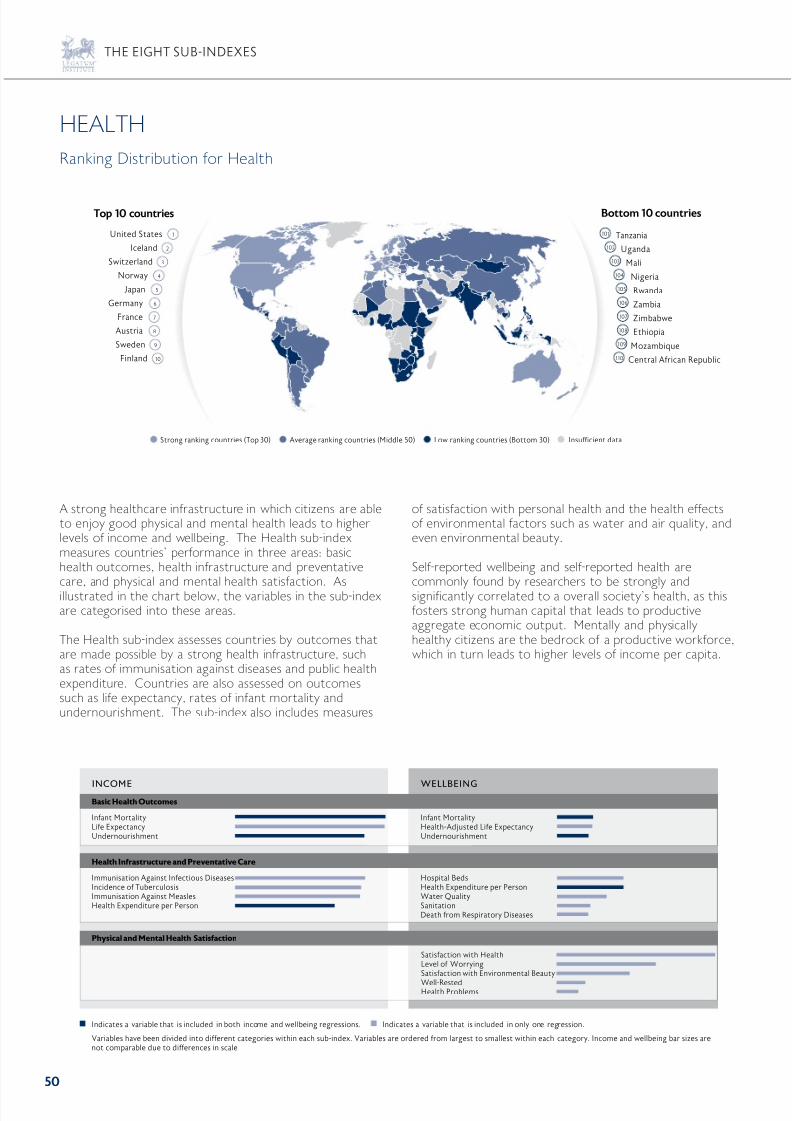
HEALTH
A strong healthcare infrastructure in which citizens are ableto enjoy good physical and mental health leads to higherlevels of income and wellbeing. The Health sub-indexmeasures countries’ performance in three areas: basichealth outcomes, health infrastructure and preventativecare, and physical and mental health satisfaction. Asillustrated in the chart below, the variables in the sub-indexare categorised into these areas.
The Health sub-index assesses countries by outcomes thatare made possible by a strong health infrastructure, suchas rates of immunisation against diseases and public healthexpenditure. Countries are also assessed on outcomessuch as life expectancy, rates of infant mortality andundernourishment. The sub-index also includes measures
of satisfaction with personal health and the health effectsof environmental factors such as water and air quality, andeven environmental beauty.
Self-reported wellbeing and self-reported health arecommonly found by researchers to be strongly andsignificantly correlated to a overall society’s health, as thisfosters strong human capital that leads to productiveaggregate economic output. Mentally and physicallyhealthy citizens are the bedrock of a productive workforce, which in turn leads to higher levels of income per capita.
Tanzania
Uganda
Mali
Nigeria
Rwanda
Zambia
Zimbabwe
Ethiopia
Mozambique
Central African Republic
United States
Iceland
Switzerland
Norway
Japan
Germany
France
Austria
Sweden
Finland
Bottom 10 countries
110
109
108
107
106
105
104
103
102
1011
2
3
4
5
6
7
8
9
10
Top 10 countries
Strong ranking countries (Top 30) Average ranking countries (Middle 50) Low ranking countries (Bottom 30) Insufficient data
Basic Health Outcomes
Infant MortalityHealth-Adjusted Life ExpectancyUndernourishment
Hospital BedsHealth Expenditure per PersonWater QualitySanitationDeath from Respiratory Diseases
Infant MortalityLife ExpectancyUndernourishment
Health Infrastructure and Preventative Care
Immunisation Against Infectious DiseasesIncidence of TuberculosisImmunisation Against MeaslesHealth Expenditure per Person
Indicates a variable that is included in both income and wellbeing regressions. Indicates a variable that is included in only one regression.
Variables have been divided into different categories within each sub-index. Variables are ordered from largest to smallest within each category. Income and wellbeing bar sizes arenot comparable due to differences in scale
INCOME WELLBEING
Physical and Mental Health Satisfaction
Satisfaction with HealthLevel of WorryingSatisfaction with Environmental Beauty
Well-RestedHealth Problems
Ranking Distribution for Health

8/6/2019 Prosperity Index Eight Sub Indexes
http://slidepdf.com/reader/full/prosperity-index-eight-sub-indexes 11/1751
United States
Iceland
SwitzerlandNorway
Japan
Germany
France
Austria
Sweden
Finland
Canada
Belgium
Netherlands
Ireland
AustraliaSlovenia
Denmark
Italy
New Zealand
United Kingdom
Czech Republic
Greece
Israel
Singapore
Spain
Taiwan
PortugalHungary
Slovakia
South Korea
Argentina
Poland
Croatia
Hong Kong
United Arab Emirates
Kuwait
Belarus
Lithuania
Estonia
Uruguay
Costa Rica
Latvia
Macedonia
Malaysia
Bulgaria
Chile
Russia
Ukraine
Saudi Arabia
Tunisia
Jordan
Syria
Romania
Mexico
Brazil
Kazakhstan
Turkey
BelizeUzbekistan
Iran
Trinidad and Tobago
Colombia
Panama
Thailand
El Salvador
China
Algeria
Jamaica
Egypt
MoroccoMoldova
Sri Lanka
Ecuador
Vietnam
Paraguay
Honduras
Guatemala
Venezuela
Lebanon
Dominican Republic
Philippines
PeruNicaragua
Indonesia
Mongolia
Bolivia
Nepal
South Africa
Ghana
Bangladesh
Pakistan
Sudan
Namibia
Yemen
India
Botswana
Senegal
Cambodia
Kenya
Cameroon
Tanzania
Uganda
Mali
Nigeria
Rwanda
Zambia
Zimbabwe
Ethiopia
Mozambique
Central African Republic
1
2
34
5
6
7
8
9
10
11
12
13
14
1516
17
18
19
20
21
22
23
24
25
26
2728
29
30
31
32
33
34
35
36
37
38
39
40
41
42
43
44
45
46
47
48
49
50
51
52
53
54
55
56
57
5859
60
61
62
63
64
65
66
67
68
69
7071
72
73
74
75
76
77
78
79
80
81
8283
84
85
86
87
88
89
90
91
92
93
94
95
96
97
98
99
100
101
102
103
104
105
106
107
108
109
110
3.103
2.750
2.7302.720
2.674
2.601
2.484
2.418
2.359
2.299
2.295
2.253
2.229
2.217
2.1572.020
1.905
1.892
1.844
1.783
1.772
1.748
1.747
1.745
1.729
1.591
1.5421.344
1.332
1.328
1.226
1.127
1.104
1.099
1.041
1.000
0.990
0.956
0.941
0.938
0.934
0.888
0.778
0.777
0.745
0.679
0.666
0.549
0.535
0.504
0.502
0.499
0.484
0.477
0.407
0.403
0.326
0.3120.258
0.255
0.216
0.200
0.134
0.094
0.087
0.081
0.064
0.036
0.020
-0.004-0.030
-0.039
-0.119
-0.365
-0.415
-0.451
-0.511
-0.579
-0.589
-0.665
-0.689
-0.708-0.842
-1.056
-1.458
-1.705
-1.769
-1.824
-1.908
-1.909
-2.262
-2.352
-2.389
-2.411
-2.437
-2.452
-2.944
-2.949
-3.086
-3.215
-3.285
-3.435
-3.494
-3.756
-3.863
-4.268
-4.455
-4.459
-4.725
-5.073
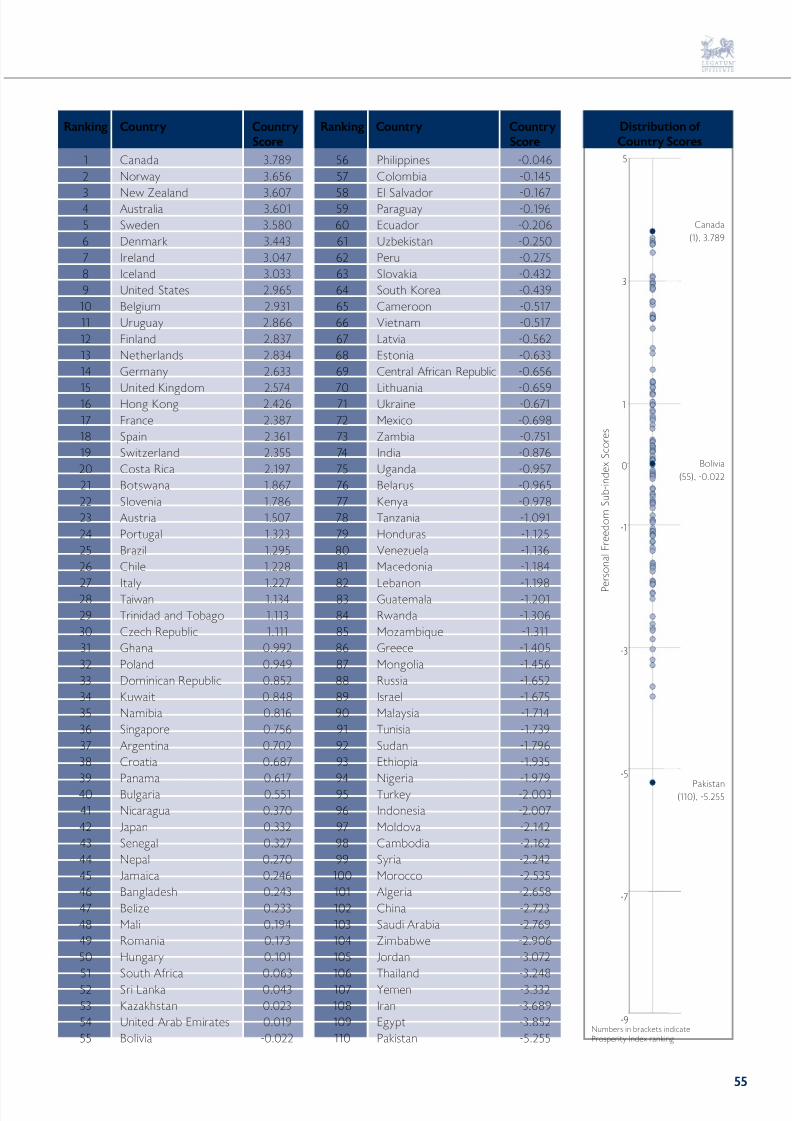
Ranking Country CountryScore
Ranking Country CountryScore
-9
-7
-5
-3
-1
1
3
5
0
United States
(1), 3.103
Brazil
(55), 0.407
Central African
Republic(110), -5.073
Numbers in brackets indicateProsperity Index ranking
H e a l t h S u b - i n d e x S c o r e s
Distribution of Country Scores

8/6/2019 Prosperity Index Eight Sub Indexes
http://slidepdf.com/reader/full/prosperity-index-eight-sub-indexes 12/17
THE EIGHT SUB-INDEXES
52
SAFETY & SECURITY
Societies plagued by threats to national security andpersonal safety cannot foster growth in average levels of income or wellbeing. The Safety and Security sub-indexmeasures countries’ performance in two areas: nationalsecurity and personal safety. As illustrated in the chartbelow, the variables in the sub-index are categorised intothese areas.
Stable economic environments are necessary for attractinginvestment and sustaining economic growth. In addition, when citizens worry about their personal safety or whetherthey will suffer for freely expressing their opinions, theiroverall wellbeing is diminished. The Safety and Securitysub-index combines objective measures of security withsubjective survey responses about personal safety. Stabilityresulting from national security, for example, is a keyelement in increasing per capita GDP in a country. Similarly,the ability to express political opinions without fear of
persecution, and feeling safe walking alone at night, arepositively correlated with higher levels of wellbeing.
When people and basic institutions are unsafe andunstable, then capital, investment, and people begin toflee. Scholars have shown that organised political violencesuch as riots, coups, and civil war, as well as general crimeand mistrust stemming from a lack of social cohesion,impede economic growth. In addition, conditions thatproduce fear and uncertainty negatively affect lifesatisfaction.
Sri Lanka
Central African Republic
Ethiopia
Nigeria
Pakistan
Uganda
Colombia
Sudan
Kenya
Zimbabwe
Iceland
Norway
Finland
Ireland
Singapore
Denmark
New Zealand
Sweden
Slovenia
Taiwan
Bottom 10 countries
110
109
108
107
106
105
104
103
102
1011
2
3
4
5
6
7
8
9
10
Top 10 countries
Strong ranking countries (Top 30) Average ranking countries (Middle 50) Low ranking countries (Bottom 30) Insufficient data
Indicates a variable that is included in both income and wellbeing regressions. Indicates a variable that is included in only one regression.
Variables have been divided into different categories within each sub-index. Variables are ordered from largest to smallest within each category. Income and wellbeing bar sizes arenot comparable due to differences in scale
National Security
Group GrievancesDemographic InstabilityState-Sponsored Political ViolenceHuman FlightRefugees and IDPsCivil War
Group GrievancesRefugees and IDPsState-Sponsored Political Violence
Personal Safety
Safe Walking Alone at NightExpress Political Opinion w/o FearAssault
AssaultProperty StolenSafe Walking Alone at Night
INCOME WELLBEING
Ranking Distribution for Safety & Security

8/6/2019 Prosperity Index Eight Sub Indexes
http://slidepdf.com/reader/full/prosperity-index-eight-sub-indexes 13/1753
Iceland
Norway
FinlandIreland
Singapore
Denmark
New Zealand
Sweden
Slovenia
Taiwan
Japan
Switzerland
Australia
Hong Kong
AustriaCanada
Portugal
Netherlands
Belgium
Germany
Poland
Uruguay
United Kingdom
United Arab Emirates
United States
Hungary
FranceCzech Republic
Kuwait
Italy
Greece
Slovakia
South Korea
Croatia
Lithuania
Estonia
Chile
Spain
Mongolia
Bulgaria
Panama
Argentina
Romania
Tunisia
Latvia
Vietnam
Kazakhstan
Costa Rica
Trinidad and Tobago
Macedonia
Ghana
Malaysia
Jamaica
Mali
Paraguay
Indonesia
Belize
UkraineBotswana
Belarus
Uzbekistan
Honduras
Senegal
Rwanda
Jordan
Cambodia
Namibia
Nicaragua
Morocco
El SalvadorSaudi Arabia
Peru
Mozambique
Moldova
Thailand
Brazil
Egypt
India
Mexico
Dominican Republic
Zambia
RussiaTurkey
Guatemala
Philippines
Syria
Nepal
Ecuador
Lebanon
Israel
Bolivia
China
Algeria
Bangladesh
Venezuela
Yemen
South Africa
Tanzania
Iran
Cameroon
Sri Lanka
Central African Republic
Ethiopia
Nigeria
Pakistan
Uganda
Colombia
Sudan
Kenya
Zimbabwe
1
2
34
5
6
7
8
9
10
11
12
13
14
1516
17
18
19
20
21
22
23
24
25
26
2728
29
30
31
32
33
34
35
36
37
38
39
40
41
42
43
44
45
46
47
48
49
50
51
52
53
54
55
56
57
5859
60
61
62
63
64
65
66
67
68
69
7071
72
73
74
75
76
77
78
79
80
81
8283
84
85
86
87
88
89
90
91
92
93
94
95
96
97
98
99
100
101
102
103
104
105
106
107
108
109
110
3.940
3.843
3.6443.598
3.439
3.202
3.046
3.036
2.944
2.930
2.926
2.826
2.792
2.696
2.6342.634
2.569
2.343
2.208
2.149
2.101
2.057
1.894
1.766
1.739
1.720
1.6751.646
1.464
1.402
1.374
1.326
1.232
1.134
1.056
1.015
0.999
0.982
0.718
0.640
0.535
0.523
0.515
0.499
0.416
0.333
0.278
0.219
0.106
0.096
0.058
0.044
0.021
0.012
-0.164
-0.187
-0.295
-0.346-0.350
-0.409
-0.467
-0.604
-0.633
-0.662
-0.672
-0.702
-0.731
-0.775
-0.865
-0.906-1.040
-1.040
-1.054
-1.056
-1.064
-1.272
-1.353
-1.438
-1.469
-1.523
-1.577
-1.588-1.604
-1.650
-1.694
-1.709
-1.729
-1.789
-1.824
-1.831
-1.847
-1.878
-1.883
-1.946
-1.950
-1.950
-1.953
-1.984
-2.111
-2.337
-2.669
-2.771
-2.830
-3.071
-3.178
-3.311
-3.481
-3.761
-3.776
-4.233
Ranking Country CountryScore
Ranking Country CountryScore
-9
-7
-5
-3
-1
1
3
5
0
Iceland
(1), 3.940
Paraguay
(55), -0.164
Zimbabwe
(110), -4.233
Numbers in brackets indicateProsperity Index ranking
S
a f e t y & S e c u r i t y S u b - i n d e x S c o r e s
Distribution of Country Scores

8/6/2019 Prosperity Index Eight Sub Indexes
http://slidepdf.com/reader/full/prosperity-index-eight-sub-indexes 14/17
THE EIGHT SUB-INDEXES
54
PERSONAL FREEDOM
When citizens enjoy their rights to expression, belief,organisation, and personal autonomy in a society welcoming of diversity, their country enjoys higher levelsof income and social wellbeing. The Personal Freedomsub-index measures countries’ performance in two areas:individual freedom and social tolerance. As illustrated inthe chart below, the variables in the sub-index arecategorised into these areas.
The Personal Freedom sub-index assesses the effects of freedom of choice, expression, belief, and movement on acountry’s per capital GDP and the subjective wellbeing of its citizens. It also assesses how the levels of tolerance forboth minorities and immigrants affect countries’ economicgrowth and citizen satisfaction. A strong empirical linkexists between individuals’ freedom to choose what to do, where to go, what to believe, and overall life satisfaction.
There is also a strong link between the levels of tolerance within a society for ethnic, cultural, and religious diversity,and the overall satisfaction people enjoy within thatsociety.
Societies that strengthen civil rights and freedoms throughdemocratisation, have been shown to experience increasesin levels of satisfaction among their citizens. Whencitizens’ personal liberties are protected, a nation alsoenjoys higher levels of economic growth.
Algeria
China
Saudi Arabia
Zimbabwe
Jordan
Thailand
Yemen
Iran
Egypt
Pakistan
Canada
Norway
New Zealand
Australia
Sweden
Denmark
Ireland
Iceland
United States
Belgium
Bottom 10 countries
110
109
108
107
106
105
104
103
102
1011
2
3
4
5
6
7
8
9
10
Top 10 countries
Strong ranking countries (Top 30) Average ranking countries (Middle 50) Low ranking countries (Bottom 30) Insufficient data
Individual Freedom
Satisfaction with Freedom of ChoiceCivil Liberties
Civil Liberty andFree Choice
Perceived Social Tolerance
Tolerance for ImmigrantsTolerance for Minorities
Tolerance for ImmigrantsTolerance for Minorities
Indicates a variable that is included in both income and wellbeing regressions. Indicates a variable that is included in only one regression.
Variables have been divided into different categories within each sub-index. Variables are ordered from largest to smallest within each category. Income and wellbeing bar sizes arenot comparable due to differences in scale
INCOME WELLBEING
Ranking Distribution for Personal Freedom
8/6/2019 Prosperity Index Eight Sub Indexes
http://slidepdf.com/reader/full/prosperity-index-eight-sub-indexes 15/1755
Canada
Norway
New ZealandAustralia
Sweden
Denmark
Ireland
Iceland
United States
Belgium
Uruguay
Finland
Netherlands
Germany
United KingdomHong Kong
France
Spain
Switzerland
Costa Rica
Botswana
Slovenia
Austria
Portugal
Brazil
Chile
ItalyTaiwan
Trinidad and Tobago
Czech Republic
Ghana
Poland
Dominican Republic
Kuwait
Namibia
Singapore
Argentina
Croatia
Panama
Bulgaria
Nicaragua
Japan
Senegal
Nepal
Jamaica
Bangladesh
Belize
Mali
Romania
Hungary
South Africa
Sri Lanka
Kazakhstan
United Arab Emirates
Bolivia
Philippines
Colombia
El SalvadorParaguay
Ecuador
Uzbekistan
Peru
Slovakia
South Korea
Cameroon
Vietnam
Latvia
Estonia
Central African Republic
LithuaniaUkraine
Mexico
Zambia
India
Uganda
Belarus
Kenya
Tanzania
Honduras
Venezuela
Macedonia
LebanonGuatemala
Rwanda
Mozambique
Greece
Mongolia
Russia
Israel
Malaysia
Tunisia
Sudan
Ethiopia
Nigeria
Turkey
Indonesia
Moldova
Cambodia
Syria
Morocco
Algeria
China
Saudi Arabia
Zimbabwe
Jordan
Thailand
Yemen
Iran
Egypt
Pakistan
1
2
34
5
6
7
8
9
10
11
12
13
14
1516
17
18
19
20
21
22
23
24
25
26
2728
29
30
31
32
33
34
35
36
37
38
39
40
41
42
43
44
45
46
47
48
49
50
51
52
53
54
55
56
57
5859
60
61
62
63
64
65
66
67
68
69
7071
72
73
74
75
76
77
78
79
80
81
8283
84
85
86
87
88
89
90
91
92
93
94
95
96
97
98
99
100
101
102
103
104
105
106
107
108
109
110
3.789
3.656
3.6073.601
3.580
3.443
3.047
3.033
2.965
2.931
2.866
2.837
2.834
2.633
2.5742.426
2.387
2.361
2.355
2.197
1.867
1.786
1.507
1.323
1.295
1.228
1.2271.134
1.113
1.111
0.992
0.949
0.852
0.848
0.816
0.756
0.702
0.687
0.617
0.551
0.370
0.332
0.327
0.270
0.246
0.243
0.233
0.194
0.173
0.101
0.063
0.043
0.023
0.019
-0.022
-0.046
-0.145
-0.167-0.196
-0.206
-0.250
-0.275
-0.432
-0.439
-0.517
-0.517
-0.562
-0.633
-0.656
-0.659-0.671
-0.698
-0.751
-0.876
-0.957
-0.965
-0.978
-1.091
-1.125
-1.136
-1.184
-1.198-1.201
-1.306
-1.311
-1.405
-1.456
-1.652
-1.675
-1.714
-1.739
-1.796
-1.935
-1.979
-2.003
-2.007
-2.142
-2.162
-2.242
-2.535
-2.658
-2.723
-2.769
-2.906
-3.072
-3.248
-3.332
-3.689
-3.852
-5.255
Ranking Country CountryScore
Ranking Country CountryScore
-9
-7
-5
-3
-1
1
3
5
0
Canada
(1), 3.789
Bolivia
(55), -0.022
Pakistan(110), -5.255
Numbers in brackets indicateProsperity Index ranking
P
e r s o n a l F r e e d o m S
u b - i n d e x S c o r e s
Distribution of Country Scores

8/6/2019 Prosperity Index Eight Sub Indexes
http://slidepdf.com/reader/full/prosperity-index-eight-sub-indexes 16/17
THE EIGHT SUB-INDEXES
56
SOCIAL CAPITAL
Social networks and the cohesion that a societyexperiences when people trust one another have a directeffect on the prosperity of a country. The Social Capitalsub-index measures countries’ performances in two areas:social cohesion and engagement, as well as communityand family networks. As illustrated in the chart below, the variables in the sub-index are categorised into these areas.
This sub-index assesses how factors like volunteering,helping strangers, and donating to charitable organisationsimpacts the economic and life satisfaction of the populaceas a whole. The sub-index also evaluates the levels of trustin a society and the manner in which citizens believe theycan rely on others, and it assesses how marriage andreligiosity provide support networks that improve wellbeing.
Empirical studies on the impact of social capital haveshown that citizen wellbeing is improved through socialtrust, family and community ties, and membership withincivic groups. Religious communities are also an importantelement in the creation of social capital. And societies with lower levels of social capital have been shown toexperience lower levels of economic growth. The use of the term “capital” in “social capital” reflects an importantreality: social networks are an asset that produceseconomic and wellbeing returns.
Ghana
Cameroon
Central African Republic
El Salvador
India
Iran
Rwanda
Turkey
Bangladesh
Pakistan
Norway
Denmark
New Zealand
Australia
Netherlands
Switzerland
Finland
Canada
United Kingdom
Ireland
Bottom 10 countries
110
109
108
107
106
105
104
103
102
1011
2
3
4
5
6
7
8
9
10
Top 10 countries
Strong ranking countries (Top 30) Average ranking countries (Middle 50) Low ranking countries (Bottom 30) Insufficient data
Societal Cohesion and Engagement
Trust in OthersDonationsFormal VolunteeringHelping Strangers
Formal VolunteeringHelping StrangersDonations
Community and Family Networks
Perceptions of Social SupportMarriage
Religious Attendance
Perceptions of Social Support
Indicates a variable that is included in both income and wellbeing regressions. Indicates a variable that is included in only one regression.
Variables have been divided into different categories within each sub-index. Variables are ordered from largest to smallest within each category. Income and wellbeing bar sizes arenot comparable due to differences in scale
INCOME WELLBEING
Ranking Distribution for Social Capital

8/6/2019 Prosperity Index Eight Sub Indexes
http://slidepdf.com/reader/full/prosperity-index-eight-sub-indexes 17/17
Norway
Denmark
New ZealandAustralia
Netherlands
Switzerland
Finland
Canada
United Kingdom
Ireland
Sweden
United States
Morocco
Iceland
AustriaGermany
Israel
Saudi Arabia
Belgium
Thailand
Sudan
Uzbekistan
Belarus
Hong Kong
Poland
Mongolia
ChinaKuwait
Sri Lanka
Italy
Japan
Czech Republic
Kazakhstan
Uruguay
Spain
United Arab Emirates
Panama
Slovenia
Mexico
Slovakia
Croatia
France
Estonia
Indonesia
Costa Rica
Venezuela
Argentina
Guatemala
Lithuania
Belize
Jamaica
Taiwan
Russia
Singapore
Hungary
Brazil
Mali
TanzaniaSouth Korea
Botswana
Paraguay
Colombia
Portugal
Chile
Uganda
Dominican Republic
Senegal
Vietnam
Tunisia
NamibiaSouth Africa
Trinidad and Tobago
Ukraine
Algeria
Syria
Moldova
Kenya
Bolivia
Yemen
Bulgaria
Honduras
PhilippinesJordan
Nepal
Ethiopia
Macedonia
Nicaragua
Zimbabwe
Nigeria
Malaysia
Zambia
Latvia
Mozambique
Romania
Egypt
Ecuador
Cambodia
Peru
Lebanon
Greece
Ghana
Cameroon
Central African Republic
El Salvador
India
Iran
Rwanda
Turkey
Bangladesh
Pakistan
1
2
34
5
6
7
8
9
10
11
12
13
14
1516
17
18
19
20
21
22
23
24
25
26
2728
29
30
31
32
33
34
35
36
37
38
39
40
41
42
43
44
45
46
47
48
49
50
51
52
53
54
55
56
57
5859
60
61
62
63
64
65
66
67
68
69
7071
72
73
74
75
76
77
78
79
80
81
8283
84
85
86
87
88
89
90
91
92
93
94
95
96
97
98
99
100
101
102
103
104
105
106
107
108
109
110
4.473
4.162
4.0303.729
3.642
3.604
3.419
3.285
3.043
2.860
2.844
2.757
2.526
2.495
2.4461.966
1.775
1.530
1.515
1.442
1.302
1.072
1.051
1.050
1.011
0.991
0.8480.792
0.778
0.774
0.684
0.636
0.599
0.559
0.487
0.485
0.294
0.289
0.288
0.183
0.152
0.137
0.132
0.083
0.065
0.037
0.006
-0.019
-0.051
-0.062
-0.065
-0.066
-0.100
-0.110
-0.179
-0.181
-0.201
-0.209-0.246
-0.325
-0.366
-0.380
-0.385
-0.396
-0.464
-0.465
-0.466
-0.467
-0.475
-0.484-0.532
-0.570
-0.582
-0.605
-0.787
-0.793
-0.882
-0.924
-0.957
-0.959
-0.974
-1.021-1.031
-1.062
-1.096
-1.152
-1.170
-1.309
-1.325
-1.363
-1.494
-1.574
-1.574
-1.579
-1.633
-1.655
-1.739
-1.830
-1.836
-1.905
-2.042
-2.054
-2.195
-2.216
-2.297
-3.004
-3.351
-3.444
-4.670
-4.977
Ranking Country CountryScore
Ranking Country CountryScore
-9
-7
-5
-3
-1
1
3
5
0
Norway(1), 4.473
Hungary
(55), -0.179
Pakistan
(110), -4.977
Numbers in brackets indicateProsperity Index ranking
S
o c i a l C a p i t a l S u b - i n d e x S c o r e s
Distribution of Country Scores