Validation of a Process-Based Agro-Ecosystem Model (Agro ...
Upload
cathleen-petersCategory
view
217download
1
Prospects for world supply & demand of vegetable oils - global challenges and implications for theoil palm agro-industry
Peter Thoenes Trade and Markets Division Food and Agriculture Organization of the U.N.
Oilc
rop
s m
arke
t o
utl
oo
k an
d o
il p
alm
ch
alle
ng
es
Overview
1. Medium-term outlook for the global oilcrop market2. Global food demand, food security, resource issues and
climate change3. The case of oil palm
4. Emerging recommendations
2
Oilc
rop
s m
arke
t o
utl
oo
k an
d o
il p
alm
ch
alle
ng
es 1. Medium-term outlook for the global oilcrop market
a) Price projectionsb) Supply projectionsc) Demand projections (incl. biofuel)d) Trade Projectionse) Sources of uncertainty
• model-based projections generated by OECD-FAO• entire agricultural sector, including biofuel• only four main oilcrops & products covered• 10-year horizon 2009-2018
focus on vegoils ... palm oil3
Oilc
rop
s m
arke
t o
utl
oo
k an
d o
il p
alm
ch
alle
ng
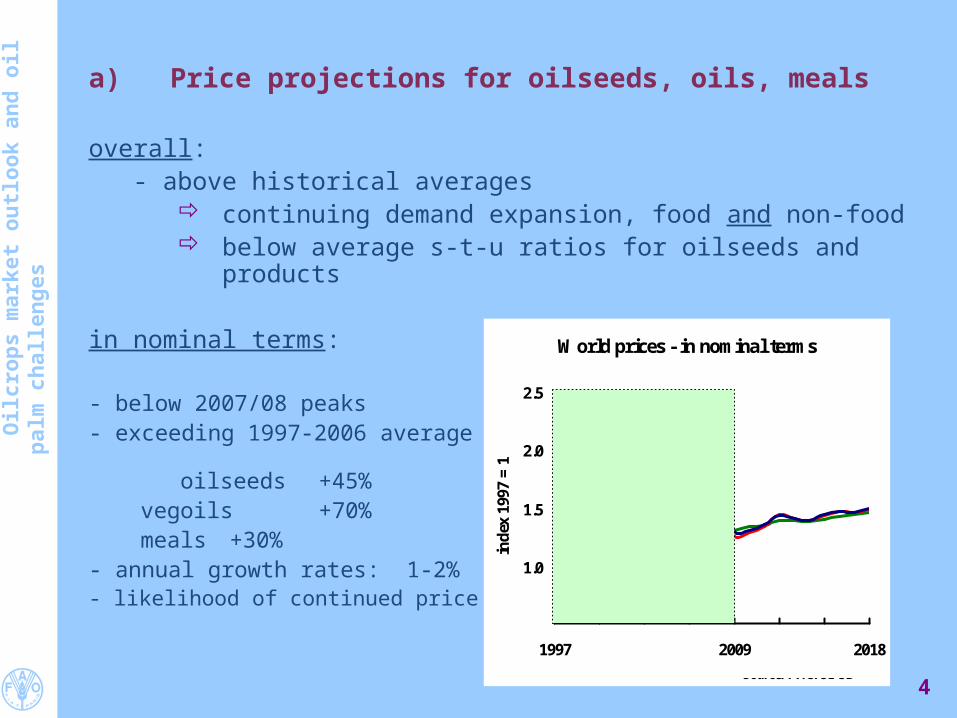
es a) Price projections for oilseeds, oils, meals
overall:- above historical averages
continuing demand expansion, food and non-food below average s-t-u ratios for oilseeds and products
in nominal terms:
- below 2007/08 peaks- exceeding 1997-2006 average
oilseeds +45%vegoils +70%meals +30%
- annual growth rates: 1-2%- likelihood of continued price volatility
4
World prices - in nominal terms
0.5
1.0
1.5
2.0
2.5
1997 2000 2003 2006 2009 2012 2015 2018
ind
ex 1
997
= 1
Vegetable Oils
Oilseeds
Oilseed meals
Source: FAO/OECD
Oilc
rop
s m
arke
t o
utl
oo
k an
d o
il p
alm
ch
alle
ng
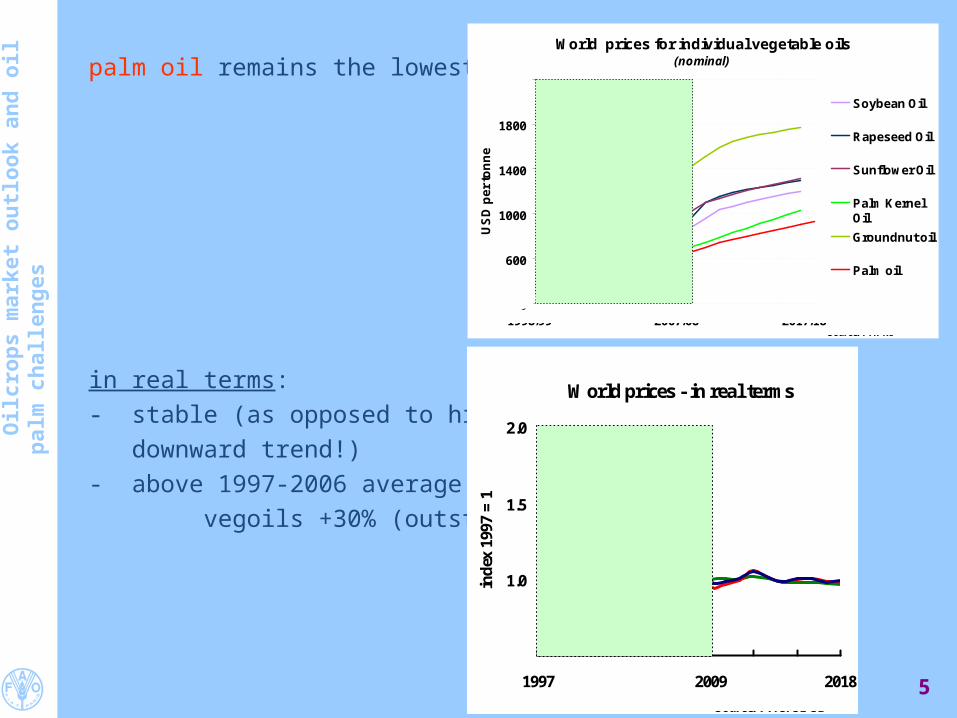
es palm oil remains the lowest-priced oil
in real terms:- stable (as opposed to historical downward trend!)- above 1997-2006 average: vegoils +30% (outstanding!)
5
World prices for individual vegetable oils(nominal)
200
600
1000
1400
1800
2200
US
D p
er
ton
ne
Soybean Oil
Rapeseed Oil
Sunflower Oil
Palm KernelOil
Groundnut oil
Palm oil
1998/99 2007/08 2017/18Source: FAPRI
World prices - in real terms
0.5
1.0
1.5
2.0
1997 2000 2003 2006 2009 2012 2015 2018
ind
ex 1
997
= 1
Vegetable Oils
Oilseeds
Oilseed meals
Source: FAO/OECD
Oilc
rop
s m
arke
t o
utl
oo
k an
d o
il p
alm
ch
alle
ng
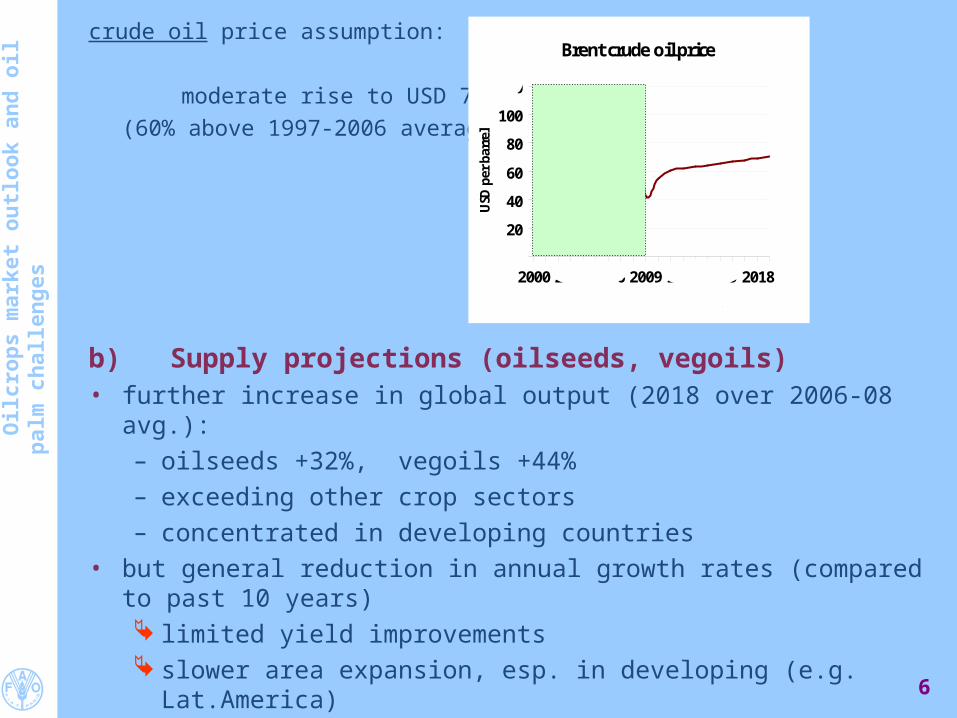
escrude oil price assumption:
moderate rise to USD 70 in 2018(60% above 1997-2006 average)
b) Supply projections (oilseeds, vegoils)• further increase in global output (2018 over 2006-08 avg.):
– oilseeds +32%, vegoils +44% – exceeding other crop sectors– concentrated in developing countries
• but general reduction in annual growth rates (compared to past 10 years) limited yield improvements slower area expansion, esp. in developing (e.g. Lat.America)
6
Brent crude oil price
0
20
40
60
80
100
120
2000 2003 2006 2009 2012 2015 2018
USD
per
bar
rel
Source: USEIA, OECD
Oilc
rop
s m
arke
t o
utl
oo
k an
d o
il p
alm
ch
alle
ng
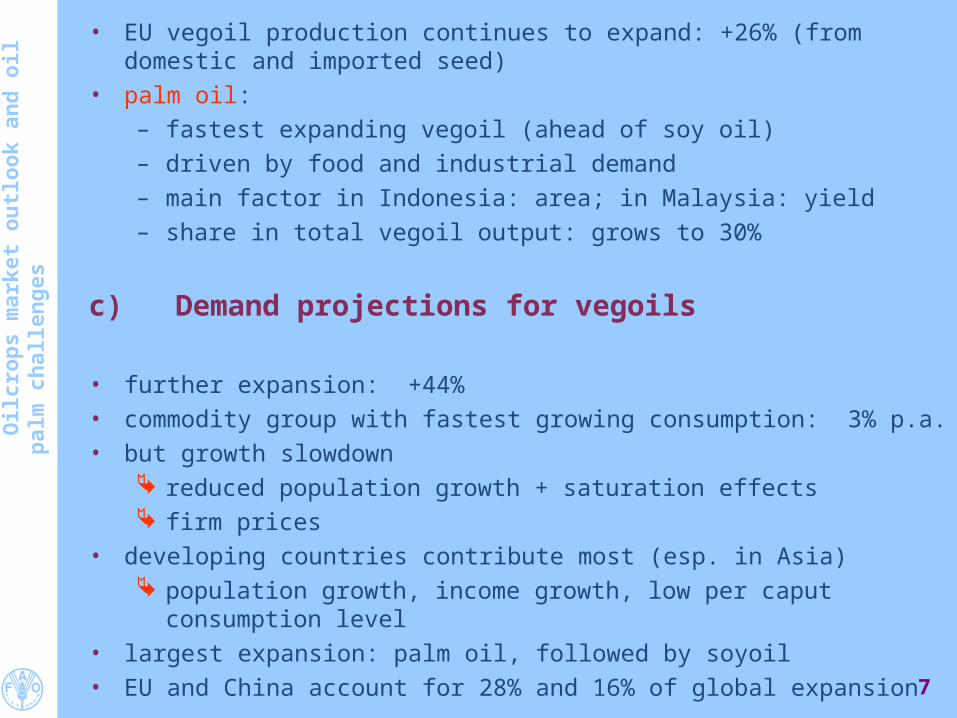
es• EU vegoil production continues to expand: +26% (from domestic and imported seed)• palm oil:
– fastest expanding vegoil (ahead of soy oil)– driven by food and industrial demand– main factor in Indonesia: area; in Malaysia: yield – share in total vegoil output: grows to 30%
c) Demand projections for vegoils
• further expansion: +44%• commodity group with fastest growing consumption: 3% p.a.• but growth slowdown
reduced population growth + saturation effects firm prices
• developing countries contribute most (esp. in Asia) population growth, income growth, low per caput consumption level
• largest expansion: palm oil, followed by soyoil• EU and China account for 28% and 16% of global expansion
7
Oilc
rop
s m
arke
t o
utl
oo
k an
d o
il p
alm
ch
alle
ng
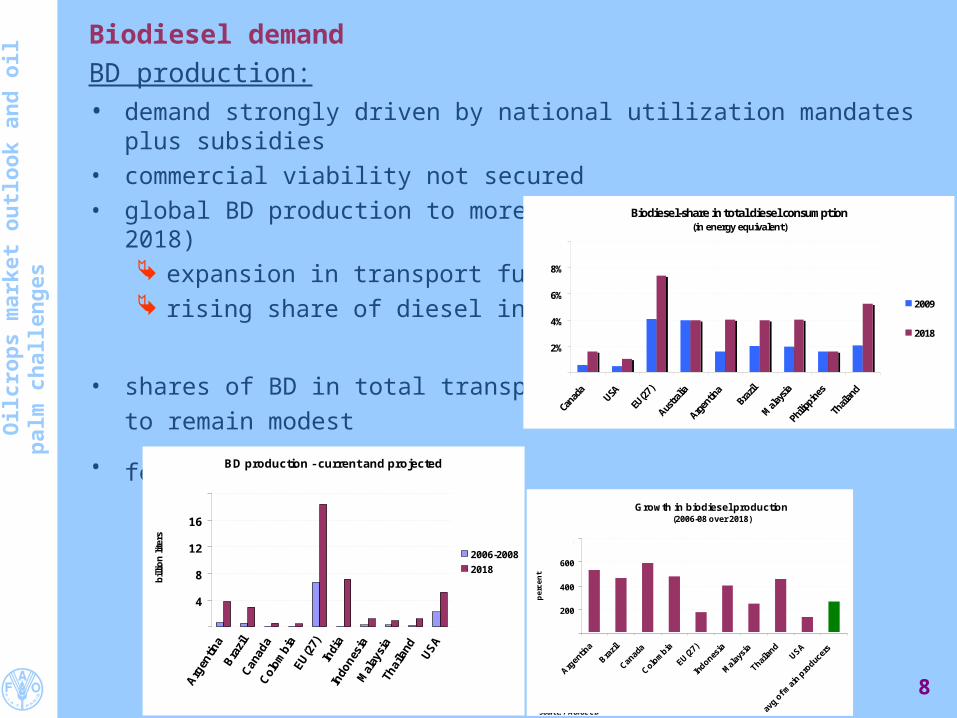
esBiodiesel demandBD production:• demand strongly driven by national utilization mandates plus subsidies• commercial viability not secured• global BD production to more than double: +127% (2009-2018)
expansion in transport fuel rising share of diesel in transp. fuel
• shares of BD in total transport fuelto remain modest
• few important players:
8
BD production - current and projected
0
4
8
12
16
20
Arg
entin
a
Bra
zil
Can
ada
Col
ombi
a
EU(2
7)
Indi
a
Indo
nesi
a
Mal
aysi
a
T
haila
nd
US
A
bill
ion
lite
rs
2006-2008
2018
Source: FAO/OECD
Growth in biodiesel production(2006-08 over 2018)
0
200
400
600
800
Arg
entin
a
Bra
zil
Canad
a
Col
ombia
EU(27)
Indones
ia
Mal
aysi
a
Thai
land
USA
avg o
f mai
n pro
ducer
s
pe
rce
nt
Source: FAO/OECD
.
Biodiesel-share in total diesel consumption(in energy equivalent)
0%
2%
4%
6%
8%
10%
2009
2018
Source: FAO/OECD
Oilc
rop
s m
arke
t o
utl
oo
k an
d o
il p
alm
ch
alle
ng
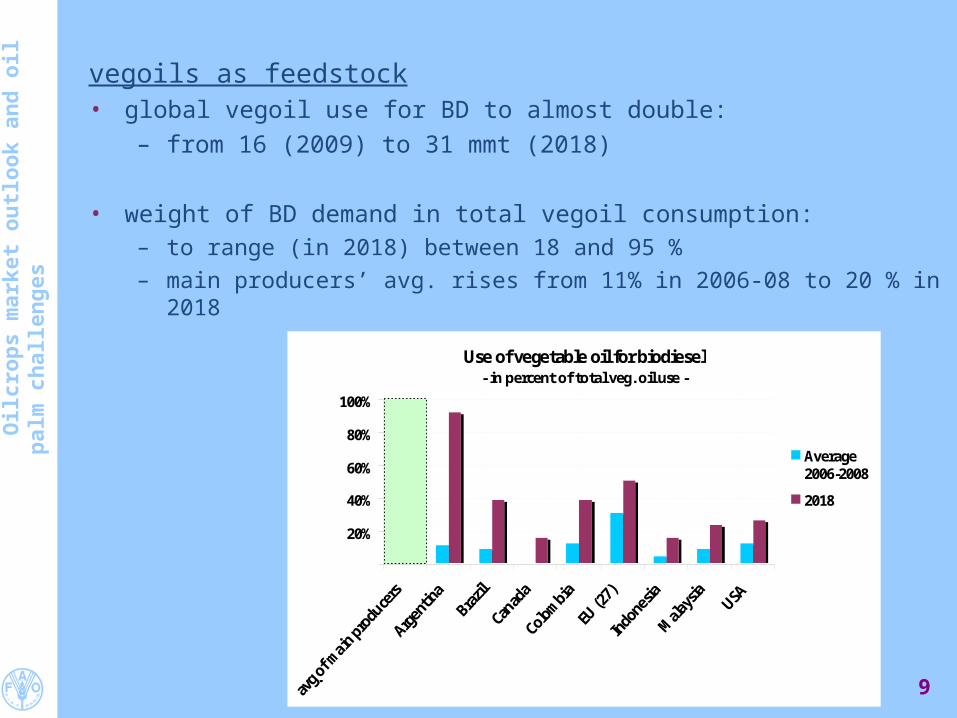
es vegoils as feedstock• global vegoil use for BD to almost double:
– from 16 (2009) to 31 mmt (2018)
• weight of BD demand in total vegoil consumption:– to range (in 2018) between 18 and 95 %– main producers’ avg. rises from 11% in 2006-08 to 20 % in 2018
9
Use of vegetable oil for biodiesel- in percent of total veg. oil use -
0%
20%
40%
60%
80%
100%
avg of m
ain produce
rsArge
ntina
Brazil
Canad
aColombia
EU (2
7)IndonesiaM
alays
ia
USA
Average2006-2008
2018
Source: FAO/OECD.
Oilc
rop
s m
arke
t o
utl
oo
k an
d o
il p
alm
ch
alle
ng
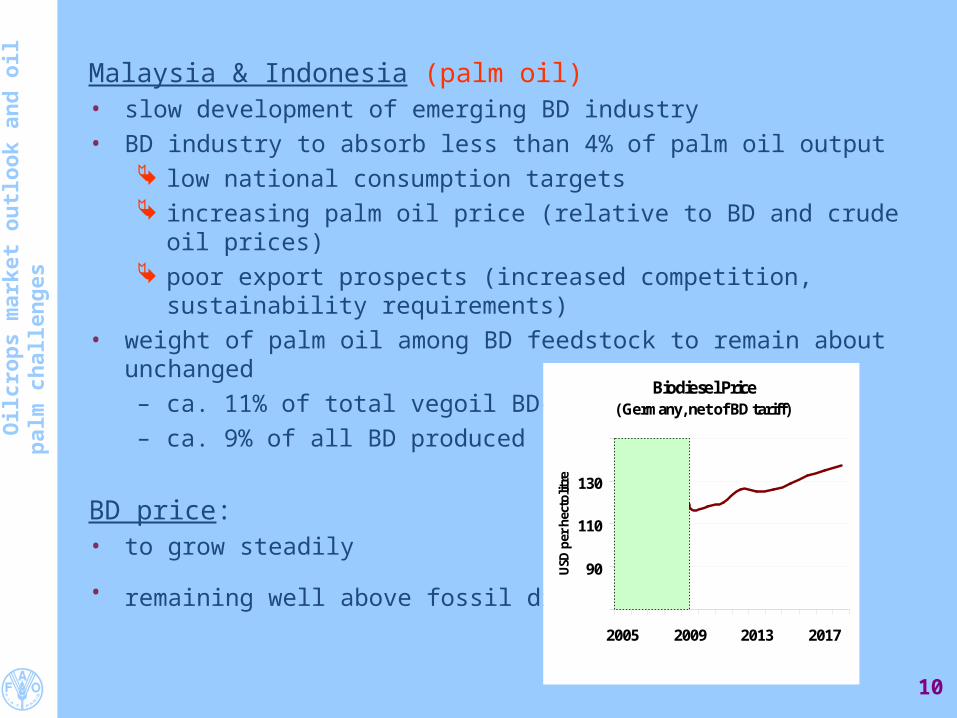
es Malaysia & Indonesia (palm oil)• slow development of emerging BD industry• BD industry to absorb less than 4% of palm oil output
low national consumption targets increasing palm oil price (relative to BD and crude oil prices) poor export prospects (increased competition, sustainability requirements)
• weight of palm oil among BD feedstock to remain about unchanged– ca. 11% of total vegoil BD-use– ca. 9% of all BD produced
BD price:• to grow steadily
• remaining well above fossil diesel prices
10
Biodiesel Price( Germany, net of BD tariff)
70
90
110
130
150
2005 2009 2013 2017
USD
per
hec
tolit
re
Source: FAO/OECD
Oilc
rop
s m
arke
t o
utl
oo
k an
d o
il p
alm
ch
alle
ng
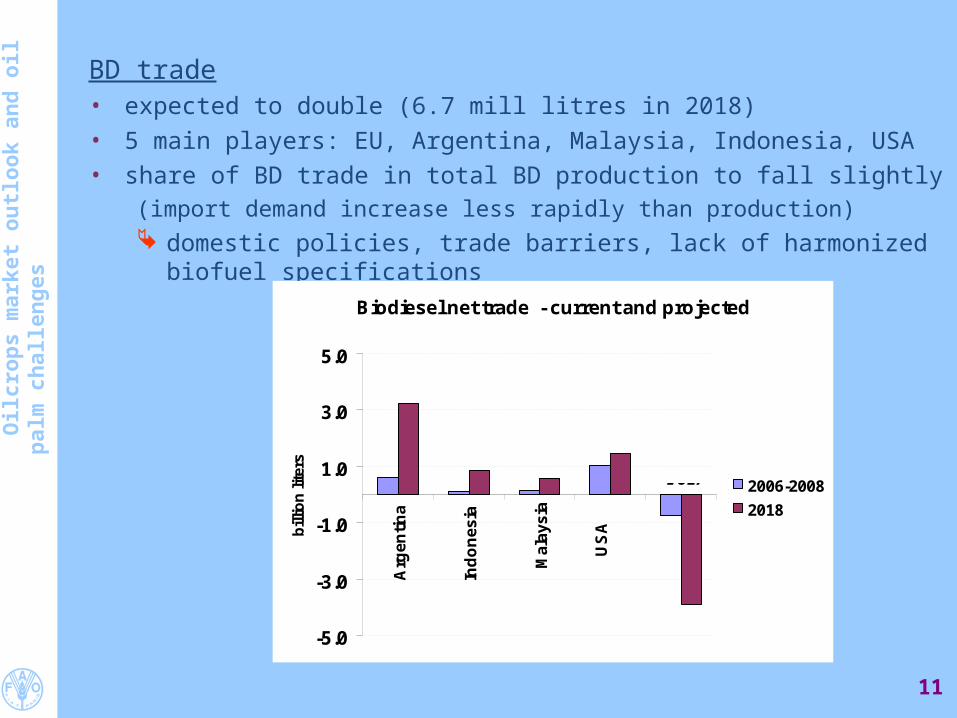
es BD trade• expected to double (6.7 mill litres in 2018)• 5 main players: EU, Argentina, Malaysia, Indonesia, USA• share of BD trade in total BD production to fall slightly
(import demand increase less rapidly than production) domestic policies, trade barriers, lack of harmonized biofuel specifications
11
Biodiesel net trade - current and projected
-5.0
-3.0
-1.0
1.0
3.0
5.0
A
rge
nti
na
Ind
on
es
ia
Ma
lay
sia
US
A
bill
ion
lite
rs
2006-2008
2018
EU27
Source: FAO/OECD
Oilc
rop
s m
arke
t o
utl
oo
k an
d o
il p
alm
ch
alle
ng
esd) Trade projections (major vegoils)
• 50% expansion– production in main comsumption regions not keeping up with demand– fastest growing commodity– BF production triggers additional import demand
• lead of developing countries • continued expansion in South-South trade• palm oil: remains most traded vegoil
Export market:• 3 countries to supply 75%: Indonesia, Malaysia, Argentina • Indonesia & Malaysia (palm oil)
– 4-5% annual growth– 80-90% of domestic production exported
• Argentina & Brazil (soy oil)– moderate growth
• other sources of growth: Canada, USA, CIS nations 12
Oilc
rop
s m
arke
t o
utl
oo
k an
d o
il p
alm
ch
alle
ng
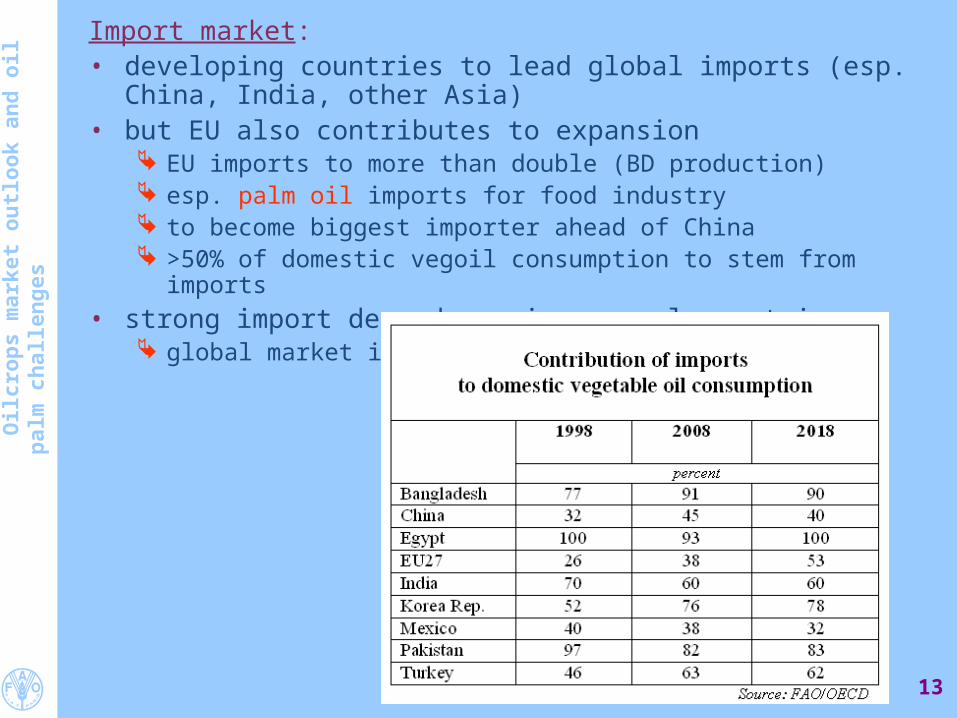
esImport market:• developing countries to lead global imports (esp. China, India, other Asia)• but EU also contributes to expansion
EU imports to more than double (BD production) esp. palm oil imports for food industry to become biggest importer ahead of China >50% of domestic vegoil consumption to stem from imports
• strong import dependence in several countries global market instability
13
Oilc
rop
s m
arke
t o
utl
oo
k an
d o
il p
alm
ch
alle
ng
es e) Sources of uncertainty
• resumption of global economic growth: 2010 or later?• policy responses to global price volatility• high market concentration increases market instability • continued consumer concerns about environmental risks as well as GM
products• exposure to developments in the energy market:
higher crude oil priceslower crop production (via rising production costs)reduce food consumption (via higher crop prices)increase BD production
• land reallocations triggered by food/fuel competition
14
Oilc
rop
s m
arke
t o
utl
oo
k an
d o
il p
alm
ch
alle
ng
es 2. Global food demand, food security, resource issues and climate change
a) Food securityb) Global food demand, resource issues, climate change
15
Oilc
rop
s m
arke
t o
utl
oo
k an
d o
il p
alm
ch
alle
ng
esa) Food security
• good medium- and longer-term market prospects– stable/slightly rising commodity prices– demand growth matched by production increase– developing nations participating in expansion of production, consumption and
trade• deterioration in world hunger and food security
– rise in number of people living below the hunger threshold– rising food prices
contributing factors:– temporary supply and demand imbalances– increased market instability– national interventions in markets– direct linkage energy & food prices– food/fuel competition– falling international investment flows– budgetary pressure on development aid– global economic slowdown
16
Oilc
rop
s m
arke
t o
utl
oo
k an
d o
il p
alm
ch
alle
ng
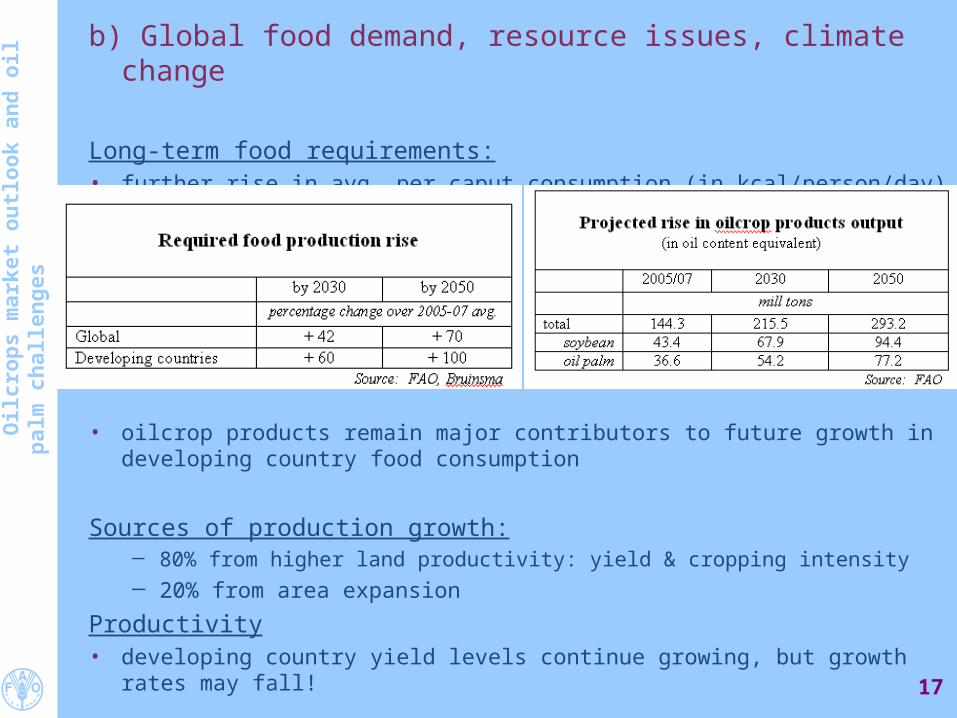
esb) Global food demand, resource issues, climate change
Long-term food requirements:• further rise in avg. per caput consumption (in kcal/person/day)
• oilcrop products remain major contributors to future growth in developing country food consumption
Sources of production growth:─ 80% from higher land productivity: yield & cropping intensity─ 20% from area expansion
Productivity• developing country yield levels continue growing, but growth rates may fall!
17
Oilc
rop
s m
arke
t o
utl
oo
k an
d o
il p
alm
ch
alle
ng
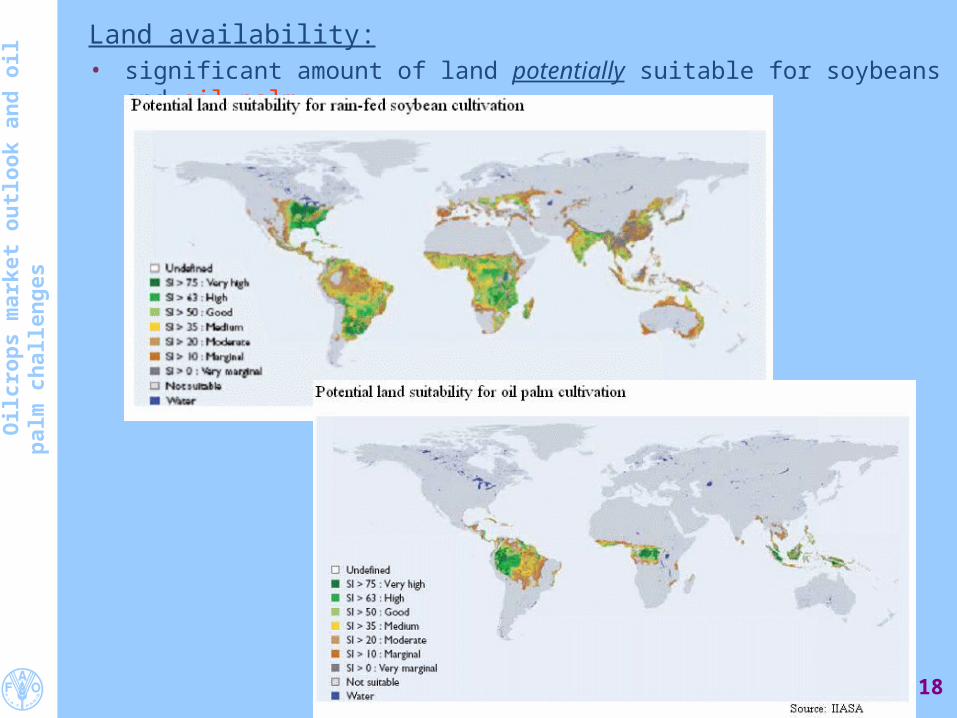
esLand availability:• significant amount of land potentially suitable for soybeans and oil palm
18
Oilc
rop
s m
arke
t o
utl
oo
k an
d o
il p
alm
ch
alle
ng
es
• actual land availability is limited competition among food crops, pasture uses, wood uses and other, new uses
(energy crops, crops with low carbon footprint) growing urban, industrial, infrastructural uses only part of the land has high or at least good yield potential considerable part of land consists of forest - conversion carries significant
social/environmental costs
Climate change:
• no consensus on ultimate net global impact on agric. production• global warming and changing rainfall patterns potentially
beneficial in high latitude regions damaging in low latitude tropical areas
• uncertainty regarding the effects of higher atmospheric CO2 concentration (carbon fertilization)
• consensus: – food security to be affected– considerable scope to improve resilience via adaptation – until 2050: increased risk of water stress; rising incidence of extreme weather
events– after 2050: significant impact on agr productivity (shifts in production frontiers)
and on the global food system19
Oilc
rop
s m
arke
t o
utl
oo
k an
d o
il p
alm
ch
alle
ng
es 3. The case of oil palm
a) Growth factors: productivity and areab) Area expansion issuesc) Productivity improvementd) Socio-economic dimensione) Palm oil as BD feedstock
20
Oilc
rop
s m
arke
t o
utl
oo
k an
d o
il p
alm
ch
alle
ng
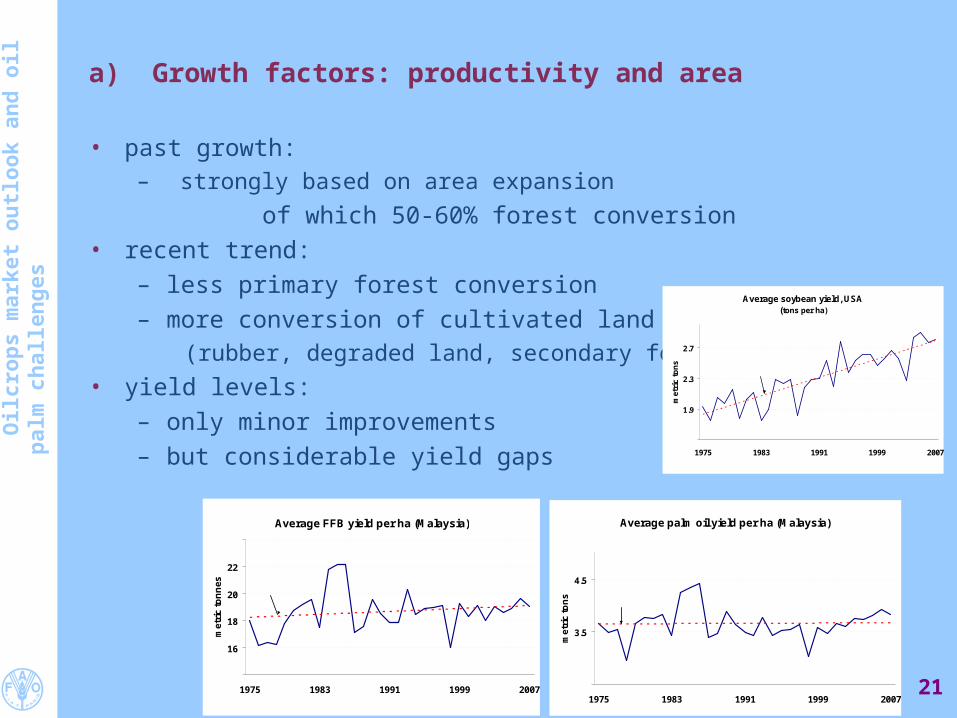
es a) Growth factors: productivity and area
• past growth:– strongly based on area expansion
of which 50-60% forest conversion• recent trend:
– less primary forest conversion– more conversion of cultivated land
(rubber, degraded land, secondary forests)• yield levels:
– only minor improvements – but considerable yield gaps
21
Average FFB yield per ha (Malaysia)
14
16
18
20
22
24
1975 1983 1991 1999 2007
me
tric
to
nn
es
linear trend
Source : MPOB
Average palm oil yield per ha (Malaysia)
2.5
3.5
4.5
1975 1983 1991 1999 2007
me
tric
to
ns
linear trend
Source : MPOB
Average soybean yield, USA(tons per ha)
1.5
1.9
2.3
2.7
1975 1983 1991 1999 2007
met
ric
ton
s
linear trend
Source : FAO
Oilc
rop
s m
arke
t o
utl
oo
k an
d o
il p
alm
ch
alle
ng
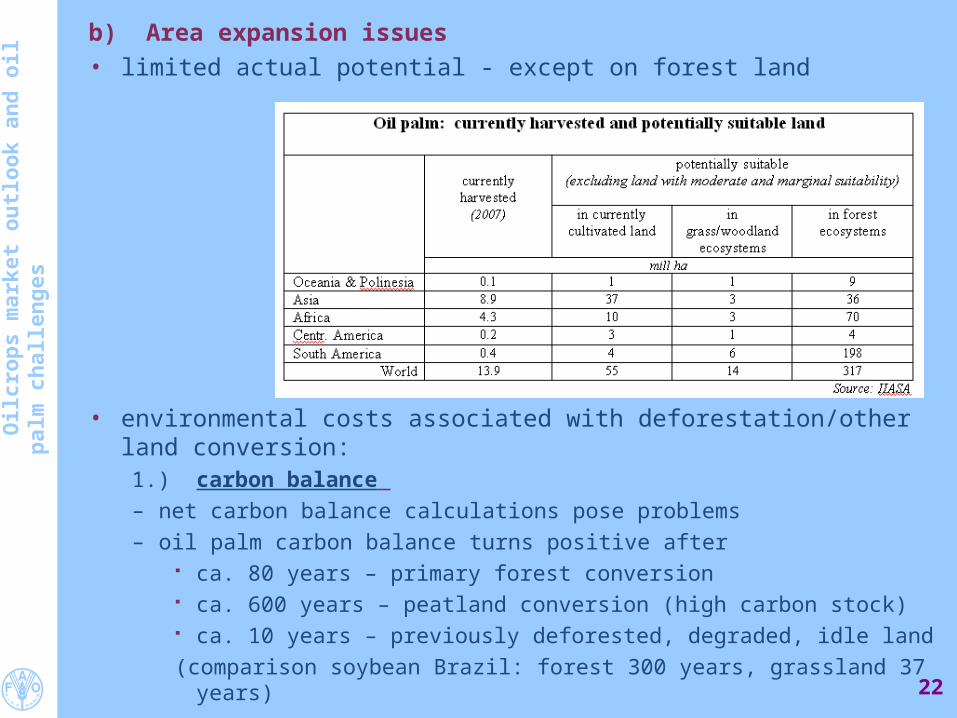
esb) Area expansion issues• limited actual potential - except on forest land
• environmental costs associated with deforestation/other land conversion:1.) carbon balance – net carbon balance calculations pose problems– oil palm carbon balance turns positive after
ca. 80 years – primary forest conversion ca. 600 years – peatland conversion (high carbon stock) ca. 10 years – previously deforested, degraded, idle land(comparison soybean Brazil: forest 300 years, grassland 37 years)
22
Oilc
rop
s m
arke
t o
utl
oo
k an
d o
il p
alm
ch
alle
ng
es 2.) reduction in biodiversity─ highest in forest conversion─ some improvement when degraded land is reclaimed
3.) additional problems associated with deforestation─ land fragmentation─ loss of forest habitats─ land clearing through fire (traditional method, cost effective, common
among smallholders)
c) Productivity improvement
1.) improved management practices─ esp. in smallholder oil palm cultivation (closing the yield gap)
typically using less productive land limited access to capital and labour limited access to technical/managerial know-how
23
Oilc
rop
s m
arke
t o
utl
oo
k an
d o
il p
alm
ch
alle
ng
es
2.) improved planting material─ smallholder access (closing yield gap) ─ traditional selection and breeding methods
19-year selection cycle limited supplies of improved material
─ genetic modification 2008 breakthrough: sequencing of oil palm genome much shorter selection cycle risk: GM opposition by end-consumers
d) Socio-economic aspects
• important benefits– employment and income generation– improved access to health care, education and other social services– attractive for smallholders (good return-to-input ratio)
• dangers associated with deforestation– erosion of traditional culture, income sources, self-sufficiency– conflicts over land tenure right
• workforce issues– labourers’ rights not respected– ethnic conflicts in case of migrant labourers
• smallholder dependence on large mills (setting the FFB price) 24
Oilc
rop
s m
arke
t o
utl
oo
k an
d o
il p
alm
ch
alle
ng
es e) Palm oil as BD feedstock
• lowest-priced feedstock with good energy efficiency
• competition from vegoils that enjoy direct policy support
• all vegoil feedstock (as well as ethanol feedstock) achieve limited net carbon savings compared to fossil fuels
esp. when counting direct/indirect land use changes• all food-crop based BF production affects food supply and food prices
rising market instabilitynegative repercussions on food security
• investment uncertainties:– further changes in policy interventions
(food security, environmental & budgetary considerations, standards)– future crude oil-vegoil price ratio
– advent of (replacement by) 2nd generation feedstock & technologies
25
Oilc
rop
s m
arke
t o
utl
oo
k an
d o
il p
alm
ch
alle
ng
es4. Emerging recommendations
a) National priorities
oil palm cultivation• minimize conversion of primary forests• encourage use of idle, degraded and other marginal land• promote best management practices in production & processing
– sustainable yield improvement– reduced land degradation, pollution etc.– biodiversity preservation , cover crops, IPM etc.
• support smallholder involvement– improve access to high-yielding varieties– promote improved plantation management– encourage establishment of smallholder cooperatives– retain diversification – promote development of small-scale mills
• secure funding for R&D and infrastructural works• enforce (and monitor adherence to) regulations
– environmental protection– land tenure guarantees, labour rights etc.– product quality (sustainability standards)
26
Oilc
rop
s m
arke
t o
utl
oo
k an
d o
il p
alm
ch
alle
ng
es Palm oil-based biodiesel production• favour production on land not suitable for food production• allow gradual expansion of BF industry; put in place entire commodity chain;
provide appropriate regulatory framework • favour production for domestic market
general support to rural development and overall economic growth meeting fuel needs in areas where feedstock is grown, esp. less accessible areas
• production for export offers limited scope main consumers rely on domestic sources (except EU) various barriers to trade remain (lack of harmonized specifications,
sustainability certification, tariff protection)
27
Oilc
rop
s m
arke
t o
utl
oo
k an
d o
il p
alm
ch
alle
ng
es a) International priorities
Food security• coordinate national policies and market interventions to reduce food security risks• encourage establishment of social safety net schemes• accelerate multilateral trade liberalization
Biofuel sector • improve policy planning and coordination• harmonization of trade regulations, sustainability standards• promote transition to 2nd generation technologies and feedstock
Climate change• coordinate national policies• foster analysis of impact on global agric. & food systems• coordinate research & investment into adaptation measures
28
Oilc
rop
s m
arke
t o
utl
oo
k an
d o
il p
alm
ch
alle
ng
es Oil palm• promote schemes that reward reduced deforestation and forest degradation
(e.g. REDD) and other control measures• support voluntary, private sector initiatives on standards for sustainable production
and processing (e.g. RSPO)─ application is demanding and costly; economic return is uncertain─ adaptation to smallholder environment needed─ supporting legal/policy reforms required at national level
• coordinate investment into agric. R&D (productivity enhancement) and facilitate technology transfer
29