Prospects for Energy Security in Asia-Pacific through ... · PROSPECTS FOR ENERGY SECURITY IN...
33
Draft - Not to be cited 1 PROSPECTS FOR ENERGY SECURITY IN ASIA-PACIFIC THROUGH REGIONAL TRADE Prospects for Energy Security in Asia-Pacific through Regional Trade Vivian Leung Shi Min, Rajan Sudesh Ratna 1 , Joong-Wan Cho 2 The views expressed in this publication are those of the authors and do not necessarily reflect the views of the United Nations. The opinions, figures and estimates set forth in this publication are the responsibility of the authors and contributors, and should not necessarily be considered as reflecting the views or carrying the endorsement of the United Nations. Any errors are the responsibility of the authors. 1 Economic Affairs Officer, Trade and Investment Division (TID), UN ESCAP 2 Chief, APTA UNIT, Trade and Investment Division (TID), UN ESCAP
Transcript of Prospects for Energy Security in Asia-Pacific through ... · PROSPECTS FOR ENERGY SECURITY IN...

Draft - Not to be cited
1
PROSPECTS FOR ENERGY SECURITY IN ASIA-PACIFIC THROUGH REGIONAL TRADE
Prospects for Energy Security in Asia-Pacific through Regional Trade
Vivian Leung Shi Min, Rajan Sudesh Ratna1, Joong-Wan Cho
2
The views expressed in this publication are those of the authors and do not necessarily reflect the views of
the United Nations. The opinions, figures and estimates set forth in this publication are the responsibility
of the authors and contributors, and should not necessarily be considered as reflecting the views or
carrying the endorsement of the United Nations. Any errors are the responsibility of the authors.
1 Economic Affairs Officer, Trade and Investment Division (TID), UN ESCAP
2 Chief, APTA UNIT, Trade and Investment Division (TID), UN ESCAP
Draft - Not to be cited
2
INTRODUCTION
Trade and investment are engines of growth for Asia-Pacific, with the region surpassing Europe to
become the world’s largest trading region in 2012. The general decline in import demand in developed
countries continues to fuel the growth in South-South trade, especially in intraregional exports, which saw
its share of total exports increasing from 40% to 50% from 2000 to 2012 (UN ESCAP 2013).
Increasing growth-driven demand for raw materials and the strengthening productive capacity of emerging
economies has exacerbated the region’s high resource dependence, especially in energy resources like
fossil fuels. Between 2011 and 2012, the import share of petroleum products in Asia-Pacific increased
from 8% to 14.5%, while its share of the region’s exports doubled from 5% to 10% (UN ESCAP 2013).
At the same time, growing demand has raised the price burden of energy resources over the years. The
region’s rising import bill for energy and commodities worsened its trade deficit, resulting in net deficit
with the rest of the world in 2012 (UN ESCAP 2013). Thus, the growth in energy demand, coupled with
the increasing price burden of fossil fuels, has made efforts for energy security more important than ever.
Energy security is a key policy challenge for Asia-Pacific and it is characterized by the four pillars of (i)
supply (or demand) security, (ii) price security, (iii) environment security and (iv) sustainable economic
growth. This refers to an adequate and reliable energy and power supply, price stability, environmental
sustainability, and affordable access to safeguard inclusive growth.
The region, with some leading countries, holds vast amounts of fossil and non-fossil energy resources. It
is a net exporter of coal, natural gas (pipeline), and electricity, but a net importer of oil and liquefied
natural gas (LNG). Due to accelerated levels of development within the region, which has led to rising
internal demand, the export of coal and natural gas (pipeline) has increasingly been on a decline. Despite
holding vast coal and natural gas reserves (Fig.1), Asia-Pacific’s demand for fossil fuel is increasingly
being met by imports and its trade surplus will be narrowed over time due to these factors. The ADB
expects net imports3 of fossil fuels (oil, coal, and natural gas) in Asia- Pacific to nearly double from 830.5
million ton of oil equivalent (Mtoe) in 2010 to 1,515.5 Mtoe in 2035 (ADB, 2013).
3 Net Imports = Imports – Exports.

Draft - Not to be cited
3
Figure 1: Contribution of ESCAP to world’s fossil fuel resources
ESCAP Share of Proven Fossil Fuel Reserves
0%
10%
20%
30%
40%
50%
60%
70%
80%
90%
100%
World
ESCAP
World 90.78% 61.40% 46.52%
ESCAP 9.22% 38.60% 53.48%
Oil Gas Coal
Note: Oil and natural gas reserves as of 1 January 2012; coal reserves as of 31 December 2008
Source of data: EIA International Energy Statistics, accessed November 2013
Without greater energy cooperation and integration, energy security will remain a distant objective for
many nations. Growing import dependency, coupled with emergent regionalism, has certainly enhanced
the prospects for regional energy cooperation, and thus energy security, but this is still at the nascent stage
and such cooperation remains sub-regional rather than pan Asia-Pacific.
This paper examines the prospects for energy security through regional energy trade and integration. In
particular, it examines how regional trade agreements can expand their coverage to correct existing intra-
regional imbalances in resources, using the case of the Asia-Pacific Trade Agreement (APTA).
The first section (1.1) provides an overview of the energy trade situation in Asia-Pacific within the global
context, focusing on the trade of primary energy commodities—oil, coal, natural gas—as well as the
cross-border trade of electricity. The study is based on analysis using published data on energy trade and
literature reviews on energy trade, including recent projections.
The next five sections (1.2-1.6) provide analysis of the structure and evolution of trade in primary energy
commodities and cross-border electricity within and from the ESCAP sub-regions. These sections trace
energy flows of oil, natural gas (piped and LNG), coal, and electricity from, to, and within the ESCAP
region, examining the importance of the region within the global energy market.
Section 2.1 provides a summary of specific energy demands for APTA Participating States, highlighting
the implications of regional energy trade flows, to show how the inclusion of Central Asian countries,

Draft - Not to be cited
4
which has already been identified as a pivotal energy exporting region in earlier sections, can overcome
some of these challenges.
Sections 2.2-2.5 detail the sources and destinations of which energy trade for individual APTA country is
conducted with to further illustrate the potential for energy trade cooperation between APTA and Central
Asia. Section 2.6 shows how such a partnership between APTA and Central Asia is mutually beneficial by
delineating the benefits for Central Asia countries in joining APTA leading to energy security at a regional
level.
Finally, the paper concludes by stating that regional cooperation to achieve energy security collectively is
a viable alternative to traditional individual or bilateral attempts and that APTA is an ideal vehicle for
such a cooperation to exist.

Draft - Not to be cited
5
1.1 IMPORTANCE OF ENERGY TRADE IN ASIA-PACIFIC
Energy trade balances the differences in energy resource endowments and capital among countries. Trade
helps to meet the energy demand for the energy import-dependent countries. At the same time, it also
increases national income of energy exporting countries, enabling them to pursue diversification. In fact,
countries with surplus energy resources tend to be highly dependent on energy exports, making it crucial
to secure demand in the same way that energy import-dependent countries need to secure their energy
sources.
In its World Energy Outlook 2013, the International Energy Agency (IEA) says that global energy trade
has re-oriented from the Atlantic basin to the Asia-Pacific region (IEA, 2013). As shown in Figure 2, the
North and South of the region is generally energy self-sufficient4 with the central countries more prone to
energy insufficiency.
Figure 2: Energy Self-Sufficiency in Asia-Pacific
Source: UN ESCAP Statistical Perspectives, Asia-Pacific Energy Forum 2013
4 1 – production/total primary energy supply

Draft - Not to be cited
6
While the ideal solution would be for each country to achieve self-sufficiency in secondary (electricity)
and refined energy, at the very least, this is almost impossible given the massive infrastructure costs that
such a venture would entail. At the same time, energy sufficiency does not immediately guarantee equal
access across the country or that power demand would be adequately met due to infrastructure, geography,
and other structural challenges. Hence promoting energy trade is pivotal to securing energy security to
address both external internal imbalances.
Figure 3: Increasing net energy imports in ESCAP regions, 2000, 2010, 2020, 2035 (Mtoe)
Source: Energy Outlook for Asia and the Pacific, ADB 2013
Given that Asia-Pacific has become increasingly dependent on energy imports (Fig.3), largely as a result
of the high and growing energy demand in the developing countries in the region, especially countries of
East and South Asia, energy trade has become crucial in meeting growing energy demand of Asia.
Addressing these challenges is thus important for overall development of the countries in the region.

Draft - Not to be cited
7
1.2 OIL TRADE
Oil is a strategic and highly concentrated energy source, especially in the field of transportation. Despite
considerable interest in exploring the use of other energy sources for transportation, these initiatives have
not transpired because of oil’s intrinsic advantage over other energy resources; it is liquid, making it the
most economically competitive and convenient energy source. With a 34% share of global energy
demand, oil remains the reference energy (Favennec 2011).
According to the EIA International Energy Statistics, Asia-Pacific crude oil imports of 18,785 Thousand
Barrels Per Day accounted for 43% of global oil imports in 2010, while oil exports of 11,152 Thousand
Barrels Per Day represented 26% of world’s total, further defining the region as a net oil importer.
Figure 4: Top ESCAP Crude Oil Importers and Exporters, 2006-2010
Source: Authors’ calculation, based on EIA International Energy Statistics (accessed November 2013)
The Middle East is still the single largest source of Asia-Pacific oil imports, both crude and petroleum,
supplying more than 54% of Asia-Pacific’s total oil imports in 2012. Intra-regional oil trade within the
Asia-Pacific region is also substantial contributing to 19% of the region’s total oil imports. The largest
exporters from within the region are Russia, Iran, Kazakhstan, and Azerbaijan. In addition, Australia,
China, India, Japan, and Singapore also trade oil (mostly refined oil products) in smaller quantities and
export most of it within the region.

Draft - Not to be cited
8
Figure 5: Sources of Asia-Pacific oil imports, 2008 and 2012
Source: Authors’ calculation, based on BP Statistical Review 2009 and 2013
Oil exports of the Former Soviet Union (FSU), which comprises many of ESCAP’s North and Central
Asian states, represented 15% of the world’s total oil exports and 7% of the Asia-Pacific region’s total in
2012.
From 2008 to 2012, limited import diversification has taken place with the Middle East and intra-Asia-
Pacific remaining the largest sources of ESCAP oil imports although imports from both regions decreased
by 7% and 3% respectively. The decrease in imports from “traditional suppliers” was offset by an increase
in imports from Africa, South America and FSU by 8% altogether.

Draft - Not to be cited
9
1.3 NATURAL GAS TRADE
Natural gas is mostly used in the industrial and electricity-generating sectors to produce heat. It is
typically seen as secondary to oil due to its physical properties as it is less concentrated. 1,100 cubic
metres of “gaseous” natural gas are needed to obtain one metric ton of oil equivalent (TOE) (Favennec
2011). However, with the ascendance of climate change concerns in state policies and the North American
shale gas revolution, gas has come to the forefront of global energy demand. There are three broad gas
markets in USA, Europe, and Asia, and the difficulties in gas transportation account for this market
segregation and cost variances. Transportation costs account for a large share of gas prices because
transportation only occurs either through a pipeline, or by LNG carriers, which requires a non-
interruptible and rigid chain for handling.
Natural gas is traded by pipeline and by ship as LNG. Natural gas trade by pipeline dominates natural gas
trade, accounting for 68% of the total trade in 2012. The ADB posits that demand for natural gas will
grow at 3.9% per year, reaching 1,463.2 Mtoe in 2035. Furthermore, this projected growth will be the
fastest among all fossil fuels because of the lower environmental burden and ease of use.
The Asia-Pacific market for natural gas is not homogenous, as it does not have a well-connected
sophisticated pipeline system, as in North America and Europe, through which gas can be traded. The
regional market is roughly split into three with a mature market in North-East Asia (i.e. Japan, South
Korea, and Taiwan) that is mainly supplied by LNG, an emerging market in China and India, and South-
East Asia, where the majority of the region’s LNG producers (i.e. Malaysia, Brunei, and Indonesia) are
found.
Asia-Pacific is the foremost player in LNG trade, and its imports of 235 bcm in 2012 accounted for 71%
of global LNG trade. As far as LNG trade is concerned, Asia is a net importer of natural gas. In fact, in
2012, ESCAP Asia imported (or 234.9 bcm) more than twice as much LNG as it exported (or 108.8 bcm).
Japan alone received 51% of the total Asian LNG imports, representing 36% of the world’s total, largely
due to resurgent demand following the Fukushima incident. Turkey, China, the Republic of Korea,
Taiwan, Thailand, and India are the other major LNG importers in Asia (BP 2013).

Draft - Not to be cited
10
Figure 6: Asian LNG imports, 2012
ESCAP LNG Imports, 2012
7.720.0 20.5
118.8
49.7
16.9
1.4
-
20.0
40.0
60.0
80.0
100.0
120.0
140.0
Turkey China India Japan South
Korea
Taiwan Thailand
Bil
lio
n c
ub
ic m
etr
es
Source: Authors’ calculation, based on BP Statistical Review 2013
The single largest source of LNG exports to Asia-Pacific is Qatar, which supplied 67.7bcm or 29% of the
regional LNG import demand in 2012. It is also the leading LNG exporter globally. The other Middle
Eastern countries of Oman, Yemen, and UAE also registered large quantities of LNG exports to Asia. In
total, the Middle East exported about 92.3 bcm of LNG to Asia-Pacific, making up 39% of the latter’s
imports. The African countries of Algeria, Egypt, Equatorial Guinea, and Nigeria also shipped LNG to
the region, totaling 28.3 bcm or 12% in shipments to Asia-Pacific. However, in aggregate, most LNG
imports of Asia come from within the region, particularly from Russia, Australia, Brunei, Indonesia, and
Malaysia, which, in fact, combined to supply 46% of the region’s total LNG imports.
The five ESCAP gas exporting countries are not only the sole LNG-exporting countries in the region, but
also essentially trade only within the region, representing 33% of global LNG trade.

Draft - Not to be cited
11
Figure 7: Asia-Pacific LNG exports, 2012
ESCAP LNG Exports, 2012
14.8
28.1
9.1
25.0
31.8
-
5.0
10.0
15.0
20.0
25.0
30.0
35.0
Russian
Federation
Australia Brunei Indonesia Malaysia
Bil
lio
n C
ub
ic M
etr
es
Source: Authors’ calculation, based on BP Statistical Review 2013
Figure 8: ESCAP natural gas imports by pipeline, 2012
Source: Authors’ calculation, based on BP Statistical Review 2013
The major Asian countries that export gas by pipeline are Kazakhstan, Russia, Turkmenistan, Iran,
Indonesia and Myanmar. Other than Russia, each exports natural gas to a small number of importers,
owing mainly to the relatively small natural gas surplus from these countries: Iran exports only to Turkey
and the FSU; Myanmar only to Thailand; and Indonesia only to Singapore and Malaysia. Transporting
gas through pipelines is largely geographically constrained, as seen in the concentration of intra-Southeast
Asian flows as well as flows amongst Russia and Central Asian states. One exception to this is gas exports

Draft - Not to be cited
12
from Turkmenistan to China, valued at 21.3bcm. This is largely facilitated by the new Central Asian
Pipelines connecting Turkmenistan, Uzbekistan, and Kazakhstan, with China, which is also the world’s
longest gas pipeline. Besides China, the other Asian countries that import piped gas are Australia,
Malaysia, Singapore, and Thailand. With the inclusion of Russia, Iran and Central Asia, the ESCAP
region is a net exporter of natural gas as far as natural gas trade by pipeline is concerned, with exports
mainly heading to Europe.

Draft - Not to be cited
13
1.4 NATURAL GAS PRICES
Other than gas supply, gas prices are also a major security concern with Asia-Pacific prices almost
doubling from 2009-2012. Unlike oil and coal prices, which are largely consistent with the global price,
gas prices in Asia-Pacific are consistently higher compared to the rest of the world. Asian gas contracts
are typically indexed to crude-oil prices with terms as long as 20 years. Thus, not only is the region’s gas
prices vulnerable to oil price volatility, gas prices in Asia are also almost quadruple prices in the USA (fig.
9).
Figure 9: Natural Gas Prices, 2013
Source: BP, http://www.bp.com/en/global/corporate/about-bp/statistical-review-of-world-energy-2013/review-by-energy-type/natural-gas/natural-gas-
prices.html
In a free market, gas prices should be delinked from oil and move towards gas-to-gas competition and this
is seen as a natural trajectory for the Asian gas market to follow. Such a scenario would be further boosted
if surplus gas from North America is successfully exported on a large scale. Using crude oil as a
benchmark for gas prices in Asia is not a credible long-term situation as oil prices are frequently distorted
by the paper market and are thus not representative of market fundamentals. Whereas gas was seen as a
direct substitute to oil in power generation, this is no longer the case and no longer warrants the linking of
gas to oil prices. High gas prices in Asia negatively impact competitiveness and they also limit the
potential for gas to expand its market share in the energy mix, which explains why coal is still the
dominant energy resource in Asia.

Draft - Not to be cited
14
1.5 COAL TRADE
The ADB posits that the region will become a net coal importer in 2015, and statistics from the EIA
suggests that Asia-Pacific is already bordering to being a net coal importer. Total ESCAP coal exports
reached 920 million short tons in 2011, while coal imports amounted to 791 million short tons. Without
Russia and Central Asia, the region becomes a net coal importer with a trade deficit of 17 million short
tons. Asian coal exports also represented 72% of the global coal trade, while the region’s coal imports
accounted for 67% of the world. The region’s coal imports was growing almost thrice as fast as the global
growth between 2007 and 2011 with coal imports increasing at a faster rate of 36% than its exports, which
increased by 23%.
This phenomenon was largely fueled by burgeoning Chinese domestic demand where coal accounted for
roughly 70% of total energy use in 2011. Chinese imports have ballooned 349% from 2007-2011,
alongside dwindling exports.
Figure 10: Global and Asian coal trade, 2007-2011
Source: Authors’ calculations, based on International Energy Statistics, EIA database (accessed November 2013).
Russia, Australia, and Indonesia are the region’s largest coal exporters. Their combined coal exports of
793 million short tons in 2011 represented 62% and 86% of the world’s and region’s total, respectively.
The coal exports from these three Asian countries were also increasing by 33% from 2007 to 2011, owing
largely to the high growth of coal exports from Indonesia (59% from 2007 to 2011). Indonesia has also
emerged as the largest coal exporter in the region.

Draft - Not to be cited
15
Figure 11: Growth of coal exports in key ESCAP countries, 2007-2011
Coal Exports of Key ESCAP Countries, 2007-2011
0
50000
100000
150000
200000
250000
300000
350000
400000
China Russia Australia Indonesia
tho
usan
d s
ho
rt t
on
s
2007
2008
2009
2010
2011
Source: International Energy Statistics, EIA database (accessed November 2013).
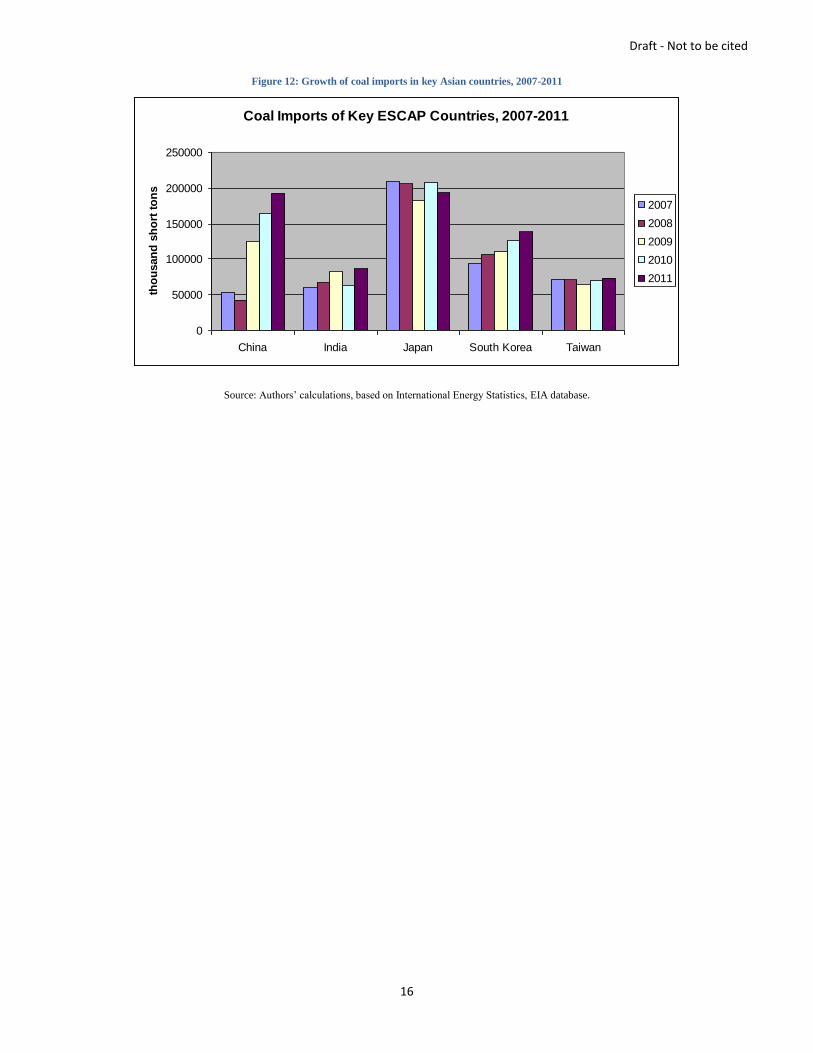
Other than China, India, Japan, South Korea, and Taiwan are also major coal importers in the region.
Together, they accounted for 58% of the world’s total coal imports in 2011 and 87% of the region’s total.
While China will continue to dominate the demand for coal in Asia, the ADB projects that its growth in
demand will slow down to 1.4% per year through 2035 as a result of energy efficiency and the increase of
other sources in the country’s energy mix. India, on the other hand, will see a steady increase in demand
for coal, at 3.1% per year until 2035. At the same time, Southeast Asia is poised to play a bigger role in
coal trade as certain countries in the region will encourage the use of coal to augment energy security,
especially Indonesia, which is set to become the fourth largest coal user in Asia-Pacific by 2035. This
means that it could soon follow the path of China and see a marked erosion of its net coal exports.
Draft - Not to be cited
16
Figure 12: Growth of coal imports in key Asian countries, 2007-2011
Coal Imports of Key ESCAP Countries, 2007-2011
0
50000
100000
150000
200000
250000
China India Japan South Korea Taiwan
tho
usan
d s
ho
rt t
on
s
2007
2008
2009
2010
2011
Source: Authors’ calculations, based on International Energy Statistics, EIA database.

Draft - Not to be cited
17
1.6 CROSS-BORDER ELECTRICITY TRADE
The ESCAP region registered net exports of 14.77 TWh in 2010, making it a net exporter. However, the
region would have been a net importer of electricity without the inclusion of North and Central Asia. The
region’s electricity exports represented 14% of the world’s total electricity trade, while its electricity
imports were 11%. Interestingly, while global electricity imports decreased by 4% from 2008-2010,
ESCAP imports increased by 10% during the same period. Similarly, global electricity exports decreased
by 5%, while ESCAP exports increased by 2%. This shows that intra-ESCAP electricity trade is
increasing.
Figure 13: Global and ESCAP Electricity Trade, 2008-2010
Source: Authors’ calculations, based on International Energy Statistics, EIA database.
Figure 14: Electricity Trade of Key ESCAP Economies, 2010
Source: Authors’ calculations, based on International Energy Statistics, EIA database.
Russia, Uzbekistan, Iran, and China are key electricity exporting countries, while Thailand, Uzbekistan,
Hong Kong, India, and Vietnam are key electricity importing countries.

Draft - Not to be cited
18
Interestingly, Uzbekistan was importing more or less the same amount of electricity as it exported, which
represented roughly 18% of the ESCAP region’s imports and 15% of its exports. Russia and China’s
electricity exports each made up 24% of ESCAP exports. As shown in the diagrams, both countries’
imports were much less than their exports. A further 8% of ESCAP electricity exports came from Iran.
While Hong Kong’s imports is high in absolute terms, representing 17% of ESCAP imports and roughly
equivalent to the imports of China and India combined, its case is unique given that its entire trade is
conducted with China.
Figure 15: Cross-border electricity trade in ESCAP
Source: Authors’ calculations, based on International Energy Statistics, EIA database.
Unlike trade in primary energy commodities, electricity trade typically occurs within well-defined sub-
regional markets, corresponding to the various sub-regions of the ESCAP region. At the same time,
electricity is also traded beyond the borders of these sub-regions to neighboring sub-regions or countries,
including those outside the ESCAP region. The bulk of electricity trade in the ESCAP region is currently
taking place in North and Central Asia, which accounted for 39% of the total electricity trade in the region
in 2010. Substantial electricity trade also occurs in East and Northeast Asia, which accounted for close to
29% of the whole ESCAP region’s total. Significant electricity trade also transpires in South West Asia
and South East Asia.
Draft - Not to be cited
19
2.1 IMPLICATIONS FOR APTA COUNTRIES
The Asia-Pacific Trade Agreement (APTA) is a preferential trade agreement that is open to all developing
member countries of the UN ESCAP. Current Participating States include Bangladesh, China, India,
Republic of Korea, Lao People’s Democratic Republic, and Sri Lanka. Mongolia has become the seventh
Participating State and the country’s formal accession to the Agreement is expected to take place in early
2014. The case of APTA is taken due to the fact that three major economies in Asia-Pacific are members
of APTA. Looking at a sub-regional agreement/grouping, instead of focusing on individual country-
specific energy demand, can benefit not only to the APTA Participating States, but also such other
countries, which, will become part of energy supply chain to APTA.
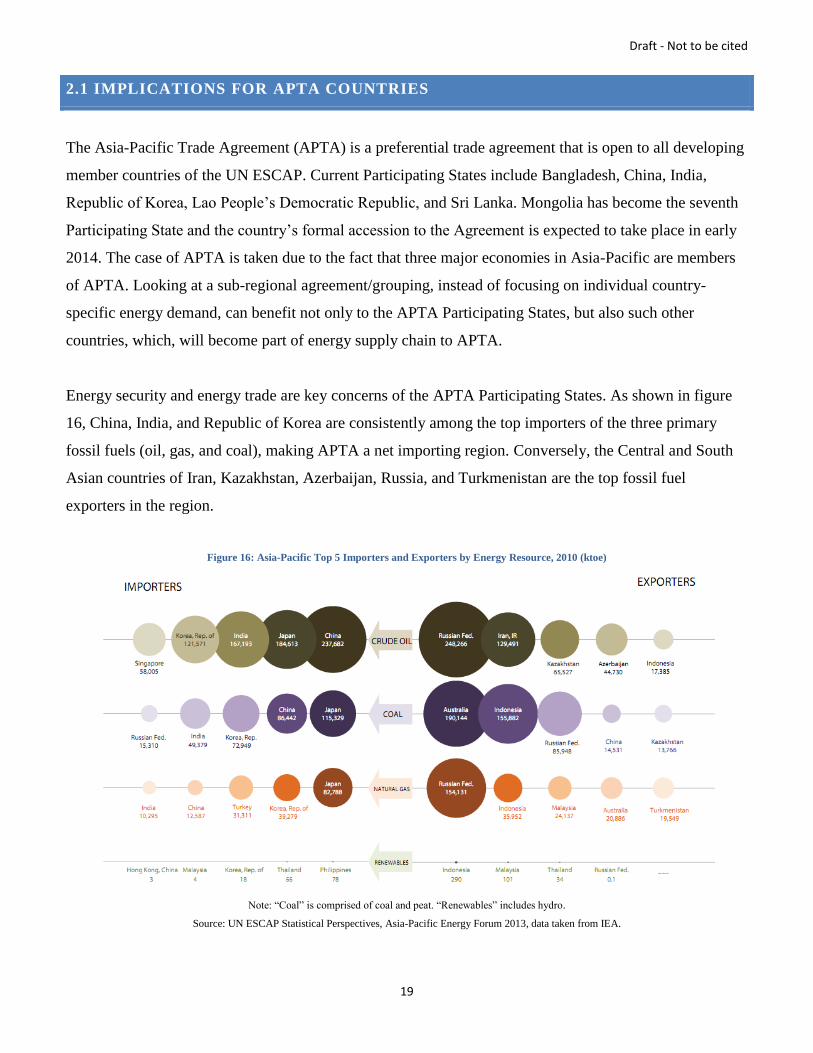
Energy security and energy trade are key concerns of the APTA Participating States. As shown in figure
16, China, India, and Republic of Korea are consistently among the top importers of the three primary
fossil fuels (oil, gas, and coal), making APTA a net importing region. Conversely, the Central and South
Asian countries of Iran, Kazakhstan, Azerbaijan, Russia, and Turkmenistan are the top fossil fuel
exporters in the region.
Figure 16: Asia-Pacific Top 5 Importers and Exporters by Energy Resource, 2010 (ktoe)
Note: “Coal” is comprised of coal and peat. “Renewables” includes hydro.
Source: UN ESCAP Statistical Perspectives, Asia-Pacific Energy Forum 2013, data taken from IEA.

Draft - Not to be cited
20
Not only are these key Central and South Asian countries large fossil fuel exporters in Asia-Pacific, they
also possess significant fossil fuel reserves (fig. 17). For a grouping of just 11 countries, they possess 14%
of global oil reserves, 31% of global gas reserves, and 19% of global coal reserves.
Figure 17: Fossil Fuel Reserves of Key Central and South Asian Countries
Source: Authors’ calculations, based on International Energy Statistics, EIA database.
Electricity trade is also a key issue for APTA countries where 6 out of 7 countries (all except Republic of
Korea) were among the top countries in Asia-Pacific with the greatest number of people without access to
electricity in 2010 (fig. 18).
Draft - Not to be cited
21
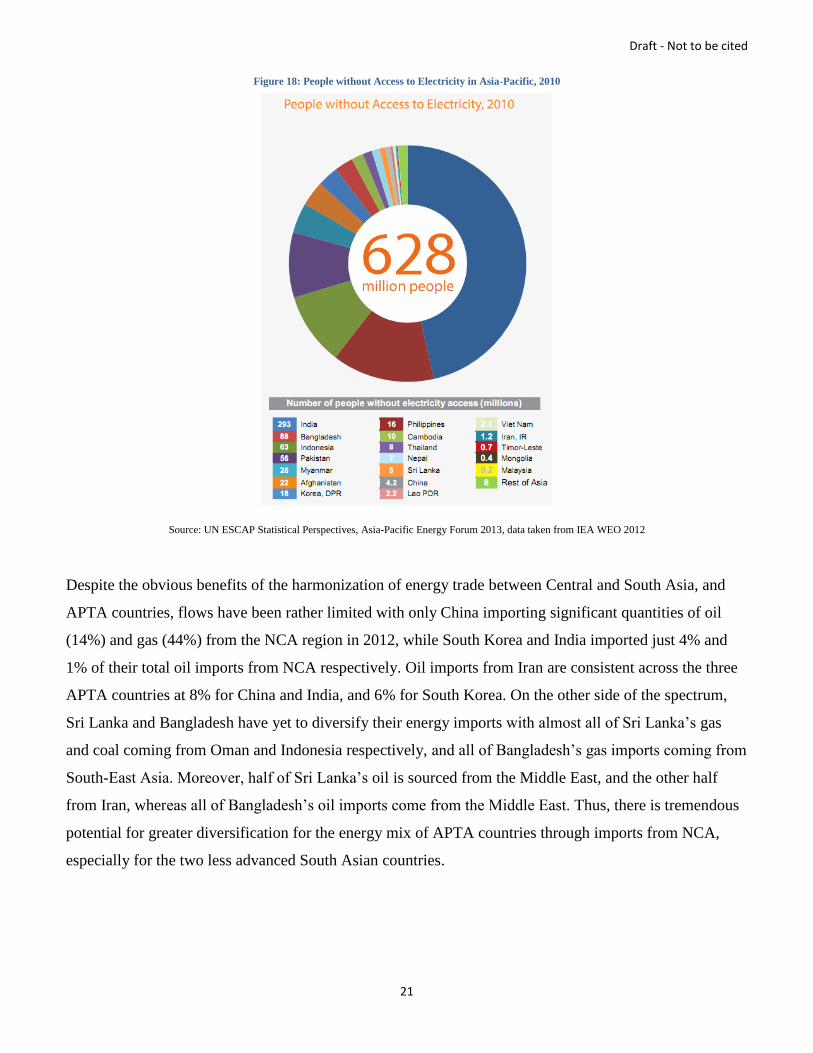
Figure 18: People without Access to Electricity in Asia-Pacific, 2010
Source: UN ESCAP Statistical Perspectives, Asia-Pacific Energy Forum 2013, data taken from IEA WEO 2012
Despite the obvious benefits of the harmonization of energy trade between Central and South Asia, and
APTA countries, flows have been rather limited with only China importing significant quantities of oil
(14%) and gas (44%) from the NCA region in 2012, while South Korea and India imported just 4% and
1% of their total oil imports from NCA respectively. Oil imports from Iran are consistent across the three
APTA countries at 8% for China and India, and 6% for South Korea. On the other side of the spectrum,
Sri Lanka and Bangladesh have yet to diversify their energy imports with almost all of Sri Lanka’s gas
and coal coming from Oman and Indonesia respectively, and all of Bangladesh’s gas imports coming from
South-East Asia. Moreover, half of Sri Lanka’s oil is sourced from the Middle East, and the other half
from Iran, whereas all of Bangladesh’s oil imports come from the Middle East. Thus, there is tremendous
potential for greater diversification for the energy mix of APTA countries through imports from NCA,
especially for the two less advanced South Asian countries.

Draft - Not to be cited
22
2.2 APTA GAS IMPORTS
Figure 19: Sources of APTA Gas Imports
Source: ESCAP calculation, based on United Nations Comtrade data downloaded from WITS database (accessed November 2013).

Draft - Not to be cited
23
2.3 APTA OIL IMPORTS
Figure 20: Sources of APTA Oil Imports
Source: ESCAP calculation, based on United Nations Comtrade data downloaded from WITS database (accessed November 2013).

Draft - Not to be cited
24
2.4 APTA COAL IMPORTS
Figure 21: Sources of APTA Coal Imports
Source: ESCAP calculation, based on United Nations Comtrade data downloaded from WITS database (accessed November 2013).

Draft - Not to be cited
25
2.5 APTA ELECTRICITY TRADE
Figure 22: Sources of APTA Electricity Imports and Exports
Source: ESCAP calculation, based on United Nations Comtrade data downloaded from WITS database (accessed November 2013).

Draft - Not to be cited
26
Unlike its fossil fuels trade, China is a net-exporter when it comes to electricity. China has a reciprocal
electricity trading relationship with Hong Kong, Myanmar, and DPRK. 54% of China’s electricity exports
went to Hong Kong, while 46% of China’s electricity imports came from Hong Kong. Vietnam and
Macau are the other major export destinations of China’s electricity. China also supplies electricity in
smaller quantities to North Korea (DPRK), Laos, Mongolia, and Myanmar. Other than Hong Kong,
Russia and Myanmar make up slightly more than half (53%) of China’s electricity imports. As a large
chunk of its electricity exports (86%) went to its Special Administrative Regions (SARs) of Macau and
Hong Kong, China would have been a borderline net electricity importer by about $17.34 Million if flows
to and from both SARs were excluded.
India’s power trade is comparatively smaller than China’s, and it is also a net-exporter, as it does not
import electricity at the moment. In 2012, the bulk of its electricity exports went to the US with a tiny
portion heading to neighboring Nepal.
As electricity is not a physical good, capturing its trade data is more complex compared to oil, gas, and
coal, and data is limited for other APTA countries. However, it is possible to derive the trade figures for
Laos from Thailand’s trade data. In 2012, Laos exported about $USD 497 Million of electricity to
Thailand, which represents 99% of the latter’s electricity imports. Conversely, Laos imported around
$USD 70.7 Million of electricity from Thailand, or 45% of Thailand’s exports. This suggests that Laos is
a net-exporter of electricity as well, thanks to its vast hydropower potential. With the implementation of
the ASEAN Power Grid Project, Laos’ electricity trade with Thailand, as well as with the rest of ASEAN
is expected to increase.
It appears that the Republic of Korea is autarkic when it comes to electricity generation and this probably
explains its high household electricity tariffs as shown in the figure below.
Draft - Not to be cited
27
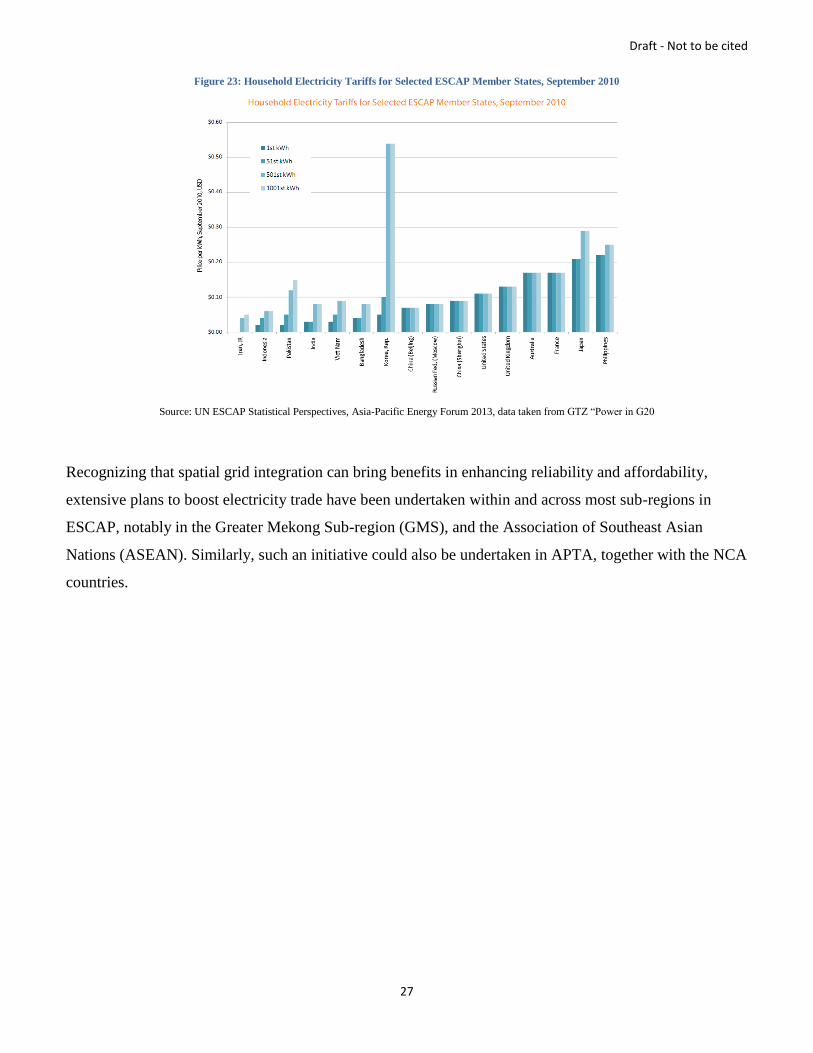
Figure 23: Household Electricity Tariffs for Selected ESCAP Member States, September 2010
Source: UN ESCAP Statistical Perspectives, Asia-Pacific Energy Forum 2013, data taken from GTZ “Power in G20
Recognizing that spatial grid integration can bring benefits in enhancing reliability and affordability,
extensive plans to boost electricity trade have been undertaken within and across most sub-regions in
ESCAP, notably in the Greater Mekong Sub-region (GMS), and the Association of Southeast Asian
Nations (ASEAN). Similarly, such an initiative could also be undertaken in APTA, together with the NCA
countries.

Draft - Not to be cited
28
2.6 IMPLICATIONS FOR KEY CENTRAL AND SOUTH ASIAN COUNTRIES IN
EXPANDING ENERGY TRADE WITH, AND ACCEDING TO APTA
The Central and South Asian (CSA) countries that are key players in energy trade include Armenia,
Azerbaijan, Georgia, Iran, Kazakhstan, Kyrgyzstan, Tajikistan, Turkey, Turkmenistan and Uzbekistan.
Notwithstanding the fact that export diversification for these countries is becoming increasingly important
with Europe, as the traditional market, gradually moving towards a renewables path, they could also
benefit from the geographical proximity and climate synergy of trading their energy resources with APTA
countries. Central Asian countries also face unique geopolitical circumstances, particularly landlocked
countries located between Russia and Iran, the two dominant energy players. The littoral states have
vested interests in ensuring their continued energy dominance and that Central Asian exports would not
bypass them. Thus, Central Asian countries might face less geopolitical resistance if they were to send
their energy exports eastward instead of westbound.
As mentioned, CSA dominates electricity trade in the Asia-Pacific region and there is vast potential for a
power exchange relationship to be formed with certain APTA countries, notably India, Mongolia, and
China given their geographic proximity to the CSA countries. Already, electricity cooperation exists
between Kyrgyz Republic, Tajikistan, Pakistan and Afghanistan under the CASA-1000 electricity
transmission system project. The project aims to transfer electricity from hydropower facilities in Kyrgyz
Republic and Tajikistan to electricity consumers in Afghanistan and Pakistan (CASA-1000 2011). Hence,
surplus generation in the NCA countries during summer can be channeled across for a profit to offset
power shortages that are most frequent in Pakistan and Afghanistan over summer. Given the difference in
climate conditions in the two sub-regions, where NCA countries are only prone to power shortages during
winter, as opposed to South Asia, which requires more electricity during summer, mutual gains exist.
Energy intensity in the ESCAP region is very high, representing two-thirds of global energy intensity in
2010 (fig. 24), and this is mainly due to NCA countries. The sub-region displays the highest energy
intensity, about 1.75 times that of the ESCAP average (fig. 25), making it highly energy inefficient.

Draft - Not to be cited
29
Figure 24: Energy Intensity in the world, 2010.
Energy Intensity, 2010
North America 1%
South America 2%
Europe 24%
Middle East 3%
Africa 2%ESCAP 68%
Source: Authors’ calculations, based on International Energy Statistics, EIA database.
Figure 25: Asia-Pacific Sub-regional Primary Energy Intensities 1990-2010.
Source: UN ESCAP Statistical Perspectives, Asia-Pacific Energy Forum 2013, data taken from IEA.
Energy intensity refers to the energy required to produce a unit of GDP and it is used to measure energy
efficiency and conservation (EE&C). As mentioned in ADB’s Asia-Pacific Energy Outlook 2013, EE&C
is a means to enhance energy supply security, especially for countries facing limited resources. Energy

Draft - Not to be cited
30
intensity is impacted by various factors, including industry structure, technology, lifestyle, and climate
conditions. In addition, energy prices as well as access to infrastructure can also affect energy intensity.
As energy efficiency is positively correlated with economic competitiveness, CSA countries (e.g.
Kazakhstan, Tajikistan, Kyrgyzstan, Armenia, and Irna) are hampered in economic development as a
result of energy usage inefficiencies (fig. 26).
Figure 26: Energy Efficiency and Economic Competitiveness5, 2010.
Source: UN ESCAP Statistical Perspectives, Asia-Pacific Energy Forum 2013, data taken from IEA
By acceding to APTA, the Central and South Asian countries could benefit from technology and
knowhow transfer from the APTA countries to ameliorate their energy efficiency performance; APTA
already has implemented the framework agreements on trade in services, trade facilitation, and
investment, which promotes intra-regional investment flows and the establishment of backward-forward
linkages between industries. At the same time, higher trade volumes will generate greater domestic
economic activity to meet their developmental objectives. Given the fact that tariff concessions are given
5 The Global Competitiveness Index is a composite statistic published annually by the World Economic Forum. The Energy Efficiency Factor is derived from
subtracting final energy intensity from 1. A higher value represents greater efficiency.

Draft - Not to be cited
31
on numerous items, CSA countries can diversify their export commodities to APTA to include non-energy
products and services.

Draft - Not to be cited
32
CONCLUSION
Endeavors towards energy security in Asia-Pacific have mostly favored bilateral, or even autarkic
approaches, with the bulk of energy trade occurring with extra-regional countries. Existing regional
cooperation have occurred mainly within established sub-regional groupings such as ASEAN. As a result,
periphery countries have largely been marginalized even though such countries tend to possess rich
resources. Earlier sections have also shown that there is vast potential for synergistic gains to be achieved
through intra-regional partnership and trade. Hence, before aiming for individual energy self-sufficiency,
Asia-Pacific countries should work towards the more tenable goal of augmenting regional efficiency and
trade.
APTA is perfectly poised to serve as a framework for such cooperation in energy trade to occur. Not only
does it span East and South Asia to include least developed countries (LDCs) together with the three
major economies in Asia-Pacific, it is also the only operational trade agreement linking the economic
powerhouses of China and India. Under the Fourth Round negotiations, tariff concessions have both
widened and deepened for over 10,000 mutual-interest items (UN ESCAP 2013). There are also certain
items relating to energy that are already present in this concession list, thus providing a foundation for the
expansion of energy trade.
Although this paper has not analyzed clean technology and renewable energies in detail, it is clear that
gains exist in clean energy technology transfers, as well as the harmonizing of power grids to overcome
the problem of intermittency in using renewable energy sources. According to a report by the Pew
Research Center, China “advanced its position as the epicenter of clean energy finance” in 2012 and Asia-
Pacific became the “leading regional destination for clean energy financing” amidst decline in other parts
of the world (The Pew Charitable Trusts 2013). Thus, the strategic combination of fossil fuels and
clean/renewable energies can forge a clear path for a sustainable energy transition for both APTA and
CSA countries, without sacrificing growth.
In view of the above analysis of trends, APTA should expand its membership to the Central and South
Asian countries to facilitate greater trade with the region and ultimately, consolidate energy security for all
parties.

Draft - Not to be cited
33
BIBLIOGRAPHY
Asian Development Bank. “Energy Outlook for Asia and the Pacific.” 2013.
CASA-1000. "CASA-1000 Project." List of FAQs. June 6, 2011. http://www.casa-1000.org/1.%20Project_FAQs_ENG.pdf
(accessed December 12, 2013).
BP. "BP Statistical Review of World Energy." June 2013. http://www.bp.com/content/dam/bp/excel/Statistical-
Review/statistical_review_of_world_energy_2013_workbook.xlsx. Accessed November 20, 2013.
EIA. “International Energy Statistics.” http://www.eia.gov/cfapps/ipdbproject/iedindex3.cfm. Accessed November, 2013.
Favennec, Jean-Pierre. The Geopolitics of Energy. Paris: IFP Energies Nouvelles Publications, 2011.
International Energy Agency. "World Energy Outlook 2013 Factsheet." How will Global Energy Markets evolve to 2035? 2013.
http://www.worldenergyoutlook.org/media/weowebsite/factsheets/WEO2013_Factsheets.pdf. Accessed December 2013.
The Pew Charitable Trusts. Who's Winning the Clean Energy Race? 2012 Edition. Pew Research Center, 2013.
UN ESCAP. “Asia-Pacific Trade and Investment Report.” 2013, 6.
http://www.unescap.org/tid/ti_report2013/download/aptir2013.pdf
UN ESCAP. "Asia-Pacific Trade Agreement." Factsheet. 2013. http://www.unescap.org/tid/apta/factsheet13.pdf (accessed
December 12, 2013).
World Bank. “World Integrated Trade Solution (WITS).” Accessed November 2013.


![Asia Pacific Youth to Business (Y2B) Forum Proposal [for Asia Pacific]](https://static.fdocuments.us/doc/165x107/568c4db71a28ab4916a50cbd/asia-pacific-youth-to-business-y2b-forum-proposal-for-asia-pacific.jpg)