Prospects for Energy Prices Presented to Sustainable Energy Ireland by Dr Gareth Davies, Managing...
29
Prospects for Energy Prices Prospects for Energy Prices Presented to Sustainable Energy Ireland by Dr Gareth Davies, Managing Consultant Thursday July 22nd 2004
-
Upload
stewart-richardson -
Category
Documents
-
view
217 -
download
0
Transcript of Prospects for Energy Prices Presented to Sustainable Energy Ireland by Dr Gareth Davies, Managing...

Prospects for Energy PricesProspects for Energy Prices
Presented to Sustainable Energy Ireland
by Dr Gareth Davies, Managing Consultant
Thursday July 22nd 2004
OverviewOverview
• recent trends in European energy prices– implications of liberalisation?– where next?
• identifying the drivers of energy prices– impacts on different cost components of bills
• path of cost drivers in Ireland– what does this mean for end-user prices?– competition or regulation?

Recent Price TrendsRecent Price Trends

I&C Electricity Prices 2003 (£/MWh)I&C Electricity Prices 2003 (£/MWh)
Rank Country Price
9 Netherlands 35.99
10 Finland 39.65
11 Portugal 50.63
12 Denmark 55.51
13 Ireland 57.34
14 Italy 68.93
15 Japan 70.15
Rank Country Price
1 Austria 23.18
2 Spain 25.01
3 Germany 26.84
4 France 27.45
5 Greece 28.06
6 Belgium 29.28
7 USA 30.50
8 UK 31.72
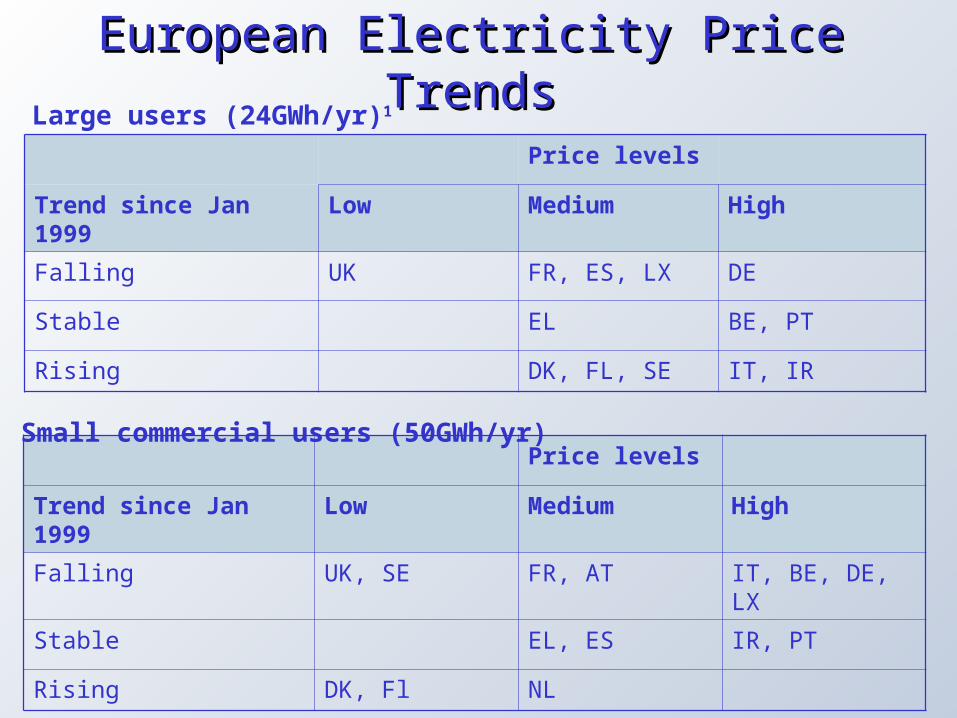
European Electricity Price TrendsEuropean Electricity Price Trends
Price levels
Trend since Jan 1999 Low Medium High
Falling UK FR, ES, LX DE
Stable EL BE, PT
Rising DK, FL, SE IT, IR
Large users (24GWh/yr)1
Price levels
Trend since Jan 1999 Low Medium High
Falling UK, SE FR, AT IT, BE, DE, LX
Stable EL, ES IR, PT
Rising DK, Fl NL
Small commercial users (50GWh/yr)

I&C Gas Prices 2003 (p/therm)I&C Gas Prices 2003 (p/therm)
Rank Country Price
7 USA 34.02
8 Netherlands 34.199 France 35.22
10 Greece 35.89
11 Portugal 44.21
12 Japan 60.01
Rank Country Price
1 Canada 21.06
2 UK 23.823 Finland 24.39
4 Ireland 30.89
5 Germany 31.3
6 Spain 31.36

European Gas Price TrendsEuropean Gas Price Trends
Price levels
Trend since Jul 2000 Low Medium High
Falling LX, UK SE,DK,BE, ES IT
Stable DE, AT, FR, IR
PT
Rising
Small commercial users (~120GWh/yr)1

Electricity Price DriversElectricity Price Drivers

Composition of BillsComposition of Bills
• costs represented in the bills– generation– network charges– retail costs
• broad categories of drivers– market fundamentals– policy requirements– regulatory regime
46%
42%
12%
Generation (including balancing costs)
Network charges
Retail costs

Wholesale Generation CostsWholesale Generation Costs• supply–demand balance
– strong demand growth– new investment in generation
volume and mix– short-term and long-term adequacy
• input fuel costs– growing reliance on gas-fired generation
• the EU ETS• new trading arrangements
– scope for competition?– increase in risk?

Generation Adequacy Generation Adequacy
-2,500
-2,000
-1,500
-1,000
-500
0
500
1,000
2005 2006 2007 2008 2009 2010
Sur
plus
/def
icit
(MW
)
Low growth, high availability High growth, low availability
High demand and low availability
Low demand and high availability

Emissions TradingEmissions Trading
• cost of the EU ETS is influenced by – carbon intensity of generation mix
– cost of carbon in traded market
– structure of national allocation plans
• cost pass-through is influenced by – level/form of competition
wholesale and retail levels
– regulatory intervention?

Comparison of European Fuel Mixes (%)Comparison of European Fuel Mixes (%)
Coal Oil Gas Nuclear Hydro Other
Ireland 37.6 21.1 37.1 – 2.4 1.7
UK 34.8 1.9 37.2 23.5 1.1 1.6
France 4.5 1.0 3.1 77.1 13.6 0.7
Germany 51.9 1.1 9.9 29.5 3.5 4.1
Italy 13.5 27.6 38.3 – 17.2 3.4
Denmark 47.3 11.1 24.6 – 0.1 17.0
Portugal 29.5 20.2 15.6 – 30.4 4.2

Carbon Price 2005 (€/tCOCarbon Price 2005 (€/tCO22))
Retail CostsRetail Costs
• impact of competition
– positive more choice more efficient pricing signals removal of cost inefficiencies
– negative higher marketing costs more risk (and hence required return) cost pass-through more likely (greater
volatility in prices)

SummarySummary
• drivers for increased prices– continuing generation adequacy pressures– adverse impact of the EU ETS– uncertainty and risk introduced by new trading
arrangements
• drivers for lower prices (or smaller increases)– regulatory intervention?– lack of competition?
• conflict between competition and competitiveness?

Gas Price DriversGas Price Drivers
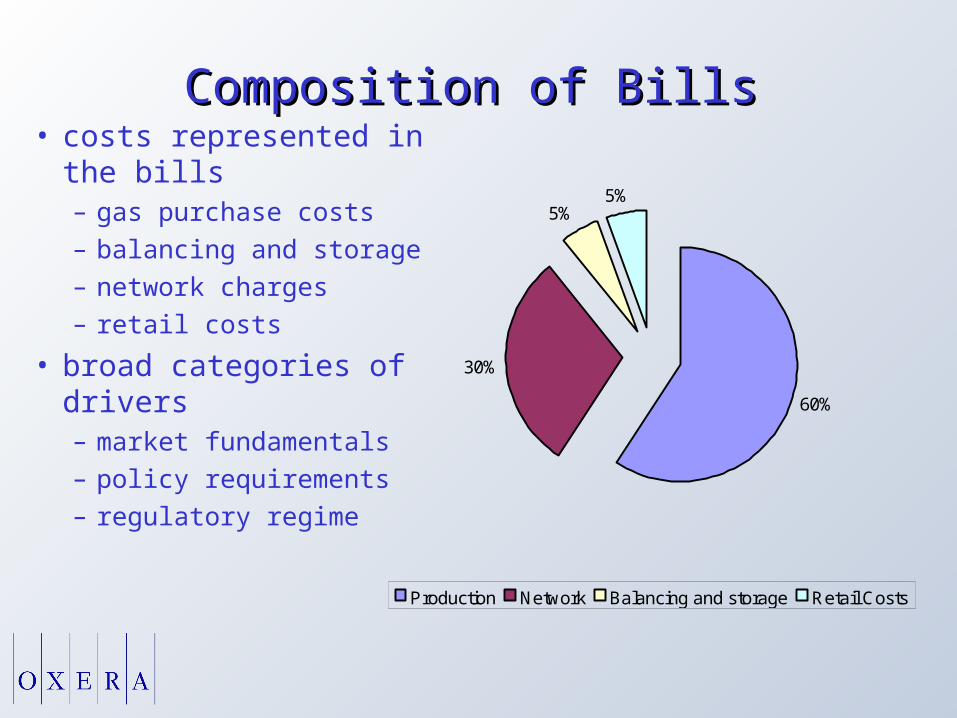
60%
30%
5%5%
Production Network Balancing and storage Retail Costs
Composition of BillsComposition of Bills• costs represented in the
bills– gas purchase costs– balancing and storage– network charges– retail costs
• broad categories of drivers– market fundamentals– policy requirements– regulatory regime

Gas Purchase CostsGas Purchase Costs
• supply–demand balance
– shift in import dependence
– potential benefit of Corrib timing still importing at the margin
– GB as marginal supply source GB gas price drivers important
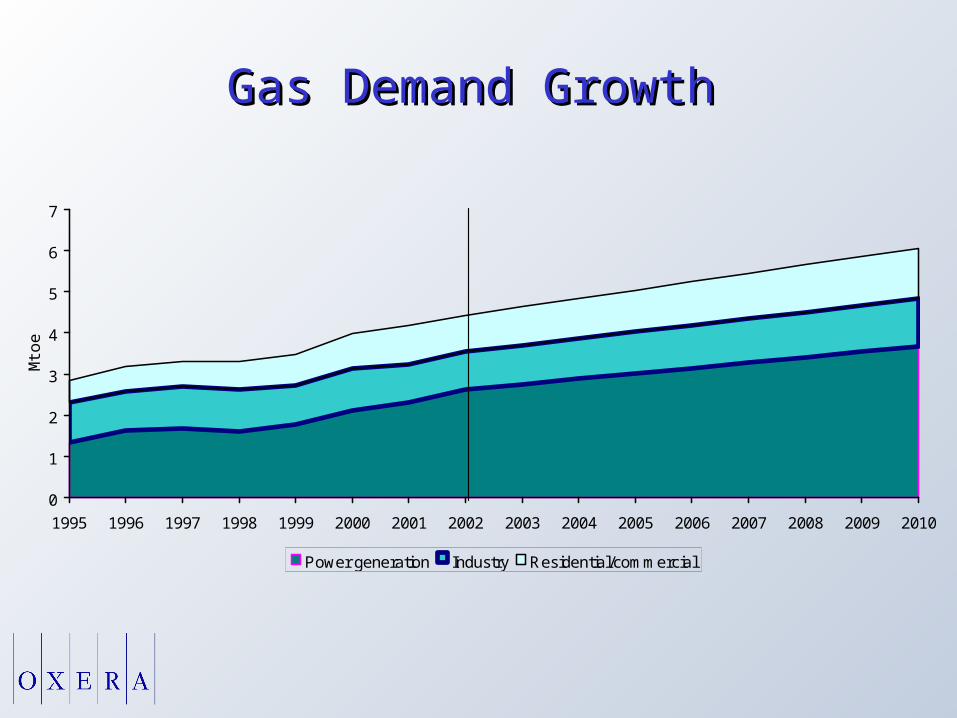
Gas Demand GrowthGas Demand Growth
0
1
2
3
4
5
6
7
1995 1996 1997 1998 1999 2000 2001 2002 2003 2004 2005 2006 2007 2008 2009 2010
Mto
e
Power generation Industry Residential/commercial

Current Gas Supply PositionCurrent Gas Supply Position
0
1
1
2
2
3
3
4
4
5
5
1995 1996 1997 1998 1999 2000 2001 2002 2003
Mto
e
Domestic production Imports

GB Wholesale Gas Price Drivers (I)GB Wholesale Gas Price Drivers (I)
• supply–demand balance– expectation of ‘tighter’ GB position in short to
medium term
– additional anticipated infrastructure investment will ease the position in medium to long term
– rising import dependence
• marginal supply source– increasing use of non-EU/EEA supply sources
higher transport costs greater supply risk need for broad-based import
infrastructure (eg, LNG, pipeline, offshore storage)

GB Wholesale Gas Price Drivers (II)GB Wholesale Gas Price Drivers (II)
• UK–EU gas price covariance– Bacton–Zeebrugge interconnector price arbitrage
from net exports to net imports
• gas-on-gas competition– direct impact of crude oil price increases due to
predominance of long-term, indexed take-or-pay contracts in the EU
NBP forward curve indicates 29–31p/therm to 2005/06

Increasing Import DependenceIncreasing Import Dependence
• UK import dependence rising faster than for the EU– UK import dependence to increase from 9% to 40% in
the period 2004–10– EU import dependence to increase from 43% to 49% in
the same period UK and EU increasingly bidding for the same imported gas
• NBP and ZH spot prices show that– net UK exports resulted in historically lower prices compared with the EU– net UK imports are expected to give higher UK prices compared
with the EU in future if total UK import capacity (ie, pipeline, interconnector, and LNG)
does not keep up with gas demand, UK price competitiveness will deteriorate dramatically (ie, UK becomes a gas ‘island’)

Gas Spot Market DifferentialsGas Spot Market Differentials
NBP ZH Differential (NBP-ZH)
Historical spot1
2002/03 16.043 17.99 -1.947
2003/04 21.075 22.344 -1.269
Calendar year ahead2
2005 30.350 29.013 1.337
2006 28.588 n/a n/a
Gas year ahead2
2004/05 30.463 28.725 1.738
2005/06 29.325 n/a n/a

Gas-on-gas CompetitionGas-on-gas Competition• EU Gas Directive1 expected to result in
– greater TPA
– ‘eligibility’ extended to all gas consumers by 2007 unclear what the actual timescale for greater upstream
competition is, but moving in this direction
• increased competition between gas producers/ shippers expected to be further enhanced by– standard terms for transmission access
– promotion of cross-border trade
• main obstacle to gas-on-gas competition is high wholesale market concentration in many EU countries

Retailing Costs and Price–Cost MarginsRetailing Costs and Price–Cost Margins
• retail competition may increase supply costs– greater marketing effort to gain and retain customers– higher levels of bad debt – front-loading of depreciation charges due to more
aggressive adoption of IT– increased financing charges due to higher business risk
ie, a higher cost of capital
• retail costs should be mitigated by efficiency gains• switching by customers to drive wholesale cost
reductions

SummarySummary
• strong gas demand growth expected• import dependence remains• prices driven by arbitrage considerations
with GB– but increasingly linked to continental prices– slow gas-on-gas competition development
• GB and Ireland at extremities of the transportation network– issues for security of supply?

Thank you
www.oxera.co.uk