Proposing Methodology Pattern for Measuring Public … · Méthode d’ Analyse et de Remontée de...
28
31 JIOS, VOL. 35, NO. 1 (2011), PP. 31-58 JIOS, VOL. 35, NO. 1 (2011) SUBMITTED 10/10; ACCEPTED 03/11 Proposing Methodology Pattern for Measuring Public Value of IT Projects Dinko Kancijan [email protected] [email protected] University of Zagreb Abstract The assessment of the acceptability and the value of IT projects in the public sector, especially when the projects feature the qualitative value along with the monetary one, is a complex problem. There are certain methodologies in the world that help various organizations in decision-making process when projects are being chosen. The paper surveys the three IT projects public value assessing methodologies: the American Value Measuring Methodology, the French MAREVA, and the German WiBe. A comparison of the approaches to solving the problem of assessing public value of IT projects was thus made. The Analytic Hierarchy Process - a method of a multicriteria analysis of alternatives - is presented in details. By the use of the Hierarchy Criteria Model in the way that respects all the basic characteristics that a methodology of the kind should feature in accordance with Gartner, a proposition of an IT project public value measurement methodology pattern was presented. The selection of projects with little value contribution if compared to the existing situation, the assessment of the acceptability of risk through the hierarchy structure of the value of a project and the aggregation of the value of separate PVIT dimensions is a contribution related to the methodology patterns that were surveyed. Keywords: public value of IT, MAREVA, WiBe, VMM, AHP, DEA, PROMETHEE 1. Introduction In line with the contemporary world trends, Croatia has been developing and implementing of IT projects within the public government sector. The implementation of electronic services into the public government comes to its full sense if the users, in comparison with the basic state without the services offered, get some advantage or benefit from the services offered. The potential solutions may vary regarding the benefit it provides for all the parties involved. Taking into consideration the wide scope of the analysis to which the potential solutions are subjected for the purpose of assessment, it is impossible to avoid mixing qualitative and quantitative factors that influence the value of an alternative, especially the one that cannot be expressed in monetary sense: intangible that is, the qualitative or public value of the information technology (PVIT). Finally, a synthesis of the contribution of various factors into a unique PVIT of a single solution mostly poses a larger problem that the analysis itself. For the purpose of an objective analysis of all the factors that influence PVIT, there is a certain number of PVIT measuring methodologies [3],[17],[19],[24] in the world existing as fixed or flexible frameworks for assessment of potential solutions. The paper is divided into five sections. After the Introduction, the situation in the realm is presented in the second section via the basics of the three PVIT assessment methodologies. The presented methodologies are used by the governments and the public governments of the countries in which the methodologies originated: the American The Value Measuring Methodology, the French MAREVA and the German WiBe. A comparison of the analysed methodologies and approaches is presented as well. UDC 001.891:35.073.515
Transcript of Proposing Methodology Pattern for Measuring Public … · Méthode d’ Analyse et de Remontée de...

31
JIOS, VOL. 35, NO. 1 (2011), PP. 31-58
JIOS, VOL. 35, NO. 1 (2011) SUBMITTED 10/10; ACCEPTED 03/11
Proposing Methodology Pattern for Measuring Public Value of IT Projects
Dinko Kancijan [email protected] �������
��������� [email protected] University of Zagreb ���� �����������������������������������������
Abstract The assessment of the acceptability and the value of IT projects in the public sector, especially when the projects feature the qualitative value along with the monetary one, is a complex problem. There are certain methodologies in the world that help various organizations in decision-making process when projects are being chosen. The paper surveys the three IT projects public value assessing methodologies: the American Value Measuring Methodology, the French MAREVA, and the German WiBe. A comparison of the approaches to solving the problem of assessing public value of IT projects was thus made. The Analytic Hierarchy Process - a method of a multicriteria analysis of alternatives - is presented in details. By the use of the Hierarchy Criteria Model in the way that respects all the basic characteristics that a methodology of the kind should feature in accordance with Gartner, a proposition of an IT project public value measurement methodology pattern was presented. The selection of projects with little value contribution if compared to the existing situation, the assessment of the acceptability of risk through the hierarchy structure of the value of a project and the aggregation of the value of separate PVIT dimensions is a contribution related to the methodology patterns that were surveyed. Keywords: public value of IT, MAREVA, WiBe, VMM, AHP, DEA, PROMETHEE
1. Introduction In line with the contemporary world trends, Croatia has been developing and implementing of IT projects within the public government sector. The implementation of electronic services into the public government comes to its full sense if the users, in comparison with the basic state without the services offered, get some advantage or benefit from the services offered. The potential solutions may vary regarding the benefit it provides for all the parties involved. Taking into consideration the wide scope of the analysis to which the potential solutions are subjected for the purpose of assessment, it is impossible to avoid mixing qualitative and quantitative factors that influence the value of an alternative, especially the one that cannot be expressed in monetary sense: intangible that is, the qualitative or public value of the information technology (PVIT). Finally, a synthesis of the contribution of various factors into a unique PVIT of a single solution mostly poses a larger problem that the analysis itself. For the purpose of an objective analysis of all the factors that influence PVIT, there is a certain number of PVIT measuring methodologies [3],[17],[19],[24] in the world existing as fixed or flexible frameworks for assessment of potential solutions.
The paper is divided into five sections. After the Introduction, the situation in the realm is presented in the second section via the basics of the three PVIT assessment methodologies. The presented methodologies are used by the governments and the public governments of the countries in which the methodologies originated: the American The Value Measuring Methodology, the French MAREVA and the German WiBe. A comparison of the analysed methodologies and approaches is presented as well.
UDC 001.891:35.073.515������������ ��������

32
JIOS, VOL. 35, NO. 1 (2011), PP. 31-58
KANCIJAN AND V���� PROPOSING METHODOLOGY PATTERN FOR MEASURING ...
The third section briefly presents some methods for multi-criteria decision making. The Analytic Hierarchy Process (AHP), the method of multi-criteria analysis of a decision, feasible for the analysis of the contribution of qualitative and quantitative factors is presented in details.
The fourth section shows a concept of PVIT measurement framework. Based on papers by both research and consulting companies, the basic setup and characteristics that are necessary for the framework are followed-through. The procedure of assessment of alternatives is roughly analysed. The feasibility of the AHP is seen through the value structure at the assessment of value as well as at the assessment of risk. The directives for selecting individual alternative are included.
The Conclusion contains a synthesis of the matters presented in the paper as well as the perspective on the activities requested in terms of a further development of the framework proposals.
2. Overview and comparison of some of IT value measurement methodologies From the literature [3],[17],[19],[24] it is known that a certain number of models and frameworks has developed in the last 15 years with the purpose of measuring the value of investments into the IT in public sector. This section shows the basics of the three PVIT measuring methodologies and a comparison of their basic characteristics.
2.1. The Value Measuring Methodology - VMM
The American methodology, The Value Measuring Methodology (VMM), was set up in 2002 with the purpose of creating efficient tools for assessing the value of the Government's e-services, the tools applicable in all the segments of the American federal government. It is a flexible framework for "... measurement of the value of government e-services ..." [3].
2.1.1. Decision-making framework
A decision-making framework provides for setting up a structure for defining the goals, endeavours, alternative analysis and the assessment of performances [4].
The value structure provides for describing and determining of usefulness priorities through two layers. In the first layer, an alternative is viewed through five value factors [4]: (1) Direct user value; (2) Social value; (3) Government financial value; (4) Government operational and foundational value; (5) Strategic/political value. The contributions of the value factors (priorities) are determined via the Analytic Hierarchy Process.
The second layer identifies and defines the standardized value measurements in the qualitative sense, depending on the value factor and goals and criteria of an organization [8].
The risk structure provides for the assessment of the influence of risks on the performance (value) decrease, the implementation aggravation or costs increase. It in turns enables the identification of the potential risk factors and provides the person who makes the decision with the information on the risk tolerance - the acceptable cost excess and the acceptable performance decrease [4].
The Cost Element Structure - by means of a profound cost estimate-contributes to lowering the sundry expenses risk or multiple calculation risk [4].
2.1.2. Analysis of alternatives
Identifying and defining of alternatives - The term 'alternative' in this context stands for any specific endeavour (e-service) of e-government. The fact that an e-service can be delivered to users in several ways has been taken into consideration. Base Case is analysed in every situation and it in turns shows the influence of the identified factors on value and costs in case when an alternative is not deployed, i.e. when no action has been taken [4].

33
JIOS, VOL. 35, NO. 1 (2011), PP. 31-58
JOURNAL OF INFORMATION AND ORGANIZATIONAL SCIENCES
Value and cost estimate - performed on the basis of the Cost Element Structure (CES) - the structure that englobes approximately 50% of expenses systematised into three groups [4]: (1) Planning and development; (2) System acquisition and implementation; (3) System functioning and maintenance. Performing the risk analysis - the whole scope of risks is analysed in order for the factors and a suitable strategy to be depicted. A scale of the level of risk probability and influence on a project is thus made. The scale of the influence of a risk on the project is made as well, costs are calculated and the value that takes the risk into consideration is assessed [4].
2.1.3. Setting up information and interpreting results
Value - is the result of value calculation and it is a unique value that is aggregated from all the expected and assesed values of an alternative in accordance with the established value hierarchy. In that sense, the value can be observed as a relation of any single alternative with the established measure system or as an indicator of comparison with other alternatives - an alternative with a higher total value is preferred. Furthermore, in the decision-making process, the value can represent the share of the potential value an alternative can deliver [4]. Value and cost comparison - the alternatives that have been analysed within the same decision-making framework can be compared via their value/cost ratio (VCR). From the investment point of view, an alternative with a higher VCR is better here because it means that the alternative gives more value with less investment [4]. Value and cost comparison in accordance with a risk - depending on the risk tolerance an organization chooses, the acceptability of alternatives in accordance with the influence of a risk on value and costs is analysed. As for both the viewpoints, an alternative with a lower risk level is more acceptable. In case that an alternative exceeds the tolerance limits, the way of alternative evaluation or risk evaluation (depending on the viewpoint) is to be revised [4].
2.2. Méthode d’ Analyse et de Remontée de la Valeur - MAREVA
The methodology (MAREVA - Method of Value Analysis and ROI) was developed through the cooperation of the French Electronic Administration Development Agency (ADAE) and consulting company Bearing Point in 2004. It has been used for assessing of more than 140 projects in France (and in some other countries) and it has seen several versions developed on the basis of experience and suggestions from users. The currently available information indicates that there could be no further method developments [23].
2.2.1. Analysis of alternatives
The value analysis is of quantitative and qualitative nature and it is based on the five components [17]: (1) Profitability for state; (2) Risk control; (3) External consideration for individuals; (4) Internal consideration public domain; (5) Necessity of project.
Profitability calculation: This includes the analysis of total project costs, recurring gain, the break-even point (BeP), the internal level of return (ILR) and the net present value (NPV). The results are in turn used in the analysis of value through the profitability for the state [17].
Value analysis: The segments of analysis and the way of scoring have been proposed in [17] for the purpose of evaluating each of the aspects. A detailed model workout with parameters and assessment scales is given in [18]. Within every value aspect of the project, there is a branched questionnaire with the appropriately scored pre-defined answers. The total score for each of the aspects is converted by means of the ranking tables into four rank intensities from "A" to "D", where "A">"D".
2.2.2. Interpretation of results
The results of the analysis are presented in a form of a "radar" diagram showing the intensity ranks assigned to each of the five assessment aspects. The methodology does not incorporate

34
JIOS, VOL. 35, NO. 1 (2011), PP. 31-58
KANCIJAN AND V���� PROPOSING METHODOLOGY PATTERN FOR MEASURING ...
a synthesis of the five separate ranks into a unique project rank because of, as it is stated in [17], the diversity of criteria in accordance with witch the project has been assessed.
2.3. Wirtschaftlichkeits-Betrachtung - WiBe 4.0
The first version of the WiBe methodology (WiBe - Profitability analysis) was developed in 1992 and evolved into its 4th version in 2004. The methodology is a German product originally intended for assessing the economic efficiency of IT projects. By means of the development and use of various criteria, the deployment in other sorts of projects was made possible [19].
The framework of the methodology consists of three modules [19]: (1) Monetary economic efficiency; (2) Extended economic efficiency; (3) Economic efficiency from the external viewpoint (external effects).
2.3.1. Analysis of alternatives
Monetary economic efficiency: The benefits and costs of a project expressed in money are analysed and the balance and net present value (NPV) calculated. The rule that applies is that a project is economically efficient if its "net present value is positive and if no risk markup were applayed to the criteria" [19]. Otherwise, it is obligatory to perform an additional risk analysis and a broadened economic efficiency analysis [19].
Extended economic efficiency: The focus of extended efficiency is on the "qualitative aspects and effects of the project" [19] and it is thus - in the interest of the methodology and regardless of NPV- desirable to assess it. In case of a negative NVP, a broader analysis is obligatory. This part of analysis consists in analysis of quality in two aspects [19]: (1) Urgency of IT measure; (2) Qualitative and strategic importance.
External effects: Certain IT project can have an essential effect on the external partners. The criteria in accordance with witch the project is assessed represent an analysis performed from the point of view of the external partners [19].
The assessment of extended effectiveness and external effects: For each group of benefits, a criteria catalogue has been set up assigning certain importance (weight) to the criteria. The sum of weights within an aspect amounts 100. The assessment of the project is performed by assigning a mark from the 0 to 10 interval in accordance with the proposed scale of the meaning of the marks and in accordance with each individual criterion. The sum of marks and corresponding weights multiplied is divided by 100. The result obtained in this way is the value of the project within the implied aspect. It is important to point out as to the extended project efficiency analysis that the maximal score per certain criteria (10 points) can be the trigger for the mandatory project implementation although the monetary effectiveness does not imply so [19].
2.3.2. Interpretation of results
The rules of the result interpretation methodology say [19]: (1) NPV > 0 - "The project is economically effective in monetary terms ...". (2) NPV < 0 - "The project can be economically efficient in the broader sense, under
special conditions" a) Maximal marks in criteria defined as mandatory (must): "IT measure must be
carried out" . b) Maximal marks in criteria defined as almost mandatory (quasi-must): "IT
measure can be carried out". c) The values from the aspect of urgency and/or quality and strategic importance
and/or external effects are high (>50): "IT measure can be carried out".

35
JIOS, VOL. 35, NO. 1 (2011), PP. 31-58
JOURNAL OF INFORMATION AND ORGANIZATIONAL SCIENCES
Comparing and ranking of a larger number of projects can be done [19]: (1) in accordance with NPV exclusively; (2) in special cases, based on budget-important costs and benefits, urgency analysis, quality and strategic importance analysis and external effects.
2.4. Comparison of the analysed methodologies
A comparison of the analysed methodologies shows some similarities in assessing the problem of measuring the value of IT projects. The common features can be summed up into three aspects of the total value of a project: (1) Costs and benefits that can be quantified - expressed monetary (2) Cost/benefit that is qualitative (intangible) and impossible to express in a monetary value (3) Risk, its structure and the influence on costs and the value of a project.
2.4.1. Costs
The analysed methodologies use a sort of pre-defined structure (catalogues) of costs, which enables a high level of reliability as to englobing all the categories of costs that can occur within the life cycle of a project. Each of the analysed methodologies uses some of known methods of calculating the economical value of a project (NPV, ROI, IRR, BeP) on which the assessments of eligibility of the project in the financial sense are based. Some of the methodologies use the calculated economic value directly (VMM, WiBe), whereas some of them fill the obtained economic values into the intensity ranks (MAREVA).
2.4.2. Risk
The approach to risk and its contribution to the total result is fairly different. Depending on a methodology, the risk assessment is performed as follows: a) VMM: Risk inventory taking in accordance with the generally accepted risk classification
(OMB, 8 risk classes) that can be adjusted to the specific features of the researched field. The analysis of the influence of risk on costs and on the qualitative value of an alternative are performed separately. A risk acceptance/aversion border is set up as a function of costs and value.
b) MAREVA: Risk is assessed on the basis of a questionnaire with a pre-defined risk classification into four classes and scoring of answers. From the risk manageability perspective, the total score is sorted into the four intensity ranks.
c) WiBe: Risk is taken into consideration in the monetary sense, through the influence on the cost increase and benefit decrease in the course of time.
2.4.3. Qualitative (non-monetary) value
Each of the methodologies provides for analysing of alternatives even through the aspects that are of a qualitative value and are not (or are very difficult to be) expressed in the monetary sense. Basically, the qualitative value of an alternative is expressed through two aspects: a) Internal: the contribution of the alternative to the organization itself and to the interaction
of the organization with other organizations within the public sector. b) External: the contribution of the alternative to the environment, i.e. to users and the
community as a whole. Depending on a methodology, the analysis of value and the expressing of value are
performed through: a) Hierarchy structure of the value factors, the corresponding criteria and their (variable)
weights that are the result of the AHP method as well as through the sum of the scores resulting from the deployment of the intensity scales developed for every individual model (VMM). The value of an alternative is expressed in the 0 to 1 interval.

36
JIOS, VOL. 35, NO. 1 (2011), PP. 31-58
KANCIJAN AND V���� PROPOSING METHODOLOGY PATTERN FOR MEASURING ...
b) A group of criteria with in-advance associated fixed values of weights and summing of contributions of predefined scores by criteria (WiBe). The value is expressed in the 0 to 100 interval.
c) Aspects with pre-defined questionnaires and pre-defined scoring of answers and post-classification of the score into four ranks of the intensity of the final mark (A>B>C>D) by each of the aspects (MAREVA).
2.4.4. Synthesis and interpretation of results
For some of the methodologies (MAREVA, WiBe), it is characteristic that they yield single results for each of the aspects/dimensions instead of one aggregated value of alternative. In this way, what has left for an analyst to do is to compare alternatives by separate aspects and make a decision as to choice. Unlike the former methodologies, VMM yields an aggregated value of alternative.
Furthermore, VMM provides for a comparison of the relation between value to costs ratio (VCR) for alternatives that has been assessed in accordance with the same models; the choice of an alternative with higher VCR as a better investment is thus possible.
MAREVA presents results for the five aspects divided into four classes (A-D) in the shape of "radar" diagram. Regardless of a coarse resolution, it can be concluded that the larger area in the diagram presents an alternative that is better in total, which is not especially practical when a comparison of more alternatives is implied.
WiBe presumes a positive NPV and/or at least 50% of points by some of the dimensions of value in the extended analysis as a condition for a choice of an alternative. The full score achieved in a certain criterion in the extended analysis can be a trigger of a mandatory deployment of an alternative.
Methodology
Component of evaluation VMM MAREVA WiBe 4.0
(1) Cost
� Cost Element Structure (CES)
� ROI � (BCR, SIR, IRR, NPV)
� NPV, BeP, IRR � Avoided costs � Scoring scale and the
conversion to the priorities from "A" to "D" (A>B>C>D)
� General catalogue of criteria (dimension: economic performance in monetary terms - profitability)
� NPV, NPV stability
(2) Risk
� Risk inventory (8 risk categories defined by OMB)
� Impact on the cost increase � Impact on reducing the
value � Boundaries preferences /
risk aversion
� Four areas of risk (design, legal, technical, developmental)
� Predefined questionnaires with scoring
� Scales for conversion to the priorities from "A" to "D" (A> B> C> D)
� By certain groups of criteria in monetary terms (costs, benefits)
� Reduction of monetary benefits / costs increase
� Impact on the calculation of NPV
(3) Value
Five value factors: (each can contain a number of criteria defined by analyst) � Direct Customer (User) � Social (non-User/Public) � Government/Operational
Foundational � Strategic/Political � Government Financial Evaluation: � Normalized ratings (0-100) � Analyst defines ratings Calculation: � Weight factors are derived
with AHP
Factors / aspects: (each contains a number of predefined criteria) � Internal aspect � External aspect � Necessity Evaluation: � Predefined questionnaires
for each aspect / element with predetermined points
Calculation: � Scoring according to a
predetermined scale and convert to the priorities from "A" to "D" (A> B> C> D)
Extended analysis: (Enhanced economic efficiency) � Urgency � Qualitatve and strategic
importance � External effects Evaluation: � Separately for each
criterion / aspect (urgency, qualitative, external effects)
� Catalogue with predetermined sub-criteria weights within the major criteria

37
JIOS, VOL. 35, NO. 1 (2011), PP. 31-58
JOURNAL OF INFORMATION AND ORGANIZATIONAL SCIENCES
Methodology
Component of evaluation VMM MAREVA WiBe 4.0
� Multiply normalized ratings by criteria weights within the individual factors
� Sum of values by factors in the aggregate value in the range 0 - 100 (%)
� Predetermined rating scale (normalized, 0-10) for each subcriteria
Calculation: � Sum of products of weight
and scored points in every aspect
� Independent ratings for each criterion / aspect (0-100)
Synthesis and interpretation
of results
� Boundaries to risk tolerance for the value and costs
� The alternatives evaluated by the same model: BCR / VCR
� Consideration of the impact of risk on the value and costs
� Consider the value and cost with respect to the risk
� Five aspects (profitability, risk, internal aspect, external aspect, necessity) ranked in priority from "A" to "D"
� Displayed in a form of "radar" graph
� NPV > 0 (first) Otherwise, according to the results of extended analysis: � ������ �� �������� ���
50) � Qualitative and strategic
���������� ��� ��� � External effects � Maximum rating (10)
according to certain criteria in an extended analysis can be a trigger for initiating the project, regardless of other results of the analysis
Table 1: Comparative overview of main characteristics of the analysed methodologies
3. Brief overview of the methods for the multicriteria decision making This paragraph shows some of multicriteria decision analysis methods. The references mention various methods of the multicriteria analysis in the realm of IT/IS projects selection, and one of them is PROMETHEE [1],[2], DEA [6],[5] and AHP [3],[4],[8].
As it is to be used in the methodology pattern, the method Analytic Hierarchy Process and the reasons for choosing the metod are to be presented in a separate subparagraph.
3.1. Preference Ranking Organisation Method for Enrichment Evaluation - PROMETHEE
The PROMETHEE method belongs to the group of multi-criteria analysis methods. Alternatives are described by several attributes that are in turn used as qualitative and quantitative criteria [14]. It comprises of the PROMETHEE I and PROMETHEE II method intended for a partial (I) or a complete (II) ranking of alternatives [14],[2]. Further development has offered some additional versions of the method that are intended for support in more complex decision-making problems [2].
There are two important steps in the method [14]: (1) Forming the relation of preference; (2) The use of the relation of preference from the previous step. In the first step, the decision-maker has to express his/her preferences as to two alternatives per each criterion. The intensity of preference shows the function P in accordance with the following [14]: (1) P(a,b) = 0 - indifference between a i b; (2) ����� �!�"� - weak preference of a over b; (3) ����� �!�#�- strong preference of a over b; (4) P(a,b) = 1 - strict preference of a over b. The preference function is for each criterion defined as P(a,b)=P(f(a)-f(b))=P(d), where f is criterial value [14].
38
JIOS, VOL. 35, NO. 1 (2011), PP. 31-58
KANCIJAN AND V���� PROPOSING METHODOLOGY PATTERN FOR MEASURING ...
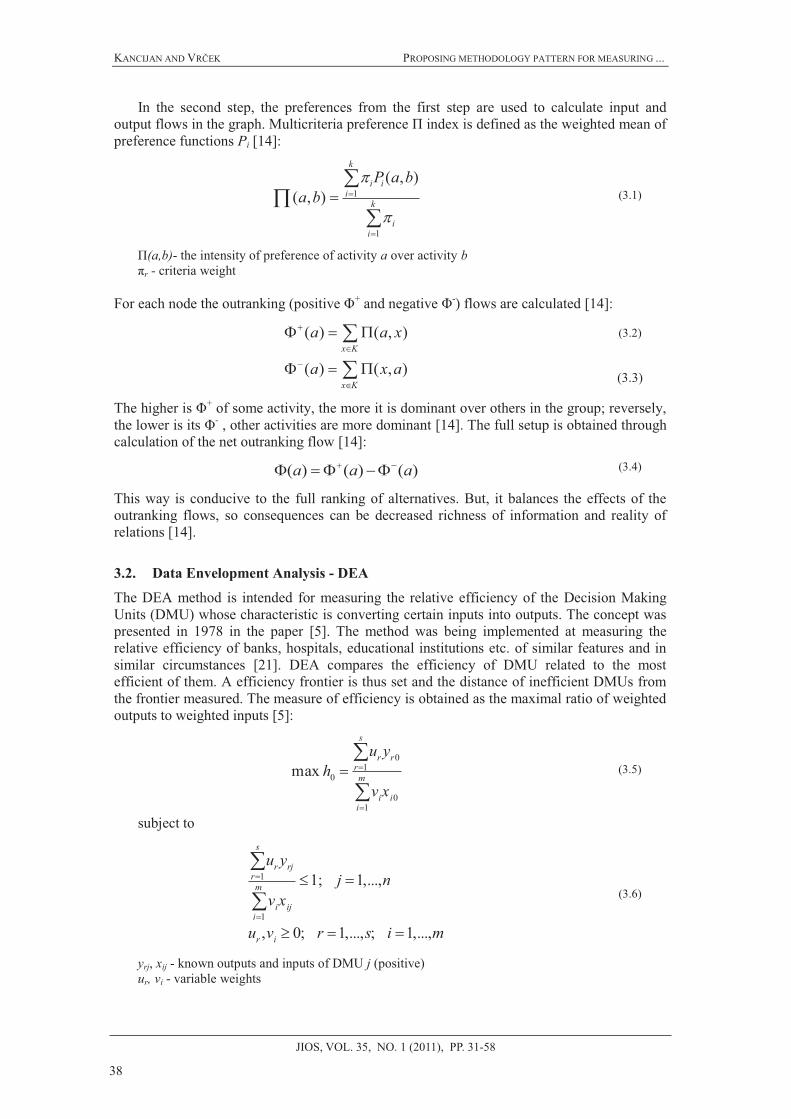
In the second step, the preferences from the first step are used to calculate input and ������ ���� �� ��� ����� !����������� ���������� " ��#�$ �� #�����# �� ��� �������# ���� �� preference functions Pi [14]:
1
1
( , )( , )
k
i ii
k
ii
P a ba b
�
��
�
��
��
(3.1)
"(a,b)- the intensity of preference of activity a over activity b %r - criteria weight
&�� ���� ��#� ��� ������'��� �������(� )+ ��# ������(� )-) flows are calculated [14]:
( ) ( , )
( ) ( , )x K
x K
a a x
a x a
�
�
�
�
�
�
�
�
(3.2)
(3.3)
*�� ������ �� )+ of some activity, the more it is dominant over others in the group; reversely, ��� ���� �� ��� )- , other activities are more dominant [14]. The full setup is obtained through calculation of the net outranking flow [14]:
( ) ( ) ( )a a a� � � � (3.4)
This way is conducive to the full ranking of alternatives. But, it balances the effects of the outranking flows, so consequences can be decreased richness of information and reality of relations [14].
3.2. Data Envelopment Analysis - DEA
The DEA method is intended for measuring the relative efficiency of the Decision Making Units (DMU) whose characteristic is converting certain inputs into outputs. The concept was presented in 1978 in the paper [5]. The method was being implemented at measuring the relative efficiency of banks, hospitals, educational institutions etc. of similar features and in similar circumstances [21]. DEA compares the efficiency of DMU related to the most efficient of them. A efficiency frontier is thus set and the distance of inefficient DMUs from the frontier measured. The measure of efficiency is obtained as the maximal ratio of weighted outputs to weighted inputs [5]:
subject to
yrj, xij - known outputs and inputs of DMU j (positive) ur, vi - variable weights
�
�
��
�
01
0
01
max
s
r rrm
i ii
u yh
v x (3.5)
�
�
� �
� � �
�
�1
1
1; 1,...,
, 0; 1,..., ; 1,...,
s
r rjrm
i iji
r i
u yj n
v x
u v r s i m
(3.6)

39
JIOS, VOL. 35, NO. 1 (2011), PP. 31-58
JOURNAL OF INFORMATION AND ORGANIZATIONAL SCIENCES
The mathematical model of the fractional linear programming makes possible that the input and output weights for any individual DMU are calculated and thus the efficinecy of the DMU is maximized. The result is the divison of DMUs into efficient (h=1) and inefficient (h<1) ones [21].
The advantages of the method are: (a) the relation between input and output is taken for granted, but there is no need for the relation to be expressed explicitly in terms of mathematics; (b) applicability at a multiple inputs and outputs; (c) the method can be used for various input/output measurements; (d) it provides for the analysis of inefficiency [21].
There are some of disadvantages of the method: (a) an increase in the number of input/output variables increases the number of DMUs at the efficient frontier - low resolution problem; (b) the best specification (theoretical maximum) cannot be tested; (c) for a large number of inputs, outputs and DMUs problems can be computationally intensive [21].
3.3. The Analytic Hierarchy Process - AHP
In the 1970s, Thomas L. Saaty developed the Analytic Hierarchy Process (AHP) method. The AHP makes possible for the person that makes the decision to present a complex problem as a hierarchy structure of the relation among the goal, criteria and alternatives.
3.3.1. Description of the Analytic Hierarchy Process
The AHP is based on pairwise comparison of structure elements to the purpose of their priority relations, i.e. their relative weights. This makes possible for the person who decides to concentrate on the comparison of just two elements, which is a characteristic close to the human way of thinking. The AHP is a compensational decision-making methodology because it can make up for the lack of alternative for some of criteria with the advances the alternative features for other criteria [13].
The comparison of the structure elements is performed in every node of the hierarchy structure by assigning intensity of importance in accordance with the importance intensity scale, so-called Saaty's scale (Table 2). Each verbally presented importance of intensity has its numerical interpretation.
Table 2: Scale of relative importance (source: [20])
The method provides for a comparison of qualitative and quantitative factors by means of determining the relative preference as to some of the factors for the person who makes the
Intensity of Importance Definition Explanation
1 Equal importance Two activities contribute equally to the objective.
3 Weak importance of one over another Experience and judgement slightly favour one activity over another.
5 Essential or strong importance Experience and judgement strongly favour one activity over another.
7 Demonstrated importance An activity is strongly favoured and its dominance is demonstrated in practice.
9 Absolute importance The evidence favouring one activity over another is of the highest possible order of affirmation.
2, 4, 6, 8 Intermediate values between the two adjacent judgements When compromise is needed.
Reciprocals of above nonzero numbers
If an activity i has one of the above non-zero numbers assigned to it when compared with activity j, then j has the reciprocal value when compared with i.

40
JIOS, VOL. 35, NO. 1 (2011), PP. 31-58
KANCIJAN AND V���� PROPOSING METHODOLOGY PATTERN FOR MEASURING ...
decision. The flow of the Analytic Hierarchy Process can be presented in four steps [13]: (1) Analysis; (2) Importance assessment; (3) Local weights calculation; (4) Sensitivity analysis.
During analisys the decision-making problem is converted into a hierarchy structure of the objective, the criteria and alternatives. Importance assessment is a comparison in the pairs of elements in every node of the hierarchy structure. In step local weights calculation priorities are calculated for each of the nodes of the hierarchy structure and for alternatives at the lowest level. The total priorities of alternatives are calculated through ponderation of the local priorities with the weights of all the superior nodes and their addition in the objective (synthesis). Sensitivity analysis is performed with the purpose of assessing the sensitivity of the structure to changes in the relation of elements in individual nodes of the structure and assessing the influence the change causes in the priorities of alternatives and the final result [13].
3.3.2. Mathematical base of the AHP method
As an example in presenting the mathematical background of AHP, n objects can be used that are to be compared in pairs taking into consideration their relative weights. At a node K of a hierarchy structure, the objects are marked as A1, ..., An, and their relative weights as w1, ..., wn. Relations between their relative weights can be written in the form of the following matrix [20]:
With the substitution wi /wj=aij matrix A can be written as [12]:
The characteristics of the matrix A are [12]: (a) all the lines are proportional to the first line; (b) the values of all elements are positive (aij>0); (c) the values at diagonal are 1 (aii=1); (d) the values are reciprocal (aij=1/aji).
If the assessments are consistent (aij=aikakj), the following equation is valid [12]:
Due to the characteristics, matrix A has only one eigenvalue that is not 0 and equals n. Regarding that it is usually not possible to attain consistent assessments in practice, the weight vector w is obtained through solution to the equation [12]:
where $max is the maximum eigenvalue of A. As the characteristic $max%�� is valid, the difference $max-n is used for measuring the consistency of assessments. By means of introducing the consistency index [20]:
�
1 2
1 1 11
1 2
2 2 22
1 2
1 2
n
n
n
n n nn
n
A A Aw w wAw w ww w wAw w w
w w wAw w w
A
(3.7)
�� �� ��� �� �� �
111 12
221 22
1 2
n
n
n n nn
aa aaa aA
a a a
(3.8)
�Aw nw (3.9)
�� �max( ) 0A I w (3.10)
41
JIOS, VOL. 35, NO. 1 (2011), PP. 31-58
JOURNAL OF INFORMATION AND ORGANIZATIONAL SCIENCES
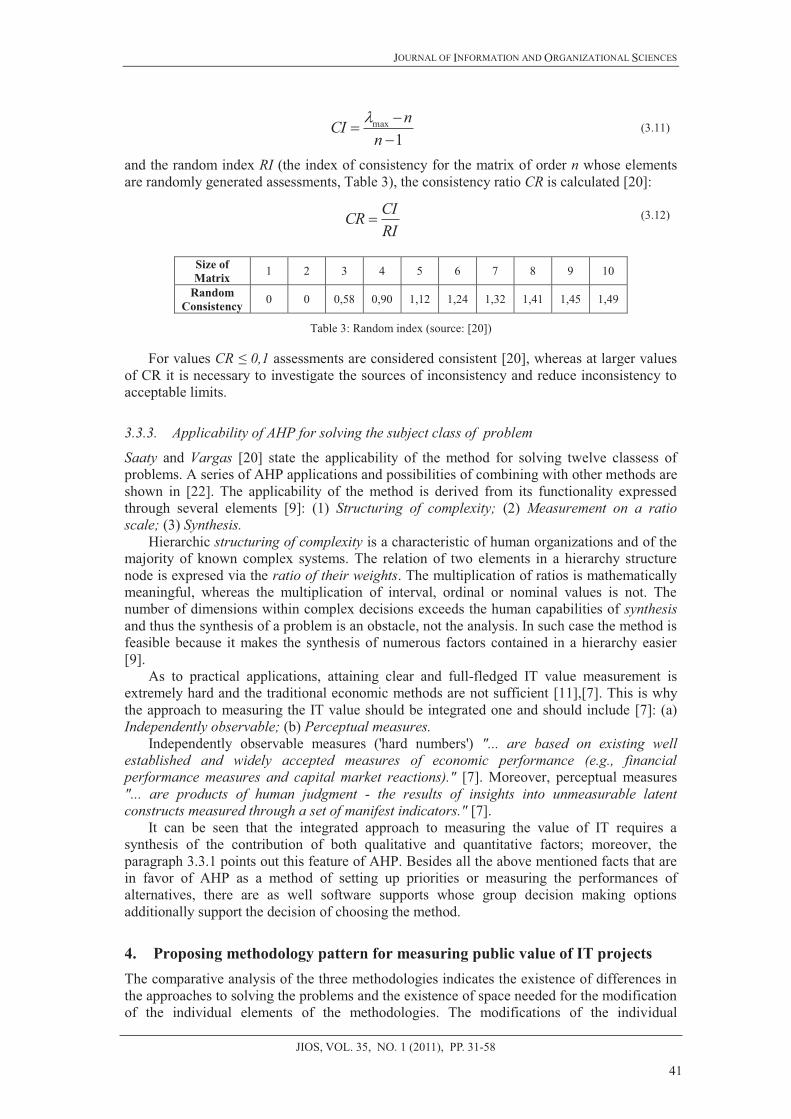
and the random index RI (the index of consistency for the matrix of order n whose elements are randomly generated assessments, Table 3), the consistency ratio CR is calculated [20]:
Size of Matrix 1 2 3 4 5 6 7 8 9 10
Random Consistency 0 0 0,58 0,90 1,12 1,24 1,32 1,41 1,45 1,49
Table 3: Random index (source: [20])
For values &'�(�",1 assessments are considered consistent [20], whereas at larger values of CR it is necessary to investigate the sources of inconsistency and reduce inconsistency to acceptable limits.
3.3.3. Applicability of AHP for solving the subject class of problem
Saaty and Vargas [20] state the applicability of the method for solving twelve classess of problems. A series of AHP applications and possibilities of combining with other methods are shown in [22]. The applicability of the method is derived from its functionality expressed through several elements [9]: (1) Structuring of complexity; (2) Measurement on a ratio scale; (3) Synthesis.
Hierarchic structuring of complexity is a characteristic of human organizations and of the majority of known complex systems. The relation of two elements in a hierarchy structure node is expresed via the ratio of their weights. The multiplication of ratios is mathematically meaningful, whereas the multiplication of interval, ordinal or nominal values is not. The number of dimensions within complex decisions exceeds the human capabilities of synthesis and thus the synthesis of a problem is an obstacle, not the analysis. In such case the method is feasible because it makes the synthesis of numerous factors contained in a hierarchy easier [9].
As to practical applications, attaining clear and full-fledged IT value measurement is extremely hard and the traditional economic methods are not sufficient [11],[7]. This is why the approach to measuring the IT value should be integrated one and should include [7]: (a) Independently observable; (b) Perceptual measures.
Independently observable measures ('hard numbers') "... are based on existing well established and widely accepted measures of economic performance (e.g., financial performance measures and capital market reactions)." [7]. Moreover, perceptual measures "... are products of human judgment - the results of insights into unmeasurable latent constructs measured through a set of manifest indicators." [7].
It can be seen that the integrated approach to measuring the value of IT requires a synthesis of the contribution of both qualitative and quantitative factors; moreover, the paragraph 3.3.1 points out this feature of AHP. Besides all the above mentioned facts that are in favor of AHP as a method of setting up priorities or measuring the performances of alternatives, there are as well software supports whose group decision making options additionally support the decision of choosing the method.
4. Proposing methodology pattern for measuring public value of IT projects The comparative analysis of the three methodologies indicates the existence of differences in the approaches to solving the problems and the existence of space needed for the modification of the individual elements of the methodologies. The modifications of the individual
� ��
�max
1nCI
n (3.11)
�CICRRI
(3.12)

42
JIOS, VOL. 35, NO. 1 (2011), PP. 31-58
KANCIJAN AND V���� PROPOSING METHODOLOGY PATTERN FOR MEASURING ...
elements, their various combinations or different approaches to the analysis of a problem should yield a method that is easy to use and that is capable of providing for a simpler comparison of alternatives and that as well means a simpler procedure of choosing the most feasible alternative.
The authors used the possibility of recombining the analysed models for the purpose of establishing a pattern and the PVIT measuring hierarchy model of their own. Unlike the above-analysed patterns, this authors' own one features the value acceptability threshold as an indicator of improvements in case of the implementation of a project and as a tool for eliminating projects whose contribution to value is too low. Furthermore, by means of evaluation the decreased value risk through the hierarchy structure, the pattern - if compared to other mentioned patterns- brings a different approach to the risk evaluation. The aggregation of the values of dimensions into a unique PVIT is a contribution to a simpler comparing of a larger number of projects. In the section that follows, the focus is set on the PVIT measuring pattern.
4.1. Public value of IT
The public value of IT was defined by Gartner as "measures that demonstrate how IT-related changes and investments contribute over time to improved constituent service level, operational efficiency and political return" [24]. From this definition it can perceive three dimensions of PVIT [24]: (1) Constituent service level; (2) Operational efficiency; (3) Political return.
Each of dimensions measure impact of investment on: (1) cost and time of users with respect to quality and accessibility of e-service; (2) departmental and interdepartmental relation of governmental organizations; (3) economy, political goals, overall society, etc. [24].
Furthermore, the Gartner study "Value for Money is not enough in Public Sector IT Projects" points on key features that are important for PVIT measuring framework [24]: (1) PVIT dimensions; (2) Value separation; (3) Balance; (4) Multiple vs. single value score; (5) Inclusion of risks; (6) Mandatory use.
The Gartner view on the dimensions of public services and the basic characteristics of the PVIT measuring framework make the basic rules that were obeyed at developing the proposal for PVIT measurement pattern.
4.2. Concept of methodology pattern
The basic idea is that a methodology should provide for analysing an IT project through three aspects as it was established in the previous section: (1) Evaluation of costs and benefits that can be quantified (2) Evaluation of quality benefits (values) that cannot be quantified in financial terms (3) Evaluation of risk and its influence on costs and quantitative values
This paper focuses on the model for evaluating values with qualitative character and the risk evaluation based on the model.
4.2.1. Benefits / values with qualitative character
Non-monetary aspect of a project comprises benefits or values that are hard or impossible to be expressed in monetary terms and from which the organization, users or society as a whole do benefit. From the analysed methodologies [3],[17],[19] it can be derived or obtained following common dimensions of the PVIT: a) Internal - value for the organization of the service provider (department) and among
organizations (departments) in the public sector b) External - the value for the project users (citizens, economy, ...)

43
JIOS, VOL. 35, NO. 1 (2011), PP. 31-58
JOURNAL OF INFORMATION AND ORGANIZATIONAL SCIENCES
c) Strategic - the value of the project for the state and the society as a whole (strategies, objectives, regulations, ...)
Figure 1: Principled framework for evaluating public value of IT
This classification is in line with the Gartner concept of the dimensions of the public value of IT and the basic feature 1 - PVIT dimensions (Section 4.1). The value is presented via three independent constituents that were observed separately. In case of need, it is possible for them to be aggregated into the expected value of an alternative in a balanced way and with equal priorities (contributions). As the concept obeys the condition of balance, it therefore conforms to the key features 2 - Value separation and 3 - Balance. Within the hierarchy of each of constituents, there is a certain number of criteria and subcriteria of various weight (priorities) that contribute variously to the value of each individual constituent, all of which is in conformity with the key feature 4 - Multiple vs. single value score. Each constituent can have a certain number of factors, i.e. criteria clusters by which characteristic values of a project are measured. The pattern is envisaged in the way that gives it as much flexibility as possible. Because of that, the evaluating framework (Figure 1) is shown through a principled hierarchy structure where the structure, at the level of dimensions, clusters and criteria, can be variable in accordance with the attitude of an analyst.
4.2.2. Risk evaluation
According to a definition, "Risk is a measure of the probability and consequence of not achieving a defined project goal." [15]. Risk comprises uncertain events or states that, in case of being fulfilled, have a negative impact on at least one of project objectives. So, it can be written that [15]:
Regarding that the amount of risk influences the public value of a project and that AHP is intended to be used to calculate PVIT, it is meaningful to convert the risk (less is better) that is a cost criterion into the reverse proportional category acceptability of risk. In this way, the risk evaluation is turned into analysis of benefit criterion (more is better). In this case, it is possible to adjust the expected value of a project from the aspect of acceptability of risk. For that purpose, the scale of probability that an event will occur should be converted into the scale of probability that an event will not occur, i.e. that there will not be any loss in some of the PVIT components. Based on references [16],[25], in Table 4, the authors suggested the intensities of probability (Intensity_1, Intensity_2) as a mean of the quantitatively expressed probability interval. This rule is not applied only when the highest probabilities are implied (where the intensities equal 1).
( , )Risk f probability consequence� (4.1)
INTERNAL VALUE
EXTERNAL VALUE
STRATEGIC VALUE
PVIT
� departmental � interdepartmental
� business � citizens � common
� political goals � impact on society � necessity

44
JIOS, VOL. 35, NO. 1 (2011), PP. 31-58
KANCIJAN AND V���� PROPOSING METHODOLOGY PATTERN FOR MEASURING ...
Intensity_1 [Authors]
Probability ratings [16] Intensity_2 [Authors]
Word-to-probability relationship [25]
Quantitative Likelihood Quantitative Verbal 0,100 0,0-0,2 Remote 0,125 0,000-0,250 Very Unlikely 0,300 0,2-0,4 Unlikely 0,325 0,250-0,400 Unlikely 0,500 0,4-0,6 Likely 0,500 0,400-0,625 Even 0,700 0,6-0,8 Highly Likely 0,713 0,625-0,800 Likely 1,000 0,8-1,0 Near Certainty 1,000 0,800-1,000 Very Likely
Table 4: An examples of probability intensities / ratings
Regarding that the intervals in both represented cases differ just slightly, the values of the probability intensity may vary in dependence with the tolerance of an analyst to risk. The analysis of the factors that influence probability, and consequently the intensity, are not the subject of this paper.
Regarding that the PVIT hierarchy structure expresses the influence of individual factors on PVIT, it is possible to perform an analysis of alternative from the perspective of the risk acceptability through PVIT analysing hierarchy structure, by use of the probability intensity (Table 4). An individual PVIT factor contributes to the risk acceptance in accordance with (4.2), whereas the total risk acceptability is expressed by equation (4.3).
ri - acceptability of risk for factor i wi - weight (global priority) for factor i pi - intensity of probability for factor i n - number of PVIT factors R - total risk acceptability The risk-adjusted value of an alternative is obtained by ponderation of its expected value
and the risk acceptability. By means of analysing and including risk, the key feature 5- Inclusion of risks is obeyed.
4.2.3. Mandatory deployment of procedures
The concept of the methodology in its first step forecasts an analysis of the present state (as 'Base case' in VMM) and an analysis of an alternative through its qualitative values for each of the dimensions. If the expected value of an alternative exceeds the set threshold of acceptance, a risk evaluation and a risk-adjustment for the value is performed. The risk-adjusted value should not amount less that the set threshold of acceptability for the adjusted value of a dimension, which fulfils the conditions of aggregating the value of dimensions into PVIT and of placing the alternative into the batch of acceptable alternatives. By means of this briefly described procedure, the key feature 6 – Mandatory use is obeyed.
4.3. Calculation of public value of IT
Based on the presented concept, the modelling of the structure for a PVIT analysis in every individual aspect can commence. The principled assessment framework presents a flexible base around which it is possible to construct various hierarchy structures of assessing a certain PVIT dimension (objective). The basic idea is to use AHP at assessing the weights of criteria and subcriteria, whereas the predefined value scales in the interval [0,1] is to be used for scoring alternatives at the lowest hierarchy level.
�
� �
� �1
i i in
ii
r w p
R r
(4.2)
(4.3)

45
JIOS, VOL. 35, NO. 1 (2011), PP. 31-58
JOURNAL OF INFORMATION AND ORGANIZATIONAL SCIENCES
4.3.1. Determining a set of criteria and their relative weights
In order to enable the use of relative alternative preferences, the criterion - standards of assessing alternatives should be defined. A group of criterion can be determined by some of the group decision-making methods or by use of appropriate criterion from the existing (analysed) methodologies. The consequent obtained criterion need to be sorted into the appropriate clusters, depending on the analysed PVIT dimension. Once a hierarchy structure is modelled, the AHP and group decision-making are to be deployed for obtaining the criterion weights.
4.3.2. Determining of parameters and value scales
In order to achieve a uniform assessment of alternatives, each criterion at the lowest hierarchy level should be attached (as in [4]):
� name, significance and description � performances per criteria to be measured � parameters and normalized value scales
The parameters attached to values can be the result of a certain function, values grouped
in intervals or qualitative marks converted into a quantitative value. The values of marks should be normalized and it is desirable that it is [0,1] interval or [0,100] points (percentage), depending on the tools used for performing a synthesis of contribution later on.
Care should be taken though to the way in which a criterion contributes to the objective and thus it is required that a difference is made between 'cost criterion' (less is better, less contributes more) that is assessed in a different way as 'benefit criterion' (more is better, more contributes more).
4.3.3. Synthesis of value by dimension
The results of scoring the alternatives by criteria are synthesized as follows: within every node of the hierarchy structure, the value scores of elements and their weights are multiplied and than added in accordance with the AHP methodology. Regarding that the sum of weights of the elements amounts 1 in every node and that the score values fall into the interval [0,1], the result of the synthesis falls as well into the [0,1] interval. Consequently, a higher result of the synthesis should be interpreted as a higher expected value of the alternative that is being assessed.
Aggregated value – If the key feature 3 – balance is obeyed, it is possible to aggregate the values by dimensions into a unique expected value of an alternative. Consequently, each of "n" dimensions of value has the same weight "1/n". In that way, the aggregation of value boils down to calculating the arithmetic mean of scores attained at each of the dimensions. The aggregated value provides the possibility of performing a simplified further analysis and comparison of alternatives.
4.3.4. Risk and risk-adjusted value of dimensions
The hierarchy PVIT assessment model can be deployed for risk evaluation, i.e. for the evaluation of the acceptability of an alternative from the perspective of risk. The anchor point for such approach to risk evaluation lies in the following premise: The share of each of the elements of the hierarchy structure contributes to value (influence, consequences for value). Through the probability of the (lack of) creation of the (un)wanted state, the lack of an element's contribution to value influences the deterioration of value because of risk (Figure 2).
Consequently, when developing an intensity scale, one should take into consideration only the probability of (lack of) emerging of risk because the consequence for value is taken into account through the priority of each of the criterion within a dimension.

46
JIOS, VOL. 35, NO. 1 (2011), PP. 31-58
KANCIJAN AND V���� PROPOSING METHODOLOGY PATTERN FOR MEASURING ...
The factor of adjustment of value because of risk (4.4) that is calculated via the score of risk acceptability (r) takes into account a part of the maximal risk.
vra – risk-adjusted value of dimension ve – expected value of dimension kr – adjustment factor due to risk (R - risk acceptability (4.3))
Figure 2: Risk - adjusting the expected value of dimension
4.3.5. Interpretation of results
Regarding that alternatives are scored via several aspects and regarding that they can have different expected values, a starting point should be determined for the choice or rejection of alternatives.
After the multicriteria scoring and calculation of the expected value of an alternative have been performed, it is possible to determine the acceptability of the alternative for a further analysis from the aspect of quality.
Figure 3: An example display of the value, acceptance of risk and acceptability of alternative thresholds
Acceptability threshold - For the purpose of reducing a potentially large group of alternatives that are to be subjected to the final analysis and for the purpose of easier focusing on the alternatives with the largest value, it is possible to determine the acceptability threshold of the expected value for each value constituent. In this way the lower limit is set of the expected value a decision maker is ready to accept. The alternatives featuring the expected value beyond the acceptability threshold are eliminated and considered unacceptable. When several alternatives for solving the same problem are analysed, the basic starting point for the
ra e rv v k� � (4.4)
Risk adjusted value of dimension
Expected value of dimension hierarchical structure of value of dimension
Acceptability of risk hierarchical structure of value of dimension
�
0,6680,731
0,9200,850
0,900
0,675
0,917
0,669
0,500
0,850
0,500
0,850
0,500
0,850
0,550
0,425
0,00
0,25
0,50
0,75
1,00
Expe
cted
valu
e
Acc
epta
bilit
yof
risk
Expe
cted
valu
e
Acc
epta
bilit
yof
risk
Expe
cted
valu
e
Acc
epta
bilit
yof
risk
Expe
cted
valu
e
Acc
epta
bilit
yof
risk
Internal value External value Strategic value Agregated valueValue dimensions
Expectedvalue
AlternativeAccept. treshold

47
JIOS, VOL. 35, NO. 1 (2011), PP. 31-58
JOURNAL OF INFORMATION AND ORGANIZATIONAL SCIENCES
acceptability threshold can be the value of the existing state of what has been assessed by the same hierarchy model ('Base Case'). That means that the acceptable alternatives are characterized by their contribution to enhancing the state in all the value dimensions. Should the expected values be aggregated in a unique PVIT (Section 4.3.3), the acceptability threshold for the aggregated value can differ (be higher) than the acceptability thresholds of individual dimensions. In this way, it is possible to select the alternatives whose expected value is at the very threshold in all dimensions. It is possible to observe the risk-adjusted aggregated value of an alternative in the same way.
Alternatives with aggregated values higher than the acceptance threshold make the group of the acceptable alternatives that can be further compared and ranked.
4.3.6. Comparison and choice of alternatives
The group of alternatives that have been scored in accordance with the same model, the same metrics, contains comparable values of alternatives and they thus can be compared. The basic comparison is the comparison in accordance with the expected value, where an alternative with a higher expected value is considered a better one.
From the viewpoint of an investor, the amount of value that is generated in accordance with the unit of the funds invested (4.5) is more interesting granted that the influence of risk on the value and costs is taken into account (as in [4]). An alternative with a higher VCR presents a better solution.
v – aggregated value of an alternative C – costs of alternative (in monetry units) VCR – value to cost ratio expressed in "1/a million monetary units"
In case of a group containing a larger number of alternatives that cannot be financed
simultaneously due to a limited budget, it is possible to perform an optimisation of the alternatives portfolio by means of deployment of the "0-1" integer programming [10]. By means of this procedure, an optimal subset (portfolio) of alternatives can be chosen, of the alternatives with the highest VCR as the criterion of optimality and a limitation as to the total costs of the portfolio that cannot exceed the proposed budget.
Besides the optimisation of an independent alternatives portfolio, it is as well possible to define interdependences, synergy effects or sequence of alternatives through additional conditions. Setting additional conditions for optimisation gives the opportunity of creating new frameworks of dependent alternatives portfolios.
4.4. Value models by dimensions
Each of the analysed methodologies [4],[18],[19] offers several dozens of criteria grouped in dimensions or factors of value. It is possible to use them for modelling of hierarchy models. The PVIT dimensions value models are going to be presented with each dimension being analysed via 10 to 15 criteria.
4.4.1. Internal value model
For the model of 'Internal value', criteria have been used from the following analysed methodologies: � VMM [4]: business line Government to Government (value factors Direct customer value,
Government ) operational value) � MAREVA [18]: dimension Benefits for administration (internalities)
610vVCRC
� � (4.5)

48
JIOS, VOL. 35, NO. 1 (2011), PP. 31-58
KANCIJAN AND V���� PROPOSING METHODOLOGY PATTERN FOR MEASURING ...
� WiBe [19]: dimensions Qualitative and strategic importance of the IT measure and External effects of the IT measure
Table 5: A set of criteria for evaluating dimension 'Internal value' grouped in a hierarchy of factors / clusters
Figure 4: The hierarchical model of dimension 'Internal value'
4.4.2. External value model
At modelling the structure of evaluation of dimensions 'External value', criteria from appropriate dimensions were used by methodologies as follows: � VMM [4]: business line Government to citizens, Government to business (value factors
Social (non-user/public) value and Direct customer value) � MAREVA [18]: dimension Benefits for user (externalities) � WiBe [19]: dimension External effects of the IT measure
Internal value (Goal)
Departmental (D)
Effects related to employees
(D.1)
� Attractiveness of working conditions [19] (D.1.1) � Ensuring/expanding qualifications [19] (D.1.2) � Project allows to improve staff management
(training, career, ...) [18] (D.1.3)
Improving the quality of
execution of tasks (D.2)
� Standardised and uniform administrative work [19] (D.2.1)
� Project allows optimisation of resources (to do better with the same or smaller) [18] (D.2.2)
� Project allows improved decision-making (visibility, accessibility, data quality) [18] (D.2.3)
� Project allows the reorganization of government and agencies involved [18] (D.2.4)
� Project allows better jobs management [18] (D.2.5) Control and information exchange
(D.3)
� Support for decision-making/leadership tasks [19] (D.3.1)
� Project allows communication and exchange (of information, best practices,...) between individuals or departments [18] (D.3.2)
Interdepartmental (I)
� Simplification/support of multi-level / multi-agency cooperation [19] (I.1)
� Sharing of information [4] (I.2) � Data unduplicated [4] (I.3)
INTERNAL VALUE
Departmental
Interdepartmental
Effects related to employees
Improving the quality
Control and information exchange
� Attractiveness of working conditions � Ensuring/expanding qualifications � improved staff management
� Standardization of administrative tasks � Resource optimization � Decision-making support � Support for government reorganization � Better jobs management
� Support for DM tasks � Communication and information
� Support for interdepartmental cooperation � Sharing of information � Data unduplicated

49
JIOS, VOL. 35, NO. 1 (2011), PP. 31-58
JOURNAL OF INFORMATION AND ORGANIZATIONAL SCIENCES
Table 6: A set of criteria for evaluating dimension 'External value' grouped in a hierarchy of factors / clusters
Based on the data from the previous table (Table 6), it is possible to present the hierarchy dimension model 'External value' in the same way as the dimension 'Internal value' (as in Table 5, Figure 4).
4.4.3. Strategic value model
The structure of the value of the dimension 'Strategic value' comprises of the appropriate criteria from the following dimensions by methodologies: � VMM [4]: all business lines (value factors Strategic/political value) � MAREVA [18]: dimension Benefits for user (externalities) and Need � WiBe [19]: dimension Qualitative and strategic importance of the IT measure and
External effects of the IT measure
As to presenting the hierarchy model of the dimension 'Strategic value', it is similar to previously presented dimensions.
Table 7: A set of criteria for evaluating dimension 'Strategic value' grouped in a hierarchy of factors / clusters
External value
Business
� Usage of electronic delivery channels outside traditional business hours [4] � Number of users (subjects) who are affected [18] � Impact of the project to companies or organizations with respect to time spent [18] � Impact of the project to companies or associations in the economic sense [18] � Services is likely to boost industry [18]
Citizens
� Number of users (people) affected by project [18] � Movement to close "digital gap" [4] � Usage of electronic delivery channels outside traditional business hours [4] � Impact of the project on an individual with respect to time spent [18] � Creation of communities of interest [4]
Common � Implementation of a uniform and standardised access [19] � Project contributes to improving the user's information (content, personalization,
transparency) [18]
Strategic value
Political goals
Compliance with
regulations and laws
[19]
� Compliance with laws [19] � Fulfilment of data protection/security requirements [19] � Project fits into the master plan for public administration [18]
Political reputation
� Advancement toward meeting mission and strategic goals and objectives [4]
� Political image (number of positive press articles) [4] � Project contributes to the impact of the country in the
international community [18]
Impact on Society
� Project has a positive impact on environmental protection [18] � Project allows to improve the safety of citizens [18] � Project makes it possible to improve social cohesion (training, integration, the
situation of children and young people,...) [18] � Service is primarily for vulnerable persons (elderly, disabled, unemployed,...)[18]
Necessity [18]
Fitting into the concept
� Integration into the IT landscape of the federal administration in general [19]
� Pilot project nature of the IT investment project [19] � Project is needed because of the preparation tool for
organizational change or change in process [18] � Manufacturer independence [19]
Synergies [19]
� Use of existing technologies by other organizations [19] � Project allows the creation of infrastructure and cross functions
required for other projects [18] � Project allows the creation of common repository (or shared
data) with other projects [18] � Use of project results for comparable projects [19]

50
JIOS, VOL. 35, NO. 1 (2011), PP. 31-58
KANCIJAN AND V���� PROPOSING METHODOLOGY PATTERN FOR MEASURING ...
4.5. Presentation of determining priorities of factors and criteria for the dimension 'Internal value'
Because of a quite complicated procedure of calculating priorities in AHP, for a larger number of elements it is appropriate to use respective software tools. The deployed tools provides for structure modelling, internal importance of structural elements assessment and calculation of their priorities based on assessments, alternative evaluation, result synthesis and sensitivity analysis. The determination of priority of criteria was performed in accordance with AHP methodology and using the appropriate software tools. The presented criteria priorities are the result of a calculation based on assessments made by the authors of this paper, so their use is limited only to demonstrating a concept in this paper.
4.5.1. Importance assessment and local weights calculation
The assessment of the relative relations among elements in all nodes in the structure follows (the marks from Table 5 are used) and the vector w of local weights of elements in an observed node.
Node: Goal 'Internal value' D I w
D 1 4 0,800 I 1/4 1 0,200
Inconsistency: 0,00
Table 8: The assessment of the relations among elements and their relative weights in node 'Goal' - 'Internal value'
Node:
D D.1 D.2 D.3 w
D.1 1 1/5 1/3 0,105 D.2 5 1 3 0,637 D.3 3 1/3 1 0,258
Inconsistency: 0,04
Table 9: The assessment of the relations among elements and their relative weights in node 'D'
Node:
D.1 D.1.1 D.1.2 D.1.3 w
D.1.1 1 2 3 0,550 D.1.2 1/2 1 1 0,240 D.1.3 1/3 1 1 0,210
Inconsistency: 0,02
Table 10: The assessment of the relations among elements and their relative weights in node 'D.1'
Node:
D.2 D.2.1 D.2.2 D.2.3 D.2.4 D.2.5 w
D.2.1 1 1/3 1/3 1/3 1/3 0,070 D.2.2 3 1 3 1/3 3 0,259 D.2.3 3 1/3 1 1/3 1/2 0,115 D.2.4 3 3 3 1 3 0,405 D.2.5 3 1/3 2 1/3 1 0,150
Inconsistency: 0,09
Table 11: The assessment of the relations among elements and their relative weights in node 'D.2'

51
JIOS, VOL. 35, NO. 1 (2011), PP. 31-58
JOURNAL OF INFORMATION AND ORGANIZATIONAL SCIENCES
Node:
D.3 D.3.1 D.3.2 w
D.3.1 1 3 0,750 D.3.2 1/3 1 0,250
Inconsistency: 0,00
Table 12: The assessment of the relations among elements and their relative weights in node 'D.3'
Node:
I I.1 I.2 I.3 w
I.1 1 3 4 0,614 I.2 1/3 1 3 0,268 I.3 1/4 1/3 1 0,117
Inconsistency: 0,07
Table 13: The assessment of the relations among elements and their relative weights in node 'I'
Furthermore, the presented hierarchy model could be converted into a single level one for the purpose of the simplicity of later use. In a single-level model, all criteria are at the same (first) level and their global priorities (Table 14) are used as their weights. The calculated priorities of the elements of the hierarchy structures can be used in further procedures for evaluating alternatives and in other tools (for example, table calculator) because the further procedure comprises in adding contributions of the weights of alternatives.
Local weights (priorities) Global weights
(priorities)
Internal value (Goal)
D 0,800
D.1 0,105 D.1.1 0,550 0,046 D.1.2 0,240 0,020 D.1.3 0,210 0,018
D.2 0,637
D.2.1 0,070 0,036 D.2.2 0,259 0,132 D.2.3 0,115 0,059 D.2.4 0,405 0,206 D.2.5 0,150 0,077
D.3 0,258 D.3.1 0,750 0,155 D.3.2 0,250 0,052
I 0,200 I.1 0,614 0,123 I.2 0,268 0,054 I.3 0,117 0,023
Table 14: The hierarchical model of the 'Internal value' with presented priorities of criteria
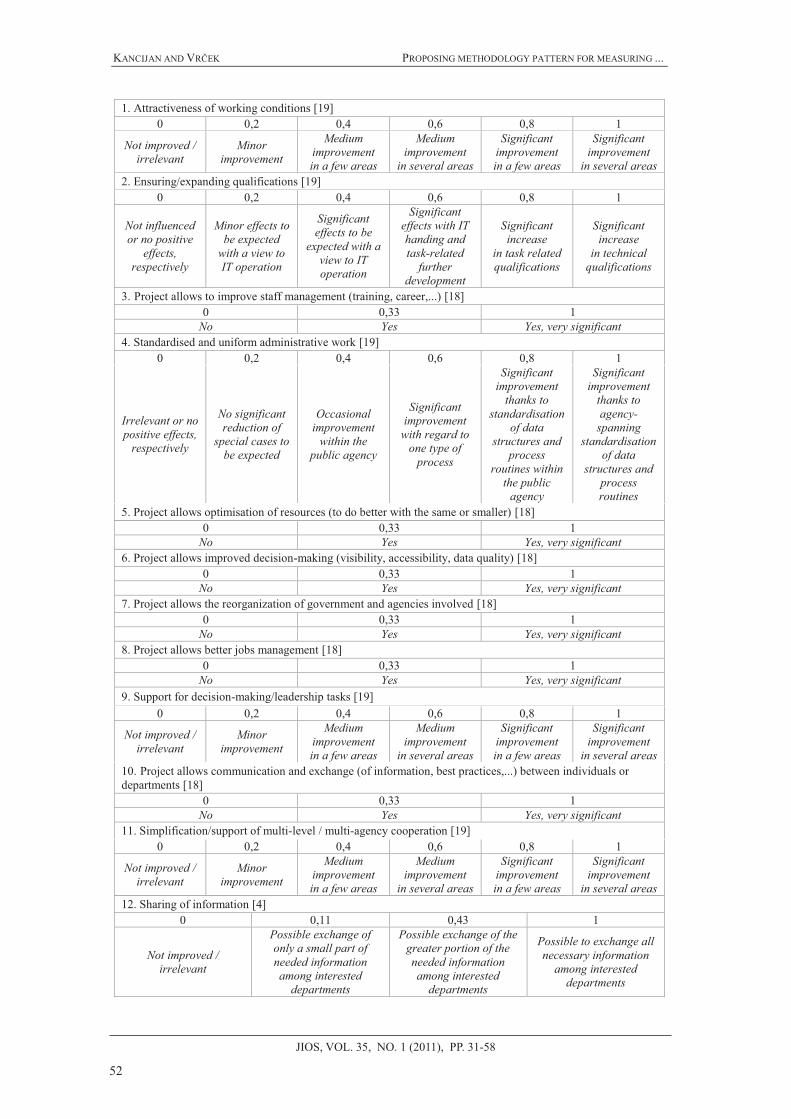
4.5.2. Intensity scales for evaluation of alternatives
For the purpose of quantifying the contributions of alternatives to the objective, a system of unique parameters of their contribution in regards to each criterion should be established. A presentation of the normalized intensities scales follows (Table 15) and the elements used are as follows: � a part taken from an original methodology WiBe [19] and normalized by maximal value � scoring system (0, 1, 3 points) from MAREVA [18] converted into a normalized scale in
the interval 0 to 1 � own scoring scales for criterion taken from VMM [4] calculated by means of AHP � criterion names and intensity descriptions are adopted from the original methodologies
52
JIOS, VOL. 35, NO. 1 (2011), PP. 31-58
KANCIJAN AND V���� PROPOSING METHODOLOGY PATTERN FOR MEASURING ...
1. Attractiveness of working conditions [19] 0 0,2 0,4 0,6 0,8 1
Not improved / irrelevant
Minor improvement
Medium improvement in a few areas
Medium improvement
in several areas
Significant improvement in a few areas
Significant improvement
in several areas 2. Ensuring/expanding qualifications [19]
0 0,2 0,4 0,6 0,8 1
Not influenced or no positive
effects, respectively
Minor effects to be expected
with a view to IT operation
Significant effects to be
expected with a view to IT operation
Significant effects with IT handing and task-related
further development
Significant increase
in task related qualifications
Significant increase
in technical qualifications
3. Project allows to improve staff management (training, career,...) [18] 0 0,33 1
No Yes Yes, very significant 4. Standardised and uniform administrative work [19]
0 0,2 0,4 0,6 0,8 1
Irrelevant or no positive effects,
respectively
No significant reduction of
special cases to be expected
Occasional improvement
within the public agency
Significant improvement
with regard to one type of
process
Significant improvement
thanks to standardisation
of data structures and
process routines within
the public agency
Significant improvement
thanks to agency-
spanning standardisation
of data structures and
process routines
5. Project allows optimisation of resources (to do better with the same or smaller) [18] 0 0,33 1
No Yes Yes, very significant 6. Project allows improved decision-making (visibility, accessibility, data quality) [18]
0 0,33 1 No Yes Yes, very significant
7. Project allows the reorganization of government and agencies involved [18] 0 0,33 1
No Yes Yes, very significant 8. Project allows better jobs management [18]
0 0,33 1 No Yes Yes, very significant
9. Support for decision-making/leadership tasks [19] 0 0,2 0,4 0,6 0,8 1
Not improved / irrelevant
Minor improvement
Medium improvement in a few areas
Medium improvement
in several areas
Significant improvement in a few areas
Significant improvement
in several areas 10. Project allows communication and exchange (of information, best practices,...) between individuals or departments [18]
0 0,33 1 No Yes Yes, very significant
11. Simplification/support of multi-level / multi-agency cooperation [19] 0 0,2 0,4 0,6 0,8 1
Not improved / irrelevant
Minor improvement
Medium improvement in a few areas
Medium improvement
in several areas
Significant improvement in a few areas
Significant improvement
in several areas 12. Sharing of information [4]
0 0,11 0,43 1
Not improved / irrelevant
Possible exchange of only a small part of needed information among interested
departments
Possible exchange of the greater portion of the needed information among interested
departments
Possible to exchange all necessary information
among interested departments

53
JIOS, VOL. 35, NO. 1 (2011), PP. 31-58
JOURNAL OF INFORMATION AND ORGANIZATIONAL SCIENCES
Table 15: Scale of intensities and their descriptions for the evaluation of alternatives by the criteria in the dimension of 'Internal value'
Regarding that the methodology VMM does not have explicitly presented intensities, for the purpose of the demonstration of a possible way of determining intensities, the authors determined the priorities of categories (intensities) for criteria 12 and 13 (Table 15) by means of the AHP and in the following way:
� the intensity with a neglectable contribution to the value within a criterion or with no contribution at all is assigned with the value "0" and it is excluded from the further evaluation
� the intensities that contribute to a criterion are compared in pairs. � the values of intensities are normalized by the maximal value of the calculated
priority, so the value of "1" means the full contribution to a criterion.
4.5.3. Evaluation of alternatives
By the use of the established intensity scales and the hierarchy structure of criteria and their priorities, it is possible to quantitatively express the contribution of an alternative to the objective - the value dimension - that has been set. As it has already been mentioned in the previous section, when alternatives are evaluated, it is possible to use a table calculator (or a similar tools) in which a table is prepared (Table 16) for the purpose of multiplication and adding of priorities. The value of individual PVIT dimensions is presented by the sum of priorities of an alternative by criteria at the lowest hierarchy level. The procedure is, with the deployment of an appropriate dimension model, the same as for evaluating alternatives in other dimensions of PVIT and the same as the one at analysing the acceptability of risk.
A1 A2
Value Risk acceptability Value Risk
acceptability INTERNAL VALUE (overall) 0,669 0,917 0,640 0,912
Criteria
Prio
rity
of
crit
eria
(G)
Rat
ing
alte
rnat
ive
Prio
rity
of a
lt.
by
crite
ria
Rat
ing
alte
rnat
ive
Prio
rity
of
risk
acce
pt.
Rat
ing
alte
rnat
ive
Prio
rity
of a
lt.
by c
riter
ia
Rat
ing
alte
rnat
ive
Prio
rity
of
risk
acce
pt.
D. DEPARTMENTAL 0,801 0,543 0,733 0,495 0,728 D.1. Effects related to employees 0,084 0,042 0,078 0,046 0,073
D.1.1. Attractiveness of working conditions 0,046 0,60 0,028 1,00 0,046 0,60 0,028 1,00 0,046
D.1.2. Ensuring/expanding qualifications 0,020 0,40 0,008 0,70 0,014 0,60 0,012 0,70 0,014
D.1.3. Improved staff management 0,018 0,33 0,006 1,00 0,018 0,33 0,006 0,70 0,013
D.2. Improving the quality of execution of tasks 0,510 0,325 0,448 0,274 0,448
D.2.1. Standardised and uniform administrative work 0,036 0,80 0,029 1,00 0,036 0,80 0,029 1,00 0,036
D.2.2. Resource optimization 0,132 1,00 0,132 1,00 0,132 1,00 0,132 1,00 0,132 D.2.3. Improved decision-making 0,059 0,33 0,019 1,00 0,059 0,33 0,019 1,00 0,059
D.2.4. Support for reorganization of government/agencies 0,206 0,33 0,068 0,70 0,144 0,33 0,068 0,70 0,144
D.2.5. Better jobs management 0,077 1,00 0,077 1,00 0,077 0,33 0,025 1,00 0,077
D.3. Control and information exchange 0,207 0,176 0,207 0,176 0,207
D.3.1. Support for DM/leadership 0,155 0,80 0,124 1,00 0,155 0,80 0,124 1,00 0,155
13. Data unduplicated [4] 0 0,20 1
Duplicated data, condition remains unchanged
Partially resolved duplication of data
Unified database, no duplication of data

54
JIOS, VOL. 35, NO. 1 (2011), PP. 31-58
KANCIJAN AND V���� PROPOSING METHODOLOGY PATTERN FOR MEASURING ...
tasks D.3.2. Communication and exchange 0,052 1,00 0,052 1,00 0,052 1,00 0,052 1,00 0,052
I. INTERDEPARTMENTAL 0,200 0,126 0,184 0,145 0,184
I.1. Support of multi-level/agency cooperation 0,123 0,80 0,098 1,00 0,123 0,80 0,098 1,00 0,123
I.2. Sharing of information 0,054 0,43 0,023 0,70 0,038 0,43 0,023 0,70 0,038 I.3. Data unduplicated 0,023 0,20 0,005 1,00 0,023 1,00 0,023 1,00 0,023
Table 16: Example of calculating the expected value of dimension 'Internal value' and risk acceptability for two alternatives
For the final selection of alternatives that are satisfactory in terms of this methodological pattern (acceptable alternatives), it would be good to perform the evaluation with an appropriate software support that provides for an sensitivity analysis. In this way, the trust in the reliability of the final choice is supported.
4.5.4. Sensitivity analysis
It is necessary to make the sensitivity analysis when more than one alternative is assessed. The analysis can be made in any node of the hierarchy stucture in accordance with the following principle: For the observed element k, the weight wk is changed whereas all other elements have the weight 1-wk. All other elements keep the weight relations so that wi/wj=const. applies for every (��* +�. Usually, the sensitivity limits are set against the changes in weights of elements (for example, ±10%) within which the change in the weight of the observed element k should not cause a change in the ranks of the alternative(s). As an example for two alternatives with corresponding values (Table 17), the dependence of the expected value on the relation among the weights of elements in a node 'Goal' - 'Internal value' is shown.
Node: Goal 'Internal value'
A1 value
A2 value w0
Departmental 0,543 0,495 0,800
Interdepartmental 0,126 0,145 0,200
Total 0,669 0,640 1,000
Table 17: An example of two alternatives of analysing sensitivity in node 'Goal' - 'Internal value'
0,5
0,6
0,7
0,8
0,9
1,0
0,00 0,20 0,40 0,60 0,80 1,00
w (Departmental)
Expectedvalue
A1A2
+10%-10%
w 0
Figure 5: An example of the sensitivity analysis of two alternatives in node 'Goal' - 'Internal value'

55
JIOS, VOL. 35, NO. 1 (2011), PP. 31-58
JOURNAL OF INFORMATION AND ORGANIZATIONAL SCIENCES
The example (
0,5
0,6
0,7
0,8
0,9
1,0
0,00 0,20 0,40 0,60 0,80 1,00
w (Departmental)
Expectedvalue
A1A2
+10%-10%
w 0
Figure 5) shows that a change in the ranks of alternatives requires a w(Departmental) change exceeding w0 ±10%. It leads to the conclusion that the structure from the example is insensitive enough to the changes of weight within the limit that has been set.
5. Conclusion The solution of the problem of evaluating and choosing the investment alternatives is a complex task in every problem domain. Usually it implies projects that, besides a high monetary value, feature some qualitative values as well that cannot be expressed in monetary sense and need to be viewed from many perspectives. This especially applies to IT projects that are intended for public and besides a monetary value feature so-called public value of the information technology as well. Regarding the multidimensional quality of such value, the methodology with which an analyst will be able to express the intangible value of alternatives and with a help from which the alternatives will be unambiguously comparable requires the deployment of methods for multicriteria analysis.
5.1. Comment on results
When the modifications of some parts of the analysed methods were presented, there was an effort present to obey the framework set by Gartner. However, the problem still remains of the interpolation of the results of the value of some independent dimensions of alternative in a larger group of alternatives (m dimensions × n alternatives). The balance feature of the mentioned Gartner's framework does not exclude the possibility of aggregating individual values of dimensions into a unique value with (as to weight) equal treatment of every single dimension. The PVIT that is aggregated in this way from the values of dimensions presents the first difference when compared to the analysed methodology patterns.
The next difference is the implementation of the elimination thresholds by dimensions. The difference in turn makes possible that - in accordance with the decision made by an analyst- the alternatives that do not show a certain contribution to the improvement of the existing state of the public value are excluded from further assessment in the very beginning. Unlike other methodology solutions, this reduces the group of the potential solutions and makes the decision easier to make.
The approach to analysing risk as well differs from the approaches encountered in the analysed methodologies. The use of the hierarchy structure of value and the probability of (not)occurrence for the risk evaluation provides for taking the risk influence - for all the criteria - into account via the same weight (influence) as the contribution of the value criteria. After the analysis of risk, it is possible to deploy the elimination threshold for the risk-

56
JIOS, VOL. 35, NO. 1 (2011), PP. 31-58
KANCIJAN AND V���� PROPOSING METHODOLOGY PATTERN FOR MEASURING ...
adjusted value, which excludes the alternatives in which the risk of impairing the value is too big. Such view on risk is a contribution to simplifying the risk evaluating.
Conduct sensitivity analysis and confirmation of structure insensitivity to limited changes in weight of criteria increases the confidence in the correctness of the selection of potential solution.
The concept of the methodology pattern presented in this paper obeys principles set by Gartner as the key features that a PVIT measurement framework should have. The presented methodology pattern has been envisaged as a flexible one. The various structures of dimensions and the hierarchy of values, risks and acceptability thresholds make possible the use of the framework in the various fields of assessment of the public value of IT.
5.2. Further work and research
The presented concept of a methodology pattern is a possible approach to the solution of the problem. Finally, there is the need for the proposed pattern to be tested for the purpose of determining its functionality and with the purpose of a fine-tuning of the parameters that influence the value and elimination of alternatives.
The process of modelling and especially calculating the priority of elements in the hierarchy structures is to be performed by the group decision-making. It is desirable thus for the group of experts to be heterogeneous and this can be attained by introducing experts into the process, the experts from all fields that will be in a certain way affected with changes being analysed: science, politics, economy, etc.
The group of the acceptable alternatives that were described by their aggregated (and risk-adjusted) value and corresponding costs is a possible starting point for observing the public value as related to the invested money. In the next step, an optimisation of the alternatives portfolio makes choosing a subgroup from the group of acceptable alternatives possible, a subset that will present - within the budget limitations - the highest value per invested monetary unit.
References [1] Albadavi, A. Formulating national information technology strategies: A preference
ranking model using PROMETHEE method. European Journal of Operational Research 153:290-296, 2004.
[2] Behzadian, M. et al. PROMETHEE: A comprehensive literature review on methodologies and applications. European Journal of Operational Research 200:198-215, 2010.
[3] Booz-Allen-Hamilton. Building a Methodology for Measuring the Value of e-Services. http://www.estrategy.gov/documents/measuring_finalreport.pdf, downloaded: February, 6th 2010.
[4] Booz-Allen-Hamilton. The Value Mesuring Methodology: How-To-Guide . http://www.cio.gov/documents/ValueMeasuring_Methodology_HowToGuide_Oct_2002.pdf, downloaded: February, 6th 2010.
[5] Charnes, A., Cooper, W. W., Rhodes, E. Measuring the Efficiency of Decision Making Units. European Journal of Operational Research 6:429-444, 1978.
[6] Chen, Y., Liang L., Yang F., Zhu J. Evaluation of information technology investment: a data envelopment analysis approach. Computers & Operations Research 33:1368-1379, 2006.
[7] Davern, M.J., Wilkin, C.L. Towards an integrated view of IT value measurement. International Journal of Accounting Information Systems 11:42–60, 2010.
57
JIOS, VOL. 35, NO. 1 (2011), PP. 31-58
JOURNAL OF INFORMATION AND ORGANIZATIONAL SCIENCES
[8] Foley, K. Using the Value Measuring Methodology to evaluate government initiatives. In Proceedings of the 2006 Crystal Ball User Conference, http://www.anarisco.com.br/gerenciador/uploads/governamentais_2a.pdf, downloaded: February, 17th 2010.
[9] Forman, E.H., Gass, S.I. The Analytic Hierarchy Process - An Exposition, Operations Research, 49(4):469-486, 2001.
[10] Forman, E.H., Selly, M.A. Decision By Objectives (How to convince others that you are right), World Scientific Press Co., Singapore, 2001., http://mdm.gwu.edu/Forman/DBO.pdf, downloaded: January, 6th 2008.
[11] Gunasekaran A., et al. A model for investment justification in information technology projects. International Journal of Information Management, 21:349-364, 2001.
[12] Hunjak, T. Mathematical basis of the AHP method. materials for the course Quantitative methods for analyzing complex decisions - postgraduate study 'Information Sciences', Faculty of Organization and Informatics Varazdin, 2008, http://elf.foi.hr/mod/resource/view.php?id=9763, downloaded: May, 4th 2009. (in Croatian)
[13] Hunjak, T. Multicriteria decision making - The AHP method. materials for the course Quantitative methods for analyzing complex decisions - postgraduate study 'Information Sciences', Faculty of Organization and Informatics Varazdin, 2008, http://elf.foi.hr/mod/resource/view.php?id=9761, downloaded: May, 4th 2009. (in Croatian)
[14] Hunjak, T. PROMETHEE Method. materials for postgraduate study, Faculty of Organization and Informatics Varazdin, 2008, http://www.foi.hr/CMS_library/studiji/pds/mps/predmeti/Promethee_Tihi.pdf, downloaded: May, 4th 2009. (in Croatian)
[15] Kerzner, H. Project management: a systems approach to planning, scheduling, and controlling. 10th edition, John Wiley & Sons Inc., 2009.
[16] Mankins, J.C. Technology readiness and risk assessments: A new approach. Acta Astronautica 65:1208-1215, 2009.
[17] MAREVA. http://ec.europa.eu/information_society/activities/egovernment/docs/ pps/2_mareva_methodology_guide.ppt, downloaded: March, 1st 2010.
[18] MAREVA. https://mioga.minefi.gouv.fr/DB/public/controlegestion/doc/analyse_ de_la_valeur/MAREVA/MAREVA_-_Parametres_du_modele.pdf, downloaded: March, 1st 2010. (in France)
[19] Röthig, P. editor. WiBe 4.0 Recommendations on Economic Efficiency Assessments in the German Federal Administration, in Particular with Regard to the Use of Information Technology. Federal Ministry of the Interior, Berlin, 2004. http://www.eu.wibe.de/wibe_framework/recommendation40/recommendations-on-economic-efficiency--wibe-4-0--pdf--792-kb-306904.pdf, downloaded: March, 1st 2010.
[20] Saaty, T.L., Vargas, L.G. The logic of priorities: Applications of the Analytic Hierarchy Process in business, energy, health, and transportation. RWS Publications, Pittsburgh PA, 1991.
[21] 3���4�56 ! 6 �� � Data Envelopment Analysis as the Efficiency Measurement Tool - Possibilities of Application in Forestry. 7�(� ������8���9� :������(� ;<6 ;��= (in Croatian)

58
JIOS, VOL. 35, NO. 1 (2011), PP. 31-58
KANCIJAN AND V���� PROPOSING METHODOLOGY PATTERN FOR MEASURING ...
[22] Vaidya O.S., Kumar S. Analytic hierarchy process: An overview of applications. European Journal of Operational Research 169:1-29, 2006.
[23] Vossey, B. Measuring Returns from e-Government: The Case of French Local Government. Professional thesis for the MSIT, HEC, Paris, 2009. http://www.slideshare.net/benjaminvossey/measuring-returns-from-egovernment-the-case-of-french-local-government, downloaded: March, 10th 2010.
[24] Worldbank. http://siteresources.worldbank.org/EXTINFORMATIONANDCOMM UNICATIONANDTECHNOLOGIES/Resources/282822-1188575147431/ PublicValueITFrameworks2007.pdf, downloaded: March, 1st 2010.
[25] Xu, Z. Application of fuzzy expert systems in assessing operational risk of software. Information and Software Technology 45:373-388, 2003.