Proposed Rule 1118.1 Non-Refinery Flares
27
Proposed Rule 1118.1 Non-Refinery Flares David L. Rothbart, P.E., BCEE Southern California Alliance of Publicly Owned Treatment Works January 10, 2018
Transcript of Proposed Rule 1118.1 Non-Refinery Flares

Proposed Rule 1118.1
Non-Refinery Flares
David L. Rothbart, P.E., BCEE
Southern California Alliance of Publicly Owned Treatment Works
January 10, 2018

To protect public health and the environment through innovative
and cost-effective wastewater and solid waste management
and, in doing so, convert waste into resources such as
recycled water, energy, and recycled materials.
Mission Statement
2

Presentation Outline
What is Biogas?
Productive Uses of Biogas
Economic Challenge - Low Cost of Power
Types of Biogas Flares
Low NOx Emission vs Standard Flare
Hypothetical Case Study
Cost Effectiveness
Observations
Recommendations

What is Biogas?
Wastewater Treatment
– Wastewater treatment plants employ anaerobic digesters to break down sewage sludge and eliminate pathogens in wastewater
Municipal Solid Waste Landfill
– Landfills contain garbage and serve to prevent contamination between the waste and the surrounding environment. Within landfills anaerobic bacteria decompose organic waste to produce biogas
Wastewater Treatment Plants and Landfills provide an essential public service

What is Biogas? Anaerobic digestion
5 Copyright © 2012 Harvest Power, Inc.
Output – Biogas Used for energy production
Output – Natural Fertilizers
Input – Organic Materials
Methanation Acidogenesis
Hydrolysis Acetogenesis

What is Biogas? Differences Between Digester Gas and
Landfill Gas
Digester Gas Landfill Gas
Methane % 55-65 10-60
Leakage Enclosed system Lots of effort to control
Siloxanes Can vary daily or hourly Steady over months or
years
Oxygen and nitrogen Trace levels Can be % levels
Trace hydrocarbons Lower than lfg ppb levels
Sulfur content 10-200 ppm 10-2000 ppm
Time to digest Weeks Decades

0
50
100
150
200
250
300
8/8
/10
8/1
5/1
0
8/2
2/1
0
8/2
9/1
0
9/5
/10
9/1
2/1
0
9/1
9/1
0
9/2
6/1
0
10/3
/10
10/1
0/1
0
Valencia WRP Puente Hills Landfill Calabasas Landfill Spadra LandfillScholl Canyon Landfill OCSD JWPCP
Hydrogen Sulfide in Landfill and Digester Gas H
2S
Concentr
ation (
ppm
v)
Samples for Valencia WRP obtained prior to iron sponge.

Siloxanes in Landfill and Digester Gas
* - JWPCP WWTP samples were obtained after chilling to 60oF.
Silo
xane C
oncentr
ation (
ppm
v)
Biogas is not natural gas

Productive Uses of Biogas
Landfills and Wastewater Treatment Plants have pioneered productive uses of biogas
Productive Uses
– Engines
– Boilers
– Fuel Cells
– Turbines / Microturbines
– Pipeline Injection / Vehicle Fuel
Example LACSD Projects

Early History: IC ENGINES 1938

The 1970’s: Birth of the Landfill Gas-to-
Energy Industry

The 1980’s: Commercialization of the
Industry
Convergence of
technologies
and high power
prices
Developed 3
LFGTE
Facilities
– Puente Hills 50
MW
– Palos Verdes
11 MW
– Spadra 10 MW

The 2000’s: Renewed Development
Higher power
prices
New technologies
Deregulated
electricity market
Districts developed
three new power
projects

Calabasas Landfill Microturbine Facility
Ten 30 kW Capstone
microturbines
Served on-site power
needs from 2002-2008
Low emissions
technology demo

15
2010: Solar Mercury 50 Turbines at Calabasas
First Use on Biogas in California

2014: Challenges
Less landfill gas available
Tighter emission regulations (higher
cost of compliance)
Lower power sales prices
Reduced demand for renewable power

Puente Hills Gas Projection
-
2,000
4,000
6,000
8,000
10,000
12,000
1985 1990 1995 2000 2005 2010 2015 2020 2025 2030 2035
CH
4 F
low
(scfm
)
PHLF Gas Projection
Actual Median 90% CI Annual Variability Median @ Maximum Rate
NOTE: Solid squares used for calibration.

Economic Challenge - Low Cost of Power

Types of Biogas Flares
Prime (e.g., beneficial use not available)
Standby (e.g., used when the beneficial use is unable to process biogas)
Emergency
– Not appropriate for must-manage biogas
Landfills
– Declining gas quality and quantity – Open vs closed
– Regulated by Rule 1150.1
Wastewater Treatment Plants
– Variable gas generation based upon wastewater influent rates (e.g., day vs night, weekend vs. weekday)

Low Emission vs Standard Flare
Low emissions achieved by premixing air/fuel
Continuously monitor premixed gas to ensure proper operation (O2, CH4)
Controlled by continuous gas monitor and variable speed combustion air fan
Greater safety requirements to avoid pre-combustion
Complex operation compared to standard flare requiring many more systems to be maintained
More prone to shutdowns due to increased complexity
More costly to operate and maintain

ZINK ZULE FLARE

Hypothetical Case Study
Replace 12 Wastewater
Flares at the Joint
Water Pollution
Control Plant in
Carson, CA
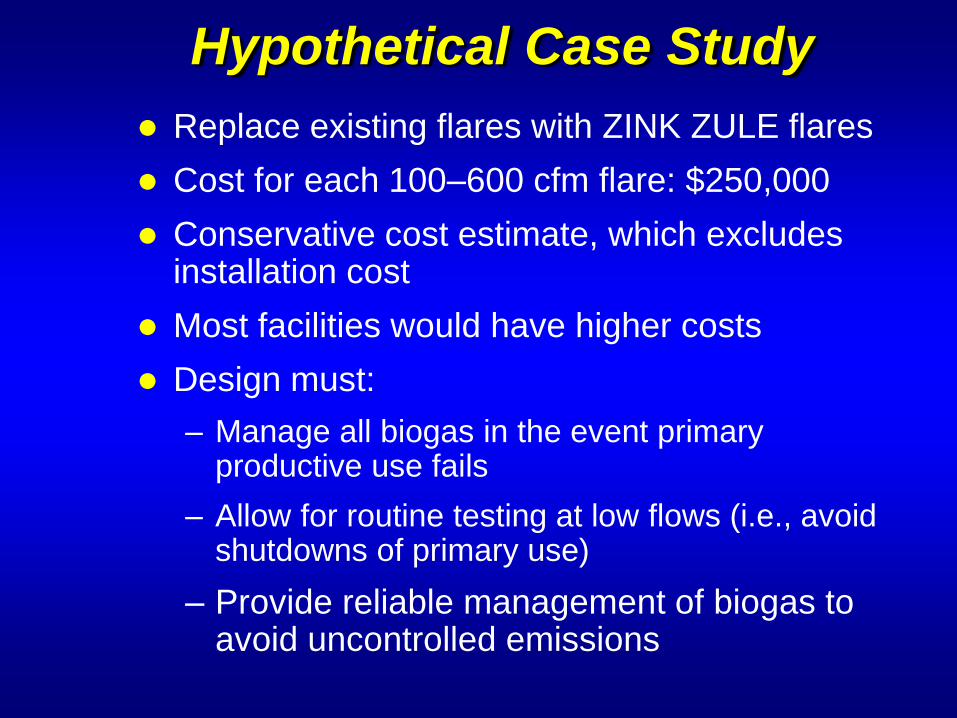
Hypothetical Case Study
Replace existing flares with ZINK ZULE flares
Cost for each 100–600 cfm flare: $250,000
Conservative cost estimate, which excludes installation cost
Most facilities would have higher costs
Design must:
– Manage all biogas in the event primary productive use fails
– Allow for routine testing at low flows (i.e., avoid shutdowns of primary use)
– Provide reliable management of biogas to avoid uncontrolled emissions

Project Cost-Effectiveness Replace all 12 flares Existing Flares New BACT Flares ACTUAL-throughput (scf/yr) 130,500,000 130,500,000 Lower Heating Value (BTU/scf) 640 640 NOx EF (lbs/MMBTU) 0.056 0.025 NOx Emissions (tpd) 0.0064 0.0029 Emission Reductions (tpd) 0.0035 Equipment Cost* $3,000,000 Annual Operating Costs $36,000 ** Equipment Life (years) 20 Rate of Interest 4% PVF 13.59 Present Value $3,489,252 Cost-Effectiveness ($/ton of NOx Reduced) $134,766 * - Equipment cost excludes blower and individual controls
** - BACT flare operating costs are actually >> than existing flares

Observations 2016 AQMP denotes CMB-03 cost-effectiveness
< $20,000 per ton NOx
Highest cost-effectiveness in the 2016 Ozone AQMP: CMB-01 $53,000 per ton NOx
PR 1118.1 more costly than anticipated and inventory less than projected
SCAP conducted a flare survey that confirms that most existing flares have an EF of about 0.06 lbs/MMBTU
56 wastewater flares converting to BACT will conservatively cost $14MM
Wastewater inventory biased high due to LA City
Emergency limit of 200 hours not feasible
Proposed Rule 1118.1 concepts more stringent than Rule 1118

Recommendations
Validate biogas flare inventory
Determine a reasonable cost-effectiveness threshold
prior to the development of rule language
Rules can provide carrots rather than sticks
Emergency flares provisions should not be included for
must manage biogas
Partner to eliminate technological, regulatory and
economic barriers to the productive use of biogas