Proposed Reforms to Chicago Pensions
30
April 17, 2014 © Anderson Economic Group, LLC, 2014 See copyright note for limited reproduction rights. Anderson Economic Group, LLC 444 North Michigan Avenue, Suite 2600 Chicago, Illinois 60611 Tel: (312) 670-6810 Fax: (312) 670-4391 www.AndersonEconomicGroup.com Proposed Reforms to Chicago Pensions What’s At Stake and How Much it Will Cost Prepared by: Jason Horwitz, Consultant
-
Upload
true-news-usa -
Category
Documents
-
view
216 -
download
0
Transcript of Proposed Reforms to Chicago Pensions

April 17, 2014
© Anderson Economic Group, LLC, 2014See copyright note for limited reproduction rights.
Anderson Economic Group, LLC444 North Michigan Avenue, Suite 2600Chicago, Illinois 60611Tel: (312) 670-6810Fax: (312) 670-4391
www.AndersonEconomicGroup.com
Proposed Reforms to Chicago PensionsWhat’s At Stake and How Much it Will Cost
Prepared by:Jason Horwitz, Consultant
Table of Contents
Anderson Economic Group, LLC
I. Executive Summary................................................1
Purpose .................................................................................. 1Key Findings ......................................................................... 1Our Approach ........................................................................ 5
II. Status of City Pension Plans.................................7
Chicago’s Retirement Funds ................................................. 7Reforms to Policemen’s and Firemen’s Pensions ................. 8Funding Status of the Municipal and Laborers’ Funds ......... 9
III. Proposed Pension Reforms ...............................11
Changes to Retiree Benefits ................................................ 11Changes to Employee Contributions .................................. 11Changes to City of Chicago Contributions ......................... 12
IV. Net Cost of the Proposed Reforms to the City of Chicago and Active Employees......................13
Net Costs for Active Employees ......................................... 13Net Costs for the City of Chicago ....................................... 13The Cost of Waiting ............................................................ 15
V. Benefit Reduction for Employees and Retirees ...17
Savings from Pension Benefit Cuts .................................... 17Impact on Current Retirees ................................................. 18Change in Benefits for Current Employees ........................ 19
VI. About the Author ...............................................21
About Anderson Economic Group ...................................... 21About the Author ................................................................ 21Copyright Notice & Disclaimers ........................................ 21
VII. Methodology ....................................................22

Executive Summary
I.Executive Summary
Under defined benefit pension plans, an employer can minimize costs by esti-mating future benefits for current employees and retirees and setting aside enough money to cover those obligations. For years, local governments in Chi-cago, including the City of Chicago, Cook County, and Chicago Public Schools, have failed to do so for hundreds of thousands of workers. As a result, city resi-dents face a collective unfunded liability that exceeds $30 billion.
To partially address the problem, Mayor Rahm Emanuel proposed, and the state legislature passed, a set of reforms to pension benefits for municipal employees and laborers in the City of Chicago. Governor Quinn has yet to sign the bill. In the long run, employers have only two ways to resolve an unfunded liability, and the recently-passed reforms include both. They reduce future benefits for active employees and current retirees. They also considerably increase the con-tribution by employees and the City government into the fund each year.
PURPOSE In this report, we analyze the proposed reforms to pensions for City of Chicago municipal employees and laborers as written in Senate Bill 1922, passed by the Illinois House and Senate on April 8, 2014. In addition to discussing the compo-nents of the bill and the current status of City pensions, we present the follow-ing:
• The estimated net cost to the City, over time, of the proposed reforms.
• The estimated net cost to active municipal employees and laborers due to higher contribution rates.
• The estimated net cost to active and retired municipal employees and laborers due to lower retirement benefits.
KEY FINDINGS Our research and analysis led to the following findings.
1. City pension funds are running out of money under the current fund-ing formula. The proposed plan to reform pensions would result in significant progress toward fully funding pension plans for city work-ers.
The municipal employees’ pension fund (MEABF) and the laborers’ pension fund (LABF) were underfunded by a combined $9.6 billion at the beginning of 2013. We estimate that the total underfunded liability now exceeds $10 billion. This shortfall is largely due to the fact that, under current law, the money that the City of Chicago sets aside for municipal workers’ and laborers’ retirement is insufficient and in no way connected to the amount of retirement benefits that each fund is required to pay in the future.
If the current funding formula continues, we estimate that the MEABF will be out of money in 2027 and the LABF will be out of money in 2030. If that occurs, it is not clear how the City of Chicago would pay the over $1.3 billion in annual benefits for retirees in those and future years.
Reforms to City of Chicago Pensions 1
© 2014 Anderson Economic Group, LLC

Executive Summary
FIGURE 1. Funding Ratios Under Status Quo and Reforms, 2015 to 2050
Under the proposed plan, the City of Chicago would commit to putting suffi-cient funds into the plan in order to achieve 90% funding by the year 2055. This would significantly reduce the risk of even greater tax hikes or benefit cuts in the future.
2. These reforms would result in $450 million more in annual payments from the City and $50 million more in annual payments from City employees by the year 2021.
The proposed reforms will result in a gradual increase of required annual contri-butions from the City between the years 2016 and 2020. By the year 2021, we estimate the City of Chicago will need to contribute $450 million more into these two funds than under the current funding formula in that year alone. By 2025, that annual amount will increase to $530 million.
For context, the 2025 payment amount is equivalent to over 9% of City govern-mental revenues (excluding sewer, water, tollway, and airports) in 2012. Fig-ure 2 on page 3 shows the projected annual contributions from the City of Chicago under the status quo and under the proposed reforms.
By 2021, employees also will be contributing more—over $50 million per year, in total. This represents 2.5% of their salary and wages, or an increase of 29% in their contributions.
0%
10%
20%
30%
40%
50%
60%
70%
80%
90%
100%
2015 2020 2025 2030 2035 2040 2045 2050
Status Quo Status QuoReforms Reforms
MEABF runs out of money
LABF runs out of money
MEABF LABF
Source: MEABF and LABF Actuarial Reports; AEG EstimatesAnalysis: Anderson Economic Group, LLC
Reforms to City of Chicago Pensions 2
© 2014 Anderson Economic Group, LLC
Executive Summary
FIGURE 2. Annual Contributions by the City of Chicago Under Status Quo and Reforms, 2015 to 2050 (billions of $)
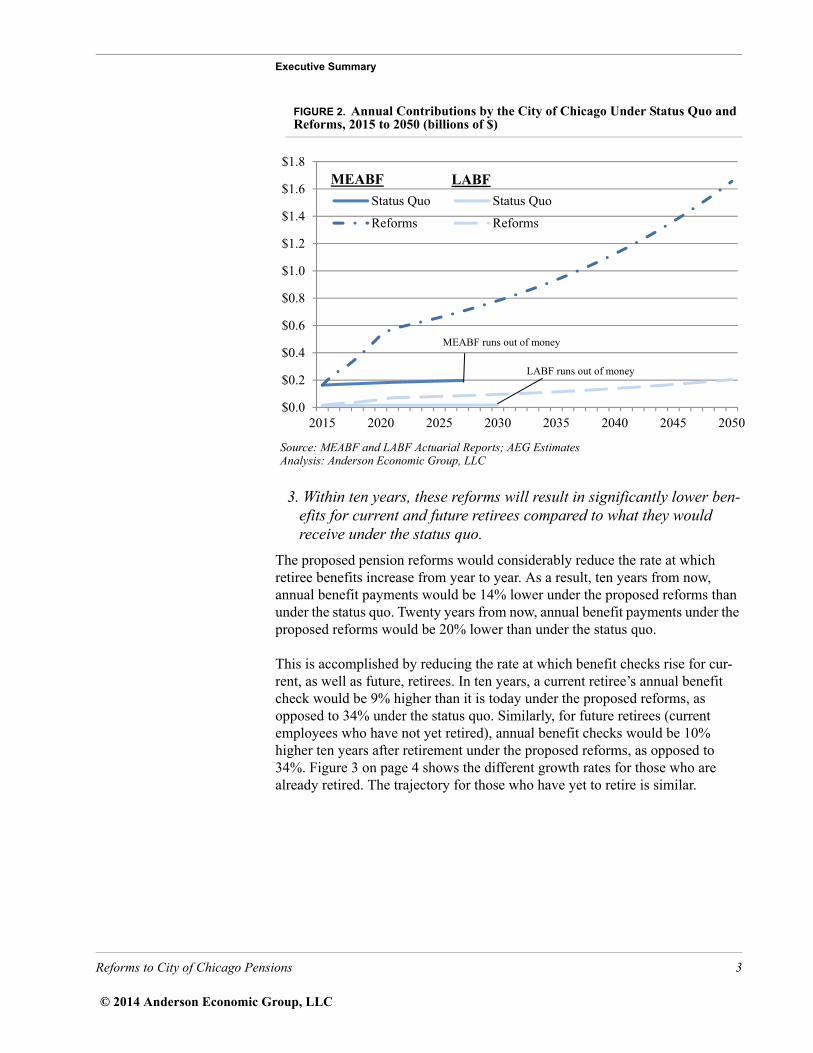
3. Within ten years, these reforms will result in significantly lower ben-efits for current and future retirees compared to what they would receive under the status quo.
The proposed pension reforms would considerably reduce the rate at which retiree benefits increase from year to year. As a result, ten years from now, annual benefit payments would be 14% lower under the proposed reforms than under the status quo. Twenty years from now, annual benefit payments under the proposed reforms would be 20% lower than under the status quo.
This is accomplished by reducing the rate at which benefit checks rise for cur-rent, as well as future, retirees. In ten years, a current retiree’s annual benefit check would be 9% higher than it is today under the proposed reforms, as opposed to 34% under the status quo. Similarly, for future retirees (current employees who have not yet retired), annual benefit checks would be 10% higher ten years after retirement under the proposed reforms, as opposed to 34%. Figure 3 on page 4 shows the different growth rates for those who are already retired. The trajectory for those who have yet to retire is similar.
$0.0
$0.2
$0.4
$0.6
$0.8
$1.0
$1.2
$1.4
$1.6
$1.8
2015 2020 2025 2030 2035 2040 2045 2050
Status Quo Status Quo
Reforms Reforms
MEABF runs out of money
LABF runs out of money
MEABF LABF
Source: MEABF and LABF Actuarial Reports; AEG EstimatesAnalysis: Anderson Economic Group, LLC
Reforms to City of Chicago Pensions 3
© 2014 Anderson Economic Group, LLC

Executive Summary
FIGURE 3. Increase in Annual Retiree Benefits After 2014, Under Status Quo and Reforms (100 = benefit level in 2014)
4. Waiting five years to implement these reforms would cost over $200 million a year in 2026 and beyond.
Any money that is placed into the pension funds today is expected to gain investment returns at an average annual rate of 7.5%. As a result, if the City fails to put $100 into the fund today in order to pay a given future benefit, on average, the City will have to pay $107.50 next year in order to cover that same benefit. To put it another way, any unfunded liability left unpaid today will
appear next year 7.5% larger.1
To see the consequences of further delays in altering the pension formula, we estimated how much these exact same reforms would cost if they were imple-mented starting in 2020, rather than 2015. The 5-year delay would cost the City over $200 million dollars per year once the reforms are fully phased in.
1. Of course, there are other reasons why an unfunded liability might increase from year to year. For example, misestimation of the average age of retirement, the longevity of retired employ-ees, future payroll, market returns, and other factors can also result in underfunding the pen-sion fund.
80
90
100
110
120
130
140
150
160
170
180
2014 2019 2024 2029
Status Quo
Reforms
Source: Senate Bill 1922, as passed on April 8, 2014; Congressional Budget Office
Analysis: Anderson Economic Group, LLCBaseline Economic Forecast, February 2014; AEG Estimates
Reforms to City of Chicago Pensions 4
© 2014 Anderson Economic Group, LLC

Executive Summary
Annual Contributions by the City of Chicago Under Proposed Reforms if Imple-mented in 2015 and 2020, Respectively (billions of $)
5. Progress toward fully funding pensions will only be achieved if city and state policymakers can resist the temptation to defer City contri-butions.
Nearly $500 million dollars in increased annual contributions will be very diffi-cult to carry out, in practice. This increase imposes a big burden and will likely occur shortly after similar commitments have been made to the policemen’s, firemen’s, and schoolteachers’ retirement funds. The temptation to delay City contributions will be even greater than usual.
While it is occasionally appropriate to defer payments in special circumstances, failure of the City to follow through on these higher contribution levels would result in even greater costs down the road. The proposed reforms contain enforcement mechanisms—the State of Illinois can redirect grants for the City into pension funds, and either fund’s retirement board can sue the City—but these are statutory requirements. It is difficult to predict how often the City will request a statutory change that reduces its obligations, and how willing the State will be to grant such a change.
OUR APPROACH We performed an actuarial analysis in order to estimate the potential impact of the pension reforms. Our primary sources were the annual actuarial reports and comprehensive financial reports for the Laborers’ and Retirement Board Employees’ Annuity and Benefit Fund (LABF) and the Municipal Employees’ Annuity and Benefit Fund (MEABF). These reports provide only summary information, so we were required to make certain assumptions in order to carry out our analysis. As a result, our estimates may moderately differ from those of actuaries who have access to more detailed information.
$0.0
$0.5
$1.0
$1.5
$2.0
$2.5
2015 2020 2025 2030 2035 2040 2045 2050
Implemented in 2015
Implemented in 2020
Source: MEABF and LABF Actuarial Reports; AEG EstimatesAnalysis: Anderson Economic Group, LLC
Reforms to City of Chicago Pensions 5
© 2014 Anderson Economic Group, LLC

Executive Summary
Using, where possible, the same actuarial assumptions that these funds’ actuar-ies used, we first predicted the number of retirees in future years and their expected benefits, under the status quo and under the reforms. We then used this information to estimate a change in the system’s unfunded liability due to these reforms. Finally, we used this new unfunded liability and new requirements for funding to estimate the required funding changes for the city and employees in the short and medium term. For more information on our methods and important assumptions, see “Methodology” on page 22.
Reforms to City of Chicago Pensions 6
© 2014 Anderson Economic Group, LLC

Status of City Pension Plans
II.Status of City Pension Plans
In a defined benefit pension plan, the employer sets an annuity (or annual bene-fit) to pay employees upon retirement. The size of this annuity is usually based on tenure, salary upon retiring, age, and/or duration of retirement. In order to minimize the cost of the benefit plan to the employer, it is common practice to set aside enough money now to pay benefits in the future. Essentially, the employer calculates how much it will owe in the future to current and retired employees, and figures out how much should be set aside and invested in order to pay that amount.
The estimated amount of future benefits discounted by the expected rate of return on assets is the actuarial accrued liability. When the money set aside to pay for these benefits is less than the actuarial accrued liability, the pension plan is underfunded. Pension plans can become underfunded for several reasons, including a drop in the rate of return on fund assets; failure by the employer to pay the required contribution; and misestimation of employee tenure, salary and lifespan. The current unfunded liability for Chicago’s retirement plans is due primarily to a combination of the first two.
CHICAGO’S RETIREMENT FUNDS
There are four separate retirement plans for City of Chicago employees. They are the Municipal Employees’ Annuity and Benefit Fund (MEABF), the Labor-ers’ and Retirement Board Employees’ Annuity and Benefit Fund (LABF), the Policemen’s Annuity and Benefit Fund (PABF), and the Firemen’s Annuity and Benefit Fund (FABF). As of the end of 2012, these pension plans had a com-
bined unfunded liability of $19 billion.2
Until recently, all of these plans were funded using a formula that did not take into account how many benefits they needed to pay in the future. The City would determine its contribution each year by multiplying employee contribu-tions made two years previously by a set “multiplier.” This is still the case with the MEABF and the LABF. For each fund, the City takes employee contribu-tions from two years previously, multiplies them by 1.25 and 1.0, respectively, and pays that amount.
For example, in the year 2010, municipal employees paid $133 million into the pension fund (each year, municipal employees contribute 8.5% of their salaries and wages). Two years later, in 2012, the City put 1.25 times that amount, a total of $167 million, into the municipal fund. Only a portion of that amount—$158 million—went toward pensions, while the other $9 million went to cover retiree health benefits. Meanwhile, according to the fund’s actuaries, the annual
2. This is the total unfunded liability for pension benefits alone. The retirement funds also pay benefits for retiree health insurance, an obligation for which there is also an unfunded liability. That amount is not included here.
Reforms to City of Chicago Pensions 7
© 2014 Anderson Economic Group, LLC

Status of City Pension Plans
required contribution the City needed to pay in 2012 in order to eventually
achieve full funding in the pension plan was $487 million.3
FIGURE 4. Actual Contributions Compared to Annual Required Contribution for City Pension Plans, 2012 (millions of $)
In other words, the City of Chicago, by paying the statutorily required amount in 2012, paid over $300 million less than actuaries would recommend to achieve full funding in the system. This was not only true for the municipal employees’ pension plan. In that same year, the City paid $41 million less than the recom-mended amount in the LABF, $137 million less in the PABF, and $173 million less in the FABF. When these payments are not made, they add to the unfunded liability and compound from year to year. After several years of underfunding its pension plans, the City of Chicago now has a considerable gap to close.
REFORMS TO POLICEMEN’S AND FIREMEN’S PENSIONS
In 2010, the state legislature passed sweeping reforms to all city pension plans, reducing the benefits for all employees hired on or after January 1, 2011. For those employees, among other measures, the legislature pushed back the retire-ment date, capped the salary base for benefits, and reduced the rate at which benefits would increase from one year to the next. These reforms greatly reduced the required payments for all future employees. Importantly, however,
3. Municipal Employees’ Annuity and Benefit Fund of Chicago, “Actuarial Valuation Report for the Year Ending December 31, 2012,” Gabriel Roeder Smith and Company, April 2013.The $487 million figure is found by using a 30-year, level-share-of-payroll funding schedule for paying down the unfunded liability and subtracting the amount already covered by employ-ees.
$0
$100
$200
$300
$400
$500
$600
$700 City of Chicago Contribution Annual Required ContributionEmployee Contribution
MEABF LABF PABF FABF
Source: 2012 and 2013 Actuarial Reports for the MEABF, LABF, PABF and FABFAnalysis: Anderson Economic Group, LLCNote: “Annual Required Contribution” refers to the contribution recommended by actuaries inorder to achieve a fully-funded system at a level share of payroll within 30 years. It isconsiderably higher than the statutorily required amount.
Reforms to City of Chicago Pensions 8
© 2014 Anderson Economic Group, LLC

Status of City Pension Plans
an unfunded liability arises from benefits already accrued. These reforms did not significantly reduce the unfunded liability in these plans because they did not reduce benefits for current employees and retirees.
For the policemen’s and firemen’s annuity funds, the 2010 reforms went even further. For these two funds alone, the City of Chicago abandoned its “multi-plier” financing method and instead was required to adhere to an annual funding requirement that would result in a 90% funding ratio by the year 2040. This requirement goes into effect in 2015. The City was granted permission to levy a tax in order to fund this payment. If the City fails to meet this requirement in any year, the State has permission to redirect grant funds for the City directly into the pension funds.
These reforms will strengthen the solvency of these pension funds, but it will be difficult for the City to meet their new obligations. The estimated annual required contribution from the City for these two pension funds combined was $660 million in 2013. The requirement for 2015 is not yet publicly available, but it is likely to be at least that amount, a considerable increase over the esti-
mated 2013 payments of $250 million.4
FUNDING STATUS OF THE MUNICIPAL AND LABORERS’ FUNDS
For the two remaining funds, MEABF and LABF, the multiplier financing requirement remains. Under the current trajectory, this could lead to insolvency of both funds within the next fifteen years. According to our projections, the MEABF will run out of money in the year 2027 and the LABF will run out of money in the year 2030 under current statutory funding requirements and bene-fits. See Figure 5 on page 10 for the projected funding ratio (ratio of total plan assets to total plan liabilities) for both plans.
If the funding ratio were ever to reach 0%, it is unclear what would occur next. Ultimately, the City of Chicago is statutorily and constitutionally required to pay agreed-upon pension benefits to retired workers. In the year 2027, the year in which the MEABF will run out of funds, we estimate that retired municipal employees will be entitled to $1.2 billion in annual benefits. We estimate that contributions from employees would only cover about $220 million of that total, so the City would be on the hook for an additional $1.0 billion.
Similarly, when the LABF is projected to run out of funds in 2030, retirees would be owed $240 million, only $50 million of which would be covered by contributions from employees. Again, it is unclear how this situation would be resolved. The City could convert to a pay-as-you-go system where they just pay out these benefits as they arise, but this would be highly unusual and perhaps unsustainable in the long run. Another possible outcome would be a negotiated
4. Estimated required contribution and payments for 2013 are from the actuarial valuation reports for the year ending December 31, 2012, for both the Policemen’s Annuity and Benefit Fund and the Firemen’s Annuity and Benefit Fund, prepared by Gabriel Roeder Smith & Company.
Reforms to City of Chicago Pensions 9
© 2014 Anderson Economic Group, LLC

Status of City Pension Plans
default and an eventual effort by the City to reinstate prefunding of benefits for future years.
FIGURE 5. Projected Funding Ratio for the MEABF and LABF Under Current Funding Requirements
0%
10%
20%
30%
40%
50%
60%
2014 2019 2024 2029
LABF
MEABF
Source: Actuarial Reports and Comprehensive Financial Reports for MEABF, LABF; AEGEstimatesAnalysis: Anderson Economic Group, LLC
Reforms to City of Chicago Pensions 10
© 2014 Anderson Economic Group, LLC

Proposed Pension Reforms
III.Proposed Pension Reforms
The proposed reforms that we analyze in this report were passed by both cham-bers of the state legislature on April 8, 2014, as Senate Bill 1922 (SB 1922). In brief, the reforms reduce benefits for retirees in the Municipal Employees’ Fund and the Laborers’ Fund, while committing the City of Chicago and employees to make sufficient contributions to nearly fully fund the plans.
The reforms in SB 1922 consist of the following measures, primarily. Each of these applies to members of both the MEABF and the LABF.
CHANGES TO RETIREE BENEFITS
• Retiree benefits will be reduced by lowering annual cost-of-living adjustments from 3%, compounded, to the lesser of 3% or half of the inflation rate, non-
compounded.5 (Since benefits would no longer be compounded, the increase will be based on the original annuity upon retirement for future retirees and the annuity in the year 2014 for current retirees.)
• Retirees will no longer receive an increase in their first year of retirement, nor will they receive an increase in the years 2017, 2019, or 2025. This measure applies to current and future retirees.
• An exception to the above two points will be made for a retiree whose total annuity is $22,000. For those retirees, the minimum increase is 1% of their orig-inal annuity upon retirement for future retirees and the annuity in the year 2014 for current retirees.
• Beginning in January 2015, employees hired since January 1, 2011, will be able to retire two years earlier. Their new retirement age will be 65 (rather than 67) for a full pension and 60 (rather than 62) for a reduced pension.
CHANGES TO EMPLOYEE CONTRIBUTIONS
• Employee contributions will increase from 8.5% to 11% by the year 2019. This change will be phased in, such that employees must pay an additional 0.5% of their income in each year until 2019, as shown in Table 1 below.
• If the funded ratio for a plan ever exceeds 90%, the employee contribution rate for the following year will drop to 9.75%. If, at any point after this drop, the funded ratio again goes below 90%, the employee contribution rate will revert to 11%.
5. The inflation rate is defined in the bill as the change in the consumer price index for all urban consumers (CPI-U).
TABLE 1. Employee Contribution to Pension Plans Under Proposed Reforms
Year 2014 2015 2016 2017 20182019 and
later
Share of Pay Contributed Under Pension Reforms
8.5% 9.0% 9.5% 10.0% 10.5% 11.0%
Source: Senate Bill 1922, as passed on April 8, 2014
Reforms to City of Chicago Pensions 11
© 2014 Anderson Economic Group, LLC

Proposed Pension Reforms
CHANGES TO CITY OF CHICAGO CONTRIBUTIONS
• In fiscal years 2016 through 2020, the City of Chicago will ramp up its contri-butions to each plan by steadily increasing the “multiplier” from 1.25 to 3.05 for the MEABF and 1.00 to 2.80 for the LABF. The City is permitted to increase property taxes in the prior year in an amount sufficient to cover the additional cost of these contributions. See Table 2 below for details. In order to determine the City contribution each year, the City will multiply the multiplier by employee contributions in the base year.
• In fiscal years 2021 through 2055, the City will be required to pay an amount into each fund that is sufficient, on a level payroll basis, to reach a funding ratio of 90% by the year 2055.
• For each fiscal year after 2055, the City will be required to pay whatever amount is necessary to maintain a funding ratio of 90%.
• If in any year the City fails to make required payments into the pension funds, the State may redirect state grants to the City into the pension funds, up to the amount that the City is required to pay. The amount of grants that can be redi-rected are capped at one-third of the total state grants to the City in 2016, two-thirds of the total state grants to the City in 2017, and all of the total state grants to the City in 2018 and later years.
• The Pension Board may take the City of Chicago to court if it finds that the City is failing to properly pay its obligations.
• Contributions to the funds for the purposes of prefunding pension benefits may not be used to fund retiree health care benefits.
TABLE 2. Increased City of Chicago Contributions Under Pension Reforms, FY 2015 to FY 2020
FY 2015 FY 2016 FY 2017 FY 2018 FY 2019 FY 2020M
EA
BF Multiplier 1.25 1.85 2.15 2.45 2.75 3.05
Base Year 2013 2013 2014 2015 2016 2017
LA
BF Multiplier 1.00 1.60 1.90 2.20 2.50 2.80
Base Year 2013 2013 2014 2015 2016 2017
Source: Senate Bill 1922, as passed on April 8, 2014
Reforms to City of Chicago Pensions 12
© 2014 Anderson Economic Group, LLC

Net Cost of the Proposed Reforms to the City of Chicago and Active Employees
2025
$169
$219
$49
$21
$27
$6
$55
IV.Net Cost of the Proposed Reforms to the City of Chicago and Active Employees
The reforms proposed in SB 1922 would commit the City of Chicago and its employees to making considerably higher payments into the pension funds for municipal employees and laborers.
NET COSTS FOR ACTIVE EMPLOYEES
The proposed reforms would increase the active employee contribution to pen-sions from 8.5% to 11% of employee salaries over the course of five years. There is a provision in the law that would lower this contribution to 9.75% if the fund ever becomes 90% funded; however, we project that it will be a very long time before either fund reaches this ratio.
In Table 3 below, we show the estimated increase in employee contributions due to this law from the years 2015 to 2025. The costs ramp up to a total net annual cost of $55 million. Since this cost is directly proportional to the size of payroll, it will grow as the City payroll grows over time.
NET COSTS FOR THE CITY OF CHICAGO
The proposed reforms would dramatically increase the amount of funding going to both the LABF and the MEABF. As described in “Chicago’s Retirement Funds” on page 7, the City has consistently failed to provide adequate funding for both of these pension funds. These reforms would commit the City to pro-viding sufficient funds to ensure that the plans will be 90% funded by the year 2055.
As shown in Table 4 on page 14, the extra costs of these reforms to the City would ramp up quickly through the year 2021, as required by the law. They would continue to increase at a rate of about 4% even after they have ramped up, due to the nature of the funding plan. By the year 2021, the City will need to provide nearly $450 million in annual contributions above what the current
TABLE 3. Annual Employee Contributions Due to Proposed Reforms, 2015 to 2025 (millions of $)
2015 2016 2017 2018 2019 2020 2021 2022 2023 2024
ME
AB
F Status Quo $145 $148 $151 $154 $157 $159 $161 $163 $165 $167
Reforms $153 $165 $178 $190 $203 $206 $209 $211 $214 $216
Net Increase $9 $17 $27 $36 $46 $47 $47 $48 $49 $49
LA
BF
Status Quo $18 $18 $18 $19 $19 $19 $20 $20 $20 $20
Reforms $19 $20 $21 $23 $25 $25 $25 $26 $26 $26
Net Increase $1 $2 $3 $4 $6 $6 $6 $6 $6 $6
Net Annual Cost of Reforms to Active Employees
$10 $20 $30 $41 $52 $52 $53 $54 $54 $55
Source: MEABF and LABF Actuarial Reports; AEG EstimatesAnalysis: Anderson Economic Group, LLCNote: Numbers may not sum to totals due to rounding.
Reforms to City of Chicago Pensions 13
© 2014 Anderson Economic Group, LLC

Net Cost of the Proposed Reforms to the City of Chicago and Active Employees
025
193
659
465
$17
$80
$64
529
funding formula dictates. By the year 2025, that additional annual cost would grow to $530 million.
Figure 6 below shows the long-term trajectory of the reforms compared to the status quo for both pension funds. We have only projected the impact out to the year 2050; however, if this funding plan is followed, the payment from the City would drop considerably in the year 2055, once the plan has reached 90% fund-ing. As shown in Figure 7 on page 15, these additional contributions would effectively resolve the majority of the funding shortfall.
FIGURE 6. Annual Contributions by the City of Chicago Under Status Quo and Reforms, 2015 to 2050 (billions of $)
TABLE 4. Annual City of Chicago Contributions Due to Proposed Reforms, 2015 to 2025 (millions of $)
2015 2016 2017 2018 2019 2020 2021 2022 2023 2024 2
ME
AB
F Status Quo $163 $166 $170 $174 $177 $181 $184 $186 $189 $191 $
Reforms $163 $246 $294 $365 $444 $530 $577 $596 $616 $637 $
Net Increase $0 $79 $124 $191 $266 $350 $393 $410 $427 $446 $
LA
BF
Status Quo $15 $15 $15 $15 $15 $16 $16 $16 $16 $16
Reforms $15 $25 $30 $38 $47 $57 $71 $73 $75 $78
Net Increase $0 $10 $15 $23 $32 $42 $55 $57 $59 $61
Net Annual Cost of Reforms to City of Chicago
$0 $89 $139 $214 $298 $391 $448 $467 $487 $507 $
Source: MEABF and LABF Actuarial Reports; AEG EstimatesAnalysis: Anderson Economic Group, LLCNote: Numbers may not sum to totals due to rounding. These contributions do not include supplemental contributions to fund retiree health care benefits.
$0.0
$0.2
$0.4
$0.6
$0.8
$1.0
$1.2
$1.4
$1.6
$1.8
2015 2020 2025 2030 2035 2040 2045 2050
Status Quo Status Quo
Reforms Reforms
MEABF runs out of money
LABF runs out of money
MEABF LABF
Source: MEABF and LABF Actuarial Reports; AEG EstimatesAnalysis: Anderson Economic Group, LLC
Reforms to City of Chicago Pensions 14
© 2014 Anderson Economic Group, LLC

Net Cost of the Proposed Reforms to the City of Chicago and Active Employees
FIGURE 7. Funding Ratios Under Status Quo and Reforms, 2015 to 2050
The statute does not specify how the City shall fund these additional contribu-tions, though it does permit the City of Chicago to increase property taxes up to the incremental amount necessary to pay for them. The options actually adopted by the City Council to fund these increased payments would likely include some combination of expenditure cuts and revenue increases.
THE COST OF WAITING
The general motivation for prefunding pension benefits stems from the ability to gain investment returns on money set aside today. The earlier that an employer sets aside money to pay for future benefits, the more investment returns that employer will realize and the less that employer will have to spend overall. Some might question the urgency of these pension reforms, but the foregoing logic suggests that waiting is costly.
We performed the same analysis assuming that the reforms would go into effect five years into the future. Thus, the first year of the changes would be 2020, and the plans would be 90% funded by the year 2060 instead of 2055.
As shown in Table 5 on page 16, the costs of the reform would be considerably higher. Once the reforms are fully phased in (year six), the City would pay $960 million if it waits five years to begin implementing this reform, rather than $650 million if the reform is implemented in this coming year. Figure 8 on page 16 shows the costs of both scenarios over time. Note how the reform, if imple-mented in 2020, becomes considerably more expensive in the year 2026 than it would be if the City were to implement it starting in 2015. The cost of delay in years 2026 and beyond exceeds $200 million per year.
0%
10%
20%
30%
40%
50%
60%
70%
80%
90%
100%
2015 2020 2025 2030 2035 2040 2045 2050
Status Quo Status QuoReforms Reforms
MEABF runs out of money
LABF runs out of money
MEABF LABF
Source: MEABF and LABF Actuarial Reports; AEG EstimatesAnalysis: Anderson Economic Group, LLC
Reforms to City of Chicago Pensions 15
© 2014 Anderson Economic Group, LLC

Net Cost of the Proposed Reforms to the City of Chicago and Active Employees
10
39
07
FIGURE 8. Annual Contributions by the City of Chicago Under Proposed Reforms if Implemented in 2015 and 2020, Respectively (billions of $)
$0.0
$0.5
$1.0
$1.5
$2.0
$2.5
2015 2020 2025 2030 2035 2040 2045 2050
Implemented in 2015
Implemented in 2020
Source: MEABF and LABF Actuarial Reports; AEG EstimatesAnalysis: Anderson Economic Group, LLC
TABLE 5. City of Chicago Annual Contributions in the First 10 Years Following Reform if Reforms Are Implemented in 2015 and in 2020, Respectively (millions of $)
Years Since Reform
Year of Implementation 0 1 2 3 4 5 6 7 8 9
2015 $178 $271 $324 $403 $491 $588 $647 $669 $691 $715 $7
2020 $196 $304 $362 $446 $539 $640 $961 $996 $1,031 $1,068 $1,1
Source: MEABF and LABF Actuarial Reports; AEG EstimatesAnalysis: Anderson Economic Group, LLCNote: These contributions do not include supplemental contributions to fund retiree health care benefits, which are unaffected by thesereforms.
Reforms to City of Chicago Pensions 16
© 2014 Anderson Economic Group, LLC
Benefit Reduction for Employees and Retirees
V.Benefit Reduction for Employees and Retirees
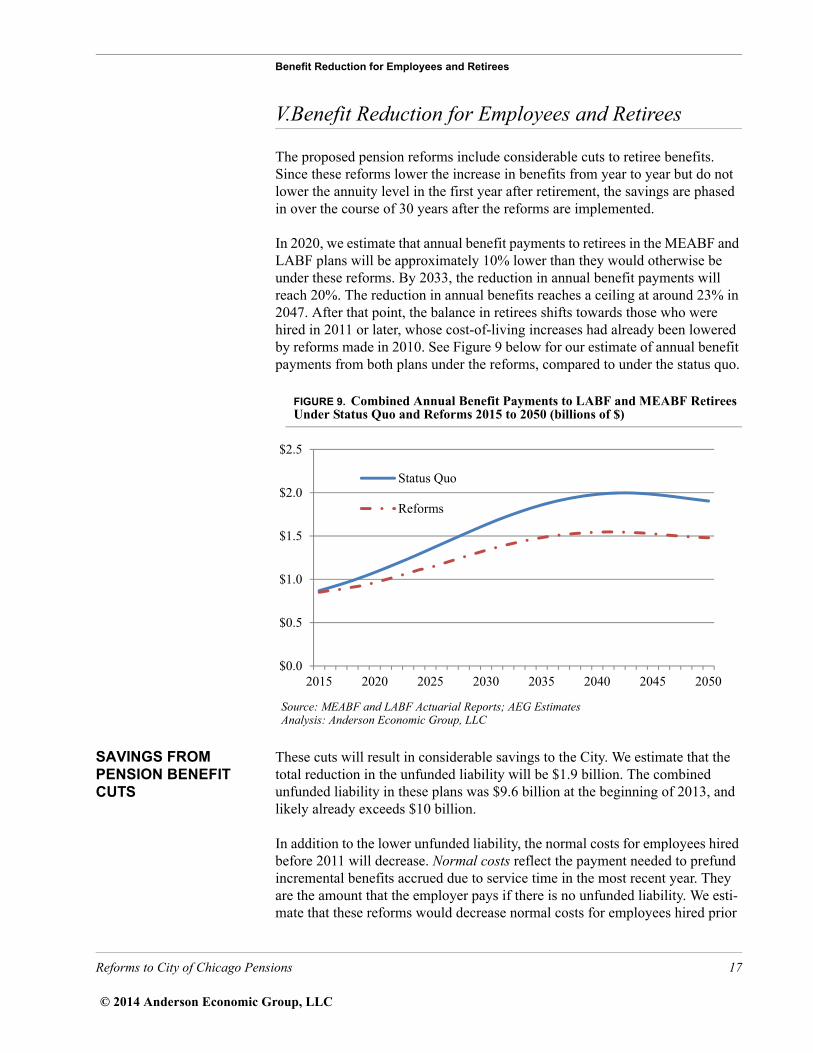
The proposed pension reforms include considerable cuts to retiree benefits. Since these reforms lower the increase in benefits from year to year but do not lower the annuity level in the first year after retirement, the savings are phased in over the course of 30 years after the reforms are implemented.
In 2020, we estimate that annual benefit payments to retirees in the MEABF and LABF plans will be approximately 10% lower than they would otherwise be under these reforms. By 2033, the reduction in annual benefit payments will reach 20%. The reduction in annual benefits reaches a ceiling at around 23% in 2047. After that point, the balance in retirees shifts towards those who were hired in 2011 or later, whose cost-of-living increases had already been lowered by reforms made in 2010. See Figure 9 below for our estimate of annual benefit payments from both plans under the reforms, compared to under the status quo.
FIGURE 9. Combined Annual Benefit Payments to LABF and MEABF Retirees Under Status Quo and Reforms 2015 to 2050 (billions of $)
SAVINGS FROM PENSION BENEFIT CUTS
These cuts will result in considerable savings to the City. We estimate that the total reduction in the unfunded liability will be $1.9 billion. The combined unfunded liability in these plans was $9.6 billion at the beginning of 2013, and likely already exceeds $10 billion.
In addition to the lower unfunded liability, the normal costs for employees hired before 2011 will decrease. Normal costs reflect the payment needed to prefund incremental benefits accrued due to service time in the most recent year. They are the amount that the employer pays if there is no unfunded liability. We esti-mate that these reforms would decrease normal costs for employees hired prior
$0.0
$0.5
$1.0
$1.5
$2.0
$2.5
2015 2020 2025 2030 2035 2040 2045 2050
Status Quo
Reforms
Source: MEABF and LABF Actuarial Reports; AEG EstimatesAnalysis: Anderson Economic Group, LLC
Reforms to City of Chicago Pensions 17
© 2014 Anderson Economic Group, LLC

Benefit Reduction for Employees and Retirees
to 2011 by 13%. Offsetting these savings somewhat are increased normal costs for employees hired in 2011 and later. Since those employees would now be able to retire two years earlier under these reforms, we estimate that normal costs for these employees would go up by about 7%. These changes are summa-rized in Table 6 below.
IMPACT ON CURRENT RETIREES
This reform, in percentage terms, will impact nearly all retirees in the same way. Since the benefit cut takes the form of a decrease in annual cost-of-living increases, the benefit cut grows over time relative to what the retiree would earn under the current benefit plan. Figure 10 on page 19 shows the trajectory of annual benefits relative to what they would be in the absence of the reforms, indexed to 100 in the year 2014.
Ten years from now, all current retirees who are eligible for increases will have annual benefits 34% higher than their benefits are this year if there is no change. Under the proposed reforms, the annual benefit level increases by 9% over that same time period. For someone who currently receives about $36,000 in annual pension benefits (the average annual benefits for a 67-year-old in the municipal employees’ plan), this means a difference of $9,000 in the year 2024. The dif-ference grows considerably over time.
Note that these reductions mean that retirees’ incomes will be going up at a slower rate than inflation, in any year where inflation is positive. This implies that real incomes (incomes adjusted for inflation) for retirees will be decreasing over time. This applies to the employees discussed in the next section, as well.
TABLE 6. Normal Costs and Unfunded Liability Under Status Quo and Reforms, 2015
Status Quo Reforms
ME
AB
FNormal Cost, Employees Hired Prior to 2011
17.4% 15.1%
Normal Cost, Employees Hired in 2011 and Later
10.7% 11.5%
Unfunded Liability $10.6 billion $8.9 billion
LA
BF
Normal Cost, Employees Hired Prior to 2011
20.1% 17.6%
Normal Cost, Employees Hired in 2011 and Later
14.0% 15.4%
Unfunded Liability $1.3 billion $1.0 billion
Source: MEABF and LABF Actuarial Reports; AEG EstimatesAnalysis: Anderson Economic Group, LLCNote: Normal costs are presented as a percent of salary and wages.
Reforms to City of Chicago Pensions 18
© 2014 Anderson Economic Group, LLC

Benefit Reduction for Employees and Retirees
FIGURE 10. Increase in Annual Retiree Benefits After 2014 for Current Retirees, Under Status Quo and Reforms (100 = benefit level in 2014)
CHANGE IN BENEFITS FOR CURRENT EMPLOYEES
Current employees will see a considerable decrease in long-term benefits once they retire, as well. In this section, we focus only on employees who were hired prior to 2011. Those hired in 2011 or later will actually see an increase in aver-age benefits because they are now able to retire two years earlier.
As with current retirees, the change in annual benefits for employees, in per-centage terms, is the same for almost all employees over the course of their retirement. Figure 11 on page 20 shows the increase in annual benefits over the course of retirement for employees that have not yet retired under the status quo and under the proposed reforms.
Under the status quo, in their tenth year after retirement, plan members receive 34% more in annual benefits than they received in their first year of retirement. Under the proposed reforms, this increase in annual benefits will be reduced to 11%. Within fifteen years, these values increase to 56% and 17%, respectively. For someone with a starting annuity of $60,000, this results in a cut of $14,160 in the tenth year of retirement and $23,405 in the fifteenth year of retirement.
80
90
100
110
120
130
140
150
160
170
180
2014 2019 2024 2029
Status Quo
Reforms
Source: Senate Bill 1922, as passed on April 8, 2014; Congressional Budget Office Baseline
Analysis: Anderson Economic Group, LLCEconomic Forecast, February 2014; AEG Estimates
Reforms to City of Chicago Pensions 19
© 2014 Anderson Economic Group, LLC

Benefit Reduction for Employees and Retirees
FIGURE 11. Increase in Annual Retiree Benefits After Retirement for Future Retirees, Under Status Quo and Reforms (100 = benefit level in first year)
The only retirees who will not experience the change in benefits shown above are those who will retire in the next few years. They will experience a lower benefits trajectory—closer to that of current retirees—because they will not receive an increase in the years 2017, 2019, and 2025.
There is a special provision in the law for those making annuities less than $22,000. They are not subject to the pension “freezes” in the first year of retire-ment and in the years 2017, 2019, and 2025. This currently applies to just under 40% of retirees, but will apply to a lower and lower share in the future as infla-tion steadily increases the final average salary on which benefits are based. Those who receive an increase in the “freeze” years will only receive an increase of 1%, so this provision only has a small effect on the overall reduction in benefits.
Source: Senate Bill 1922, as passed on April 8, 2014; Congressional Budget Office Baseline
Analysis: Anderson Economic Group, LLCEconomic Forecast, February 2014; AEG Estimates
80
90
100
110
120
130
140
150
160
170
0 5 10 15Years Since Retirement
Status Quo
Reforms
Reforms to City of Chicago Pensions 20
© 2014 Anderson Economic Group, LLC
About the Author
VI.About the Author
ABOUT ANDERSON ECONOMIC GROUP
Anderson Economic Group, LLC was founded in 1996 and today has offices in East Lansing, Michigan and Chicago, Illinois. AEG is a research and consulting firm that specializes in economics, public policy, financial valuation, and mar-ket research.
We insist on a high level of integrity in our analyses, together with technical expertise in the field. For these reasons, work by Anderson Economic Group is commonly used in legislative hearings, legal proceedings, and executive strat-egy discussions.
Since our founding in 1996, our analysis has helped publicly-held corporations, private businesses, governments, and non-profit organizations. Our work has included markets throughout the United States, as well as in Canada, Mexico, and Barbados.
AEG’s past clients include:
• Governments such as the states of Michigan, North Carolina, Kentucky, and Wisconsin; the cities of Detroit, Cincinnati, Norfolk, and Fort Wayne; and coun-ties such as Oakland County, Michigan, and Collier County, Florida.
• Corporations such as GM, Ford, Delphi, Honda, Taubman Centers, The Detroit Lions, PG&E Generating; SBC, Gambrinus, Labatt USA, and InBev USA; Spartan Stores, Nestle, automobile dealers and dealership groups representing Toyota, Honda, Chrysler, Mercedes-Benz, and other brands.
• Nonprofit organizations such as Michigan State University, Wayne State Uni-versity, University of Michigan, Van Andel Institute, the Michigan Manufactur-ers Association, United Ways of Michigan, Service Employees International Union, Automation Alley, and the Michigan Chamber of Commerce.
Please visit www.AndersonEconomicGroup.com for more information.
ABOUT THE AUTHOR Jason Horwitz. Mr. Horwitz is a Consultant at Anderson Economic Group, working in the Public Policy and Economic Analysis practice area. Mr. Horwitz' work includes research and analyses on tax reforms, tax incentives, pensions, energy, and the economic impact of large institutions.
COPYRIGHT NOTICE & DISCLAIMERS
This entire report, including tables, is copyright (c) 2014 by Anderson Eco-nomic Group LLC. All rights reserved, except permission to reproduce in its entirety, including this notice, for news media and research purposes. Resale without permission, and use in derivative works, is expressly prohibited. “Fair use” excerpts may be included in news or research reports provided a complete citation is given to the author, title, and publisher.
Reforms to City of Chicago Pensions 21
© 2014 Anderson Economic Group, LLC
Methodology
VII.Methodology
In order to provide the estimates in this report, we performed an actuarial analy-sis on the pension reforms, as proposed in SB 1922. Our primary sources were the annual actuarial reports and comprehensive financial reports for the Labor-ers’ and Retirement Board Employees’ Annuity and Benefit Fund of Chicago (LABF) and the Municipal Employees’ Annuity and Benefit Fund of Chicago (MEABF). These reports provide only summary information, so we were required to make certain assumptions in order to carry out our analysis. As a result, our estimates may moderately differ from those of actuaries who have access to more detailed information.
Using, where possible, the same actuarial assumptions that these funds’ actuar-ies used, we took the following steps:
• Estimated, for all years through 2050, the number of active employees and retir-ees, including their age, tenure, and average salary (in the case of retirees, aver-age salary upon retirement) for both the MEABF and the LABF.
• Estimated benefit payments for retirees in each year, based on the current fund-ing formula and based on the formula after reforms for both the MEABF and the LABF.
• Estimated the new unfunded liability and new requirements for funding due to changes in the benefits paid and the changes in the funding formula for both the MEABF and LABF.
MEMBERS AND RETIREES
For each year between 2014 and 2050, inclusive, we estimated the number of active employees in the LABF and the MEABF. We started with the number of active employees by age and tenure. We assigned each employee within a given age-and-tenure group the average pay level for that group. This information was available in the actuarial report for each fund.
The total number of Tier 2 employees (employees hired after January 1, 2011) was available, but they were not separated out by age and tenure. We assigned all employees with less than one year of tenure and a proportion of those with one to four years of tenure to the Tier 2 group. The share of those with one to four years of tenure apportioned to the Tier 2 group were based on the Tier 2 total and the percent of people within each age group with less than one year of tenure. We tracked Tier 1 and Tier 2 employees separately because they receive very different benefits.
We then constructed a custom model to project the number of active employees and number of retirees for future years. In each year, the number of active employees at a given tenure and age would be equal to the number of active employees from the previous year with that tenure minus one year and that age minus one year, adjusted for the following:
• Mortality rate for working people of that age;
Reforms to City of Chicago Pensions 22
© 2014 Anderson Economic Group, LLC

Methodology
• Termination rate (rate at which employees left without retiring, for any reason) for that tenure and age; and,
• Retirement rate for that tenure and age.
We used RP-2014 Mortality Rates from the Society of Actuaries. We did not make adjustments to these mortality rates for future years. Termination rates and retirement rates were provided in the actuarial reports.
We also adjusted the salaries in each year. We assumed that starting salaries would grow by 3% from one year to the next (the actuaries for these systems use inflation values of 3%). For other salaries, at every given level of tenure and age, we used the rate of salary increases as presented in the actuarial report. For example, the rate of salary increase used by MEABF actuaries for employees with 4 years of tenure is 6.75%. Therefore, we assumed that a 30-year-old with 5 years of tenure in 2021 would have a salary 6.75% greater than a 29-year-old with 4 years of tenure in 2020.
For those who retired, we kept track of final salary, tenure, age, and the year in which they retired. After the first year of retirement, the number of retirees at a given tenure level were simply adjusted by mortality rates for the following year.
We also assumed that, for each year after 2012, the number of new employees in each fund and their age distribution would be the same as they were in 2012 for MEABF and 2011 in LABF. We used 2011 for LABF employees because the number of hires in 2012 was unusually low, and we did not want to assume that trend would continue.
The only difference between the numbers and characteristics of retirees under the reforms occurs for Tier 2 employees (those hired in 2011 or later). Tier 2 employees would be able to hire two years earlier under proposed reforms (65 instead of 67 for a full pension). We assumed that retiree rates at the earlier ages would be the same as they were for the youngest ages under the current plan. We adjusted our analysis accordingly when modeling the effect of the proposed reforms.
ESTIMATING BENEFITS
We estimated benefits for three different groups: those who retired before 2013 (current retirees), those who were hired before 2011 and retired in 2013 or later (Tier 1 future retirees), and those who were hired in 2011 or later (Tier 2 future retirees).
Current retirees
The actuarial reports for these funds provide the number of retirees and their average benefits received by age. We assumed, in the first year, that each retiree received the average benefit corresponding to their given age bracket. In model-ing future benefit payments under the status quo, we simply increased the bene-
Reforms to City of Chicago Pensions 23
© 2014 Anderson Economic Group, LLC

Methodology
fit level for the set of retirees at each age by 3%, and then reduced the number of retirees by the mortality rate for retired workers.
After Reforms. To estimate current retirees’ benefits after reforms, we assumed that inflation would never be 6% or higher. This means that, in years where there would be no freeze, retirees’ benefits would increase at half the rate of inflation times their benefit in the year 2014. For each year, we added a given age group’s 2014 benefit times half the rate of inflation, according to the Con-gressional Budget Office (CBO) February 2014 Economic Baseline Forecast. For years after 2024, the last year where CPI-U is projected in the baseline fore-cast, we assumed that the inflation rate would be equal to the projected inflation rate in 2024 (2.4%).
In the years 2017, 2019, and 2025 we did not increase the benefits from one year to the next, as the proposed reforms require a benefit freeze in those years. In each case, we adjusted the change in benefits from one year to the next by the mortality rate for retirees within each age group.
Tier 1 future retirees
For future retirees in Tier 1 (retirees who retire in or after 2013 and were hired prior to 2011), we estimated benefits under the current plan by multiplying 2.4% times years of tenure times final average salary for retirees with 33 years of ser-vice or less. Retirees cannot receive more than 80% of their final average salary as their starting annuity, so retirees with over 33 years of service were given an original annuity of 80% times their final average salary.
Final average salary is the highest average annual salary for any four consecu-tive years within the last ten years of service. To approximate final average sal-ary, we multiplied the retiring salary for a retiree by 93.7% for the MEABF and 94.7% for the LABF. This would accurately estimate a retiree’s final average salary if that retiree received 4.5% raises in each of the four years leading up to retirement in the MEABF and 3.75% raises in each of the four years leading up to retirement in the LABF. Those amounts for raises correspond to actuarial assumptions made in the funds’ actuarial reports.
In all future years, we increased each retiree’s benefits by 3%. In each case, we adjusted the number of retirees for each year downward by the mortality rates for retirees within each age group.
After Reforms. To estimate the benefits for future retirees under the reforms, we used the same method to estimate the starting benefit as under the current plan. However, instead of using a 3% increase in years following the first year of retirement, we used an increase equivalent to half of inflation, as estimated by the Congressional Budget Office, times the original annuity upon retirement.
Reforms to City of Chicago Pensions 24
© 2014 Anderson Economic Group, LLC

Methodology
We did not apply this increase in the first year after retirement or in the years 2017, 2019, and 2025. In each case, we adjusted the number of retirees for each year downward by the mortality rates for retirees within each age group.
Tier 2 future retirees
For future retirees in Tier 2 (retirees who were hired in 2011 or later), we esti-mated benefits under the current plan by multiplying 2.4% times years of tenure times final average salary for those with 33 years of service or less. Retirees cannot receive more than 80% of their final average salary as their starting annuity, so retirees with over 33 years of service were given an original annuity of 80% times their final average salary.
For Tier 2 employees, final average salary is the highest average annual salary for any eight consecutive years within the last ten years of service (as opposed to four). To approximate final average salary, we multiplied the retiring salary for a retiree by 86.2% for the MEABF and 88.2% for the LABF. This would accurately estimate a retiree’s final average salary if that retiree received 4.5% raises in each of the eight years leading up to retirement in the MEABF and 3.75% raises in each of the eight years leading up to retirement in the LABF. Those raise amounts correspond to actuarial assumptions made in the funds’ actuarial reports.
Also, final average salary was capped at $106,800 in 2011 for Tier 2 employees. This cap is adjusted upward by half the rate of inflation each year. We accounted for this cap and how it would change over time in estimating final average sal-ary.
In all future years, we increased each retiree’s benefits by half of inflation times the original annuity upon retirement. We also adjusted the number of retirees downward by the mortality rate for retirees at each corresponding age.
After Reforms. The reforms would affect Tier 2 retirees in two ways. Their retirement age would be reduced by two years (65 instead of 67 for a full bene-fit), and they would no longer receive a benefit increase after their first year of retirement and in the year 2025 (no Tier 2 employees in these plans will be eligi-ble to retire prior to 2022).
As stated above, we re-estimated the number and characteristics of Tier 2 mem-bers and retirees using an earlier retirement age. We simply applied the same procedure to these new estimates in order to account for the change in retire-ment age.
Also, we did not apply the benefit increase after retirees’ first year of retirement or in the year 2025 to arrive at our final estimate of benefits provided to Tier 2 employees.
Reforms to City of Chicago Pensions 25
© 2014 Anderson Economic Group, LLC

Methodology
Impact on Benefits
Once we had estimated annual benefit payments for all groups under both the status quo and the reforms, we simply added up the groups under both scenar-ios. Then, the net impact of the reforms in any given year on benefit payments was simply the difference between the annual benefit payments to all groups under the reforms and the annual benefit payments to all groups under the status quo.
CHANGE IN NORMAL COSTS AND UNFUNDED LIABILITY
The changes in retiree benefit payments estimated above would impact the required City contributions through their change in the normal costs for current employees and their impact on the unfunded liability for the two systems.
Normal Costs
Normal costs are the payments required to cover the most recent year in accrued benefits for current employees. They represent how much should be paid into the pension fund if there is no unfunded liability. We estimated the change in normal costs by estimating how much less (or more) benefits will cost that will be accrued in future years. We estimated this separately for Tier 1 and for Tier 2 employees.
Tier 1. For a range of Tier 1 employees at different ages, tenure, salary, and years of retirement, we projected their future benefits under the status quo and under the reforms, using the appropriate cost-of-living adjustments. Then, we took the present value of those changes relative to the year of their retirement. We took the present value because for each year in which they are not receiving benefits, assets set aside for their benefits can gain another year of returns. The discount rate used to estimate present value was 7.5%, the actuarial assumption for market rates of return under both plans.
After modeling projected benefits under the status quo and reforms under a range of scenarios, we estimated the total present value of all benefits provided over the course of retirement in each scenario. Then, we estimated the percent-age difference between the total present value of benefits provided under the reforms relative to the status quo in each scenario. The average of this percent-age difference across all scenarios was 12.8%. Therefore, we assumed that nor-mal costs would be reduced by 12.8%, on average, for Tier 1 employees.
Tier 2. For Tier 2 employees, we used a different method because we had to account not only for a different amount of benefits for each retiree, but a change in the overall number and characteristics of retirees due to the lowered retire-ment age. Using the methods described in the section “Tier 2 future retirees” on page 25, we estimated the change in total retiree benefits only for Tier 2 employees for all years between 2022 and 2050.
Then, we assumed that all retiree benefits paid in 2050 were not yet accrued. In years prior to 2050, we increased the share of benefits not yet accrued (and
Reforms to City of Chicago Pensions 26
© 2014 Anderson Economic Group, LLC

Methodology
therefore not a part of the already-recognized liability). We needed to make this distinction since normal costs only reflect new benefits accrued in the relevant year. We assumed that about two-thirds of the benefits for those retiring in 2022 had not yet been accrued. For each year in between, there was a gradual increase through 2050 to a full share of benefits.
Once we estimated the share of the net savings that were attributable to benefits yet to be accrued, we took the average of those benefits over every year from 2022 to 2050. This average was weighted by a factor related to the present value in benefits for that year, such that changes in benefits in 30 years had less of an impact on the normal costs than changes in benefits in 20 years. The discount rate we used for present value was 7.5%. Our weighted average was a 7.2% increase in benefits, suggesting that normal costs for Tier 2 retirees should go up by 7.2%.
Unfunded Liability
To estimate the unfunded liability, we started with the total change in benefits paid due to the reform, as calculated in “Impact on Benefits” on page 26. We could not attribute the total change in benefits to a change in the unfunded lia-bility, because some of the reduced benefits are yet to be accrued by current employees (they will be paid for through normal costs in the coming years).
For current retirees, all changes in benefits would contribute to a reduction in the unfunded liability. We took the present value of all reductions in benefits for current retirees and summed them to estimate how much they would reduce the unfunded liability.
For employees not yet retired, we assumed that all of the change in their bene-fits would reduce the unfunded liability in the year 2015 and none of them would reduce the unfunded liability in the year 2030. We then estimated the share that should be applied to the unfunded liability in between using a straight-line gradual increase in the share of benefits. Finally, we took the pres-ent value of these benefits and summed them across all years to get their total impact on the unfunded liability.
CITY AND EMPLOYEE CONTRIBUTIONS
Once we estimated the change in normal costs and the unfunded liability, we could estimate the change in City contributions and employee contributions. The provisions of the law, as laid out in “Changes to Employee Contributions” on page 11, require that employees begin to increase their contributions gradu-ally over the next five years as a share of their payroll. We estimated total pay-roll for active employees every year through the process outlined in “Members and Retirees” on page 22.
We simply applied the proper percentage to those payrolls in each year to esti-mate the employee contribution to the pension plans under both the status quo and the reform. The difference between the status quo and the reform contribu-
Reforms to City of Chicago Pensions 27
© 2014 Anderson Economic Group, LLC

Methodology
tions in any given year are the net annual cost of the pension reforms to active employees.
City contributions in the years 2012 and 2013 were taken from the actuarial reports. The City contribution for 2014 and 2015 was estimated by multiplying the employer contributions in the year 2012 and 2013, respectively, by the appropriate multipliers—1.0 for the LABF and 1.25 for the MEABF. Under the status quo, we continued this for all years after 2015 until the funds were insol-vent. We made no assumptions about what the City contributions might be upon fund insolvency.
For the years 2016 through 2020 under reforms, we applied the provisions in the law that require the multiplier to go up each year and to multiply it times the employer contributions from three years previously. For example, City contri-butions in 2016 for the LABF will simply be 1.6 times 2013 employer contribu-tions in the LABF.
In order to estimate the contributions in 2021 and beyond under the reforms, we were required to estimate the unfunded liability over time. The unfunded liabil-ity at the beginning of 2013 is taken from the 2012 actuarial report. For each year after that, we simply subtract the contributions from the City and employ-ees for that year that do not cover the normal cost, and then multiply the remain-der by 1.075. We use the multiplier 1.075 since the actuaries assume 7.5% market gains in both funds. In all cases, we excluded the City contribution to cover retiree health care. This method is applied to both the reform and the sta-tus quo. Under the reform, we subtract our estimate for the change in unfunded liability from both the unfunded liability and the total accrued liability in the year 2015.
For the year 2021 under the reform, we estimated City contributions for all future years based on the unfunded liability. The proposed reforms require that the City achieve 90% funding in both plans by the year 2055 by providing con-tributions as a level share of payroll. In both plans, actuaries assume that payroll will increase at an annual rate of 4%. Therefore, if the City is funding the plans as a level share of payroll, the contribution will also increase at an annual rate of 4%.
To find the amount the City is required to contribute in 2021, we set the City contribution to the value it would need to be in order for the unfunded liability in the year 2055 to be equivalent to 10% of the total system liabilities. The con-tribution in each year from the City for pensions was assumed to be 4% higher than the last after 2021. The unfunded liability would change from year to year just as described above.
Reforms to City of Chicago Pensions 28
© 2014 Anderson Economic Group, LLC


![Cap. 173] Pensions CHAPTER 173. PENSIONS. 173.pdf · Pensions, etc., to cease on bankruptcy. 14. Pensions, etc., may cease on sentence to term of imprisonment. 15. Pensions, etc.,](https://static.fdocuments.us/doc/165x107/5f32c41fe2aa25713c052446/cap-173-pensions-chapter-173-173pdf-pensions-etc-to-cease-on-bankruptcy.jpg)