Proposed Provincial Air Quality Objectives for Nitrogen ...
28
Proposed Provincial Air Quality Objectives for Nitrogen Dioxide (NO 2 ) Jerome A. Robles, Ph.D., P.Eng. Air Quality Science Specialist Clean Air/Environmental Standards Branch Ministry of Environment and Climate Change Strategy Public Webinar 26 May 2021 1
Transcript of Proposed Provincial Air Quality Objectives for Nitrogen ...

Proposed Provincial Air Quality Objectives for
Nitrogen Dioxide (NO2)
Jerome A. Robles, Ph.D., P.Eng.Air Quality Science Specialist
Clean Air/Environmental Standards BranchMinistry of Environment and Climate Change Strategy
Public Webinar26 May 2021
1

Presentation Outline
• Summarise key findings from the review of Provincial Air Quality Objectives- NO2 levels: status and
trends- NOx emission trends
and projections
• Proposal for new Provincial Air Quality Objectives for NO2
2
3
Nitrogen Dioxide (NO2)
• Part of highly reactive compounds: Nitrogen Oxides (NOx)
• Formed during combustion
• Can cause/aggravate asthma, reduce lung functions
• Produce ozone, acid rain, smog
• Non-threshold pollutant
4
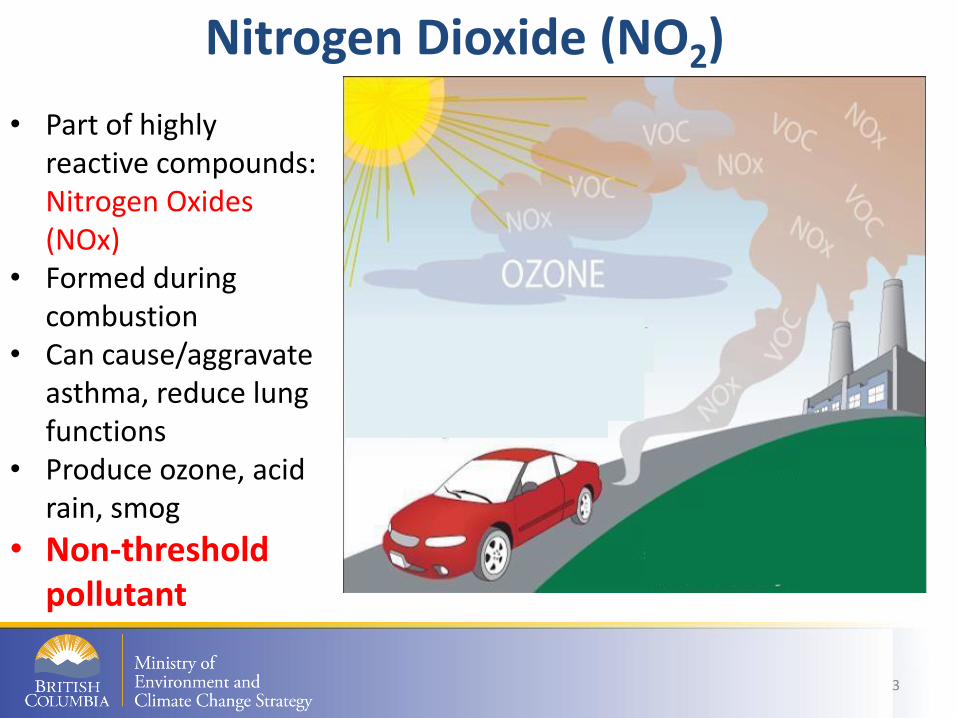
BackgroundBased on U.S. EPA and Canadian
National Ambient Air Quality Objective
Interim Provincial Air Quality Objective (2014)• 1-hour: 100 ppb (98th perc. of daily max
over 1-year)• Annual: 32 ppb
Based on Population Improvement Approach1% PIA (2020), 15% PIA (2025)
2020 CAAQS for NO2 (2017)• 1-hour: 60 ppb (98th perc. of daily max
over 3 years)• Annual: 17 ppb
2025 CAAQS for NO2 (2017)• 1-hour: 42 ppb (98th perc. of daily max
over 3 years)• Annual: 12 ppb
Provincial Framework for Development of Provincial AQOs
• Where CAAQS exist, use CAAQS and supporting science as starting point
• Where CAAQS do not exist, use criteria from leading Canadian/U.S. jurisdictions as starting point
5
6
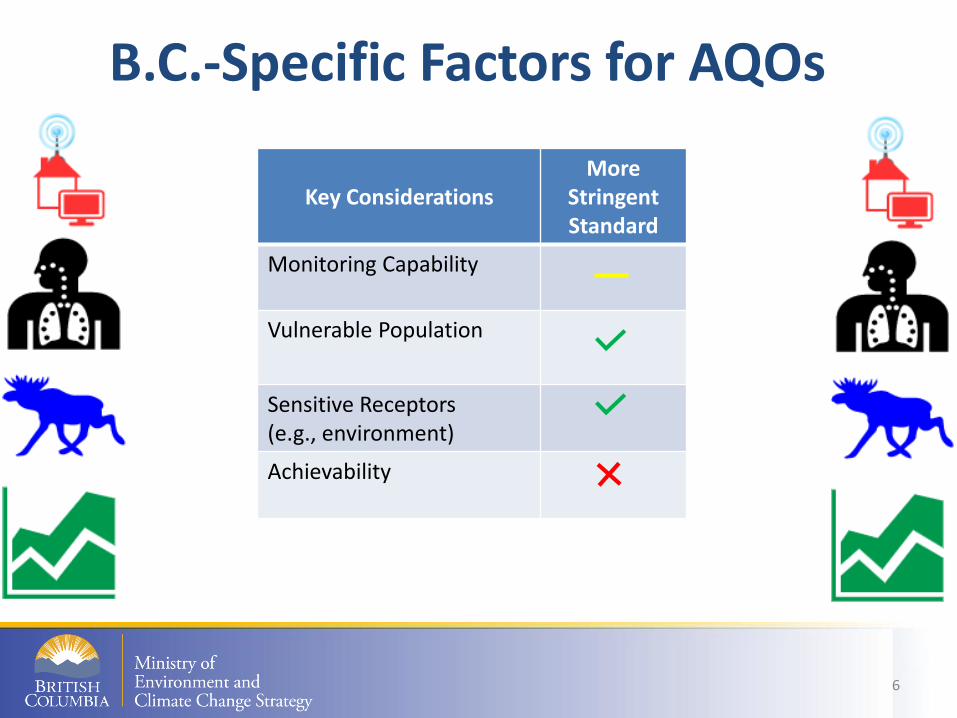
B.C.-Specific Factors for AQOs
Key ConsiderationsMore
Stringent Standard
Monitoring Capability
Vulnerable Population
Sensitive Receptors (e.g., environment)
Achievability
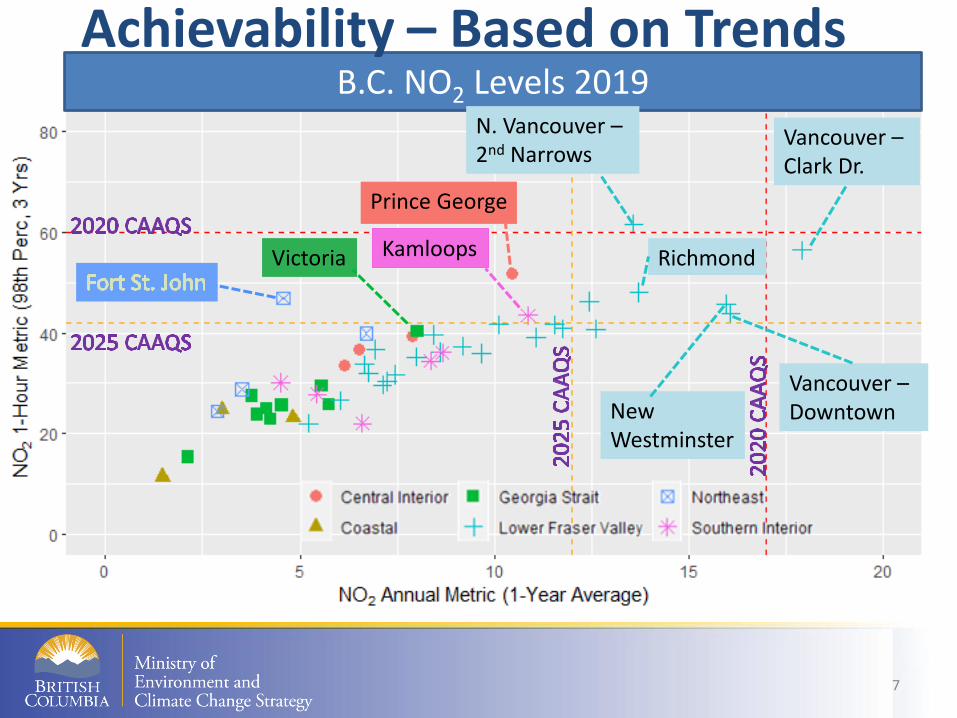
B.C. NO2 Levels 2019
7
Vancouver –Downtown
Vancouver –Clark Dr.
New Westminster
Richmond
Achievability – Based on Trends
Prince George
Victoria Kamloops
N. Vancouver –2nd Narrows
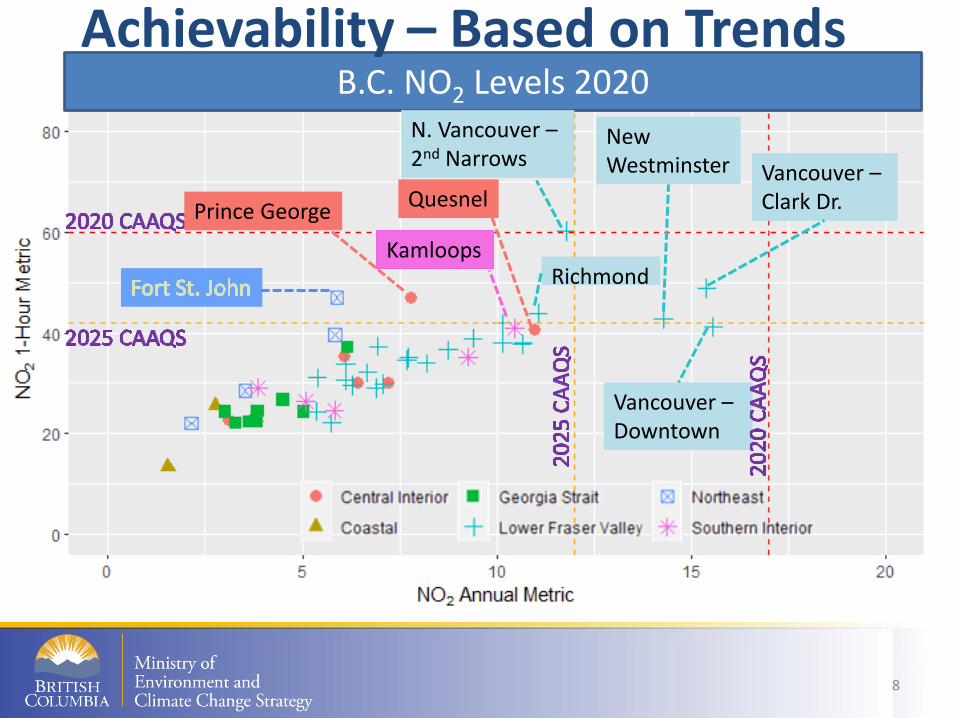
B.C. NO2 Levels 2020
8
Vancouver –Downtown
Vancouver –Clark Dr.
New Westminster
Richmond
Achievability – Based on Trends
Prince GeorgeQuesnel
Kamloops
N. Vancouver –2nd Narrows
9
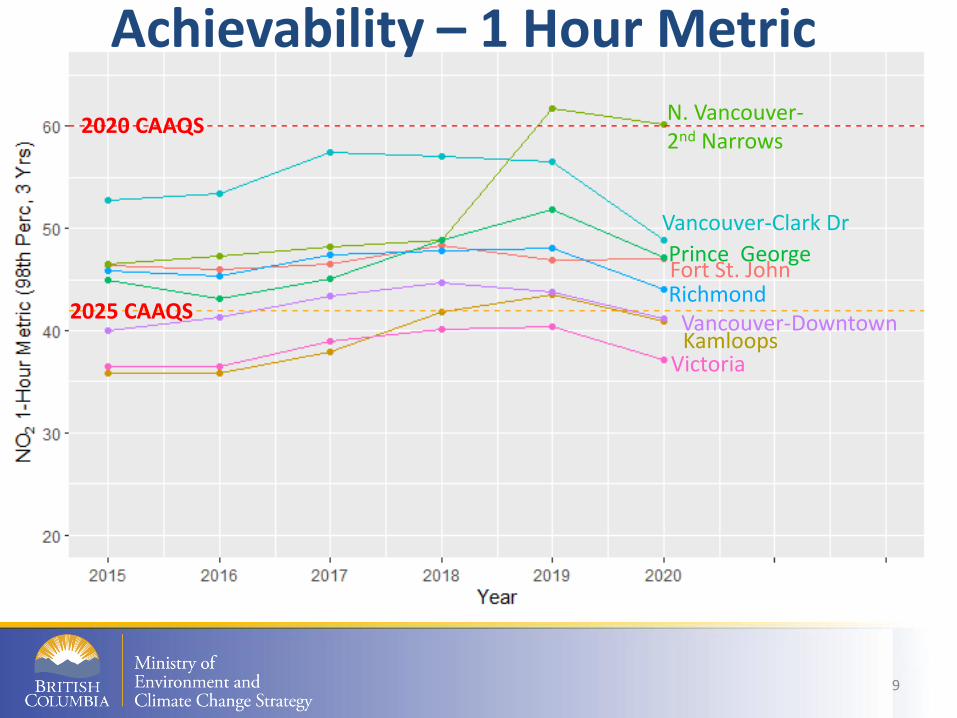
Fort St. John
Kamloops
Vancouver-Clark Dr
Vancouver-DowntownRichmond
Prince George
Achievability – 1 Hour Metric
2025 CAAQS
2020 CAAQSN. Vancouver-2nd Narrows
Victoria

10
Fort St. John
Kamloops
Vancouver-Clark DrVancouver-Downtown
Richmond
Prince George
Achievability – Annual Metric
2025 CAAQS
2020 CAAQS
N. Vancouver-2nd Narrows
Victoria
11
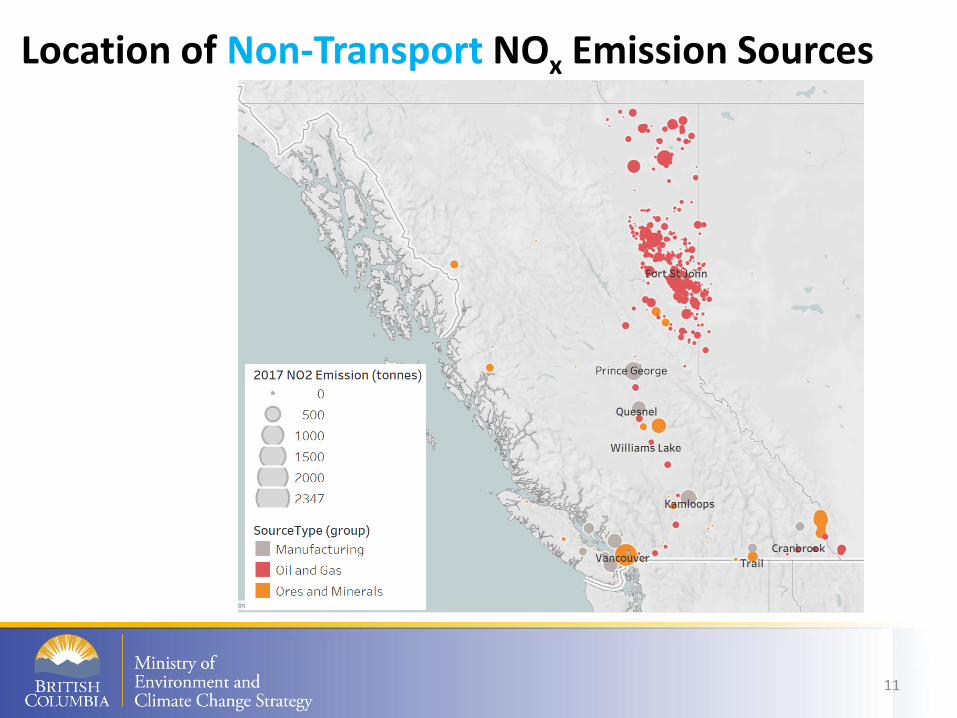
Location of Non-Transport NOx Emission Sources
12
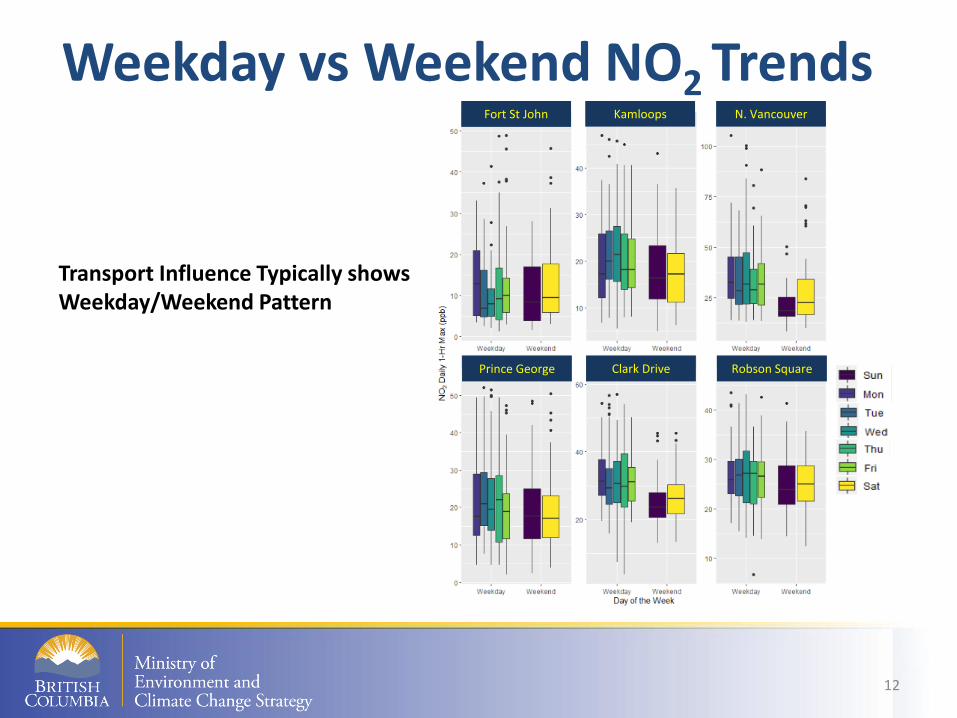
Weekday vs Weekend NO2 TrendsFort St John Kamloops N. Vancouver
Prince George Clark Drive Robson Square
Transport Influence Typically shows Weekday/Weekend Pattern
13
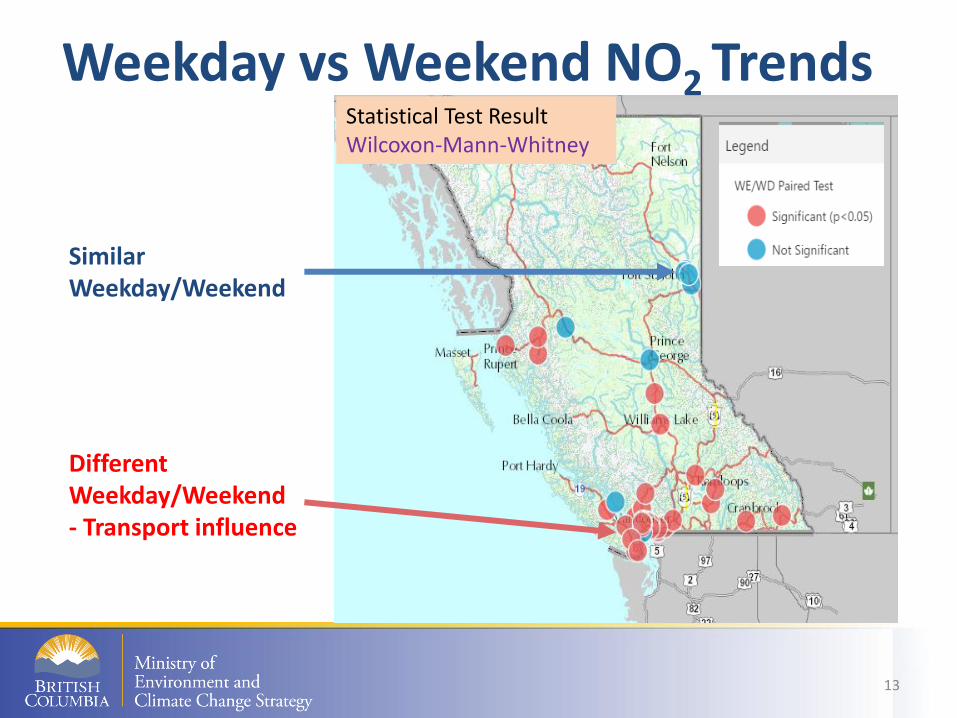
Similar Weekday/Weekend
DifferentWeekday/Weekend- Transport influence
Weekday vs Weekend NO2 TrendsStatistical Test ResultWilcoxon-Mann-Whitney
14
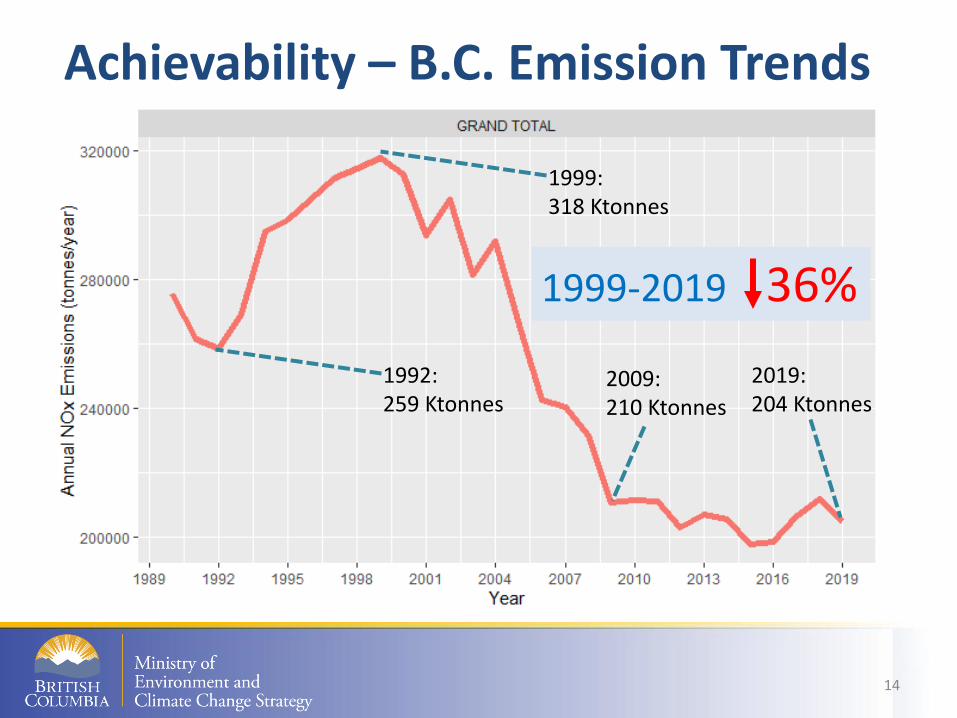
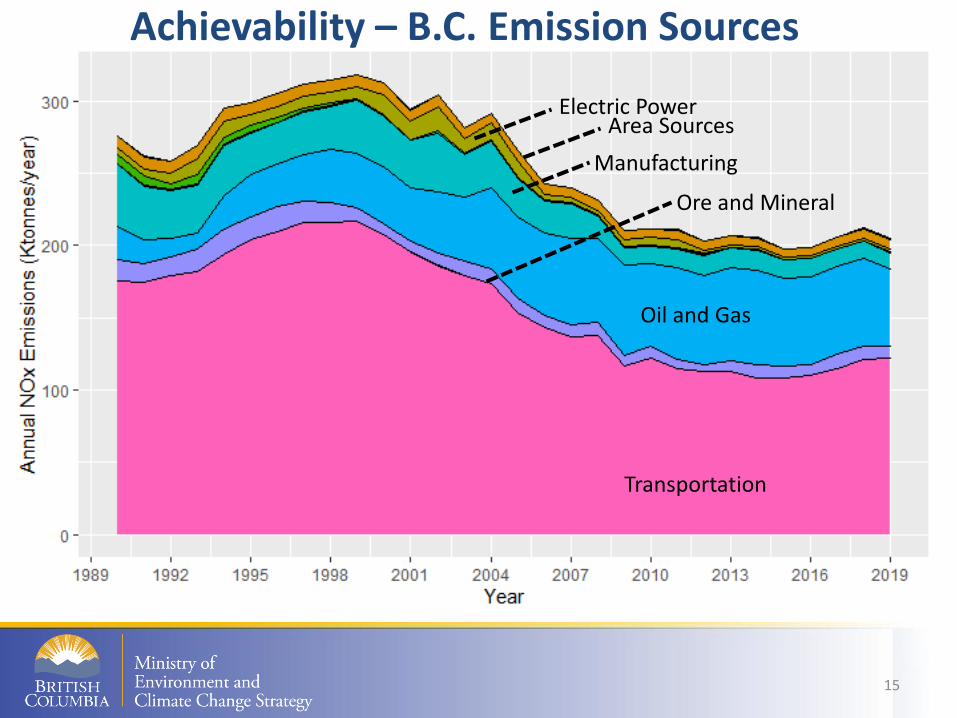
Achievability – B.C. Emission Trends
2019:204 Ktonnes
2009:210 Ktonnes
1999:318 Ktonnes
1992:259 Ktonnes
1999-2019 36%
15
Transportation
Oil and Gas
Manufacturing
Electric Power
Ore and Mineral
Achievability – B.C. Emission Sources
Area Sources

16
NOx Emission Sources in B.C. (2019)
Transportation (60%) Industry (37%) Area (3%)

17
Transportation/Mobile Equipment
Manufacturing
Electric Power
Oil and Gas
Ores and Minerals
Annual Changes in B.C. Emissions
18
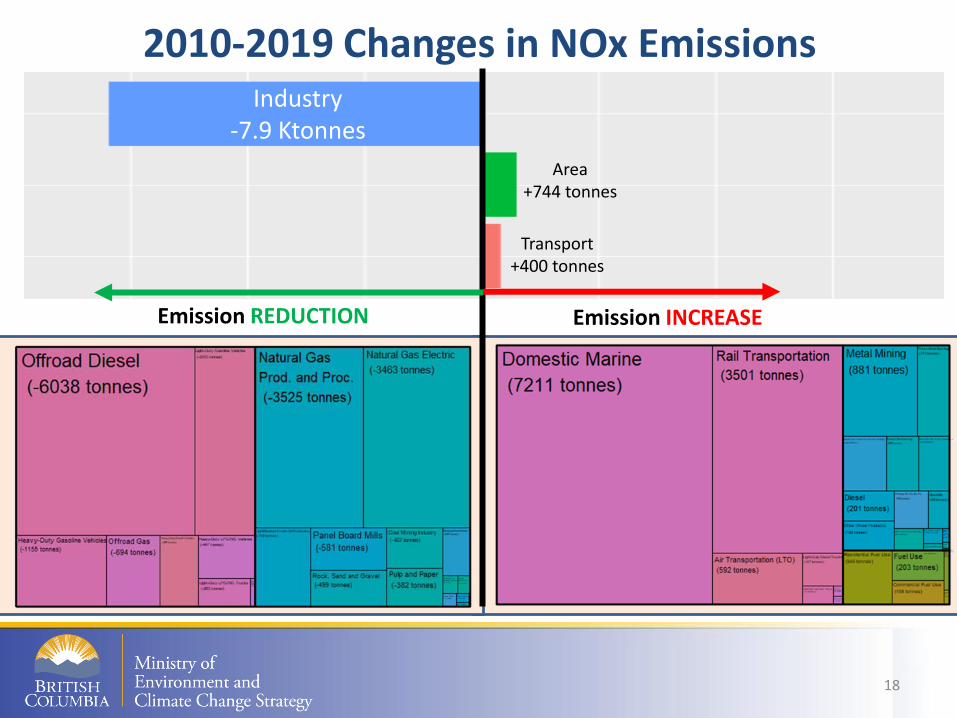
2010-2019 Changes in NOx EmissionsIndustry
-7.9 Ktonnes
Transport +400 tonnes
Emission REDUCTION
Area +744 tonnes
Emission INCREASE
19
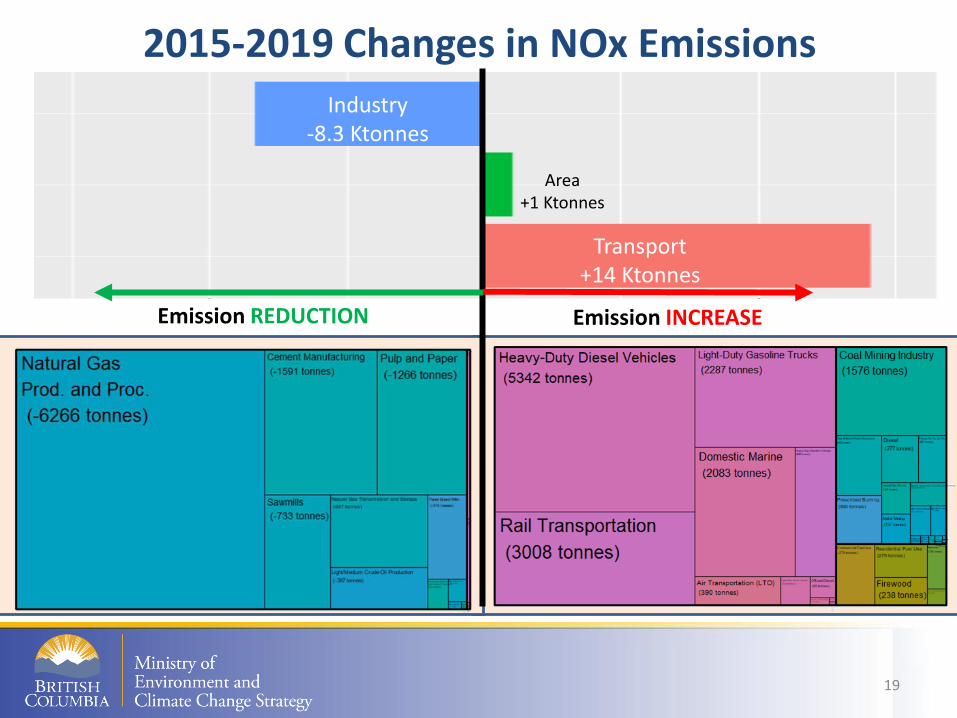
2015-2019 Changes in NOx Emissions
Transport +14 Ktonnes
Emission REDUCTION
Area +1 Ktonnes
Emission INCREASE
Industry -8.3 Ktonnes
20
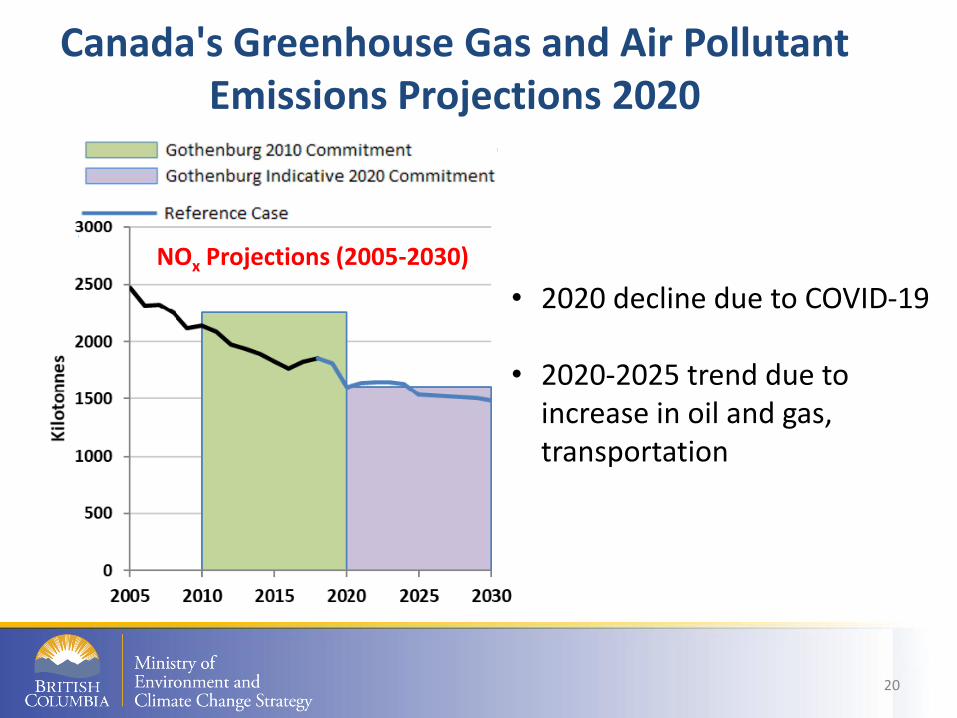
Canada's Greenhouse Gas and Air Pollutant Emissions Projections 2020
NOx Projections (2005-2030)
• 2020 decline due to COVID-19
• 2020-2025 trend due to increase in oil and gas, transportation

21
Achievability – Trends Emission Sources
Summary of Trends in Emission Sources
• NOx Emission show decreasing trends 1999-2009, nearly flat trends 2010-2019
• NOx Emissions are mostly from the Transportation Sector mainly Diesel Engines, Marine Emissions
• Transportation sector emissions has been decreasing 1999-2009, started increasing due to marine emissions 2010-2019
• NO2 from monitored sites follows transportation source patterns
22
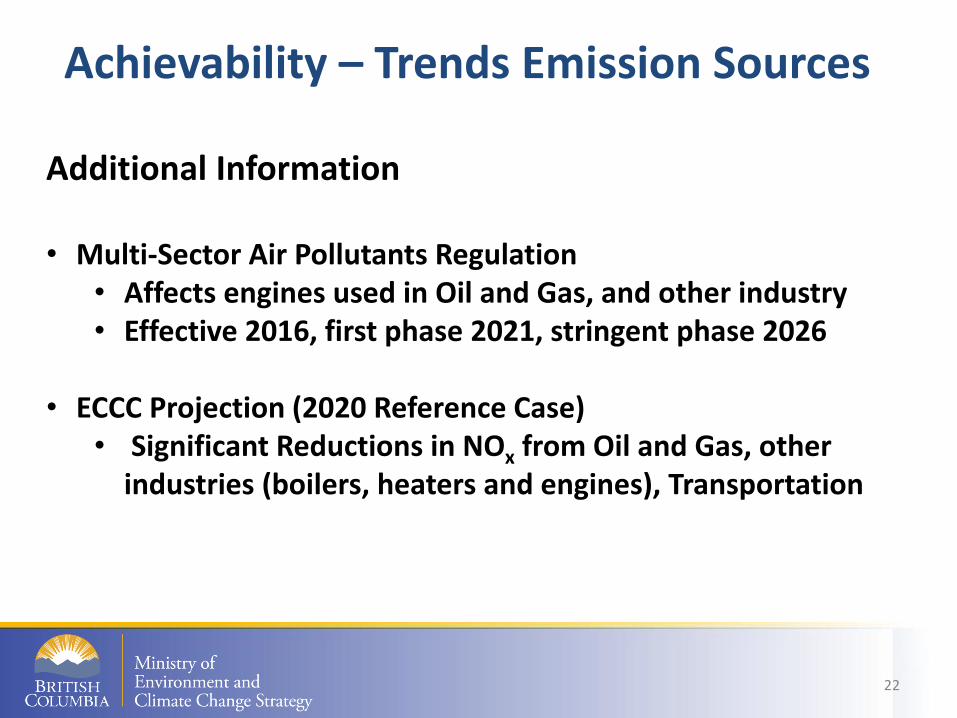
Achievability – Trends Emission Sources
Additional Information
• Multi-Sector Air Pollutants Regulation• Affects engines used in Oil and Gas, and other industry• Effective 2016, first phase 2021, stringent phase 2026
• ECCC Projection (2020 Reference Case)• Significant Reductions in NOx from Oil and Gas, other
industries (boilers, heaters and engines), Transportation
23
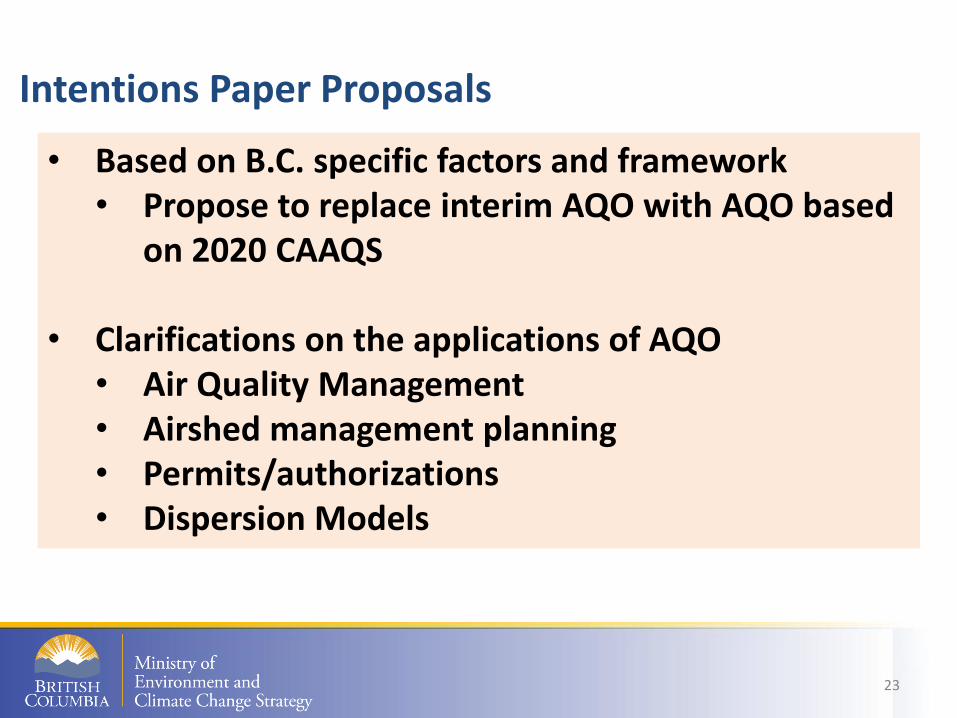
Intentions Paper Proposals
• Based on B.C. specific factors and framework• Propose to replace interim AQO with AQO based
on 2020 CAAQS
• Clarifications on the applications of AQO• Air Quality Management• Airshed management planning• Permits/authorizations• Dispersion Models
24
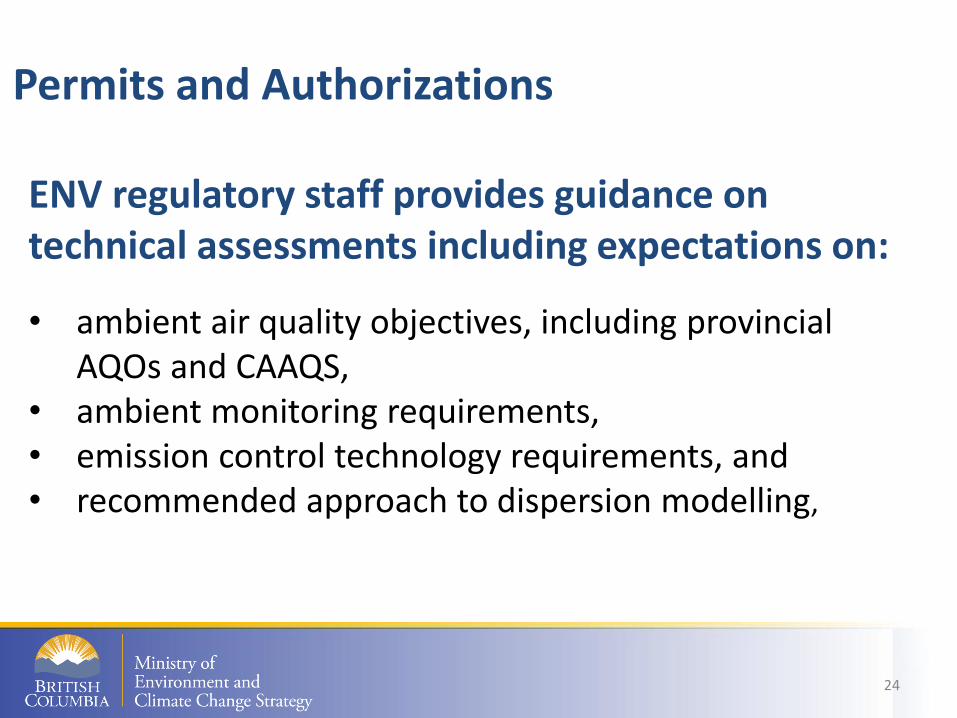
Permits and Authorizations
ENV regulatory staff provides guidance on technical assessments including expectations on:
• ambient air quality objectives, including provincial AQOs and CAAQS,
• ambient monitoring requirements, • emission control technology requirements, and • recommended approach to dispersion modelling,
25
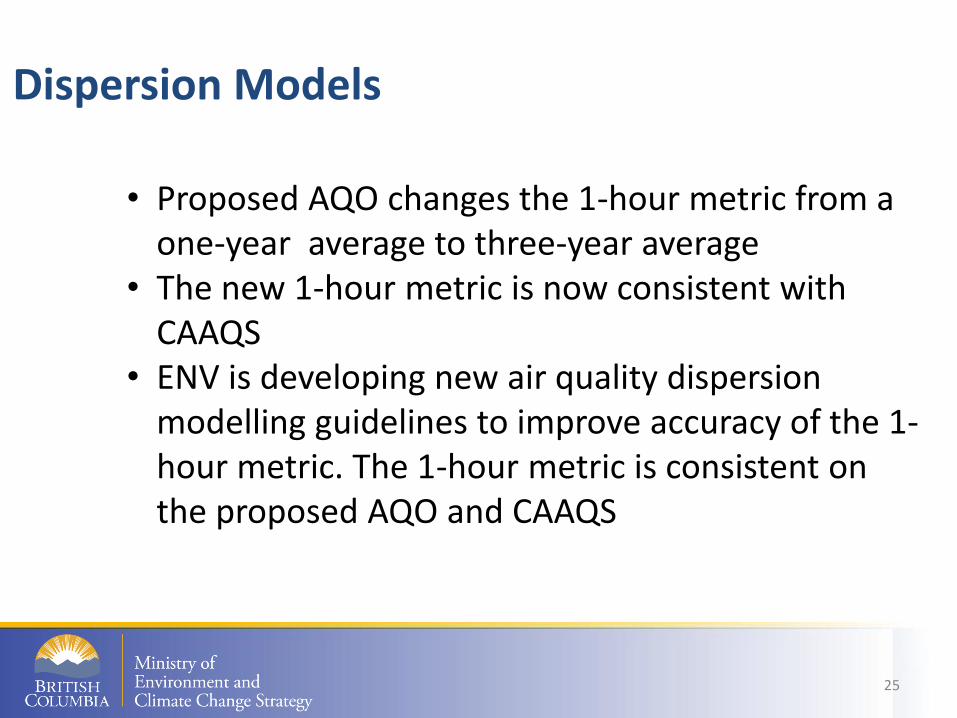
Dispersion Models
• Proposed AQO changes the 1-hour metric from a one-year average to three-year average
• The new 1-hour metric is now consistent with CAAQS
• ENV is developing new air quality dispersion modelling guidelines to improve accuracy of the 1-hour metric. The 1-hour metric is consistent on the proposed AQO and CAAQS

26
Next Steps
• Gathering of comments and feedback:• by June 18, 2021• [email protected]
• Finalize the Policy for AQO Adoption (July 2021)• Decision and Implementation (Fall-Winter 2021)
Use the B.C. Air Quality Subscription Service to receive email notifications:
https://www2.gov.bc.ca/gov/content/environment/air-land-water/air/latest-news-and-updates

27
Questions
28