PROPOSED PROJECT SITE LOCATIONS IN...
47
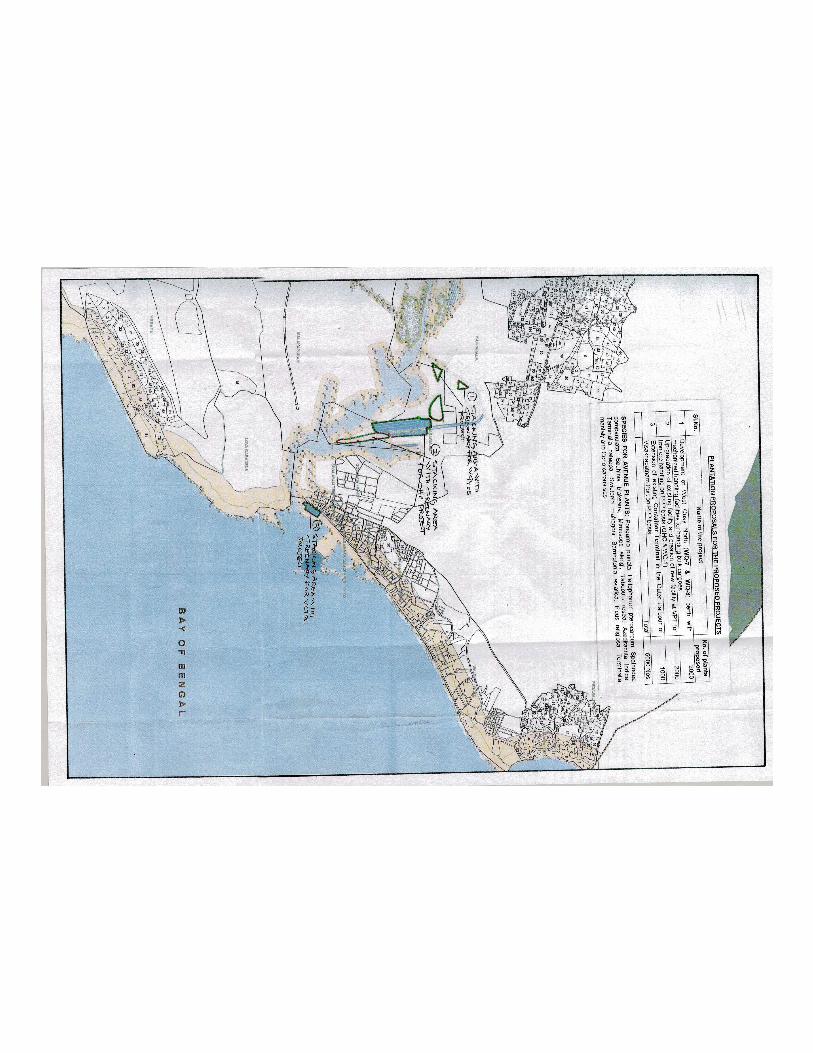
YERADA MALAKAPURAM MINIDI KAPPARADA MARRIPALEM MULAGADA GULLALAPALEM WALTAIR - WARD KANCHARAPALEM LOVA GARADENS GODEVARI - WARD PEDAWALTAIR CHINAWALTAIR AKKIREDDIPALEM MAHARANIPETA - WARD CHENGAL RAOPETA - WARD SITARAMASWAMY TEMPLE - WARD SIVALAYAM TEMPLE - WARD 83°22'30"E 83°22'30"E 83°22'0"E 83°22'0"E 83°21'30"E 83°21'30"E 83°21'0"E 83°21'0"E 83°20'30"E 83°20'30"E 83°20'0"E 83°20'0"E 83°19'30"E 83°19'30"E 83°19'0"E 83°19'0"E 83°18'30"E 83°18'30"E 83°18'0"E 83°18'0"E 83°17'30"E 83°17'30"E 83°17'0"E 83°17'0"E 83°16'30"E 83°16'30"E 83°16'0"E 83°16'0"E 83°15'30"E 83°15'30"E 83°15'0"E 83°15'0"E 83°14'30"E 83°14'30"E 83°14'0"E 83°14'0"E 83°13'30"E 83°13'30"E 83°13'0"E 83°13'0"E 83°12'30"E 83°12'30"E 17°47'0"N 17°47'0"N 17°46'30"N 17°46'30"N 17°46'0"N 17°46'0"N 17°45'30"N 17°45'30"N 17°45'0"N 17°45'0"N 17°44'30"N 17°44'30"N 17°44'0"N 17°44'0"N 17°43'30"N 17°43'30"N 17°43'0"N 17°43'0"N 17°42'30"N 17°42'30"N 17°42'0"N 17°42'0"N 17°41'30"N 17°41'30"N 17°41'0"N 17°41'0"N 17°40'30"N 17°40'30"N 17°40'0"N 17°40'0"N 17°39'30"N 17°39'30"N 17°39'0"N 17°39'0"N 17°38'30"N 17°38'30"N 17°38'0"N 17°38'0"N 17°37'30"N 17°37'30"N SCALE 1 : 25,000 PROPOSED PROJECT SITE LOCATIONS IN VISHAKAPATNAM PORT PREPARED BY INSTITUTE OF REMOTE SENSING ANNA UNIVERSITY CHENNAI - 600 025 CONSULTANT FOR THE CLIENT 0 625 1,250 1,875 2,500 312.5 M ± LEGEND WATER BODIES 7Km BUFFER FROM PROPOSED PROJECT SITES WAPCOS LIMITED 76-C, INSTITUTIONAL AREA SECTOR - 18, GURGAON - 122 015 HARYANA BAY OF BENGAL VILLAGE / WARD BOUNDARY CLIENT VISHAKAPATNAM PORT TRUST VISHAKAPATNAM KAMBALAKONDA WILDLIFE SANCTUARY KAMBALAKONDA WILDLIFE SANCTUARY ORE HANDLING COMPLEX AND WQ-1 DEVELOPMENT OF WQ-7 & 8 EXISTING CONTAINER TERMINAL EXISTING CONTAINER TERMINAL ORE HANDLING COMPLEX AND WQ-1 DEVELOPMENT OF WQ-7 & 8 PROPOSED EXTENSION OF CONTAINER TERMINAL PROPOSED EXTENSION OF CONTAINER TERMINAL
Transcript of PROPOSED PROJECT SITE LOCATIONS IN...

YERADA
MALAKAPURAM
MINIDI
KAPPARADA
MARRIPALEM
MULAGADA
GULLALAPALEM
WALTAIR - WARD
KANCHARAPALEM
LOVA GARADENS
GODEVARI - WARD
PEDAWALTAIR
CHINAWALTAIR
AKKIREDDIPALEM
MAHARANIPETA - WARD
CHENGAL RAOPETA - WARD
SITARAMASWAMY TEMPLE - WARD
SIVALAYAM TEMPLE - WARD
83°22'30"E
83°22'30"E
83°22'0"E
83°22'0"E
83°21'30"E
83°21'30"E
83°21'0"E
83°21'0"E
83°20'30"E
83°20'30"E
83°20'0"E
83°20'0"E
83°19'30"E
83°19'30"E
83°19'0"E
83°19'0"E
83°18'30"E
83°18'30"E
83°18'0"E
83°18'0"E
83°17'30"E
83°17'30"E
83°17'0"E
83°17'0"E
83°16'30"E
83°16'30"E
83°16'0"E
83°16'0"E
83°15'30"E
83°15'30"E
83°15'0"E
83°15'0"E
83°14'30"E
83°14'30"E
83°14'0"E
83°14'0"E
83°13'30"E
83°13'30"E
83°13'0"E
83°13'0"E
83°12'30"E
83°12'30"E17
°47'0
"N 17°4
7'0"N
17°4
6'30"N 17
°46'3
0"N
17°4
6'0"N 17
°46'0
"N
17°4
5'30"N 17
°45'3
0"N
17°4
5'0"N 17
°45'0
"N
17°4
4'30"N 17
°44'3
0"N
17°4
4'0"N 17
°44'0
"N
17°4
3'30"N 17
°43'3
0"N
17°4
3'0"N 17
°43'0
"N
17°4
2'30"N 17
°42'3
0"N
17°4
2'0"N 17
°42'0
"N
17°4
1'30"N 17
°41'3
0"N
17°4
1'0"N 17
°41'0
"N
17°4
0'30"N 17
°40'3
0"N
17°4
0'0"N 17
°40'0
"N
17°3
9'30"N 17
°39'3
0"N
17°3
9'0"N 17
°39'0
"N
17°3
8'30"N 17
°38'3
0"N
17°3
8'0"N 17
°38'0
"N
17°3
7'30"N 17
°37'3
0"N
SCALE 1 : 25,000
PROPOSED PROJECT SITE LOCATIONS IN VISHAKAPATNAM PORT
PREPARED BYINSTITUTE OF REMOTE SENSING
ANNA UNIVERSITYCHENNAI - 600 025
CONSULTANT FOR THE CLIENT
0 625 1,250 1,875 2,500312.5M
±LEGEND
WATER BODIES
7Km BUFFER FROM PROPOSED PROJECT SITES
WAPCOS LIMITED76-C, INSTITUTIONAL AREA
SECTOR - 18, GURGAON - 122 015HARYANA
B A Y O F B E N G A L
VILLAGE / WARD BOUNDARY
CLIENTVISHAKAPATNAM PORT TRUST
VISHAKAPATNAM
KAMBALAKONDA WILDLIFE SANCTUARY
KAMBALAKONDA WILDLIFE SANCTUARY
ORE HANDLING COMPLEX AND WQ-1
DEVELOPMENT OF WQ-7 & 8
EXISTING CONTAINER TERMINAL
EXISTINGCONTAINER TERMINAL
ORE HANDLING COMPLEX AND WQ-1
DEVELOPMENT OF WQ-7 & 8
PROPOSED EXTENSION OFCONTAINER TERMINAL
PROPOSED EXTENSION OF CONTAINER TERMINAL

Annexure-5B
Environment Management System for other bulk cargo handling other than coal
S.N
O
Berth Cargo EMS in place
1 EQ-3 Pet Coke, Steel, Food
grains, Container cargo
1. Mechanical handling with respect
to Iron ore and semi mechanical
handling of Fertilizers and
Fertilizer raw materials.
2. Manual sweeping and Sprinkling
of water on wharfs to minimize
surface dust emissions.
3. Covering of cargo carrying trucks
with tarpaulins while moving to
and from berths w.r.t. bulk cargo.
4. Provision of save wall nets along
berth for preventing spillages into
the sea.
5. Maintaining the minimum drop
height while unloading from ships
onto the berth where there is no
feasibility of wetting of cargo.
6. Covering of stacks with tarpaulins
and maintaining the height under
permissible limit.
7. Deployment of Mobile fog cannons
for spraying the water for
preventing the spreading the of air
emissions while unloading from
ship to berth and loading into
trucks/wagons etc.
.
2 EQ-4
3 EQ-5
4 EQ-6 Anthracite coal, BF Slag,
Fertilizers, Phosphoric acid,
Fertilizer Raw Materials
5 EQ-7 Finished Fertilizers
6 EQ-10 Liquid cargo
7 WQ-2 Iron Ore, granite
8 WQ-3 Steel, Soya, Pet coke &
Iron Ore.
9 WQ-4 Iron Ore, Iron ore pellets,
lime stone & Steel.
10 WQ-5 Alumina, granite & caustic
soda.
11 WQ-6 Dry Bulk Cargo (CP Coke,
LAM Coke, Steel, Granite
blocks)
12 Fertilizer
Berth
Fertilizer Raw material and
Finished Fertilizers.
Annexure-5A
Pollution control measures at Visakhapatnam Port Trust
Visakhapatnam Port Trust being a bulk cargo handling port and in order to address the dust generation problem, as a continual improvement, apart from mechanization of bulk cargoes handling viz. Coal, Iron ore, Fertilizers etc. through BOT/PPP operators, port has taken up various other pollution control measures and are being monitored through a mechanism as mentioned below:
A) SOURCE OF DUST GENERATION:
In conventional coal handling, dust generation is mainly due to multiple
handling such as unloading the coal from ship using grabs and placed on the berth, from berth loading in to dumpers, dumpers transport the coal to stackyards, stacking of coal at stack yards, from stack yard loading in to railway wagons etc. B) MITIGATIVE MEASURES: In order to address the dust generation problem, mechanization of cargo handling is the major solution, where in bulk cargo / coal unloaded from ship falls in a hopper, from hopper passed on to closed conveyor, conveyor to stack yard, from stack yard to silo with bucket wheel reclaimer / conveyor arrangement, loading in to railway wagons from silo etc. and transportation to the destination. In the said process, it can be seen that transport to stack yards through dumpers by road is avoided and conventional handling as mentioned above is avoided. Also environmental measures viz. sprinkling and dry fogging at unloading points, transfer houses in conveyor system are also essential and there by dust generation is minimized.
1) THE POLLUTION MITIGATIVE MEASURES IN PLACE AT
MECHANIZED COAL HANDLING PROJECTS:

2

3
2) THE POLLUTION MITIGATIVE MEASURES IN PLACE AT OTHER
AREAS:
A) The very first step in controlling and managing the dust generated by Coal handling is the Mechanical Dust Suppression System (MDSS), which was commissioned in 2002 with capital cost of Rs.7.89 Crores. This system sprinkles water over the Coal stacks at the stack yards so that the Coal stacks are wet and the dust does not rise into the air.
B) To reduce the spread of dust on to areas beyond the Port, a dust barrier was constructed at the R11 area in the North at a height of 7.5 meters for a length of 500m. at a cost of Rs.1.50 Crores. Another dust barrier of height 11.5 metres for a length of 1000m was constructed on the Eastern and Northern side of the East Yard at a cost of Rs.2.50 Crores.

4
C) 90% of the coal is being evacuated by rail avoiding road movement and thereby to minimize dust emissions. However, the roads in the Visakhapatnam Port are being wetted by water tankers round the clock to prevent emission of dust during movement of vehicles. A total of 275 trips i.e. about 4.0 MLD of treated water is sprinkled per day through tankers and a about 3.0 MLD is sprinkled through MDSS.
D) Covering of trucks, railway wagons and stacks with tarpaulins.

5
E) A comprehensive environment management system is set up to remove floating matter from Geddas, desilting of drains, manual sweeping of roads, etc. at the cost of Rs.6.38 Crores. Work order issued during July 2015 for a period of two years and the work is in progress.
F) In order to reduce fugitive dust, agents are covering the coal stacks
with tarpaulins. However, whenever the agents are not covering the stacks as mentioned above, Visakhapatnam port is taking up covering

6
of the such stacks, for which an agency is in place for Supply of Tarpaulins and manpower for covering of Coal and other Cargo stacks with Tarpaulins at yearly cost of Rs.0.85 Crores.
G) Two Truck Mounted Fog Canons deployed to suppress the dust while
loading / unloading cargo at berth and stack yards at a cost of Rs.0.90 Crores.
H) Construction and operation of Truck Tyre Cleaning System at B
Ramp i.e. at the interface of port and city roads, at a cost of Rs.0.81 Crores for which work order issued on 14.09.2015 and work is in progress and targeted to be completed by March 2016.
I) The reorganization of the stack yards is in progress so that the dust
generating stacks such as Coal is being shifted to the inner side of the Harbour and non-dusty cargos at the periphery. Initially shifting of cargo to designated stacks is targeted to be completed by March 2016.
J) Repairs / modifications to existing sprinkling systems at S4 and
WOB areas at a cost of Rs. 1.60 crores is in progress and targeted to be completed by end of March 2016.
K) Supply, operation & maintenance of Continuous online ambient air
quality monitoring (CAAQM) stations at three identified areas of Port of
Visakhapatnam for a period of 5 years at a cost of Rs. 2.71 crores is
under progress and expected to be completed by end of April 2016.
3) FUTURE PLANS FOR THE ENVIRONMENTAL MITIGATIVE
MEASURES:

7
A) SHORT TERM PLANS (DURING 2015-17): (a) Under continual improvement program, another dust barrier of 7.50m
height and 1.70KM long i.e. from the Sea Horse Junction to Convent Junction at the city interface is under construction at a cost of Rs.9.75 Crores. Work order was already released and the work is under progress and expected to be completed by May 2016.
(b) Sweeping of roads within the Port by mechanical sweeping machine
at a cost of Rs.2.81 Crores. Tenders have been floated. (c) Up-gradation and strengthening of BT and CC Blocks for
Operational Roads including drains and Berms (East Zone) at a cost of Rs.16.31 Crores. Tenders have been floated.
(d) Strengthening and up-gradation of BT and CC Blocks for roads
including drains and berms (Convent Junction to PCR Junction) at a cost of Rs.18.32 Crores. Tenders have been floated.
(e) Refurbishment of STP to handle 10MLD with proper quality output as
per APPCB norms at an estimated cost of about Rs. 1.50 crores. At estimate stage and targeted to be completed by end of June 2016.
B) LONG TERM PLANS (DURING 2015-18):
(a) Re-organization of stack yards duly providing Environmental safeguards viz. Service road, raised kerb wall around stacks, sprinkling system, Plantation around stacks etc.
(b) Dismantling and re-construction of West Quay berths i.e from part of
WQ-2 to WQ-5 for handling 14.50m draft vessels with fully mechanized handling facilities for handling bulk cargoes.
(c) Dismantling and re-construction of part of EQ5 and EQ-6 berths for
handling 14.50m draft vessels with fully mechanized handling facilities for handling bulk cargoes. Mechanization of cargo handling at EQ6 berth.
(d) Development of multipurpose terminal by replacement of existing EQ2
to EQ5 berths to cater to 14.50m draft vessels with fully mechanized handling facilities for handling bulk cargoes in inner harbour of Visakhapatnam Port.

8
(e) Development of West Quay North (WQ-7 & WQ-8) berth with mechanized handling facilities for handling bulk cargoes.
4) THE MEASURES TAKEN BY THE PORT TO MONITOR AND IMPROVE ENVIRONMENTAL MANAGEMENT SYSTEMS: (a) As a proactive measure and to achieve continual improvement,
Visakhapatnam Port has engaged the services of the Administrative Staff College of India, Hyderabad for the preparation of “Environmental Management and Monitoring Plan” (EMMP). The said report was submitted in January 2015 and the Port is implementing the same.
(b) Port has engaged the services of Administrative Staff College of India,
Hyderabad for monitoring the implementation of identified EMPs under EMMP.
(c) The Port has engaged the services of the Jawaharlal Technological
University, Kakinada to come up with an “Assessment of Effectiveness of existing air pollution management plan of Public Private Partnership partners and other areas of Visakhapatnam Port”. The said report is expected to be submitted by December 2015.
(d) The Visakhapatnam Port has engaged the services of the National
Environment Engineering Research Institute (hereinafter referred to as NEERI) for the preparation of “Disaster Management Plan”. The said plan was submitted in July 2014 and has been in force.
(e) The ambient air quality monitoring at three locations of the
surrounding areas of the Visakhapatnam Port has been entrusted to the Andhra University.
(f) The STP water quality and Ambient Air Quality monitoring at three
locations of the area around the Visakhapatnam Port is entrusted to the APPCB and same is in progress.
…

Annexure- WATER BALANCE AT VISAKHAPATNAM PORT TRUST
Sl. No.
Item Quantity
A) FRESH WATER FOR DRINKING, SANITATION etc.
1 Fresh water to be drawn from Greater Visakhapatnam Municipal Corporation (GVMC) as per agreement per month
167,309 KL
2 Fresh water drawn from GVMC per month (Average) a) Operational areas: 43,174 KL b) Residential areas: 1,01,246 KL c) Others: 5,200 KL
149,620 KL
3 Fresh water available from wells and infiltration galleries of Visakhapatnam port trust (VPT) per month
52,274 KL
4 Fresh water being drawn from wells and infiltration galleries of VPT per month a) Operational areas including oil wharf, ships etc.: 27,274 KL b) Residential areas: 25,000 KL
52,274 KL
5 Total fresh water available for drinking, sanitation etc. from both GVMC and VPT own sources per month
219,583 KL
6 Total fresh water consumed for drinking, sanitation etc. from both GVMC and VPT own sources per month.
201,894 KL
7 Fresh water demand for construction, drinking, sanitation etc. for future projects assuming 1000 KL per day per project: i) WQ7 & 8 berths: 30,000 KL ii) Container terminal: 30,000 KL iii) OHC project: 30,000 KL
90,000 KL
8 Total demand of fresh water including future projects
291,894 KL
9 Deficit in fresh water demand which shall be drawn from GVMC
72,311 KL
B) STP TREATED WATER FOR DUST SUPPRESSION:
1 STP treated water available per month 300,000 KL
2 STP treated water being used for dust suppress per month a) By VPT: 165,000 KL b) By PPP operators: 41,400 KL
206,400 KL
3 STP treated water demand for dust suppress for the proposed projects per month a) OHC project: 15, 000 KL b) WQ7&8 project: 15, 000 KL
30,000 KL
4 Total treated water available per month 300,000 KL
5 Total treated demand per month 236,400 KL
6 Total treated water balance per month 63,600 KL
…
Annexure-1
DETAILS OF EXISTING FACILITIES AS PER EXISTING EC AND PROPOSED FACILITIES AT VISAKHAPATNAM PORT TRUST
Consented capacities of Existing facilities: 88.1 MMTPA
Proposed capacities after expansion: 37.49 MMTPA
Total capacity after Expansion: 125.59

Sl. No.
Description Capacity in MMTPA
Reference
Existing facilities as per existing EC obtained
1 M/s.Visakhapatnam Port Trust (EQ 1to EQ 7, WQ 1 to WQ 5 berths, OR 1 and OR2 berths and Fertilizer berths & OSTT, NOM, LPG BERTH and MPB)
34.1 As per CFO, APPCB No.APPCB/VSP/VSP/45/CFO/HO/2014/883, Dt.26.12.2014. Valid upto: 31.12.2016
M/s.Vizag Sea Port Limited (EQ-8 & 9)
9.5 As per CFO, APPCB No.APPCB/VSP/VSP/13519/CFO/HO/2014/557, Dt.09.05.2014. Valid upto: 31.12.2016
M/s. AVR Infra Private Limited (EQ-10)
1.84
As per CFO, APPCB No.APPCB/VSP/VSP/230/CFO/HO/2015/3549, Dt.19.08.2015. Valid upto: 31.08.2016
M/s West Quay Multiport Pvt.Ltd 6.0 As per CFO, APPCB No.APPCB/VSP/VSP/229/CFO/HO/2015/439, Dt.19.04.2015. Valid upto: 31.01.2016
M/s.Adani Vizag Coal Terminal Private Limited (EQ-1)
6.41 As per CFO, APPCB No.APPCB/VSP/VSP/264/CFO/HO/2014/97, Dt.24.10.2014. Valid upto: 30.11.2015 Application for renewal is submitted
M/s.Vizag General Cargo Berth Private Limited (GCB)
10.18 As per CFO, APPCB No.APPCB/VSP/VSP/45/CFO/HO/ 2014/686, Dt.04.12.2014.
Valid upto: 31.07.2017
M/s.SEW Vizag Coal Terminal Private Limited (EQ-1A) 7.36 As per EC granted vide Lr.No.F.No.11-33/2010-IA.III, Dt.08.07.2011
M/s.Visakha Container Private Limited (existing)
7.5 (0.50 MTEUs)
As per CFO, APPCB No.APPCB/VSP/VSP/242/CFO/HO/ 2015/2061, Dt.16.03.2015.
M/s.Vizag Agriport Private Limited (EQ-7 upgraded)
5.21 As per CFE, APPCB No.302/PCB/CFE/RO-VSP/HO/2012/4118, Dt.15.12.2012
Total capacity of Existing Facilities 82.1
2 Proposed additional facilities
M/s.Essar Vizag Terminals Limited (OHC)
Phase – I 16.2 (OBI & OBII) Phase-II 6.8 (WQ-1)
Under Consideration by EAC
M/s.Visakha Container Terminal Private Limited(extension)
8.1 (0.54 MTEUs)
Development of WQ-7 & 8 (WQ-North berth)
6.39
Total capacity of proposed additional facilities 37.49
3. Total capacity after expansion 125.59

Fax No.0891-2565023
Government of India Ministry of Water Resources, River
Development and Ganga Rejuvenation Central Water & Power Research Station
Khadakwasla, Pune – 411 024
Tel : 020-24103421 Fax : 020-24381004 E-mail : [email protected]
No.101/13/72-PH II Dated: 10.03.2016
Chief Engineer, Visakhapatnam Port Trust Visakhapatnam 530 035.
(Attn: Shri. M.R. Rajanikanth, SE )
Sub: Sediment Transport Investigation at Visakhapatnam Port –Dumping Ground - Reg.
Ref: VPT fax letter. No. IENG/SE-V/AE-I/CWPRS/2016 dated 25 Feb. 2016 Sir,
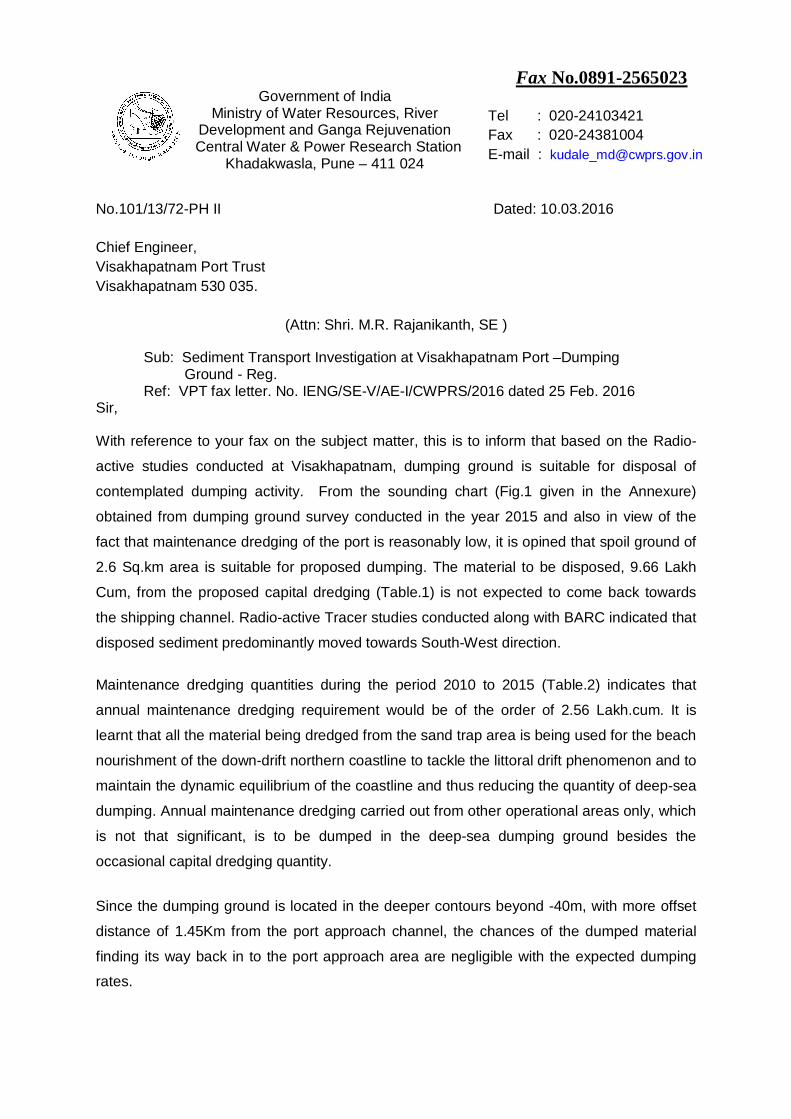
With reference to your fax on the subject matter, this is to inform that based on the Radio-
active studies conducted at Visakhapatnam, dumping ground is suitable for disposal of
contemplated dumping activity. From the sounding chart (Fig.1 given in the Annexure)
obtained from dumping ground survey conducted in the year 2015 and also in view of the
fact that maintenance dredging of the port is reasonably low, it is opined that spoil ground of
2.6 Sq.km area is suitable for proposed dumping. The material to be disposed, 9.66 Lakh
Cum, from the proposed capital dredging (Table.1) is not expected to come back towards
the shipping channel. Radio-active Tracer studies conducted along with BARC indicated that
disposed sediment predominantly moved towards South-West direction.
Maintenance dredging quantities during the period 2010 to 2015 (Table.2) indicates that
annual maintenance dredging requirement would be of the order of 2.56 Lakh.cum. It is
learnt that all the material being dredged from the sand trap area is being used for the beach
nourishment of the down-drift northern coastline to tackle the littoral drift phenomenon and to
maintain the dynamic equilibrium of the coastline and thus reducing the quantity of deep-sea
dumping. Annual maintenance dredging carried out from other operational areas only, which
is not that significant, is to be dumped in the deep-sea dumping ground besides the
occasional capital dredging quantity.
Since the dumping ground is located in the deeper contours beyond -40m, with more offset
distance of 1.45Km from the port approach channel, the chances of the dumped material
finding its way back in to the port approach area are negligible with the expected dumping
rates.


ANNEXURE
Table.1. Proposed Capital Dredging
Description Quantity (Cu.m)
Up-gradation of OHC 184000
Extension of Container Terminal 596024 Development of West Quay 7 & 8 Berths 186225
Table.2. Maintenance Dredging during 2010-2015
Year Maintenance
Dredging (Lakh.Cu.m)
2010-11 1.18
2011-12 5.99
2012-13 2.59
2013-14 1.58
2014-15 1.46

Fig. 1: lndex map of Dumping ground at Visakhapatnam port
showing the extent and Soundings
Fig. 2: Bed Transport / spreading pattern as per the Radio-Active
Tracer study at Visakhapatnam port

Fig. 3: Bed thickness change at the end of two months dumping period
Fig. 4: Bed thickness change Vs No. of Dumping days
Fig.5: Suspended Sediment Concentration map during dumping

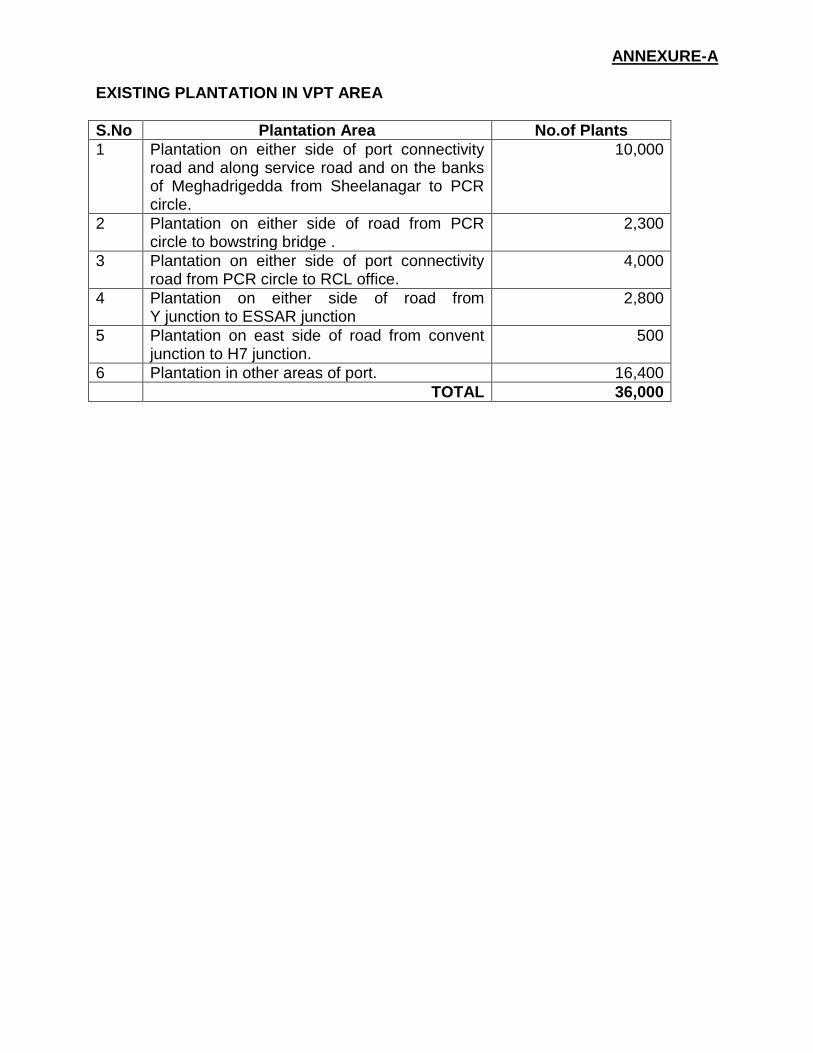
ANNEXURE-A EXISTING PLANTATION IN VPT AREA
S.No Plantation Area No.of Plants
1 Plantation on either side of port connectivity road and along service road and on the banks of Meghadrigedda from Sheelanagar to PCR circle.
10,000
2 Plantation on either side of road from PCR circle to bowstring bridge .
2,300
3 Plantation on either side of port connectivity road from PCR circle to RCL office.
4,000
4 Plantation on either side of road from Y junction to ESSAR junction
2,800
5 Plantation on east side of road from convent junction to H7 junction.
500
6 Plantation in other areas of port. 16,400
TOTAL 36,000
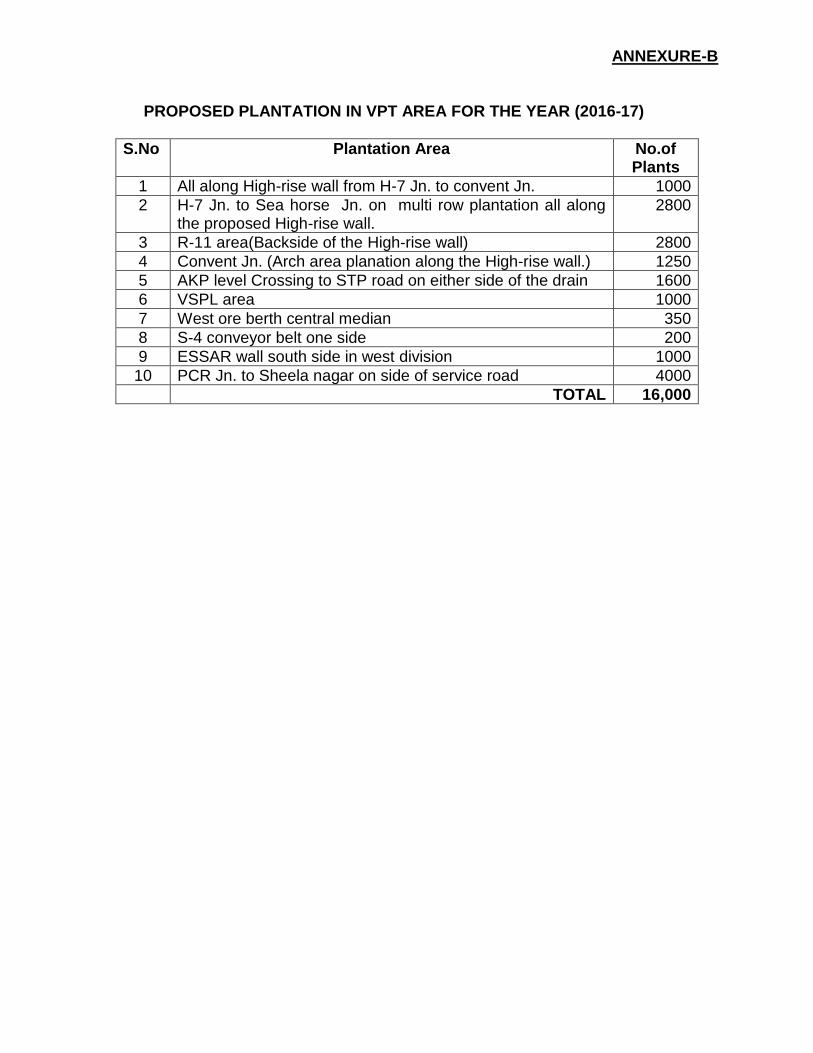
ANNEXURE-B
PROPOSED PLANTATION IN VPT AREA FOR THE YEAR (2016-17)
S.No Plantation Area No.of Plants
1 All along High-rise wall from H-7 Jn. to convent Jn. 1000
2 H-7 Jn. to Sea horse Jn. on multi row plantation all along the proposed High-rise wall.
2800
3 R-11 area(Backside of the High-rise wall) 2800
4 Convent Jn. (Arch area planation along the High-rise wall.) 1250
5 AKP level Crossing to STP road on either side of the drain 1600
6 VSPL area 1000
7 West ore berth central median 350
8 S-4 conveyor belt one side 200
9 ESSAR wall south side in west division 1000
10 PCR Jn. to Sheela nagar on side of service road 4000
TOTAL 16,000


Annexure-8 Replies for the queries /issues raised by the public/NGO in the Public hearing held on 10.04.2015
Queries related to Air pollution
S.NO Query raised Reply Action plan
1 Sri J.T.RamaRao, Uttharandhra Ikya Vedika
V.P.T. would invest Rs.200 Crores in the next three to four years to make V.P.T' a Green Port. Out of which works at a cost of Rs.70 crores were already sanctioned and in the process of tender finalization for award of work in due course of time. Improving the environment and reducing vehicular traffic movement within the Port area due to 'the mechanisation. Re-organization of stack yards is proposed by shifting the present location of coal stack to inside from periphery by providing proper environmental safeguards viz. construction of high rise walls, drainage system, MDSS and Plantation which is targeted to be completed by end of year 2015
Works in Operation: 1. Mechanical Dust Suppression System (MDSS),
which was commissioned in 2002 in Coal stacking areas
Capital cost of Rs.7.89 Crores.
2. Construction of dust barrier at R-11 area and East yards at a cost of Rs.4.0 crores
3. A comprehensive environment management
system cleaning of Geddas, desilting of drains, manual sweeping of roads, etc the cost of project is Rs.6.38 Crores.
4. Covering of Coal and other Cargo stacks with
Tarpaulins at cost of Rs.0.85 Crores per annum
5. Two Truck Mounted Fog Canons deployed to suppress the dust while loading / unloading cargo at berth and stack yards cost of the project is Rs.0.90 Crores.
Works under progress:
Construction and operation of Truck Tyre Cleaning System at B-Ramp i.e. at the interface of port and city roads Targeted to be completed by March 2016. Cost of the project is Rs.0.81 Crores
Repairs / modifications to existing sprinkling systems at S4 and WOB areas is in progress Targeted to be completed by March 2016. Cost of project is Rs. 1.60 crores
Future plans categorized as
A) Short term plans (2015:17)
1. Dust barrier of 7.50m height and 1.70KM long i.e. from the Sea Horse Junction to Convent
2 Sri Mohamed Sadhik, President,Yuva Bharath Force
3 Sri Alikhan, One-Town Area
4 Sri A.J.Stalin, City secretary, CPI (M),
5 Sri Abdul Gaphar, Kotaveedhi
6 Sri D. Markendaya, CPI (M),
7 Sri V.Bosanna, Sampradaya Matsakarula society
8 Sri Abdul Anif, TDP Minority Cell President
9 Sri Mohamed Irfan," Captain of Merchant ship, Kotaveedhi
10 Sri T.Sankar, PedaJalaripeta, Matsakarula Society Secretary
11 Sri P.Jagga Rao, Visakhapatnam
12 Sri P.Venkata Rao, Ex-Corporator
13 Sri Syam Prasad, HRC member
14 Sri L.F.Raghuram, Visakhapatnam,
15 Sri Chowdhari Apparao
16 Sri Rajasekhar Varma of Loksatta Party

17 Sr,i Brahmaswaroop, an electi'ical engineer
Junction at the city interface is under construction at a cost of Rs.9.75 Crores.
2. Sweeping of roads within the Port by mechanical sweeping machine at a cost of Rs.2.81 Crores.
3. Up-gradation and strengthening of BT and CC Blocks for Operational Roads including drains and Berms (East Zone) at a cost of Rs.16.31 Crores
4. Strengthening and up-gradation of BT and CC Blocks for roads including drains and berms (Convent Junction to PCR Junction) at a cost of Rs.18.32 Crores.
5. Refurbishment of STP to handle 10MLD with proper quality output as per APPCB norms at an estimated cost of about Rs. 1.50 crores.
B) LONG TERM PLANS (DURING 2015-18):
1. Reorganization of stackyards , Dismantling and construction of old berths like WQ2 to WQ5, EQ 5 and EQ 6
2. Development of multipurpose terminal by replacing EQ2 to EQ5 and WQ 7 &WQ 8 with mechanization facilities
Queries related to Health and Medical facilities
S.NO Query raised Reply Action plan
1 Sri Paka Satya Narayana, Backward Rights society
With regard to the Health, VPT is conducting regularly in coordination with lndian Red Cross, health camps for the residents of the 1 Town Area as a part of CSR activities and also regular health checkups are being conducted of all the VPT employees who are working in the field and there is no evidence/correlation of any illness caused due to pollution to the employees.
1. Green Vision-Health project for fishermen folk on
communicable diseases and health awareness Project Expenditure: Rs.9,75,000.00
2. Sankar Foundation to perform Cataract Surgeries. Project Expenditure : Rs.25,00,000.00 3. Indian Red Cross Society for procuring medical
equipment. Project Expenditure: Rs.50,00,000.00
4. Govt. ENT Hospital –OTO Acoustic Emission
medical equipment. Project Expenditure : Rs.2,94,000.00
2 Sri A.J.Stalin, City secretary, CPI (M),
3 Sri Abdul Gaphar, Kotaveedhi
4 Smt. A.Vimala, Andhra Pradesh Mahila Samakhya Visakha City secretary
5 Expansion and other Miscellaneous problems
6 Sri M.A.Rasool, Kotaveedhi,

7 Sri Mariadas, A voluntary activist
Miscellaneous and other problems (Beach Erosion, Shifting of Fishing harbour, EIA report prepared by WAPCOS)
S.NO Query raised Reply Action plan
1 Sri Mohamed Irfan," Captain of Merchant ship, Kotaveedhi
Covering of coal stack yards with tarpaulins, deployment of mobile fog cannons for preventing the spreading of dust in air during loading and unloading operations
In order to reduce fugitive dust, agents are covering the coal stacks with tarpaulins. However, whenever the agents are not covering the stacks as mentioned above, Visakhapatnam port is taking up covering of the such stacks, for which an agency is in place for Supply of Tarpaulins and manpower for covering of Coal and other Cargo stacks with Tarpaulins at cost of Rs.0.85 Crores per annum
2 Sri J.D.Naidu, Visakha Fishing Harbour Matsakarula Society Secretaryr
No immediate plans to shift the Fishing harbour. -----
3 Sri T.Sankar, PedaJalaripeta, Matsakarula Society Secretary
The fish catch cannot be related to the construction activity of any jetties.
-----
4 Dr. Sharin Rahman, Chaitanya Sravanthi Organization,
The EIA report is prepared by accredited agency M/S WAPCOS as per required standards after proper scientific analysis of Environment data
Additional information as sought by EAC are submitted
5 Sri J.T.RamaRao, Uttharandhra Ikya Vedika
The proposed expansion project of VPT is not in any way related to the R.K.Beach erosion.
As a responsible corporate Citizen VPT have realized the problem of erosion in the early 1970s which is mainly due to the natural phenomena on account of Sea wave/current hence taken up the beach nourishment activity for past 3 decades . A quantity of about 4 lakhs cu.m of sand is being pumped for the beach nourishment at a cost of about 6.00 crores

Part A - Ambient Air Monitoring Reports for the Period of April-2014 to September-2014
Date of Sampling
Location 1 : ADM Building PM10
μg/m3 PM2.5
μg/m3 SO2
μg/m3 NOx μg/m3
NH3 μg/m3
O3 μg/m3
CO μg/m3
C6H6
μg/m3 BaP
ng/m3 Pb
μg/m3 As
ng/m3 Ni
ng/m3 03/04/2014 50.2 21.6 9.65 16.86 BDL* 9.74 BDL* BDL* BDL* BDL* BDL* BDL* 07/04/2014 65.5 23.2 7.55 28.93 BDL* 7.57 BDL* BDL* BDL* BDL* BDL* BDL* 10/04/2014 48.7 17.8 BDL* 16.08 BDL* 11.43 BDL* BDL* BDL* BDL* BDL* BDL* 14/04/2014 59.6 15.3 6.31 25.02 BDL* 10.31 BDL* BDL* BDL* BDL* BDL* BDL* 17/04/2014 73.4 24.2 BDL* 27.70 BDL* 6.51 BDL* BDL* BDL* BDL* BDL* BDL* 21/04/2014 53.2 19.5 11.71 21.89 BDL* 13.48 BDL* BDL* BDL* BDL* BDL* BDL* 24/04/2014 61.7 22.4 BDL* 24.23 BDL* 5.17 BDL* BDL* BDL* BDL* BDL* BDL* 28/04/2014 70.8 18.7 10.63 23.79 BDL* 13.15 BDL* BDL* BDL* BDL* BDL* BDL* 01/05/2014 56.5 25.7 9.65 25.93 BDL* 9.74 BDL* BDL* BDL* BDL* BDL* BDL* 05/05/2014 65.6 21.6 7.55 26.61 BDL* 7.57 BDL* BDL* BDL* BDL* BDL* BDL* 08/05/2014 76.5 16.6 BDL* 32.02 BDL* 11.43 BDL* BDL* BDL* BDL* BDL* BDL* 12/05/2014 57.3 23.6 6.31 21.65 BDL* 10.31 BDL* BDL* BDL* BDL* BDL* BDL* 15/05/2014 68.1 29.6 BDL* 31.12 BDL* 6.51 BDL* BDL* BDL* BDL* BDL* BDL* 19/05/2014 48.6 17.4 11.71 16.91 BDL* 13.48 BDL* BDL* BDL* BDL* BDL* BDL* 22/05/2014 55.7 24.9 BDL* 19.62 BDL* 5.17 BDL* BDL* BDL* BDL* BDL* BDL* 26/05/2014 66.1 18.3 10.63 24.47 BDL* 13.15 BDL* BDL* BDL* BDL* BDL* BDL* 29/05/2014 52.4 20.3 8.39 18.60 BDL* 8.65 BDL* BDL* BDL* BDL* BDL* BDL* 02/06/2014 52.6 22.5 12.47 22.68 BDL* 14.54 BDL* BDL* BDL* BDL* BDL* BDL* 05/06/2014 68.9 17.5 8.82 18.60 BDL* 18.49 BDL* BDL* BDL* BDL* BDL* BDL* 09/06/2014 54.8 28.4 6.58 20.67 BDL* 15.30 BDL* BDL* BDL* BDL* BDL* BDL* 12/06/2014 62.6 26.3 5.34 16.54 BDL* 19.56 BDL* BDL* BDL* BDL* BDL* BDL* 16/06/2014 45.6 15.5 13.35 26.55 BDL* 11.57 BDL* BDL* BDL* BDL* BDL* BDL* 19/06/2014 65.6 23.8 10.67 29.48 BDL* 9.66 BDL* BDL* BDL* BDL* BDL* BDL* 23/06/2014 59.4 20.9 7.55 28.63 BDL* 17.67 BDL* BDL* BDL* BDL* BDL* BDL* 26/06/2014 76.4 18.8 5.20 17.53 BDL* 12.70 BDL* BDL* BDL* BDL* BDL* BDL* 30/06/2014 62.9 24.6 9.69 25.51 BDL* 10.93 BDL* BDL* BDL* BDL* BDL* BDL* 03/07/2014 71.5 27.6 15.81 30.70 BDL* 15.49 BDL* BDL* BDL* BDL* BDL* BDL* 07/07/2014 59.5 34.2 14.51 22.58 BDL* 10.21 BDL* BDL* BDL* BDL* BDL* BDL* 10/07/2014 48.5 25.1 9.60 18.66 BDL* 8.44 BDL* BDL* BDL* BDL* BDL* BDL* 14/07/2014 56.4 30.9 13.48 27.37 BDL* 17.56 BDL* BDL* BDL* BDL* BDL* BDL* 17/07/2014 64.5 26.4 11.20 25.52 BDL* 10.46 BDL* BDL* BDL* BDL* BDL* BDL* 21/07/2014 74.9 18.4 14.10 31.54 BDL* 19.42 BDL* BDL* BDL* BDL* BDL* BDL* 24/07/2014 42.6 16.3 8.71 16.54 BDL* 6.47 BDL* BDL* BDL* BDL* BDL* BDL* 28/07/2014 68.3 24.6 10.44 23.50 BDL* 9.52 BDL* BDL* BDL* BDL* BDL* BDL* 31/07/2014 72.4 20.0 12.34 29.38 BDL* 16.54 BDL* BDL* BDL* BDL* BDL* BDL* 04/08/2014 61.2 28.0 9.28 27.40 BDL* 11.40 1.03 BDL* BDL* BDL* BDL* BDL* 07/08/2014 58.4 24.2 12.74 21.19 BDL* 9.69 0.71 BDL* BDL* BDL* BDL* BDL* 11/08/2014 45.7 27.1 8.60 16.31 BDL* 10.36 0.89 BDL* BDL* BDL* BDL* BDL* 14/08/2014 49.5 23.8 11.06 18.19 BDL* 8.24 0.96 BDL* BDL* BDL* BDL* BDL* 18/08/2014 53.6 25.0 13.43 17.64 BDL* 12.63 0.79 BDL* BDL* BDL* BDL* BDL* 21/08/2014 67.4 21.2 12.25 23.07 BDL* 10.56 1.02 BDL* BDL* BDL* BDL* BDL* 25/08/2014 43.7 19.2 8.22 15.75 BDL* 7.56 1.05 BDL* BDL* BDL* BDL* BDL* 28/08/2014 50.2 27.9 14.43 20.19 BDL* 11.61 1.13 BDL* BDL* BDL* BDL* BDL* 01/09/2014 42.6 20.5 7.89 20.62 BDL* 17.67 0.21 BDL* BDL* BDL* BDL* BDL*

Page 1 of 18
Date of Sampling
Location 1 : ADM Building PM10
μg/m3 PM2.5
μg/m3 SO2
μg/m3 NOx μg/m3
NH3 μg/m3
O3 μg/m3
CO μg/m3
C6H6
μg/m3 BaP
ng/m3 Pb
μg/m3 As
ng/m3 Ni
ng/m3 04/09/2014 66.3 23.8 11.72 22.73 BDL* 19.52 0.34 BDL* BDL* BDL* BDL* BDL* 08/09/2014 52.6 20.9 12.80 27.54 BDL* 12.61 0.30 BDL* BDL* BDL* BDL* BDL* 11/09/2014 68.5 35.9 12.40 30.91 BDL* 18.57 0.14 BDL* BDL* BDL* BDL* BDL* 15/09/2014 53.8 16.4 14.12 25.02 BDL* 21.72 0.26 BDL* BDL* BDL* BDL* BDL* 18/09/2014 61.7 19.2 10.05 22.37 BDL* 14.61 0.29 BDL* BDL* BDL* BDL* BDL* 22/09/2014 56.5 16.7 9.58 32.35 BDL* 25.41 0.24 BDL* BDL* BDL* BDL* BDL* 25/09/2014 70.7 29.6 14.07 28.38 BDL* 20.32 0.19 BDL* BDL* BDL* BDL* BDL* 29/09/2014 44.5 15.0 8.22 17.43 BDL* 12.50 0.11 BDL* BDL* BDL* BDL* BDL* *Below detection limit

Page 2 of 18
Date of Sampling
Location 2 : Pond Area in Back Up PM10
μg/m3 PM2.5
μg/m3 SO2
μg/m3 NOx μg/m3
NH3 μg/m3
O3 μg/m3
CO μg/m3
C6H6
μg/m3 BaP
ng/m3 Pb
μg/m3 As
ng/m3 Ni
ng/m3 03/04/2014 71.9 32.8 14.8 31.9 BDL* 17.5 BDL* BDL* BDL* BDL* BDL* BDL* 07/04/2014 83.4 27.8 13.6 34.1 BDL* 20.1 BDL* BDL* BDL* BDL* BDL* BDL* 10/04/2014 74.1 25.7 19.4 25.3 BDL* 15.2 BDL* BDL* BDL* BDL* BDL* BDL* 14/04/2014 96.5 46.5 9.1 35.7 45.0 12.7 BDL* BDL* BDL* BDL* BDL* 12.2 17/04/2014 86.5 41.5 8.7 20.6 BDL* 16.5 BDL* BDL* BDL* BDL* BDL* BDL* 21/04/2014 60.8 28.2 18.0 38.6 BDL* 18.5 BDL* BDL* BDL* BDL* BDL* BDL* 24/04/2014 75.6 33.6 9.5 29.8 BDL* 13.3 BDL* BDL* BDL* BDL* BDL* BDL* 28/04/2014 92.7 36.5 15.4 36.2 31.2 15.8 BDL* BDL* BDL* BDL* BDL* 10.2 01/05/2014 80.0 38.2 14.8 34.7 18.1 17.5 BDL* BDL* BDL* BDL* BDL* BDL* 05/05/2014 92.6 35.7 13.6 31.6 32.5 20.1 BDL* BDL* BDL* BDL* BDL* BDL* 08/05/2014 84.6 38.6 19.4 24.1 BDL* 15.2 BDL* BDL* BDL* BDL* BDL* BDL* 12/05/2014 93.6 28.6 9.1 33.5 BDL* 12.7 BDL* BDL* BDL* BDL* BDL* BDL* 15/05/2014 85.7 30.7 8.7 36.4 BDL* 16.5 BDL* BDL* BDL* BDL* BDL* 10.6 19/05/2014 77.4 28.2 18.0 25.3 BDL* 18.5 BDL* BDL* BDL* BDL* BDL* BDL* 22/05/2014 91.6 37.3 9.5 33.8 BDL* 13.3 BDL* BDL* BDL* BDL* BDL* BDL* 26/05/2014 95.3 48.5 15.4 40.2 48.4 15.8 BDL* BDL* BDL* BDL* BDL* 11.6 29/05/2014 73.6 15.3 17.7 28.4 BDL* 19.3 BDL* BDL* BDL* BDL* BDL* BDL* 02/06/2014 76.2 34.2 17.7 34.8 BDL* 19.6 BDL* BDL* BDL* BDL* BDL* BDL* 05/06/2014 82.6 26.7 15.6 37.5 BDL* 23.4 BDL* BDL* BDL* BDL* BDL* BDL* 09/06/2014 71.6 37.1 10.7 40.6 BDL* 17.5 BDL* BDL* BDL* BDL* BDL* BDL* 12/06/2014 86.2 39.6 18.5 33.6 16.4 24.2 BDL* BDL* BDL* BDL* BDL* BDL* 16/06/2014 68.9 23.8 22.5 38.5 BDL* 16.4 BDL* BDL* BDL* BDL* BDL* BDL* 19/06/2014 78.2 32.5 14.6 32.6 BDL* 21.4 BDL* BDL* BDL* BDL* BDL* BDL* 23/06/2014 80.8 36.3 8.5 39.5 22.6 25.9 BDL* BDL* BDL* BDL* BDL* 11.8 26/06/2014 92.6 42.5 19.4 31.4 BDL* 18.3 BDL* BDL* BDL* BDL* BDL* BDL* 30/06/2014 88.9 35.4 14.3 29.6 30.7 15.3 BDL* BDL* BDL* BDL* BDL* 10.6 03/07/2014 84.6 36.3 18.8 37.6 18.3 21.4 BDL* BDL* BDL* BDL* BDL* BDL* 07/07/2014 70.2 42.1 21.7 30.5 BDL* 15.3 BDL* BDL* BDL* BDL* BDL* BDL* 10/07/2014 63.6 37.5 16.7 27.5 BDL* 13.3 BDL* BDL* BDL* BDL* BDL* BDL* 14/07/2014 76.5 46.3 25.0 35.4 BDL* 23.4 BDL* BDL* BDL* BDL* BDL* BDL* 17/07/2014 89.5 42.5 20.3 29.5 BDL* 18.6 BDL* BDL* BDL* BDL* BDL* BDL* 21/07/2014 96.5 30.4 25.7 36.5 30.6 25.7 BDL* BDL* BDL* BDL* BDL* 10.4 24/07/2014 65.6 26.7 18.5 25.6 BDL* 11.6 BDL* BDL* BDL* BDL* BDL* BDL* 28/07/2014 92.4 41.7 18.1 32.5 BDL* 14.6 BDL* BDL* BDL* BDL* BDL* BDL* 31/07/2014 88.2 47.9 23.0 40.5 22.7 26.4 BDL* BDL* BDL* BDL* BDL* 11.6 04/08/2014 68.9 17.1 13.3 31.2 BDL* 14.3 1.1 BDL* BDL* BDL* BDL* BDL* 07/08/2014 64.1 32.5 18.8 24.6 BDL* 13.2 0.9 BDL* BDL* BDL* BDL* BDL* 11/08/2014 59.1 31.3 15.9 21.2 BDL* 11.3 0.8 BDL* BDL* BDL* BDL* BDL* 14/08/2014 38.5 26.3 12.6 24.3 BDL* 9.6 1.0 BDL* BDL* BDL* BDL* BDL* 18/08/2014 68.2 29.6 19.1 25.1 BDL* 15.5 1.3 BDL* BDL* BDL* BDL* BDL* 21/08/2014 70.5 36.7 16.7 28.5 BDL* 17.5 1.8 BDL* BDL* BDL* BDL* BDL* 25/08/2014 52.1 28.7 12.9 20.2 BDL* 8.6 1.4 BDL* BDL* BDL* BDL* BDL* 28/08/2014 69.4 31.7 16.6 27.8 BDL* 14.8 1.5 BDL* BDL* BDL* BDL* BDL* 01/09/2014 62.6 20.0 19.6 27.3 BDL* 22.5 0.3 BDL* BDL* BDL* BDL* BDL*

Page 3 of 18
Date of Sampling
Location 2 : Pond Area in Back Up PM10
μg/m3 PM2.5
μg/m3 SO2
μg/m3 NOx μg/m3
NH3 μg/m3
O3 μg/m3
CO μg/m3
C6H6
μg/m3 BaP
ng/m3 Pb
μg/m3 As
ng/m3 Ni
ng/m3 04/09/2014 86.5 28.8 18.1 30.8 BDL* 24.7 0.4 BDL* BDL* BDL* BDL* BDL* 08/09/2014 76.5 35.4 23.0 35.4 BDL* 20.4 0.4 BDL* BDL* BDL* BDL* BDL* 11/09/2014 82.6 33.8 23.5 41.1 36.6 23.5 0.2 BDL* BDL* BDL* BDL* 10.1 15/09/2014 92.6 42.5 25.0 33.4 BDL* 25.9 0.3 BDL* BDL* BDL* BDL* BDL* 18/09/2014 88.6 40.4 17.3 28.1 20.7 17.4 0.4 BDL* BDL* BDL* BDL* 11.5 22/09/2014 78.2 29.6 20.5 38.6 BDL* 27.7 0.3 BDL* BDL* BDL* BDL* BDL* 25/09/2014 81.4 36.7 16.5 34.9 18.6 16.4 0.3 BDL* BDL* BDL* BDL* BDL* 29/09/2014 68.4 28.3 17.5 28.4 BDL* 14.7 0.2 BDL* BDL* BDL* BDL* BDL* *Below detection limit

Page 4 of 18
Date of Sampling
Location 3 : Control Building PM10
μg/m3 PM2.5
μg/m3 SO2
μg/m3 NOx μg/m3
NH3 μg/m3
O3 μg/m3
CO μg/m3
C6H6
μg/m3 BaP
ng/m3 Pb
μg/m3 As
ng/m3 Ni
ng/m3 03/04/2014 57.9 24.1 7.5 14.5 BDL* 6.2 BDL* BDL* BDL* BDL* BDL* BDL* 07/04/2014 76.3 34.4 9.2 27.3 25.48 12.4 BDL* BDL* BDL* BDL* BDL* 10.8 10/04/2014 54.7 20.0 14.8 19.5 BDL* 17.4 BDL* BDL* BDL* BDL* BDL* BDL* 14/04/2014 78.0 28.9 5.9 31.6 BDL* 7.6 BDL* BDL* BDL* BDL* BDL* BDL* 17/04/2014 60.6 15.9 BDL* 25.2 BDL* 9.8 BDL* BDL* BDL* BDL* BDL* BDL* 21/04/2014 77.0 23.6 13.4 27.4 BDL* 15.6 BDL* BDL* BDL* BDL* BDL* BDL* 24/04/2014 84.8 31.3 BDL* 32.9 17.83 11.7 BDL* BDL* BDL* BDL* BDL* 11.6 28/04/2014 66.4 27.8 12.7 22.6 BDL* 9.3 BDL* BDL* BDL* BDL* BDL* BDL* 01/05/2014 93.0 30.5 7.5 36.7 BDL* 6.2 BDL* BDL* BDL* BDL* BDL* 11.1 05/05/2014 52.6 15.7 9.2 25.7 BDL* 12.4 BDL* BDL* BDL* BDL* BDL* BDL* 08/05/2014 63.5 19.6 14.8 25.8 BDL* 17.4 BDL* BDL* BDL* BDL* BDL* BDL* 12/05/2014 80.9 31.4 5.9 30.6 BDL* 7.6 BDL* BDL* BDL* BDL* BDL* BDL* 15/05/2014 78.2 34.4 BDL* 33.4 16.58 9.8 BDL* BDL* BDL* BDL* BDL* BDL* 19/05/2014 55.6 20.6 13.4 22.8 BDL* 15.6 BDL* BDL* BDL* BDL* BDL* BDL* 22/05/2014 65.1 27.4 BDL* 15.2 BDL* 11.7 BDL* BDL* BDL* BDL* BDL* BDL* 26/05/2014 80.8 29.1 12.7 31.5 BDL* 9.3 BDL* BDL* BDL* BDL* BDL* BDL* 29/05/2014 61.6 25.8 6.3 22.4 BDL* 12.7 BDL* BDL* BDL* BDL* BDL* BDL* 02/06/2014 64.6 29.5 10.2 28.4 BDL* 10.5 BDL* BDL* BDL* BDL* BDL* BDL* 05/06/2014 76.6 32.5 6.2 24.5 BDL* 20.7 BDL* BDL* BDL* BDL* BDL* BDL* 09/06/2014 60.1 26.3 12.5 26.4 BDL* 19.5 BDL* BDL* BDL* BDL* BDL* BDL* 12/06/2014 73.6 30.0 8.7 23.5 BDL* 22.9 BDL* BDL* BDL* BDL* BDL* BDL* 16/06/2014 56.8 18.2 14.8 31.6 BDL* 14.7 BDL* BDL* BDL* BDL* BDL* BDL* 19/06/2014 47.5 15.6 7.8 34.5 BDL* 12.4 BDL* BDL* BDL* BDL* BDL* BDL* 23/06/2014 72.6 24.6 11.3 36.6 BDL* 21.6 BDL* BDL* BDL* BDL* BDL* BDL* 26/06/2014 64.8 31.6 15.1 22.6 BDL* 16.7 BDL* BDL* BDL* BDL* BDL* BDL* 30/06/2014 78.8 26.5 5.4 20.6 BDL* 12.6 BDL* BDL* BDL* BDL* BDL* BDL* 03/07/2014 54.9 18.6 9.4 33.6 BDL* 18.7 BDL* BDL* BDL* BDL* BDL* BDL* 07/07/2014 63.5 29.4 17.6 26.5 BDL* 13.5 BDL* BDL* BDL* BDL* BDL* BDL* 10/07/2014 56.5 32.9 12.7 22.8 BDL* 10.8 BDL* BDL* BDL* BDL* BDL* BDL* 14/07/2014 68.2 35.5 13.7 31.5 BDL* 21.7 BDL* BDL* BDL* BDL* BDL* BDL* 17/07/2014 73.5 31.7 14.6 19.5 BDL* 14.4 BDL* BDL* BDL* BDL* BDL* BDL* 21/07/2014 84.7 38.6 18.5 27.9 BDL* 23.5 BDL* BDL* BDL* BDL* BDL* BDL* 24/07/2014 54.6 20.6 11.4 21.5 BDL* 9.6 BDL* BDL* BDL* BDL* BDL* BDL* 28/07/2014 71.6 29.9 13.8 28.5 BDL* 12.4 BDL* BDL* BDL* BDL* BDL* BDL* 31/07/2014 82.6 35.1 15.5 23.6 BDL* 19.6 BDL* BDL* BDL* BDL* BDL* BDL* 04/08/2014 81.1 52.5 17.8 34.2 15.20 19.7 1.60 BDL* BDL* BDL* BDL* BDL* 07/08/2014 75.4 55.4 21.5 30.1 BDL* 14.0 1.83 BDL* BDL* BDL* BDL* BDL* 11/08/2014 66.4 45.3 21.1 34.1 BDL* 21.4 1.49 BDL* BDL* BDL* BDL* BDL* 14/08/2014 54.1 32.3 14.6 25.1 BDL* 10.1 1.32 BDL* BDL* BDL* BDL* BDL* 18/08/2014 71.3 41.2 19.6 32.2 BDL* 19.9 1.72 BDL* BDL* BDL* BDL* BDL* 21/08/2014 74.5 49.6 21.1 31.2 BDL* 17.3 1.15 BDL* BDL* BDL* BDL* BDL* 25/08/2014 76.4 53.7 17.4 28.4 BDL* 12.3 0.92 BDL* BDL* BDL* BDL* BDL* 28/08/2014 68.2 50.8 20.0 31.9 BDL* 16.3 1.03 BDL* BDL* BDL* BDL* BDL* 01/09/2014 50.9 15.6 10.6 22.6 BDL* 19.8 0.23 BDL* BDL* BDL* BDL* BDL* 04/09/2014 71.3 20.6 14.5 26.5 BDL* 21.3 0.37 BDL* BDL* BDL* BDL* BDL*

Page 5 of 18
Date of Sampling
Location 3 : Control Building PM10
μg/m3 PM2.5
μg/m3 SO2
μg/m3 NOx μg/m3
NH3 μg/m3
O3 μg/m3
CO μg/m3
C6H6
μg/m3 BaP
ng/m3 Pb
μg/m3 As
ng/m3 Ni
ng/m3 08/09/2014 66.6 32.5 17.4 23.6 BDL* 15.5 0.34 BDL* BDL* BDL* BDL* BDL* 11/09/2014 77.4 30.5 28.4 20.7 21.38 13.6 0.17 BDL* BDL* BDL* BDL* BDL* 15/09/2014 67.8 24.5 16.6 30.3 BDL* 17.5 0.29 BDL* BDL* BDL* BDL* BDL* 18/09/2014 75.6 30.4 13.0 24.6 BDL* 19.2 0.32 BDL* BDL* BDL* BDL* BDL* 22/09/2014 50.6 22.4 15.8 28.6 BDL* 23.7 0.26 BDL* BDL* BDL* BDL* BDL* 25/09/2014 62.4 18.4 11.5 31.9 BDL* 14.4 0.22 BDL* BDL* BDL* BDL* BDL* 29/09/2014 53.3 23.4 12.6 20.5 BDL* 10.6 0.15 BDL* BDL* BDL* BDL* BDL* *Below detection limit

Page 6 of 18
Date of Sampling
Location 4 : Adani Construction (L&T Side) Backup Area PM10
μg/m3 PM2.5
μg/m3 SO2
μg/m3 NOx μg/m3
NH3 μg/m3
O3 μg/m3
CO μg/m3
C6H6
μg/m3 BaP
ng/m3 Pb
μg/m3 As
ng/m3 Ni
ng/m3 03/04/2014 84.6 38.7 20.84 36.28 BDL* 20.15 BDL* BDL* BDL* BDL* BDL* BDL* 07/04/2014 91.8 25.8 17.09 37.28 33.27 17.73 BDL* BDL* BDL* BDL* BDL* 12.12 10/04/2014 63.0 24.4 21.40 32.95 BDL* 19.74 BDL* BDL* BDL* BDL* BDL* BDL* 14/04/2014 89.2 40.0 16.73 36.50 BDL* 16.44 BDL* BDL* BDL* BDL* BDL* BDL* 17/04/2014 90.8 37.9 11.29 41.27 44.68 12.67 BDL* BDL* BDL* BDL* BDL* 13.11 21/04/2014 88.1 32.4 22.43 34.06 BDL* 21.96 BDL* BDL* BDL* BDL* BDL* BDL* 24/04/2014 94.6 41.0 14.68 37.61 27.57 15.95 BDL* BDL* BDL* BDL* BDL* 10.76 28/04/2014 81.0 31.6 19.42 42.60 BDL* 18.78 BDL* BDL* BDL* BDL* BDL* BDL* 01/05/2014 91.9 44.2 20.84 39.98 28.63 20.15 BDL* BDL* BDL* BDL* BDL* 11.24 05/05/2014 84.8 32.1 17.09 43.57 BDL* 17.73 BDL* BDL* BDL* BDL* BDL* BDL* 08/05/2014 97.6 40.8 21.40 35.61 42.95 19.74 BDL* BDL* BDL* BDL* BDL* 10.51 12/05/2014 88.6 36.6 16.73 38.86 BDL* 16.44 BDL* BDL* BDL* BDL* BDL* BDL* 15/05/2014 96.5 41.7 11.29 40.09 35.48 12.67 BDL* BDL* BDL* BDL* BDL* 12.62 19/05/2014 70.5 26.1 22.43 36.62 BDL* 21.96 BDL* BDL* BDL* BDL* BDL* BDL* 22/05/2014 86.5 38.9 14.68 28.56 BDL* 15.95 BDL* BDL* BDL* BDL* BDL* BDL* 26/05/2014 95.8 41.3 19.42 37.52 BDL* 18.78 BDL* BDL* BDL* BDL* BDL* BDL* 29/05/2014 80.6 28.2 18.34 31.36 BDL* 14.51 BDL* BDL* BDL* BDL* BDL* BDL* 02/06/2014 86.8 38.8 22.61 37.58 BDL* 23.49 BDL* BDL* BDL* BDL* BDL* BDL* 05/06/2014 90.6 40.7 19.74 41.47 BDL* 25.34 BDL* BDL* BDL* BDL* BDL* BDL* 09/06/2014 83.6 48.2 16.58 44.50 BDL* 21.50 BDL* BDL* BDL* BDL* BDL* BDL* 12/06/2014 91.6 37.5 21.51 30.58 23.70 27.85 BDL* BDL* BDL* BDL* BDL* 10.35 16/06/2014 75.8 31.5 18.44 42.56 BDL* 19.32 BDL* BDL* BDL* BDL* BDL* BDL* 19/06/2014 84.2 35.8 20.68 37.37 BDL* 26.52 BDL* BDL* BDL* BDL* BDL* BDL* 23/06/2014 96.6 42.8 17.53 33.26 29.86 23.91 BDL* BDL* BDL* BDL* BDL* 12.84 26/06/2014 89.6 56.3 21.48 36.40 BDL* 18.69 BDL* BDL* BDL* BDL* BDL* BDL* 30/06/2014 94.6 32.4 12.22 32.44 39.71 24.66 BDL* BDL* BDL* BDL* BDL* 11.55 03/07/2014 95.6 37.9 24.60 41.65 24.44 24.49 BDL* BDL* BDL* BDL* BDL* BDL* 07/07/2014 85.6 53.5 28.02 35.49 BDL* 18.56 BDL* BDL* BDL* BDL* BDL* BDL* 10/07/2014 71.5 41.8 19.58 32.64 BDL* 15.59 BDL* BDL* BDL* BDL* BDL* BDL* 14/07/2014 84.5 40.1 21.50 38.45 12.53 19.61 BDL* BDL* BDL* BDL* BDL* BDL* 17/07/2014 96.5 35.4 18.39 36.51 BDL* 20.43 BDL* BDL* BDL* BDL* BDL* BDL* 21/07/2014 90.6 43.9 23.49 39.59 42.61 27.47 BDL* BDL* BDL* BDL* BDL* 11.60 24/07/2014 72.6 33.4 15.40 27.58 BDL* 13.50 BDL* BDL* BDL* BDL* BDL* BDL* 28/07/2014 83.5 49.4 22.92 37.54 BDL* 16.55 BDL* BDL* BDL* BDL* BDL* BDL* 31/07/2014 95.8 55.4 28.63 33.24 34.47 23.41 BDL* BDL* BDL* BDL* BDL* 12.65 04/08/2014 79.3 48.9 21.24 36.20 15.62 17.95 1.26 BDL* BDL* BDL* BDL* BDL* 07/08/2014 88.5 57.3 23.48 32.46 BDL* 19.76 1.15 BDL* BDL* BDL* BDL* BDL* 11/08/2014 93.7 58.2 26.41 38.59 BDL* 21.44 1.03 BDL* BDL* BDL* BDL* BDL* 14/08/2014 62.5 35.4 16.46 31.10 BDL* 13.34 0.92 BDL* BDL* BDL* BDL* BDL* 18/08/2014 99.4 60.0 20.41 37.57 BDL* 22.26 1.37 BDL* BDL* BDL* BDL* BDL* 21/08/2014 85.2 51.2 24.15 35.18 19.15 20.58 1.72 BDL* BDL* BDL* BDL* BDL* 25/08/2014 81.3 55.0 22.56 30.19 BDL* 15.13 1.60 BDL* BDL* BDL* BDL* BDL* 28/08/2014 89.6 56.2 25.07 34.16 BDL* 17.53 1.83 BDL* BDL* BDL* BDL* BDL* 01/09/2014 69.8 26.8 12.80 32.61 BDL* 25.49 0.36 BDL* BDL* BDL* BDL* BDL*

Page 7 of 18
Date of Sampling
Location 4 : Adani Construction (L&T Side) Backup Area PM10
μg/m3 PM2.5
μg/m3 SO2
μg/m3 NOx μg/m3
NH3 μg/m3
O3 μg/m3
CO μg/m3
C6H6
μg/m3 BaP
ng/m3 Pb
μg/m3 As
ng/m3 Ni
ng/m3 04/09/2014 78.6 33.8 21.12 36.46 BDL* 27.28 0.44 BDL* BDL* BDL* BDL* BDL* 08/09/2014 85.0 40.5 20.91 40.47 BDL* 24.15 0.48 BDL* BDL* BDL* BDL* BDL* 11/09/2014 90.9 43.5 18.46 38.53 41.75 26.27 0.22 BDL* BDL* BDL* BDL* 11.55 15/09/2014 80.6 35.4 22.93 36.82 BDL* 23.31 0.45 BDL* BDL* BDL* BDL* BDL* 18/09/2014 95.2 44.7 19.33 33.06 32.67 21.50 0.40 BDL* BDL* BDL* BDL* 12.18 22/09/2014 82.7 32.5 25.70 42.59 BDL* 18.27 0.33 BDL* BDL* BDL* BDL* BDL* 25/09/2014 90.2 27.7 22.70 37.73 26.62 25.59 0.27 BDL* BDL* BDL* BDL* BDL* 29/09/2014 71.4 30.3 23.76 31.35 BDL* 19.51 0.23 BDL* BDL* BDL* BDL* BDL* *Below detection limit

Page 8 of 18
Part B – Marine Water Quality Report for the Period of April-2014 to September-2014
Location No. 1: South Side
Sr. No
Parameters Unit Apr’14 Mar’14 Jun’14 Jul’14 Aug’14 Sep’14
14/04/2014 12/05/2014 20/06/2014 10/07/2014 07/08/2014 08/09/2014
1 Temperature oC 30 31 30 30 30 31
2 pH -- 7.82 7.90 7.82 8.10 8.20 8.40
3 Total Suspended Solids mg/L 198 240 210 240 270 310
4 Salinity ppt 33 34 30 29.2 28.4 27.8
5 Dissolved Oxygen mg/L 5.3 5.2 4.95 5.6 5.8 5.5
6 BOD (3 days @ 27 oC) mg/L BDL* BDL* BDL* BDL* BDL* BDL*
7 Phosphate as PO43- - P mg/L BDL* BDL* BDL* 0.183 0.688 0.293
8 PTotal mg/L BDL* BDL* BDL* 0.059 0.222 0.908
9 Nitrate as NO3- -N mg/L 0.25 0.30 0.34 0.307 0.359 0.420
10 Nitrite as NO2- -N mg/L BDL* BDL* BDL* BDL* BDL* BDL*
11 Ammonical Nitrogen as NH4+-N mg/L 4.70 4.4 3.92 4.80 3.50 3.80
12 NTotal mg/L 4.95 4.70 4.26 5.10 3.85 3.22
13 Phenols mg/L BDL* BDL* BDL* BDL* BDL* BDL*
14 PHc µg/L BDL* BDL* BDL* BDL* BDL* BDL*
15 Hexavalent Chromium as Cr+6 mg/L BDL* BDL* BDL* BDL* BDL* BDL* *Below detection limit

Page 9 of 18
Location No. 2: North side
Sr. No
Parameters Unit Apr’14 Mar’14 Jun’14 Jul’14 Aug’14 Sep’14
14/04/2014 12/05/2014 20/06/2014 10/07/2014 07/08/2014 08/09/2014
1 Temperature oC 30 31 30 30 30 31
2 pH -- 8.10 8.32 8.12 8.18 8.25 8.48
3 Total Suspended Solids mg/L 160 188 172 216 260 280
4 Salinity ppt 33 34 31 29.8 28.8 29
5 Dissolved Oxygen mg/L 5.3 5.2 5.0 5.5 5.6 5.4
6 BOD (3 days @ 27 oC) mg/L BDL* BDL* BDL* BDL* BDL* BDL*
7 Phosphate as PO43- - P mg/L BDL* BDL* BDL* 0.229 0.780 0.278
8 PTotal mg/L BDL* BDL* BDL* 0.074 0.251 0.861
9 Nitrate as NO3- -N mg/L 0.35 0.42 0.39 0.375 0.265 0.280
10 Nitrite as NO2- -N mg/L BDL* BDL* BDL* BDL* BDL* BDL*
11 Ammonical Nitrogen as NH4+-N
mg/L 5.93 5.10 5.08 5.07 4.15 4.31
12 NTotal mg/L 6.28 5.52 5.47 5.44 4.41 4.60
13 Phenols mg/L BDL* BDL* BDL* BDL* BDL* BDL*
14 PHc µg/L BDL* BDL* BDL* BDL* BDL* BDL*
15 Hexavalent Chromium as Cr+6 mg/L BDL* BDL* BDL* BDL* BDL* BDL*
*Below detection limit
Page 10 of 18
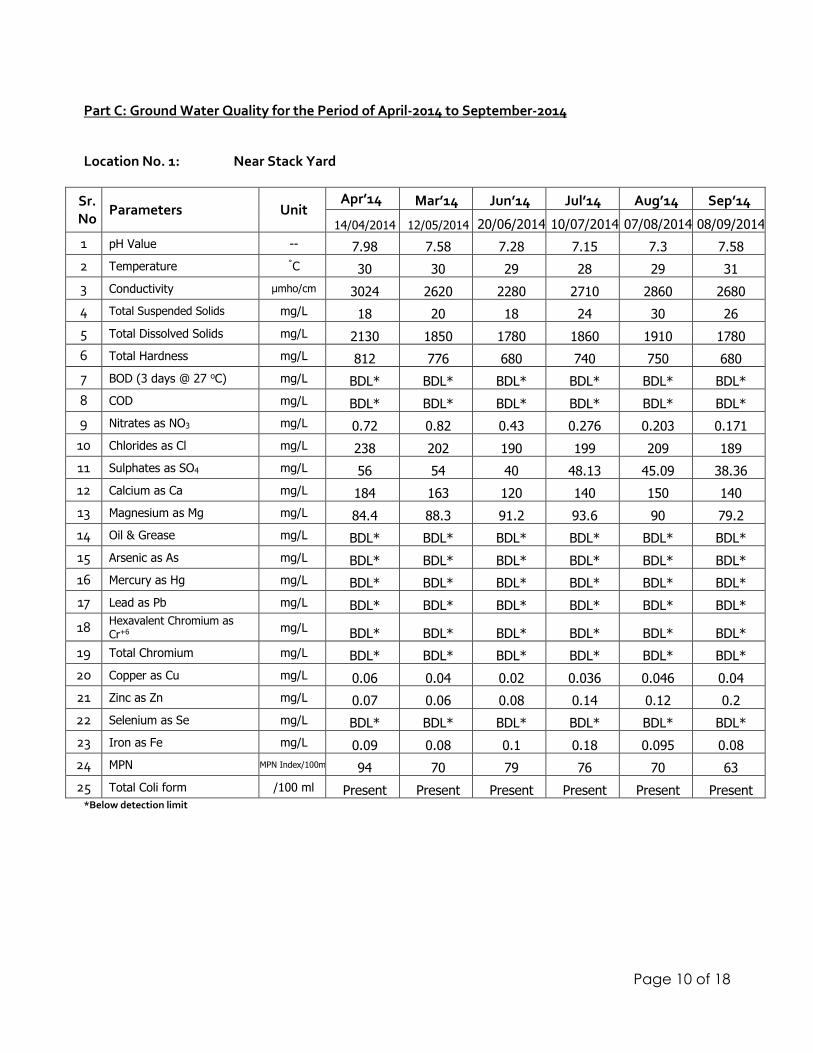
Part C: Ground Water Quality for the Period of April-2014 to September-2014
Location No. 1: Near Stack Yard
Sr. No
Parameters Unit Apr’14 Mar’14 Jun’14 Jul’14 Aug’14 Sep’14
14/04/2014 12/05/2014 20/06/2014 10/07/2014 07/08/2014 08/09/2014
1 pH Value -- 7.98 7.58 7.28 7.15 7.3 7.58
2 Temperature ˚C 30 30 29 28 29 31
3 Conductivity µmho/cm 3024 2620 2280 2710 2860 2680
4 Total Suspended Solids mg/L 18 20 18 24 30 26
5 Total Dissolved Solids mg/L 2130 1850 1780 1860 1910 1780
6 Total Hardness mg/L 812 776 680 740 750 680
7 BOD (3 days @ 27 oC) mg/L BDL* BDL* BDL* BDL* BDL* BDL*
8 COD mg/L BDL* BDL* BDL* BDL* BDL* BDL*
9 Nitrates as NO3 mg/L 0.72 0.82 0.43 0.276 0.203 0.171
10 Chlorides as Cl mg/L 238 202 190 199 209 189
11 Sulphates as SO4 mg/L 56 54 40 48.13 45.09 38.36
12 Calcium as Ca mg/L 184 163 120 140 150 140
13 Magnesium as Mg mg/L 84.4 88.3 91.2 93.6 90 79.2
14 Oil & Grease mg/L BDL* BDL* BDL* BDL* BDL* BDL*
15 Arsenic as As mg/L BDL* BDL* BDL* BDL* BDL* BDL*
16 Mercury as Hg mg/L BDL* BDL* BDL* BDL* BDL* BDL*
17 Lead as Pb mg/L BDL* BDL* BDL* BDL* BDL* BDL*
18 Hexavalent Chromium as Cr+6
mg/L BDL* BDL* BDL* BDL* BDL* BDL*
19 Total Chromium mg/L BDL* BDL* BDL* BDL* BDL* BDL*
20 Copper as Cu mg/L 0.06 0.04 0.02 0.036 0.046 0.04
21 Zinc as Zn mg/L 0.07 0.06 0.08 0.14 0.12 0.2
22 Selenium as Se mg/L BDL* BDL* BDL* BDL* BDL* BDL*
23 Iron as Fe mg/L 0.09 0.08 0.1 0.18 0.095 0.08
24 MPN MPN Index/100ml 94 70 79 76 70 63
25 Total Coli form /100 ml Present Present Present Present Present Present *Below detection limit

Page 11 of 18
Location No. 2: Near Port Registration Office
Sr. No
Parameters Unit Apr’14 Mar’14 Jun’14 Jul’14 Aug’14 Sep’14
14/04/2014 12/05/2014 20/06/2014 10/07/2014 07/08/2014 08/09/2014
1 pH Value -- 8.4 8.25 8.01 7.9 8.1 8.46
2 Temperature ˚C 30 30 29 28 29 31
3 Conductivity µmho/cm 805 736 680 750 810 782
4 Total Suspended Solids mg/L 17 22 24 32 36 28
5 Total Dissolved Solids mg/L 574 524 480 510 560 480
6 Total Hardness mg/L 320 258 190 202 218 186
7 BOD (3 days @ 27 oC) mg/L BDL* BDL* BDL* BDL* BDL* BDL*
8 COD mg/L BDL* BDL* BDL* BDL* BDL* BDL*
9 Nitrates as NO3 mg/L 0.96 1.21 1.17 0.86 0.593 0.498
10 Chlorides as Cl mg/L 164 150 120 134 141 134
11 Sulphates as SO4 mg/L 42 36 30 36 44.11 36.37
12 Calcium as Ca mg/L 62.4 54 54 64 72 56
13 Magnesium as Mg mg/L 39.3 29.5 13.2 10.08 9.12 11.04
14 Oil & Grease mg/L BDL* BDL* BDL* BDL* BDL* BDL*
15 Arsenic as As mg/L BDL* BDL* BDL* BDL* BDL* BDL*
16 Mercury as Hg mg/L BDL* BDL* BDL* BDL* BDL* BDL*
17 Lead as Pb mg/L BDL* BDL* BDL* BDL* BDL* BDL*
18 Hexavalent Chromium as Cr+6
mg/L BDL* BDL* BDL* BDL* BDL* BDL*
19 Total Chromium mg/L BDL* BDL* BDL* BDL* BDL* BDL*
20 Copper as Cu mg/L 0.05 0.05 0.1 0.14 0.08 0.066
21 Zinc as Zn mg/L 0.05 0.07 0.02 0.032 0.028 0.018
22 Selenium as Se mg/L BDL* BDL* BDL* BDL* BDL* BDL*
23 Iron as Fe mg/L 0.065 0.072 0.04 0.092 0.076 0.048
24 MPN MPN
Index/100ml 58 49 46 48 49 46
25 Total Coli form /100 ml Present Present Present Present Present Present *Below detection limit

Page 12 of 18
Location No. 3: Near Watchmen Pool
Sr. No
Parameters Unit Apr’14 Mar’14 Jun’14 Jul’14 Aug’14 Sep’14
14/04/2014 12/05/2014 20/06/2014 10/07/2014 07/08/2014 08/09/2014
1 pH Value -- 8.22 8.1 8.46 8.4 8.45 8.58
2 Temperature ˚C 30 30 29 28 29 31
3 Conductivity µmho/cm 1796 715 760 1878 1920 1780
4 Total Suspended Solids mg/L 15 18 14 18 22 18
5 Total Dissolved Solids mg/L 1280 1074 1240 1290 1320 1240
6 Total Hardness mg/L 640 516 612 632 648 620
7 BOD (3 days @ 27 oC) mg/L BDL* BDL* BDL* BDL* BDL* BDL*
8 COD mg/L BDL* BDL* BDL* BDL* BDL* BDL*
9 Nitrates as NO3 mg/L 0.88 0.78 0.439 0.307 0.312 0.264
10 Chlorides as Cl mg/L 262 242 309 320 329 379
11 Sulphates as SO4 mg/L 60 52 27.9 33.97 48.09 39.38
12 Calcium as Ca mg/L 179 156 144 162 180 160
13 Magnesium as Mg mg/L 46 29.7 60.4 54.24 47.04 52.8
14 Oil & Grease mg/L BDL* BDL* BDL* BDL* BDL* BDL*
15 Arsenic as As mg/L BDL* BDL* BDL* BDL* BDL* BDL*
16 Mercury as Hg mg/L BDL* BDL* BDL* BDL* BDL* BDL*
17 Lead as Pb mg/L BDL* BDL* BDL* BDL* BDL* BDL*
18 Hexavalent Chromium as Cr+6
mg/L BDL* BDL* BDL* BDL* BDL* BDL*
19 Total Chromium mg/L BDL* BDL* BDL* BDL* BDL* BDL*
20 Copper as Cu mg/L 0.04 0.06 0.12 0.18 0.12 0.2
21 Zinc as Zn mg/L 0.04 0.05 0.08 0.092 0.07 0.086
22 Selenium as Se mg/L BDL* BDL* BDL* BDL* BDL* BDL*
23 Iron as Fe mg/L 0.074 0.088 0.066 0.32 0.239 0.18
24 MPN MPN
Index/100ml 70 58 63 70 63 70
25 Total Coli form /100 ml Present Present Present Present Present Present
*Below detection limit

Page 13 of 18
Location No. 4: Near Dump Pound Area
Sr. No
Parameters Unit Apr’14 Mar’14 Jun’14 Jul’14 Aug’14 Sep’14
14/04/2014 12/05/2014 20/06/2014 10/07/2014 07/08/2014 08/09/2014
1 pH Value -- 8.5 8.3 7.85 7.92 8.2 8.66
2 Temperature ˚C 30 30 29 28 29 31
3 Conductivity µmho/cm 1424 1866 1650 2056 2140 2080
4 Total Suspended Solids mg/L 19 24 26 28 30 27
5 Total Dissolved Solids mg/L 1158 1314 1360 1408 1446 1410
6 Total Hardness mg/L 320 488 632 660 672 600
7 BOD (3 days @ 27 oC) mg/L BDL* BDL* BDL* BDL* BDL* BDL*
8 COD mg/L BDL* BDL* BDL* BDL* BDL* BDL*
9 Nitrates as NO3 mg/L 1.12 1.23 1.63 1.3 0.984 0.779
10 Chlorides as Cl mg/L 284 412 370 394 407 424
11 Sulphates as SO4 mg/L 58 82 72 77.96 83.91 76.33
12 Calcium as Ca mg/L 72 102 88 98 104 116
13 Magnesium as Mg mg/L 33.6 55.6 98.9 99.6 98.88 74.4
14 Oil & Grease mg/L BDL* BDL* BDL* BDL* BDL* BDL*
15 Arsenic as As mg/L BDL* BDL* BDL* BDL* BDL* BDL*
16 Mercury as Hg mg/L BDL* BDL* BDL* BDL* BDL* BDL*
17 Lead as Pb mg/L BDL* BDL* BDL* BDL* BDL* BDL*
18 Hexavalent Chromium as Cr+6 mg/L BDL* BDL* BDL* BDL* BDL* BDL*
19 Total Chromium mg/L BDL* BDL* BDL* BDL* BDL* BDL*
20 Copper as Cu mg/L 0.05 0.05 0.04 0.06 BDL* 0.066
21 Zinc as Zn mg/L 0.03 0.06 0.07 0.084 0.08 0.05
22 Selenium as Se mg/L BDL* BDL* BDL* BDL* BDL* BDL*
23 Iron as Fe mg/L 0.08 0.092 0.076 0.14 0.097 0.082
24 MPN MPN Index/100ml 109 84 70 79 76 79
25 Total Coli form /100 ml Present Present Present Present Present Present
*Below detection limit

Page 14 of 18
Part D: Soil Quality for the Period of April-2014 to September-2014
Location No. 1: Near Admin
Sr. No
Parameters Unit Apr’14 Mar’14 Jun’14 Jul’14 Aug’14 Sep’14
10/04/2014 12/05/2014 20/06/2014 10/07/2014 20/08/2014 08/09/2014
1 pH Value -- 8.76 9.1 8.89 9.1 9 8.9
2 Electrical Conductivity µmho/cm 2056 1846 1826 1790 1840 1680
3 Moisture % 17.5 17.33 16.66 36.39 38.4 40.41
4 Potassium as K mg/L 56 54 77 65 75 60
5 Iron as Fe % 1.64 1.5 0.99 0.839 0.72 0.579
6 Lead as Pb mg/kg 38 32 53.99 40.18 35.4 25.6
7 Zinc as Zn mg/kg 42 45 27.94 22.76 20.7 12.36
8 Texture
-- Loamy
Sand
Loamy
Sand Sandy
Sandy
Loam
Sandy
Loam
Sandy
Loam
9 Organic Matter % 0.67 0.54 0.691 0.583 0.64 0.572
10 N % 0.06 0.05 0.068 0.145 0.16 0.134
11 P as P2O5 % 0.08 0.09 0.121 0.224 0.34 0.26
12 Boron as B mg/kg 39 30 24.81 20.19 16.8 14.56
13 Caption Exchange Capacity
meq/100 gm 0.48 0.47 0.849 0.964 0.8 1.04
14 Sodium Absorption Ratio
-- 2 2.1 3.37 3.58 4.4 2.95
15 Porosity % 34 36 32.85 37.55 40 41.94
16 Water Holding Capacity
% 42 40 43.35 40.32 40.4 42.99
*Below detection limit
Page 15 of 18
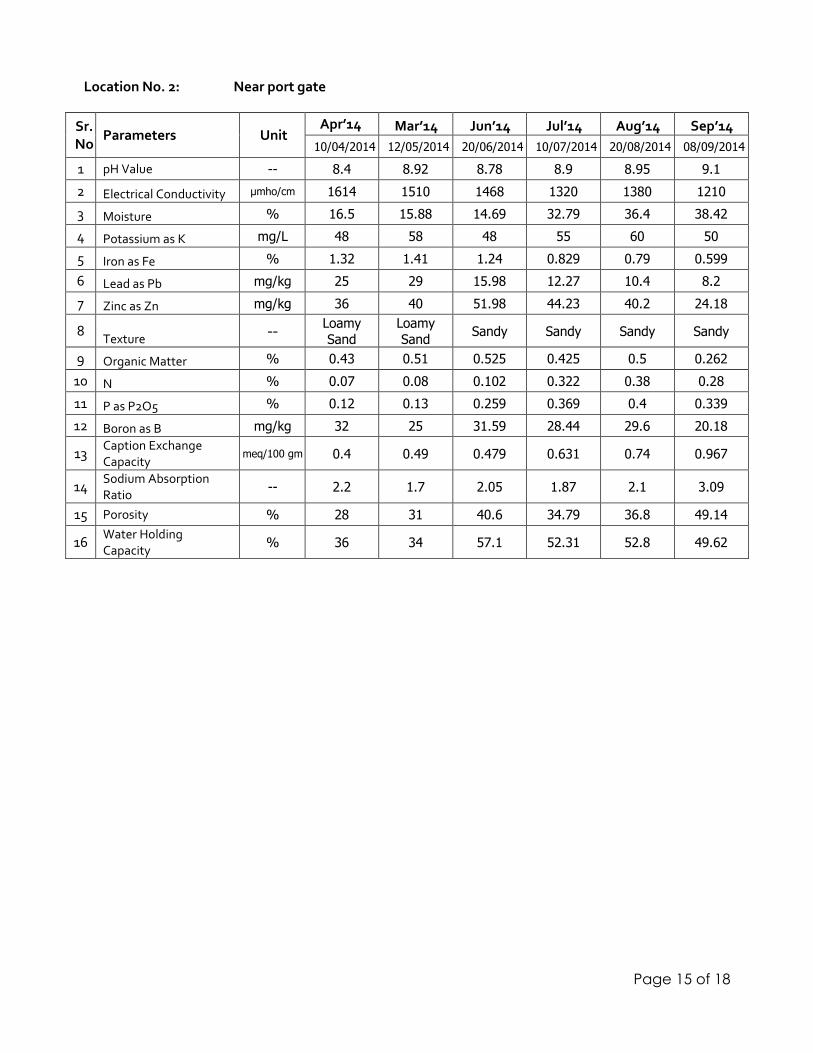
Location No. 2: Near port gate
Sr. No
Parameters Unit Apr’14 Mar’14 Jun’14 Jul’14 Aug’14 Sep’14
10/04/2014 12/05/2014 20/06/2014 10/07/2014 20/08/2014 08/09/2014
1 pH Value -- 8.4 8.92 8.78 8.9 8.95 9.1
2 Electrical Conductivity µmho/cm 1614 1510 1468 1320 1380 1210
3 Moisture % 16.5 15.88 14.69 32.79 36.4 38.42
4 Potassium as K mg/L 48 58 48 55 60 50
5 Iron as Fe % 1.32 1.41 1.24 0.829 0.79 0.599
6 Lead as Pb mg/kg 25 29 15.98 12.27 10.4 8.2
7 Zinc as Zn mg/kg 36 40 51.98 44.23 40.2 24.18
8 Texture
-- Loamy
Sand
Loamy
Sand Sandy Sandy Sandy Sandy
9 Organic Matter % 0.43 0.51 0.525 0.425 0.5 0.262
10 N % 0.07 0.08 0.102 0.322 0.38 0.28
11 P as P2O5 % 0.12 0.13 0.259 0.369 0.4 0.339
12 Boron as B mg/kg 32 25 31.59 28.44 29.6 20.18
13 Caption Exchange Capacity
meq/100 gm 0.4 0.49 0.479 0.631 0.74 0.967
14 Sodium Absorption Ratio
-- 2.2 1.7 2.05 1.87 2.1 3.09
15 Porosity % 28 31 40.6 34.79 36.8 49.14
16 Water Holding Capacity
% 36 34 57.1 52.31 52.8 49.62

Page 16 of 18
Location No. 3: Silo site
Sr. No
Parameters Unit Apr’14 Mar’14 Jun’14 Jul’14 Aug’14 Sep’14
10/04/2014 12/05/2014 20/06/2014 10/07/2014 20/08/2014 08/09/2014
1 pH Value -- 9.24 9.62 9.48 9.3 9.2 9.15
2 Electrical Conductivity
µmho/cm 2450 2144 2080 1940 2010 1920
3 Moisture % 17.72 17.2 20.13 34.6 37.2 38.73
4 Potassium as K mg/L 72 68 74 70 78 62
5 Iron as Fe % 1.7 1.72 1.44 1.12 1.08 0.839
6 Lead as Pb mg/kg 30 35 34.98 30.79 28.6 20.58
7 Zinc as Zn mg/kg 62 65 77.99 83.39 80.9 49.94
8 Texture -- Loamy
Sand
Loamy
Sand Sandy Sandy Sandy Sandy
9 Organic Matter % 0.66 0.71 0.394 0.31 0.38 0.322
10 N % 0.05 0.07 0.08 0.03 0.038 0.046
11 P as P2O5 % 0.09 0.11 0.338 0.48 0.5 0.44
12 Boron as B mg/kg 45 32 44.81 20.99 17.2 13.61
13 Caption Exchange Capacity
meq/100 gm 0.44 0.5 0.659 0.892 0.8 0.98
14 Sodium Absorption Ratio
-- 2.1 1.8 2.52 2.7 3.2 3.36
15 Porosity % 32 35 28.66 32.47 39.9 39.15
16 Water Holding Capacity
% 41 38 48.06 45.62 45.9 46.92

Page 17 of 18
Location No. 4: Proposed Dump Pond Area
Sr. No
Parameters Unit Apr’14 Mar’14 Jun’14 Jul’14 Aug’14 Sep’14
10/04/2014 12/05/2014 20/06/2014 10/07/2014 20/08/2014 08/09/2014
1 pH Value -- 8.9 8.48 9.21 9.15 9.3 9.25
2 Electrical Conductivity µmho/cm 2665 2240 2180 2010 2060 1980
3 Moisture % 18.46 18.12 12.74 35.2 36.9 38.92
4 Potassium as K mg/L 68 74 62 50 56 48
5 Iron as Fe % 1.84 1.8 0.87 0.67 0.58 0.479
6 Lead as Pb mg/kg 35 40 89.99 70.37 56.4 40.18
7 Zinc as Zn mg/kg 50 56 71.99 61.99 56.8 30.67
8 Texture -- Loamy
Sand
Loamy
Sand Sandy Sandy Sandy Sandy
9 Organic Matter % 0.54 0.62 0.22 0.13 0.18 0.233
10 N % 0.08 0.06 0.18 0.27 0.31 0.266
11 P as P2O5 % 0.1 0.12 0.27 0.33 0.4 0.276
12 Boron as B mg/kg 50 40 59.87 31.8 23.8 18.7
13 Caption Exchange Capacity
meq/100 gm 0.35 0.42 0.719 0.924 0.94 0.989
14 Sodium Absorption Ratio
-- 1.7 1.5 2.7 2.8 3.4 3.38
15 Porosity % 30 32 38.4 32.61 30 38.89
16 Water Holding Capacity
% 45 43 47 44.19 44.3 47.99

Page 18 of 18
Part E: Day time Noise Monitoring in dB(A) Leq. for the Period of April-2014 to September-2014
Sr. No
Location
Apr’14 Mar’14 Jun’14 Jul’14 Aug’14 Sep’14
07/04/20
14
17/04/20
14
08/05/20
14
26/05/20
14
06/06/20
14
21/06/20
14
07/07/20
14
24/07/20
14
11/08/20
14
25/08/20
14
11/08/20
14
25/08/20
14
1 Near ADM Building
71.2 70.5 68.5 69.7 72.2 70.6 68.1 69.9 65.5 67.3 62.2 64.5
2 Near Port Gate 61.9 64.6 57.2 61.5 65.5 63.3 62.2 64.7 59.9 62.7 57.5 59.2
3 Silo Site 72.4 68.5 69.9 70.2 72.1 68.1 70.3 66.1 68.2 64.1 65.1 62.4
4 Proposed Dump Pond Area
71.2 69.4 68.1 71.3 70.8 66.5 69.5 65.8 67.4 63.6 64.8 60.9

Sl.
No
Information sought by EAC VPT remarks
1 Tabular statement indicating details of (a) existing facilities as per existing EC obtained; (b) proposed additional facilities;
(c) total capacity after expansion to be
provided.
Annexure -I
2 CRZ classification of the project area. Annexure-2
3 Dispersion modelling for the dumping of the additional dredge materials shall be carried out. The study report shall be incorporated.
Annexure-3
4 Baseline ambient air quality monitoring data in respect of parameters such as methane and VOC to be collected
Annexure-4 (2014)
5 Details of the air pollution control measures to be undertaken for the coal handling berth and well as bulk cargo handling berth.
Annexure- 5 A and 5B
6 Layout map of greenbelt proposed around
the coal handling berth and bulk cargo
berth.
Annexure-6
7 Water balance chart indicating fresh water requirement and waste water generation for the existing port as well as after expansion.
Annecure-7
8 Issues raised during public hearing and
commitments made by the project
proponent in the form of tabular chart with
financial budget for complying with the
commitments made.
Annexure -8