Proposal for a - Harvard University
63
Performance of Agrivoltaic Systems for Shade-Intolerant Crops: Land for Both Food and Clean Energy Production The Harvard community has made this article openly available. Please share how this access benefits you. Your story matters Citation Sekiyama, Takashi. 2019. Performance of Agrivoltaic Systems for Shade-Intolerant Crops: Land for Both Food and Clean Energy Production. Master's thesis, Harvard Extension School. Citable link http://nrs.harvard.edu/urn-3:HUL.InstRepos:42004145 Terms of Use This article was downloaded from Harvard University’s DASH repository, and is made available under the terms and conditions applicable to Other Posted Material, as set forth at http:// nrs.harvard.edu/urn-3:HUL.InstRepos:dash.current.terms-of- use#LAA
Transcript of Proposal for a - Harvard University
Performance of Agrivoltaic Systemsfor Shade-Intolerant Crops: Land for
Both Food and Clean Energy ProductionThe Harvard community has made this
article openly available. Please share howthis access benefits you. Your story matters
Citation Sekiyama, Takashi. 2019. Performance of Agrivoltaic Systems forShade-Intolerant Crops: Land for Both Food and Clean EnergyProduction. Master's thesis, Harvard Extension School.
Citable link http://nrs.harvard.edu/urn-3:HUL.InstRepos:42004145
Terms of Use This article was downloaded from Harvard University’s DASHrepository, and is made available under the terms and conditionsapplicable to Other Posted Material, as set forth at http://nrs.harvard.edu/urn-3:HUL.InstRepos:dash.current.terms-of-use#LAA
Performance of Agrivoltaic Systems for Shade-intolerant Crops:
Land for Both Food and Clean Energy Production
Takashi Sekiyama
A Thesis in the Field of Sustainability
for the Degree of Master of Liberal Arts in Extension Studies
Harvard University
March 2019

Copyright 2019 Takashi Sekiyama
Abstract
The purpose of this research was to examine the performance of agrivoltaic
systems, which produce crops and electricity simultaneously, by installing stilt-mounted
photovoltaic (PV) panels on farmland. As PV power stations continue to enjoy
remarkable growth, land occupation with the purpose of establishing solar farms will
intensify the competition for land resources between food and clean energy production.
In a bid to reduce this competition, previous studies have suggested that agrivoltaic
systems can produce shade-tolerant crops such as lettuce under PV modules. However, if
agrivoltaics work well only for some shade-tolerant crops, as existing studies seem to
infer, their practical applicability would be very limited. Thus, the research considered
three related questions: 1) Is it possible to grow shade-intolerant crops under the shade of
agrivoltaic PV panels? 2) Can stilt-mounted agrivoltaic systems mitigate the trade-off
between crop production and clean energy generation even when applied to shade-
intolerant crops? 3) Is it financially feasible for farmers to adopt stilt-mounted agrivoltaic
systems for shade-intolerant crops? In order to answer these questions, this research
explored the performance of an agrivoltaic farm producing corn, a typical shade-
intolerant crop.
The research was conducted at a 100-m2 experimental farm with three sub-
configurations: no modules (control), low-module density, and high-module density.
Eight 0.76-m-wide PV module arrays, spaced at 0.71 m intervals, comprised the high-
density configuration, while four PV module arrays spaced at 1.67 m intervals comprised

the low-density configuration. In each configuration, 25 corn stalks were planted 0.5 m
apart (9 stalks/m2).
The results showed that the stilt-mounted agrivoltaic system can mitigate the
trade-off between crop production and clean energy generation even when applied to
shade-intolerant crops. First, the biomass of corn stover grown in the low-density PV
module configuration was larger than that of the no-module control configuration by
4.9%. Second, the corn yield per square meter of the low-density configuration was larger
than that of the control by 5.6%. Third, the total annual revenue of the high-density
configuration was 8.3 times larger than that of the control, while that of the low-density
configuration was 4.7 times larger. Furthermore, according to the cost-benefit analysis for
this case study, a good return on the investment is likely for such agrivoltaic systems. The
cost-benefit ratios of high-density and low-density configurations over a 20-year period
were 1.90 and 1.78, respectively, indicating that both systems would be financially
feasible.
The results of this research should encourage more conventional farmers, clean
energy producers, and policy makers to consider adopting stilt-mounted PV systems.
Beyond its applications in agriculture, this system has the potential to generate electricity
on pasture land, water surfaces, roads, and many other places without devastating the
natural environment. Particularly in densely populated regions, mountainous areas, small
inhabited islands, and barren desert areas, where land resources are relatively scarce, this
system could exploit limited land resources for simultaneous food and clean energy
production.

v
Acknowledgements
I wish to express my deepest appreciation to all those who offered their assistance,
guidance, and support during this research project. This project would not have been
successful without the guidance and thoughtful direction of my thesis director, Mr. Akira
Nagashima, who has given his time and institute resources to support this thesis. I would
also like to thank the faculty of the Sustainability program of the Harvard University
Extension School, who helped guide my understanding of various environmental
problems. My research advisor, Dr. Mark Leighton, was a tremendous source of support
throughout the development of my thesis, reviewing multiple iterations of the initial
proposal and providing constant guidance. Last, but certainly not least, I thank my friends
and family, particularly Eriko Sekiyama, for her patience, understanding, and
unconditional support.
vi
Table of Contents
Acknowledgements………………………………………………………………………..v
List of Tables……………………………………………………………………………viii
List of Figures……………………………………………………………………………..x
Definition of Terms………………………………………………………………………xi
I. Introduction ……………………………….…………………………………...1
Research Significance and Objectives………………………………………….4
Background……………………………………………………………………..5
Gaps in Current Agrivoltaics Research……………………………………7
Application to shade-intolerant crops……………………………….7
Financial feasibility in different countries and regions……………...8
Agrivoltaic Systems in Japan…………………………………………….10
Research Questions, Hypotheses, and Specific Aims…………………………13
Specific Aims...………………………………………………………………..13
Research Presentation ………………………………………………………...14
II. The Sensitivity of Corn Yield per Square Meter to Changes in Shading Level.15
Methods………………………………………………………………………..15
Data Collection…………………………………………………………..15
Sensitivity Analysis……………………………………………………..17
Results…………………………………………………………………………18
Corn Yield………………………………………………………………18
Performance of the PV System…………………………………………21
vii
Crop Revenues…….……………..….……………………………….....23
Discussion……………………………………………………………………..26
Possible Reasons for High Crop Yield…..…………....………………..27
Financial Feasibility of Agrivoltaic Systems…………………………...28
III. Financial Feasibility of an Agrivoltaic System in Japan……….………. …...30
Methods………………………………………………………………………..30
Electricity Generation…………………………………………………..31
Crop Production………………..……………………………………….31
Assumptions……………………………………………………………32
Results…………………………………………………………………………33
Discussion……………………………………………………………………..33
IV. Discussion…………………………………………………….………………..39
Summary of Sensitivity Analysis……………………………………………...39
Summary of Cost-Benefit Analysis……………………………………………40
Conclusions……………………………………………………………………41
Future Work...…………………………………………………………………43
Further Solar-Sharing Potential with Stilt-mounted PV Modules.……..46
References……………………………..…………………………………………………49

viii
List of Tables
Table 1 Typical prices of PV systems in selected countries in 2013 (IEA, 2014). ….....9
Table 2 Examples of agrivoltaic farms in Japan. .......................................................... 12
Table 3 Average fresh weight of corn crops grown in different configurations. .......... 19
Table 4 Average biomass (dry basis) of corn stover grown in different
configurations…………………………………………………………..……19
Table 5 Corn yields per square meter for different configurations. ............................. 21
Table 6 Power output (kWh) of stilt-mounted agrivoltaic PV modules in the high-
density configuration from September 2017 to August 2018. ........................ 22
Table 7 Power output (kWh) of stilt-mounted agrivoltaic PV modules in the low
densityconfiguration from September 2017 to August 2018. ......................... 22
Table 8 Annual average price of sweetcorn in Tokyo Metropolitan Central Wholesale
Market from 2013 to 2017. ............................................................................. 23
Table 9 Annual revenue per square meter from corn crops grown in different
configurations. ................................................................................................ 23
Table 10 Annual total revenue per square meter from corn crops and PV in different
configurations. ................................................................................................ 24
Table 11 Annual total revenue per square meter with different feed-in-tariff rates. ..... 25
Table 12 Light saturation points of selected crops (Solar Sharing Network, 2018a). ... 28
Table 13 Financial feasibility of high-density configuration agrivoltaic system (10-year
period). ............................................................................................................ 35
ix
Table 14 Financial feasibility of low-density configuration agrivoltaic system (10-year
period). ............................................................................................................ 36
Table 15 Financial feasibility of high-density configuration agrivoltaic system (20-year
period). ............................................................................................................ 37
Table 16 Financial feasibility of low-density configuration agrivoltaic system (20-year
period). ............................................................................................................ 38
x
List of Figures
Figure 1 Three different types of agrivoltaic system: (a) using the space between PV
panels for crops, (b) a PV greenhouse, and (c) a stilt-mounted system. ............. 5
Figure 2 PV module configurations at the agrivoltaic experimental farm ...................... 16
Figure 3 Sensitivity of fresh weight of reproductive corn parts with respect to the
spacing between modules. ................................................................................ 20
Figure 4 Sensitivity of crop biomass of corn stover with respect to the spacing between
modules. ............................................................................................................ 20
Figure 5 Sensitivity of annual PV power output with respect to the spacing between
modules. ............................................................................................................ 21
Figure 6 Change in feed-in-tariff rate for PV power generation in Japan (Data: METI,
2018). ................................................................................................................ 25
Figure 7 Sensitivity of annual total revenue per square meter to changes in the feed-in-
tariff rate............................................................................................................ 26
xi
Definition of Terms
Agrivoltaic: Co-developing the same area of land for agriculture and photovoltaic
power generation
EIA: United States Energy Information Administration
IEA: International Energy Agency
JSSA: Japan Solar Sharing Association
MAFF: Japanese Ministry of Agriculture, Forestry and Fisheries
METI: Japanese Ministry of Economy, Trade and Industry
NREL: United States National Renewable Energy Laboratory
PV: Photovoltaic
SEIA: Solar Energy Industries Association
1
Chapter I
Introduction
Our society relies heavily on fossil fuels, which is not sustainable. The major
fossil fuels including coal, oil, and natural gas dominate global energy consumption and,
while their benefits are undeniable, they also cause serious environmental problems, from
air pollution to global warming. Fossil fuels are also non-renewable; they draw on finite
resources that will eventually dwindle. Thus, our continued reliance on fossil fuels is not
possible, neither environmentally nor materially.
In contrast to fossil fuels, renewable energy resources are constantly replenished
and more environmentally friendly. Commonly used renewable energy sources include
biomass, hydropower, geothermal, wind, and solar. Today, the use of renewable energy is
increasing. In 2017, 11% of total U.S. energy consumption and approximately 17% of
U.S. electricity generation was from renewable energy sources (EIA, 2018). In addition,
renewable energy plays an important role in reducing greenhouse gas emissions. Non-
biomass renewable sources of energy such as hydropower, geothermal, wind, and solar
do not directly emit greenhouse gases. Despite these strengths, renewable energy is
typically more expensive to produce and use than fossil fuels and energy sources are not
always available. For example, clouds reduce electricity generation from solar power
plants, low-wind days reduce electricity generation from wind farms, and droughts
reduce the water available for hydropower.
2
Among renewable energy technologies, photovoltaic (hereafter called “PV”)
power generation has enjoyed remarkable growth over the past decade. PV systems have
several advantages. First, PV systems can supply electricity in locations where electricity
distribution systems do not exist, and they can also supply electricity to the electric power
grid. Second, PV arrays can be installed quickly and at any size. Also, PV systems do not
directly emit air pollutants, which harm human health and the global climate. PV systems
designed for the supply of commercial power into the electricity grid are known as PV
power stations, solar farms, or solar parks. Commercial PV power stations are different
from building-mounted and other decentralized solar power applications because they
supply power at the utility level, rather than to a local user or users. Most existing large-
scale solar power plants are owned and operated by independent power producers (SEIA,
2018).
According to International Energy Agency (hereinafter called “IEA”), the
installed capacity of PV in major countries was approximately 402 GW in 2017, 70 times
higher than in 2006. Additions in 2017 alone amounted to at least 96 GW. Although PV’s
overall share of global power generation remains low at 2.1%, Honduras, Germany,
Greece, Italy, and Japan now have enough PV capacity to theoretically produce more
than 5% of their annual electricity demand with PV. Solar is beginning to have a
noticeable impact among sources of power generation growth. By the end of 2017, 29
countries had at least 1 GW of cumulative PV system capacity and eight countries had
installed at least 1 GW. China alone accounts for 32% of the global installed capacity.
The United States ranks second (51 GW) with Japan third (49 GW) and Germany fourth
(42 GW) (IEA, 2018a).
3
Government incentives have promoted the recent growth of PV power stations.
Compared with fossil fuel systems, the levelized cost of PV systems is higher. Investors
of residential and commercial PV systems are typically faced with fundamental economic
challenges: the cost of electricity from such systems exceeds that of electricity from fossil
fuel-based utilities and other sources. Consequently, without financial incentives,
building and land owners will not invest in PV systems, and utilities will not purchase
electricity from these systems. Therefore, the feed-in-tariff initiatives favored in Europe,
together with comparable measures adopted in the United States, China, and Japan, have
played an indispensable role in promoting PV systems in these countries.
As PV power stations continue to enjoy remarkable growth, land occupation
intended for solar farms will intensify competition for land resources between food and
clean energy production (e.g., Nonhebel, 2005). The question remains as to how
competition for land resources between food and energy production can be resolved.
Although PV systems require less land than other renewable energy options (Fthenakis &
Kim, 2009), in reality, commercial PV power stations can occupy a considerable land
area at local scales. In many cases, the most suitable sites for solar power plants, which
perform optimally with long daylight hours and minimal cloud cover, are classified as
agricultural land. This presents an issue in that land supporting viable and diverse
agriculture is likely to have more value as agricultural land than as a solar farm (Neil,
Stapleton, & Martell, 2017). This competition could be particularly serious in densely
populated regions, mountainous areas, and small inhabited islands.
However, this competition could be reduced by agrivoltaic systems, which
produce crops and electricity at the same time by installing compact solar panels on
4
farmland. Although previous studies have indicated that this system effectively produces
shade-tolerant crops and electricity simultaneously (e.g. Marrow et al., 2013), further
studies are required to evaluate its practical applications. In particular, the performance of
shade-intolerant crops, which are expected to grow poorly in low-light environments, has
not yet been fully explored for agrivoltaic systems. As well as the feasibility of crop
production, the financial feasibility of agrivoltaic systems should also be determined via
cost-benefit analyses in different countries and regions.
Research Significance and Objectives
The fundamental problem tackled by this research was how to reduce competition
for land resources between food production and PV power generation. In other words, the
main objective was to identify a PV system that can help reduce the tension between
limited land resources and increasing demands for food and clean energy. Roof-top PV
systems can partially satisfy home electricity demands, but other sectors consume more
electricity. In the United States, for example, the residential sector accounts for only
37.1% of the final electricity consumption, while 36.0% and 21.3% of the total is
consumed by the commercial sector and industry, respectively (IEA, 2018b). As a major
renewable energy source, large (commercial-scale) PV power stations are key for
meeting the demands of those sectors. Although lifecycle studies of PV systems show a
lower requirement for land than other renewable energy options (Fthenakis & Kim, 2009),
commercial PV power stations nevertheless occupy vast tracts of land at local scales.
This problem could be solved by agrivoltaic systems. Thus, this thesis has the
following objectives:

5
• To evaluate the effectiveness of agrivoltaic systems at reducing competition for
land resources between agriculture and PV power generation.
• To examine the applications of agrivoltaic systems to shade-intolerant crops.
• To determine the financial feasibility of agrivoltaic systems in countries where
detailed agrivoltaic farm experiments have not yet been reported.
Background
To date, three types of agrivoltaic systems, which simultaneously enable crop and
electricity production on farmland, have been proposed (Figure 1). The first type was
(a) (b) (c)
Figure 1. Three different types of agrivoltaic system: (a) using the space between PV
panels for crops, (b) a PV greenhouse, and (c) a stilt-mounted system.
proposed in the early 1980s, using the space between PV rows for crops (Goetzberger,
1982). The second type is a PV greenhouse, in which part of its transparent covering is
replaced by PV modules. The use of PV for greenhouses is a promising solution for the
competition for land resources between food and energy production because it allows

6
continuous food production and electricity generation throughout the year (Scognamiglio,
2014). The third type consists of stilt-mounted PV modules above the crops.
Stilt-mounted agrivoltaic systems were originally invented by Akira Nagashima,
an agricultural machinery engineer, in 2004. Nagashima devised and patented a special
structure similar to a garden pergola (Japan Patent No. 2005-277038, 2005). The
structure is made of pipes and rows of PV panels mounted above the ground and arranged
at certain intervals to allow enough sunlight for photosynthesis to penetrate to the ground.
The system is designed to guarantee adequate sunlight for crops and sufficient space for
agricultural machinery. Moreover, the structure has no concrete footing so can be easily
dismantled.
Existing studies have focused on agrivoltaics with stilted solar arrays. Farm
experiments with stilt-mounted PV modules were recently reported in France (e.g.
Marrow et al., 2013), Japan (Nagashima, 2014), and the United States (Majumdar &
Pasqualetti, 2018). They indicated that the system of planting shade-tolerant crops does
not decrease land productivity. Adoption of agrivoltaic systems may therefore require
minimal adaptation of cropping practices. The first reported agrivoltaic farm experiment
was performed in Montpellier, France, in 2013 (Marrow et al., 2013). Marrow and
colleagues grew lettuce crops with a system consisting of 0.8-m-wide stilt-mounted PV
modules, mounted at a height of 4 m and tilted at an angle of 25°. The same area of land
was used to successfully produce both electricity and food. Their results showed that
shading created by the PV arrays had no significant effect on the lettuce yield. The
growth rate below the PV panels was not reduced except during the juvenile phase of the
crop.

7
Interestingly, field experiments performed by Dupraz and colleagues found that
agrivoltaic systems even increased land productivity for durum wheat by 35–72%
(Dupraz et al., 2011). They used land equivalent ratios to compare conventional options
(separation of agriculture and energy harvesting) and two agrivoltaic systems with
different PV panel densities. Light transmission at the crop level by an array of solar
panels was modeled, and a crop model was developed to predict the productivity of
partially shaded crops. According to another field experiment, solar-generated electricity
coupled with shade-tolerant lettuce production resulted in an increase in economic value
of over 30% over conventional agriculture (Dinesh & Pearce, 2016).
Gaps in Current Agrivoltaics Research
In order to evaluate the practical value of agrivoltaic systems, however, further
studies are required. For example, the potential of PV greenhouses has yet to be explored
as previous farm experiments have mainly focused on agrivoltaic systems consisting of
stilt-mounted PV modules above crops. Nevertheless, further research on stilt-mounted
PV systems is still vital, particularly in terms of their application to shade-intolerant crops
and their financial feasibility in different regions and countries.
Application to shade-intolerant crops. The studies reviewed above only indicate that
agrivoltaics are effective for plants that are shade resistant, namely, arugula, Asian greens,
chard, collard greens, kale, mustard greens, parsley, sorrel, spinach, scallions, broccoli,
kohlrabi, cabbage, hog peanut, alfalfa, yam, taro, cassava, and sweet potato (Dinesh &
Pearce, 2016). However, the effectiveness of the system for shade-intolerant crops, which
8
are expected to grow poorly in a low-light environment, has not yet been explored. Many
major commercial crops, such as corn, watermelon, tomato, cucumber, pumpkin, cabbage,
turnip, and rice are shade intolerant and presumably require abundant sunlight. If
agrivoltaics are only applicable to commercially less viable and shade-tolerant crops, the
system is not likely to produce enough food and clean energy to meet the increasing
global demands.
However, it is possible that shade-intolerant crops can grow under the shade of
agrivoltaic PV panels. Shade tolerance is a plant trait that describes its ability to tolerate
low light levels. Only limited screening studies of crop tolerance to shade are available
(e.g., Johnston & Onwueme, 1998; Lin, Zhang, & Chen, 2007). In practice, corn,
watermelons, tomatoes, and taro are reputed to have high saturation points, which means
that they need strong light to grow. Examples of crops that prefer moderate light include
cucumbers, turnips, pumpkins, cabbage, and green peppers. Mushrooms show a
preference for growth in comparatively dark places.
For example, Nagashima (2014) reported that corn, a typical shade-intolerant crop,
could grow well under the shade of agrivoltaic PV panels. Surprisingly, some stalks
under the panels grew even higher than those without shade at his experimental farm.
Unfortunately, however, he compared the height of corn stalks by sight alone and only
reported qualitative results. Thus, quantitative research is necessary to examine the
applicability of agrivoltaic systems to shade-intolerant crops such as corn.
Financial feasibility in different countries and regions. More cost-benefit analyses in
different countries and regions are necessary to examine the feasibility of agrivoltaic

9
systems. A study on a stilt-mounted agrivoltaic system cultivating lettuce in Kansas
indicated that the system could earn a farmer 8–30% more than conventional farming
(Dinesh & Pearce, 2015). Installation of this system was determined financially feasible
for conventional farmers under several assumptions including US residential electric rates,
a discount rate of 4.5%, a loan term of 30 years, a degradation rate of 0.5%/year,
insurance costs of 1.5%, O&M costs of 9%, and a zero interest loan of 100% debt.
However, the costs of PV systems vary significantly among countries or even
within a country because they are largely determined by local resource availability. While
the price of PV modules has been reduced due to technological advances and the scale of
the economy (Fraunhofer, 2015), soft costs such as different supply chains, local
regulatory requirements, labor and permitting costs, and different financing mechanisms
lead to wide regional differences (IEA, 2015). As a result, prices for entire PV systems
vary more widely than those for PV modules, which tend to be global commodities.
Small systems such as rooftop systems are usually more expensive than their larger
counterparts, especially ground-based, utility-scale systems.
Prices for similar system types also vary significantly among countries (Table 1).
Thus, to boost the global adoption of agrivoltaic systems, it is necessary to study their
Table 1. Typical prices of PV systems in selected countries in 2013 (IEA, 2014).
(unit: USD/W)
Australia China France Germany Italy Japan UK US
Residential 1.8 1.5 4.1 2.4 2.8 4.2 2.8 4.9
Commercial 1.7 1.4 2.7 1.8 1.9 3.6 2.4 4.5
Utility-scale 2.0 1.4 2.2 1.4 1.5 2.9 1.9 3.3

10
financial feasibility in countries where detailed agrivoltaic farm experiments have not yet
been reported, at least in English journals. In light of the relatively high installation costs,
it is important to examine the feasibility of agrivoltaic systems in Japan.
Agrivoltaic Systems in Japan
Although scarce information is available in English publications, the
implementation of agrivoltaic systems has been rapidly spreading in Japan. Agrivoltaic
systems are known as “Solar Sharing” in Japan. Although the concept was originally
developed in 2004 by Akira Nagashima, the Japanese Agricultural Land Act had
prohibited solar generation on farmland at the time. In April 2013, however, the Japanese
Ministry of Agriculture, Forestry and Fisheries gave its approval to install agrivoltaic
systems on farmland under the following conditions:
1. The support posts must be easily constructed and easily removed.
2. They must be designed to ensure a suitable amount of sunlight for the growth of
crops from the perspective of panel angle, gaps, and so forth.
3. Reports on the status of the produce grown on the agricultural land underneath the
agricultural power equipment must be given every year.
4. The conversion period pertaining to each application shall be a term of no more
than three years, and approval must be obtained for extensions if there are no
problems.
These conditions are to ensure that farmers remain farmers, and do not fully
convert productive farmland into PV power stations. Farmers, therefore, are required to
report their annual crop cultivation, and if the crop yield of the solar-shared farmland

11
falls below 80% compared to the original level, they will be required to dismantle the PV
system.
In addition, the onset of the feed-in tariff scheme made agrivoltaic systems more
attractive. The Japanese Ministry of Economy, Trade, and Industry adopted the feed-in
tariff scheme in July 2012, whereupon electric power companies are obliged to buy
electricity generated from renewable sources at a fixed price for a certain period. Under
this policy, Japanese electric power companies have been purchasing electricity
generated from solar and wind power systems of independent power producers and
customers (METI, 2012). These deregulation measures as well as financial support have
encouraged Japanese farmers to install agrivoltaic systems on their farmland.
As of March 2017, 1296 Japanese farms had registered to install agrivoltaic systems
(MAFF, 2018a). As seen from Table 2, many different crops have been planted under PV
panels on these registered agrivoltaic farms: blackberry, blueberry, broad bean, carrot,
chestnut, eggplant, grape, ginger, leek, lettuce, mandarin orange, mushroom, pasture,
peanut, persimmon, potato, radish, red bean, rice, spinach, tea, tomato, turnip, and wheat.
Their electricity generation capacity ranges from 10–393 kW, but the typical capacity is
approximately 50 kW (Solar Sharing Network, 2018b) (Table 2).
The installation of agrivoltaic systems can be financially feasible in Japan. For
example, an agrivoltaic farmer in Chiba prefecture (Movellan, 2013) installed 348 stilt-
mounted PV panels on a 750-m2 farm, and cultivated peanuts, yams, eggplants, cucumber,
tomatoes, taros, and cabbages under the PV panels. The installation cost of the PV system,

12
Table 2. Examples of agrivoltaic farms in Japan.
Name of Farm Location Generation
Capacity Crops
Yachimata Chiba prefecture 392.7 kW Blueberry
Isezaki Gunma prefecture 140 kW Grape
Makinohara Shizuoka prefecture 56 kW Tea
Wakaba Chiba prefecture 50 kW Wheat
Hatano Kanagawa prefecture 50 kW Orange
Kasu Saitama prefecture 50 kW Red bean
Imabari Ehime prefecture 33 kW Rice
Source: Solar Sharing Network (2018b)
which produces 35,000 kWh a year, was approximately 12.6 million yen (approximately
114,500 USD). Having secured the feed-in-tariff rate of 42 yen per kWh for 20 years, he
should be able to earn 1.47 million yen (approximately 13,000 USD) annually, while
making only 100,000 yen (approximately 900 USD) from agriculture.
In summary, existing studies suggest that agrivoltaic systems are effective for
simultaneously producing shade-tolerant crops and electricity. Considering the
requirements stated above, however, it is meaningful to study the possibility of coupling
agrivoltaic systems with shade-intolerant crops such as corn. It is important to check
whether an increase in the overall productivity of land could be achieved even with crops
that need plenty of sunlight. In addition, more cost-benefit analyses in different countries
and regions are necessary. It could be particularly useful to learn from Japan’s rich
experience in agrivoltaic farming.

13
Research Questions, Hypotheses, and Specific Aims
The goal of this research was to examine the effectiveness of agrivoltaic systems
for reducing the tensions between limited land resources and increasing demands for food
and clean energy. Particularly, this research focused on the stilt-mounted type of
agrivoltaic system, which is the most widely adopted system in existing studies and
practice. In order to achieve this goal, the research considers three related questions: 1) Is
it possible to grow shade-intolerant crops under the shade of agrivoltaic PV panels? 2)
Can stilt-mounted agrivoltaic systems mitigate the trade-off between crop production and
clean energy generation even when applied to shade-intolerant crops? 3) Is it financially
feasible for farmers to adopt stilt-mounted agrivoltaic systems in a country such as
Japan?
Therefore, the hypotheses examined in this research are as follows:
• The biomass of corn stover grown in an agrivoltaic farm will be no less than 90%
that of corn plants grown without the agrivoltaic system. (Stover refers to dried
stalks and leaves of a field crop.)
• The annual revenue from PV power generation and corn harvest in an agrivoltaic
farm will be larger than that of a traditional corn field.
• The cost benefit ratio of a stilt-mounted agrivoltaic system will be larger than 1.0
in Japan, indicating financial feasibility.
Specific Aims
To test the hypotheses stated above, the specific aims of this research were as
follows:
14
• Establish field experimental plots.
• Monitor the growth and yield of corn plants in the experimental plots.
• Gauge the biomass of corn plants harvested in the experimental plots.
• Calculate the annual profits per square meter of the experimental plots.
• Develop a spreadsheet for a cost benefit analysis.
Research Presentation
Chapters II and III of this thesis are presented in the form of discrete journal
articles with their own methods, results, and summary sections. Chapter II examines the
sensitivity of corn yield and annual revenue per square meter to changes in the level of
crop shading. Chapter III evaluates the financial feasibility of the agrivoltaic system in
Japan. While the articles are related as part of this thesis, they are intended to be
published independently.
15
Chapter II
Sensitivity of Corn Yield per Square Meter to Changes in Shading Level
Previous studies have suggested that agrivoltaic systems are effective for
simultaneously producing electricity and shade-tolerant crops such as lettuce. However, if
agrivoltaics are effective only for a few shade-tolerant crops, the system’s practical
applications would be very limited. Thus, this research explored the applicability of
agrivoltaic systems to corn, a typical shade-intolerant crop.
Methods
Data necessary for this research were collected from a case study plot at the
agrivoltaic experimental farm operated by the CHO Technical Research Institute in
Ichihara City, Chiba Prefecture, Japan (Latitude: 35.378929, Longitude: 140.138549).
Data Collection
The size of the experimental farm was 100 m2 and contained three sub-
configurations; no modules (control), low-module density, and high-module density
(Figure 2). The solar PV modules were mounted on the ground, with the area underneath
the stilts used for agriculture and large enough to accommodate farming equipment. The
total output capacity of the PV system was 4.5 kW. The feed-in-tariff rate of 48 yen
(approximately 0.44 USD) per kWh was secured for this PV system.

16
This system consisted of 72 PV modules (1354 mm x 345 mm) mounted at a
height of 2.7 m and tilted at an angle of 30°. In the high-density configuration, there were
eight PV module arrays (48 modules) spaced at 0.71 m intervals. In the low-density
configuration, there were four PV module arrays (24 modules) spaced at 1.67 m intervals.
Both the stilt-mounted PV panel configurations casted shade on the crop below. The
shading from the PV module varied according to the time of year and height of the crops
planted between the module rows. The no-module (control) configuration had no PV
modules above the ground.
Figure 2. PV module configurations at the agrivoltaic experimental farm.
The PV modules used in this research had a self-cleaning glass surface. Farming
equipment spreads dust, which causes soiling of the PV modules and affects the
electricity output. This dust diminishes the transmittance capacity of the transparent
collectors on the PV module surface. Therefore, periodic cleaning of the panels is
17
required to maintain optimum power output. The PV modules in this research, however,
could maintain clean surfaces without the need for frequent cleaning.
For this research, sweetcorn was planted on the experimental farm in early April
2018 and harvested in late July. Corn is a typical shade-intolerant crop and a major global
commodity. Corn has a growth period of approximately 90 days and grows up to a height
of 2 m. In each configuration, there were 25 corn stalks spaced 0.5 m apart (nine stalks
per 1 m2). The same soil, fertilizer, and water were used to grow all corn crops. After
harvesting, the weight, size, and market value of the reproductive part of the crop were
evaluated. The market value was calculated using the 5-year average of the market price
obtained by the Agriculture & Livestock Industries Corporation, a Japanese
governmental agency. The corn stover was dried to measure its biomass.
Sensitivity Analysis
This research evaluated the sensitivity of the corn yield per square meter with
respect to changes in the level of shading. If the biomass of corn plants grown in an
agrivoltaic farm is no less than 90% that of corn plants grown separately, the corn can be
said to grow well under the shade of agrivoltaic PV panels, as predicted by Nagashima
(2014). Thus, this research tested this hypothesis using equation 1. Here, BC(trad) is the
traditional amount of crop biomass (dry basis) per square meter without an agrivoltaic
installation, and BC is the amount of the crop biomass per square meter with agrivoltaic
intervention:
90% x BC(trad) =< BC (1)

18
Also, when the annual revenue from PV power generation and corn harvest in an
agrivoltaic farm is larger than that of a traditional corn field, equation 2 should be true,
where VC(trad) is the traditional value of the crop per square meter per year without an
agrivoltaic installation, VC is the revenue of the crop per square meter per year with
agrivoltaic intervention, and S is the solar revenue per square meter per year:
VC(trad) < (VC +S ) (2)
Results
To examine the corn production performance of the experimental agrivoltaic farm,
this research explored the sensitivity of corn yield per square meter to changes in shading
level.
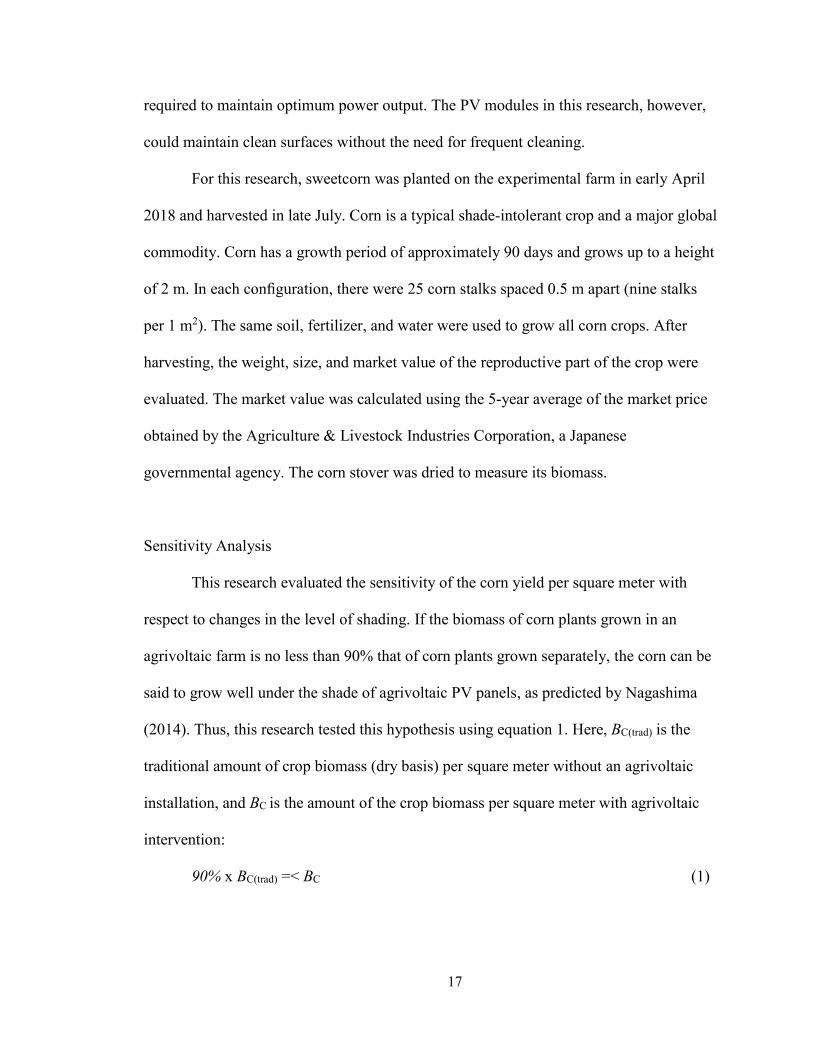
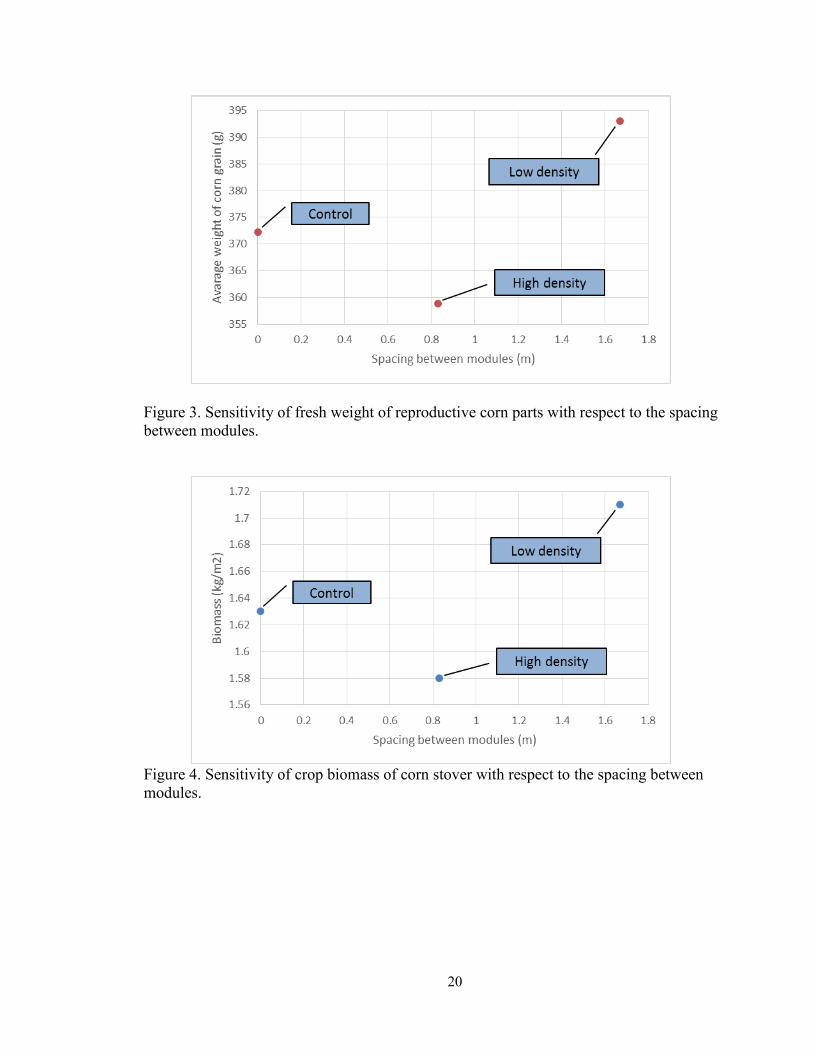
Corn Yield
The growth of corn planted under the PV modules was gauged in terms of the
fresh weight of corn crops as well as biomass of corn stover. As mentioned earlier, the
corn was planted in early April 2018 and harvested in late July. Surprisingly, the corn
yield of the low-density configuration was larger not only than that of the high-density
configuration, but also than that of the no-module control configuration (Table 3 and
Table 4). The relationship between the crop biomass per square meter in the low-density
configuration (Bc(low)) and the crop biomass per square meter without the agrivoltaic PV
modules (BC(trad)) is shown by the following equations:
BC(low) / BC(trad) = 1.049
∴ BC(trad) < BC(low) (3)

19
Table 3. Average fresh weight of corn crops grown in different configurations.
Configurations
Control Low-density High-density
Average fresh
weight (g) 372.2 393.0 358.8
Comparison with
Control 1 1.056 0.964
Table 4. Average biomass (dry basis) of corn stover grown in different configurations.
Configurations
Control Low-density High-density
Average biomass
(kg/m2) 1.63 1.71 1.58
Comparison with
Control 1 1.049 0.969
Similarly, the relationship between Bc(high), the crop biomass per square meter in
the high-density configuration, and BC(trad) is shown in the following equations:
BC(high) / BC(trad) = 0.969
∴ 90% x BC(trad) < BC(high) (4)
As shown in Figure 3 and Figure 4, the corn yield depends on the shading.
Shading affects the amount of incident solar irradiation, which in turn affects the yield
including the weight of crops and biomass of plants. The sensitivity of the corn yield can
be described as the change in fresh weight of reproductive parts and amount of biomass
(dry basis) of corn stover with respect to the spacing between modules.
The crop yield (Y) can be calculated by:
Y [kg/m2] = (W x d)/1000 (5)
where W is the average fresh weight of crops (g) and d is the number of plants per square
meter, which is nine in this study. Values of W for the control configuration, low-density
20
Figure 3. Sensitivity of fresh weight of reproductive corn parts with respect to the spacing
between modules.
Figure 4. Sensitivity of crop biomass of corn stover with respect to the spacing between
modules.

21
configuration, and high-density configuration are 372.2, 393.0, and 358.8, respectively,
which resulted in the low density configuration exhibiting the highest corn yield, as
shown in Table 5.
Table 5. Corn yields per square meter for different configurations.
Configurations
Control Low-density High-density
Corn yield (kg/m2) 3.35 3.54 3.23
Performance of the PV System
The monthly kWh output of the PV modules for different configurations is shown
in Table 6 and Table 7. Figure 5 reveals that the high-density configuration produced
Figure 5. Sensitivity of annual PV power output with respect to the spacing between
modules.
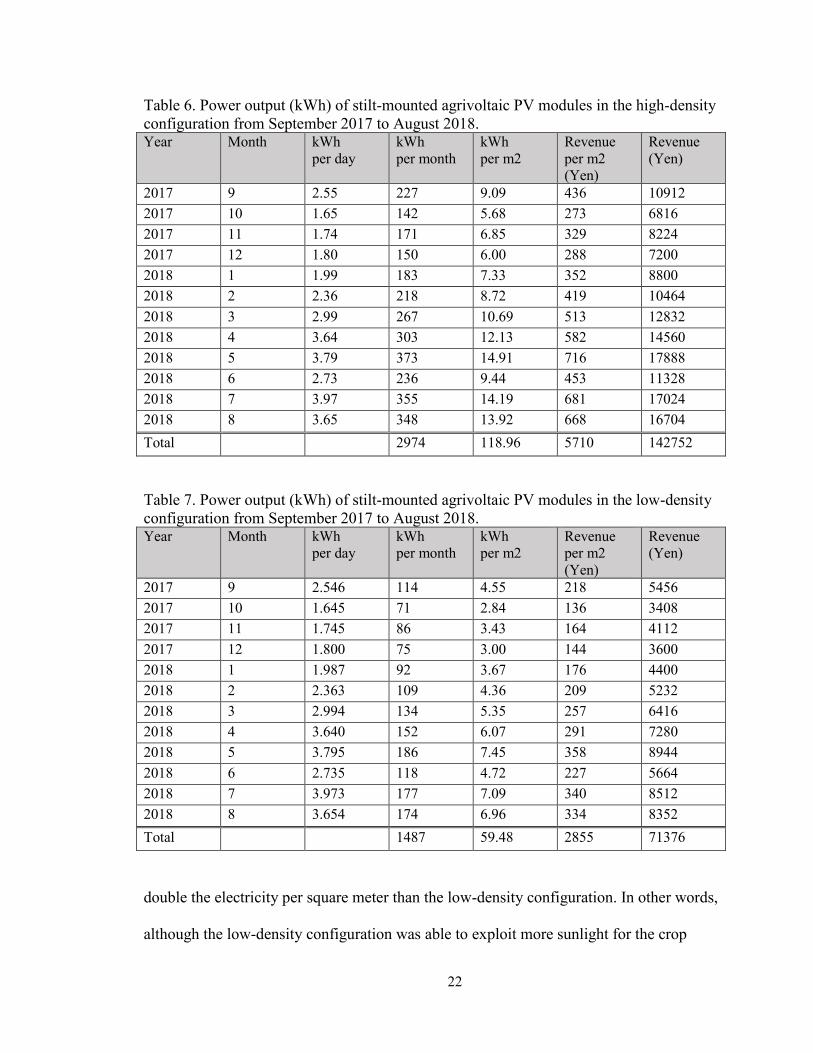
22
Table 6. Power output (kWh) of stilt-mounted agrivoltaic PV modules in the high-density
configuration from September 2017 to August 2018. Year Month kWh
per day
kWh
per month
kWh
per m2
Revenue
per m2
(Yen)
Revenue
(Yen)
2017 9 2.55 227 9.09 436 10912
2017 10 1.65 142 5.68 273 6816
2017 11 1.74 171 6.85 329 8224
2017 12 1.80 150 6.00 288 7200
2018 1 1.99 183 7.33 352 8800
2018 2 2.36 218 8.72 419 10464
2018 3 2.99 267 10.69 513 12832
2018 4 3.64 303 12.13 582 14560
2018 5 3.79 373 14.91 716 17888
2018 6 2.73 236 9.44 453 11328
2018 7 3.97 355 14.19 681 17024
2018 8 3.65 348 13.92 668 16704
Total 2974 118.96 5710 142752
Table 7. Power output (kWh) of stilt-mounted agrivoltaic PV modules in the low-density
configuration from September 2017 to August 2018. Year Month kWh
per day
kWh
per month
kWh
per m2
Revenue
per m2
(Yen)
Revenue
(Yen)
2017 9 2.546 114 4.55 218 5456
2017 10 1.645 71 2.84 136 3408
2017 11 1.745 86 3.43 164 4112
2017 12 1.800 75 3.00 144 3600
2018 1 1.987 92 3.67 176 4400
2018 2 2.363 109 4.36 209 5232
2018 3 2.994 134 5.35 257 6416
2018 4 3.640 152 6.07 291 7280
2018 5 3.795 186 7.45 358 8944
2018 6 2.735 118 4.72 227 5664
2018 7 3.973 177 7.09 340 8512
2018 8 3.654 174 6.96 334 8352
Total 1487 59.48 2855 71376
double the electricity per square meter than the low-density configuration. In other words,
although the low-density configuration was able to exploit more sunlight for the crop
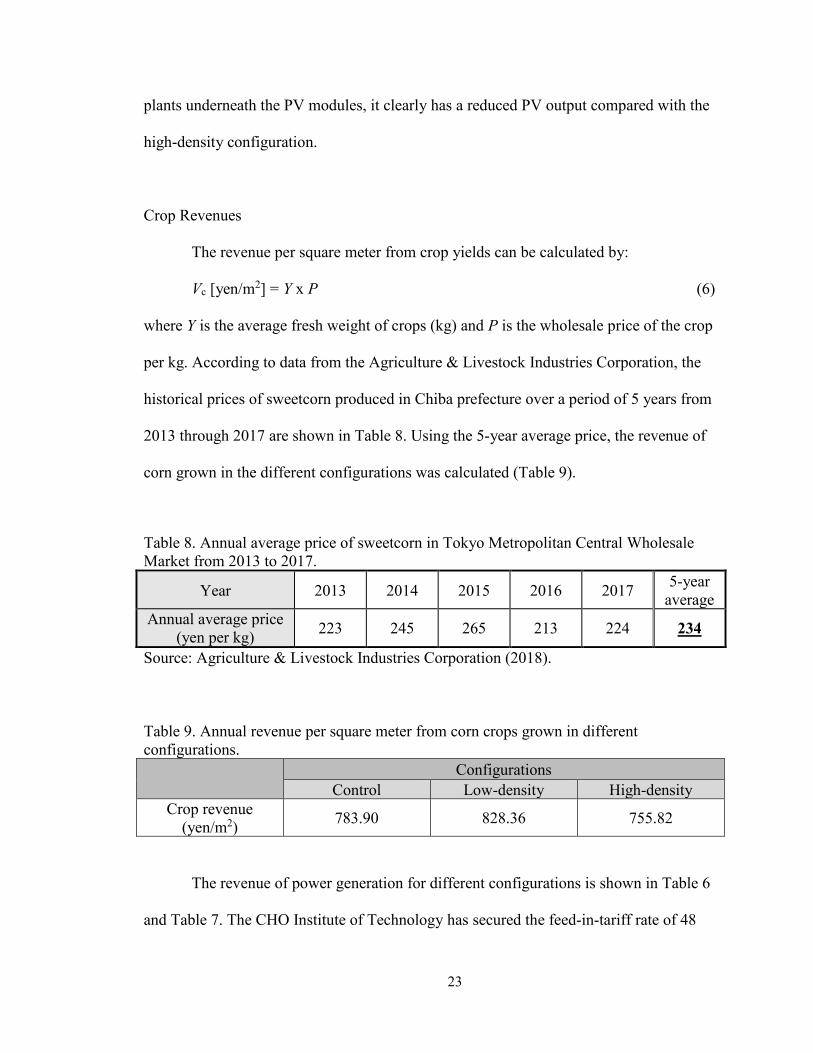
23
plants underneath the PV modules, it clearly has a reduced PV output compared with the
high-density configuration.
Crop Revenues
The revenue per square meter from crop yields can be calculated by:
Vc [yen/m2] = Y x P (6)
where Y is the average fresh weight of crops (kg) and P is the wholesale price of the crop
per kg. According to data from the Agriculture & Livestock Industries Corporation, the
historical prices of sweetcorn produced in Chiba prefecture over a period of 5 years from
2013 through 2017 are shown in Table 8. Using the 5-year average price, the revenue of
corn grown in the different configurations was calculated (Table 9).
Table 8. Annual average price of sweetcorn in Tokyo Metropolitan Central Wholesale
Market from 2013 to 2017.
Year 2013 2014 2015 2016 2017 5-year
average
Annual average price
(yen per kg) 223 245 265 213 224 234
Source: Agriculture & Livestock Industries Corporation (2018).
Table 9. Annual revenue per square meter from corn crops grown in different
configurations.
Configurations
Control Low-density High-density
Crop revenue
(yen/m2) 783.90 828.36 755.82
The revenue of power generation for different configurations is shown in Table 6
and Table 7. The CHO Institute of Technology has secured the feed-in-tariff rate of 48

24
yen (approximately 0.44 USD) per kWh for 20 years. The annual revenue per square
meter from PV power generation (S) can be calculated by:
S [yen/m2] = E x r (7)
where the annual power output per square meter of agrivoltaic PV modules is E (kWh)
and r is the feed-in-tariff rate. Utilizing the corresponding values for each configuration,
the annual revenue per square meter from PV power generation was 2855 JPY and 5710
JPY for the low-density and high-density configuration, respectively. Thus, the annual
total revenue per square meter from corn crops and PV power generation (Vc + S) can be
calculated as shown in Table 10.
Table 10. Annual total revenue per square meter from corn crops and PV in different
configurations.
Configurations
Control Low-density High-density
Total revenue
(yen/m2) 783.90 3683.36 6465.82
Therefore, if the annual revenues per square meter from corn crops in low-density
and high-density configurations are Vc(low) and Vc(high), respectively, and those from PV
power generation in low-density and high-density configurations are S(low) and S(high),
respectively, their relationship with the annual revenue per square meter without
agrivoltaic PV panels in the control configuration (Vc(trad)) can be described as:
Vc(trad) < Vc(low) + S(low) < Vc(high) + S(high) (8)
This relationship will not change even with lower fit-in-tariff rate. Although the
CHO Institute of Technology secured the feed-in-tariff rate of 48 yen per kWh in 2010,
the rate has nonetheless been declining (Figure 6).
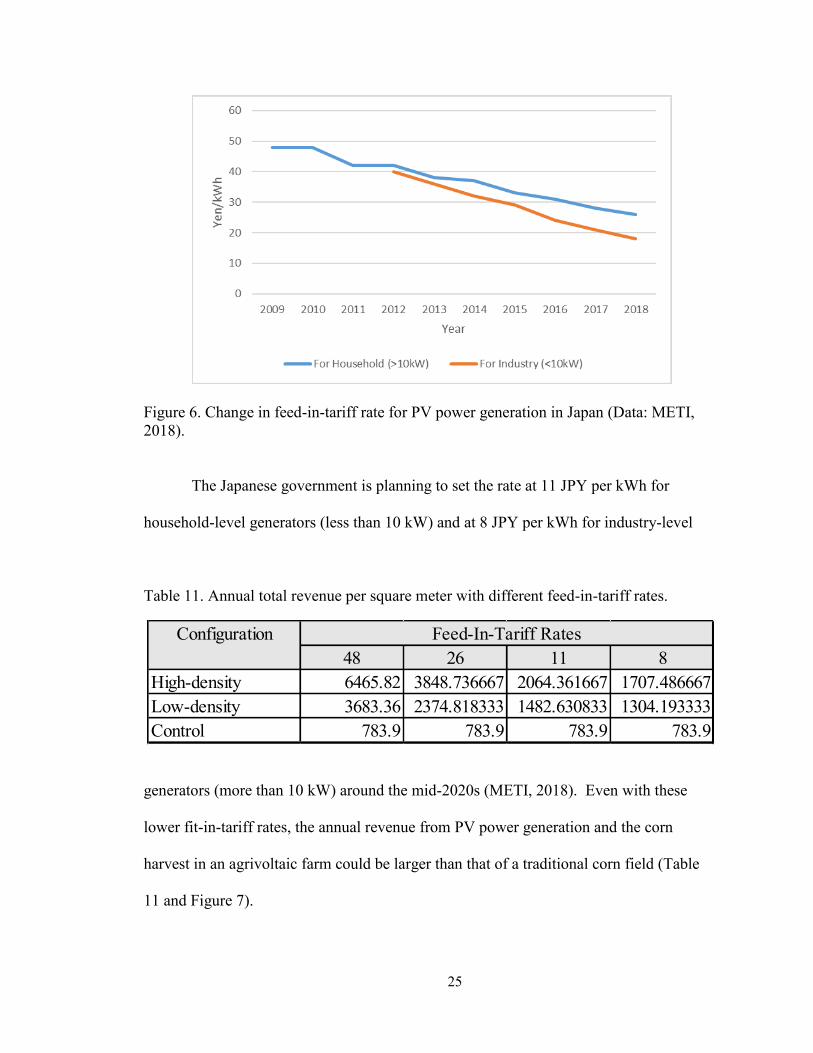
25
Figure 6. Change in feed-in-tariff rate for PV power generation in Japan (Data: METI,
2018).
The Japanese government is planning to set the rate at 11 JPY per kWh for
household-level generators (less than 10 kW) and at 8 JPY per kWh for industry-level
Table 11. Annual total revenue per square meter with different feed-in-tariff rates.
Configuration
48 26 11 8
High-density 6465.82 3848.736667 2064.361667 1707.486667
Low-density 3683.36 2374.818333 1482.630833 1304.193333
Control 783.9 783.9 783.9 783.9
Feed-In-Tariff Rates
generators (more than 10 kW) around the mid-2020s (METI, 2018). Even with these
lower fit-in-tariff rates, the annual revenue from PV power generation and the corn
harvest in an agrivoltaic farm could be larger than that of a traditional corn field (Table
11 and Figure 7).

26
Figure 7. Sensitivity of annual total revenue per square meter to changes in the feed-in-
tariff rate.
Discussion
This case study showed that it is possible to grow corn, a typical shade-intolerant
crop, under the shade of agrivoltaic PV panels. The biomass of corn stover grown under
PV module arrays spaced at 0.71 m intervals was no less than 96.9% that of corn without
PV modules. Furthermore, the biomass of corn stover grown under PV module arrays
spaced at 1.67 m intervals was even greater than that of corn without PV modules by
4.9%. In fact, the corn yield per square meter of the low-density configuration was 3.54
kg, which was larger not only than that of the high-density configuration, but also than
that of the no-module control configuration by 5.6%.
This study also indicated that the annual revenue from PV power generation and
the corn harvest in an agrivoltaic farm could be larger than that of a traditional corn field.
Actually, the total revenue of the high-density configuration was 8.3 times larger than

27
that of the control configuration, whereas that of the low-density configuration was 4.7
times larger.
Possible Reasons for High Crop Yield
This result implies that not only shade-tolerant crops but also shade-intolerant
crops can achieve high yields, despite growing under the shaded area created by
agrivoltaic PV panels. Several factors may explain why incorporating PV panels into
agriculture can be beneficial for crops. First, the light saturation point of each crop seems
to be a key concept. Actually, only a small fraction of the incident sunlight is required for
plants to reach their maximum rate of photosynthesis. As light intensity increases, a level
is eventually reached where light is no longer the factor limiting the overall rate of
photosynthesis. Just as a sponge becomes saturated with water, increasing the light no
longer boosts photosynthesis after the light saturation point (Table 12).
Second, too much sunlight hinders crop growth. Daily exposure to harsh
ultraviolet radiation can cause serious damage to plant DNA. In fact, plants have evolved
mechanisms to protect themselves from sun damage; they produce special molecules and
send them to the outer layer of their leaves to protect themselves. These molecules, called
sinapate esters, block ultraviolet-B radiation from penetrating deeper into leaves (Dean,
et al., 2014).
Third, the shading caused by the PV panels reduces water evaporation. This is
beneficial, especially in the hot and dry season. It has been observed that shading results
in water savings of 14–29% depending on the level of shade (Marrou, Dufour & Wery,
2013). Also, PV panels reduce the diurnal variations in crop and soil temperatures, while

28
daily air temperature and vapor pressure deficit remain constant, even for the area located
under the panels (Marrow et al., 2013). PV modules also alleviate soil erosion by
reducing moisture evaporation (Wu et al., 2014).
Table 12. Light saturation points of selected crops (Solar Sharing Network, 2018a).
Crops Light Saturation
Points (KLX)
Crops Light Saturation
Points (KLX)
Corn 80–90 Rice 40–45
Water melon 80–90 Carrot 40
Tomato 80 Turnip 40
Taro 80 Sweet potato 30
Cucumber 55 Lettuce 25
Pumpkin 45 Green pepper 20–30
Blueberry 45 Spring onion 25
Cabbage 45 Mushroom >20
Financial Feasibility of Agrivoltaic Systems
This research indicated that the annual total revenue from an agrivoltaic farm
could be larger than its respective monosystem, not only for a high feed-in-tariff rate but
also with lower rates. The question remains, however, whether the revenue from
agrivoltaic systems can equal the investment costs. In this chapter, the installation costs
of the agrivoltaic system were not considered. The costs of PV systems, however, vary
significantly among countries and even within a country because they are largely
determined by local resource availability. Although there are some reports that the
installation of agrivoltaic system can be financially feasible in Japan, it is important to
confirm the financial feasibility of the system in this specific case study. Thus, Chapter
29
III presents a cost-benefit analysis to explore the financial feasibility of the agrivoltaic
system at the experimental farm.

30
Chapter III
Financial Feasibility of an Agrivoltaic System in Japan
In this chapter, a cost-benefit analysis is conducted to explore the financial
feasibility of an agrivoltaic system at the experimental farm of the CHO Institute of
Technology in Japan (latitude: 35.378929, longitude: 140.138549). Chapter II indicated
that the annual total revenue from the agrivoltaic farm could be larger than that of its
monosystem equivalent. The question remains however whether agrivoltaic system
revenue can exceed the investment. While the price of PV modules has been reduced due
to technological advances and the scale of the economy, prices for complete PV systems
vary more widely than those for PV modules. Soft costs such as different supply chains,
local regulatory requirements, labor and permitting costs, and different financing
mechanisms lead to wide regional differences. As a result, the installation costs of PV
systems vary significantly among and even within countries. Thus, to boost the global
adoption of agrivoltaic systems, it is necessary to study their financial feasibility in many
different countries. In light of their relatively high installation costs, it is particularly
important to examine the feasibility of agrivoltaic systems in Japan.
Methods
A cost-benefit analysis was conducted for agrivoltaic systems over 10-year and
20-year periods after the initial investment. The agrivoltaic system of the experimental
farm consisted of 72 PV modules (1354 mm x 345 mm) mounted at a height of 2.7 m and
31
tilted at an angle of 30°. The area underneath the stilts could still be used for agriculture
and was large enough to accommodate farming equipment.
Electricity Generation
The experimental farm had three sub-configurations: no modules (control), low
module density, and high module density. In the high-density configuration, there were
eight PV module arrays (48 modules) spaced at 0.71 m intervals. In the low-density
configuration, there were four PV module arrays (24 modules) spaced at 1.67 m intervals.
Both stilt-mounted PV panel configurations casted shade on the crop below, whereas the
no-module (control) configuration had no PV modules above the ground.
The total output capacity of the PV system was 4.5 kW. The CHO Institute of
Technology secured a feed-in-tariff rate of 48 JPY (approximately 0.44 USD) per kWh
for 20 years. The installation cost of the high-density configuration agrivoltaic system
was 1.35 million JPY (approximately 12,300 USD) and that of the low-density
configuration was 720,000 JPY (approximately 6,500 USD).
Crop Production
For this research, sweetcorn was planted on the experimental farm in early April
2018 and harvested in late July of the same year. Corn is a typical shade-intolerant crop
and a major global commodity. Corn has a growth period of approximately 90 days and
grows up to a height of 2 m. In each configuration, there were 25 corn stalks spaced 0.5
m apart (nine stalks per 1 m2). The same soil, fertilizer, and water were used to grow all
crops. The shading from the PV module varied according to the time of year and the

32
height of crops planted between the module rows. The market value of the corn was
calculated using the 5-year average of the market price obtained from the Agriculture &
Livestock Industries Corporation, a Japanese governmental agency.
Assumptions
The cost-benefit analysis of the financial feasibility of the agrivoltaic system
assumed a discount rate of 0.1% (the interest rate of a 10-year Japanese government bond
as of October 2018) and a 1% interest (the long-term prime rate in Japan as of October
2018) loan of 100% debt. The revenue from PV power generation was assumed to be
constant and set based on the actual value at the experimental farm from September 2017
through August 2018. That is, the revenue was assumed to be 142,752 JPY for the high-
density configuration and 71,376 JPY for the low-density configuration (Table 1 and
Table 2).
The profitability of the agrivoltaic system at the experimental farm was expressed
as a cost benefit ratio (CBR). CBR is the ratio of the monetary benefits of a project
relative to the costs required to carry out the project. When the CBR of the system is
larger than 1, the system is said to be financially feasible. All benefits and costs are
expressed in discounted current values. CBR can be obtained by the following equation,
where C is the discounted cost of the system and R is the discounted revenue from PV
power generation:
CBR = R/C (9)

33
Results
The result of the estimation showed that it would take almost ten years or more
before the investment in agrivoltaic systems equaled the revenue in this case (Table 13
and Table 14). The discounted revenues from PV power generation were almost the same
as the discounted cost of the system in this case study. For the low-density configuration
containing four PV module arrays, the discounted revenues from PV power generation
was less than the discounted costs. The 10-year cost benefit ratio of the low-density
configuration was 0.94, while that of the high-density configuration containing eight PV
module arrays was 1.00.
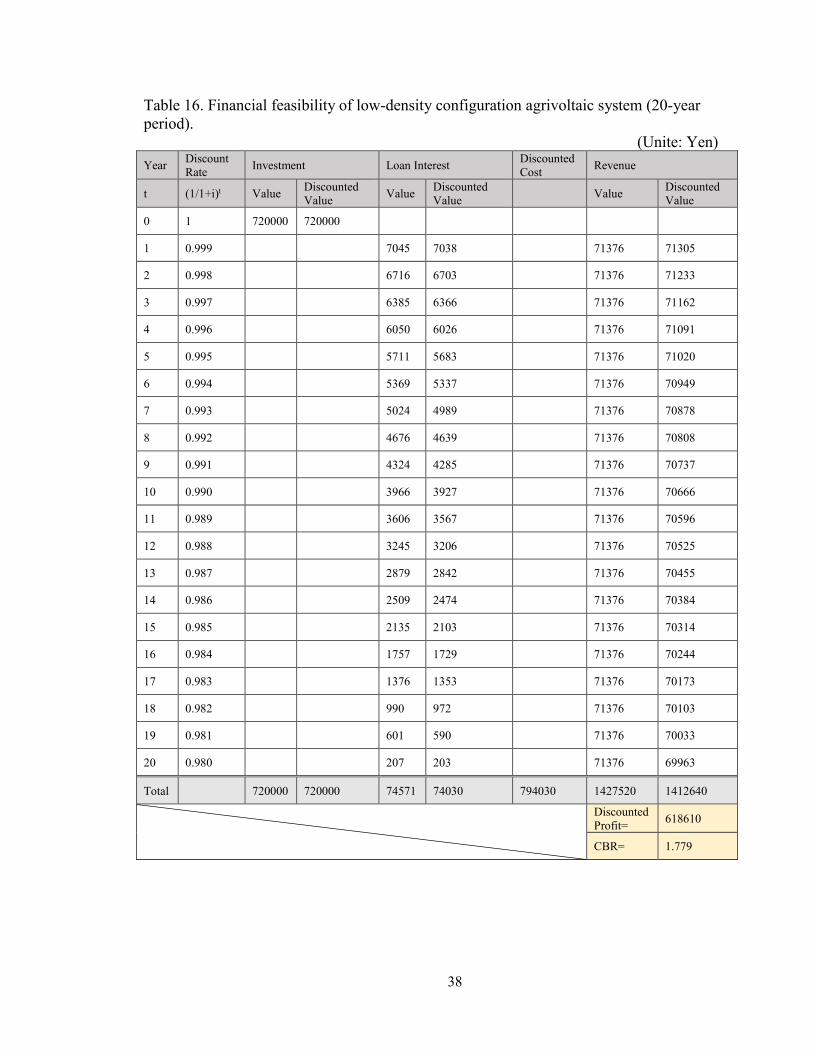
However, the cost-benefit analysis for the 20-year period indicated that
investment in agrivoltaic systems would be profitable (Table 15 and Table 16). In this
case study, the cost benefit ratios of the high-density and low-density configurations for
the 20-year period were 1.90 and 1.78, respectively. This means that the discounted
revenues from PV power generation and corn production would be almost twice the
discounted cost of the system for both configurations.
Discussion
The cost benefit analysis indicates that it can be financially feasible to adopt stilt-
mounted agrivoltaic systems in this case study. As seen in Table 3, the discounted
revenue (R) from PV power generation for the high-density configuration over a 20-year
period was 2,825,281 JPY, and the discounted cost (C) was 1,488,930 JPY. Thus, the
discounted profit (R – C) from PV power generation for the high-density configuration
was 1,336,351 JPY for a 20-year period. As the area of this configuration was 50 m2, the

34
discounted annual profit per square meter from PV power generation would be 26,727
JPY. The annual revenue per square meter from corn crops was 6465.82 JPY (Table 10);
thus, the annual profit per square meter from PV power generation was 35 times more
than that from corn production. Similarly, because the discounted revenue from PV
power generation for the low-density configuration over a 20-year period was 1,412,640
JPY and the discounted cost was 794,030 JPY (Table 6 and 7), the discounted annual
profit per square meter from PV power generation was 12,372 JPY, which was 15 times
the annual revenue per square meter from corn crops.
These results indicate that a good return would likely be obtained on investment
in agrivoltaic systems within 20 years under the assumptions of this case study, although
it would take almost 10 years or more to break even. As the service life of PV modules is
typically at least 20 years, it is rational to examine the financial feasibility of an
agrivoltaic system for a 20-year period. If the installation costs of stilt-mounted PV
modules are further reduced, agrivoltaic systems would become an attractive investment
for more farmers.
However, it should be noted that these results were obtained for a feed-in-tariff
rate of 48 JPY per kWh. Yet, as seen from Figure 6, the feed-in-tariff for PV power
generation has been continuously declining. Although the CHO Institute of Technology
secured the feed-in-tariff rate of 48 JPY per kWh in 2010, the Japanese government is
planning to set the rate at 11 JPY per kWh for household-level generators (less than 10
kW) and 8 JPY per kWh for industry-level generators (more than 10 kW) around the
mid-2020s. Therefore, it might become difficult to make a profit with low feed-in-tariff
rates when the installation costs are considered. Thus, the key to future financial

35
feasibility of stilt-mounted agrivoltaic systems would be a reduction in the installation
costs, which is largely influenced by wide regional differences of soft costs such as
different supply chains, local regulatory requirements, labor and permit costs, and
different financing mechanisms. In other words, the feed-in-tariff rate should not be
lowered without also reducing the installation costs.
Table 13. Financial feasibility of high-density configuration agrivoltaic system (10-year
period).
(Unite: Yen)
Year Discount
Rate Investment Loan Interest
Discounted
Cost Revenue
t (1/1+i)t Value Discounted
Value Value
Discounted
Value Value
Discounted
Value
0 1 1350000 1350000
1 0.999 12906 12893 142752 142609
2 0.998 11610 11587 142752 142467
3 0.997 10298 10267 142752 142325
4 0.996 8976 8940 142752 142182
5 0.995 7640 7602 142752 142040
6 0.994 6293 6255 142752 141898
7 0.993 4931 4897 142752 141757
8 0.992 3554 3526 142752 141615
9 0.991 2165 2146 142752 141474
10 0.990 759 751 142752 141332
Total 1350000 1350000 69132 68864 1418864 1427520 1419700
Discounted
Profit= 836
CBR= 1.001

36
Table 14. Financial feasibility of low-density configuration agrivoltaic system (10-year
period).
(Unite: Yen)
Year Discount
Rate Investment Loan Interest
Discounted
Cost Revenue
t (1/1+i)t Value Discounted
Value Value
Discounted
Value Value
Discounted
Value
0 1.000 720000 720000
1 0.999 6880 6873 71376 71305
2 0.998 6188 6176 71376 71233
3 0.997 5490 5474 71376 71162
4 0.996 4784 4765 71376 71091
5 0.995 4074 4054 71376 71020
6 0.994 3354 3334 71376 70949
7 0.993 2626 2608 71376 70878
8 0.992 1893 1878 71376 70808
9 0.991 1151 1141 71376 70737
10 0.990 402 398 71376 70666
Total 720000 720000 36842 36699 756699 713760 709850
Discounted
Profit= -46849
CBR= 0.938

37
Table 15. Financial feasibility of high-density configuration agrivoltaic system (20-year
period).
(Unite: Yen)
Year Discount
Rate Investment Loan Interest
Discounted
Cost Revenue
t (1/1+i)t Value Discounted
Value Value
Discounted
Value Value
Discounted
Value
0 1 1350000 1350000
1 0.999 13215 13202 142752 142609
2 0.998 12597 12572 142752 142467
3 0.997 11977 11941 142752 142325
4 0.996 11349 11304 142752 142182
5 0.995 10713 10660 142752 142040
6 0.994 10074 10014 142752 141898
7 0.993 9426 9360 142752 141757
8 0.992 8772 8702 142752 141615
9 0.991 8112 8039 142752 141474
10 0.990 7444 7370 142752 141332
11 0.989 6771 6697 142752 141191
12 0.988 6090 6017 142752 141050
13 0.987 5405 5335 142752 140909
14 0.986 4710 4645 142752 140768
15 0.985 4009 3949 142752 140628
16 0.984 3301 3249 142752 140487
17 0.983 2586 2542 142752 140347
18 0.982 1865 1832 142752 140207
19 0.981 1133 1112 142752 140067
20 0.980 396 388 142752 139927
Total 1350000 1350000 139945 138930 1488930 2855040 2825281
Discounted
Profit= 1336351
CBR= 1.898
38
Table 16. Financial feasibility of low-density configuration agrivoltaic system (20-year
period).
(Unite: Yen)
Year Discount
Rate Investment Loan Interest
Discounted
Cost Revenue
t (1/1+i)t Value Discounted
Value Value
Discounted
Value Value
Discounted
Value
0 1 720000 720000
1 0.999 7045 7038 71376 71305
2 0.998 6716 6703 71376 71233
3 0.997 6385 6366 71376 71162
4 0.996 6050 6026 71376 71091
5 0.995 5711 5683 71376 71020
6 0.994 5369 5337 71376 70949
7 0.993 5024 4989 71376 70878
8 0.992 4676 4639 71376 70808
9 0.991 4324 4285 71376 70737
10 0.990 3966 3927 71376 70666
11 0.989 3606 3567 71376 70596
12 0.988 3245 3206 71376 70525
13 0.987 2879 2842 71376 70455
14 0.986 2509 2474 71376 70384
15 0.985 2135 2103 71376 70314
16 0.984 1757 1729 71376 70244
17 0.983 1376 1353 71376 70173
18 0.982 990 972 71376 70103
19 0.981 601 590 71376 70033
20 0.980 207 203 71376 69963
Total 720000 720000 74571 74030 794030 1427520 1412640
Discounted
Profit= 618610
CBR= 1.779
39
Chapter IV
Discussion
This research has shown that stilt-mounted agrivoltaic systems could mitigate the
trade-off between crop production and clean energy generation, even when applied to
shade-intolerant crops.
Summary of Sensitivity Analysis
Chapter II showed that it could be possible to grow corn, a typical shade-
intolerant crop, even under the shade of agrivoltaic PV panels. The biomass of corn
stover grown under PV module arrays spaced at 0.71 m intervals was no less than 96.9%
of that of corn without PV modules. Furthermore, the biomass of corn stover grown
under PV module arrays spaced at 1.67 m intervals was even greater than that of corn
without PV modules by 4.9%. In fact, the corn yield per square meter of the low-density
configuration was 3.54 kg, which was larger not only than that of the high-density
configuration, but also than that of the no-module control configuration by 5.6%.
Chapter II also indicated that an increase in the overall productivity of land could
be achieved even with crops that require plenty of sunlight. Annual revenue from PV
power generation and the corn harvest in an agrivoltaic farm could be larger than that of a
traditional corn field. In fact, the total revenue of the high-density configuration was 8.3
times larger than that of the control configuration, while the total revenue of the low-
density configuration was 4.7 times larger.

40
Summary of Cost-Benefit Analysis
According to the cost-benefit analysis in Chapter III, a good return should be
obtained on investment in agrivoltaic systems within 20 years under the assumptions of
this case study. Although it would take almost ten years or more before the investment in
agrivoltaic systems broke even in this case, the cost-benefit ratios of the high-density and
low-density configurations over a 20-year period were 1.90 and 1.78, respectively. This
indicates that it could be financially feasible to adopt stilt-mounted agrivoltaic systems in
Japan.
The key to financial feasibility of stilt-mounted agrivoltaic systems in Japan
seems to be a reduction in the installation costs. The generous feed-in-tariff of 48 JPY per
kWh enabled a good return on investment in this case study; however, the planned lower
rates of 11 JPY per kWh and 8 JPY per kWh for household-level and industry-level
generators by the mid-2020s would result in greater difficulty making a profit unless the
installation costs also declined. Thus, the feed-in-tariff rates should not be lowered
without also reducing the installation costs.
Even without a full life cycle analysis, the results from the cost-benefit analysis in
Chapter III indicate that agrivoltaic systems could be profitable for conventional farmers.
As population and energy use continue to increase, more efficient land use might become
possible in the future.

41
Conclusions
Stilt-mounted agrivoltaic systems could reduce tensions between limited land
resources and increasing demands for food and clean energy. In Japan, for example, it
might be possible to supply the entire country’s electricity with agrivoltaic systems. In
this research, the low-density configuration with 1354 mm x 345 mm PV module arrays
spaced at 1.67 m intervals generated 59.48 kWh per square meter per year. The
relationship between the amount of the country’s electricity demand, D, the annual
energy production per m2 of an agrivoltaic system, e, and the area of land necessary to
generate D, L, is shown in equation (10).
L = D / e
= 797.1 billion kWh / 59.48 kWh per m2
≒13 billion m2
= 1.3 million ha (10)
With Japan’s annual electricity demand of 797.1 billion kWh as of 2015 (Federation of
Electric Power Companies of Japan, 2016), L is 1.3 million ha. Thus, just 30% of farm
land (or 4.4 million ha, MAFF, 2018b) adopting the same low-density stilt-mounted
agrivoltaic modules would meet the country’s electricity demand.
Although existing studies have reported that agrivoltaics work well only for
shade-tolerant crops, this research showed that even corn, a typical shade-intolerant crop,
could grow well under the shade of agrivoltaic PV panels. This implies that stilt-mounted
agrivoltaic systems could be applicable a wider range of commercially important crops. If
so, the practical availability of stilt-mounted agrivoltaic systems would be highly
promising. This research should encourage more conventional farmers, clean energy

42
producers, and policy makers to consider adopting stilt-mounted agrivoltaic systems.
Particularly in densely populated regions, mountainous areas, and small inhabited islands,
where land resources are relatively scarce, this system could simultaneously take
advantage of limited land resources for both food and clean energy production.
It would be an exaggeration to claim that agrivoltaic systems could drive out other
energy sources, but it is true that this system offers important advantages over fossil fuels
as well as traditional PV systems. Solar power is a sustainable source of energy because it
will be available as long as the sun exists, is free of charge, and emits no pollutants or
gases. Thus, PV power generation may be one of the most promising ways to generate
electricity from renewable energy sources. Limitations related to installation area are one
disadvantage of traditional PV power generation. This is less important for households,
where PV modules installed on rooftops can generate sufficient electricity, but industry
requires a huge area for PV power plants to provide a sufficient and constant electricity
supply. As this research demonstrates, agrivoltaic systems can help to overcome the
problem of limited land resources, negating this disadvantage of PV power generation.
Nevertheless, there are some disadvantages of agrivoltaic systems. Similar to
traditional PV power generation, agrivoltaics cannot reliably generate constant energy;
the system cannot adequately function if sunlight is not available during the night or on
cloudy days. Thus, it is difficult to rely on agrivoltaic systems as a main power source
even if the total generation capacity is large enough to meet the country’s electricity
demand. The key to solving this is employing battery backup systems that can store
electricity for use when sunlight is not available. Another issue affecting the expansion of
PV generation, including agrivoltaics, is PV panel recycling. Although PV power

43
generation itself does not cause pollution, disposing of PV panels may have serious
impacts on the environment. The impact could be particularly serious if agrivoltaic
systems are adopted by large areas of farmland, resulting in huge volumes of PV panels
requiring disposal. Thus, it is necessary to develop effective methods for recycling large
volumes of PV panels whilst also promoting agrivoltaic systems.
Future Work
This research expanded the potential applications of agrivoltaic systems to shade-
intolerant crops, but many crops have still not been evaluated for agrivoltaic applications.
Future work is necessary to extend its use to shade-intolerant plants other than corn
including water melon, tomato, cucumber, pumpkin, cabbage, turnip, and rice. However,
information on the shade tolerance of crops remains limited. Therefore, as Dinesh and
Pearce (2016) reported, it is important to study the morphological traits of such crops to
understand their behavior and light requirement patterns during different life stages from
germination to harvest. Many different factors; i.e., radiation interception efficiency, light
saturation point, damage from ultraviolet radiation, water evaporation, and crop
temperature potentially affect the shade tolerance of crops.
It should also be noted that this research only employed a limited number of
samples. The case study was conducted at a small 100 m2 experimental farm with three
configurations and only dozens of corn stalks in each configuration. Whilst this case
study showed that corn could grow well even under the shade of agrivoltaic PV panels, it
is necessary to verify the reliability of these results with a larger sample size in future
research. In addition, more studies on the financial feasibility of agrivoltaic systems

44
should be conducted. The case of this study obtained a good return on the investment in
agrivoltaic system, however, it would be worthwhile examining the financial feasibility
of the system under many different assumptions with different installation cost and feed-
in-tariff rates.
Furthermore, more advanced PV systems could be designed to improve the
efficiency of electricity generation and reduce the impact on agricultural yields. For
example, PV module tilt can be adjusted to enhance the power generation efficiency. One
proposal involves an agrivoltaic system equipped with a programmed microcomputer and
a motor that automatically adjusts the tilt to be perpendicular to the sun as it moves from
east to west (Nagashima, 2015), solving the issue of fixed PV panels not fully converting
solar energy to electricity. This problem can be solved by arranging PV panels to track
the Sun. The proposed system may equip a programmed microcomputer and a motor that
maintains the tilting of PV panels almost perpendicular to the Sun. In this way maximum
sun light is incident on the panel at any time of the day so that the power generation
efficiency can be improved. Additionally, bifacial PV panels could increase the
electricity production per square meter of the PV module through the use of light
absorption from the albedo (Guerrero-Lemus et al., 2016). Other ideas have been
proposed to enhance crop productivity. Semi-transparent PV panels, which combine the
benefits of visible light transparency and light-to-electricity conversion, could reduce
shading on crops under agrivoltaic systems. In fact, semi-transparent PV panels have
already been developed for greenhouse roof applications (Yano, Onoe & Nakata, 2014).
PV panels with mirrored backings might also increase the availability of sunlight for

45
crops by multiplying the reflection of incoming light to the ground. Further research is
required to couple new PV panel technology to agrivoltaic systems.
Another area of research is the development of suitable PV modules for
agrivoltaic systems. PV modules should be lightweight because they are mounted in high
locations. The modules also need to be small to reduce the shadows cast on the ground as
well as the influence of wind. As the output of modules for home use has been increasing,
larger modules are becoming more popular; however, major manufacturers have not yet
marketed modules of a suitable size and output for agrivlotaic systems. Also, the effect of
dust spread by agricultural activity onto the PV panel surface on the power output of the
system should be considered. Instead of periodically cleaning the PV modules, it could be
possible to maintain optimum electricity output with a hydrophilic coating on the PV
panel surface.
Future work is also necessary to explore the potential of PV greenhouses.
Previous farm experiments, including this research, have focused on agrivoltaic systems
consisting of stilt-mounted PV modules installed above the crops. The use of PV for
greenhouses, however, would be a good solution to the land resource competition
between agriculture and PV power generation because the greenhouse allows continuous
food production and electricity generation throughout the year. In fact, a Japanese
agricultural corporation produces tomato, another typical shade-intolerant crop, in their
PV greenhouse (Solar Sharing Network, 2018c) that has a cultivated area of 515 m2 on
the ground and 84 100-w solar panels on the roof. Their annual crop yields of tomato are
approximately 3,300 kg, which is worth around 2 million JPY. The electricity generated
on the roof is used for air-conditioning in the greenhouse, and the excess electricity is
46
sold to the local electric power company for approximately 170, 000 JPY per year. By
referring to such examples, the optimum design and performance of PV greenhouses
should be evaluated further.
Further Solar-Sharing Potential with Stilt-mounted PV Modules
As PV power stations continue to enjoy remarkable growth, a contradiction has
gradually come to light. Now, the occupation of vast amounts of land for solar farms is
becoming a problem. PV power generation began with panel installation on roofs and
was followed by mega solar power plants built on old factory sites and barren and unused
land. Presently, vast forests are sometimes cut down to construct solar power plants.
Although solar power is a promising renewable energy source, it should not involve
destruction of the environment.
Stilt-mounted PV modules installed at moderate intervals may be an effective way
to achieve coexistence of PV power generation and environmental sustainability. Possible
applications of stilt-mounted PV modules are not limited to agriculture; they can be
installed in any location where other commercial activities are run simultaneously. One
example is the livestock industry. If a large-scale stilt-mounted PV system is built on
pasture land, the land can generate energy and livestock products at the same time
without destroying the environment. As this research shows, PV panels can promote plant
growth by moderating excessive sunlight and reducing water evaporation. Thus, stilt-
mounted PV modules could maintain grazing land and livestock in desert areas that
would otherwise suffer from severe sunlight and water evaporation.

47
Furthermore, the idea of stilt-mounted PV modules can be applied to the water
surface. Some companies have been developing floating PV systems on large bodies of
water such as inshore and offshore waters, drinking water reservoirs, quarry lakes,
irrigation canals, and hydroelectric dam reservoirs (Ciel & Terra, 2018; Oceans of Energy,
2018). Vast PV modules on the water surface, however, block sunlight into water and
affect the activity of aquatic plants and animals. If a floating stilt-mounted PV system is
adopted, it can not only decrease the influence on aquatic plants and animals, but also
enable the use of space between PV modules and the water surface for fisheries and
aquaculture.
Akira Nagashima, who invented the stilt-mounted agrivoltaic system, said the
following: “Rather than using all of the sunlight pouring on a land for power generation,
it is important for a sustainable society to share it with many different creatures. That is
the philosophy of Solar-Sharing” (Nagashima, 2015). Although the stilt-mounted PV
system was originally developed to generate electricity from incoming sunlight on
farmland, this system may also be an effective way to produce sustainable energy without
devastating the environment. This system enables people to generate electricity on
farmland, pasture land, water surfaces, roads, and anywhere people, animals, and plants
are living. Moreover, even barren deserts can be changed into habitable lands where
people can produce food and energy simultaneously with a system consisted of tilt-
mounted PV modules installed at moderate intervals.

48
References
Agriculture & Livestock Industries Corporation (2018). Vegitable Total and Aggregate
Information Network. Retrieved October 6, 2018, from
https://vegetan.alic.go.jp/sch7.do.
Ciel & Terra. (2018). Simple, Durable and Affordable Floating Solar PV Platforms.
Retrieved November 22, 2018, from https://www.ciel-et-terre.net/hydrelio-
floating-solar-system-benefits/.
Cossu, M., Murgia, L., Ledda, L., Deligios, P.A., Sirigu, A., & Chessa, (2014). F. Solar
radiation distribution inside a greenhouse with south-oriented photovoltaic roofs
and effects on crop productivity. Applied Energy,133, 89–100.
Dean, C. D., Kusaka, R., Walsh, P. S., Allais, F., & Zwier, T. S. (2014). Plant Sunscreens
in the UV-B: Ultraviolet Spectroscopy of Jet-Cooled Sinapoyl Malate, Sinapic Acid,
and Sinapate Ester Derivatives. Journal of the American Chemical Society, 136
(42), 14780-14795.
Dinesh, H., & Pearce, J.M. (2016). The potential of agrivoltaic systems. Renewable and
Sustainable Energy Reviews, 54, 299–308.
Dupraz, C., Marrou, H., Talbot, G., Dufour, L., Nogier, A., & Ferard, Y. (2011).
Combining solar photovoltaic panels and food crops for optimising land use:
Towards new agrivoltaic schemes. Renewable Energy, 36(10), 2725-2732.
Fraunhofer Institute for Solar Energy Systems. (2015). Current and Future Cost of
Photovoltaics—Long-term Scenarios for Market Development, System Prices and
LCOE of Utility-Scale PV Systems. Retrieved July 9, 2017, from
https://www.agora-energiewende.de/fileadmin/Projekte/2014/Kosten-Photovoltaik-
2050/AgoraEnergiewende_Current_and_Future_Cost_of_PV_Feb2015_web.pdf.
Federation of Electric Power Companies of Japan. (2016). Electricity Demand in Fiscal
2015 (Confirmed Report). Retrieved November 9, 2018, from
file:///C:/Users/takas/AppData/Local/Microsoft/Windows/INetCache/IE/IGZ49KT
R/juyou_k_e_fy2015.pdf.
Fthenakis, V., & Kim, H. C. (2009). Land use and electricity generation: A life-cycle
analysis. Renewable and Sustainable Energy Reviews, 13(6–7), 1465-1474.
Goetzberger, A, & Zastrow, A. (1982). On the coexistence of solar-energy conversion
and plant cultivation. International Journal of Solar Energy, 1(1), 55-69.

49
Guerrero-Lemus, R., Vega, R., Kim, T., Kimm, A., & Shephard, L.E. (2016). Bifacial
solar photovoltaics – A technology review. Renewable and Sustainable Energy
Reviews, 60, 1533-1549.
Ho, M. (2013). Japanese Farmers Producing Crops and Solar Energy Simultaneously.
Science in Society. Retrieved October 9, 2018, from http://www.i-
sis.org.uk/Japanese_Farmers_Producing_Crops_and_Solar_Energy.php.
International Energy Agency (IEA). (2014). Technology Roadmap: Solar Photovoltaic
Energy, 2014 edition. Paris: IEA.
-----. (2015). Projected Costs of Generating Electricity 2015 Edition. Paris: IEA.
-----. (2018a). Snapshot of Global Photovoltaic Markets 2018. Paris: IEA.
-----. (2018b). United States: Electricity and Heat for 2015. Retrieved July 1, 2018, from
http://www.iea.org/statistics/statisticssearch/report/?country=USA&product=electri
cityandheat&year=2015.
Japanese Ministry of Agriculture, Forestry and Fisheries (MAFF). (2018a). Einougata
hatsuden setsubi no secchi ni kakaru kyoka jisseki. Retrieved November 15, 2018,
from http://www.maff.go.jp/j/shokusan/renewable/energy/einou.html.
-----. (2018b). Nochi ni kansuru toukei. Retrieved November 15, 2018, from
http://www.maff.go.jp/j/tokei/sihyo/data/10.html.
Japanese Ministry of Economy, Trade and Industry (METI). (2018). The 8th meeting,
New and Renewable Energy Subcommittee. Retrieved October 9, 2018, from
http://www.meti.go.jp/shingikai/enecho/denryoku_gas/saisei_kano/008.html.
-----. Feed-in Tariff Scheme in Japan. (2012). Retrieved May 15, 2018, from
http://www.meti.go.jp/english/policy/energy_environment/renewable/.
Johnston, M., Onwueme, I. C. (1998). Effect of shade of photosynthetic pigments in the
tropical root crops: yam, taro, tannia, cassava and sweet potato. Experimental
Agriculture, 34(3), 301–312.
Lin S, Zhang, Q., & Chen, Q. (2007). Shade-tolerance of ten species of garden plants.
Journal of Northeast Forestry University, 35, 32-34.
Majumdar, D., & Pasqualetti, M. J. (2018). Dual use of agricultural land: Introducing
‘agrivoltaics’ in Phoenix Metropolitan Statistical Area, USA. Landscape and
Urban Planning, 170, 150-168.
50
Marrou, H., Dufour, L., & Wery J. (2013). How does a shelter of solar panels influence
water flows in a soil–crop system? European Journal of Agronomy, 50, 38-51.
Marrou, H., Guilioni, L., Dufour, L., Dupraz, C., & Wery, J. (2013). Microclimate under
agrivoltaic systems: is crop growth rate affected in the partial shade of solar
panels? Agricultural and Forest Meteorology, 177(1), 17-32.
Movellan, J. (2013). Japan Next-Generation Farmers Cultivate Crops and Solar Energy.
Renewable Energy World, October 10, 2013. Retrieved July 25, 2018, from
https://www.renewableenergyworld.com/articles/2013/10/japan-next-generation-
farmers-cultivate-agriculture-and-solar-energy.html.
Nagashima, A. (2005). Japan Patent No. 2005-277038. Tokyo, Japan. Japan Patent
Office.
-----. (2014). Development and Prospect of Photovoltaic system "Solar Sharing". Journal
of Japan Solar Energy Society, 40(6), 11-15.
-----. (2015). Encouragement for Solar Sharing. Tokyo: RIC.
Neill, S., Stapleton, G., & Martell, C. (2017). Solar Farms: The Earthscan Expert Guide
to Design and Construction of Utility-scale Photovoltaic Systems. Oxford:
Routledge.
Nonhebel S. (2005). Renewable energy and food supply: will there be enough land?
Renewal and Sustainable Energy Reviews, 9(2), 191–201.
Scognamiglio, A. (2014). Photovoltaic Greenhouses: A Feasible Solution for Islands?
Design, Operation Monitoring and Lessons Learned from a Real Case Study;
Conference Paper, The 6th World Conference on Photovoltaic Energy Conversion,
Kyoto, Japan, November 23-27, 2014.
Solar Energy Industries Association (SEIA). (2018). Photovoltaic (Solar Electric).
Retrieved November 9, 2018, from http://www.seia.org/policy/solar-
technology/photovoltaic-solar-electric.
Solar Sharing Network. (2018a). What is Solar Sharing? Retrieved May 15, 2018, from
https://apcmaintenance.meclib.jp/kaigai_ver1/book/index.html#target/page_no=1.
-----. (2018b). List of Power Plants. Retrieved July 25, 2018, from https://solar-
sharing.org/?cat=11&paged=3.
-----. (2018c). Hydroponics tomato with electric green house. Retrieved November 5,
2018, from https://solar-sharing.org/?page_id=2937.
Oceans of Energy. (2018). Oceans of Energy: Offshore Floating Solar. Retrieved
51
November 22, 2018, from https://oceansofenergy.blue/.
U.S. Energy Information Administration (EIA). (2018). Renewable Energy Explained.
Retrieved November 9, 2018, from
https://www.eia.gov/energyexplained/index.cfm?page=renewable_home.
U.S. National Renewable Energy Laboratory (NREL). (2012). A Guide to Community
Shared Solar: Utility, Private, and Nonprofit Project Development. Retrieved July
18, 2017, from http://www.nrel.gov/docs/fy12osti/54570.pdf.
Wu Z., Hou A., Chang C., Huang X., Shi D., & Wang Z. (2014). Environmental impacts
of large-scale csp plants in northwestern China. Environmental Science: Processes
& Impacts, 16(10), 2432–2441.
Yano, A., Onoue, M., & Nakata, J. (2014). Prototype semi-transparent photovoltaic
modules for greenhouse roof applications. Biosystems Engineering, 122, 62-73.