PropertyVertical - Property Dealers, Commercial & Residential
21
third quarter report www.propertyvertical.com A comprehensive analysis of Chandigarh residential real estate market PropertyVertical.com 2006
Transcript of PropertyVertical - Property Dealers, Commercial & Residential

third quarter reportwww.propertyvertical.com
A comprehensive analysis
of Chandigarh residential
real estate market
PropertyVertical.com
2006

www.propertyvertical.com
Property Vertical is pleased to bring the Third Quarter Report
on the Chandigarh residential property sales. Such endeavor
has been made for the first time in the Indian Real Estate
Market and we feel proud to be the pioneers of this concept.
An attempt has been made to come up with a comprehensive
analysis of the residential property in Chandigarh.
The authencity of the data is kept in mind as it is collected
from Chandigarh Estate Office. To give a complete perspective
to the report this data is then compared with the data collected
from the local property dealers.
Simplicity of the report has been maintained for easy
understanding and evaluation by the readers.
We hope to provide a relevant and informative report to our
valued readers.
Introduction ......................................................................3
Flats and Plots in Chandigarh ........................................5
New constructions and developmentsin Panchkula and Mohali..................................................6
New developments around Tri-city ..................................7
Kharar...............................................................................8
Dera Bassi........................................................................9
Types and No. of deeds registered in Chandigarh........10
No. of deeds registered vis-a-vis the location in Chandigarh .............................10
Variations in the property area with respect tothe registered amount in Chandigarh............................11
No. of properties sold vis-a-visthe area of property in Chandigarh................................12
No. of properties sold vis-a-visthe Registered Amount in Chandigarh ..........................12
Chandigarh Market Comparison (120-130 sq yards)....13
Chandigarh Market Comparison (190-200 sq yards)....14
Chandigarh Market Comparison (250-300 sq yards)....15
Chandigarh Market Comparison (500-600 sq yards)....16
Variations in the registered amount withsame residential property area in Chandigarh ..............17
Variations in the registeredamount in Chandigarh sector-wise................................18
Predictions .....................................................................19
Conclusion .....................................................................20
Sources, Special Thanks,Our Addresses, Disclaimer & Copyright........................21
Welcome Contents
third quarter report
PropertyVertical.com 2page
2006
Ritu Sharma
Research Analyst
Vipin Sharma
General Manager

3page
third quarter reportwww.propertyvertical.com
The real estate sector is attracting both national and international private developers and colonizers in India. The tri-city i.e.
Chandigarh, Mohali and Panchkula and the suburban areas of Chandigarh like Kharar, Zirakpur, Baddi and Dera Bassi are
not left far behind. These locations are much sought after destinations for developers like TDI, MGF, Westend, Unitech,
Parsvnath, Omaxe and EMMAR. Huge investments have been made by these developers and still many are in the pipeline
ready to explore opportunities in this area.
The entry of huge number of private builders in the outskirts of Chandigarh developing land into residential property has
increased the availability of residential property to the prospective buyers and investors. As a result there has been definitely
a manifold increase in the supply but the demand is not increasing proportionately. As a result residential property rates
have depreciated around 25% to 30% in the areas like Mohali and Panchkula.
In last six months there has been a slump in the residential properties in Chandigarh. Around 15%-20% rates for small
properties like 5 marlas and 10 marlas have gone down whereas for the larger properties like 1 kanal it has been static in
Chandigarh residential properties in last one year. Both the investors and the sellers are waiting for the slump to settle down
before going into any transaction.
The main reasons attributed to this can be that the residential property market in Chandigarh is nearly saturated. Now the
expansion is on the outskirts and the sub-urban areas. This has surely brought smiles on the faces of middle income and
the salaried class who can now buy a residential property not far away from Chandigarh.
The rate of registration of a plot in Chandigarh fixed by the administration is Rs 19,200 per square yard on which the registry
is supposed to be done. Whereas the market rate is around Rs. 60,000 per square yard in sectors like 18, 19, 21 and 22. The
registeration rate in Mohali and Panchkula is around Rs 10,000 to Rs 14,000 whereas in the suburbs it is between Rs 4,000
to Rs 6,000.
The government rate for construction is Rs. 200 per square feet covered area for old construction which is more than 10 yrs
old and Rs. 400 per square feet for new construction which is less than 10 yrs old.
In the residential property the demand is high for 5-10 marlas in both the plot and the constructed house. The value of a 5
marla old constructed house is around 70 lakhs whereas for 10 marla it is around Rs.1.25 crore and for 1 kanal it is around
Rs 2.5 crore.
Considering the flats, rates vary from location to location and from project to project. Taking the example of MDC (Mansa
Devi Complex), Panchkula, the property rates are Rs. 31,000 per square meter and a 3 bed room flat would cost around Rs.
40-60 lakhs.
The rates of leasehold properties are around 20-25% less than the freehold properties. Leasehold properties are in sectors
like 44, 43, 42, 41 and 40. Due to the lack of finance availability from the banks on leasehold properties, these have a fewer
buyers. These days most of the buyers are opting for the loans. Also the government provides benefits on the loan amount
like exemption from the Income Tax.
PropertyVertical.com
2006
Introduction
Visit Our website to browse Listings and learn more about market trends.
www.propertyvertical.com

4page
third quarter reportwww.propertyvertical.com
PropertyVertical.com
2006
Property Vertical Research Department believes that there is a need for Apartment Act to be enforced in Chandigarh. As
separate floors cannot be sold or bought in Chandigarh but they are transferred under the Shared Transfer Act. In last 5-6
years there has been a trend of transferring floors of a multi storey constructed house. But the Apartment Act will make it
more convenient and simple for both the parties. For instance if a family staying in a three story house has three children
and they want to give a portion to each, the act will enable them to do so.
At present the ownership rights are distributed as 50%, 30% and 20% for ground floor, first floor and the second floor
respectively.
OwnershipFloor rights
Ground Floor 50%
First Floor 30%
Second Floor 20%
50%
30%
20%
ground floor
first floor
second floor
Visit Our website to browse Listings and learn more about market trends.
www.propertyvertical.com

5page
third quarter reportwww.propertyvertical.com
The availability of flats in Chandigarh is limited to Sector 41 to Sector
49 only. These are the Society Flats which are categorized as LIG,
MIG and HIG. These are again divided into lower and upper
categories.
The rates of these flats per category are given in table xx.
Old constructed house means on which the construction is more
than ten years old.
New constructed house means on which the construction is less
than ten years old
PropertyVertical.com
2006
Flats in Chandigarh
Floorwise Rates of 10 marla
house in Chandigarh
Category of Rate*Flats (rs./per sq feet)
LIG (2 BR) Lower 2000
Upper 1900
MIG (3 BR+DD) Lower 2100
Upper 2300
HIG (3 BR+DD) Lower 2600
Upper 3100
10 Marla House Floor Old Constructed New Constructed
Ground Floor 65-70 lakhs 80-90 lakhs
First Floor 50-55 lakhs 60-65 lakhs
Second Floor 35-40 lakhs 45-50 lakhs
The availability of plots in Chandigarh is very limited and in some areas is
almost negligible. For instance 5 and 10 marla plots are not available in the
northern sectors of. Chandigarh. Also 10 marla plots are rarely available in the
southern sectors.
The demand for 5 and 10 marla plots is the maximum in Chandigarh but due to
limited availability, the rate per square yard of these plots is the maximum.
The Chandigarh market scenario related to residential plots is very limited. There is more demand but less supply. Hence
the rates are high as compared to the residential plots in the periphery of the tri-city like Kharar, Banur, Zirakpur and Dera
Bassi. As a result due to lower rates and ample availability the shift is towards these areas.
Plots in Chandigarh
Market Rate*Area of Plot (rs./per sq feet)
5 marlas 50 - 60 lakhs
10 marlas 1.35 - 1.5 crores
1 kanal 2.65 - 3 crores
2 kanal 5.5 - 6 crores
*The rates are approximate as per the property dealers. All the rates are in INR.
Visit Our website to browse Listings and learn more about market trends.
www.propertyvertical.com
6page
third quarter reportwww.propertyvertical.com
PropertyVertical.com
2006
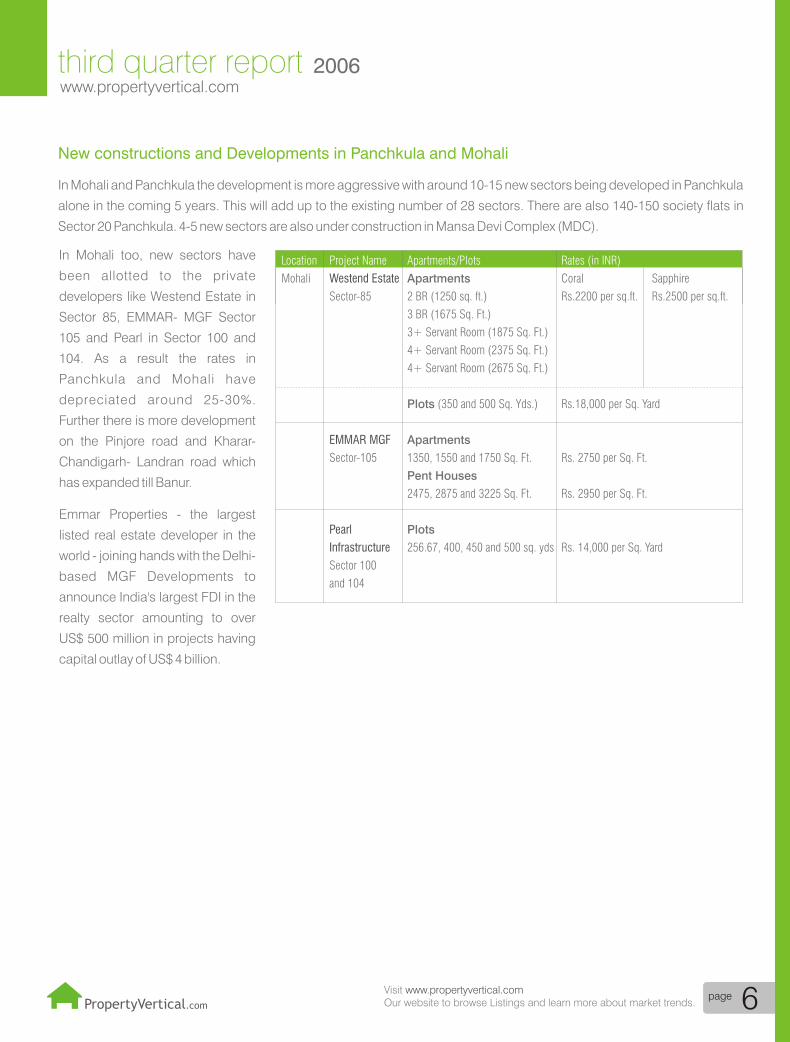
In Mohali and Panchkula the development is more aggressive with around 10-15 new sectors being developed in Panchkula
alone in the coming 5 years. This will add up to the existing number of 28 sectors. There are also 140-150 society flats in
Sector 20 Panchkula. 4-5 new sectors are also under construction in Mansa Devi Complex (MDC).
New constructions and Developments in Panchkula and Mohali
Location Project Name Apartments/Plots Rates (in INR)
Mohali Apartments Coral Sapphire
Sector-85 2 BR (1250 sq. ft.) Rs.2200 per sq.ft. Rs.2500 per sq.ft.
3 BR (1675 Sq. Ft.)
3+ Servant Room (1875 Sq. Ft.)
4+ Servant Room (2375 Sq. Ft.)
4+ Servant Room (2675 Sq. Ft.)
Plots (350 and 500 Sq. Yds.) Rs.18,000 per Sq. Yard
Apartments
Sector-105 1350, 1550 and 1750 Sq. Ft. Rs. 2750 per Sq. Ft.
Pent Houses
2475, 2875 and 3225 Sq. Ft. Rs. 2950 per Sq. Ft.
Plots
256.67, 400, 450 and 500 sq. yds Rs. 14,000 per Sq. Yard
Sector 100
and 104
Westend Estate
EMMAR MGF
Pearl
Infrastructure
In Mohali too, new sectors have
been allotted to the private
developers like Westend Estate in
Sector 85, EMMAR- MGF Sector
105 and Pearl in Sector 100 and
104. As a result the rates in
Panchkula and Mohali have
depreciated around 25-30%.
Further there is more development
on the Pinjore road and Kharar-
Chandigarh- Landran road which
has expanded till Banur.
Emmar Properties - the largest
listed real estate developer in the
world - joining hands with the Delhi-
based MGF Developments to
announce India's largest FDI in the
realty sector amounting to over
US$ 500 million in projects having
capital outlay of US$ 4 billion.
Visit Our website to browse Listings and learn more about market trends.
www.propertyvertical.com

7page
third quarter reportwww.propertyvertical.com
PropertyVertical.com
2006
To meet the demand in the real estate sector the development is now shifting to the outskirts of the cities as the land inside
has been completely exhausted. This leaves no solution for the investors but to look for other options around.
The property rates vary from builder to builder depending upon the facilities and amenities provided by them. Like a villa in
Shivalik City may cost you something around Rs. 40-50 lakhs whereas in Gillco Towers it may cost you around Rs.28 lakhs
depending upon the area and number of storey built up.
A flat in Shivalik City costs around Rs.1,868 per sq feet. In TDI it costs around Rs.1, 750 per sq feet whereas in MGF it may
cost something around Rs.2, 750 per sq feet which is the discounted price as against the actual price of Rs.2, 950 per sq
feet.
The plot rates also vary from builder to builder. For instance plots in Pearl costs around Rs.15,000 per sq. yard. Whereas in
MGF the residential plot is for Rs.11,500 per sq. yard and in Shivalik city it is for Rs.12,000 per sq yard.
New Developments around Tri- city
Baddi
Location Project Name Apartments/Plots Rates (in INR)
Baddi ndFlats 1st and 2 floor for1, 2, and 3 BR Rs.1670 per Sq. Feet
rd th th3 , 4 and 5 floor forRs.1620 per Sq. Feet
Omaxe Parkwood
Zirakpur
Location Project Name Apartments/Plots Rates (in INR)
Zirakpur Apartments Rs.2100 per Sq. Feet2,3,4 and 5 BR (Basic Rate)
FlatsGround Floor to
th7 Floor
G.F. Rs.3085 per Sq. Feet
F.F. Rs. 3055 per Sq. Ft.(The rate goes ondecreasing reciprocalwith the floors).
FlatsGround Floor to
th6 Floor
2 BR Rs. 2100 to Rs. 2200 per Sq. Ft.
3 BR Rs. 2200 toRs. 2100 per Sq. Ft.
Nirmal ChhayaTowers
Whistler HeightsTownshipsPvt. Ltd.
Jaipuria’sSunrise Greens
Visit Our website to browse Listings and learn more about market trends.
www.propertyvertical.com

8page
third quarter reportwww.propertyvertical.com
PropertyVertical.com
2006
One of the examples of the expansion of the residential
properties outside the tri-city is the area enclosing
Kharar-Landran and Kharar-Chandigarh (National
Highway 21) stretch between Kharar, Landran and
Mohali. On one side the road leads to Ropar and
Ludhiana and on the opposite it goes to Banur whereas
Chandigarh is on the other side. This area is enclosed
by Chandigarh and the Quark city Mohali making it
easily accessible.
It is emerging as a huge potential residential area these
days. Almost everyone interested in the real estate
including the developers, constructors, dealers and
also the end consumers planning to buy a residential
plot, flat or a house are considering this as an option.
Also, those who due to the sky rocketed real estate
prices cannot afford to buy any property in Chandigarh
or Mohali or the young working generation who are
looking for their own residence rather than paying huge
rents are investing in Kharar.
Kharar
Location Project Name Apartments/Plots Rates (in INR)
Kharar Flats Rs. 1868 per Sq. Ft.
Villas Rs. 40-50 lakhs
Plots Rs. 12000 per Sq. yard
Apartments(Bajwa Ground Floor to
thDevelopers Ltd.) 5 Floor
2 BR Rs. 1846 per Sq. Ft.3 BR Rs.1687.50 per Sq. Ft.
Villas
140 Sq. yards 30 lakhs165 Sq. yards 34 lakhs 263 Sq. yards 53 lakhs290 Sq. yards 58 lakhs
Apartmentsst(Marvel Buildcon 1 Floor to Rs.1750 per Sq. Ft.thPvt. Ltd.) 6 Floor
Shivalik City
Sunny Enclave
Acme Heights
Visit Our website to browse Listings and learn more about market trends.
www.propertyvertical.com

9page
third quarter reportwww.propertyvertical.com
PropertyVertical.com
2006
After Zirakpur, Dera Bassi is now attracting the colonizers.
The land which was selling at the rate of Rs 20 lakh per
acre last year on the Chandigarh- Ambala Highway in the
villages like Madhopur, Sheikhpura Khurd, Dadrala,
Gulabgarh and Sadhemajra is now selling at the rate of
1.25 cr to 1.5 cr per acre. This land however is non
agricultural, which is now bringing smiles on the faces of
the farmers as they are getting good returns for their land.
The tri-city being out of reach of the common middle
class, salaried and small businessman, now Dera Bassi is
another option for them.
Dera Bassi
Plots
Flats
Location Project Name Apartments/Plots Rates (in INR)
Dera Bassi Parsvnath PlotsDevelopers Ltd. (In 200, 250, 300, Rs. 10,000 per sq yard.
350, 400 and 450Sq.yards)
Green Estate FlatsType A Rs.1286 per Sq. Ft.
Type B Rs.1297 per Sq. Ft.
0Westend Estate
MohaliParsvnath Developers
Dera BassiSunny Enclave
Kharar
Builders
Plo
t R
ate
in IN
R p
er
sq.y
d.
10,000
12,000
14,000
16,000
18,000
Builders
0Green EstateWestend
EstateEMMAR
MGFOmaxe
ParkwoodsNirmalChhayaTowers
WhistlerHeights
Jaipuria’sSunriseGreens
Shivalik City SunnyEnclave
AcneHeights
Fla
t R
ate
in IN
R (p
er
sq
. ft.)
1,200
1,300
1,600
1,700
1,800
1,900
2,000
2,100
2,200
2,500
2,600
2,700
2,800
3,000
2,900
3,100
Mohali Baddi Zirakpur Dera Bassi Kharar
Visit Our website to browse Listings and learn more about market trends.
www.propertyvertical.com
typ
e A
typ
e B
2B
R
Co
ral
Sa
pp
hire
3B
R

page
third quarter reportwww.propertyvertical.com
In the third quarter months of July, August and September the maximum number of deeds in the residential property in
Chandigarh was the sale deeds. 92 sale deeds were registered in the records of Estate Office.
10 Gift Deeds were recorded.
4 Transfer Deeds and only 1 Exchange Deed was recorded.
Types and No. of deeds registered in Chandigarh
PropertyVertical.com
2006
0
Sale Gift
Type of deeds
No.
of re
gis
trie
s
Transfer Exchange
1
4
10
92
Type Of Deed
No. of Registeries
Sale 92
Gift 10
Transfer 4
Exchange 1
The maximum number of sale in the residential property as registered which is 22 in the months of July, August and
September was in the western sectors of Chandigarh which includes Sector 35, 36, 40, 42.
North West sectors of Chandigarh recorded the second highest sale i.e. 18. These sectors are 37, 38 and 23.
* The information is according to the Chandigarh Estate Office Records. All rates are in INR.
Number of deeds registered vis-à-vis the location in Chandigarh.
Area North North East East South East South South West West North West Center
No. of 7 11 8 7 11 7 22 18 13Deeds
0
North North East
Area
No.
of D
eed
s
East South East South South West West North West Center
7
8
11
13
18
22
10Visit Our website to browse Listings and learn more about market trends.
www.propertyvertical.com

page
third quarter reportwww.propertyvertical.com
PropertyVertical.com
2006
Variations in the property area with respect to the registered amount in Chandigarh
Registered Area (sq. yards)
Amount (in lakhs, INR) Min. Max. Average
3 to 5 126.75 266 196.375
5 to 7 121.92 - -
7 to 9 125 500.5 312.75
9 to 11 121.92 249.38 185.65
11 to 13 151.67 253.5 202.585
13 to 15 121.92 269 195.46
15 to 17 338 - -
17 to 19 253.3 500 376.65
19 to 21 192 338 265
21 to 23 182 198.33 190.165
23 to 25 166 253.5 209.75
25 to 27 500.5 - -
27 to 29 250 253.5 251.75
31 to 33 151.67 425 288.335
37 to 39 500 - -
49 to 51 250 259.405 254.7025
53 to 55 600 - -
57 to 59 568.8 - -
61 to 63 250 - -
63 to 65 314.33 - -
69 to 71 344.5 - -
89 to 91 300 - -
99 to 101 253.5 475.22 364.36
101 to 103 322 505.4 -
105 to 107 528.13 - -
109 to 111 521.7 - -
113 to 115 528.13 - -
129 to 131 639.4 - -
The highest average residential property area i e. 376.65
sq. yard falls under the registered amount category of 17
to 19 lakhs. This proves that in the third quarter, registries
of amount ranging between 17 to 19 lakhs was done for
the highest average residential property area as
compared to the other related property areas.
11Visit Our website to browse Listings and learn more about market trends.
www.propertyvertical.com
page
third quarter reportwww.propertyvertical.com
PropertyVertical.com
2006
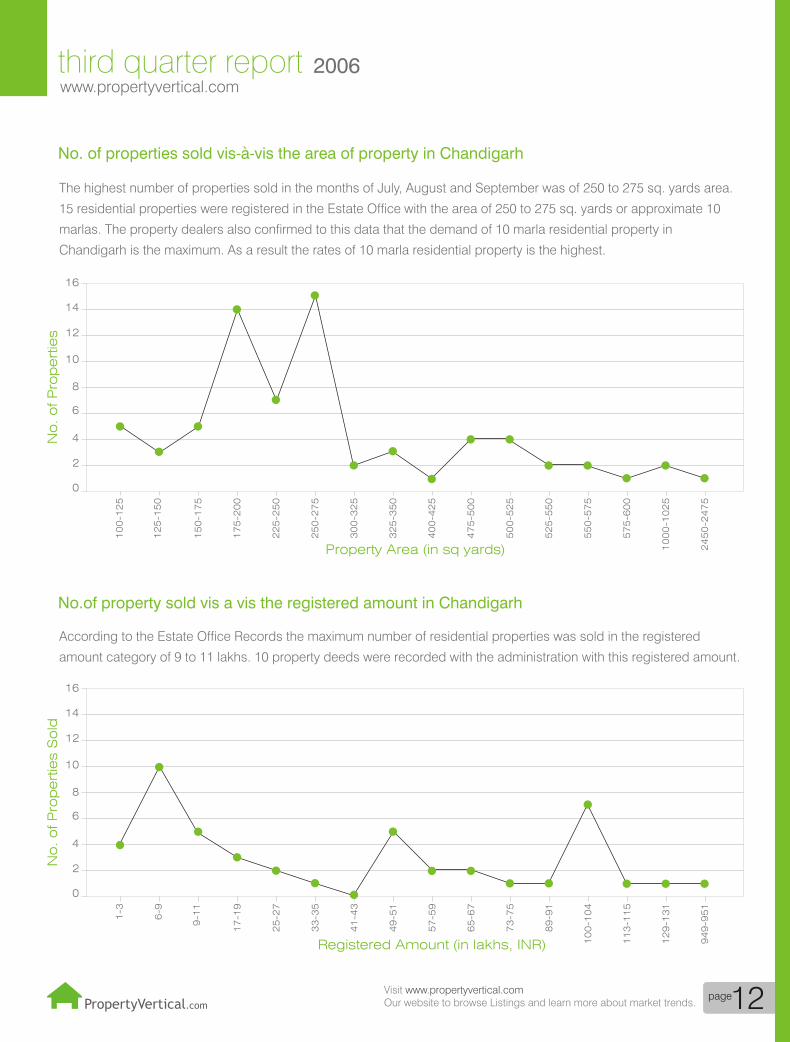
The highest number of properties sold in the months of July, August and September was of 250 to 275 sq. yards area.
15 residential properties were registered in the Estate Office with the area of 250 to 275 sq. yards or approximate 10
marlas. The property dealers also confirmed to this data that the demand of 10 marla residential property in
Chandigarh is the maximum. As a result the rates of 10 marla residential property is the highest.
No. of properties sold vis-à-vis the area of property in Chandigarh
0
10
0-1
25
12
5-1
50
15
0-1
75
22
5-2
50
25
0-2
75
30
0-3
25
32
5-3
50
40
0-4
25
47
5-5
00
17
5-2
00
50
0-5
25
52
5-5
50
55
0-5
75
57
5-6
00
10
00
-10
25
24
50
-24
75
Property Area (in sq yards)
No
. o
f P
rop
ert
ies
2
4
6
8
10
12
14
16
According to the Estate Office Records the maximum number of residential properties was sold in the registered
amount category of 9 to 11 lakhs. 10 property deeds were recorded with the administration with this registered amount.
No.of property sold vis a vis the registered amount in Chandigarh
0
1-3
9-1
1
6-9
17
-19
33
-35
41
-43
49
-51
57
-59
65
-67
73
-75
25
-27
89
-91
10
0-1
04
11
3-1
15
12
9-1
31
94
9-9
51
Registered Amount (in lakhs, INR)
No.
of P
rop
ert
ies S
old
2
4
6
8
10
12
14
16
12Visit Our website to browse Listings and learn more about market trends.
www.propertyvertical.com
page
third quarter reportwww.propertyvertical.com
PropertyVertical.com
2006
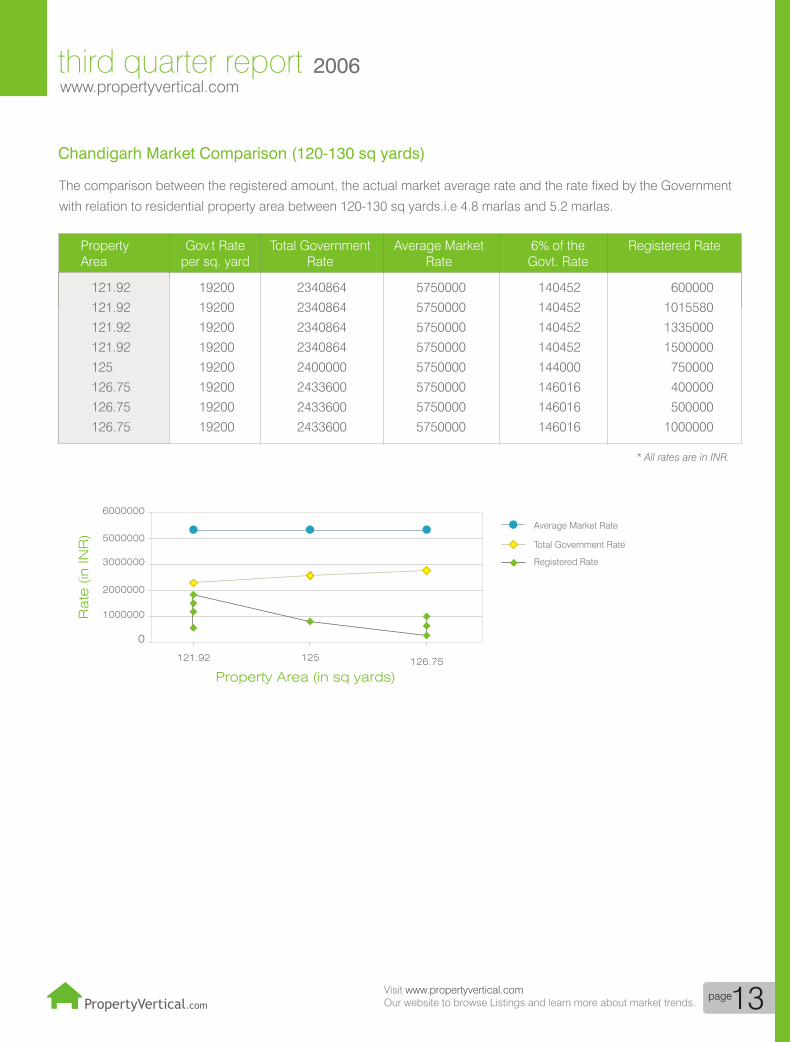
The comparison between the registered amount, the actual market average rate and the rate fixed by the Government
with relation to residential property area between 120-130 sq yards.i.e 4.8 marlas and 5.2 marlas.
Property Gov.t Rate Total Government Average Market 6% of the Registered RateArea per sq. yard Rate Rate Govt. Rate
Chandigarh Market Comparison (120-130 sq yards)
0
121.92 126.75125
Property Area (in sq yards)
Rate
(in
IN
R)
1000000
2000000
3000000
5000000
6000000
Average Market Rate
Registered Rate
Total Government Rate
121.92 19200 2340864 5750000 140452 600000
121.92 19200 2340864 5750000 140452 1015580
121.92 19200 2340864 5750000 140452 1335000
121.92 19200 2340864 5750000 140452 1500000
125 19200 2400000 5750000 144000 750000
126.75 19200 2433600 5750000 146016 400000
126.75 19200 2433600 5750000 146016 500000
126.75 19200 2433600 5750000 146016 1000000
13Visit Our website to browse Listings and learn more about market trends.
www.propertyvertical.com
* All rates are in INR.

page
third quarter reportwww.propertyvertical.com
PropertyVertical.com
2006
The comparison between the registered amount, the actual market rate and the rate fixed by the Government with
relation to residential property area between 190-200 sq yards.i.e 7.6 marlas and 8 marlas.
Property Gov.t Rate Total Government Average Market 6% of the Registered RateArea per sq. yard Rate Rate Govt. Rate
Chandigarh Market Comparison (190-200 sq yards)
0
192 194.44 197.41 198.33192.44
Property Area (in sq yards)
Ra
te (in
IN
R)
1000000
2000000
3000000
4000000
6000000
8000000
9000000
Average Market Rate Registered RateTotal Government Rate
192 19200 3686400 8750000 221184 830000
192 19200 3686400 8750000 221184 900000
192 19200 3686400 8750000 221184 950000
192 19200 3686400 8750000 221184 1210000
192 19200 3686400 8750000 221184 2010000
192 19200 3686400 8750000 221184 2300000
192.44 19200 3694848 8750000 221700 2337000
194.44 19200 3733248 8750000 223995 2205000
197.41 19200 3790272 8750000 227416 2100000
198.33 19200 3807936 8750000 228476 2071968
198.33 19200 3807936 8750000 228476 2200000
14Visit Our website to browse Listings and learn more about market trends.
www.propertyvertical.com
* All rates are in INR.

page
third quarter reportwww.propertyvertical.com
The comparison between the registered amount, the actual market rate and the rate fixed by the Government with
relation to residential property area between 250-300 sq yards.i.e 10 marlas to 12 marlas.
PropertyVertical.com
Property Gov.t Rate Total Government Average Market 6% of the Registered RateArea per sq. yard Rate Rate Govt. Rate
Chandigarh Market Comparison (250-300 sq yards)
2006
0
250 253.5 256.67 259.405253.3
Property Area (in sq yards)
Rate
(in
IN
R)
2000000
4000000
6000000
10000000
14000000
16000000
18000000
Average Market Rate Registered RateTotal Government Rate
0
250 19200 4800000 14000000 288000 1140000
250 19200 4800000 16000000 288000 2730600
250 19200 4800000 14000000 288000 5000000
250 19200 4800000 14000000 288000 5070000
250 19200 4800000 14000000 288000 6250000
253.3 19200 4863360 14000000 291800 1750000
253.5 19200 4867200 16000000 292000 1200000
253.5 19200 4867200 16000000 292000 1751000
253.5 19200 4867200 16000000 292000 1980000
253.5 19200 4867200 14000000 292000 2400000
253.5 19200 4867200 14000000 292000 2400000
253.5 19200 4867200 14000000 292000 2500000
253.5 19200 4867200 16000000 292000 2500000
253.5 19200 4867200 16000000 292000 2850000
253.5 19200 4867200 14000000 292000 3200000
253.5 19200 4867200 16000000 292000 10000000
256.67 19200 4928064 14000000 295700 1750000
259.405 19200 4980576 16000000 298800 500000
15Visit Our website to browse Listings and learn more about market trends.
www.propertyvertical.com
* All rates are in INR.

page
third quarter reportwww.propertyvertical.com
The comparison between the registered amount, the actual market rate and the rate fixed by the Government with
relation to residential property area between 500-600 sq yards.i.e 20 marlas to 24 marlas
PropertyVertical.com
Property Gov.t Rate Total Government Average Market 6% of the Registered RateArea per sq. yard Rate Rate Govt. Rate
16
Chandigarh Market Comparison (500-600 sq yards)
2006
0
500 528.13 568.8 600521.7500.5 505.4
Property Area (in sq yards)
Rate
(in
IN
R)
5000000
10000000
15000000
20000000
25000000
30000000
35000000
Average Market Rate Registered RateTotal Government Rate
500 19200 9600000 32000000 576000 1900000
500 19200 9600000 32000000 576000 1900000
500.5 19200 9609600 28750000 576600 900000
500.5 19200 9609600 32000000 576600 2600000
505.4 19200 9703680 28750000 582200 10250000
521.7 19200 10016640 32000000 601000 10966640
528.13 19200 10140096 26500000 608400 10540096
528.13 19200 10140096 28750000 608400 11500000
568.8 19200 10920960 32000000 655250 5860500
568.8 19200 10920960 32000000 655250 5860500
600 19200 11520000 32000000 691200 5340000
Visit Our website to browse Listings and learn more about market trends.
www.propertyvertical.com
* All rates are in INR.

page
third quarter reportwww.propertyvertical.com
PropertyVertical.com
Property RegisteredArea Amount
121.92 600000
121.92 1015580
121.92 1335000
121.92 1500000
125 750000
126.75 400000
126.75 500000
126.75 1000000
Property RegisteredArea Amount
192 830000
192 900000
192 950000
192 1210000
192 2010000
192 2300000
192.44 2337000
194.44 2205000
197.41 2100000
198.33 2071968
198.33 2200000
The variations in the Registered Amount with the same residential property area in Chandigarh
17
2006
0
121.92 125
Reg
iste
red
Am
ount (in IN
R)
Property Area (in sq yards)
126.75
200000
400000
600000
1000000
1200000
1400000
1600000
800000
0
192 192.44 194.44 197.41
Reg
iste
red
Am
ount (in IN
R)
Property Area (in sq yards)
198.33
500000
1000000
1500000
2500000
2000000
This proves that the same residential property area is registered with different registry amounts. Some of the reasons
for this variation are that it depends on the will and the financial capability of the buyer as whether he wants to go for
loan from the bank for the purchase of the property.
Visit Our website to browse Listings and learn more about market trends.
www.propertyvertical.com
* All rates are in INR.
* All rates are in INR.

page
third quarter reportwww.propertyvertical.com
PropertyVertical.com
Sectors Registered Amount ( in lakh, INR)
Minimum Amount Maximum Amount
22 6 15
27 9 22
38 8.3 23
Sectors Registered Amount ( in lakh, INR)
Minimum Amount Maximum Amount
35 12 32
38 13.25 28.5
40 4.5 100
44 50 62.5
Sectors Registered Amount ( in lakh, INR)
Minimum Amount Maximum Amount
8 19 39
10 26 100.9
The maximum and the
minimum registered amount of
120-200 sq. yards in different
sectors
The maximum and the
minimum registered amount of
250-300 sq. yards in different
sectors
The maximum and the
minimum registered amount of
500-600 sq. yards in different
sectors
18
2006
Variations in the registered amount in Chandigarh sector wise
0
8
500-600 sq.yards 120-200 sq.yards 250-300 sq.yards
38 35 38 40 442710 22
Sectors in Chandigarh
Rate
(in
lakhs,
INR
)
10
20
30
40
50
60
70
80
100
110Minimum Maximum
Visit Our website to browse Listings and learn more about market trends.
www.propertyvertical.com

page
third quarter reportwww.propertyvertical.com
Property Vertical research team came up with the following predictions for the next quarter related to real estate in
Chandigarh.
! The rates for residential properties will rise in the coming quarter.
! Whereas the commercial rates are concerned; these are already shooting up due to the latest movements in
Panchkula commercial segment.
! Rental commercial is getting pace and is high right now. It has increased by 50% to 100% in Panchkula and
20% to 30% in Chandigarh. Further appreciation is unlikely to occur.
! The sale and purchase of both residential and commercial properties in Chandigarh tri city will surely boost up
due to NRI visits in the year end and early next year.
! This quarter has witnessed many new developments in and around Chandigarh tri city and this trend is
expected to continue and increase in the coming months. But until the demand and supply is proportional, the
new developers will not get the expected sales and profits on their investments.
Predictions
PropertyVertical.com 19
2006
Visit Our website to browse Listings and learn more about market trends.
www.propertyvertical.com

page
third quarter reportwww.propertyvertical.com
The third Quarter Report tries to throw light on the residential property market in Chandigarh with respect to the records
of the Estate Office and the information collected from the property dealers.
The maximum number of registered deeds in the Chandigarh residential property in the third quarter months of July,
August and September was the sale deed as compared to the Gift Deed, Transfer Deed and Exchange Deed.
The maximum number of sale in the residential property as registered in the third quarter months was in the western
sectors of Chandigarh. 22 deeds were registered in the sectors 35, 36, 40 and 42.
The highest average residential property area i e. 376.65 sq. yard falls under the registered amount category of 17 to 19
lakhs. This proves that in the third quarter, registries of amount ranging between 17 to 19 lakhs was done for the
highest average residential property area as compared to the other related property areas.
The highest number of properties sold in the months of July, August and September was of 250 to 275 sq. yards area.
The property dealers also confirmed to this data that the demand of 10 marla residential property in Chandigarh is the
maximum. As a result of this the rates of 10 marla residential property is also the highest.
In this report one factor which came into light was that same residential property area is registered with different registry
rates. Some of the reasons for this variation are that it depends on the will and the financial capability of the buyer as
whether he wants to go for loan from the bank for the purchase of the property.
Conclusion
PropertyVertical.com 20
2006
Visit Our website to browse Listings and learn more about market trends.
www.propertyvertical.com

page
third quarter reportwww.propertyvertical.com
! Chandigarh Estate Office! Property Dealers in Tri-city! www.propertyvertical.com
Chandigarh Office:SCO - 58 & 59, Level 2, Sector 34 A, Chandigarh, India.Ph:0172-5017354, 5088814
Source of Information
Special Thanks
Our Addresses
PropertyVertical.com 21
2006
Delhi Office:#155, Level 2, Lane-4, Mahipalpur Ext. New Delhi- 37, IndiaPhone: +91-11-55094144
US Office:115 Broadway, Suit 1304New York, NY, 10006Toll Free: 888-276-4064
Special thanks to Chandigarh Estate Office and the property dealers in the tri-city for the support and co-operation.
All material presented in this report is intended for information purposes only and has been compiled from sources deemed to be reliable. Though information is believed
to be correct, it may be subject to errors, omissions, changes or withdrawal without notice. Property Vertical does not warrant or assume any legal liability or responsibility
for the accuracy and completeness of any information.
Copyrights 2006 Online Real Estate Pvt Ltd.
For more information of this report please visit www.propertyvertical.com.
Email report author Ritu Sharma at [email protected] with questions or comments
Visit Our website to browse Listings and learn more about market trends.
www.propertyvertical.com