Property Taxes on Business and Industrial Property in ... · Property Taxes on Business and...
37
Property Taxes on Business and Industrial Property in British Columbia Robert L. Bish, Ph.D. Contents Executive Summary / 2 Introduction / 6 Property taxes / 7 Comparisons with other jurisdictions / 13 Observations / 24 Conclusions / 30 Appendix A: BC Property Classifications / 32 Appendix B: Total Tax Rates and Municipal Ratios for the Top Quartile of Major Industry Rates / 33 References / 34 About the Author / 35 Acknowledgments / 35 About this publication / 36 About The Fraser Institute / 37 Fraser Institute Digital Publication September 2004
Transcript of Property Taxes on Business and Industrial Property in ... · Property Taxes on Business and...
Property Taxes on Businessand Industrial Property inBritish Columbia
Robert L. Bish, Ph.D.
Contents
Executive Summary / 2
Introduction / 6
Property taxes / 7
Comparisons with other jurisdictions / 13
Observations / 24
Conclusions / 30
Appendix A: BC Property Classifications / 32
Appendix B: Total Tax Rates andMunicipal Ratios for the Top Quartileof Major Industry Rates / 33
References / 34
About the Author / 35
Acknowledgments / 35
About this publication / 36
About The Fraser Institute / 37
Fraser Institute Digital Publication
September 2004
Executive Summary
Property taxes are an extremely important tax for the kind of local government structure
we have in British Columbia. They finance local services by municipalities and regional
districts and schools by the provincial government. Most of the services that property
taxes finance are for the area where the taxes are raised. In other words, property tax is a
group-user charge for benefits received for relatively small geographic areas.
Most jurisdictions tax different classes of property at different rates so that a class of
property can pay for the services it receives. Business classes most often pay higher rates
than residential classes. In general, the closer the balance between taxes paid and bene-
fits received for local government services, the more efficient are the decisions on taxes
and services. However, there exists the opportunity for municipal councils to tax some
classes of property to subsidize services to others. The greatest risk is that residents,
who are voters, will elect councils that simply tax business classes of property to keep
residential taxes low without really considering the full impacts of such a decision.
Business investment has become increasingly mobile and jurisdictions have been forced
to pay more attention to their own taxation relative to that of adjacent municipalities,
provinces, and states in order to maintain a favourable business climate. High property
tax rates can be a very significant factor for businesses as they decide whether or not to
remain open, or to make a new investment. For this reason, it is in interests of all munic-
ipalities and others concerned with the business climate in British Columbia to look
more closely at our property tax system.
Property taxes in British Columbia
From 1984 onwards, British Columbia has allowed municipalities complete discretion
in setting property taxes on different classes of property. Since then, BC’s municipalities
have enjoyed more property tax discretion than municipalities in any other province and
nearly all US states. This flexibility gives BC municipalities the freedom to set any rates
they wish on 9 different classes of property, 4 of which are business (utilities, major
industry, light industry and business), with only minimal constraints on utility taxation.
A comparative analysis of the treatment of business classes of property relative to resi-
dential in British Columbia reveals that in this period, business property has been taxed
at much higher rates than residential property. In 2003, the median residential rate in
BC was 1.17 percent compared to 5.58 percent for utilities, 4.94 percent for major indus-
try, 3.30 percent for light industry and 2.69 percent for business. The median ratio of
Fraser Institute Digital Publication
September 2004
Property Taxes on Business and Industrial Property in British Columbia 2
business to residential tax rates in 2003 was 4.61 for utilities, 4.01 for major industry,
2.91 for light industry and 2.28 for business.
Comparisons with other jurisdictions
Canada
While complete municipal discretion to set property taxes exists in British Columbia,
most provinces put all business properties into one class and set required or maximum
ratios between rates on different property classes. Exceptions to the general approach
include Alberta and Ontario.
Where the provincial government sets the tax ratios between residential and business
properties, the ratios are quite small. For example, in Saskatchewan it is 1.43 for com-
merce and industry and 1.07 for utilities, and in Manitoba it is 1.4 for business, 1.1 for
pipelines and 0.56 for railroads. Winnipeg also has a business tax that raises nearly half
as much revenue as its business property taxes, resulting in a ratio of approximately 2.0.
These ratios are all very low compared to those in British Columbia.
The more interesting comparisons, however, are with jurisdictions where there is more
flexibility on either property tax rates or ratios. In Alberta, median and average munici-
pal residential tax rates are a little over twice the level they are in BC. Alberta municipal
non-residential rates are very close to BC’s business class rates, but Alberta’s non-resi-
dent rates are about 75 percent of BC’s light industry, 44 percent of BC’s major industry,
and slightly less than 40 percent of BC’s utility rates. The higher residential rates and
lower business rates result in median and average ratios of less than 1.5. When one adds
school taxes to the municipal taxes and compares them with total taxes levied within BC
municipalities, the same patterns as for municipal taxes remains. Alberta’s residential
tax rates remain higher than in BC, but BC has higher tax rates and ratios on all business
classes of property.
Alberta is one province where municipalities may levy a business tax in addition to busi-
ness property taxes, although very few Alberta municipalities levy such a tax. System-
atically adding business-tax-rate-equivalent totals to municipal rates would not change
the basic Alberta/BC patterns.
Ontario has recently been through property tax changes and has emerged with more
business property classes than British Columbia, but also has provincially-designated
“ranges of fairness” for the mandatory classes. “These ranges ensure that taxes are not
Fraser Institute Digital Publication
September 2004
Property Taxes on Business and Industrial Property in British Columbia 3
shifted onto property classes that are already subject to unfairly high tax rates, or off
property classes that are subject to unfairly low tax rates.”
By examining medians, one can note that the school plus the municipal residential rate
in Ontario is 1.4 times the total residential rate in BC, and the combined commercial rate
in Ontario is 1.5 times BC’s business rate. Ontario’s basic industry rate is twice BC’s
light industry rate, and Ontario’s large industry rate is 1.9 times BC’s. Thus, median tax
rates are higher in all classes in Ontario than British Columbia. Some higher taxes
should be expected because Ontario’s municipalities fund a significant portion of the
province’s social welfare programs. Where the two provinces differ is that Ontario’s
municipal and total tax rates are more tightly clustered around the median and average,
while BC’s are more spread out. Thus, BC has many more municipalities with higher
rates than Ontario’s maximums.
US states
For each US state, the data has been separated between data for the largest city in each
state, labeled “urban” and a representative small city (labeled “rural”). A comparison of
median and average total residential property tax rates between US states and British
Columbia reveals that they are very close, with the large city median a bit lower, and the
rural median and average a bit higher than in BC.
The overall difference in the patterns is in the treatment of business properties relative
to residential properties. Insofar as tax rates go, both treat residential properties simi-
larly. However, US commercial and industrial properties are taxed at much lower rates
than residential properties, and in small towns industrial properties are usually taxed at
lower rates than residences. In BC, commercial properties are taxed at about 2.3 times
the residential rate, light industry at about 3 times the residential rate, and major indus-
try about 4 times as much as the residential rate. The net result is that most US states
provide a much more business-friendly property tax climate and expect their residents to
pay a greater share of property taxes to support local governments than is the case in
Canada.
Conclusion
High property tax rates can be a very significant factor for businesses as they decide
whether or not to remain in business, or to make new investments. British Columbia
appears to have a serious business climate problem in its treatment of major industry,
and to a lesser extent, utilities. Alberta and Ontario do not have similar problems with
Fraser Institute Digital Publication
September 2004
Property Taxes on Business and Industrial Property in British Columbia 4
very high tax rates in some municipalities, although those provinces still give their
municipalities considerable discretion over local rate setting.
Two approaches worthy of consideration offer potential solutions. The first approach is
to combine all 4 business classes into a single class, as is done in most other provinces.
What limited evidence exists in Canada indicates that with such a broad classification
system business tax ratios remain reasonable. A second approach is to look more closely
at the applicability of Ontario’s reforms. These reforms involve determining ranges of
fairness and thresholds based on average property tax rates in the municipalities for dif-
ferent major classes, and then requiring all tax rate changes to move toward the range of
fairness.
It is in the interests of all municipalities and others concerned with British Columbia’s
business climate to more closely examine how municipalities set tax rates to see if
extremely high tax rates and ratios can be avoided while still maintaining local discretion
in tax rate setting. Both municipal discretion and a favourable business climate are desir-
able objectives, but the current arrangements have not achieved a proper balance
between the two in a significant number of BC municipalities. This failure has the poten-
tial to adversely affect the business investment climate throughout the province.
Fraser Institute Digital Publication
September 2004
Property Taxes on Business and Industrial Property in British Columbia 5
Introduction
From 1984 onwards, British Columbia has allowed municipalities complete discretion
in setting property taxes on different classes of property. Since then, BC’s municipalities
have enjoyed more property tax discretion than municipalities in any other province and
nearly all US states. Casual observation indicates that municipalities have used this dis-
cretion to impose ever-higher taxes on business properties relative to residential proper-
ties. The purpose of this study is to summarize and more broadly disseminate the
findings of a detailed analysis. The larger report contains five main sections: a discussion
of the changing nature of the property tax over time from a general wealth tax to a geo-
graphically-based benefits received tax, a description of trends in the relationship
between taxes on residences and business classes since the 1984 introduction of variable
rates in British Columbia, a description of the taxation of business properties in the rest
of Canada and the US, an analysis of similarities and differences in different systems, and
finally, concluding observations on the taxation of residential and business properties in
BC (Bish, 2003). For the purpose of this analysis, business properties include utilities,
major industry, light industry, and business. Appendix A describes the BC property tax
classes.
Fraser Institute Digital Publication
September 2004
Property Taxes on Business and Industrial Property in British Columbia 6
Property taxes
Property taxes are an extremely important tax for the kind of local government structure
that exists in North America. Local government systems on this continent consist of a
multiplicity of local government units with different boundaries, some of which overlap.
In British Columbia this includes municipalities, regional districts with their municipal
and electoral areas, hospital districts, school districts, and improvement districts. Also,
many municipalities and electoral areas have within them special taxing areas for financ-
ing specific services that are provided only in that area. Most of the services that property
taxes finance are for the area where the taxes are raised, and it is this structure that per-
mits locally elected officials to make decisions to compare the costs of taxation with the
benefits of services: this is the essence of democratic decision-making. The property tax
has evolved to facilitate this system where it resembles a geographically-based, group
user charge for services. 1
British Columbia has one of the most developed, geographically-based, bene-
fits-received property tax systems in North America. 2 Within its regional district sys-
tem, which can be divided up internally with any boundaries useful for supplying a
service, only the properties within those boundaries are taxed for that service. Likewise,
municipalities can create special taxing areas within them to pay for special services not
provided elsewhere. Similar arrangements to levy property taxes in a small area for a spe-
cial service exist in most jurisdictions in North America. The use of these smaller areas
for taxation to pay for benefits to those areas is an important approach to removing the
Fraser Institute Digital Publication
September 2004
Property Taxes on Business and Industrial Property in British Columbia 7
1 It is extremely difficult to compare property taxes with general sales or income taxes, especially with
regard to its incidence on business properties. Virtually all studies of property tax incidence are of resi-
dential property taxes only because it is impossible to make general statements about the incidence of
property taxes on business. First, there is no systematic relationship between a business’s “real property”
and its net income, which may in fact be negative in some years. Second, a business is only a “piece of
paper.” Tax burdens must fall on customers through higher prices, on sellers of resources to the business,
including its employees, on owners of the business (which may include mutual and pension funds), or
property owners if the business leases instead of owing its real property. Both taxes and benefits from the
services it finances may also be capitalized into property values and this reinforces their benefits-received
nature and makes it even more difficult to compare their incidence with income and general sales taxes.
2 When property taxes are used in a relatively small geographic area to finance services in that area, they
take on the characteristics of a user charge for a group where direct benefits are received for the payment
instead of a tax unrelated to benefits. The smaller and more homogeneous the group of properties upon
which a tax is levied to provide a specific service, the closer the tax approximates an individual user
charge. Cost-based user charges have the advantage of promoting efficient resource use, and appropriate
cost-of-service-based property taxes have fewer distorting effects on decisions than result from other
taxes. In addition, when the benefits of services exceed the cost of taxes, the property values in the bene-
fitting area are enhanced instead of depressed by the tax-spending process; this is most likely to result
when relatively small groups make the tax-spending decisions.
distorting effects of taxation that is unrelated to benefits to an efficiency-enhancing ben-
efits-received group user charge.
In recent times, some jurisdictions have begun to apply the benefits-received approach
systematically to different classes of property, with the different property tax rates on
different classes of property based on the costs of providing services to different classes.
For example, if businesses attract a lot of customers and employees from outside the
local government’s jurisdiction, the costs of providing services to those customers and
employees while they are in the jurisdiction should be paid by the businesses that attract
them, and their property taxes should cover those costs. This approach could lead to
either higher or lower property tax rates on different classes of property relative to resi-
dential rates. A second approach, as property taxes have increased, is for a jurisdiction to
pay more attention to its taxation rates relative to those of its neighbours in order to
maintain a favourable business climate. A jurisdiction’s neighbours may be adjacent
municipalities for most business taxation, but can also be adjacent provinces, states, or
even countries for the location of industry.
Some combination of the cost of providing services to different classes of property and
the goal of achieving economic competitiveness appears to underlie Ontario’s designa-
tion of a band of “fair” property tax rates for different classes of property. Political pres-
sure and the cost of services approach underlie the City of Vancouver’s attempt to
rebalance residential and business property taxes following the KPMG study.3 Allo-
cating costs among property classes is a natural evolution of the transition of the prop-
erty tax to a benefits-received tax in relation to different classes of property as well as to
geographically-defined groups.4 British Columbia’s variable tax rate system allows such
a trend.
Property taxes in British Columbia
British Columbia has one of the most highly evolved systems of local government with
property taxes used as geographically-based, group user charges (for a discussion on the
use of property taxes in BC, see Bish and Clemens, 1999). The provincial government
has also removed the responsibility of funding services devoted primarily to income
Fraser Institute Digital Publication
September 2004
Property Taxes on Business and Industrial Property in British Columbia 8
3 KPMG, 1995. This study concluded that business property taxes were used to subsidize residential ser-
vices such that residents only paid $.50 of each $1.00 their services cost to produce with the other $.50
paid by excess taxes on business.
4 The closer the match between the costs of providing services and taxes paid (through user charges where
feasible, or for relatively small, geographically-defined groups), the more likely location and investment
decisions will be efficient and contribute to increasing productivity in the economy.
redistribution from local governments and funds them with general income and sales
taxes. Property tax assessments are exceptionally uniform at market value and the tax is
well administered. Homeowner grants and deferment programs reduce the burden on
occupants of lower-valued dwellings, the elderly, and the disabled. The proportion of
school financing from property taxes has been reduced and school resources are equal-
ized province-wide. Also, with regional districts and provisions for local area tax financ-
ing within municipalities, there are opportunities for local people and their officials to
relate local taxes to local benefits. British Columbia’s municipalities also have more dis-
cretion to set different property tax rates on different classes of property than any other
jurisdiction in Canada.5 Other provincial governments either set the ratios among prop-
erty classes, combine all business and industrial properties into fewer (usually one)
classes, or constrain ratio and rate setting.
The BC government designated the ratios between tax classes which virtually all munici-
palities used when setting their tax rates until 1983.6 Beginning in 1984, municipalities
began to set their own rates and ratios on 9 different classes of property, four of which
were business properties: utilities, machinery, industry, and business. In 1988, the
machinery class was abolished and industry split between light and major. The provin-
cial government, however, continued to set ratios among property classes for use by
regional and hospital districts, and also set its own rural property tax rates for areas out-
side of municipalities.
During the initial years under variable rates, most municipalities continued to use ratios
identical to or virtually identical to those the provincial government designated for use
by regional districts under Local Government Act regulations. However, over time munici-
palities have increased the ratios of tax rates on business, industry, and utilities relative
to residential tax rates, with some ratios and rates becoming not only high, but indeed
the highest in North America.
British Columbia’s rates and ratios prior to and since the introduction of munici-
pally-determined variables in 1983 are presented in table 1.7 Local Government Act (LGA)
Fraser Institute Digital Publication
September 2004
Property Taxes on Business and Industrial Property in British Columbia 9
5 Newfoundland municipalities, however, have similar discretion over business occupancy taxes.
6 Ratios are comparisons of a class tax rate relative to the residential rate. For example, if the business tax
rate is 3.0 percent and the residential rate is 1.0 percent, the ratio is 3 (3:1). Ratios were set by applying a
single rate to different percentages of assessed value. There was some discretion to vary those percent-
ages, but very few municipalities took advantage of that discretion. Note that tax rates in this analysis are
presented as a percentage of assessed value as is done in most of Canada. In BC, tax rates are reported in
dollars per $1,000 of assessed value, thus a rate of $20/$1,000 is the same as 2 percent.
7 The data are provided for minimums, medians, averages, and maximums. For comparison, median rates
and ratios are generally used as averages may be skewed by very high rates and ratios.
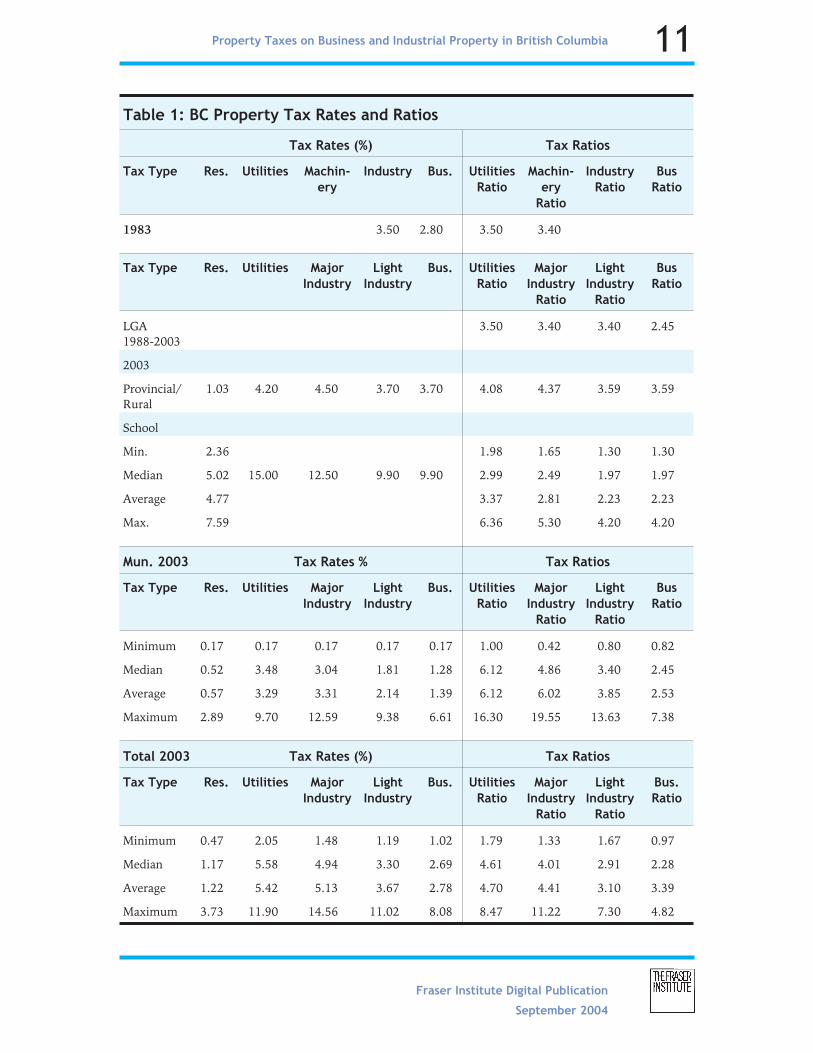
ratios are shown beginning in 1988 because that is when the tax on machinery was abol-
ished and the industry class split between light and major. Also shown are the ratios rel-
ative to residential tax rates for business classes in 2003. These include the ratios for the
provincial rural property tax where revenues go to the general fund and support, but are
not directly related to, the financing of rural roads and rural policing, the LGA ratios
used by regional districts, and an estimate of ratios for provincial school taxes. School
tax rates are uniform across the province for all non-residential properties and the pro-
vincial government sets different residential rates in smaller areas to provide for residen-
tial school tax equalization. Because there are so many school tax areas, the ratios are
based on a sample of 52 different school taxing areas. Finally, summary statistics on
municipal property taxes and total property taxes in municipalities are shown. For each
tax and ratio, where relevant, the lowest, median (one half tax at a higher rate; one half at
a lower rate), average, and high, rates and ratios are shown.
It is important to note that tax rates are shown four ways in Canada: dollars per thou-
sand of assessed value, mills (which is the same as dollars per thousand without the “$”
sign), dollars per hundred of assessed value, and percent (which is the same as dollars
per hundred with a “%” instead of a “$”). While BC uses dollars per thousand, all rates
shown in this analysis are presented in percentages, as is the custom in most Canadian
jurisdictions. Thus a rate of 1.03 percent is the same as $10.30/$1,000. Actual tax rates
are also often expressed to 5 decimal places. For comparative purposes, amounts in this
report are limited to fewer decimal places as it makes the tables easier to read without
sacrificing the degree of accuracy needed for the comparisons.
While one could report data for intermediate years, they simply reflect trends between
1983 and 2003. To summarize these trends:
• the LGA Act ratios applicable to regional and hospital districts have remained
unchanged;
• provincial government ratios for the rural area tax have all increased, with busi-
ness increasing the most from 2.45 to 3.59;
• school tax ratios are different as they are of no concern in tax rate setting. The
province sets the same tax rates on all non-residential classes province-wide, but
residential rates are set to equalize school tax burdens on residents in different
school tax areas. Their median ratios are lower than all other tax ratios including
1983, pre-variable, tax-rate-setting ratios. These lower ratios on school tax rates
are the major reason tax ratios on total property taxes within municipalities are
lower than the tax ratios set by municipalities on municipal property taxes.
Fraser Institute Digital Publication
September 2004
Property Taxes on Business and Industrial Property in British Columbia 10
Fraser Institute Digital Publication
September 2004
Property Taxes on Business and Industrial Property in British Columbia 11
Table 1: BC Property Tax Rates and Ratios
Tax Rates (%) Tax Ratios
Tax Type Res. Utilities Machin-
ery
Industry Bus. Utilities
Ratio
Machin-
ery
Ratio
Industry
Ratio
Bus
Ratio
1983 3.50 2.80 3.50 3.40
Tax Type Res. Utilities Major
Industry
Light
Industry
Bus. Utilities
Ratio
Major
Industry
Ratio
Light
Industry
Ratio
Bus
Ratio
LGA1988-2003
3.50 3.40 3.40 2.45
2003
Provincial/Rural
1.03 4.20 4.50 3.70 3.70 4.08 4.37 3.59 3.59
School
Min. 2.36 1.98 1.65 1.30 1.30
Median 5.02 15.00 12.50 9.90 9.90 2.99 2.49 1.97 1.97
Average 4.77 3.37 2.81 2.23 2.23
Max. 7.59 6.36 5.30 4.20 4.20
Mun. 2003 Tax Rates % Tax Ratios
Tax Type Res. Utilities Major
Industry
Light
Industry
Bus. Utilities
Ratio
Major
Industry
Ratio
Light
Industry
Ratio
Bus
Ratio
Minimum 0.17 0.17 0.17 0.17 0.17 1.00 0.42 0.80 0.82
Median 0.52 3.48 3.04 1.81 1.28 6.12 4.86 3.40 2.45
Average 0.57 3.29 3.31 2.14 1.39 6.12 6.02 3.85 2.53
Maximum 2.89 9.70 12.59 9.38 6.61 16.30 19.55 13.63 7.38
Total 2003 Tax Rates (%) Tax Ratios
Tax Type Res. Utilities Major
Industry
Light
Industry
Bus. Utilities
Ratio
Major
Industry
Ratio
Light
Industry
Ratio
Bus.
Ratio
Minimum 0.47 2.05 1.48 1.19 1.02 1.79 1.33 1.67 0.97
Median 1.17 5.58 4.94 3.30 2.69 4.61 4.01 2.91 2.28
Average 1.22 5.42 5.13 3.67 2.78 4.70 4.41 3.10 3.39
Maximum 3.73 11.90 14.56 11.02 8.08 8.47 11.22 7.30 4.82
The table does not permit determination of changes in tax rates over time, only ratios,
and the greatest changes are in the range of municipal tax ratios, both in medians for
utilities and major industry, and with some very high ratios in all business classes.
Municipalities with minimum ratios are taxing utilities at the same rate as residential
property. Some municipalities are taxing the other three business classes at less than
residential rates, and over half of all municipalities have not increased ratios on business
or light industry compared to LGA ratios. However, most have increased the ratios on
major industry and utilities, and some ratios have become very high even though
between 1988 and 2003 there were constraints placed on municipal taxation of utilities
and the way railroads were assessed and taxed.
The greatest insight from these ratios comes from the comparative analysis of the treat-
ment of business classes of property relative to residential in other provinces and states.
One should note, however, that property tax rates on business properties in many
municipalities, especially utilities and major industry, can become high enough to influ-
ence the location and investment decisions of businesses.8 For example, utilities and
major industry show median total tax rates of 5.58 percent and 4.94 percent, and highs
of 11.9 percent and 14.56 percent respectively. A 5 percent annual property tax bill is
about the same total cost as the capital cost of an investment amortized over 20 years,
and thus the investor is paying double for the investment. Another way to think of tax
rates at the 5 percent level is that the monthly property tax bill would be almost same
size as the mortgage payment. Seventeen municipalities have municipal tax rates on
major industry that exceed 5 percent and in 48, or nearly one-third of all BC municipali-
ties (48153), the total property tax rate on major industry exceeds this amount. This is a tax
rate that will preclude many investments. These potential effects are best examined in
the context of comparing property tax treatment of business in BC with other provinces.
In addition, some comparisons with US states will also be provided because many busi-
ness decisions are North America-wide, not just Canadian.
Fraser Institute Digital Publication
September 2004
Property Taxes on Business and Industrial Property in British Columbia 12
8 Large sample size studies in the US show tax differences are most important within a metropolitan area
and not between metropolitan areas. This is because most businesses need to be somewhere within a
metropolitan area to serve that area. Major industry, in contrast, may need to locate near raw materials or
at some point between raw materials and markets. Thus, different kinds of business and industry will
have different sensitivity to property tax rates in investment and location decisions. Note that compari-
sons will show that US property tax rates are generally much lower than Canadian rates, and especially
rates in British Columbia. Thus, one would expect more sensitivity by business to property tax rates in
Canada and British Columbia than is identified in US studies.

Comparisons with other jurisdictions
Canada
Canadian provinces have reasonably similar structures of local government, with the
exception of significant municipal social welfare responsibility in Ontario, which results
in Ontario municipalities having the highest per-capita expenditures and revenue needs.
In all provinces the major revenue source for non-school local governments is the prop-
erty tax. The major differences among provinces are that municipalities in some prov-
inces rely relatively less on user charges (Quebec, Newfoundland, Nova Scotia), and in
Newfoundland the provincial government provides larger provincial transfers, which
reduces the need of its municipalities for own-source revenue. Thus, in comparisons of
tax rates, one must be cognizant that Ontario municipalities must raise more
own-source revenue, and Newfoundland municipalities much less, due to provincial pol-
icies. Furthermore, different municipalities put different emphasis on user charges rela-
tive to the property tax. BC, along with Alberta, Saskatchewan, Manitoba, and PEI, rely
most heavily on user charges as a percentage of their own-source revenue. However,
comparisons in this analysis focus not simply on tax rates, but on how business and
industrial properties are taxed relative to residential properties in British Columbia rela-
tive to other jurisdictions.
Property tax systems across jurisdictions can be compared in several ways. One way is to
ignore all aspects of assessments and rates, and simply survey individuals to find out
their income, house value, and amount of property tax paid, as is done in Statistics Can-
ada and Royal LePage surveys. This works for residential rates. With this approach, BC
residents have lower property tax rates in relation to assessed value (less than 1%) than
any other province except Newfoundland. However, in relation to family income, taxes
in BC are about the Canadian average. This appears to be the result of higher than aver-
age home values in BC (where so much of the population is concentrated in the high
housing-price areas of the Lower Mainland and southern Vancouver Island) and, as will
be seen, the relatively high taxation of business.
Similar cross-Canada studies do not exist for industrial properties nor for entire prov-
inces for other classes of property. For these, one must get into specific case studies, as is
done across the United States, or examine assessment classifications, practices, and tax
rates. For example, an identical tax rate has a different result in a province in which tax
assessments are updated annually to market value compared to one which has a three-,
six-, ten-year, or even a random assessment cycle. In addition, in four provinces munici-
palities may still maintain a business occupancy tax in addition to the property tax. They
are noted and included as a property tax in the discussion of individual provinces where
Fraser Institute Digital Publication
September 2004
Property Taxes on Business and Industrial Property in British Columbia 13
relevant. Newfoundland, however, also has a local business gross income tax on some
kinds of business that is described but not included as a property tax. Provincial govern-
ments follow different policies for municipal taxation of residential and business proper-
ties. First, they have different classification systems. Most simply have residential,
non-residential (which includes BC’s four business classes) and farm, but others, like
BC and Ontario, have more classes. With regard to ratios of rates between classes of
property, most provincial governments set fixed ratios, either by setting the percentage
of the assessment that is to be taxed for each class with each class taxed at the same rate,
or by designating ratios directly. Others set fixed ratios for the real property tax, but
allow municipalities to set their own rates on the business occupancy tax. Ontario allows
municipal rate setting but designates “fair ranges” and limits. BC and Alberta, however,
allow municipalities nearly full discretion within provincially-determined classes. In
addition, provinces have different policies on residential exemptions, such as British
Columbia’s homeowner grants, and some allow tax credits for municipal property taxes
against provincial property taxes, or against provincial income taxes. In addition, some
provinces have different policies for their largest city compared to smaller municipali-
ties. And if all of the above were not enough, some provinces are in the middle of reform-
ing assessment practices or reorganizing their local governments.
To make comparisons taking every difference into account in detail would require a
research effort far larger than this one, and one that has never, to the author’s knowl-
edge, been done in Canada. There is sufficient information, however, to make some basic
comparisons of the treatment of residential versus business properties in different prov-
inces to place the policies of British Columbia’s municipalities in the Canadian context.
This study gives no attention to the treatment of farms or forests. That would require
still another major research effort.
Where the provincial government sets the tax ratios between residential and business
properties, the ratios are quite small. For example, in Saskatchewan, the ratio is 1.43 for
commerce and industry, and 1.07 for utilities. In Manitoba, it is 1.4 for business, 1.1 for
pipelines, and 0.56 for railroads. Winnipeg also has a business tax that raises nearly half
as much revenue as its business property taxes, resulting in a ratio of approximately 2.0.
These ratios are all very low compared to British Columbia. This analysis places greater
emphasis on the provinces where there are higher ratios or more flexibility on either
property tax rates or business occupancy taxes. In some provinces where municipalities
set their own rates and ratios there is sufficient information to get a good picture of their
policies. These provinces include Alberta, Ontario and Nova Scotia. Basic information on
property tax rates and ratios for Alberta and Nova Scotia are presented below in Table 2.
Alberta and Nova Scotia have had excellent market value assessments for some time and
Ontario has recently updated to market value so assessment bases are similar. The infor-
Fraser Institute Digital Publication
September 2004
Property Taxes on Business and Industrial Property in British Columbia 14
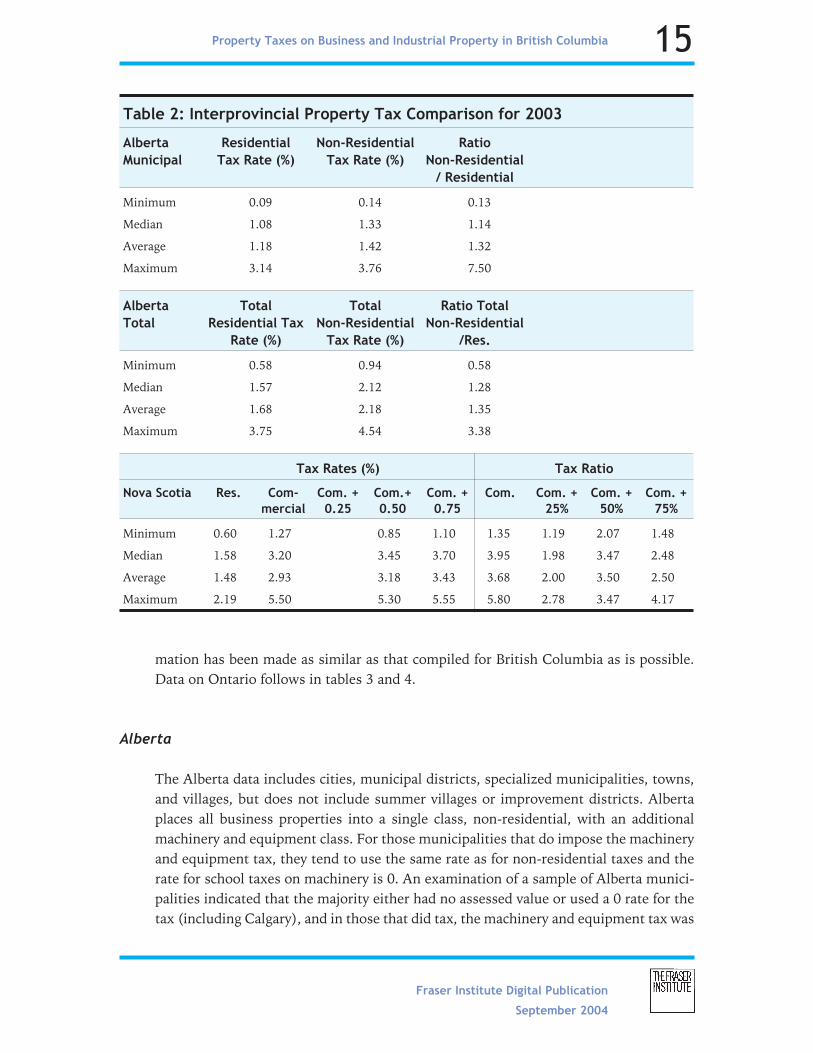
mation has been made as similar as that compiled for British Columbia as is possible.
Data on Ontario follows in tables 3 and 4.
Alberta
The Alberta data includes cities, municipal districts, specialized municipalities, towns,
and villages, but does not include summer villages or improvement districts. Alberta
places all business properties into a single class, non-residential, with an additional
machinery and equipment class. For those municipalities that do impose the machinery
and equipment tax, they tend to use the same rate as for non-residential taxes and the
rate for school taxes on machinery is 0. An examination of a sample of Alberta munici-
palities indicated that the majority either had no assessed value or used a 0 rate for the
tax (including Calgary), and in those that did tax, the machinery and equipment tax was
Fraser Institute Digital Publication
September 2004
Property Taxes on Business and Industrial Property in British Columbia 15
Table 2: Interprovincial Property Tax Comparison for 2003
Alberta
Municipal
Residential
Tax Rate (%)
Non-Residential
Tax Rate (%)
Ratio
Non-Residential
/ Residential
Minimum 0.09 0.14 0.13
Median 1.08 1.33 1.14
Average 1.18 1.42 1.32
Maximum 3.14 3.76 7.50
Alberta
Total
Total
Residential Tax
Rate (%)
Total
Non-Residential
Tax Rate (%)
Ratio Total
Non-Residential
/Res.
Minimum 0.58 0.94 0.58
Median 1.57 2.12 1.28
Average 1.68 2.18 1.35
Maximum 3.75 4.54 3.38
Tax Rates (%) Tax Ratio
Nova Scotia Res. Com-
mercial
Com. +
0.25
Com.+
0.50
Com. +
0.75
Com. Com. +
25%
Com. +
50%
Com. +
75%
Minimum 0.60 1.27 0.85 1.10 1.35 1.19 2.07 1.48
Median 1.58 3.20 3.45 3.70 3.95 1.98 3.47 2.48
Average 1.48 2.93 3.18 3.43 3.68 2.00 3.50 2.50
Maximum 2.19 5.50 5.30 5.55 5.80 2.78 3.47 4.17

from less than 1 percent to as high as 8 percent of the non-residential assessment.
Because there is no summary data on use of machinery and equipment taxation, data on
it is not included in the table. Adding it systematically would have very little effect on the
minimum, median, or average non-resident tax rates, although it could raise the “high”
shown in the table if that municipality imposed it. Median and average municipal resi-
dential tax rates in Alberta are a little over twice BC’s level. Alberta’s municipal non-resi-
dential rates are very close to BC’s business class rates, but Alberta’s non-resident rates
are about 75 percent of BC’s light industry, 44 percent of BC’s major industry and
slightly less than 40 percent of BC’s utility rates. The higher residential rates and lower
business rates result in median and average ratios of less than 1.5, and would not go
above that if machinery and equipment were added. When one looks at specific munici-
palities they do cluster around the mean and median with only 4 of 295 municipalities
having ratios above 3; those include Calgary, Banff, and Jasper.
Alberta is one of the provinces where municipalities may levy a business tax in addition
to business property taxes. A recent study of business taxes by the city of Calgary
observed that very few Alberta municipalities levied such a tax, and for most, revenues
were very low. Calgary, however, had the highest taxes reported and the study noted that
the city’s business tax was equivalent to 27 percent of its non-residential property tax
collections. I estimate that including this tax (for which no centralized data source is
available) could increase the average municipal tax rate by perhaps 5 percent, but for
Calgary itself the rate would need to increase about 30 percent, which would still make
its business rate 1.7 percent and raise its ratio to 3.8. This would result in slightly higher
business rates than the median BC business tax rate of 1.28 percent and about the same
as Vancouver’s 1.64 percent, but Calgary’s rates remain lower than the BC medians for
utilities, major industry, and light industry. Calgary ratios are all lower than BC medians
or Vancouver’s ratios. Edmonton also has a business tax but its overall ratio is lower
than Calgary’s. Systematically adding business-tax-rate-equivalent totals to municipal
rates would not change the basic Alberta-BC patterns.
When one adds school taxes to the municipal taxes and compares them with total taxes
levied within BC municipalities, the same patterns as for municipal taxes remain.
Alberta residential tax rates remain higher than in BC, but BC has higher tax rates and
ratios on all business classes of property.
Nova Scotia
Nova Scotia’s municipalities may set different property tax rates on residential and com-
mercial property and add a business tax based on proportions of assessed value to com-
mercial properties. For the business tax, the provincial government sets maximum
Fraser Institute Digital Publication
September 2004
Property Taxes on Business and Industrial Property in British Columbia 16
assessment ratios for three classes of business. Businesses such as service stations, res-
taurants, and automobile dealers may be taxed on up to 25 percent of the assessed com-
mercial value of the space they use. Financial institutions may be taxed on up to 75
percent of their building’s value and other businesses may be taxed on up to 50 percent
of the assessed value of their building. The average taxable business tax assessment base
is 35.6 percent for all municipalities. For comparative purposes, the Nova Scotia table
shows the residential and commercial property tax rates and ratios, and then provides
what the maximum commercial rates and ratios could be for the three business tax
classes.
Median residential rates in Nova Scotia are a little more than three times BC’s municipal
rates. Median commercial property tax rates are 2.5 times BC’s municipal business rates;
nearly 1.8 times BC’s light industry rates; .92 of BC’s major industry rates; and .91 of
BC’s utility rates. If municipalities add the maximum permitted business tax, which
many do not, the maximum potential rates and ratio are also shown in the table. This
would leave residential rates unchanged but increase taxes on businesses and raise ratios
relative to residential taxes. This, in turn, would bring median commercial property tax
rates above all BC business classes, but the maximums and ratios are all much lower,
with no tax rates above 5.8 percent and no ratios above 4.86.
Nova Scotia has no additional property taxes for schools, as do BC and Alberta. If one
compares total property tax rates and not just municipal tax rates, Nova Scotia’s residen-
tial rates remain slightly higher than BC’s, BC’s business rates are similar depending on
the level of the business tax levied in Nova Scotia, and BC’s utility and major industry
rates are higher. All of BC’s ratios remain higher.
Ontario
Ontario has recently been through major assessment practice changes and rate transi-
tions to implement those changes. It has emerged with more business property classes
than British Columbia, but it also has provincially designated “Ranges of Fairness” for
the mandatory classes. These ranges ensure that taxes are not shifted onto property
classes that are already subject to unfairly high tax rates, or off property classes that are
subject to unfairly low tax rates. There are also regulations for setting transition ratios
and caps on taxes due to reassessments. Fifty-four Ontario municipalities representing
71 percent of the population participate in a detailed study of municipal revenue issues
each year and the observations here are taken from this study (BMA Management Con-
sulting, Municipal Study—2002). Reliance on this study for municipalities avoids trying
to sort out all of the legislative and regulatory changes that have happened since reas-
Fraser Institute Digital Publication
September 2004
Property Taxes on Business and Industrial Property in British Columbia 17
sessment as well as the differences among the two-tier and single levels of local govern-
ment across the province.
Ontario has three mandatory classes for business property: commercial, industrial, and
pipelines. Optional classes, which come under the same constraints as the mandatory
classes, include office buildings, shopping centres, parking lots, and large industrial. Not
all municipalities use the optional classes. The designated range of fairness ratios for the
commercial and industrial classes are 0.60 to 1.10; for pipelines it is 0.60-0.70. The pro-
vincial government does not mandate these ranges, but municipalities can only change
tax rates in ways that move ratios toward the range of fairness, not away. Municipalities
must treat these ranges as objectives and move toward them in their rate setting. In addi-
tion to requiring a move toward range of fairness ratios, in 2000, the province also estab-
lished “Threshold Ratios” which preclude any increase in actual tax rates on any classes
where the threshold ratio is exceeded. The threshold ratio for commercial is 1.98 and for
industrial, 2.63. Currently, not all Ontario municipalities achieve these ratios, but they
are constraining regulations that municipalities are moving toward to create a more
friendly business climate in the province.
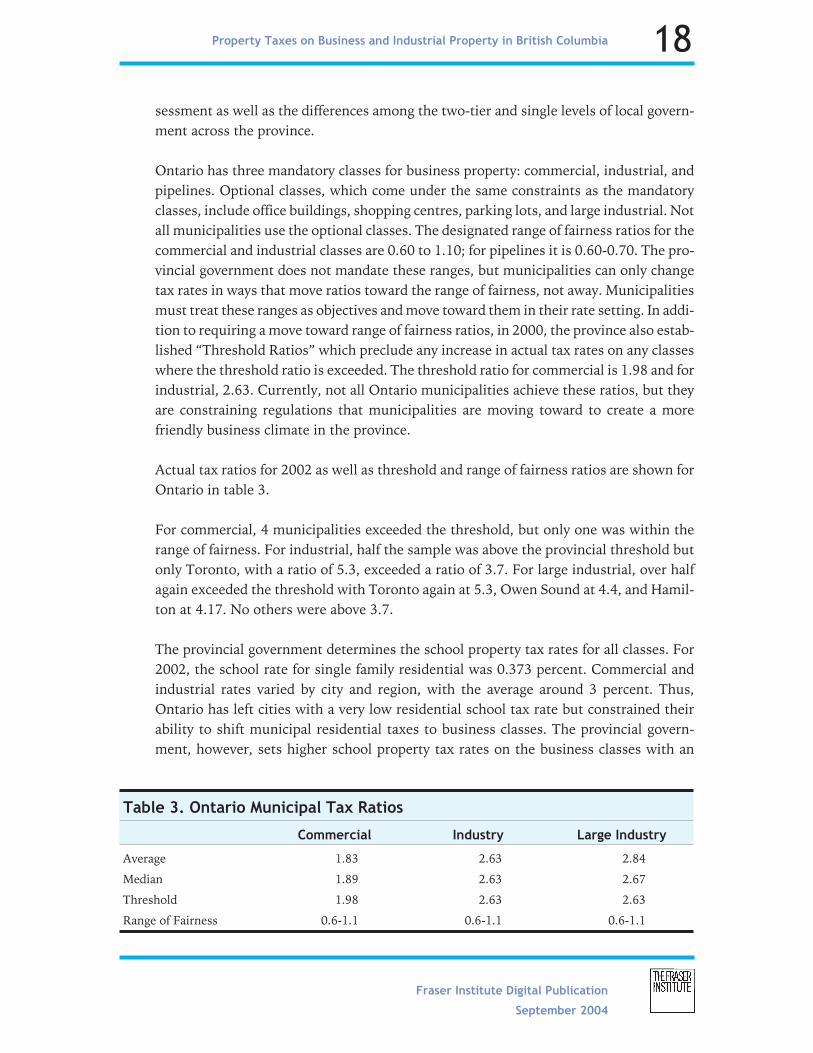
Actual tax ratios for 2002 as well as threshold and range of fairness ratios are shown for
Ontario in table 3.
For commercial, 4 municipalities exceeded the threshold, but only one was within the
range of fairness. For industrial, half the sample was above the provincial threshold but
only Toronto, with a ratio of 5.3, exceeded a ratio of 3.7. For large industrial, over half
again exceeded the threshold with Toronto again at 5.3, Owen Sound at 4.4, and Hamil-
ton at 4.17. No others were above 3.7.
The provincial government determines the school property tax rates for all classes. For
2002, the school rate for single family residential was 0.373 percent. Commercial and
industrial rates varied by city and region, with the average around 3 percent. Thus,
Ontario has left cities with a very low residential school tax rate but constrained their
ability to shift municipal residential taxes to business classes. The provincial govern-
ment, however, sets higher school property tax rates on the business classes with an
Fraser Institute Digital Publication
September 2004
Property Taxes on Business and Industrial Property in British Columbia 18
Table 3. Ontario Municipal Tax Ratios
Commercial Industry Large Industry
Average 1.83 2.63 2.84
Median 1.89 2.63 2.67
Threshold 1.98 2.63 2.63
Range of Fairness 0.6-1.1 0.6-1.1 0.6-1.1
effective ratio of about 8. The relatively low ratio constraints set for municipalities forces
their voters to carefully consider expenditures because they cannot simply raise taxes on
non-residential properties as can be done in provinces with unconstrained variable rates.
At the same time, the very low residential school tax rate helps keep total residential
property tax rates on residences down, even with the lower municipal ratios.
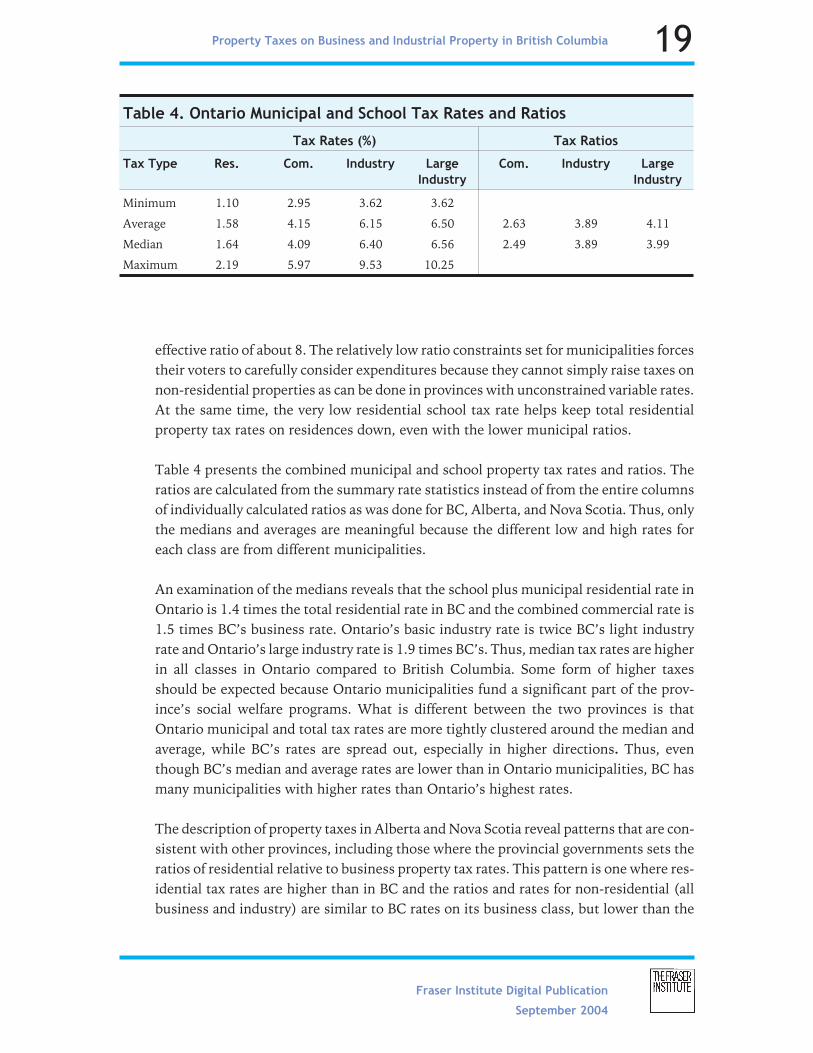
Table 4 presents the combined municipal and school property tax rates and ratios. The
ratios are calculated from the summary rate statistics instead of from the entire columns
of individually calculated ratios as was done for BC, Alberta, and Nova Scotia. Thus, only
the medians and averages are meaningful because the different low and high rates for
each class are from different municipalities.
An examination of the medians reveals that the school plus municipal residential rate in
Ontario is 1.4 times the total residential rate in BC and the combined commercial rate is
1.5 times BC’s business rate. Ontario’s basic industry rate is twice BC’s light industry
rate and Ontario’s large industry rate is 1.9 times BC’s. Thus, median tax rates are higher
in all classes in Ontario compared to British Columbia. Some form of higher taxes
should be expected because Ontario municipalities fund a significant part of the prov-
ince’s social welfare programs. What is different between the two provinces is that
Ontario municipal and total tax rates are more tightly clustered around the median and
average, while BC’s rates are spread out, especially in higher directions. Thus, even
though BC’s median and average rates are lower than in Ontario municipalities, BC has
many municipalities with higher rates than Ontario’s highest rates.
The description of property taxes in Alberta and Nova Scotia reveal patterns that are con-
sistent with other provinces, including those where the provincial governments sets the
ratios of residential relative to business property tax rates. This pattern is one where res-
idential tax rates are higher than in BC and the ratios and rates for non-residential (all
business and industry) are similar to BC rates on its business class, but lower than the
Fraser Institute Digital Publication
September 2004
Property Taxes on Business and Industrial Property in British Columbia 19
Table 4. Ontario Municipal and School Tax Rates and Ratios
Tax Rates (%) Tax Ratios
Tax Type Res. Com. Industry Large
Industry
Com. Industry Large
Industry
Minimum 1.10 2.95 3.62 3.62
Average 1.58 4.15 6.15 6.50 2.63 3.89 4.11
Median 1.64 4.09 6.40 6.56 2.49 3.89 3.99
Maximum 2.19 5.97 9.53 10.25
rates on BC’s utilities, light industry, and major industry classes. The rates set by the
municipalities are also much more clustered around the averages and medians, where in
BC, rates on utilities, light industry, and especially major industry are spread out with
some very high rates in some municipalities.
Ontario demonstrates a pattern more like BC where the many classes of property led to
very high rates and ratios on industry and some businesses classes, which are now being
constrained by Ontario provincial legislation with its defined “Ranges of Fairness” and
“Threshold Rates.”
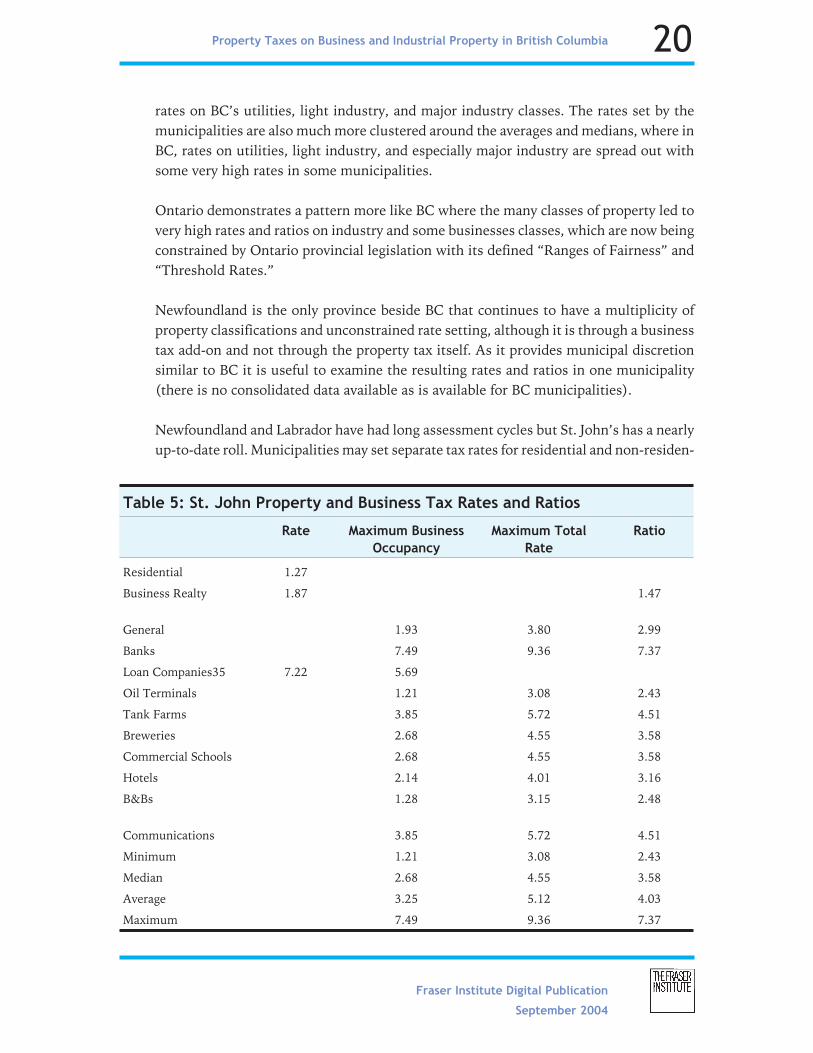
Newfoundland is the only province beside BC that continues to have a multiplicity of
property classifications and unconstrained rate setting, although it is through a business
tax add-on and not through the property tax itself. As it provides municipal discretion
similar to BC it is useful to examine the resulting rates and ratios in one municipality
(there is no consolidated data available as is available for BC municipalities).
Newfoundland and Labrador have had long assessment cycles but St. John’s has a nearly
up-to-date roll. Municipalities may set separate tax rates for residential and non-residen-
Fraser Institute Digital Publication
September 2004
Property Taxes on Business and Industrial Property in British Columbia 20
Table 5: St. John Property and Business Tax Rates and Ratios
Rate Maximum Business
Occupancy
Maximum Total
Rate
Ratio
Residential 1.27
Business Realty 1.87 1.47
General 1.93 3.80 2.99
Banks 7.49 9.36 7.37
Loan Companies35 7.22 5.69
Oil Terminals 1.21 3.08 2.43
Tank Farms 3.85 5.72 4.51
Breweries 2.68 4.55 3.58
Commercial Schools 2.68 4.55 3.58
Hotels 2.14 4.01 3.16
B&Bs 1.28 3.15 2.48
Communications 3.85 5.72 4.51
Minimum 1.21 3.08 2.43
Median 2.68 4.55 3.58
Average 3.25 5.12 4.03
Maximum 7.49 9.36 7.37

tial property. The residential rate reported for St John’s is 1.27 percent with a non-resi-
dential rate of 1.87 percent for a ratio of 1.47. In addition there are 10 categories of
business tax, with the highest on banks, as in Nova Scotia. While the basic property tax
rate differences between residential and business realty are relatively small, business
occupancy tax rates can be quite high and thus make a significant change in the ratios.
These rates and revised ratios are indicated in table 5 below. Newfoundland has no
school property taxes.
The basic residential tax rate in St. John’s is higher than BC’s median municipal residen-
tial rate and about the same as the BC total tax rate within a municipality. The overall
ratio between residential and business property tax rates of 1.47 is lower than the
median in BC and similar to many jurisdictions across Canada. What stands out, how-
ever, is the variety and rates of the business occupation tax. The median and average
rates of property taxes plus business occupation taxes at 3.6 and 4 percent are higher
than the general business and similar to the light industry classes in BC, but several
other classes, especially banks and loan companies, are taxed at quite high rates and thus
have high ratios as well.
US States
Municipalities within the 50 US states and District of Columbia have a similar history to
municipalities within Canadian provinces in their use of property taxes. Both began with
the property tax as a wealth tax and have been narrowing it to a tax based on land and
buildings. During the past few decades, however, municipalities in more states have
been permitted to expand their revenue sources to include retail sales and income taxes
so that their reliance on property taxation as their only significant tax has declined.
While additional taxes may appear desirable to municipal officials, these other revenue
sources, especially the income tax, have introduced considerable instability into munici-
pal revenues and caused serious financial problems during the last economic downturn.
The debate as to whether Canadian municipalities should be allowed to use these addi-
tional taxes continues.
Within the context of additional tax sources, the property tax still remains the single
most important revenue source for most local governments in the US. While the diver-
sity of property tax systems is as great as in Canada, the Minnesota Center for Public
Finance Research undertakes far more complete comparisons of property taxation
among the 51 states than is available in Canada.9 The information presented here is
Fraser Institute Digital Publication
September 2004
Property Taxes on Business and Industrial Property in British Columbia 21
9 Data on US states is from the Minnesota Center for Public Finance Research, }{\plain \i 50-State Property
Tax Comparison Study.}{\plain
largely from that source. Descriptions will be limited to rates and ratios in relation to
business properties as was the description of provincial systems.
The Minnesota Center’s studies are extremely detailed. Because of widely diverse
assessment practices their methodology is different from that used in the inter-provin-
cial comparisons. Their approach is to select representative residences, three differ-
ent-sized commercial establishments, and three different-sized industrial properties and
calculate the actual taxes that would be paid by those properties in the largest city and a
representative small city within each state. This approach does not provide for the diver-
sity that may occur within a state. On the other hand, that diversity is much less likely
than in Canadian provinces because of either constitutional or legislative provisions
which either require uniform rates on all classes of property or set the ratios that must be
used. This methodology also produces the effective rate for total property taxes, not just
the municipal rate. The methodology also takes into account exemptions (like the BC
homeowners grants) where they exist. By being able to take residential exemptions into
account, the effective rate is lower than the Canadian published rates, especially for
low-valued properties. This lower effective rate on residential properties also creates an
upward bias in ratio calculations because the residential properties are the ones that
receive the exemptions.
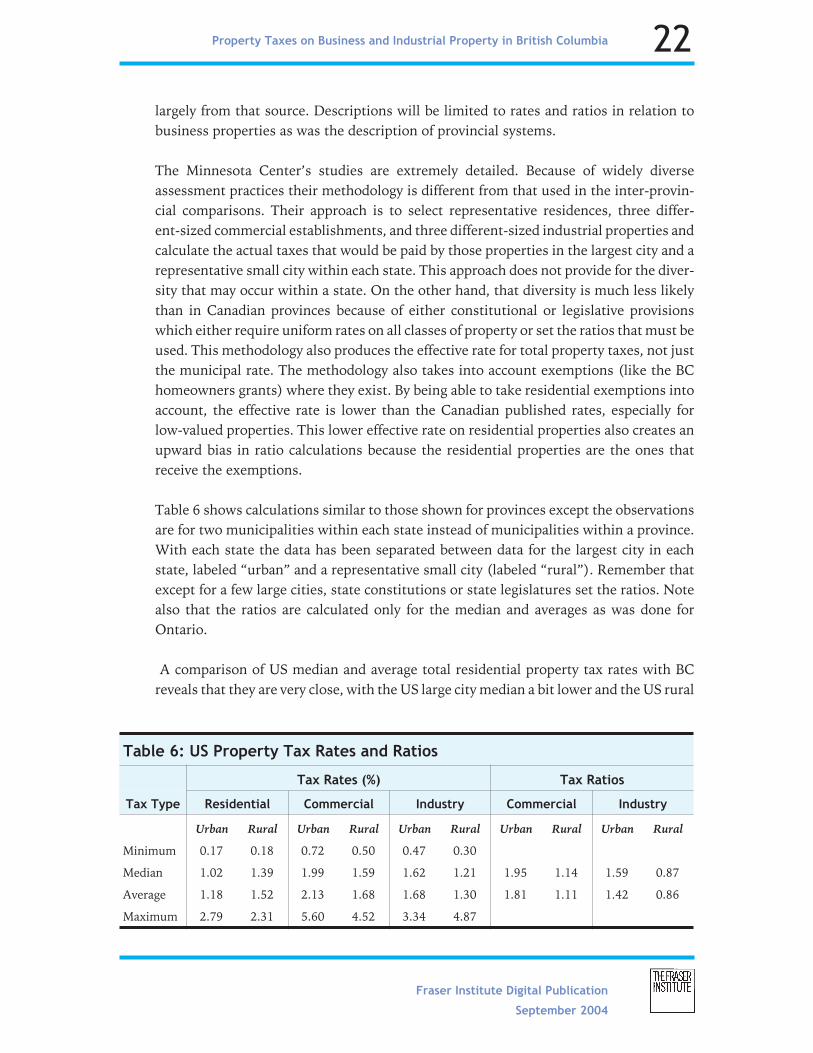
Table 6 shows calculations similar to those shown for provinces except the observations
are for two municipalities within each state instead of municipalities within a province.
With each state the data has been separated between data for the largest city in each
state, labeled “urban” and a representative small city (labeled “rural”). Remember that
except for a few large cities, state constitutions or state legislatures set the ratios. Note
also that the ratios are calculated only for the median and averages as was done for
Ontario.
A comparison of US median and average total residential property tax rates with BC
reveals that they are very close, with the US large city median a bit lower and the US rural
Fraser Institute Digital Publication
September 2004
Property Taxes on Business and Industrial Property in British Columbia 22
Table 6: US Property Tax Rates and Ratios
Tax Rates (%) Tax Ratios
Tax Type Residential Commercial Industry Commercial Industry
Urban Rural Urban Rural Urban Rural Urban Rural Urban Rural
Minimum 0.17 0.18 0.72 0.50 0.47 0.30
Median 1.02 1.39 1.99 1.59 1.62 1.21 1.95 1.14 1.59 0.87
Average 1.18 1.52 2.13 1.68 1.68 1.30 1.81 1.11 1.42 0.86
Maximum 2.79 2.31 5.60 4.52 3.34 4.87
median and average a bit higher than in BC. Median BC business rates are a bit higher
than US commercial rates, although BC maximums are triple the US maximum.
The greatest differences between the US and BC is in major industrial rates. Here meth-
odological differences are much less important and the US median and average rates of
close to 1.6 percent are less than one-third of the BC total median and average rates of
4.94 and 5.13 percent. An even more extreme difference, however, is revealed in the
maximum rates where the maximum US rate was 3.34 percent in large cities and 4.87
percent in a small town, rates less than the BC median and about one- third of the BC
maximum of 14.5 percent. The differences are only a little less extreme for light indus-
try. The commercial class has less difference than light industry but tax rates are still sig-
nificantly higher in BC, with the US median and average being close to 1.6 percent
compared to BC’s median and average of 2.69 percent and 2.78 percent. Again BC’s max-
imums are much higher than in the US, with a high rate of 8.08 percent in BC compared
to 4.87 percent in the US. One must be careful when comparing maximum rates as the
methodology used for the US study may have missed exceptionally high rates in some
municipality in one of the very few states that allow greater municipal discretion in set-
ting their ratios among classes.
The overall differences in the patterns are in the treatment of business properties rela-
tive to residential properties. Insofar as tax rates go, both treat residential properties
similarly. However, in the US, commercial and industrial properties are taxed at much
lower rates than residential properties and in small towns industrial properties are usu-
ally taxed at lower rates than residences. In BC, commercial properties are taxed at about
2.3 times the residential rate, light industry at about 3 times the residential rate, and
major industry about 4 times as much as residential. The net result, insofar as property
taxation is concerned, is that most US states provide a much more business friendly
property tax climate and expect their residents to pay a greater share of property taxes to
support local governments than is the case in Canada.
Fraser Institute Digital Publication
September 2004
Property Taxes on Business and Industrial Property in British Columbia 23
Observations
Rates and Ratios
In Canada, BC has the lowest median municipal and total rates on residential properties
with total rates at around 1.2 percent. Total residential rates in Nova Scotia and Ontario
are 1.5 to 1.6 percent and a little over 2 percent in Alberta. US median residential rates
tend to be slightly lower than in BC.
Non-residential property taxes are more complicated because different provinces have
different classification systems. For BC’s business class (which excludes utilities, light
and major industry), Alberta’s median is on average the lowest of the provinces for
which comprehensive data is available. Alberta’s median is 2.1 percent compared to BC’s
2.7 percent. Nova Scotia is higher at (3.45 to 3.95 percent) and Ontario is still higher at
about 4 percent. In St. John’s, Newfoundland, the multiplicity of business plus property
taxes ranges from comparable to Nova Scotia to higher than Ontario. Other provinces
have their non-residential tax ratios constrained by their provincial governments at
ratios of 1.5 to 2.5. This will generally put their business taxes into the 3 to 4 percent
range, similar to Nova Scotia and Ontario, and slightly higher than in BC.
For other kinds of business (utilities, light industry and major industry), Alberta’s rates
and ratios are, on average, lower. It has only one class for all business properties and sep-
arate business occupancy taxes are not widely imposed. Nova Scotia, through its busi-
ness taxes, and Ontario, through more classifications, can treat different businesses
differently. For median and average rates, BC’s rates on light industry and major indus-
try move up to be about the same as Nova Scotia’s, in the 3+ percent range. BC’s utility
tax rates move up to 5.5 percent. Ontario, however, taxes industry and large industry in
the 6.1 to 6.5 percent range. The overall profile for median and average municipal and
total property tax rates in BC should not be a problem for business competitiveness with
the rest of Canada, although compared to Alberta, BC has a pattern of lower residential
rates and higher rates on businesses, especially in the major industry and utilities
classes. The pattern across Canada appears to be one where businesses are taxed more
highly than residences relative to what can be justified by the limited amount of evidence
that exists on the costs of providing municipal services to different classes of property.
Virtually all Canadian provinces levy higher property taxes on business than is common
in US states. This difference results from US municipalities having more alternative rev-
enue sources and constraints on taxing non-residential compared to residential proper-
ties. In most US states, property taxes are also generally lower instead of higher on
industrial property compared to commercial property. In comparison with US state
Fraser Institute Digital Publication
September 2004
Property Taxes on Business and Industrial Property in British Columbia 24
medians, BC’s median business class rate is 2.7 percent compared to 2.0 percent, and on
industry 3.1 to 3.4 percent compared to the US 1.6 percent. In comparison with its clos-
est US neighbour, Washington State, BC’s median rates are relatively high, with Wash-
ington State residential and commercial property taxes running about 1 percent and
their industrial property taxes running at 0.8 percent. These rates are fairly uniform.
This is quite a difference from those BC municipalities that levy industrial property taxes
at rates up to 14.5 percent.
An examination of median tax rates and ratios provides some insight into how systems
compare. However, in an examination of the maximum rates and ratios, British Colum-
bia stands out in its municipal and total rates and municipal ratios; it has the highest
maximum rates and ratios in Canada for utilities, light industry, and major industry. It is
useful to examine what has happened in those municipalities whose major industry prop-
erty tax rates are in the top 25 percent of BC municipalities that contain such industry.
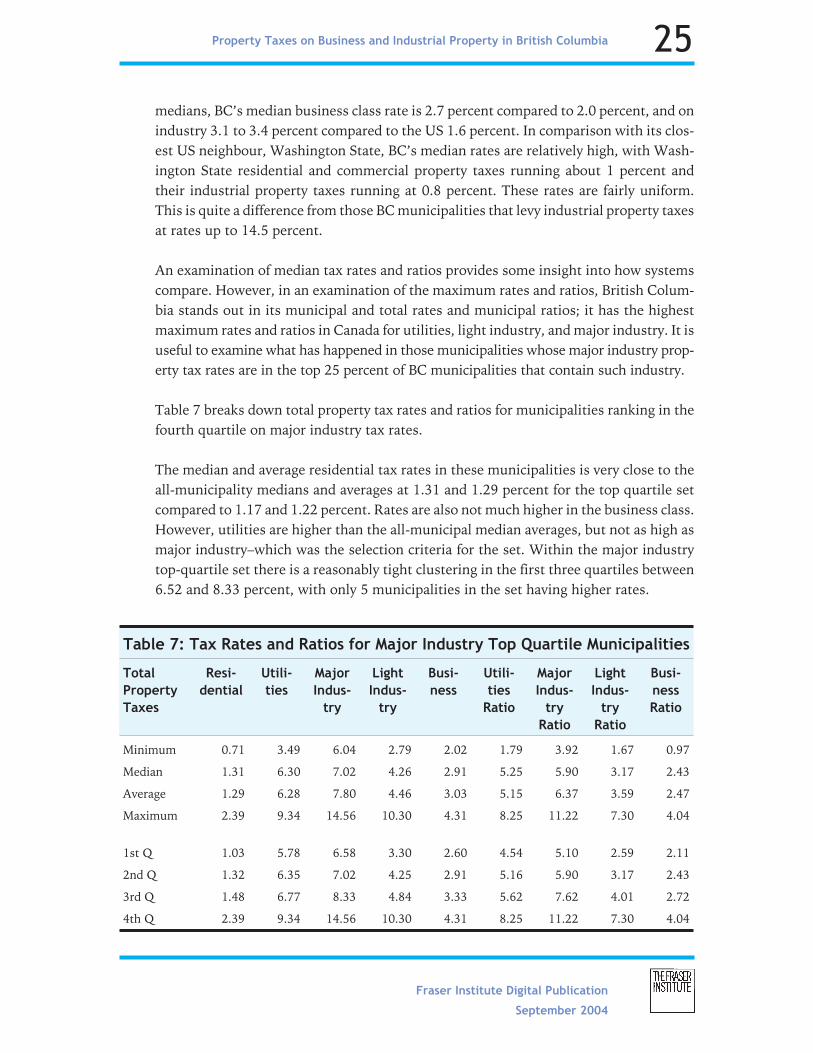
Table 7 breaks down total property tax rates and ratios for municipalities ranking in the
fourth quartile on major industry tax rates.
The median and average residential tax rates in these municipalities is very close to the
all-municipality medians and averages at 1.31 and 1.29 percent for the top quartile set
compared to 1.17 and 1.22 percent. Rates are also not much higher in the business class.
However, utilities are higher than the all-municipal median averages, but not as high as
major industry–which was the selection criteria for the set. Within the major industry
top-quartile set there is a reasonably tight clustering in the first three quartiles between
6.52 and 8.33 percent, with only 5 municipalities in the set having higher rates.
Fraser Institute Digital Publication
September 2004
Property Taxes on Business and Industrial Property in British Columbia 25
Table 7: Tax Rates and Ratios for Major Industry Top Quartile Municipalities
Total
Property
Taxes
Resi-
dential
Utili-
ties
Major
Indus-
try
Light
Indus-
try
Busi-
ness
Utili-
ties
Ratio
Major
Indus-
try
Ratio
Light
Indus-
try
Ratio
Busi-
ness
Ratio
Minimum 0.71 3.49 6.04 2.79 2.02 1.79 3.92 1.67 0.97
Median 1.31 6.30 7.02 4.26 2.91 5.25 5.90 3.17 2.43
Average 1.29 6.28 7.80 4.46 3.03 5.15 6.37 3.59 2.47
Maximum 2.39 9.34 14.56 10.30 4.31 8.25 11.22 7.30 4.04
1st Q 1.03 5.78 6.58 3.30 2.60 4.54 5.10 2.59 2.11
2nd Q 1.32 6.35 7.02 4.25 2.91 5.16 5.90 3.17 2.43
3rd Q 1.48 6.77 8.33 4.84 3.33 5.62 7.62 4.01 2.72
4th Q 2.39 9.34 14.56 10.30 4.31 8.25 11.22 7.30 4.04
All business class ratios are higher at all ranges of the set. An examination of the ratios
used by these municipalities for municipal tax rates reveals that the minimum is 5.54,
the median 10.52, the average 10.14, and the maximum is 19.55. This means that the
municipalities with the highest major industry rates and accompanying higher rates in
other business classes also keep their residential rates similar to other municipalities in
BC. The result is that they have higher ratios on business class properties than anywhere
else that has been examined in Canada. Appendix B provides a list of the top major
industry quartile by total tax rates, along with their municipal major industry ratios.
What is noticeable from the list is that virtually none of the municipalities are in the
Lower Mainland or southern Vancouver Island where even low residential tax rates
would lead to high tax bills because of high assessed values; they are primarily munici-
palities where residential values are much lower.
The ratios used by municipalities for municipal taxes are higher than ratios for total
taxes because of the BC government’s uniform school tax rates, but the resulting total
rates and ratios are still highest in Canada and insofar as US summary data goes, the low-
est BC rate in the fourth quartile set is higher than in any US state and 3 to 5 times higher
than US state median rates.
Within these municipalities, residential tax rates have been kept at provincial averages.
These are not Lower Mainland municipalities with high residential property values, so
their actual tax payments are below the provincial average. In these municipalities, busi-
ness and light industry rates are higher than the BC averages, utilities are about average
(they are high across BC), but major industry rates are extremely high–ranging from 6.4
to 14.6 percent. In all of these classes some municipalities appear to have the highest
property tax rates in all of North America. In relation to the United States, the lowest BC
major industry rate in the fourth quartile is also higher than in any US state and 3 to 5
times higher than state median rates. The ratios of the major industry relative to residen-
tial rates are also the highest in North America, with ratios in the top quartile ranging
from 5.55 to 19.55. These are extreme and demonstrate very strong evidence that major
industry is being forced to pay taxes far in excess of any servicing costs to subsidize the
residents in those municipalities. Given these extremely high rates and ratios of taxation
of major industry, it is useful to examine some of the factors involved.
Classification systems
Different provinces have different classification systems for setting tax rates. It appears
that when property tax classifications place all business properties in the same class, as
does Alberta, all businesses are taxed with reasonable ratios compared to residential. It
is only when municipalities have discretion over a larger number of classes such as BC’s
4 classes of business properties, or St. John’s 10 categories of business occupancy taxes,
Fraser Institute Digital Publication
September 2004
Property Taxes on Business and Industrial Property in British Columbia 26
that we see exceptionally high rates and ratios on some classes. Perhaps the lack of a
local business community to represent major industry and utilities in BC municipalities
and the immobility of these properties accounts for their high rates.
Comparing kinds of taxes
Property tax rates sound low, especially compared to income tax rates. The difference is
that the property is taxed over and over again, where a sale or income is only taxed once.
To put property tax rates in context, at the lowest fourth quartile, major industry pays a
total property tax rate of 6.375 percent. This is equivalent to a 50 percent excise tax rate
on the new facility. Or, if the facility returns the expected profit, the property tax is
equivalent to a 50 percent income tax. And of course if the facility does not return the
expected profit, the property tax must be paid anyway, which can result in property tax
rates being equivalent to higher than 100 percent income tax rates. In addition, the fact
that high property taxes must be paid even if a company is making a loss can lead to
bankruptcies and company closures where income taxes are only paid when a company
has profits and can afford them. BC’s high property taxes on major industry exacerbate
this problem. Thus, what at first glance looks like a low tax rate is in fact equivalent to
very high rates of other taxes and is also much more destabilizing than those high rates
for other taxes would be.10
Efficient council decisions on services
The most important decision process for a municipality is preparation of its annual bud-
get. During the process the council must balance the costs of services against their bene-
fits. Where all classes of taxpayers are affected by decisions, the council has an incentive
to be efficient in its decisions. This is one reason why Ontario has constrained the ability
of municipalities to shift taxes away from residences to non-residential properties with
municipal property tax ratio limits. In BC, in contrast, municipal councils can provide
more services for their residents than their residents would be willing to pay for because
the council can shift the tax burden to other classes of property. It is nice for residential
taxpayers to reside in such a system, at least in the short run. It is not so desirable if the
resulting high taxes on those activities cause investing and adding to the tax base in the
municipality to be discontinued. The mismatch between taxpayers and benefits has been
addressed for geographic areas in the form of special taxing areas and the regional dis-
trict system. While the provincial allowance for levying different property tax rates on
Fraser Institute Digital Publication
September 2004
Property Taxes on Business and Industrial Property in British Columbia 27
10 A Corporate Capital Tax has similar problems where its profit-insensitive nature causes more problems
than just its rate.
nine different classes of property provides the opportunity to further refine the use of the
property tax as a group user charge, in about one-fourth of BC’s municipalities it appears
that municipal councils use excessive rates on utilities, light industry and major industry
to subsidize their residential voters instead.
One should not be surprised that municipal councils seek to satisfy their voters, who are
largely residential, by keeping their property taxes low at the expense of non-residential
properties. This is most likely why the great majority of provincial and state govern-
ments in North America set the ratios between residential and non-residential property
tax rates for their municipalities and do not permit the high ratios that have emerged in
Ontario (and are being pulled back by the provincial government), Newfoundland, and
BC to emerge in the first place.
The business climate
High rates of property taxation have different consequences for different kinds of busi-
nesses. Where the land is a large proportion of the assessed value, the developer can
offer a lower price for the land to offset part of the expected property tax burden and for
businesses that rent or lease, property taxes can be taken into account in setting rental
prices. However, specifically for major industry, land is usually a very small proportion of
their assessed value and the company generally owns the property. Thus, the company
has to treat property taxes as a cost of doing business in making investment decisions.
High property taxes in some municipalities will obviously discourage business invest-
ment in those municipalities unless those taxes are offset by municipally-provided ser-
vice benefits. In some high-tax rate municipalities, it is likely that no company will invest
or reinvest in that municipality; when its plant is obsolete, it will simply close up and
leave. While obtaining high revenues from an industry to keep residential property taxes
low may appear to be a desirable policy, if those high taxes discourage new investment,
the high rates may contribute to a potential disaster for the community.
While it is obvious that high property tax rates may influence business investment deci-
sions in the high-rate municipalities, what may not be recognized is that the use of high
tax rates by a significant number of municipalities may also affect business decisions to
invest in other BC municipalities. This is because after an investment is made, the
municipal council can proceed to raise property tax rates on the investment as high as it
wants. An investor can feel fairly safe if the investment is in the business class, where
there is likely to be a local business community that influences council, but investors in
major industry or utilities would not feel the same safety because once the investment is
in place, they are vulnerable. Their vulnerability is demonstrated by the fact that a signif-
icant number of BC municipalities already have what appear to be the highest tax rates
and ratios on major industry and utilities in Canada—and probably in North America.
Fraser Institute Digital Publication
September 2004
Property Taxes on Business and Industrial Property in British Columbia 28
This should be of concern to all municipalities in the province and to the provincial gov-
ernment. For a major industry to make the required large investments in plant and
equipment requires confidence that taxes will be fair, comparable to other jurisdictions,
and predictable. These conditions are a necessary characteristic of a favourable business
climate and, with regard to the taxation of major industry and, to a slightly lesser extent,
utilities, are missing at this time in British Columbia.
Since variable rates were introduced in 1984, BC’s provincial government has had to
intervene twice to reduce municipal property taxation of business. First, the provincial
government changed the way railways were assessed and imposed caps on tax rates or
ratios for utilities. Second, the provincial government constrained the taxation of light
and major industry within port areas. In port areas, property tax rates had become very
high compared to the property taxes imposed on port facilities on the US West Coast,
especially in Washington State. Interestingly, in the exchange of arguments over the rate
capping, not one municipality produced a report indicating that it was receiving less rev-
enue from its port area than it was costing to provide it with municipal services.11 Given
their tax rates in the context of other research it is very likely that the port area industrial
properties were providing a surplus, which the municipalities used to keep the residen-
tial tax rates of their voters down. The data in this report indicate that high tax rates on
major industry and utilities (and even light industry rates are very high compared to
Washington State) extend far beyond port areas. Other areas of BC’s economy may also
be uncompetitive due to high property tax rates in some municipalities; these high rates
can have a negative influence on investments throughout the province. For example,
over the next decade, hundreds of millions (if not billions) of dollars in energy facilities
need to be constructed between the natural gas fields of Northern BC, Alberta, Alaska,
the Beaufort Sea, and electricity users in Arizona and California. Whether or not a juris-
diction can secure those investments to convert energy from pipe to wire will be influ-
enced by property tax rates, and right now, BC is not a competitive location for those
investments, nor is it competitive for any other major industry investment that does not
depend specifically on a local natural resource.
Fraser Institute Digital Publication
September 2004
Property Taxes on Business and Industrial Property in British Columbia 29
11 The major study of port competitiveness is Perrin, Thorau & Associates, 2001. The City of Vancouver and
other municipalities have placed their arguments on their respective municipal web sites.
Conclusions
While additional research may be helpful, it is very unlikely to change the major con-
clusions of this report: the very high property tax rates and ratios imposed on major
industry, and to a slightly lesser extent utilities, in a significant minority of BC’s munici-
palities have caused the province to have a serious business climate problem. There are
two approaches to consider, both of which offer potential solutions. Neither approach
would prevent municipalities from setting tax rates to cover their costs of services in a
flexible manner, but both would affect their discretion to levy very high tax rates on nar-
row classes of property.
The first approach is to combine all 4 business classes into a single class, as is done in
other provinces except Ontario. The same effect can be achieved by tying major industry
and utility12 tax rates and ratios directly to the business or light industry classes. What
limited evidence exists in Canada indicates that with such a broad classification system,
business tax ratios remain reasonable. It is unlikely that local business class property
owners would find such an approach attractive, but in the long run if major industry
chooses not to reinvest or locate in high-tax municipalities, their own businesses will
suffer. In some municipalities such a move would also likely generate tax increases for
residents. The statistics are available to analyze short-run consequences. The difficulty is
in predicting any increase in investment that might occur in light of lower tax revenues
that would result from lower taxes on major industry or utility properties in the long
run.
A second approach would be for BC to look more closely at the applicability of the
Ontario reforms. They involve determining ranges of fairness and thresholds based on
average property tax rates in the municipalities for different major classes, and then
requiring all tax rate changes to move toward the range of fairness. The Ontario provin-
cial government also imposes a very low rate for residential school taxes that has freed
up municipalities to raise their own residential tax rates, which in turn reduces the ratio
between residential taxes and business classes. This reform has the advantage of creat-
ing a fairer and more competitive property tax system. It has the added benefit of
improving the efficiency of council decisions by forcing councils to consider any expendi-
ture increases compared to tax increases on residents instead of passing them on to
non-voters in business classes.13
Fraser Institute Digital Publication
September 2004
Property Taxes on Business and Industrial Property in British Columbia 30
12 While utility tax rates are limited to 4 percent or a 2.5 ratio relative to business class tax rates, utility tax
rates are still very high. Given research on the costs of providing services elsewhere, there is no service
cost justification for these rates.
13 Issues of the Ontario reform are described in Slack, 2000. This paper also contains many references to
reports leading up to the reforms.
It is important to note that neither of these recommendations would prevent the prop-
erty tax from continuing as a geographically-based user charge, with its flexibility to
adjust rates up or down, and with its potential for different rates in different small areas.
It is also very unlikely that these reforms would prevent the property tax from being
related to the costs of servicing business relative to residential properties. What they
would do is prevent specific classes of property from being targeted for taxation dispro-
portionate to the costs of providing services to them in order to subsidize the costs of
services for residential taxpayers.
BC’s introduction of complete municipal tax discretion in 1984 with 4 different business
class taxes offered municipalities the opportunity to relate property taxes to the costs of
serving different classes or property. However, in at least one-quarter of municipalities,
it has led to serious business climate problems for major industry and utilities. These
problems must be resolved if BC is going to attract the scale of investment it needs to
replace aging plant and equipment. If these problems aren’t resolved, facilities will close,
and the resulting higher taxes will be imposed on whoever is left.14 Reforming any tax
system is extremely difficult. Officials dedicated to the long-run health of the province’s
economic climate must politically drive reforms. Perhaps other provincial and state gov-
ernments are correct in not permitting the total variable tax rate discretion that BC has
allowed for its municipalities, not because a majority of municipalities have not acted
responsibly, but because a minority may create an unfavourable business climate that
harms everyone.
Fraser Institute Digital Publication
September 2004
Property Taxes on Business and Industrial Property in British Columbia 31
14 The highest residential, utility, light industry, and business tax rates in British Columbia are found in a
municipality that used to have major industry that closed. It no longer has to be concerned with its tax
rate on major industry.
Appendix A: BC Property Classifications
Class 01: Residential—includes single family, multi-family, summer homes and
vacant land not zoned or used for other purposes.
Class 02: Utilities—includes railways, pipelines, telephone lines, cable TV and electri-
cal systems.
Class 03: Unmanaged Forest Land—includes forest land which is not managed in
accordance with an approved Forest Management Plan.
Class 04: Major Industry—includes land and buildings of major industrial properties
such as lumber or pulp mills, mining operations and others.
Class 05: Light Industry—includes properties used for extracting, manufacturing, or
transporting products. Scrap metal yards, wineries, and boat-building yards
fall within this category.
Class 06: Business/Other—includes properties that do not fall into the other catego-
ries such as hotels, offices, warehouses, and others.
Class 07: Managed Forest Land—privately-owned land designated as Forest Land
Reserve and for which BC Assessment has approved a Forest Management
Plan.
Class 08: Recreational Property/Non-profit Organization—includes land used solely
as an outdoor recreational facility such as golf courses, waterslides, marinas,
and others.
Class 09: Farm Land—farm land must produce primary agricultural products for sale
such as a crop or livestock.
Fraser Institute Digital Publication
September 2004
Property Taxes on Business and Industrial Property in British Columbia 32
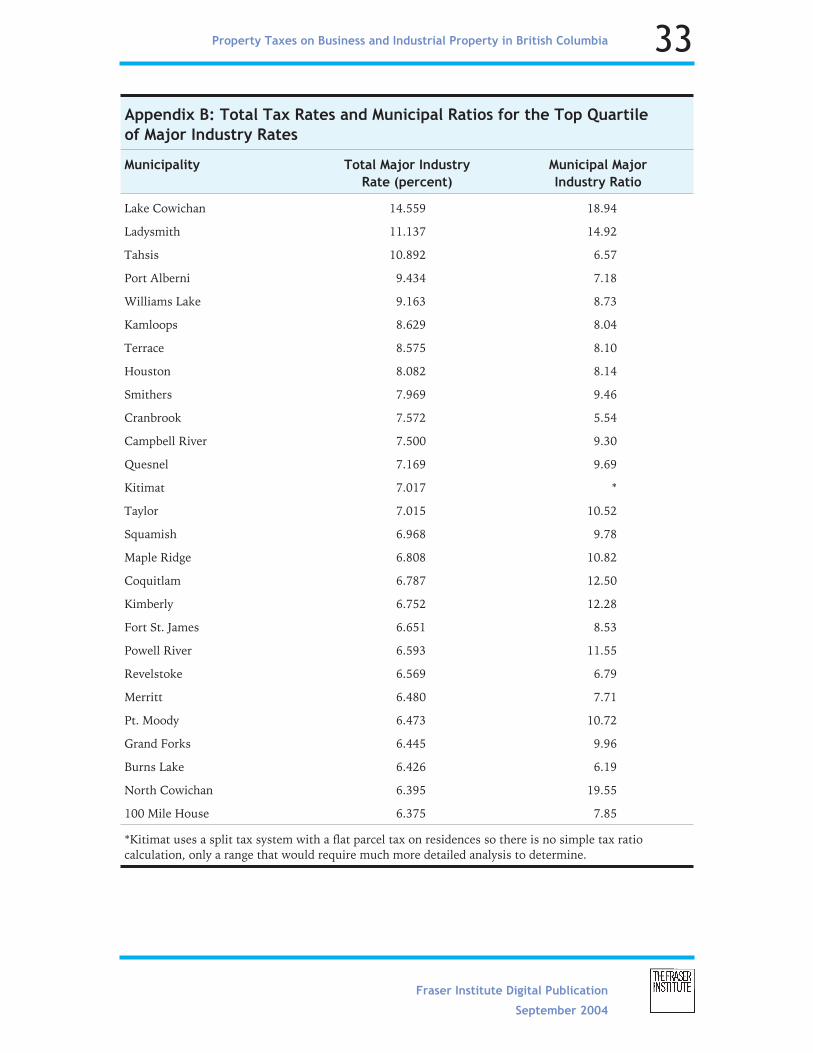
Fraser Institute Digital Publication
September 2004
Property Taxes on Business and Industrial Property in British Columbia 33
Appendix B: Total Tax Rates and Municipal Ratios for the Top Quartile
of Major Industry Rates
Municipality Total Major Industry
Rate (percent)
Municipal Major
Industry Ratio
Lake Cowichan 14.559 18.94
Ladysmith 11.137 14.92
Tahsis 10.892 6.57
Port Alberni 9.434 7.18
Williams Lake 9.163 8.73
Kamloops 8.629 8.04
Terrace 8.575 8.10
Houston 8.082 8.14
Smithers 7.969 9.46
Cranbrook 7.572 5.54
Campbell River 7.500 9.30
Quesnel 7.169 9.69
Kitimat 7.017 *
Taylor 7.015 10.52
Squamish 6.968 9.78
Maple Ridge 6.808 10.82
Coquitlam 6.787 12.50
Kimberly 6.752 12.28
Fort St. James 6.651 8.53
Powell River 6.593 11.55
Revelstoke 6.569 6.79
Merritt 6.480 7.71
Pt. Moody 6.473 10.72
Grand Forks 6.445 9.96
Burns Lake 6.426 6.19
North Cowichan 6.395 19.55
100 Mile House 6.375 7.85
*Kitimat uses a split tax system with a flat parcel tax on residences so there is no simple tax ratiocalculation, only a range that would require much more detailed analysis to determine.
References
Property tax systems and rate information were obtained from provincial government
and municipal web sites.
Bish, Robert L. (2003). Property Taxes on Business and Industrial Property in British Columbia:
Comparisons and Business Climate Observations. Local Government Institute, Univer-
sity of Victoria, WP #11 (October). This report can be found at either www.rbish.ca
or http://web.uvic.ca/padm/cpss/lgi/publish.htm as Working Paper #11.
Bish, Robert L. and Eric G. Clemens (1999). Local Government in British Columbia. Union
of BC Municipalities, Richmond.
BMA Management Consulting, Inc. (2002). Municipal Study—2002. (A comparison of
Ontario municipalities).
City of Calgary. Final Report of the Business Tax Review Tax Force, July 7, 2003.
Kitchen, Harry (2002). Municipal Revenue and Expenditure Issues in Canada. Canadian Tax
Foundation.
KPMG (1995). Study of Consumption of Tax-Supported City Services. 2 vols. Prepared for the
City Council, City of Vancouver.
Mair, Douglas (1991). “The Incidence of the Property Tax: A Survey.” British Review of
Economic Issues (October): 1-27.
Minnesota Center for Public Finance Research (2003). 50-State Property Tax Comparison
Study. Published in cooperation with the Minnesota Taxpayers Association. Infor-
mation on obtaining a copy can be found at www.mntax.org/cpfr/property.php.
Perrin, Thorau and Associates (2001). Discussion Paper: Options to Improve the Competitive-
ness of Ports in British Columbia. Prepared for the BC Ministry of Employment and
Investment (March).
Slack, Enid (2000). “Property Tax Reform in Ontario: What Have We Learned?” Cana-
dian Tax Journal. Vol. 50, no. 2. Pp. 576-585.
Fraser Institute Digital Publication
September 2004
Property Taxes on Business and Industrial Property in British Columbia 34
About the Author
Robert L. Bish earned his Ph.D. in Economics from Indiana University in 1968 and
served in departments or schools of economics, public affairs, public administration, and
urban studies at the universities of Washington, Southern California, and Maryland
before joining the School of Public Administration at the University of Victoria in 1981.
Dr. Bish co-founded the Local Government Institute at the university and has continued
to work and publish with the Institute since his retirement in 1998. Dr. Bish has
researched, consulted, and published on local government in both the US and Canada.
His major works include The Public Economy of Metropolitan Areas (1971); Understanding
Urban Government: Metropolitan Reform Reconsidered (1973) with Vincent Ostrom;
Financing Government (1973) with Harold Groves; Urban Economics and Policy Analysis
(1975) with Hugh O. Nourse; Local Government in the United States (1988) with Vincent
and Elinor Ostrom; Indian Government: Its Meaning in Practice (1989) with Frank Cassidy;
and Local Government in British Columbia (1987, 1990, 1999). The CD Howe Institute
recently published his review of evidence on amalgamations in North America in Local
Government Amalgamations: Discredited Nineteenth-Century Ideals Alive in the Twenty-First. Dr.
Bish is included in Who’s Who in Economics, where selection for inclusion is based on the
number of times an economist’s work is cited by other scholars in academic work.
Acknowledgments
This paper is based on a more technical paper prepared for the Local Government Insti-
tute at the University of Victoria and supported by NorskeCanada. The author would
like to acknowledge Irene Huse and Annette Mueller as well as Professor Francois Des
Rosiers from Laval University for their assistance in completing the original paper. In
addition, I would like to express appreciation to the many provincial and municipal offi-
cials across Canada who took time to provide information and discuss issues. I would
also like to express my thanks to the individuals at The Fraser Institute with whom I
worked to disseminate this more accessible version of my study to British Columbians.
Finally, thanks are also due Dr. Enid Slack from Toronto and anonymous reviewers of
the first draft of the report who provided additional insights.
Fraser Institute Digital Publication
September 2004
Property Taxes on Business and Industrial Property in British Columbia 35
About this publication
Fraser Institute Digital Publications are published from time to time by The Fraser Institute
(Vancouver, British Columbia, Canada) to provide, in a format easily accessible online,
timely and comprehensive studies of current issues in economics and public policy.
Distribution
These publications are available from http://www.fraserinstitute.ca in Portable Document
Format (PDF) and can be read with Adobe Acrobat Reader, which is available free of
charge from Adobe Systems Inc. To down-load Acrobat Reader, go to this link:
http://www.adobe.com/products/acrobat/readstep.html with your browser.
Disclaimer
The author of this publication has worked independently and opinions expressed by him
are, therefore, his own, and do not necessarily reflect the opinions of the members or the
trustees of The Fraser Institute.
Copyright
Copyright© 2004 by the Fraser Institute. All rights reserved. No part of this publication
may be reproduced in any manner whatsoever without written permission except in the
case of brief passages quoted in critical articles and reviews.
Date of issue
September 2004
Editing, design and production
Lindsey Thomas Martin and Kristin McCahon
Fraser Institute Digital Publication
September 2004
Property Taxes on Business and Industrial Property in British Columbia 36
About The Fraser Institute
The Fraser Institute is an independent Canadian economic and social research and edu-
cational organization. It has as its objective the redirection of public attention to the role
of competitive markets in providing for the well-being of Canadians. Where markets
work, the Institute’s interest lies in trying to discover prospects for improvement.
Where markets do not work, its interest lies in finding the reasons. Where competitive
markets have been replaced by government control, the interest of the Institute lies in
documenting objectively the nature of the improvement or deterioration resulting from
government intervention. The work of the Institute is assisted by an Editorial Advisory
Board of internationally renowned economists. The Fraser Institute is a national, feder-
ally chartered, non-profit organization financed by the sale of its publications and the
tax-deductible contributions from its members, from foundations, and from other sup-
porters; it receives no government funding.
Fraser Institute mailing address
The Fraser Institute, 4th Floor, 1770 Burrard St., Vancouver, BC, Canada V6J 3G7
Membership
For information about becoming a member of The Fraser Institute, please contact the
Development Department via e-mail: [email protected]; via telephone:
604.688.0221 ext. 586; via fax: 604.688.8539. In Calgary, please contact us via e-mail:
[email protected]; via telephone: 403.216.7175 or, toll-free 1.866.716.7175; via
fax: 403.234.9010. From Toronto, please telephone 416.363.6575 or fax 416.934.1639.
Media
For media enquiries, please contact Suzanne Walters, Director of Communications, via
e-mail: [email protected]; or via telephone: 604.714.4582.
Ordering publications
For information about ordering The Fraser Institute’s printed publications, please con-
tact the book sales coordinator via e-mail: [email protected]; via telephone:
604.688.0221 ext. 580 or, toll free, 1.800.665.3558 ext. 580; or via fax: 604.688.8539.
Fraser Institute Digital Publication
September 2004
Property Taxes on Business and Industrial Property in British Columbia 37