Property investment Luxury spending trends Databank...
36
Transcript of Property investment Luxury spending trends Databank...


3 the wealth report 20153
Welcome to the 2015 edition of The Wealth Report
the wealth report 2015
Andrew HayGlobal Head of Residential [email protected] +44 20 7861 1071
It is clear that 2015 will be a remarkable year in terms of political and economic fluctuations, making it harder than ever to predict investor sentiment and the resulting wealth flows.
We are fortunate in being able to draw not only on a network of over 350 offices, but also the views of thousands of active clients and investors, together with the expertise of our agency and consultancy teams, including those advising on alternative property sectors, such as healthcare, agriculture and student housing.
I am delighted that in this edition of The Wealth Report we share the first-hand investment perspec-tives and experiences of Massimo Ferragamo and Goodwin Gaw. In addition, the report also features the latest research from leading wealth analysts and commentators. Through our partnership with WealthInsight, for example, we can offer an analysis of wealth distribution trends covering almost 100 countries and over 100 cities. Contributions from NetJets, Fragomen and Ledbury Research allow us to focus on the critical issues of global travel and connec-
tivity, wealth migration and luxury spending trends.Our Attitudes Survey adds depth to our analysis
by delving deep into the views of the wealthy regard-ing investment risks and opportunities. Our coverage of the world’s premier luxury residential markets has been expanded to include 100 cities and second-home destinations. And our focus on investment opportunities covers the world.
The scope and the ambition of the report is reflected by Knight Frank’s growth. In the last year we have formed a strategic residential relationship with Douglas Elliman covering New York and the key luxury home hotspots in the US. We have also established new offices in Chamonix, Provence, San Remo, Venice, Sardinia, Marbella and Taipei, as well as opening five new offices in the UK.
The reach and influence of The Wealth Report continues to grow. We hope you find our latest find-ings and forecasts both informative and inspiring. If we can provide you with further research or advice we are of course happy to help and look forward to hearing from you.
The Wealth Report 2015
commissioned byAndrew HAy
written by KnigHt FrAnK reseArcH
designed by winKreAtiVe
printed by PUrePrint
Knight Frankeditor Andrew sHirley
global head of research liAm BAiley
marketing & pr BronyA HeAVer
Winkreativecreative director mAUrUs FrAser
art director leslie KwoK
designer mAtt le gAllez
art Buyer rHiAnnon nicol
account manager emilie AAgreen
Photographyportraits of andrew hay and liam Bailey taken by John wright at the corinthia residences, whitehall, london, courtesy of Simon naudi Illustration
lyndon hayesmichael kirkhamJoël penkmanJim Spencer
DefinitionsUHnwi throughout this report, we use Uhnwi as an abbreviation for ultra-high-net-worth individual. Unless otherwise stated, an Uhnwi is defined as someone with a net worth of over US$30m.
Prime ProPerty the most desirable and most expensive property in a given location, generally defined as the top 5% of each market by value. prime markets often have a significant international bias in terms of buyer profile.

54 the wealth report 2015
P38
Growing wealth
creation has led to an increas-ing number of
buyers from an ever-widening
list of countries purchasing
property in a growing
number of global hubs
For me the slump in oil prices that
startedin 2014 is a
game changer for the
economy, and also for
property investment
P48
contentS
p28
p49
p63
06
World in numbers
highlights from the key research findings of the 2015 edition of The Wealth Report, including attitudes Survey, piri, global cities Survey and wealth distribution data
08
Attitudes Survey
weAltH worries81% of advisors say their clients are worried about tax hikes — p10
no PlAce liKe Home Just over 25% of Uhnwis are considering buying a new home in 2015 — p12
16
Global wealthdistribution
weAltH rise the total number of Uhnwis rose by almost 5,200, or 3%, in 2014. their population is set to grow a further 34% by 2024 — p18
AFricAn sUrge the ivory coast will see africa’s largest 10-year increase in Uhnwi numbers with forecast growth of 119% — p21
26
Global cities
london cAllingthe Uk’s capital city holds off new york to take the top spot in our 2015 global cities Survey — p28
wHere tHe ricH liVe a graphical representation of Uhnwi wealth population data for over 100 cities across the world — p30
34
PIRI 2015
tHe Big APPle sHinesnew york tops our piri 100 index with prime residential price growth of almost 19% in 2014. overall, the index rose by just over 2% — p37
room witH A View monaco once again tops our list of the world’s most expensive prime residential property. US$1m will buy you just 17 sq m of home there, compared with 204 sq m in cape town — p39
46
Property investment
tAngiBle Assets ProsPer the total amount of money invested into commercial property rose to around $619bn in 2014. private inves-tors accounted for $153bn of that — p49
ten to wAtcH knight frank experts highlight 10 trends and sectors Uhnwi investors should be aware of — pp52–55
58
Luxury spending trends
rUle BritAnniA the Uk tops our new Big Spenders index, followed by china and Qatar — p60
Vroom, Vroom classic cars are still the top performers in our luxury investment index, rising in value by 16% in 2014 — p62
66
Databank
wealth distribution data in detail — p66 attitudes Survey responses by region — p68
70
Final word
liam Bailey, knight frank’s global head of research, highlights the implications of The Wealth Report’s latest findings for Uhnwis and their advisors
p41
p12
p20
Contributors and interviewees
liAm BAiley gloBal head of reSearch, knight frank
foremost prime property expert
Andrew sHirley the wealth report editor, knight frankluxury investments commentator
grÁinne gilmore head of Uk reSidential reSearch, knight frank
former economics correspondent, The Times
JAmes roBerts chief economiSt, knight frank
leading commercial property expert
mAdelAine olliVier analySt, ledBUry reSearch
luxury goods commentator and researcher
clAire Adler lUxUry Jewellery conSUltantwriter, pr advisor, speaker
mAssimo FerrAgAmo chairman, ferragamo USaScion of leading fashion dynasty
goodwin gAw chairman, gaw capital
one of asia’s leading property investors
KAte eVerett-Allen head of international reSidential reSearch, knight frank
authority on international residential markets
dr PiPPA mAlmgren foUnder, drpm groUp
economist and former US presidential advisor

76 the wealth report 2015world in nUmBerS
Piri
18.8%the largest prime residential price rise,seen by new york
global cities
01london’s ranking in our 2015 global cities survey
Piri
17.3 sq mthe area of prime property Us$1m will buyin monaco
Attitudes
61%of russian UHnwis are sending their children overseas for their secondary education
global cities
03Hong Kong’s ranking in our 2015 global cities survey – the top Asian location
global wealth
50,767the number of UsUHnwis predicted in 2024
Attitudes
15%of latin American UHnwis are thinking of changing their country of residence
Piri
-15%the greatest drop in prime residentialprices, seen by Buenos Aires
Highs and lows: key statistics from The Wealth Report 2015
The Wealth Report contains a huge amount of data, not only from knight frank’s own research teams, but also from leading industry analysts and commentators. the map below includes a worldwide snapshot of the numbers drawn from our piri 100 index; the wealth distribution data supplied by wealthinsight; the results of our global cities Survey and the fi ndings of our unique annual attitudes Survey.
Attitudes
global wealth
$0.2tnthe total wealth held by African UHnwis in 2014
Property
1.8m sq ftthe area of First-world shopping malls set to open in nairobi in 2015
52%the proportion of UHnwis from the UAe who are considering buying a new home in 2015
global wealth
1,752the growth in singapore’s UHnwi population, 2014 to 2024
Property
42%of Australasian UHnwi investment portfolios are allocated to property
global trends
$20.8tn
the total wealth held by UHnwis
172,850
the total number of UHnwis worldwide
3%
increase in the number of UHnwis
2013 to 2014
$153bn
the estimated commercial property investment by
private individuals
82%
% of wealth advisors reporting the net worth
of their UHnwi clients increased

attitudes survey the wealth report 201598attitudes survey 8
A global guide to UHNWI wealth, attitudes and investments
The Wealth Report Attitudes SurveyThe world is becoming increasingly preoc-cupied by the lives of the rich and famous; the more sensational the detail the better.
fuelling this trend is the growing omnipotence of an internet that streams a non-stop fl ow of gossip and photographs, authorised or not. Some of the super-rich, those whose wealth derives from their celebrity status, actively encourage it, but for most the intrusion is unwelcome.
No wonder then that the distinctly un-voyeuristic results of our own annual survey of the attitudes of the wealthy, discussed over the following pages, reveal that ultra-high-net-worth individuals are becoming increasingly concerned about the power of the web in terms of online privacy and cyber-crime.
Interestingly, however, given a potential economic slowdown in china and continued political and economic uncertainty in many parts of the world, it is family and business succession issues followed by a possible hike in wealth taxes that are the biggest concerns for UHNWIs, according to the wealth managers and private bankers who advise them.
putting these concerns aside, 2014 was a good year for the wealthy. The vast majority saw their net worth increase, and most of the respondents to the survey said
this trend would continue for their clients in 2015.
But with contributors from all parts of the world, the results of our Attitudes Survey highlight some revealing regional trends.
Generally, UHNWIs living in Austral-asia seem happiest with their lifestyles – only 4% want to change their country of residence or domicile, and very few send their children overseas to be educated. By contrast, a third of those from russia and the cIS are considering a move, and over 60% dispatch their children abroad for their secondary education.
The results of the Attitudes Survey also cement the position of property as the cor-nerstone of many UHNWI investment stra-tegies – it accounts on average for almost a third of UHNWI portfolios. But bricks and mortar are not the only tangible assets that are in demand. So-called investments of passion, such as art, wine and classic cars, continue to attract more interest.
While our survey doesn’t delve into the more personal facets of UHNWI lifestyles, it provides an invaluable glimpse of their attitudes towards property, investments and the factors aff ecting their ability to increase and safeguard their wealth, and how those factors vary around the world.
01
Getting richeraccording to the results of the attitudes survey, 80% of wealth advisors expect their clients’ net worth to increase in 2015
02
The joy of propertyover a quarter of uhNwis are thinking of buying a new house in 2015, while 35% of those surveyed expect their clients to increase their allocation to property investments during the year. in certain regions of the world up to a third of the super-rich are thinking of changing their domicile or country of residence
03
The collecting bugover 60% of survey respondents reckon their clients are becoming more interested in collecting investments of passion

attitudes survey the wealth report 20151110
The fi fth instalment of The Wealth Report’s annual Attitudes Survey is based on a detailed survey of almost 500 leading private bankers and wealth advisors from across the globe, and refl ects the attitudes of their ultra-wealthy clients who have a combined wealth of over US$1.7tn.
covering many aspects of the lifestyles of ultra-high-net-worth individuals (those with a net worth of over $30m), from wealth creation to philanthropy, from property investments to luxury spend-ing trends, the survey’s fi ndings off er a unique insight into the attitudes of the super-wealthy.
last year proved to be a more profi t-able one for the world’s UHNWIs than expected by their advisors. In 2013 when we asked the survey’s respondents about their clients’ wealth creation prospects over the next 12 months, 63% said they thought their net worth would increase. A year later 82% said it had actually increased during 2014, with only 3% reporting a fall.
looking forward, the outlook is still bullish. Despite concerns over the global economy, 80% of survey respondents
concerned about the handover of family wealth to the next generation.
A potential increase in wealth taxes (81%) and increased government scrutiny of wealth (80%) were the second and third most vexatious issues, according to our survey results. respondents from Aus-tralasia were the least concerned about increased government scrutiny, with only 44% fl agging it as a threat.
The growing power of the internet, both in terms of cyber-crime and the abil-ity to invade privacy and damage reputa-tions, led 76% of respondents to highlight it as an area of concern.
Philanthropy, shopping, fl ying
UHNWI attitudes to philanthropy remain largely unchanged. According to last year’s Attitudes Survey, 21% of respond-ents expected their clients’ philanthropic
expect their clients’ wealth to grow further in 2015 (see p18 for our detailed predic-tions on global wealth creation over the next 10 years).
wealth threats
However, the road to greater riches is not always simple, and the survey results highlight a number of issues that UHNWIs believe could hinder their ability to gener-ate more wealth. Interestingly, it was not the global geopolitical and economic issues that tend to spook stock markets that were of the most concern, but more personal issues.
on average, less than half of respond-ents said their clients were concerned about the impact of the chinese economy dipping (although unsurprisingly this rises to over 70% in Asia and 67% in neighbouring Australasia). The same pat-tern was repeated for the ongoing turmoil in the Middle east and Ukraine.
family succession issues were, in fact, the number one worry, with 85% of respondents saying their clients were
activities to increase; in this year’s survey the fi gure was 22%, with three-quarters predicting they would remain the same. The outlook for a rise in giving was most pessimistic in more mature economies like europe (17%), perhaps because philanthropy is already well established there, compared with emerging economies like Africa (36%).
As part of this year’s Attitudes Survey we have endeavoured to fi nd out if younger UHNWIs have a diff erent attitude to wealth than their parents’ generation. When asked if they were more philanthropic, 45% of respondents said “yes”.
By contrast, when we asked if they spent more on luxury goods, two-thirds of those taking the survey agreed that was the case, perhaps explaining why succession planning is considered such a big issue. overall, 30% of survey respondents are expecting their clients to splash out more on luxury goods this year, compared with 2014, with UHNWIs from Africa (39%)enjoying their wealth the most.
The use of private jets is growing stead-ily around the world, with demand rising most quickly in Asia – 38% of respondents said their clients were increasingly using them for business and leisure purposes (see our special feature on p40 for more).
homes, vineyards, migration
Across the world, 23% of the wealth on av-erage of UHNWIs is accounted for by their main residence and any second homes not
Wealth trendsThe latest fi ndings from The Wealth Report’s annual Attitudes Survey of UHNWI advisors
ANDREW SHIRLEY,THE WEALTH REPORT EDITOR
percentage of respondents who think their younger uhNwis are more philanthropic than their parents’ generation
45%
source: the wealth report 2015 attitudes survey
source: the wealth report 2015attitudes survey
data refers to number of survey respondents whosaid each issue was of concern to their clients source: the wealth report 2015 attitudes survey
BriGht Future Most wealth advisors expect their clients’ wealth to increase in 2015
do younger uhNwis spend more on luxury goods than their parents?
spend morespend the samespend less
25%
9%
66%
Wealth worries
the issues uhNwis believe could affect their wealth, lifestyles or business
Chi
na’s
pot
enti
al
econ
omic
slo
wdo
wn
pol
itic
al in
terf
eren
ce
Cyb
er-c
rim
e an
d on
line
priv
acy
pot
enti
al in
crea
se
in w
ealt
h ta
xes
85%
81%
80%
76%
68%
66%
51%
51%
49%
Cri
sis
in M
iddl
e e
ast
pol
itic
al s
itua
tion
in
rus
sia/
ukr
aine
Fam
ily/b
usin
ess
succ
essi
on is
sues
incr
ease
d sc
ruti
ny o
f w
ealt
hy b
y go
vern
men
tw
ealt
hy b
y go
vern
men
tw
ealt
hy b
y go
vern
men
tw
ealt
hy b
y go
vern
men
tw
ealt
hy b
y go
vern
men
tw
ealt
hy b
y go
vern
men
t
hea
lth/
envi
ronm
ent
issu
es
THE WEALTH REPORT ATTITUDES SURVEY
the results of the attitudes survey are based on the responses from almost 500 private bankers and wealth advisors who completed a survey in late autumn 2014. the global fi gures are weighted to refl ect the regional distribution of uhNwi wealth popu-lations. a full regional breakdown of the data is available in databank at the back of the report.
Wealth monitor
respondents were asked how their clients’ wealth had changed during 2014 and how they thought it would change in 2015
2014 Change
region % increase
africa
89%
asia
74%
australasia
81%
europe
74%
latin america
87%
Middle east
88%
North america
100%
russia/Cis
33%
wealth has decreasedwealth has remained the samewealth has increased
2015 outlook
region % increase
africa
82%
asia
75%
australasia
69%
europe
71%
latin america
85%
Middle east
77%
North america
100%
russia/Cis
44%
wealth will decreasewealth will remain the samewealth will increase

attitudes survey the wealth report 20151312
sou
rce:
the
wea
lth
rep
ort
2015
att
itud
es s
urve
y
one of the most revealing
questions posed by
the survey relates to the
number of Uhnwis who are planning
to permanently change
their domicile or country
of residence
Allocation to property in UHNWI investment portfolios
owned purely as an investment, according to our survey results. In Australasia and Asia the proportion edges up to almost 30%. Just over a quarter of UHNWIs are considering purchasing another house in 2015 to add to the three they already own.
When we asked our respondents if any of their clients were particularly interested in a ski, vineyard or equestrian property, a few interesting trends emerged. The de-mand from Asian UHNWIs for vineyards remains keen, with 40% of respondents with clients in china, 43% in Taiwan and 31% in Malaysia noting rising interest.
In Africa (29%) and the Middle east (40% in the UAe) equestrian properties are more of a draw, while a ski chalet is the top priority for wealthy second-home seekers from europe (35%) and North America (50% in the US).
one of the most revealing questions posed by the survey relates to the number of UHNWIs who are planning to perma-nently change their domicile or country of residence.
Australians and New Zealanders are the least likely to want to up sticks. only 4% of those surveyed said their clients were considering a move. By contrast, a third of respondents with clients in the russia/cIS region said a move could be on the cards. This follows a response rate of 35% in last year’s survey, suggesting a
longer-term trend is emerging.Globally, tax was highlighted as the
main reason UHNWIs would consider moving to a diff erent country, but in rus-sia education and political issues were reported as two of the biggest drivers.
Seeking out the best education abroad for their children is clearly very important for russian and cIS UHNWIs. over 60% are likely to send their off spring overseas for their secondary education, compared with a global average of 27%. This process also seems to be happening sooner, with 67% of respondents noting that their clients were sending their children overseas at an earlier age.
investing, collecting
of course, property is not just a place where the wealthy live. It is increasingly seen as a mainstream investment class, accounting on average for 32% of an UHNWI’s investment portfolio. Globally, 37% of survey respondents said their clients increased their exposure to prop-erty as an investment in 2014 and 35% expect that trend to continue in 2015.
residential property is the most popular sector to invest in, with 81% of wealth advisors saying their clients were becoming more interested in it. offi ces (59%) were the next most popular
source: the wealth report 2015 attitudes survey
source: the wealth report 2015 attitudes survey
property type. (See pp46 to 57 for more on property investment trends.)
control of their property investments is clearly important to the wealthy – almost 80% of respondents said UHNWIs prefer to invest directly into property, with only 12% choosing to use a fund vehicle.
Bricks and mortar retain their appeal for the latest generation of UHNWIs, with 45% of respondents saying their younger clients were more interested in property than their parents.
outside property, equities are pre-dicted to be the most popular investment class in 2015, with a net balance of 45% of those taking the survey expecting their clients’ exposure to stocks and shares to increase in 2015. This builds on the grow-ing appetite for riskier investments that the Attitudes Survey fl agged up last year.
consequently, according to the survey results, cash, fi xed income bonds and gold and other precious metals are likely to see a declining demand this year.
Investments of passion, however, remain fi rmly on the radar for the super-rich. Globally, 61% of our respondents said their UHNWI clients were becoming more interested in the likes of classic cars, art and wine.
Art is the luxury asset where interest is rising the most – perhaps unsurpris-ing given its accessibility – followed by watches, wine and classic cars. Stamps arouse the least passion around the world, but there is a noticeable diff erence in Africa and Asia, where 14% and 8%, respectively, of survey respondents noted increasing interest. Drilling down, the fi gure rises to 17% for china.
This matches the recent rise in prices for Asian and commonwealth stamps. for more on the performance of luxury investments turn to p62.
Despite collectable assets commonly being described as investments of pas-sion, personal pleasure is still the main motivation for their acquisition, accord-ing to 62% of those surveyed. In India, however, status (38%) was considered almost as important, and across Asia capital growth (32%) was a key factor.For full regional results see Databank, pp68–69.
MasterClass art is the most popular investment of passion, according to the attitudes survey
House hunting
respondents were asked what percentage of their clients were considering purchasinga new home in 2015
Emigrating
respondents were asked what percentage of their clients were considering permanently changing their domicile or country of residence
africa 23%
asia 22%
australasia 15%
europe 24%
latin america 28%
36%Middle east
31%North america
21%russia/Cis
11%
12%
4%
14%
15%
10%
7%
33%
africa
asia
australasia
europe
latin america
Middle east
North america
russia/Cis
42%australasia
40%Middle east
38%asia
33%europe
31%africa
27%russia/Cis
26%latin america
24%North america
How is the allocation changing?
allocation increaseallocation remains the sameallocation decrease
2014
37%
55%
8%
2015
fore
cast
10%
35%
54%
percentage of uhNwis who are becoming more interested in investments of passion
61%
percentage of respondents who said their uhNwi clients were more interested in collecting:
3%63% 48%
stampsart wine
PERCENTAGE OF UHNWIS LIKELY TO
SEND THEIR CHILDREN OVERSEAS FOR
THEIR SECONDARY EDUCATION
australia
3%
China
42%
russia
50%

attitudes survey the wealth report 20151514
Wealth trends under the microscope
Leading wealth experts share their views on key findings from the Attitudes Survey
The results of The Wealth Report Attitudes Survey discussed over the preceding pages provide a unique glimpse into the attitudes, concerns and investment choices of UHNWIs from around the world. To look at some of the issues raised in more detail, we asked leading specialists from various sectors of the wealth industry, including private banking, investment, family offices, education and legal services, to share their own insights into specific trends and highlight what the implications could be for UHNWIs and their advisors.
As an investor you
should devote your attention to things that
a) matter, and b) you can do
something about
Philanthropic attitude change Millennials (to use the new parlance for under-40s) take seriously the notion of stewardship and social responsibility. This may not be news, exactly, but what differentiates millennials from their parents is the inclination to use robust and/or sophisticated management tech-niques for family philanthropy. The steel magnate model of philanthropy is giving way to that of measuring impact not only through the aforementioned implementa-tion of business models for philanthropy, but also through the use of metrics to evaluate the potency of value-informed investments. While wealth managers still need to employ tax-efficient and long-term wealth management vehicles for UHNW millennials, they can also ex-pect to implement values-based consider-ations into investment portfolios. Service providers supporting UHNWIs through intergenerational wealth management services (read here, family offices) can expect family giving to evolve from a redistributive model towards managed and measured philanthropic initiatives. Andrew Porter, DIrecTor of reSeArcH, cAMpDeN WeAlTH
overseas education recently, leading public schools have start-ed to insist overseas applicants complete at least two years in a UK-based prepara-tory school. clients from areas that are already well represented in the independ-ent system, such as russia, Nigeria and the Middle eastern states, have realised the dramatic effect that an earlier move to a UK school can bring. leading public schools carry out rigorous preassessments when children are 10 or 11. preparing for these tests from within the system greatly increases a student’s chance of success. for all these reasons, we are seeing renewed interest in boarding preparatory schools and london day schools from most of our international clients. williAm Petty, DIrecTor, BoNAS MAcfArlANe eDUcATIoN
luxury investment In our experience UHNWIs are becom-ing more and more concerned about paper assets such as bonds and equities, and are increasingly looking for tangible alternatives. The scarcity of luxury assets and their historic ability to hedge against inflation make them an appealing invest-
ment proposition – it is always possible to commission a new yacht, but nobody can paint another Monet or build a classic ferrari. Increasing demand and limited supply suggest that capital growth could continue. There are risks, however, like fraud and poor portfolio diversification. To remove some of these risks, inves-tors should express their views on luxury through a multi-asset solution. SAeed PAtel, INveSTMeNT ANAlyST, ScHroDerS
Attitudes to risk
As an investor you should devote your attention to things that a) matter, and b) you can do something about. Geo-poli- tical events, though of huge significance in most ways, matter much less to the returns of a long-term investor than inves-tors think they do, while they’re thinking about them. And they are typically so unpredictable that it is nearly impossible to do much about them in the short term with any certainty. So it is uncommonly reassuring to observe from the Attitudes Survey results that clients instead seem to be rightly much more focused on the certain things they can actually do something about, such as planning
for succession, taxes, government scru-tiny and privacy/security. or at least their advisors think they are – which may not be quite the same thing. dr GreG B dAvieS, HeAD of BeHAvIoUrAl fINANce, BArclAyS
online perils A reputation is an individual’s most valu-able asset, and in an increasingly digital age, cyber-crime and online privacy are big concerns. We are increasingly being asked by high-net-worth individuals how they can go about protecting their reputa-tion. It is vital to conduct a reputation management audit as soon as possible. This will focus on maintaining or taking control of an individual’s reputation. The first area to look at is information that the individual, or friends and family, has direct control over, such as social media accounts and personal websites. It’s also important that family and friends are aware of the risks of posting information online, as it could damage the individual. The more that can be done at the proactive stage, the better.
niri ShAn, HeAD of repUTATIoN MANAGeMeNT, TAylor WeSSING

1716 the wealth rePort 20151616
a comprehensive analysis of how wealth is distributed around the world
Global wealth trendsWith the help of data from WealthInsight, The Wealth Report provides a unique and comprehensive analysis of how global wealth distribution is changing and is pre-dicted to change over the next 10 years.
Last year, around 15 people a day joined the ranks of the ultra-wealthy, or those worth over US$30m. This growth is set to continue in the coming decade, with the global population of ultra-high-net-worth individuals forecast to climb by 34% to a total of almost 231,000.
Our data also allows us to look at wealth distribution trends at a granular country level. As such, we can highlight specifi c wealth-creation hotspots, for example, Kazakhstan, where the numberof UHNWIs is set to grow by 114% over the next decade. But topping the list of the almost 100 countries we examine is Viet-nam, with a forecast uplift of 159% in its UHNWI population.
Taking a diff erent angle on the data, we can see how evenly wealth is distrib-uted within a country. While Monaco, unsurprisingly, perhaps, given that most of its residents are very wealthy, tops this list, with the equivalent of 574 UHNWIs per 100,000 people, the other countries that emerge at the top are perhaps more surprising. The, US with 12.7 UHNWIs per
100,000 head of population, is some way behind countries in Scandinavia, New Zealand and the UK. Despite the sharp rise in the number of Chinese UHNWIs, there are still only 0.6 UHNWIs per 100,000 people in China because of the size of the country’s population.
Wealth, or more specifi cally, its uneven distribution, has become an increasing subject of debate over the past few years. Some, such as the controversial French economist Thomas Piketty, argue that governments should take action and levy higher taxes on the rich in order to re-distribute wealth. Others, like our contributor Dr Pippa Malmgren, believe that higher taxes could actually prove a barrier to economic growth, undermining the opportunity for wealth creation across every stratum of society.
In developing countries signifi cant amounts of wealth are already being created by a growing and increasingly aspirational middle class. On p23 we examine the importance of this movem ent across the world, not only as a gen-erator of wealth but also in terms of the increased political power it commands, and how this may be set to change the geopolitical landscape.
01
Wealth risesthe global population of uhnwis rose by almost 5,200, or 3%, in 2014, and 53 new billionaires were created
02
future growth over the next 10 years the number of uhnwis around the world is forecast to rise by 34% to almost 231,000. Growth will be strongest in developing regions, with africa’s ultra-wealthy population rising by 59%
03
regional shiftsasian uhnwis now hold more total wealth ($5.9tn) than those in north america ($5.5tn)
Global wealth distribution

1918 the wealth rePort 2015Global wealth distribution 18
The global population of ultra-high-net-worth individuals grew by almost 5,200 last year, according to data prepared exclusively for The Wealth Report by the analyst fi rm WealthInsight.
This latest increase means 65,335 people have joined the ranks of the ultra-wealthy over the past decade – a rise of 61%. In total, there are now 172,850 individuals in this cohort who hold wealth totalling $20.8tn, an increase of $700bn during 2014.
Moving up the wealth brackets, nearly 1,180 people became centa-millionaires in 2014, taking the world’s total population of those worth over $100m to 38,280.
At the top of the wealth tree 53 individ-uals became billionaires last year, pushing global membership of this exclusive club to 1,844 – an 82% rise from the number recorded in 2004.
The annual pace of wealth creation also quickened in 2014 compared with 2013, albeit slightly. The number of UHNWIs grew by 3.1% last year, compared with
2.9% in the previous 12 months. But at a regional level the diff erences were more marked.
Most notably, Asia overtook North America as the region with the second-largest UHNWI growth. Some 1,419 people moved past the $30m+ mark in Asia in 2014, after an increase of fewer than 1,000 in 2013. Europe held onto the top spot with the most new entrants into the ultra-wealthy bracket over 2014.
The ultra-wealthy in Asia now also hold more in total wealth, with net assets of $5.9tn, than those in North America, with $5.5tn. However, with a $6.4tn treasure chest, European UHNWIs still control the most wealth.
Last year’s rise in UHNWI numbers came despite weaker-than-anticipated global economic growth. During 2014 the IMF was forced to downgrade its forecast increase for world output from 3.7% to 3.3%.
Throughout the course of 2014, politi-cal tensions mounted, while increased
For full details of wealth distribution trends and forecasts for each world region and for almost 100 countries turn to databank, p66
uhnwI population growth continuesThe Wealth Report highlights key current and future global wealth distribution trends
GrÁinne Gilmore, Head of UKresidential researcH
uncertainty over the ramifi cations of withdrawing fi scal stimulus measures in the US aff ected sentiment in many regions.
Towards the end of the year plunging oil prices and the strengthening dollar also hit emerging markets, as well as key natural resource exporters like Nigeria, Russia and Mexico.
Ouliana Vlasova, Head of Content at WealthInsight, says: “The positive outcomes for developed economies at the start of 2014 positively infl uenced wealth creation. However, that picture changed throughout the year. The growth in wealth could perhaps have been bigger had the world economy picked up more strongly in the second half of last year.”
The outlook for the rest of this year is also mixed. Although the IMF has down-graded its own forecasts for annual growth in world output from 3.8% to 3.5%, this is still slightly stronger than the growth in 2014. Emerging economies are expected to grow by 4.3%, compared with 2.4% for developed economies.
Economic headwinds
There is certainly evidence that beneath the economic headwinds, some central banks and governments have been getting to grips with the serious repair work needed in the wake of the global fi nancial crisis.
However, fears over economic weak-ness in the eurozone prompted the Euro-pean Central Bank to start a programme of quantitative easing earlier this year, a signal of the headwinds still facing devel-oped economies.
Yet the longer-term forecast for wealth creation, anticipating how wealthy popu-lations will have changed a decade from now, is still upbeat. Looking through the shorter-term uncertainties, WealthInsight predicts the number of ultra-wealthy people will grow globally by 34% between 2014 and 2024, up from a forecast of 28% growth between 2013 and 2023 (see graphic for regional predictions).
Ms Vlasova says: “We expect the measures that are being put into place to
uhnwI populations and total wealth by region in 2014
172,850
Global uhnwi population 2014
$20.8tn
Global uhnwiwealth 2014
34%
Predicted global uhnwi population
growth 2014 to 2024
all data provided by
countries with UHnWi population growth of 5% or above in 2014
Zambia
Mongolia
namibia
Kazakhstan
China
uruguay
iran
Vietnam
uae
Panama
hong Kong
nigeria
uganda
Myanmar
Monaco 10%
7%
7%
6%
6%
6%
6%
6%
5%
5%
5%
5%
5%
5%
5%
russia/Cis
2,068Predicted uhnwi 10-yr growth 25%
total uhnwi wealth $0.6tn
asia
42,272Predicted uhnwi 10-yr growth 48%
total uhnwi wealth $5.9tn
australasia
3,920Predicted uhnwi 10-yr growth 23%
total uhnwi wealth $0.4tn
latin america
9,902Predicted uhnwi 10-yr growth 50%
total uhnwi wealth $1.2tn
europe
60,565Predicted uhnwi 10-yr growth 25%
total uhnwi wealth $6.4tn
africa
1,932Predicted uhnwi 10-yr growth 59%
total uhnwi wealth $0.2tn
Middle east
7,269Predicted uhnwi 10-yr growth 40%
total uhnwi wealth $0.7tn
north america
44,922Predicted uhnwi 10-yr growth 25%
total uhnwi wealth $5.5tn

2120 the wealth report 2015Global wealth distribution
While Monaco is set to double its population of ultra-wealthy residents over the next 10 years, it will not quite keep up with the rate of growth in some other economies, including Vietnam, the Ivory Coast, Kazakhstan and Indonesia, which are forecast to see the largest increases in UHNWI populations over the next decade (see chart above).
We identified Kazakhstan last year as a country to watch, and this is still the case. It is set for a 114% increase in UHNWIs over the next 10 years, much higher than the 46% growth forecast for neighbouring Russia. Indeed, most of the CIS countries are set to outperform Russia in terms of UHNWI growth – not only because of the military and fiscal turbulence in the country, but also because of the trend in Russia for those who have amassed wealth
to base themselves overseas. Almost one-third of Russian UHNWIs would like to change their domicile, according to the Attitudes Survey.
Indonesia, which is expected to see 132% growth in the number of ultra-wealthy people by 2024, is the only MINT country where 10-year forecast growth exceeds 100%. Jim O’Neill, former Chair-man of Goldman Sachs, popularised the acronym MINT for Mexico, Indonesia, Nigeria and Turkey, identifying them as the new engines of economic growth.
Nigeria comes close to Indonesia with 90% forecast growth in UHNWIs. It is striking, however, that even this level of growth is not enough to clinch the top spot for Africa, which is taken by the Ivory Coast (+119%). Deon de Klerk, Head of International Private Clients at Standard
safeguard against another financial crisis will contribute to improved economic conditions over the next decade, coupled with government initiatives to create more entrepreneurs – one of the main drivers of millionaire growth.”
Asia is set to lead the way, with another 20,127 people likely to see their wealth move past $30m during the next decade.
Looking in more detail at our data, which includes a comprehensive analysis of wealth distribution for over 100 countries, we see a number of other key trends emerge.
Despite the turbulence in some cor-ners of the global economy as a result of renewed political tensions and fiscal uncertainty in 2014, some countries expe-rienced particularly strong wealth crea-tion last year, with UHNWI populations expanding by 5% or more in 15 countries (see chart on p18).
Twelve of these countries were emerg-ing economies, underlining the fact that despite concerns about the easing of the pace of growth in developing economies, they are still key drivers of wealth crea-tion.
But it is also notable that it was Monaco, the well-established hub for wealth, that topped the list for growth last year, with a 10% expansion in its popula-tion of UHNWIs. The number of centa-
In terms of sheer numbers,
the US will still be the
dominant force in terms of its ultra-wealthy population in
2024
Countries with highest forecast growth in UHNWI populations, 2014-2024
millionaires (those with over $100m in net assets) in the principality jumped by 10% in 2014, far above the European aver-age of 3.2%, while the number of billion-aires rose from 11 to 12 (see chart on p21).
It is likely that the tax-free environ-ment and low entry hurdles for residency in Monaco have become a greater draw for those concerned by discussions of increased taxes on wealth and assets. Indeed, our Attitudes Survey (p10) high-lights that one of the biggest concerns for UHNWIs across the globe is a potential increase in wealth taxes.
In terms of sheer numbers, the US will still be the dominant force in terms of its ultra-wealthy population in 2024, with the data forecasting a 25% increase in UHNWI numbers to almost 51,000, the biggest concentration in any single country (see chart on the right).
Wealth equality
But when looking at these wealthy residents as a proportion of the country’s total population, the US, with 12 UHNWIs per 100,000, is outgunned by 19 countries including New Zealand and the UK (see chart on p21). Unsurprisingly, Monaco tops the list with an equivalent rate of 574 per 100,000.
Bank, Africa’s largest bank, says: “Africa has the highest potential for growth of any region at the moment. Reforms in Nigeria have been expedited, helping the country build credibility among foreign investors. It is an exciting time.”
When we look at the amalgamated expectations for growth in UHNWIs, the MINT countries, with average expected uplift of 76% over the next decade, nar-rowly defeat the BRIC countries (Brazil, Russia, India and China), which have an average forecast growth of 72%. How-ever, they both far outstrip global average
Midas touCh Monaco’s population of uhnwis is set to double by 2024
number of uhnwis per 100,000 people
breakdown of Monaco wealth tiers (2014)
MillionairesuhnwisCenta-millionairesbillionaires
11,924
217 22
12
Monaco574
luxembourg113
singapore60
switzerland54
norway50
new Zealand24
uK17
Germany14
Japan13
us13
russia0.9
Forecast top FIVe UHNWI
popUlatIoNs IN 2024
Japan
China
Germany
uK
us
50,767
19,916
15,681
14,481
13,176

22Global wealth distribution
forecast growth (34%) and the average increase expected across the G8 (28%) over the next decade.
In China, policymakers are under increasing pressure with questions over economic growth mounting as well as political tensions surfacing in Hong Kong. However, Gabriel Sterne, Head of Global Macro Investor Services at Oxford Economics, says there is room for more education and financial deepening in the country. “We still see China as a success story, and it should continue to catch up in terms of productivity,” he says. Cer-tainly by 2024 China is not only set to be the largest economy in the world, but will boast nearly 15,700 UHNWIs and 338 billionaires.
Meanwhile, elections in India and Bra-zil have sparked opportunities for more economic growth. India has seen a 166% rise in UHNWIs over the past decade, and with the new Indian government com-manding a majority in the lower house for the first time in three decades, there is real opportunity to introduce far more transparency. That in turn will boost for-eign investment. WealthInsight forecasts a 104% increase in India’s UHNWIs over the next decade.
Last year’s election in Brazil, and the ensuing interest rate rise by the country’s central bank, flexing its independent muscles, could start to shore up the
Brazillian economy. There is still much work to be done, including offsetting the falling prices for key Brazilian exports. However, despite this, the growth of Brazil’s UHNWI population over the next decade is expected to outperform the global average, at 50%.
Eurozone difficulties
The difficulties in the eurozone over the last year, with Germany narrowly avoid-ing another recession, are not over yet. The economic grouping faces a potential-ly painful re-balancing of the economy, driving productivity as well as consump-tion in the coming years. This is re-flected in our data, with many eurozone countries seeing a slightly lower level of growth in ultra-wealthy populations than the global average. However, the newest entrants to the eurozone – Latvia, Lithua-nia and Estonia – are set to outperform in the next decade, albeit from a low base. The UK, which had the fastest-growing economy in the G8 last year, is set to see 100 billionaires by 2024, making it the fifth-highest hub for billionaires in the world behind the US, China, India and Russia, each of whose overall population significantly outnumbers that of the UK. For more wealth distribution numbers see Databank, p66.
olYMPian endeaVours uhnwi population growth in brazilian cities like são Paulo is set to outperform the global average
Global pyramid of wealth 2014
billionaires1,844
Centa-millionaires 38,280
uhnwis172,850
Millionaires
17,808,831
total population
7,290,912,784*
*as of 15:48 GMt 27 January 2015source: wealthinsight, worldometers.info
WEALTH TAXES: THE GREAT DEBATE
the debate about income inequality (see graphic below) and wealth taxes gained traction during 2014, not least because of the wide discussions around the ideas of thomas Piketty, a French economist who argues that there should be a global wealth tax on the richest in order to redis-tribute money to the poorest in society. the well-respected oeCd has also highlighted that inequality can curb economic growth, arguing that using tax and transfers to tackle inequality can be effective as long as the policies are highly targeted, aimed at not just the very poorest but the poorest 40% of the population, particularly focus-ing on education.
Yet other economists point out it has been proved that high marginal tax rates can decrease productivity and inhibit entrepreneurialism, as those who suc-ceed are faced with the prospect of much higher levies. dr Pippa Malmgren, founder of drPM Group and former economic ad-visor to us President George w. bush, argues that instead of focusing on taxing wealth brackets, there should be more emphasis on creating more wealth for all. in her book Signals, published earlier this year, she argues that instead of increasing tax levies, governments should be cutting them, especially for entrepreneurs and small businesses: “the argument seems to have swung to distribution, when in fact it should be about productivity. it is essential that the policymakers focus on innovating and growing their economies.”
03 KF_GlobalWealth_AW_V2.indd 22 05/02/2015 14:34
Millionaires. UHNWIs. Centa-mil-lionaires. Billionaires. Their lives and lifestyles cause fascination worldwide, but the changes happening below the apex of the wealth pyramid, while less glamorous, are just as important to anybody inter-ested in the luxury sector.
Mass affluence, or the creation of middle-class consumers with disposable income to spend, is inextricably linked with economic growth and development, and wealth creation.
However, unlike the clearly delineated strata of the super-wealthy discussed ear-lier, there is no hard-and-fast definition of middle class. Some researchers have included those who earn close to or above the country’s average wage, while others have set specific income thresholds. For example, influential economists Branko Milanovic and Shlomo Yitzhaki declared in 2000 that the global middle class were those who earned between $4,000 and $17,000 a year.
More recently, the idea of looking at the purchase and use of cars as a measure of disposable income and middle-class status has gained currency.
Whatever the definition, there is no doubt that the middle classes have been
expanding rapidly in emerging econo-mies in recent years. By Milanovic and Yitzhaki’s measure, there are more than 369 million middle-class people in G20 developing economies, such as China, Brazil and India, and around one billion in advanced economies.
Between 2000 and 2010, Africa’s middle-class population grew from 29% to 34% of the continent’s total popula-tion, while the OECD says that by 2030 Asia will account for 66% of the world’s middle-class population – 10 times larger than that of the US and five times bigger than Europe’s.
As well as indicating rising living standards in a country, the middle classes are also the engine of consumer spend-ing, with enough disposable income to purchase goods and services that can help pump money back into domestic and international economies.
The trend is particularly striking in the emerging economies, where private consumption is growing at around three times the rate of advanced economies. The developing world’s share of global private consumption climbed from 18% to nearly 30% between 2002 and 2012, ac-cording to In Search of the Global Middle Class, written by Uri Dadush and Shimelse Ali. It is certainly no coincidence that the wealth data prepared for this report shows that some of the fastest rates of growth in the number of millionaires will be in Africa and Latin America over the next decade, with an expected increase of 53% and 46%, respectively.
Increased middle-class spending and
investment power in developing econo-mies has a direct impact on the poten-tial for the creation of entrepreneurial UHNWIs who can benefit from the rising appetite for everything from consumer goods to financial services, technology and health care.
This has been well proved by the stratospheric success of Alibaba, which provides sales services for websites and has propelled its founder, Jack Ma, to the top of China’s rich list. Alibaba’s success has been the result of, in no small part, increased consumer demand and access to technology across China.
In Africa, Acacia Mall, a new high-end shopping mall in Kampala, Uganda, is just one example of how the middle classes are shaping retail, with Western-style shop-ping centres now providing good returns for their HNWI backers. Judy Rugasira Ky-anda, Managing Director at Knight Frank Uganda, says: “The mall is surrounded by areas populated by a strong middle class, who benefit from the retail and services provided in an upmarket setting.”
Inditex, the Spanish retailer whose brands include Zara, Uterqüe and Mas-simo Dutti, and which is majority owned by its founder, the Spanish billionaire Amancio Ortega, has been expanding rapidly in China. It has been opening five Zara stores a month to satisfy the demand for its chic-yet-affordable fashion among the middle class.
A growing and strengthening middle class can often be accompanied by politi-cal challenges, however, as the growth in economic independence sparks greater demand for better services – especially education, political transparency and freedom of expression. In the past two years alone there have been protests in countries including Brazil, Hong Kong, Venezuela, Bulgaria, China and Turkey, which have, to some extent, been associ-ated with the increasingly vociferous demands of the middle classes.
Yet the increasing demands of the middle classes can also prove a great spur to innovation, encouraging entrepreneurs to start their own businesses to provide for this emerging class with disposable income, which in turn provides good jobs to lift more people into the middle classes – resulting in a form of virtuous circle.
This ability of the middle class to grow itself is perhaps just as well, as amid a cloudier outlook for the global economy, the eyes of the world are turning to the middle classes – and more importantly their wallets and purses. Their spending power will be a crucial lever to help boost global demand.
the power ofmass affluence Special focus on the importance of middle-class wealth growth GrÁinne Gilmore, Head of UK residential researcH
23
PURCHASING POWER Middle-class spending is driving wealth creation
tHE WEAltH REPORt 2015
03 KF_GlobalWealth_AW.indd 23 04/02/2015 12:59

2524 the wealth rePort 2015Global wealth distribution
technology
Identifying specifi c growth op-portunities is made more dif-fi cult by the uncertain outlook, and it is equally diffi cult to be sure which assets will be low risk in the future – traditional havens cannot be guaranteed to remain low risk, and this includes blue-chip companies and government debt. But in this environment, excessive caution can be misplaced, and even wealth preservation requires a degree of risk. Tak-ing a 10-year view, advances in technology should continue to empower the spread of education and prosperity, and in turn fuel consumer demand. Only a major confl ict is likely to stand in the way of this.
Instability is a risk to any form of economic growth. This is particularly true in Africa. A major sustained political upheaval or a similar incident could detract from the important projects being implemented that should de-liver growth. There are many countries within Africa, all at
Africa is one of the few re-gions remaining in the world where there is huge potential for growth. It has a growing and young population that is fuelling demand and push-ing up economic activity and wealth creation. The con-tinent also boasts a strong strand of entre preneurialism, which has resulted in a clear shift towards substantial
The Wealth Report asks what the biggest risks and opportunities for wealth creation around the world are
JoHn Veale
Chief investment offi cer at stonehage investment Partners,
a global multifamily offi ce
deon de KlerK
head of international Private Clients at standard bank, the largest bank in africa
diff erent stages of develop-ment. The ideal is that each of these countries stays on track towards economic develop-ment and growth. But if any of them, especially one of the major nations such as Nigeria, Kenya, South Africa or Angola, took a sudden change of direc-tion, then that would pose a risk to Africa’s growth story.
growth in HNWI numbers over recent years. Given that Africa currently accounts for 15% of the world’s popula tion, but de-livers only 4% of global output, it unquestionably off ers great opportunity over the medium and longer term.
There will be growing oppor-tunities in emerging-market technology – that is, new, more-sophisticated develop-ments within the technology we all use every day. Funding platforms such as Kickstarter are exciting, helping engender more new ideas. We also see real estate, mostly com-mercial property, in the US as an opportunity – there is a reassurance that you can actu-ally go kick your investment. People should not overlook the opportunities in developed economies. For many years the story has been about emerging economies, based on their manufacturing. But we have moved some of our manu-facturing back to the US and Canada in recent years – there is opportunity here.
cUrt ricHardson
uhnwi us tech entrepreneur and founder of otterbox
technology and real estate
africa’s young population
risks opportunities
narrow economic growth
dr sHUBHada rao
senior President andChief economist at Yes bank, one of india’s largest private-
sector banks
The risk for wealth creation in the Indian economy and many other emerging economies will arise if economic growth over the coming years is not spread across every sector of the economy, from services to energy. Such broad-based growth results in a quicker trickle-down eff ect than when the economy is relying on just a few strong pockets of output. Every economy that trans-forms itself from an emerging to a developed economy has seen some instances where wealth inequality has growth, but this seems to be most acute where the economy is leaning on just one or two levers of growth.
pricing of equities
cHris Williamson
Chief economist at Markit, a global fi nancial information
services provider
I see the biggest risk at present being the disconnect between the pricing of bonds and com-modities on the one hand, and equities on the other. While bond and commodity prices are pricing in weak global de-mand, recent stock market ral-lies seem to be factoring in the expectation of future profi ts based on rising demand. This year will certainly be a year to watch how the markets react to the withdrawal of monetary stimulus in the US, as there is a strong argument that the stock rally has been fuelled by excess credit in developed and emerging markets, fuelled by quantitative easing.
Government expansion
cUrt ricHardson
uhnwi us tech entrepreneur and founder
of otterbox
One key risk, certainly in the US but also elsewhere around the world, is the continued ex-pansion of government. There has been exponential growth in the size of the government in the US over the past eight to 12 years, and this has been marked by more taxes and regulation. These develop-ments have an impact on the dollars people have to invest. When there is uncertainty about whether a tax regime will continue to change, or about expanding regulation, investment decisions change, which in turn can have an eff ect on economic as well as investment outcomes. The US’s approach to this is, in eff ect, a global issue, as its economic performance has international ramifi cations.
property andinvestments of
passion
cHris Williamson
Chief economist at Markit, a global fi nancial information
services provider
After a period such as the fi nancial crisis, with the great correction that happened in its wake, there are always opportunities to fi nd assets that might still be under-valued, whether property in the US or Spain. Even seven years after the crisis, there are still opportunities available. Alongside this, it is no sur-prise to me that investments of passion have performed so well of late. If you can only get a low rate of return, you might as well invest in something you enjoy. My vote is for clas-sic motorcycles.
find the “missing middle” of
manufacturing
dr sHUBHada rao
senior President and Chief economist at Yes bank,
one of india’s largest private- sector banks
The opportunities for wealth creation, especially in India, are potentially huge, if policy-makers can boost manufactur-ing, or, as I call it, the “missing middle”. There are signs of a stronger and more transparent policy system under the new Modi government, and, if suc-cessful, this will attract more overseas investment. India has the ability and the know-how to increase its global presence in terms of manufacturing, and it could benefi t from the global links created by over-seas investment. If allowed to fl ourish, a manufacturing sector in India could provide massive growth. Education is also more widespread than in other emerging economies.
Volatileoutlook
JoHn Veale
Chief investment offi cer atstonehage investment
Partners, a global multifamily offi ce
Geopolitical events such as the escalation of Russia’s ac-tions in Ukraine could lead to further loss of confi dence and potentially a defl ationary trap, particularly in Europe. At the other extreme, if economic growth is stronger than antici-pated and central banks are wrong-footed by wage pres-sures on infl ation, this could lead to tightening of policy and strong rises in yields. As investment advisors we worry more about these issues today, as loose monetary policies have helped push the valua-tion of many asset markets to levels that allow little room for disappointment.
sustainedpolitical upheaval
deon de KlerK
head of international Private Clients at standard bank, the largest bank in africa
27 the wealth report 201526Global cities
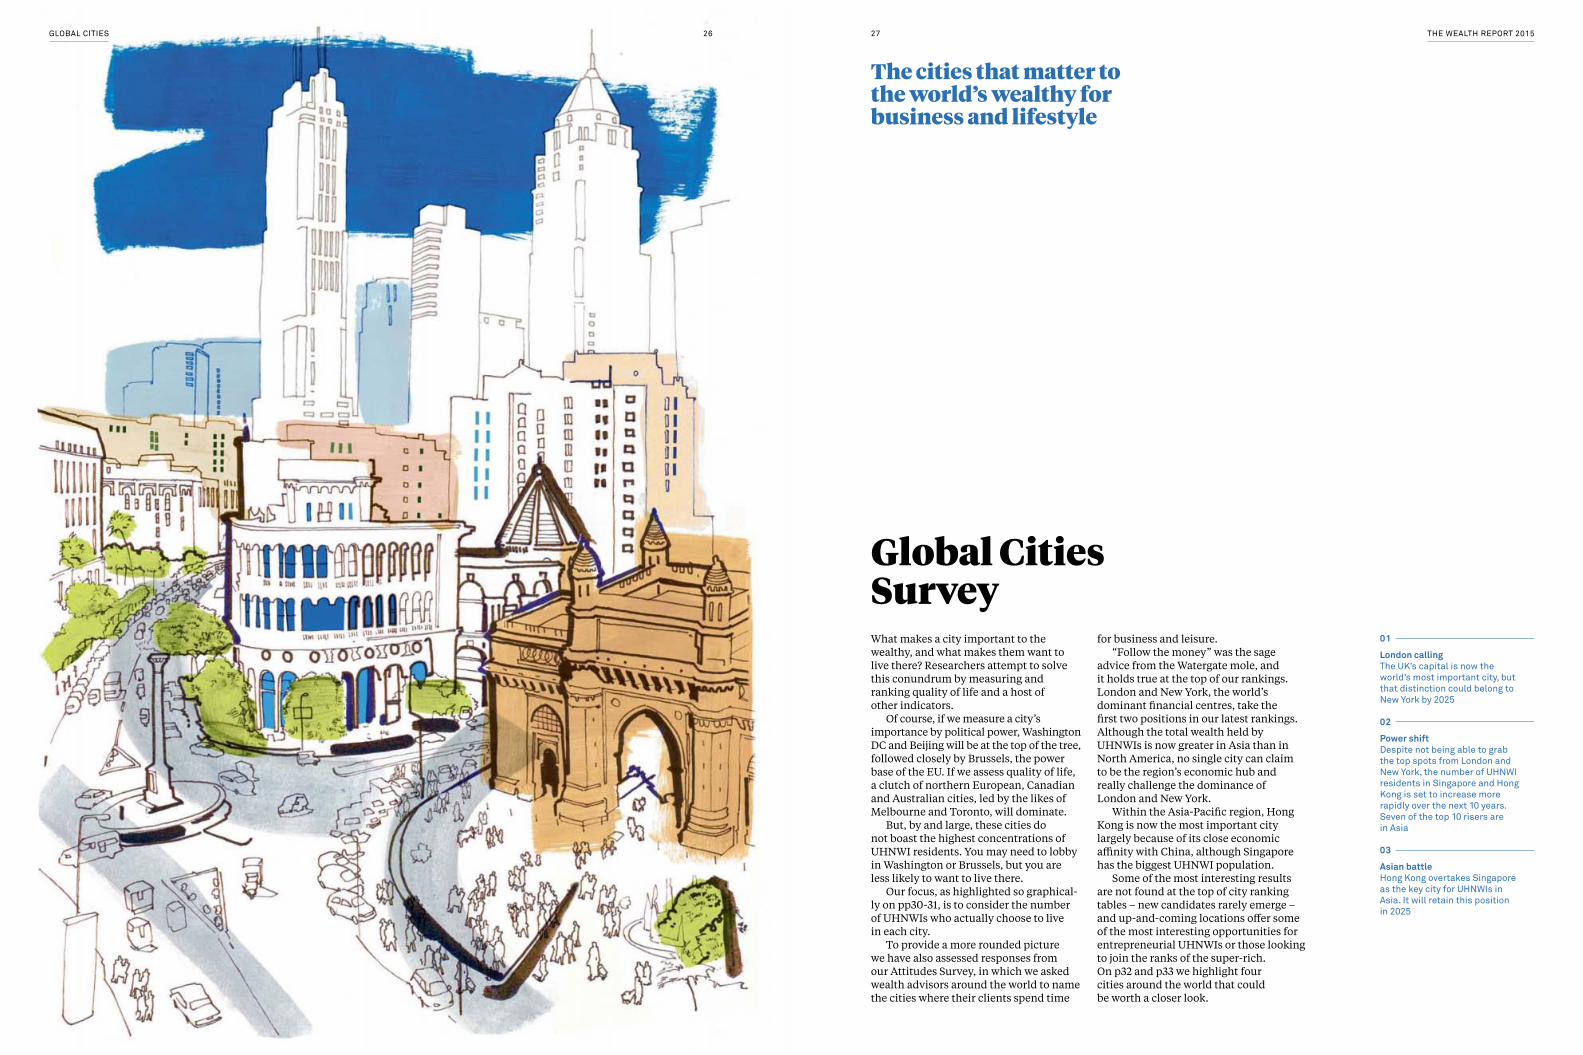
The cities that matter to the world’s wealthy for business and lifestyle
Global Cities SurveyWhat makes a city important to the wealthy, and what makes them want to live there? Researchers attempt to solve this conundrum by measuring and ranking quality of life and a host of other indicators.
Of course, if we measure a city’s importance by political power, Washington DC and Beijing will be at the top of the tree, followed closely by Brussels, the power base of the EU. If we assess quality of life, a clutch of northern European, Canadian and Australian cities, led by the likes of Melbourne and Toronto, will dominate.
But, by and large, these cities do not boast the highest concentrations of UHNWI residents. You may need to lobby in Washington or Brussels, but you are less likely to want to live there.
Our focus, as highlighted so graphical-ly on pp30-31, is to consider the number of UHNWIs who actually choose to live in each city.
To provide a more rounded picture we have also assessed responses from our Attitudes Survey, in which we asked wealth advisors around the world to name the cities where their clients spend time
for business and leisure.“Follow the money” was the sage
advice from the Watergate mole, and it holds true at the top of our rankings. London and New York, the world’s dominant financial centres, take the first two positions in our latest rankings. Although the total wealth held by UHNWIs is now greater in Asia than in North America, no single city can claim to be the region’s economic hub and really challenge the dominance of London and New York.
Within the Asia-Pacific region, Hong Kong is now the most important city largely because of its close economic affinity with China, although Singapore has the biggest UHNWI population.
Some of the most interesting results are not found at the top of city ranking tables – new candidates rarely emerge – and up-and-coming locations offer some of the most interesting opportunities for entrepreneurial UHNWIs or those looking to join the ranks of the super-rich. On p32 and p33 we highlight four cities around the world that could be worth a closer look.
01
London callingthe UK’s capital is now the world’s most important city, but that distinction could belong to New York by 2025
02
Power shift Despite not being able to grab the top spots from london and New York, the number of UhNwi residents in singapore and hong Kong is set to increase more rapidly over the next 10 years. seven of the top 10 risers are in asia
03
Asian battlehong Kong overtakes singapore as the key city for UhNwis in asia. it will retain this position in 2025

2928 the wealth report 2015
Most important cities to UHNWIs in 2025
1New York
2London
3Hong Kong
4Singapore
5Shanghai
6Beijing
7Miami
8Dubai
9Paris
10Zurich
Global cities
Changing fortunes across our rankings over the past 12 months have seen Hong Kong and Singapore continue to slug it out for pole position in Asia.
This year Hong Kong edges ahead, moving from fourth to third position in our global top 10. With Shanghai main-taining its steady rise, Asia holds four of the top 10 slots in our list. Although Geneva loses ground this year, Zurich’s strengthening helps maintain European representation.
Focusing purely on the population of wealthy residents, our data confirms that London remains the single biggest centre for global UHNWIs, followed by Tokyo, Singapore and New York. Ten years hence and the expectation is that London will retain its top spot, but Singapore will have closed the gap with a 54% growth in its population of UHNWIs over that period.
With the exception of London, European cities will see a relative decline in their rankings based on the size of their UHNWI populations over the next decade, despite an average 27% growth in wealthy residents.
Europe’s relative, if not absolute, decline is reflected in North America,
The world’s top 40 citiesThe latest results from our Global Cities Survey, which monitors the cities that matter to the world’s wealthy
LIAM BAILEY, GLoBAL HEAD of RESEARcH
Australasia and even the Middle East, with one standout reason – the dramatic growth of wealth in Asia. On average, cities across that region will see a 91% growth in their UHNWI populations over the next decade.
The most rapid growth in wealth will be seen in the likes of Ho Chi Minh City, Jakarta, Mumbai and Delhi. One-fifth of the cities assessed are expected to see greater than 100% growth over the next decade, all of which are in Asia or Africa. Geographic concentration of wealth remains a key facet with 10% of all additional growth in UHNWIs taking place in just five cities – Singapore, Hong Kong, New York, London and Mumbai – over the next decade.
When we focus on the broader measure of dollar millionaires, or HNWIs, rather than UHNWIs, we see some resilience in the performance of cities in the developed world. Tokyo contains the biggest single cluster of HNWIs today. At 466,000 the HNWI population is nearly a fifth larger than the number two city, New York, with a little under 400,000.
In 10 years we will see a reversal, with New York expected to be home to the
biggest global total, with over 520,000 HNWIs, and Tokyo slipping to second place with 508,000.
By this point Beijing will sit in third position, with 350,000 dollar millionaires, a rise of 55% over the decade. Despite the US and Japan hanging on with the two biggest city counts, growth even at this wealth level will be dominated by Asian centres, with six of the 10 biggest growth cities in absolute terms being in Asia.
Collectively they are expected to add 600,000 new HNWIs to their populations over the period to 2024. In Mumbai alone forecast growth is a phenomenal 125,000 – a 128%.
Our Attitudes Survey points to the cities that UHNWIs believe will yield the best investment opportunities in 2015 – led by New York, London, Berlin and Los Angeles.
Looking to the future, one constant remains: the rise of the Asian powerhouse cities, the relative decline of the Euro-pean centres and the tussle between the two global behemoths – New York and London, with New York expected to be the most important city for global UHNWIs in 2025.
source: Knight Frank Global cities survey
source: wealthinsight see pp30–31 for more city-level UhNwi population data
source: Knight Frank research
Top 40 most important cities to UHNWIs in 2015
1 london
2 New York
3 hong Kong
4 singapore
5 shanghai
6 Miami
7 paris
8 Dubai
9 beijing
10 Zurich
11 tokyo
12 toronto
13 Geneva
14 sydney
15 taipei
16 Frankfurt
17 Moscow
18 Madrid
19 san Fransisco
20 Vienna
21 Milan
22 los angeles
23 Jakarta
24 Munich
25 amsterdam
26 Mumbai
27 Dublin
28 Johannesburg
29 istanbul
30 Kuala lumpur
31 são paulo
32 Mexico city
33 berlin
34 washington Dc
35 boston
36 cape town
37 auckland
38 buenos aires
39 rio de Janeiro
40 tel aviv
HoW WE MEASURE THE WoRLD
our analysis confirms the most important global cities to the world’s wealthy. our measure includes an assessment of unique city-level UhNwi population counts, provided by wealthinsight; in addition, our attitudes survey con-tributes rankings covering the importance of cities for their business links, economic activity and lifestyle offer. in short, these are the cities where the wealthy congregate, work, invest, are educated and spend their leisure time. Future forecasts for wealth populations and judgements of the changing influence of cities from our attitudes survey underpin our forecast for the top 10 cities in 2025.
priMe MoVer london is the world’s most important city for UhNwis
ASIAN TIGER Singapore is set to gain the most UhNwis of any city over the next 10 years
Top three cities with the greatest growth in the number of UHNWI residents (2014-2024)
1 2 3
singapore hong Kong New York
+1,752 +1,251 +1,013

3130 the wealth report 2015Global cities
Where UHNWIs really liveour Global cities survey touched on the locations with the highest concentration of UhNwi residents; here we take a wider graphical look at city-level populations around the world in 2014.
source: wealthinsight

3332 the wealth report 2015Global cities
The cities featured on this spread are not those about to be listed among the world’s top 10 or even top 20 most important cities. Indeed, none of them yet boasts any billionaire residents, according to data from WealthInsight, but their HNWI (millionaire) and UHNWI populations are rising, and they are locations whose influ-ence we believe is growing strongly at a regional level. Even if they are unlikely to be on the second-home list of most UHNWIs, they should certainly be on their radars in terms of the wealth creation opportunities they will present.
Belgrade, Serbia
As with all our featured cities, rising wealth is a key illustration of the growing strength of Belgrade’s economic fortunes. While seeing only a steady 12% rise in the number of HNWI residents in the years from 2007 to 2014, the expectation is that this figure will jump markedly by 2024, with a forecast of 72% growth over the decade.
Accounting for 40% of Serbia’s economic activity, the city acts as south-eastern Europe’s financial and business centre and is witnessing rising levels of foreign direct investment.
Inward investment has been aided by tax incentives and grants and an increas-ingly competitive tax environment, which has attracted the likes of Fiat and Siemens to invest in plants in the city.
Lifestyle improvements over the past decade have been supercharged by a grow-ing reputation as a tourist centre – Lonely Planet describes Belgrade as “one of the most happening cities in Europe” – luring
Cities of the futureThe Wealth Report picks locations with a potentially bright future
young visitors in particular, who are stay-ing in increasing numbers, attracted by low-cost and relatively high-quality office accommodation to develop internet and app start-ups, including leading online gaming firms.
Panama City
The unique geography that has blessed Panama with its canal has also aided economic growth and wealth creation in its capital, Panama City, by bridging the divide between Latin and North America. With a near doubling in the number of HNWIs since 2007 to hit 4,700 in 2014 and nearly 7,000 by 2024, The Economist’s decision to label the city “a Singapore for Central America” seems increasingly prescient. In a Central American context Panama offers a high degree of economic and regulatory stability. Investors are attracted by the strongest economic growth offered in the region and also a very competitive tax environment – all
The Economist’s
decision to label Panama
“a Singaporefor Central
America” seems increasingly
prescientof which have contributed to foreign direct investment levels hitting 9% of GDP in recent years.
Tourism and retirement developments have added to the attractions of the city. High-quality transport and health care and a growing presence of global hotel brands have drawn investment from entrepreneurs looking to expand on a strong food and lifestyle scene.
Addis Ababa, Ethiopia
Africa’s fastest-growing economy, Ethiopia, benefits from not only the political importance of Addis Ababa but also the 3.8% annual growth rate of the population within the capital. In addition to natural growth, there is vast rural-urban migration, which planners predict combined could lead to the size of the city surging by 2040 to over 8.1 million.
Wealth creation has seen a near doubling of the population of HNWIs since 2007 to a little over 1,300, with one of the strongest forecast growth rates for the coming decade – with an expected expansion to 2,600 by 2024.
The city is understandably witness-ing severe growing pains, with public investment in transport including an overhead rail network, and construction dominating GDP growth. Relocation of existing residents to accommodate new infrastructure has caused severe stresses on some sectors of the city’s population. The Renaissance dam under construc-tion on the Blue Nile is Africa’s largest hydroelectric scheme and could provide energy security – a vital component for economic development.
With the presence of the African Union headquarters, and the headquar-ters of the United Nations Economic Commission for Africa, as well as a number of continental and international organizations, the city is commonly regarded as the political capital of Africa, lending a strong diplomatic and political edge to its growing economic strengths.
01 belGraDe south-eastern europe’s financial centre02 paNaMa citY “a singapore for central america”03 aDDis ababa africa’s political capital04 YaNGoN annual tourist visits to hit seven million by 2020
01
02
03
Yangon, Myanmar
With its number of HNWI residents set to more than double over the coming decade, hitting in excess of 3,500 US dollar millionaires by 2024, Myanmar’s former capital and largest city, Yangon, is a classic example of emerging market wealth creation.
Benefiting from the gradual opening up of its economy, following the introduction of democratic reforms in recent years, the city has seen strong employment growth and inward investment, with annual GDP growth at a national level predicted to eclipse that seen in India and even China in 2015 and 2016. Accounting for a fifth of
overall economic output, Yangon is set to be the lead beneficiary of this process.
Controls over non-resident property ownership have slowed private interna-tional investments, but private equity investment in business, especially those in the construction and development sectors, have been one method for non-residents to gain exposure to rising property values.
Restaurant, hotel and retail offer has been improving steadily over the past five years, and new entrants are arriving rapidly – with tourism visits forecast to grow from three million in 2015 to over seven million in 2020. A grand tour of Myanmar is now on the hotlist for wealthy tourists.
04

the performance of the world’s most important prime residential markets
Virtually everybody likes to talk about house prices, particularly the value of their own home. But for ultra-wealthy individuals who may own houses around the world, keeping track of their portfo-lio’s worth is not that simple.
However, Knight Frank’s newly en-larged Prime International Residential Index (PIRI) now includes performance data for 100 of the world’s key luxury city and second-home markets, and is recog-nised as the sector’s most comprehensive performance benchmark.
So what does the PIRI 100 tell us about prime market performance in 2014 – which UHNWI property owners will be rubbing their palms, and who will be less cheerful? Well, the picture is certainly mixed around the world.
Those lucky enough to have property in the US are unlikely to have any com-plaints, as domestic and international demand fuelled price growth. European destinations fared less well, with values dropping on average by 0.4% across the continent. Overall, city markets around the world outperformed second-home sun and ski destinations.
Of course, the analysis over the follow-ing pages is about more than just what happened last year. While past perfor-mance is interesting, what the astute property owner will be more concerned about is future trends.
Although isolated issues such as the Swiss government’s surprise decision to unpeg its currency from the euro in January – house prices in eff ect became 20% more expensive overnight for foreign buyers – will clearly impact markets, we see two main opposing trends at play at the macro level. How they play out will have a profound impact on prime property markets. On one hand, the growing globalisation of wealth means there are more UHNWIs from more countries looking for luxury homes in an increas-ingly diverse number of international destinations; on the other, there is burgeoning government scrutiny of wealth and levels of protectionism.
The globalisation theme is highlighted by the rising number of UHNWIs who are looking to shift their domicile; with the help of immigration specialist Fragomen we explore this trend in more detail on page 42. The growing usage of private jets for business and personal purposes is another refl ection of rising wealth mobility. Using exclusive data from NetJets we highlight the most popular and fastest-growing routes for the ultra-rich traveller.
And fi nally, Massimo Ferragamo, of the Italian fashion house Ferragamo, shares some of his own perspectives on luxury property ownership.
the PIrI 100
01
Big apple bounce New York saw the biggest growth in prime residential prices in 2014 (+18.8%). Three other US locations were in the top 10 of PIRI
03
london calling The UK saw the largest infl ux of HNWI passport seekers (over 114,000) over the past 10 years, according to immigration specialist Fragomen
02
Mixed fortunes While 16 of the locations in our PIRI 100 saw double-digit prime property price growth last year, the value of luxury homes fell or remained static in almost 40% of them
PIRI (PRIME INTERNATIONAL RESIDENTIAL INDEx) THE WEALTH REPORT 20153534

The value of luxury residential property around the world rose by just over 2% on average in 2014, based on the perfor-mance of the 100 locations covered by our PIRI rankings. With reversals in markets as far apart as Asia, the Middle East and Europe, growth was lower than the 2.8% seen in 2013.
The US dominates the top of our table, taking four out of the top 10 positions, with New York (+18.8%) and Aspen (+16%) in first and second place respectively. The disparity with Europe’s cities is stark. Luxury prices rose by almost 13% on aver-age across US cities last year, compared with an average of only 2.5% in Europe.
Bali, the leading Asian second-home market, and the emerging Middle Eastern urban powerhouse of Istanbul were stand-out performers, with luxury prices up by 15% year on year in both markets.
Our previous front runner, Jakarta, which led the rankings in 2012 and 2013, slipped to 12th place this year, an indica-tion of the luxury market slowdown evi-dent across many Asian cities last year.
Some previously strong markets such as Dubai (17% growth in 2013) saw prices slow markedly (0.3% in 2014). This is in part because of the mortgage cap of the Central Bank of the UAE, which is stricter for those purchasing properties above five million dirham.
The dampening impact of this kind of prudent macro policy also explains the ongoing weak growth in Hong Kong and Singapore. Government policy has been deliberately aimed at limiting price rises through higher taxation and mortgage market intervention.
Mainland China mirrored this trend with prime price growth in Shanghai (0%), Beijing (-0.5%) and Guangzhou (0.6%) proving lacklustre at best.
Government policy has been
deliberately aimed at
limiting price rises through
higher taxation and mortgage
market intervention
Buenos Aires proved our weakest per-former, but with GDP growth in negative territory in 2014, the city’s housing market tribulations are less than surprising.
While the threat of Mayor de Blasio’s so-called pied-à-terre tax doesn’t appear to have dampened growth in New York, recent hikes in stamp duty (a purchase tax) have curtailed the rate of price growth for properties worth over £2m in London, holding overall prime price growth at 5.1% for the year. The latest changes to UK Stamp Duty mean higher costs for those purchasing a property priced at £937,500 or above, this may cap growth above this threshold in the near term.
Despite the more muted performance of the PIRI 100 this year, luxury housing markets continue to outperform their mainstream counterparts. The average price of a luxury home in our index is 38% higher than it was at the index’s lowest point in the second quarter of 2009; the av-erage price of mainstream global property has risen by just 14% over the same period.
21 Melbourne Australasia 8.5%22 Tokyo Asia 8.1%23= Verbier Europe 8.0%23= Munich Europe 8.0%25= Vancouver North America 7.5%25= Frankfurt Europe 7.5%27 São Paulo Latin America 7.3%28 Toronto North America 7.1%29 Riyadh Middle East 6.0%30= Seoul Asia 5.3%30= Doha Middle East 5.3%32= Madrid Europe 5.1%32= London Europe 5.1%32= Bangkok Asia 5.1%35= Mustique Caribbean 5.0%35= Ibiza Europe 5.0%37 Edinburgh Europe 4.2%38 Courchevel 1550 Europe 3.2%39= Venice Europe 3.0%39= Jumby Bay (Antigua) Caribbean 3.0%39= Barcelona Europe 3.0%39= Val d’Isère Europe 3.0%43 Mumbai Asia 2.9%44= Cayman Islands Caribbean 2.5%44= Marrakesh Africa 2.5%44= Gstaad Europe 2.5%47= Bahamas Caribbean 2.0%47= Morzine Europe 2.0%47= Sotogrande Europe 2.0%47= Chamonix Europe 2.0%47= Western Algarve Europe 2.0%47= Cyprus Europe 2.0%53 Delhi Asia 1.8%54 Rome Europe 1.5%55 Nairobi Africa 1.4%56 Hong Kong Asia 1.1%57 Phuket Asia 0.7%58 Guangzhou Asia 0.6%59 Kuala Lumpur Asia 0.5%60 Dubai Middle East 0.3%61= St Barts Caribbean 0.0%61= Shanghai Asia 0.0%63= Central Algarve Europe -0.5%63= Beijing Asia -0.5%65 Taipei Asia -1.2%66 Méribel Europe -1.5%67= Megève Europe -2.0%67= Italian Riviera Europe -2.0%67= Monaco Europe -2.0%67= Florence Europe -2.0%67= Geneva Europe -2.0%67= St Moritz Europe -2.0%67= Cap Ferrat Europe -2.0%74= Evian Europe -3.0%74= Marbella Europe -3.0%74= Mallorca Europe -3.0%74= Barbados Caribbean -3.0%74= Provence Europe -3.0%74= Lake Como Europe -3.0%74= Vienna Europe -3.0%74= Brussels Europe -3.0%74= Davos Europe -3.0%83 Paris Europe -3.5%84 Moscow Russia/CIS -3.7%85= Cannes Europe -4.0%85= Tuscany Europe -4.0%87= St-Tropez Europe -5.0%87= Lausanne Europe -5.0%87= Villars-sur-Ollon Europe -5.0%90 Courchevel 1850 Europe -5.4%91 Dordogne Europe -6.0%92= British Virgin Islands Caribbean -7.0%92= Umbria Europe -7.0%94= Sardinia Europe -8.0%94= Zurich Europe -8.0%96 Cortina Europe -10.0%97 Milan Europe -12.0%98 Singapore Asia -12.4%99= Crans-Montana Europe -15.0%99= Buenos Aires Latin America -15.0%
The PIRI 100
The latest results of our Prime International Residential Index, which marks the change in price of prime residential property in 100 cities and second-home locations (annual percent growth to 31 December 2014*)
*All price changes relate to local currency and reflect nominal change. Data for Moscow, Los Angeles, San Francisco, Miami and Riyadh relates to the period from Q3 2013 to Q3 2014. Data for Tel Aviv relates to the period from Nov 2013 to Nov 2014. Tokyo relates to properties above JPY 100m.
US shines as global growth falls Analysis of the latest trends to emerge from Knight Frank’s unique Prime International Residential Index (PIRI) KaTe eveReTT-allen, Head of InTeRnaTIonal ResIdenTIal ReseaRcH
Rank location World Region annual % change1 New York North America 18.8%2 Aspen North America 16.0%3= Bali Asia 15.0%3= Istanbul Middle East 15.0%5 Abu Dhabi Middle East 14.7%6 San Francisco North America 14.3%7 Dublin Europe 13.4%8= Cape Town Africa 13.2%8= Muscat Middle East 13.2%10 Los Angeles North America 13.0%11 Auckland Australasia 12.1%12 Jakarta Asia 11.2%13 Sydney Australasia 11.0%14 Tel Aviv Middle East 10.3%15 Bengaluru Asia 10.1%16 Amsterdam Europe 10.0%17 Miami North America 9.8%18 Berlin Europe 9.0%19= Washington DC North America 8.7%19= Johannesburg Africa 8.7%
Top
20
Sources: All data from Knight Frank’s global network with the exception of: Aspen – Andrew Ernemann of Sotheby’s International Realty; Washington DC – Metropolitan Regional Information Systems, Inc. Statistics generated on 06/01/2015, ©Copyright 2015. All rights reserved. Information deemed reliable but not guaranteed; Tokyo – Ken Corporation; São Paulo – FIPE (Fundação Instituto de Pesquisas Econômicas); Los Angeles and San Francisco – First Republic Bank; Vancouver – Dexter Associates Realty
RISING HIGH Prime property values in New York are soaring
Annual price change by world region, to 31 December 2014
North America
11.9%
Latin America
-3.9%
Europe
-0.4%Africa
6.5%Middle East
9.3%
Caribbean
0.4%
Russia/CIS
-3.7%Asia
3.0%Australasia
10.5%
PIRI (PRIME INTERNATIONAL RESIDENTIAL INDEx) THE WEALTH REPORT 20153736

Since Knight Frank published the first edition of The Wealth Report in 2007, a relatively simple narrative – undented by even the global financial crisis – has domi-nated our analysis of global luxury resi-dential markets. Growing wealth creation has led to an increasing number of buyers, from an ever-widening list of countries, purchasing property in a growing number of global hubs.
With the arrival in 2014 of significant volumes of wealthy Chinese investors in markets around the world, it seems an odd time to question the sustainability of this trend. There is, however, a risk in as-suming that the globalisation of demand is a one-way bet, as signs of protectionism are growing.
Immigration, a classic driver for international property investment by UHNWIs, and a subject we look at in detail on p42, is an arena where we are seeing rising counter-trends.
In 2014 Russia, for example, imposed reporting requirements on nationals seek-ing permanent residence or citizenship in other countries, backed by criminal sanctions. Some recipient countries have tightened access to residency, notably Switzerland, which has seen a range of restrictions on UHNWI immigration over recent years.
We have commented in previous edi-tions of The Wealth Report on the adop-tion of new taxes or restrictions aimed specifically at non-resident purchasers, most notably in Singapore and Hong Kong. Other countries are copying this model.
The UK will see the withdrawal of the capital gains tax exemption for non-residents in April this year, with the introduction of higher annual charges for residential property held in corporate structures, traditionally favoured by wealthy overseas buyers.
In cities like New York and Paris new property taxes have been considered.
Despite these protectionist reactions, the overall direction of travel favours more, not less, international demand for prime residential property.
There are a wide range of factors underpinning additional globalisation. Short-term geopolitical and fiscal factors still dominate, the flight of capital from southern Europe during the eurozone crisis in 2010 and 2011 is just one example.
potential for demand growth from main-land China, but massive private wealth has not yet diversified globally; rather its migration has been hampered by foreign-exchange controls.
There has been a general acceptance that over time, restrictions on pension investments and even direct investments for Chinese citizens will be relaxed, and more money will be invested overseas.
We might want to question this assumption for a moment. Since the financial crisis the list of countries that have imposed tougher controls on the free flow of capital, even if only temporarily, has grown longer – India, Ghana, Cyprus, Ukraine, with more to come. There has been a shift away from the assumed direc-tion of travel – of more-liberal trading conditions.
Even if China does liberalise, the huge potential for Chinese investment flows to influence asset prices globally highlights the tension between our globalisation and protectionism themes.
Rising demand from emerging-world wealth has the potential to lead to a stronger political and regulatory backlash in the main global investment hubs – if asset prices and affordability issues rise strongly as a result.
But long-term trends, such as the growing appetite for international education, and the pull of stable political, economic and regulatory safe havens, are responsible for the most durable ongoing demand sources.
The strength of London’s education offer has long underpinned demand for the city’s property. A decade ago Russian, Middle Eastern or European children mov-ing into London schools would be starting at age 13. Rising competition for places at 13 means a starting age of seven or eight is increasingly the norm.
London is not the sole education target. There is a growing desire for UHNWIs to craft a global education experience – school in the UK or Australia, university in the US, postgraduate study or MBA in Europe – creating global citizens in terms of language, location and education. And at every stage there will almost inevitably be a property requirement.
Rising demand from
emerging-worldwealth has
the potential to lead to a
stronger political and
regulatory backlash
in the main global
investment hubs
Although rules surrounding the im-migration process are tightening in some locations, the general trend is for more countries, especially indebted European ones, to try to attract new wealthy resi-dents. Although it can be a challenge for countries to create high-value immigration schemes and meet tough compliance safeguards, more will undoubtedly try.
Perhaps the biggest trend that would contribute to our globalisation narrative winning out against protectionism is the lifting of capital controls in wealth-export-ing countries. Effective demand for luxury international property would be far higher than it currently is if it weren’t for red tape and bureaucratic limitations such as foreign exchange controls, as experienced in India and China, for example.
China is the most instructive, but not unique, example to consider. The simple fact is that there is extraordinary
Opposing forcesThe tension between protectionismand globalisation in residential markets is impacting market performance
lIaM BaIleY, GloBal Head of ReseaRcH
Source: See main PIRI table on page 37. *Based on apartments only
PIRI price change by property type in 2014
-0.9% -0.5%
4.5%
Second home – skiSecond home – sunCity
There are, however, two potential future approaches to release this tension. Firstly there is a politically restrictive approach, with more taxation and regula-tions aimed at non-resident investors. By asking for notification of second passports, Russia has confirmed how restrictions can easily come from the wealth-exporting nations. China could introduce a wealth tax on outbound capital flows or even a worldwide tax regime.
Alternatively, it is just as likely that China will enter into greater cooperation on information exchange – regarding taxation and by which China, and others, will ultimately join in the wider policing of global wealth. This shift towards increased global cooperation over taxation and transparency, and the sharing of investor details, would see a greater alignment of costs and benefits between wealth-expor-ting countries and the investment destina-tion countries – which could ultimately support long-term growth in investment.
The square metres of luxury property Us$1m will buy
Monaco
Hong Kong*
London
New York
Singapore
Geneva
Sydney*
Shanghai
Paris
Beijing
Rome
Moscow
Istanbul
Tokyo
Mumbai
São Paulo
Dubai
Cape Town
Miami
Los Angeles
17
20
21
34
39
39
41
48
50
57
59
61
68
79
84
86
96
142
145
204
fIve GloBal PRIMe ResIdenTIal HoTsPoTs
London
St John Street, Clerkenwell. This area has led the loft-living trend for over 30 years. We see the demand for loft accommodation increasing. Scarcity will drive pricing, as will Crossrail, with the nearby Farringdon station providing access to this key invest-ment location. The Tech City association will also drive the continued growth of high-quality shopping and restaurants.
Typical 700 sq ft apartment – Us$1.3m
New York
West Street in Manhattan is one to watch. The street will form the new residential entrance to Brookfield Place, adjacent to the new World Trade Center complex, and will be lined with world-class restaurants and luxury retail brands. West Street is aleader for the whole downtown market,which is set for a boost over the next few years; value growth here should outpace the rest of New York by some margin.
Typical 1,500 sq ft apartment –Us$2.7m
Cape Town
Main Road, Green Point, Cape Town. The local area was initially boosted by the legacy of the World Cup, and huge invest-
ment was put into upgrading local infra-structure, such as developing parks, roads and a transport system. On the back of this, restaurateurs such as Manos and Beluga have improved the local lifestyle offer. Add in world-class sports facilities, access to the waterfront, the city centre and views of Table Mountain and this is the street to watch in 2015.
Typical 700 sq ft apartment – Us$200,000
Dubai
Business Bay, Dubai. Work has started on building a channel connecting the sea to the existing lake that lies in front of the Burj Khalifa. This will allow access for superyachts and sailing boats to the bay. Construction of large towers lining the channel is under way, providing residences with the unique benefit of mooring facilities in this central location.
Typical 1,500 sq ft apartment – Us$680,000
Hong Kong
Our tip for Hong Kong is the Sai Ying Pun neighbourhood. It is within close walking distance to central Hong Kong but retains local charm. The area is near galleries, good shops and excellent local restaurants. While more residential buildings have started to be developed in the area, there are still many opportunities for redevelopment.
Typical 700 sq ft apartment – Us$1.9m
PIRI (PRIME INTERNATIONAL RESIDENTIAL INDEx) THE WEALTH REPORT 20153938

With its density of wealth and internal economic linkages, the US remains the world’s most important private jet market by some distance, according to private avi-ation provider NetJets. This dominance is borne out when we consider the globe’s busiest private jet routes, where 60% of the traffi c starts and ends in the US.
NetJets confi rms that Europe is the second-largest market, at around 25% of the US. Russia continues to represent a signifi cant portion of overall European demand. Moscow is among the top 10 routes with highest hours fl own, as re-corded by NetJets, refl ecting the ongoing importance of Russian wealth in luxury property markets in Europe and the US.
London’s standout performance in Europe as an investment destination is confi rmed by the fact that 30% of the most frequented routes in this region either start or fi nish in the UK’s capital city.
NetJets reports that the synergy between New York and London is greater than ever, with traffi c on this major route increasing every year.
While Dubai and the broader UAE are seeing increasing traffi c, the Middle East’s position as the world’s third-largest market is being challenged by the rise of traffi c in China and Brazil. Traffi c from Brazil to Europe has grown 20% each year since 2010, with the main destinations inclu-ding France, Spain, Portugal and the UK – refl ected by luxury property investment purchases by Brazilian buyers during 2014.
Africa is a more fragmented market, although Nigeria has become a major private jet hub – with fl ights to and from Lagos making it into our list of the top 10 fastest-growing global routes.
Anticipating wealth fl ows from one part of the world to another has become an industry in itself. The insight of
FASTEST- GROWING
ROUTE
Nice/Côte d’Azur
New York
FlY aWaYUsing exclusive NetJets data, The Wealth Report looks at the most popular private jet routes and assesses their impact on wealth migration and property investment destinations
WHo Is flYInG?
Over 80% of private jet passengers are male. The typical age for fl yers is 40-55. Private entrepreneurs dominate in terms of profession. Source of wealth tends to be from fi nance and the oil and gas sectors. NetJets reports that fl yers from the property industry have returned in the past 12 months, joined by owners of technology companies.
NetJets shines some light on the latest trends. There is a clear synergy between established market routes and investment fl ows – with London and New York dis-playing one of the closest prime property relationships as well as fl ight paths.
The most insightful data comes when we look at emerging-market demand. Latin American investment in Europe, for example, has long been overshadowed by the huge waves of investment fl ow-ing into Miami and other US hotspots. The breadth of routes fl own into key EU markets from Brazil, but also Argentina and other key southern American hubs, reveals a closer relationship between these markets than is often recognised.
The huge potential for demand for property in Europe, and also in North America, from investors based in Asia, Africa, the Middle East and Latin America is hinted at by the new growth routes highlighted by the NetJets data.
This page:HIGH FLIERS Private jet usage by UHNWIs is increasing
Opposite page: SO NICE The Côte d’Azur is one of the most popular desitinations for private jet charters
Source: NetJets/Eurocontrol/SAS
Maiquetía
Dubai
Pittsburgh
Houston
Moscow
Houston
Lagos
Austin
Houston
Nice/Côte d’Azur
Miami
New York*
Midland (Texas)
London
Houston
Washington DC
Tel Aviv
New York*
West Palm Beach
London
*Teterboro, New Jersey
Miami
New York*
New York*
London
London
London
Chicago
Houston
West Palm Beach
Moscow
New York*
Nice/Côte d’Azur
Nice/Côte d’Azur
New York*
New York*
New York**
Moscow
West Palm Beach
New York*
Los Angeles***
*Teterboro, New Jersey**Westchester/White Plains, New York***Van Nuys
Private jet traffic: top 10 routes (2013)
Private jet traffic: top 10 fastest-growing routes (2013)
DePartUre BOarD
cHIna PoTenTIal
China’s current absence from our top 10 relates to the embryonic nature of its private jet market. However, growth potential in the near term is signifi cant – jet manufacturer Bombardier fore-casts that the Greater China private jet fl eet is likely to grow from 330 to 1,275 aircraft by 2023.
NetJets, the fi rst international op-erator to have secured a Chinese air operating certificate to operate in mainland China, believes that intra-China fl ights are likely to concentrate initially on three major metropolitan areas : Beijing, Shanghai and Hong Kong.
snoWBelT and sUnBelTdesTInaTIons
In a relatively fl at market both Olbia in Sardinia (+14%) and Ibiza (+17%) have seen very strong annual increases in traffi c over the past 12 months, confi rm-ing their growing importance as summer holiday and second-home hubs. Nice remains a major destination, likewise the airport of St-Tropez, where fl ying into La Môle is now possible. Growth in traffi c to Alpine airports, such as Sion and Chambéry, points to a revival in demand for property in nearby resorts like Verbier, St Moritz and Courchevel.
Private jet traffi c to destinations like the Maldives, the Caribbean and the Seychelles confirms the growing strength of property in long-distance resorts.
PIRI (PRIME INTERNATIONAL RESIDENTIAL INDEx) THE WEALTH REPORT 20154140

Anyone watching London’s stellar residential market performance will be unsurprised to hear that the UK has been a top recipient of mobile HNWIs over the past decade.
According to Nadine Goldfoot, a part-ner at Fragomen, over 60% of these have been from Europe, but with substantial numbers also coming from China, Russia, India, the Middle East (especially Saudi Arabia, Syria and Turkey) and Africa (led by South Africa, Nigeria and Egypt). More recently, 309 of the 703 applications in the first nine months of 2014 for the UK’s Tier 1 investor visa were from China, with 162 coming from Russia.
Singapore has seen strong migration of HNWIs from China, India and Indonesia. Flows into the US predominantly come from the UK, India and Russia, although Fragomen’s worldwide client practice notes that the US EB-5 programme saw record applicant numbers from China in 2014.
Demand for entry to Australia has been boosted by strong inflows from across
the Asia-Pacific region (India, China, Indonesia), as well as the UK, Europe and South Africa. As of January 2015 the Hong Kong CIES programme, which was especially popular with HNWIs from China, has been suspended, leaving clients from the region in need of sus-tainable alternatives.
Restrictions on confidentiality rules in Switzerland have removed some options for the mobile wealthy, and Fragomen notes a number of HNWIs who had been domiciled in Switzerland for tax purposes have relocated to Singapore, the UK or the UAE.
There has been growing specula-tion over the success of the more recent entrants to the investor immigration market – most of them in Europe. Fragomen has noticed a sizeable uptake in programmes linked to property purchases in Europe – across Spain, Portugal and Latvia.
Malta’s Individual Investor Progr- a-mme introduced in February 2014 had
Demand will increasingly be driven by international developers
The world’s largest residential developers, led by players from China, India, Hong Kong and Malaysia, continue to diver-sify into new markets. Where Greenland Group, Swire, China Vanke Co and Lodha Group lead, they are followed by private compatriot investors looking to dip their toe into international investment – with the reassurance of buying from a familiar brand. Watch for Hong Kong buyers in Mi-ami, and Chinese buyers on the Australian Gold Coast and the US West Coast – and just about every nationality in London and New York.
Some buyers will find the market less welcoming
Pressure from any number of bodies – the EU, the US and the OECD included – on low tax jurisdictions to comply with trans-parency rulings is acting in concert with ever-tighter regulations aimed at reducing the risk of money laundering. Similarly, while EU and US restrictions on Russia over the Ukraine crisis may have been tightly drawn in terms of named individu-als with whom to avoid doing business, the somewhat vague wording in the regula-tions has caused professional advisors to become increasingly risk-averse in terms of whom they work with. Banks in par-ticular will simply not risk falling short of regulatory standards. There are a small but growing number of potential buyers who will find it increasingly difficult to access foreign property markets.
Government stimulus will be with us for longer
That ultra-low interest rates and govern-ment stimulus measures have aided de-mand for residential property, as with just about every other tangible asset, is a given. A year ago the assumption was that it was only a matter of time before interest rates would begin to rise across the developed world. A year on and the continued fragi-lity of the eurozone recovery and broader concerns over the global economy have meant that policy tightening has been pushed further into 2015 and even into 2016. It appears that the support for global demand and the ability of purchasers to push prices higher will be with us for some while yet.
Technology will reinforce the globali-sation of demand
In last year’s edition of The Wealth Report we discussed the potential impact of sub-orbital travel on property demand over the next 10 to 20 years. More immediate support for global demand is likely to come from improvements to traditional jet technology. Several companies such as Aerion, Spike Aerospace, Lockheed Mar-tin and Boeing are working to reintroduce a more affordable and sustainable supersonic replacement for Concorde.
UK
Singapore
US
Australia
Hong Kong
Canada
UAE
HNWIs 2013Country HNWIs gained from 2003 to 2013 (as a percentage of total HNWI population)
114,100 (14%)
(20%)
(1%)
(14%)
(12%)
(5%)
(21%)
45,000
815,000
225,000
158,300
164,500
272,900
48,300
4,034,000 42,400
22,200
19,700
13,600
10,100
countries with the biggest inflows of HnWIs (past 10 years)
China
India
France
Italy
Russia
Switzerland
Indonesia
HNWIs 2013Country HNWIs lost from 2003 to 2013 (as a percentage of total HNWI population)
76,200 (15%)
(27%)43,400
507,800
160,600
124,000
82,300
265,800
37,000
244,100 (13%)31,700
(15%)18,600
(17%)14,000
(4%)10,600
(27%)10,000
countries with the biggest outflows of HnWIs (past 10 years)
received over 200 applications by August 2014, with applicants from 30 countries, but mostly from Russia.
Official figures show over 1,936 visas were issued in the first 12 months of Portugal’s Golden Visa programme. Here the vast majority of applicants have been from China, representing close to 80% of total demand.
The biggest story in terms of wealth-ex-porting nations is undoubtedly China. It is estimated that 76,200 Chinese millionaires emigrated or acquired alternative citizen-ship over the 10 years to 2013. They are a significant force in Europe and dominate Asia-Pacific schemes – with around 90% of applicants for Australia’s Significant Inves-tor visa coming from China.
India’s wealthy migrants tend to favour the UK, the US and Australia. French and Italian HNWIs prefer the UK and Swit-zerland. Some 73,000 Russians received foreign passports in 2013/14, the majority of the HNWIs among them focusing on the UK and the US.
Reducing the London to New York travel time from seven hours to three and a half is the first ambitious objective.
New buyers will help boost demand in established and emerging prime markets
Mexico, Indonesia, Nigeria and Turkey will be among the biggest suppliers of UHNWIs hungry to buy luxury inter-national property. Although Mexican nationals tend to move into the US, they are positive about European opportuni-ties, with some notable investments made in Spain and Germany in 2014. Turkey is a growth market, although because of ongo-ing problems around banking licences and restrictions on capital flows, real demand has been held below potential levels. Indonesian buyers will become a much more serious force in Australia and the wider Asia-Pacific region in 2015. While Nigerian buyers will still form a strong sector of the market in key cities like London and New York, they will increase their activity closer to home in South Africa and Mauritius.
PaSSPOrtS, PleaSeHNWI migration is a major influence on the global luxury property market. Using research provided by global immigration specialist Fragomen, we examine the directions of travel
Future prime property trendsThe main factors that are likely to drive prime residential markets over the short and long term lIaM BaIleY, GloBal Head of ReseaRcH
Source: Fragomen using data from New World Wealth survey
GOLD STANDARD Australia’s east coast is attracting a new wave of Asian residential investors
PIRI (PRIME INTERNATIONAL RESIDENTIAL INDEx) THE WEALTH REPORT 20154342

He asks me if I’ve ever been to the Val d’Orcia, a UNESCO world heritage site, largely unchanged since the 15th century. I’ve not, so I mention another area in Tus-cany that I have visited and considered very beautiful. “It is nice there,” he replies politely, “but it’s not the same. Del Bosco is somewhere very special. All you can see is green, green and green, and nothing to ruin the view of the landscape.”
Originally, the plan was to turn the estate into a very exclusive private mem-bers’ club. However, in the wake of the fi nancial crisis, Mr Ferragamo changed his model. The estate is still very exclu-sive, but visitors can now stay in the hotel and villas and join Italy’s only private golf club, which is located on the property. A number of the estate’s villas have also been sold to an international range of buyers. “We renovate the villas for the owners, and when the owners are not in residence, we manage all aspects of the property.”
The process of rejuvenating the estate, which dates back to the 10th century, has clearly been a labour of love. “You cannot own a property like this without it having a purpose. You have to create a synergy for all its elements – the land, the build-ings, the vineyards – to bring it back to life again.”
After we’ve talked and just as The Wealth Report is about to go to press, Mr Ferragamo gets in touch to let me know that Rosewood Hotels and Resorts, after careful consideration, has been appointed to manage the estate’s hotel and villas.
Massimo Ferragamo’s life seems to divide neatly in two. Not only does he split his time between Italy and the US – “I was sent there to work for the Ferragamo busi-ness when I was 25”– but in each country he likes to move between homes in the city and the countryside.
In Italy he owns a house in Florence – “the most beautiful city in world, where I was born” – as well as Castiglion del Bosco, a 5,000-acre estate in the Val d’Orcia region of Tuscany. Stateside he has an apartment in Manhattan and a
“They immediately recognised and respected that Castiglion del Bosco is deeply rooted in the Tuscan way of life.”
As well as his cherished Tuscan estate, Mr Ferragamo is also involved with his family’s wider property portfolio, which includes fi ve boutique luxury hotels in Florence and Rome – “They are doing very well, so we might open outside of Italy” – and the freehold of many of the Ferragamo shops around the world. “Real estate became second nature to us almost by chance. We’re allergic to paying rent,” he says.
I ask if he has a philosophy when it comes to investing.“I call it the three Ls – I have to love something, it has to be in a good location and the investment has to be for the long term. If you stick to those rules in real estate you’ll never lose.”
“As a family we don’t speculate. There is not a speculative piece of DNA in our bodies. When you speculate it’s like musi-cal chairs – if the music stops and you don’t have somewhere to sit, you’ve got a problem,” he adds fi rmly.
Personal perspectives on property
The Wealth Report Editor Andrew Shirley talks to MASSIMO FERRAGAMO about homes, property investments and an unusual collection
country house in Millbrook, a small vil-lage in upstate New York referred to as a low-key version of the Hamptons.
“I love the contrast between the city and the countryside,” he explains. “They are quite diff erent, and I really like that.” But, I ask, if you had to make a choice? “If I was forced to choose I would say I prefer the countryside,” he concedes after a mo-ment’s thought.
He brushes off my surprise that he doesn’t also own a waterside property like many other UHNWIs or a ski chalet,
especially as his wife skied for the Italian national team. He says he likes to keep things simple.
“To be honest, a collection of houses can also be a collection of headaches,” he says, “and there are so many lovely places around the world to stay and ski. The whole family is also a great lover of boats, so we prefer to actually be on the water, not just looking at it.”
Helping people avoid the problems often associated with second-home ownership was one of the reasons behind the development of the Castiglion del Bosco estate, which he stumbled across by chance when looking for somewhere to make wine. He certainly wasn’t looking for a project of that scale – the estate in-cluded many medieval buildings in need of renovation – but he fell in love with it.
As a family we don’t speculate. There is not a speculative piece of DNA in our bodies.
When you speculate it’s like musical chairs
To be honest, a collection of housescan also be a collection of headaches
MASSIMO FERRAGAMO
As a scion of one of Italy’s, if not the world’s, most infl uential and successful fashion dynasties, Massimo Ferragamo has style in his DNA. The sixth and youngest child of Salvatore Ferragamo, who rose to fame creating shoes for the stars of Hollywood in the 1920s, Massimo is Chairman of Ferragamo USA, and pursues personal and family projects in his native Tuscany.
MASSIMO MASSIMO FERRAGAMO
MASSIMO FERRAGAMO
MASSIMO FERRAGAMO
MASSIMO FERRAGAMO
MASSIMO FERRAGAMO
MASSIMO FERRAGAMO
MASSIMO FERRAGAMO
MASSIMO FERRAGAMO
MASSIMO FERRAGAMO
MASSIMO FERRAGAMOFERRAGAMOFERRAGAMOFERRAGAMOFERRAGAMOFERRAGAMO
Given that Mr Ferragamo has such a peripatetic lifestyle, I wonder if he has time for any other investments of pas-sion apart from property – maybe art or classic cars. “As a family we own art, al-though I’m not really a collector myself,” he says. But as befi ts somebody who likes to make his own rules when investing in property, it turns out that he does have a suitably individual collection that takes pride of place in his Florentine study.
“I do love sports, so I like to buy an-tique silver trophies. You can get a nice surprise when you turn them over and see they were made by Mappin & Webb, Asprey or Garrard.” His favourite, he says, is a huge 1904 silver charity shield from England, once competed for by a team called the Corinthians against the winners of the then equivalent of the Premier League.
Although he “hates to overpay” for anything, Mr Ferragamo says, as with prop-erty, you have to like what you buy and be prepared to hold it, and then in the long term it will prove to be a good investment.
LABOUR OF LOVE Castiglion del Bosco in Tuscany’s Val d’Orcia
WELL-HEELED The Ferragamo Museum in Florence
PIRI (PRIME INTERNATIONAL RESIDENTIAL INDEX) THE WEALTH REPORT 20154544

PROPERTy INVESTMENT 46
UHNWI appetite for property increasesIn the 2014 edition of The Wealth Report, almost half of the wealth advisors who took part in our annual Attitudes Survey said that their UHNWI clients would po-tentially increase their investment alloca-tion to property during the year. In this year’s survey, almost 40% of respondents said that had actually happened.
Property is defi nitely back on the agenda for private investors, who ac-counted for around a quarter of all com-mercial property deals last year, as well as residential investments. Tracking the ex-act proportion is diffi cult because many transactions, while essentially funded by an UHNWI, are fronted by a family-owned fund, company or private offi ce.
The tangible nature of property, especially when located in leading cities such as London, is one of its enduring attractions. But UHNWIs are now looking beyond prime or trophy offi ces and retail space as a safe haven for their funds; they are prepared to look up the risk curve to non-core locations.
This may mean moving outside a capital city’s CBD area, where yields have become increasingly compressed, or heading into secondary cities where bet-ter value and higher returns are available. Increasingly for many UHNWIs it also means investing overseas. The results
of our Capital Markets Survey show that wealthy investors are allocating more of their funds to property investments out-side their own country. More peripheral markets such as Ireland and Spain are benefi ting from this trend.
Demand for alternative property assets is also growing, and is leading to more private investment into business-critical opportunities like health care and student accommodation. UHNWIs are adopting increasingly sophisticated investment strategies, and sometimes this approach involves the kind of active management previously restricted to institutions and funds. Examples include refurbishment and development projects.
Goodwin Gaw, who we interview at the end of this chapter, is one of Asia’s lead-ing property investors and exemplifi es this value-add approach. Where others may see down-at-heel neighbourhoods, he sees opportunities for regeneration and social change.
According to our latest Attitudes Survey results, the UHNWI hunger for property as an investment remains undimmed. Falling oil prices should free up more capital to be spent on consumer goods, which should in turn present more property opportunities to feed the increasingly hungry private investor.
01
Commercially minded An estimated $619bn of commercial property deals wastransacted in 2014, a 7% increase on the previous year
03
Global fl ow UHNWIs are increasing the amounts they invest overseas, according to the results of our Capital Markets Survey
02
Big dealUHNWIs were active in the market during 2014, accounting for over $150bn of commercial transactions. The biggest was the $1.15bn purchase of london’s “Gherkin” by a wealthy Brazilian family
Global trends and markets: the need-to-know guide for UHNWI property investors
PROPERTy INVESTMENT 46PROPERTy INVESTMENT THE WEAlTH REPORT 20154746

Forecast global investment volumes (US$bn)
20172016
2015
657 704 770
Global property investment in 2014
466
153
Institutional
Private
By sector (US$bn)
By investor type (US$bn)
By region (US$bn)
Hotel
64
Retail
161
Industrial
87
Office
307North America
286
Europe
228
Asia-Pacific
125
Rest of world
8
Source: RCA, Knight Frank Research Note: Knight Frank Research estimates for 2014, and forecasts for 2015 to 2017, are based on RCA data.
the equivalent of adding 18 new corpora-tions the size of General Motors. China is far from a busted flush and actually some-where to look for long-term opportunities.
That office rents have edged back rather than slumped in Shanghai and Beijing dur-ing challenging market conditions bodes well for the long term, so I see resilience in key centres.
India’s property market has experi-enced a marked slowdown. However, on a recent trip to Mumbai I was struck by the energising effect of the reformist Modi gov-ernment on the business community. The Knight Frank India Real Estate Sentiment Index reflects this, with confidence in the property industry nearly doubling in 2014.
Dubai’s commercial property is often overshadowed by the residential market. However, office rents are showing tentative signs of recovery, and Jebel Ali has been de-clared the world’s most productive port by the Journal of Commerce, while passenger numbers at Dubai’s international airport continue to rise. This suggests the core economic areas of tourism, trade and travel are performing well.
North America saw a strong increase in sales volume in 2014 (+8%). New York and San Francisco are established in a new cycle, so investments need to have a value-add angle, such as development or refur-bishment, or be a safe income counterbal-ance to riskier investments elsewhere.
In the US, CBD vacancy rates are lower than in suburban areas. However, those suburban office locations with good transport connections to CBD areas, and a mixed-use setting, are performing better. This could offer opportunities to those comfortable with a higher-risk profile.
Europe enjoyed an impressive rebound in investment last year, with investors re-entering the markets that suffered most in the 2010 to 2012 period, like Spain and Ireland. In 2012 Spain saw just three deals of over €100m; last year there were 16.
The core eurozone economies of France and Germany were largely stag-nant in 2014. However, property in the gateway city of Paris has mostly defied the gloom, and plans to develop new rail infrastructure will create future devel-opment hotspots. Berlin has a vibrant technology scene and a relatively low cost of living for young workers. I see more incubators for start-ups being developed.
UHNWIs are now an important force in the commercial property world and are operating at all levels – prime, secondary, development and change of use. Opportu-nities are opening up as the global econo-my moves into a new cycle. Development in particular is rising up the agenda in the real estate world, and UHNWIs will be part of the new wave of building.
REFINERy BlUES The slump in oil prices may be bad news for producers, but it could benefit property markets
Commercial real estate in 2015 In a constantly changing world UHNWIs are finding value by investing ambitiously in commercial real estate JAMES ROBERTS, ChiEF ECOnOMiST
Source: RCA, Knight Frank Research
Today UHNWIs are as sophisticated
as many institutional
investors, reflecting that
many have long-
established real estate portfolios
If I had to pick a single word that could ap-ply right across the global economy at this time it would have to be “uncertainty”. This is why investors are looking at real estate.
For the investor in the Middle East it is uncertainty over the situation in Iraq and Syria. To the European or Japanese inves-tor it is the move towards QE and whether this will end stagnation. Conversely, the American or Briton faces uncertainty on how best to invest to capitalise on an unfolding recovery.
A real estate investor knows that if the lean years are to continue, one buys the safe prime assets, like offices in Manhat-tan or shops on the Champs-Élysées. If the economy is about to improve, the riskier but higher-yielding properties are where opportunities lie.
The game changer
For me the slump in oil prices that started in 2014 is a game changer for the econo-my, and also for property investment.
The world today uses more oil in four months than it did during the whole of the Second World War. The global oil bill in 2014 was bigger than the GDP of Brazil but will be less in 2015. The fall in price will result in a huge transfer of money. Consumers will have more to spend, and firms more to invest. Yet despite the rise in spending, inflation will stay in check as energy is such an influence on other prices.
This comes at a time when real estate investors are already adopting a higher-risk profile. We estimate global commer-cial real estate sales volume increased by 7% in 2014 to around US$619bn in 2014, with value-add assets increasingly popu-lar. Value-add is any building where the purchaser can grow the investment return via construction, changing to another use like residential, or signing up higher-
paying tenants. I see global sales rising by another 6% in 2015, with value-add rising further up the agenda.
Private investors are following the trend towards risk, which was not typical of previous property market cycles. Tradi-tionally, the private investor has targeted prime assets, but last year a quarter of global commercial sales were to private buyers, despite the move towards risk in evidence in many markets.
Today UHNWIs are as sophisticated as many institutional investors, reflect-ing that many have long-established real estate portfolios. Moreover, in our digital age private investors are able to access a wealth of global information to inform their decisions. In 2015 we expect to see more private money in the value-add asset market.
Where next?
In the cities that have led the recovery, like London, New York and San Francisco, the skylines are peppered with cranes. Since the Olympics London has added seven new skyscrapers. In these cities higher-risk investment strategies are now in play, so real estate investors are asking where next they should buy to best ride the recovery.
A good starting point has to be the places that have been struggling up to now.
Commercial property sales in Asia-Pacific fell by 5% in 2014. The region’s two rising giants, India and China, are indica-tive of trends in the broader region.
In China the land market has seen sales drop by 22%, which is understandable in a country that has built “ghost cities” in the past. China is adapting to a new pace of growth, but the country’s projected GDP increase this year from the IMF is about
Top five private investor deals of 2014
Type: Office
City: london
Buyer: Safra Group
US$1,152m
30 St Mary Axe
US$ 350m
Type: Retail
City: Moscow
Buyer: The Gutserievy brothers
Novinsky Passage
US$336m
Type: Hotel
City: Worldwide
Buyer: Adrian Zecha in JV with Peak Hotels and Resorts
Aman Resorts
US$226m
Type: Office
City: Toronto
Buyer: Amancio Ortega
Type: Office
City: Frankfurt
Buyer: Safra Group
WINX – The Riverside Tower
US$436m
Renaissance Plaza
PROPERTy INVESTMENT THE WEAlTH REPORT 20154948

MARkET pERFORMAnCE
looking at the ongoing performance of commercial property markets, most of our capital markets teams expect prices to hold firm or increase slightly this year. But the outlook for Russia is more bearish, with commercial values predicted to de-crease significantly in 2015. At the other end of the spectrum, Spanish markets are set to continue their rebound with prices increasing significantly. Australia is also expecting an uptick buoyed by strong de-mand from Asian investors.
It will be interesting to see how the European Central Bank’s quantitative eas-ing experiment unfolds. In other parts of the world QE measures have driven sig-nificant investment flows into alternative asset classes, such as property. From my own experience, I think property invest-ment will increasingly be considered more mainstream and less alternative by UHNWIs.
property investing, while others may be from a particular diaspora investing back into their homelands – for example, US-domiciled Indians, and ex-pat Kenyans. Those based in less stable parts of the world are often seeking a safe-haven for their wealth.
This safe-haven theme is also reflected in the preferred locations and sectors for those UHNWIs investing outside their own countries. The UK, and London in particular, was the most popular first-choice destination.
Germany was at the top of the list for UK-based wealthy individuals and was a popular second for other European UHNWIs. For Asian investors, Australia and the US were leading second or third choice destinations. A Chinese UHNWI, for example, has just bought 175 Liverpool Street, a Grade A office building in Sydney’s CBD, for AU$400m.
Office buildings were the dominant commercial investment sector of choice, however, there is still demand for residential buildings, particularly from UHNWIs making their first foray into property investment.
Alex Foshay, of our New York Capital Markets team, highlights Miami, which attracts a lot of interest from Latin American UHNWIs, as a case in point. Demand has mainly been focused on condominium developments, but private investors are now starting to look at more commercial sectors.
In terms of inbound investment from UHNWIs from other countries, there are some interesting patterns.
China is not seeing an increase in the number of private individuals looking to invest in property there. The same pattern is repeated for Hong Kong and Singapore.
The uncertainty around the extent of the Chinese economic slowdown is clearly having an impact.
For the UK and France, the Middle East is the source of most private invest-ment, although those from other parts of the world are making their presence felt, notably Brazilian billionaire Joseph Safra who purchased London’s “Gherkin”.
In Australia, the US and Africa, wealthy Chinese investors are currently the most significant overseas investors.
Tony Galetti, Head of Knight Frank South Africa, says the growth of UHNWI Chinese investment into South Africa has been impressive over the past few years.
There is a strong preference for indus-trial property, he points out, with large industrial area, of greater Johannesburg that have been virtually all bought up by private Chinese investors. There have also been several trophy purchases, including a prominent Sandton skyscraper as well as several notable wine farms in the Western Cape region.
In the US, gateway cities, particularly New York and San Francisco, are attract-ing not just Chinese investment, but also interest from Korean, Israeli and Middle Eastern UHNWI, says Alex Foshay.
One of the clear trends
to emerge is the
increasingly global nature
of privateinvestments
AFRICA CAllING Cities like Johannesburg are attracting significant numbers of Chinese UHNWI investors
In my role advising high-net-worth inves-tors from around the world, it is clear that the demand for property as an investment class is increasing rapidly.
To help analyse the global property investment activities of UHNWIs in more detail, The Wealth Report conducted a survey of Knight Frank’s Capital Markets teams in key locations around the world to find out where and what the super-wealthy are buying.
One of the clear trends to emerge is the increasingly global nature of private investments. UHNWIs still hold most of their property investments in their own country, but in the vast majority of the locations surveyed, wealthy private indi-viduals have been increasing the amount invested overseas.
Some are diversifying their portfo-lios as they gain more experience with
UHNWI property investment goes global Key trends from the results of The Wealth Report Global Capital Markets Survey DEBORAh WATT, hEAD OF GlOBAl WEAlTh invESTMEnTS
predicted change in commercial property values in 2015
The Wealth Report Global Capital Markets Survey 2015
UhnWi commercial property portfolio allocations
how has that changed over the past five years?
location
Own country
Othercountry
Own country
Othercountry
90%
80%
70%
80%
70%
90%
80%
95%
90%
80%
60%
60%
70%
80%
80%
Australia
Germany
Hong Kong
India
Kenya
Malaysia
Singapore
South Africa
Spain
UAE
UK
US
Russia
China
France
10%
20%
30%
20%
30%
10%
20%
05%
10%
20%
40%
40%
30%
20%
20%
inbound UhnWi investments
key
Mainsource
Investment rising?
Preferred sector
Source: The Wealth Report Global Capital Markets Survey
Outbound UhnWi investments
Preferred location
Preferred sector
Germany
Belgium
US
US
US
n/A
UK
UK
UK
UK
UK
UK
UK
UK
UK
UK
UK
UK
YES
YES
YES
YES
YES
YES
YES
YES
YES
nO
nO
nO
nO
nO
n/A
nO
China
China
China
GCC
Singapore
China
China
GCC
Hong Kong
GCC
India
India
Residential
Increase slightly
Remainthe same
Decrease slightly
Increase significantly
Decrease significantly
Office
Retailland
PROPERTy INVESTMENT THE WEAlTH REPORT 20155150

Wealthy Chinese investors have been expanding from luxury residential properties into office buildings, shopping malls and hotels. The latest example is the high-profile joint-venture purchase of the General Motors Building in New York by Zhang Xin, chief executive of office landlord Soho China. After several initial waves of Chinese institutional capital outflow, Chinese UHNWIs are becoming part of the so-called Fourth Wave of investors, which also consists of insurance companies, small- to mid-cap state-owned enterprises and private developers. After heavy investment into gateway cities and trophy buildings, Chinese UHNWIs have established a familiarity with transacting in these markets, and we expect that they will start to pursue higher yields in other commercial property sectors. We will see them moving beyond the gateway cities of London, New York and Sydney and investing into other key cities, such as Frankfurt, Brisbane, Miami and Manchester. In fact, cities like Miami are already firmly on the radar of the wealthy Chinese investors, as the prices of apartments there are up to 25% lower than in Shanghai. A key trend remains the cultural diversity of the city, and of grow-ing importance is the quality of life offered. These factors will continue to draw in Chinese UHNWIs.
Investor interest in farmland continues to grow for a number of reasons. First, demographics. Everybody has to eat, and the world’s population is set to hit nine billion by 2050. Investing in farmland is a sim-ple way to buy into the demand created by this trend. But not only will there be more mouths to feed; those mouths are demanding more meat and dairy-based foodstuffs, which require more land to produce per unit of energy than traditional grain-based diets. Second, tangibility. Off the back of the financial crisis, farmland is increasingly being seen as a safe-haven inflation-hedging asset. In the UK values have risen almost 200% over the past 10 years, according to the Knight Frank Farmland Index. Third, the ability to add value to underutilised land. For the more hands-on investor this offers the opportunity to substantially boost capital values, particularly in areas with a higher-risk profile, and is something our experts in Zambia are helping a number of UHNWI investors achieve.
The decline of Cairo’s commercial influence at the northern end of Af-rica, and the realisation by international busi-nesses that they cannot run the entire continent from Johannesburg in the southern tip, has created a vacuum that Nairobi is eagerly filling. With the arrival and expansion of a string of multinationals, the city is now firmly established as one of Africa’s leading hubs. Local developers have responded by build-ing Grade A quality office space that is attracting top-quality tenants pay-ing dollar-denominated rents with leases that include fixed annual in-creases. Generally, rents are perceived as good value by international firms, suggesting there is room for healthy future
rental growth and also yield shift, which in turn is attracting global investors. In addition, newly discovered oil and gas deposits are creating something of an energy boom, while all sectors of Kenya’s economy, apart from tourism, are growing — GDP is rising at around 5.5% each year. This is largely being driven by a burgeoning middle class hungry for Western-style goods and shopping experiences that, by and large, seems impervious to political controversies and terror-ism activities. This year should see the opening of around 1.8m square feet of First-World shopping malls in Nairobi, with new international retail-ers committing to the region for the first time.
They may have already made their first billion or 10, but changing the world with one wildly successful idea like Twitter or LinkedIn isn’t enough. Tech entrepreneurs who have seen their companies mature to the point of initial public offering are continuing to reinvest their intellectual and monetary capital into new start-up companies with their own require-ments for office space. However, while the hunger to discover the next game-changing technology remains un-diminished, the location of the search has shifted. We are seeing a move away from the Silicon
Valley into San Francisco proper as firms recognise the latest generation of tech talent wants to live, socialise and work in the centre of the action. Cash-rich companies like Google are also buying space, not renting it. In addition to the renowned SOMA district and burgeoning Mid-Market area, neighbourhoods such as the Mission and Potrero districts are be-ing targeted by smaller and start-up tech firms. A growing sector in the town is the establishment of luxurious private tech clubs such as The Bat-tery, where entrepreneurs and developers can hang out and share ideas.
Last year was a tumultuous one for the Gulf region. After an extremely positive start to the year, contin-ued political and economic instability in the Middle East, as well as sharp falls in oil prices, hit confidence hard across local capital markets. As a result, we have witnessed further investment flows from the region into stable, income-generating commercial property
nEil BROOkESHead of Capital Markets, Asia-Pacific
AnThOnY hAvElOCkHead of Agency, Nairobi
TOM RAYnhAM Head of Agricultural Investments, london
kYlE kOvAC Senior Managing Director, Capital Markets
San Francisco
JOSEph MORRiS Head of Capital Markets, Middle East
BEhAviOURiAl
lOCATiOnS TO WATCh: MiAMi, MAnChESTER AnD BRiSBAnE
internationally. Key cities such as London continue to attract capital, but we have more recently seen Middle Eastern investors moving up the risk curve to tier-two cities and UK regions, as well as peripheral eurozone markets like Ireland, Germany and Spain. More locally, in the Gulf, with high volatility across both the local stock market and the Dubai residential sector, we anticipate that assets such as commercial real estate with long-term occupational leases will benefit from the fallout, especially as Dubai preserves its status as the region’s relative safe haven. Investor interest is growing from the wider GCC (particularly Saudi Arabia), but also from countries such as India.
This year should see the
opening of around 1.8m
square feet of First World
shopping malls in Nairobi
Everybody has to eat, and
the world’s population is
set to hit nine billion
by 2050. Investing in
farmland is a simple way to
buy into the demand created
by this trend
The Wealth Report asks 10 property investment experts from across Knight Frank’s global network to highlight trends that private UHNW investors should be watching closely
TREnD
Chinese investors diversifying their portfolios
TREnD
Rebalancing of economic power in Africa
Changing population and food consumption trends
SECTOR TO WATCh: GRADE A OFFiCE AnD RETAil SpACE in nAiROBi
SECTOR TO WATCh: AGRiCUlTURAl lAnD in ThE Uk AnD AFRiCA
Middle Eastern economic and political instability
SECTOR TO WATCh: COMMERCiAl pROpERTY in ThE UAE
Reinvestment by US West Coast tech entrepreneurs
SECTORS TO WATCh: ThE MiSSiOn AnD pOTRERO AREAS OF SAn
FRAnCiSCO AnD ThE nEW WAvE OF TECh ClUBS
TREnD
TREnD
TREnD
PROPERTy INVESTMENT THE WEAlTH REPORT 20155352

A change in consumer behaviour and societal trends, and the increasing rise of the internet, has made property investors look more closely at traditionally non-core options. While the three main sectors of logistics, offi ces and retail continue to dominate, specialist property sectors, predominantly compris-ing student accommodation, hotels and health care, have substantially increased their impact on the investment landscape, particularly with UHNWIs. The main rationale is that the physical properties themselves in these sectors are business-critical as-sets – without the building the operator will not have a business – and will generally benefi t from long-term leases to good covenants, with fi xed or infl ation-linked increases contained within the leases. This provides the UHNWI investors with an asset class they will generally be familiar with, combined with an easy-to-manage and hands-off investment that re-quires little active property asset management. With all occupational markets within these subsectors seeing robust high-calibre demand for best-in-class locations, there should continue to be a pipeline of good-quality supply from tenants in solid occupier markets. This all signals sound investment opportu-nities for investors looking for wealth preservation and wealth generation.
Owning their own home still remains a key aspiration for most people in the UK, but a growing number of young professionals now see renting as a long-term option rather than as a stopgap while they save to buy a property. In part this has been driven by the increasing cost of joining the housing ladder, but it also refl ects transitional modern lifestyles as people switch jobs more often and want the freedom to move from one location to another. This demand for rented property provides investors with a secure return because it is easy to fi nd another tenant when one moves on. The private-rental sector model in the UK is also evolving. Purpose-built developments maximise returns by carefully balancing social and private space. More compact and effi ciently laid-out apartments allow more units per development, but this is off set by better communal facilities like gyms, and more luxurious private space such as en-suite bathrooms and balconies. London is still hugely popular for investors wanting a long-term secure asset, but higher yields are on off er in regional cities like Birmingham, which will benefi t from the HS2 railway. Annual net yields of over 5% are available.
Although some com-mentators are saying that Australian commercial property is now fully priced, partly on the back of continued demand from Asian institutions and private investors, I believe the market still off ers opportunities for UHNWIs. While current premium (trophy) yields in Sydney’s CBD are almost comparable to the 2007 nadir, yields are still relatively high on a global basis and there is the expectation that local funding costs will fall to their lowest levels on record in 2015 and re-main “lower for longer”. This means a substantial
positive spread between property yields and fund-ing costs is opening up. This is most accentuated for non-CBD secondary grade, suburban and pro-vincial offi ce stock. Cross-border capital fl ows will increase further because of the depreciation of the Australian dollar, driving even higher sales volumes and asset prices. This will be complement-ed by a more positive outlook in the occupier market, particularly in east coast cities where stock levels are falling because of conversion of former commercial space into hotels and residen-tial accommodation.
Ireland’s economy was one of the fi rst to rebound from the fi nancial crisis, with current growth rates of over 7%. One of the main drivers of the recovery has been the country’s ability to attract foreign direct
JAMES MAnniXHead of Residential Capital Markets, UK
JAMES pARRYHead of Institutional Sales and Capital Markets, Australia
ADRiAn TRUEiCkInvestments, Dublin
investment, particularly from the fast-growing IT sector, with Google, Twitter, LinkedIn and Facebook all expanding their Irish operations in 2014. Mirror-ing the broader economy, the property sector has rebounded from the lows of 2010/11, with strong oc-cupier demand pushing up rents in all sectors. With very little new construction over the past fi ve years and a limited development pipeline, rents are likely to continue to grow strongly over the next 24 months. Although the total property return is predicted to exceed 36% in 2014, property values are still ap-proximately 20% below their peak, off ering potential for attractive investment returns. Investor demand, buoyed by the strength of the dollar against the euro, is largely from US private equity funds that have targeted both large-scale asset and loan portfolios. Although they have now been joined by some of the European pension funds and Middle Eastern inves-tors, demand from UHNWIs has so far been limited to some Asian interest in the hotel sector. With a number of trophy residential and commercial assets still to be traded, the market off ers international private investors a stable environment with potential for attractive returns.
Owning their own home
still remains a key aspiration for most people
in the UK, but a growing
number of young
professionals now see renting
as a long-term option
rather than as a stopgap
ShAUn ROYHead of Specialist Property Investment, london
I am increasingly seeingthe second or thirdgeneration of UHNWfamilies being allocateda proportion of the fam-ily’s investment portfolioto invest into commercialreal estate. These gen-erations are generally more globally educated – often in the UK or the US – than their parents or grandparents and are approaching investmentin a fashion more akinto a professional fund orwealth manager. Thereis more of a focus oncash-fl ow analysis of theinvestment, and on analysis of tenant cov-enant strength and local market drivers. They are looking for performance over trophy assets.
Capital gain through development is popular, as are higher- income yields, possibly through buying offi ces in strong regional, rather than capital, cities or looking at diff erent sectors such as logistics. Overall there is uncertainty about go-ing into property funds to achieve exposure to this sector – the youngergeneration want controland believe that theywill achieve as good, ifnot better, returns thanif they handed over capital to a fund man-ager. There is a culture of wanting to prove to their fathers or grandfathers that they can grow and protect the family wealth for future generations.
I am increasingly
seeing the second or third
generation of UHNW
families being allocated a proportion
of the family’s investment portfolio to invest into
commercial real estate
DEBORAh WATTHead of Global Wealth Investment, london
For more information on Knight Frank’s Commercial Property and Capital Markets teams please contact [email protected]
TREnD
TREnD
TREnD
Rising interest in long-term renting
SECTOR TO WATCh: nEW-BUilD REnTAl ACCOMMODATiOn in ThE Uk
Property markets lagging in economic recovery
SECTOR TO WATCh: iT in iRElAnD
Asian interest in Australia
SECTORS TO WATCh: nOn-CORE, SUBURBAn OR pROvinCiAl
OFFiCE MARkETS
Business-critical assets off er long-term security
SECTORS TO WATCh: hOTElS, STUDEnT ACCOMMODATiOn, hEAlTh CARE
SECTOR TO WATCh: ASSET MAnAGEMEnT OppORTUniTiES
in ThE OFFiCE SECTOR
Generational shifts in UHNWI investment strategies
TREnD
TREnD
PROPERTy INVESTMENT THE WEAlTH REPORT 20155554

Personal perspectives on property
The Wealth Report Editor Andrew Shirley talks to G O O DW I N GAW about his passion for property and why investing in the wrong side of town can sometimes be the right move
Asian HNWIs are looking for safety rather than pure upside at the moment, and that means markets with liquidity – places like
London and New York
The aim is to change neighbour hoods, make them better places to live, to take an ugly duckling and turn it into something
sexy and trendy
The fi rst thing I notice when talking to Goodwin Gaw in his Hong Kong offi ce is that property development is clearly more than just a business for him. It is some-thing he is deeply passionate about at a very personal level.
“I was always into building things and architecture as a kid. I even thought I wanted to be an architect. So my dad sent me off to work with one, but then I realised something: apart from a few very success-ful ones, and even then only later on in their careers, architects generally build what their clients want, not what they want to.”
For many in the real estate industry, it’s the deal that is their lifeblood. But I don’t get the impression that this is what makes Goodwin Gaw tick. For him it’s the chance to take something unloved, recycle it and bring it back to life.
Take his very fi rst investment, for ex-ample. In 1995 he bought Hollywood’s
iconic Roosevelt Hotel, bankrupt and a shadow of its former life, which witnessed some of Tinseltown’s most historic events, including the inaugural Academy Awards and Marilyn Monroe’s fi rst model-ling shoot.
Not only is the hotel again the cool place to be seen, but the deal spurred a
slew of further investments, including the conversion of over 40,000 square metres of empty historical buildings into trendy residential lofts, which helped rejuvenate the then down-at-heel downtown area of Los Angeles.
Re-urbanisation, or reverse suburbani-sation, is a big theme, he tells me. “There is no reason people should be scattered in lots of suburbs. They may be socialising online, but they want to collaborate in a physical space.”
“To me real estate is not just a category of investment. It’s living bricks and mor-tar. I feel a lot of the time it’s not about the money. The aim is to change neighbour-hoods, make them better places to live, to take an ugly duckling and turn it into something sexy and trendy.”
However, Mr Gaw is quick to point out that fi nancial success generally follows. “The goal is to create a return for investors, although some have asked me, ‘Are you
having too much fun?’ But I tell them when I’m having fun that’s when I know things are going well. And I am always investing my own money into every project.”
He says he hasn’t “miscued” too many times, and on the few occasions a deal hasn’t really fi red, like a tax-driven rein-vestment acquisition in Houston or a foray
GOODWINGAW
Hong Kong-based Goodwin Gaw is one of Asia’s most infl uential and innovative property developers and in-vestors. Investing his own money and that of his investors, he has built up a diverse residential, commercial and leisure portfolio spanning Europe, Asia and North America.
GOODWINGOODWINGOODWINGOODWINGOODWINGOODWINGAW
GOODWINGAW
GOODWINGAW
GOODWINGAW
GOODWINGAW
GOODWINGAW
into the Philippines, it has been because he ventured outside his core investment philosophy.
“I like to invest in markets with con-straints,” he says – places like London, Hong Kong and New York, where physical boundaries and planning policies create zones where people want to live or busi-nesses need to be located.
“Houston was never a market that I liked. There’s no zoning, and if you look out from the top of a tall building all you can see is land. But I thought that if I reno-vated the building I could charge higher rents, but people just go and build some-where else. It taught me that if a market is high enough for you to want to sell some-thing, then just pay the tax.”
He adds, “The Philippines wasn’t an easy place to do business. It’s really an in-sider’s market.”
Although his family bought and rede-veloped one of Yangon’s best hotels – “My grandfather was brought up in Burma, my father was born there” – investors aren’t generally fl ocking towards emerging mar-kets now, he says.
“Asian HNWIs are looking for safety rather than pure upside at the moment, and that means markets with liquidity –places like London and New York. Tokyo also looks like an interesting play.”
But he still likes to focus on the edgier parts of town and is eyeing up Hong Kong’s Sham Shui Po neighbourhood. He remains upbeat about China – “Apart from the US it will be the world’s only self-sustaining economy” – and is involved with a US$1bn redevelopment of a Beijing “vintage-style” retail outlet. “It will be a fresh new take on something that is obsolete. It will be cut-ting edge.”
Cities go through cycles, he explains. “At one point everything old is considered obsolete, but then people get nostalgic for it. You need history. Take New York’s meat-packing district, London’s Shoreditch. To be a truly global city you need that charac-ter, that variety.”
Having cut his property teeth on a hotel redevelopment, Mr Gaw continues to be drawn to hospitality and lifestyle op-portunities around the world, but I’m not surprised to hear he still likes something with a bit of an alternative angle to it. He helped, for example, bring renowned hotelier Nick Jones’s arty Soho House concept to Chicago and is also looking at Hong Kong.
As we wrap up the interview I ask him where he chooses to live and why. He suc-
cinctly lists Hong Kong and Los Angeles–“Those are the places where I do busi-ness.” But he gets more animated when I ask about second homes. “We do have a house in a members-only club in the Mon-tana mountains, he says. “The air is so clean up there.”
He pauses, thinks and then adds: “I think that is a concept that could really de-velop in China. People are becoming more and more interested in healthy lifestyles and organic food.” Watch this space.
FIRST TIME LUCKY The Roosevelt Hotel, Hollywood, has been one of Goodwin Gaw’s most satisfying investments
PROPERTY INVESTMENT THE WEALTH REPORT 20155756

investments of passion: performance and luxury spending trends
Luxury research And now for the fun stuff . So far in The Wealth Report we’ve talked about big and important themes like global wealth distribution, the world’s most important cities, property markets and investments.
In this chapter we look at exciting things like luxury goods, classic cars, art, jewellery and fi ne wine.
Of course, this being a serious re-search publication we naturally look at such purchases from an investment perspective. The latest results from the Knight Frank Luxury Investment Index, which tracks a theoretical portfolio of 10 investable luxury assets, show that many of these investments of passion have seen their values continue to rise.
Although, according to the results of our Attitudes Survey, the personal pleasure they provide is the main reason most UHNWIs like to collect beautiful and pleasurable things, one suspects that even the most epicurean collectors would prefer that their treasures grow in value.
Coloured diamonds are the latest ad-dition to our index. Given that jewellery has historically been a common way to store and transfer wealth in many cul-tures, diamonds are perhaps one of the most multifunctional assets in the index.
We list some of the most high-profi le sales in our special feature on p64.
Pearls, which until recently were considered rather old-fashioned, are also rising rapidly in value. This trend is being helped by the almost total lack of supply of new natural pearls coupled with strong demand from the Arabian Gulf, where many of the world’s fi nest pearls were originally harvested.
Indeed, much of the recent demand for luxury goods and investments has been driven by wealth creation in regions with burgeoning economies like Asia and the Middle East. It is therefore intriguing to see that the UK tops our new Big Spenders Index, compiled for The Wealth Report by Ledbury Research.
The index tracks the countries likely to see the strongest growth in spending on big-ticket luxury items by their own UHNWI populations and visitors from abroad. It would be fair to say that the UK secured poll position off the back of the many visitors who fl ock to London’s luxury stores and increasingly out-of-town designer outlets like Bicester Village – the second-most visited destination in the UK for wealthy Chinese tourists and part of a string of similar ‘villages’ around the world.
01
Rule britanniathe UK tops The Wealth Report’s new Big spenders index, produced for us by Ledbury research
03
shining brightColoured diamonds now feature in our index. on average their value has risen by 167% since 2005
02
Vroom, vroomClassic cars were once again the top-performing asset class in our Luxury investment index, rising by 16% during 2014. overall the index rose by 10% last year and has grown by a healthy 205% over the past 10 years
LUxUrY sPeNdiNg tHe WeaLtH rePort 20155958

The general outlook for luxury spending continues to be positive. Almost a third of respondents to The Wealth Report’s Attitudes Survey expect their wealthy clients to spend more on luxury goods in 2015, compared with just 8% who expect it to decline.
But how does the short-to-medium-term outlook compare for individual countries, and where in the world might luxury brands look to expand? The new Big Spenders Index, compiled exclusively for The Wealth Report, provides some of the answers by identifying the locations likely to see strong growth in big-ticket spending by their own ultra-wealthy populations and visiting UHNWIs.
Topping the list for 2015 is a very well-established centre of wealth, the UK. The country scores well, in terms of both the fortunes of its domestic UHNWI popula-tion, thanks to the relative strength of the UK economy, and our tracking of the driv-ers and indicators of high-end spending. The finding underlines the importance of the UK for luxury brands, which sold over £8bn of goods in the country last year, according to Ledbury’s estimates.
China fills the second slot in our rank-ing table. The Chinese are already the single biggest consumers of luxury goods around the world, accounting for some 29% of the global luxury spend, according to consultants Bain & Altagamma.
Although recently much has been said about the impact of the Chinese govern-ment’s anti-graft measures on luxury demand, Ledbury has consistently argued that the fundamentals of the Chinese luxury market remain very attractive, given the burgeoning wealthy population and rapidly growing middle class. China’s high ranking in the Big Spenders Index reflects the underlying robustness of its UHNWI population.
While overall sales performance of luxury goods in the Greater China region has been muted over the past year, there is no denying that there is still a strong demand for luxury brands, which isn’t going to change.
However, what is certainly changing is where Chinese consumers are choosing to buy luxury (the vast majority of Chinese luxury spend is outside mainland China), the selection of luxury brands they are buying, and the profiles of the consumers themselves, which are rapidly evolving because of the varying attitudes that
exist towards luxury within the different Chinese cities.
India, one of the lower-profile BRIC economies, is in fifth place in our rank-ings. Over the past year the rise in wealth and the number of wealthy has been impressive – the number of UHNWIs is in-creasing rapidly, according to our Wealth Model. Aligned to this wealth growth is an equally substantial increase in luxury consumption: the value of champagne imports rose 19% year on year, according to the most recent data from Le Comité Interprofessionnel du Vin de Champagne, despite total exports being flat.
We expect international luxury goods to be particular beneficiaries of this new wealth in India, rather than more tradi-tional, local brands. For example, research by the Kotak Mahindra bank has shown that among the wealthy, the traditional
Almost a thirdof respondents to The Wealth
Report’sAttitudes
Survey expect their wealthy
clients to spend more on
luxury goodsin 2015
Indian wedding gift is fast evolving away from silver plates towards top Western designer brands.
We also anticipate that wealth crea-tion, and luxury consumption, will be neither quite as controversial nor quite as hampered by social inequality or austerity agendas as has been the case in Brazil and indeed, latterly, China. With India’s long-standing caste system, wide gaps in incomes and wealth are an ac-cepted norm in the country, according to Kotak Mahindra.
Reflecting on the regional make-up of the top countries, it is interesting to see Europe, Asia and the Middle East all well represented. Africa is noticeably absent this year, reflecting some weakening on the continent, notably in commodity-fuelled wealth, which had propelled the success of a number of countries.
Hey, big spender The results of a new index compiled for The Wealth Report by Ledbury Research’s Luxury Analysis team MADELAINE OLLIVIER, LuxuRy ANALyst, LEDbuRy REsEARch
APPAREL Wearable technology and luxury overlap With the wearable tech trend continuing, fashion brands have been collaborating with tech companies to help break into the market. But fashion brands are also choosing to make their own wearable, style-conscious tech. Ralph Lauren is pioneering this strategy through its newly unveiled line of smart clothes dubbed Polo Tech. Embedded technology in the clothes allows users to monitor their bodies on their smartphones.
AccEssORIEs Pre-owned luxury
Pre-owned luxury goods sales are boom-ing. The second-hand market for luxury apparel, accessories, watches and jewel-lery is valued at some $19bn (Bain & Altagamma). Leather goods and clothing make up $4bn of that, and the segment is growing faster than the luxury industry overall (Bloomberg). Some products sold on these marketplaces achieve prices higher than retail, as customers bypass waiting lists for items such as new Hermès bags.
WAtchEs AND JEWELLERy Women’s watches boom
Women have traditionally been more interested in smaller, unobtrusive styles unable to accommodate the complex-ity and multifunctionality of traditional men’s watches. But a fashion for slightly larger watches and jewellery, combined with the growing purchasing power of women, particularly in luxury strongholds such as China, is helping drive sales. The share of female watches in the market has risen to around 35% from 20% in 1995 (Bain & Altagamma).
FINE WINEs AND sPIRIts China’s slowdown particularly affects Cognac sales
French wine and spirits exports fell 7.3% to €4.8bn in the first half of 2014, hit by a 28% fall in sales to China. Cognac exports to China fell 12% (Fédération des Expor-tateurs de Vins & Spiritueux de France). The Chinese government’s continued austerity campaign is thought to be part of the explanation for the drop in Cognac sales as the spirit is associated with gift-ing. Scottish whisky sales are, however, reporting an uptick in other emerging Asian markets as the spirit is associated with status.
cARs India lags
Manufacturers had been hoping that India would follow in China’s footsteps for luxury car demand, but most have seen disappointing sales and sluggish demand. Only 250 supercars are estimated to have been sold in the country in 2014 (HIS). Import duty hikes and currency declines aren’t helping, but a more fundamental obstruction comes from India’s roads. However, manufacturers could benefit from impending releases of luxury SUVs.
yAchts Market recovers At the 2014 Monaco Yacht Show, ship-builders, brokers and outfitters all said that the market was improving –35% more superyachts were sold in the first half of the year compared with the same period in 2013 (Camper & Nicholsons Interna-tional). This is despite some caution in the industry because of the political uncer-tainty within Russia and the Middle East, traditionally seen as the strongest markets for superyachts.
Luxury Spending TrendS Drawing on extensive monitoring of luxury markets around the world, Ledbury Research picks out interesting developments within the main luxury goods categories
set fair Yacht sales are on the rise
source: Ledbury research
1 uK 9 5 8 7 5 5
2
chi
na 10 7 2 6 7 7
3Q
atar 7 10 9 10 2 2
4
can
ada
9 8 5 10 3 4
5 Indi
a
8 10 10 5 1 4
6
saud
i Ara
bia
8 5 9 10 4 3
7
sw
itze
rlan
d
10 8 6 6 3 4
8
Mex
ico
9 8 6 9 1 4
9
hon
g K
ong
9 9 9 2 2 3
10
Kuw
ait
6 7 8 10 2 2
the big spenders Index 2015
top 10 highest-scoring countries according to the Big spenders index, based on scores in the following categories
spending on luxury imported items
Premium travel and spending
Luxury store footprint
Big-ticket luxury goods spending
Wealth growth UHNWi population
COUNTRYRANK
10 10 10 10 10 10
10 10 10 10 10 10
10 10 10 10 10 10
10 10 10 10 10 10
10 10 10 10 10 10
10 10 10 10 10 10
10 10 10 10 10 10
10 10 10 10 10 10
10 10 10 10 10 10
10 10 10 10 10 10
LUxUrY sPeNdiNg tHe WeaLtH rePort 20156160

tion specialising in coloured or “fancy” diamonds, along with a new index track-ing their performance. Because of their rarity these generally pink, yellow or blue stones command very high prices at auc-tion and seem to fall more readily into the category of investments of passion. (See our special focus on diamonds on p64 for more details.)
So how has this newcomer to KFLII performed compared with the other asset classes that we track? Since January 2005 The Fancy Color Diamond Price Index has increased by 167% in value, which inter-estingly is almost exactly the same rise as the wider jewellery index that we use.
Christie’s jewellery consultant Ray-
There is no doubt that so-called invest-ments of passion are still catching the imagination of the wealth management sector and the media. I continue to be pleasantly surprised by the press coverage devoted to KFLII since it was launched two years ago.
One question I have often been asked is why we don’t include gold or diamonds in the index. Gold to me has always seemed more of a conventional investment that tends to sit mainly in a bank vault, while the pricing indices available for white diamonds were too broad in their scope for inclusion.
Now, however, a group of industry experts has formed a research founda-
487% over the past 10 years and growing 16% in 2014. This actually represents some-thing of a slowdown, following the index’s staggering 47% surge the year before.
HAGI founder Dietrich Hatlapa says the market is returning to normal – although a 1962 Ferrari 250 GTO Berli-netta did set a new world record when it went under the hammer for $38m at the Bonhams Quail Lodge sale in August.
In general, however, classic Porsche models performed most strongly in 2014, while more-modern supercars from the 1970s and 80s, like the Lamborghini Countach and Ferrari F40, are growing in popularity, adds Mr Hatlapa.
After a few years of relatively languid performance, art appears to be bouncing back, with annual growth of 15%, accord-ing to data from Art Market Research. “The art market has fully recovered from the economic crisis,” says Harvey Mendel-son, of art advisory firm 1858 Ltd. Chariot, by Giacometti, was the most expensive
auction sale of the year, making almost $101m at Sotheby’s record-breaking No-vember sale of modern and impressionist art in New York.
However, instability in certain parts of the world is having an impact on spe-cific sectors of the market. At a Sotheby’s evening sale of high-value Russian art in London only 32% of the 37 lots on offer found buyers.
Coins were the only other asset class to achieve double-digit growth in 2014 with gains of 13%. A rare Edward VIII, 1937, gold sovereign made £516,000 when it was auctioned by Baldwin’s in May.
Our benchmark philatelic index – the Stanley Gibbons GB250 – grew by just 3% over the year, but the market for Chinese and Commonwealth stamps continues to grow strongly, says Keith Heddle, Head of Investments at Stanley Gibbons. The sole remaining example of a British Guiana 1856 one-cent black on magenta set a new world record when it was auc-
mond Sancroft-Baker, who compiles the index on behalf of Art Market Research, says that demand for top-quality coloured gemstones is also very strong. “We’ve seen a million dollars a carat paid for a Bur-mese ruby recently, and £200,000 a carat for a Kashmir sapphire.”
The market for pearls is also extremely buoyant, says Mr Sancroft-Baker. “There is a lot of demand from the Gulf States, who are buying back their heritage. I recently valued a pair of natural pearl ear-rings at a million pounds.”
Once again classic cars have been the strongest performer in KFLII over both the long and short-term, with the value of the HAGI Top Index rising by an astounding
The Knight Frank Luxury Investment Index (KFLII) is a weighted index based on the performance of 10 indices provided to Knight Frank by the third-party sources listed.
Going, going, gone Some of the record-breaking or most significant luxury investment auction results of 2014
01
04 05 06
02 03
01 Edward VIII gold sovereign. Sold by Baldwin’s for £516,000 02 1962 Ferrari 250 GTO Berlinetta. Sold by Bonhams for $38m 03 ‘Chariot’, by Giacometti. Sold by Sotheby’s for $101m 04 British Guiana 1856 one-cent black on magenta stamp. Sold by Sotheby’s for $9.48m 05 1933 Patek Philippe Supercomplication pocket watch. Sold by Sotheby’s for 23.2 million Swiss francs 06 The Mellon Blue Diamond. Sold by Sotheby’s for $32.6m
tioned for $9.48m by Sotheby’s New York in June.
The 1933 Patek Philippe Supercompli-cation pocket watch was another record breaker when it sold for 23.2 million Swiss francs at Sotheby’s in Geneva, the highest price for any timepiece sold at auction. The overall watch market, however, re-mained stable with annual growth of 4%.
Knight Frank’s Fine Wine Icons Index was up 7% on the year, with strong growth for certain US and Italian vintages. But the top end of the Bordeaux market is yet to stabilise, although it should finally bot-tom out in 2015, says Nick Martin of Wine Owners, which compiles the index.
The value of antique furniture contin-ued to fall in 2014.
Overall, KFLII grew by a further 10% in 2014 and has risen by 205% over the past 10 years. Although this doesn’t take into ac-count any storage, maintenance, insurance or dealing costs, it does help explain the ongoing interest in luxury investments.
Sparkling returns The latest results from the Knight Frank Luxury Investment Index (KFLII), which now includes coloured diamonds ANDREW SHIRLEY, THE WEALTH REPORT EDITOR
Performance of the Knight Frank Luxury Investment Index by asset class, Q4 2004 to Q4 2014*Sources: Art Market Research – Furniture, Chinese Ceramics, Jewellery, Watches, Art.Stanley Gibbons – Stamps, coins. HAGI – Classic cars. Wine Owners - Wine. Fancy Color Research Foundation – Diamonds.
*Except coloured diamonds, Jan 2005 to Oct 2014
12-month performance
5-year performance
10-year performance
CoinsColoured Diamonds
Classiccars
500%
400%
300%
200%
100%
0%
Furniture WineStamps Art
-9%
-25%
-28% 4%
49% 68
%
9%
46% 69
%
2%
73%
167%
2%
35%
168%
3%
34%
195%
13%
92%
232%
7%
38%
234%
15%
61%
252%
16%
140%
487%
The 10-year performance of the Knight Frank Luxury Investment Index
50%
0%
100%
150%
200%
250%
350%
300%
Dec 04 Dec 06 Aug 07 Apr 08 Dec 08 Aug 09 Apr 10 Dec 10 Aug 11 Apr 12 Dec 12 Aug 13 Apr 14 Dec 14Aug 05 Apr 06
10 y
rs: 2
05%
5 yr
s: 6
2%
1 yr
: 10%
Watches Chinese ceramics
Jewellery
LuxuRy SpEnDInG THE WEALTH REpORT 20156362

Source: Fancy Color Research Foundation
There is nothing quite like holding a 30-carat D-fl awless diamond in the palm of your hand. This tiny thing could assure the fi nancial security of a couple of genera-tions of an entire family.
Robust returns on diamonds of more than one carat, mounting demand from Asia and the prospect of mines running dry are pointing to the increased attrac-tiveness of precious natural diamonds as an investment asset. Global diamond sup-ply is expected to plateau by 2020 and drop off signifi cantly in the following decade, according to mining giant De Beers.
“Since 2009 the price of polished dia-monds measuring one carat or more has risen 5%,” says Ari Epstein, CEO of Antwerp World Diamond Centre.
Bruce Cleaver, Executive Head of Stra-tegy at De Beers, now anticipates a rise in diamond prices. “With growth in diamond demand expected to outstrip growth in supply, there are diff erent possible out-comes, but we believe higher diamond prices would account for a signifi cant amount of the gap,” he says.
The concept of diamonds as a store of wealth is not new. Diamonds are arguably
Overall, fancy pink, yellow and blue diamonds have increased in value by 167% since 2005, according to the new index.
Individuals looking to invest in dia-monds can buy stones from diamond trad-ers and pay for storage and insurance, or buy shares in diamond companies. The Singapore Diamond Investment Exchange and Los Angeles-based Investment Dia-mond Exchange partner with banks off er-ing private clients purchasing, valuation and certifi cation services.
Asset management fi rms including Diamond Capital Fund sell shares in stores of physical diamonds. Sciens Colored Diamond Fund, owned by UHNWI John Rigas, invests in red, pink, blue, green, or-ange and yellow diamonds sourced from mines for individuals and institutions.
“Since the 1950s the price of the dia-monds we invest in has never dropped,” says Mahyar Makhzani, Co-Managing Di-rector at Sciens Colored Diamond Fund.
Investing in diamonds poses chal-lenges. Unlike gold, diamonds are not fun-gible – one carat is not equal to another carat. Although the internet has brought about increased pricing transparency, there is no standardised pricing index that
the most transportable form of wealth in existence.
While diamond afi cionados may be madly in love with the stones they buy, they also regard them as a means to in-creased wealth. In 2006 billionaire jewel-ler Laurence Graff bought the 78.1-carat Maharajah diamond. It had not been seen in 50 years because it had been in a bank vault. “The translucency, the life in that stone, is beyond anything I have ever seen,” Mr Graff said at the time. The next day, he sold it for an undisclosed profi t.
Fancy colour diamonds (a technical term in the industry for stones of excep-tional colour), which are far rarer than white diamonds, are performing particu-larly strongly. The 9.75-carat Mellon Blue
set a new world auction record for the carat price of a blue diamond when it made $32.6m at Sotheby’s New York in Novem-ber 2014.
Most sales, however, do not take place at auction, so tracking the change in price has been diffi cult. But a new index created by The Fancy Color Research Foundation, which records deals at all stages of the chain, off ers more transparency.
Multifaceted investment opportunity
To coincide with the introduction of coloured diamonds into the Knight Frank Luxury Investment Index, industry expert C L A I R E A D L E R explores the growing appeal of diamonds as an investment of passion
The concept of diamonds as a store ofwealth is not new. Diamonds are arguably the
most transportable form of wealth in existence
classifi es the many thousands of diff erent qualities of diamonds, which incorporate a spectrum well beyond the traditional four Cs of cut, carat, colour and clarity, while also off ering easy access to individuals be-yond the diamond industry.
Monaco-based diamond expert Ehud Arye Laniado believes increased trans-parency will prove transformative. “A fully transparent pricing system will un-lock an opportunity for savvy consumers to view diamonds as a store of wealth in ways not yet possible, ushering in a new era in which informed buyers will be able to make confi dent purchasing decisions,” says Mr Laniado, the principal of Mercury Diamond, which advised Cora Interna-tional, a New York jeweller specialising in rare diamonds, on acquiring the 29.6-carat Blue Moon for $25.6 million.
London-based, Russian-born jewellery designer Yana Zaikin, founder of Emily H London, has noticed her UHNWI clients increasingly hedging their bets on top- quality diamonds, while adorning them-selves in the meantime.
“Five years ago my clients preferred investing in gold rather than wear-able diamond jewels,” says Mrs Zaikin. “With currency fl uctuations, they’re now diversifying with diamonds. Some keep jewels in the safe, but most wear them. One bought three identical brilliant stones for three rings, which they keep in each of their homes, in Palm Beach, London and New York.”
SPARKLING COLOURED DIAMOND BUYS
A pair of pear-shaped yellow diamond ear pendants (52.88 and 51.46 carats) sold for dou-ble their presale estimate at $5.4m at Christie’s New York in December 2014
The oval fancy light pink Gol-conda diamond (21.3 carats) sold for $4.3m at Christie’s New York sale of Magnifi cent Jewels in December 2014
The Mellon Blue Diamond (9.75 carats) set a new world auction record for the carat price of a blue diamond, fetching $32.6m at Sotheby’s New York in November 2014
The Winston Blue (13.22 car-ats) was sold to Harry Win-ston for 21.4m Swiss francs in May 2014
The Graff Pink (24.78 carats) achieved $46.2m at Sotheby’s Geneva in November 2010, the auction record for any diamond or jewel
The Graff Vivid Yellow (100.9 carats) marked a world auction record for a yellow diamond when it sold for $16.3m at Sotheby’s Geneva in May 2014
The Blue Moon (29.6 carats) was acquired by Cora Inter-national LLC for $25.6m from Petra Diamonds in February 2014
The blue diamond Bulgari Trombino ring (5.30 carats) fetched £6.2m at Bonhams in April 2013
SPARKLING COLOURED SPARKLING COLOURED SPARKLING COLOURED SPARKLING COLOURED SPARKLING COLOURED SPARKLING COLOURED SPARKLING COLOURED DIAMOND BUYS
SPARKLING COLOURED DIAMOND BUYS
SPARKLING COLOURED DIAMOND BUYS
SPARKLING COLOURED DIAMOND BUYS
SPARKLING COLOURED DIAMOND BUYS
SPARKLING COLOURED DIAMOND BUYS
SPARKLING COLOURED DIAMOND BUYS
SPARKLING COLOURED DIAMOND BUYS
SPARKLING COLOURED DIAMOND BUYS
SPARKLING COLOURED DIAMOND BUYS
SPARKLING COLOURED DIAMOND BUYS
SPARKLING COLOURED DIAMOND BUYS
SPARKLING COLOURED DIAMOND BUYS
SPARKLING COLOURED DIAMOND BUYS
SPARKLING COLOURED DIAMOND BUYS
SPARKLING COLOURED DIAMOND BUYS
SPARKLING COLOURED DIAMOND BUYS
SPARKLING COLOURED DIAMOND BUYS
SPARKLING COLOURED
65
The Graff Vivid Yellow, ©Sotheby’s
167%Overall price change
The Fancy Color Diamond Price Index (Jan 2005 to Oct 2014)
56%
161%
360%
Yellow
Pink
Blue
LUXURY SPENDING THE WEALTH REPORT 20156564

6766 the wealth report 2015databank
By its very nature, a printed publication such as The Wealth Report can only hope to describe and analyse trends in any de-tail at a fairly broad macro level. However, over the following pages we have included two highly granular datasets that provide a huge amount of information for those interested in global wealth distribution and the results of the report’s annual Attitudes Survey.
The numbers behind the trends Comprehensive wealth distribution data and regional Attitudes Survey results
The wealth distribution data, provided by WealthInsight, includes historic, cur-rent and 10-year predictions for UHNWI, centa-millionaire and billionaire popula-tions in almost 100 countries. Regional millionaire population data is included, but is also available on request at a coun-try level. City wealth numbers for over 100 locations can also be requested.
In terms of the 2015 Attitudes Survey (pp8–15), we have included the results at a regional level for the majority of the survey’s findings, but further data for selected countries is also available for those wanting to delve deeper. To take part in next year’s survey please contact: [email protected]
Regional wealth distribution
Region 2004 2013 2014 20242004-
20142013-
20142014-
2024
africa 76,385 164,000 168,815 257,519 121% 3% 53%asia 2,718,770 4,933,277 5,094,277 7,373,427 87% 3% 45%australasia 144,252 350,500 357,006 440,015 147% 2% 23%europe 3,714,946 5,015,797 5,152,132 6,298,363 39% 3% 22%russia/CIS 47,714 195,226 197,625 293,390 314% 1% 48%latin america 240,017 580,700 593,560 866,146 147% 2% 46%Middle east 204,944 426,100 438,583 605,438 114% 3% 38%north america 4,370,348 5,653,100 5,806,833 7,128,478 33% 3% 23%World 11,517,376 17,318,700 17,808,831 23,262,776 55% 3% 31%
Millionaire populations
UhnwI (+US$30m) populations
Region 2004 2013 2014 20242004-
20142013-
20142014-
2024
africa 824 1,868 1,932 3,074 135% 3% 59%asia 22,335 40,853 42,272 62,399 89% 3% 48%australasia 1,594 3,828 3,920 4,834 146% 2% 23%europe 42,409 58,731 60,565 75,945 43% 3% 25%russia/CIS 481 2,034 2,068 3,327 330% 2% 61%latin america 3,798 9,677 9,902 14,837 161% 2% 50%Middle east 3,296 7,052 7,269 10,198 121% 3% 40%north america 32,778 43,626 44,922 56,159 37% 3% 25%World 107,515 167,669 172,850 230,773 61% 3% 34%
Centa-millionaire populations
Region 2004 2013 2014 20242004-
20142013-
20142014-
2024
africa 229 509 524 815 129% 3% 56%asia 4,149 8,744 9,094 14,263 119% 4% 57%australasia 294 727 744 924 153% 2% 24%europe 8,006 10,917 11,261 14,027 41% 3% 25%russia/CIS 216 915 926 1,447 329% 1% 56%latin america 590 1,625 1,663 2,549 182% 2% 53%Middle east 705 1,508 1,550 2,167 120% 3% 40%north america 9,289 12,159 12,518 15,597 35% 3% 25%World 23,478 37,103 38,280 51,789 63% 3% 35%
billionaire populations
Region 2004 2013 2014 20242004-
20142013-
20142014-
2024
africa 11 30 30 48 172.7% 0% 60%asia 194 472 492 834 153.6% 4% 70%australasia 13 33 33 41 153.8% 0% 24%europe 268 383 393 490 46.6% 3% 25%russia/CIS 31 135 136 203 338.7% 1% 49%latin america 39 103 105 159 169.2% 2% 51%Middle east 46 98 102 138 121.7% 4% 35%north america 412 537 553 685 34.2% 3% 24%World 1,014 1,791 1,844 2,598 81.9% 3% 41%
*africa includes egypt*europe excludes russia and CIS countries*Middle east includes turkey*latin america includes the Caribbean and Mexico
% change
% change
% change
% change
Global wealth distribution
Country Region 2004 2013 2014 20242004-
20142013-
20142014-
2024 2004 2013 2014 20242004-
20142013-
20142014-
2024 2004 2013 2014 20242004-
20142013-
20142014-
2024
algeria africa 14 35 36 51 157% 3% 42% 2 4 4 6 100% 0% 50% - 1 1 1 - 0% 0%angola africa 12 70 72 112 500% 3% 56% 3 17 17 26 467% 0% 53% - 1 1 2 - 0% 100%argentina latin america 139 483 480 944 245% -1% 97% 37 128 127 248 243% -1% 95% 2 7 7 13 250.0% 0% 86%australia australasia 1,001 2,740 2,785 3,553 178% 2% 28% 216 585 595 756 175% 2% 27% 11 30 30 38 172.7% 0% 27%austria europe 953 1,429 1,460 1,874 53% 2% 28% 129 193 197 252 53% 2% 28% 6 9 9 11 50.0% 0% 22%azerbaijan russia / CIS 19 62 64 107 237% 3% 67% 2 6 6 10 200% 0% 67% 1 - - - - - -bahrain Middle east 69 124 126 161 83% 2% 28% 7 12 12 15 71% 0% 25% - - - - - - -bangladesh asia 38 75 78 113 105% 4% 45% 4 8 8 12 100% 0% 50% - - - - - - -belgium europe 955 1,370 1,402 1,771 47% 2% 26% 117 167 171 215 46% 2% 26% 1 1 1 1 0.0% 0% 0%botswana africa 12 20 20 26 67% 0% 30% 1 2 2 3 100% 0% 50%- - - -brazil latin america 1,146 4,122 4,218 6,278 268% 2% 49% 170 602 616 911 262% 2% 48% 12 43 44 65 266.7% 2% 48%bulgaria europe 16 42 43 69 169% 2% 60% 2 4 4 6 100% 0% 50% - - - - - - -Cambodia asia 20 52 54 84 170% 4% 56% 6 15 16 25 167% 7% 56% - - - - - - -Canada north america 2,275 4,248 4,341 5,392 91% 2% 24% 381 705 720 891 89% 2% 24% 20 37 38 47 90.0% 3% 24%Chile latin america 219 664 687 1,122 214% 3% 63% 76 226 234 379 208% 4% 62% 5 15 16 26 220.0% 7% 63%China asia 1,721 7,905 8,366 15,681 386% 6% 87% 582 2,639 2,790 5,185 379% 6% 86% 39 174 184 338 371.8% 6% 84%Colombia latin america 131 435 446 606 240% 3% 36% 23 74 76 103 230% 3% 36% 1 2 2 3 100.0% 0% 50%Croatia europe 130 220 221 303 70% 0% 37% 13 22 22 30 69% 0% 36% - - - - - - -Cyprus europe 128 182 181 228 41% -1% 26% 27 38 38 48 41% 0% 26% 1 1 1 1 0.0% 0% 0%Czech republic europe 200 391 399 548 100% 2% 37% 41 79 81 111 98% 3% 37% 2 4 4 5 100.0% 0% 25%denmark europe 709 981 1,019 1,288 44% 4% 26% 115 158 164 207 43% 4% 26% 4 6 6 8 50.0% 0% 33%egypt africa 101 270 276 387 173% 2% 40% 37 97 99 138 168% 2% 39% 3 7 7 10 133.3% 0% 43%estonia europe 16 36 37 60 131% 3% 62% 2 4 4 6 100% 0% 50% - - - - - - -ethiopia africa 9 35 36 72 300% 3% 100% 1 4 4 8 300% 0% 100% - - - - - - -Finland europe 288 416 426 544 48% 2% 28% 36 52 53 67 47% 2% 26% 1 1 1 1 0.0% 0% 0%France europe 2,774 3,800 3,865 4,424 39% 2% 14% 431 588 598 683 39% 2% 14% 28 38 39 44 39.3% 3% 13%Germany europe 8,126 11,392 11,679 14,481 44% 3% 24% 1,813 2,529 2,591 3,201 43% 2% 24% 49 68 70 86 42.9% 3% 23%Ghana africa 7 30 31 62 343% 3% 100% 1 3 3 6 200% 0% 100% - - - - - - -Greece europe 573 721 717 907 25% -1% 26% 74 92 92 116 24% 0% 26% 2 3 3 4 50.0% 0% 33%hong kong asia 1,706 2,560 2,690 3,941 58% 5% 47% 404 603 633 922 57% 5% 46% 34 51 53 77 55.9% 4% 45%India asia 622 1,576 1,652 3,371 166% 5% 104% 153 383 401 811 162% 5% 102% 26 65 68 136 161.5% 5% 100%Indonesia asia 195 626 650 1,507 233% 4% 132% 58 185 192 441 231% 4% 130% 7 23 24 54 242.9% 4% 125%Iran Middle east 68 217 229 403 237% 6% 76% 7 22 23 40 229% 5% 74% - - - - - - -Iraq Middle east 45 130 133 229 196% 2% 72% 4 13 13 22 225% 0% 69% - - - - - - -Ireland europe 714 811 825 983 16% 2% 19% 107 121 123 146 15% 2% 19% 3 3 3 4 0.0% 0% 33%Israel Middle east 800 1,437 1,485 1,880 86% 3% 27% 110 197 203 256 85% 3% 26% 9 16 17 21 88.9% 6% 24%Italy europe 2,936 3,650 3,717 4,468 27% 2% 20% 481 595 606 726 26% 2% 20% 21 26 26 31 23.8% 0% 19%Ivory Coast africa 16 25 26 57 63% 4% 119% 2 3 3 6 50% 0% 100% - - - - - - -Japan asia 12,186 16,450 16,703 19,916 37% 2% 19% 1,425 1,915 1,944 2,311 36% 2% 19% 19 26 26 31 36.8% 0% 19%Jordan Middle east 38 94 96 140 153% 2% 46% 8 19 19 28 138% 0% 47% - - - - - - -kazakhstan russia / CIS 33 179 190 407 476% 6% 114% 11 58 61 129 455% 5% 111% 1 7 7 15 600.0% 0% 114%kenya africa 56 110 115 209 105% 5% 82% 16 31 32 58 100% 3% 81% - 1 1 2 - 0% 100%kuwait Middle east 203 515 513 760 153% 0% 48% 45 112 112 165 149% 0% 47% 2 6 6 9 200.0% 0% 50%latvia europe 28 68 69 125 146% 1% 81% 3 7 7 13 133% 0% 86% - - - - - - -lebanon Middle east 167 306 308 407 84% 1% 32% 45 81 82 108 82% 1% 32% 2 3 3 4 50.0% 0% 33%libya africa 16 45 42 66 163% -7% 57% 2 5 5 8 150% 0% 60% - - - - - - -lithuania europe 39 83 86 155 121% 4% 80% 4 8 8 14 100% 0% 75% 0 1 1 2 - 0% 100%luxembourg europe 354 580 599 803 69% 3% 34% 97 158 163 218 68% 3% 34% 1 1 1 1 0.0% 0% 0%Malaysia asia 242 557 572 814 136% 3% 42% 90 206 211 299 134% 2% 42% 6 14 14 20 133.3% 0% 43%Mexico latin america 1,687 2,540 2,596 3,526 54% 2% 36% 168 252 257 347 53% 2% 35% 14 21 21 28 50.0% 0% 33%Monaco europe 129 198 217 426 68% 10% 96% 13 20 22 43 69% 10% 95% 2 11 12 23 500.0% 9% 92%Mongolia asia 8 45 48 101 500% 7% 110% 1 5 5 10 400% 0% 100% - - - - - - -Morocco africa 23 40 41 64 78% 3% 56% 20 34 35 54 75% 3% 54% 2 4 4 6 100.0% 0% 50%Mozambique africa 4 10 10 19 150% 0% 90% 0 1 1 2 - 0% 100% - - - - - - -Myanmar asia 14 40 42 85 200% 5% 102% 1 4 4 8 300% 0% 100% - - - - - - -namibia africa 7 16 17 23 143% 6% 35% 1 2 2 3 100% 0% 50% - - - - - - -netherlands europe 2,020 2,735 2,826 3,531 40% 3% 25% 300 404 417 519 39% 3% 24% 3 4 4 5 33.3% 0% 25%new Zealand australasia 577 1,050 1,094 1,229 90% 4% 12% 75 135 141 158 88% 4% 12% 2 3 3 3 50.0% 0% 0%nigeria africa 63 200 210 399 233% 5% 90% 19 60 63 119 232% 5% 89% 2 7 7 13 250.0% 0% 86%norway europe 1,238 2,425 2,521 3,501 104% 4% 39% 167 323 336 464 101% 4% 38% 5 9 9 12 80.0% 0% 33%oman Middle east 51 135 137 195 169% 1% 42% 5 14 14 20 180% 0% 43% - 1 1 1 - 0% 0%pakistan asia 112 260 267 400 138% 3% 50% 11 26 27 40 145% 4% 48% - - - - - - -panama latin america 41 98 103 154 151% 5% 50% 4 10 11 16 175% 10% 45% - - - - - - -paraguay latin america 49 159 165 267 237% 4% 62% 5 16 17 27 240% 6% 59% - - - - - - -peru latin america 96 276 283 451 195% 3% 59% 38 108 111 176 192% 3% 59% 3 9 9 14 200.0% 0% 56%philippines asia 68 171 177 295 160% 4% 67% 59 147 152 252 158% 3% 66% 6 15 16 26 166.7% 7% 63%poland europe 222 487 503 683 127% 3% 36% 33 71 73 99 121% 3% 36% 2 5 5 7 150.0% 0% 40%portugal europe 485 625 634 781 31% 1% 23% 80 103 104 128 30% 1% 23% 2 3 3 4 50.0% 0% 33%Qatar Middle east 114 286 296 452 160% 4% 53% 24 59 61 93 154% 3% 52% - 1 1 2 - 0% 100%romania europe 61 172 177 297 190% 3% 68% 17 47 48 80 182% 2% 67% 1 2 2 3 100.0% 0% 50%russia russia / CIS 279 1,292 1,303 1,899 367% 1% 46% 139 634 639 926 360% 1% 45% 26 116 117 168 350.0% 1% 44%Saudi arabia Middle east 382 851 874 1,212 129% 3% 39% 156 345 354 488 127% 3% 38% 10 22 23 31 130.0% 5% 35%Singapore asia 1,471 3,154 3,227 4,979 119% 2% 54% 354 751 768 1,177 117% 2% 53% 11 23 24 36 118.2% 4% 50%South africa africa 300 594 616 903 105% 4% 47% 86 168 174 254 102% 4% 46% 4 8 8 12 100.0% 0% 50%South korea asia 946 1,565 1,622 2,184 71% 4% 35% 236 387 401 537 70% 4% 34% 17 27 28 37 64.7% 4% 32%Spain europe 2,556 3,475 3,538 4,392 38% 2% 24% 398 538 548 678 38% 2% 24% 16 22 22 27 37.5% 0% 23%Sri lanka asia 21 61 63 103 200% 3% 63% 6 16 17 28 183% 6% 65% - - - - - - -Sudan africa 3 8 8 12 167% 0% 50% 0 1 1 1 - 0% 0% - - - - - - -Sweden europe 2,033 3,147 3,245 4,327 60% 3% 33% 263 405 417 553 59% 3% 33% 6 10 10 13 66.7% 0% 30%Switzerland europe 2,479 4,137 4,328 5,295 75% 5% 22% 479 793 829 1,011 73% 5% 22% 45 74 77 93 71.1% 4% 21%Syria Middle east 85 203 211 321 148% 4% 52% 9 20 21 32 133% 5% 52% - - - - - - -taiwan asia 933 1,503 1,570 2,148 68% 4% 37% 275 440 459 625 67% 4% 36% 22 35 36 49 63.6% 3% 36%tanzania africa 40 75 78 156 95% 4% 100% 4 8 8 16 100% 0% 100% - - - - - - -thailand asia 218 527 540 855 148% 2% 58% 85 203 208 327 145% 2% 57% 7 17 17 26 142.9% 0% 53%tunisia africa 37 55 57 88 54% 4% 54% 4 6 6 9 50% 0% 50% - - - - - - -turkey Middle east 866 1,923 1,986 2,881 129% 3% 45% 214 471 486 701 127% 3% 44% 16 35 36 51 125.0% 3% 42%Uae Middle east 317 625 658 856 108% 5% 30% 43 84 88 114 105% 5% 30% 7 13 14 18 100.0% 8% 29%Uganda africa 9 20 21 35 133% 5% 67% 5 12 12 20 140% 0% 67% - 1 1 2 - 0% 100%Uk europe 8,431 10,149 10,547 13,176 25% 4% 25% 2,004 2,405 2,498 3,109 25% 4% 24% 65 78 81 100 24.6% 4% 23%Ukraine russia / CIS 93 339 343 592 269% 1% 73% 49 174 176 301 259% 1% 71% 3 12 12 20 300.0% 0% 67%Uruguay latin america 28 108 114 186 307% 6% 63% 3 11 12 19 300% 9% 58% - - - - - - -USa north america 30,503 39,378 40,581 50,767 33% 3% 25% 8,908 11,454 11,798 14,706 32% 3% 25% 392 500 515 638 31.4% 3% 24%Uzbekistan russia / CIS 29 82 86 172 197% 5% 100% 3 8 8 16 167% 0% 100% - - - - - - -Venezuela latin america 47 200 192 413 309% -4% 115% 12 50 48 102 300% -4% 113% 1 3 3 6 200.0% 0% 100%Vietnam asia 35 110 116 300 231% 5% 159% 7 21 22 56 214% 5% 155% - 1 1 3 - 0% 200%Zambia africa 4 15 16 29 300% 7% 81% 1 2 2 4 100% 0% 100% - - - - - - -Zimbabwe africa 14 25 26 38 86% 4% 46% 2 3 3 4 50% 0% 33% - - - - - - -
UhnwI populations Centa-millionaire populations billionaire populations% change % change % change
Source: wealthInsight

6968 the wealth report 2015databank
Africa Asia Australasia Europe Latin America Middle East North America Russia/CIS Global
Family/business succession issues 96% 72% 83% 86% 89% 92% 92% 100% 85%potential increase in wealth taxes 100% 78% 61% 90% 77% 58% 82% 75% 81%Increased scrutiny of wealthy by government 82% 76% 44% 88% 85% 73% 75% 100% 80%Cyber-crime and online privacy 78% 75% 69% 72% 65% 65% 92% 75% 76%political interference 86% 76% 35% 69% 76% 81% 55% 89% 68%health/environmental issues 54% 71% 60% 57% 75% 38% 82% 38% 66%Crisis in Middle east 31% 35% 38% 48% 38% 96% 64% 29% 51%political situation in russia/Ukraine 19% 34% 47% 52% 38% 38% 73% 100% 51%China’s potential economic slowdown 30% 71% 67% 31% 37% 35% 64% 0% 49%
what percentage of your clients are concerned about the following issues regarding their wealth, business or lifestyle?
Africa Asia Australasia Europe Latin America Middle East North America Russia/CIS Global
tax 57% 68% 56% 81% 83% 54% 91% 56% 77%Quality of life/health 74% 79% 33% 65% 60% 71% 45% 100% 63%business reasons 43% 66% 51% 62% 53% 40% 36% 63% 54%education of children 71% 75% 24% 44% 49% 60% 27% 89% 49%Security 93% 71% 19% 51% 60% 69% 9% 63% 47%political issues 86% 57% 9% 50% 43% 73% 0% 88% 40%lack of civil liberties 25% 38% 0% 11% 12% 28% 0% 57% 16%
are the following factors reasons why your clients might want to move? (percentage = respondents who said yes)
Africa Asia Australasia Europe Latin America Middle East North America Russia/CIS Global
residential for investment 100% 84% 69% 82% 77% 85% 75% 100% 81%offices 63% 68% 29% 43% 57% 76% 70% 63% 59%retail/shops 43% 59% 15% 31% 48% 63% 55% 50% 47%hotels 22% 34% 21% 39% 28% 64% 33% 43% 37%Infrastructure 30% 21% 46% 35% 40% 32% 56% 50% 37%agricultural 29% 27% 56% 43% 40% 8% 44% 50% 37%warehousing/industrial 54% 33% 51% 28% 36% 33% 30% 17% 31%
are your clients becoming more interested in the following property investments? (percentage = respondents who said yes)
Africa Asia Australasia Europe Latin America Middle East North America Russia/CIS Global
Ski property 0% 12% 17% 35% 26% 28% 64% 11% 34%Vineyard 25% 27% 17% 26% 19% 4% 30% 38% 25%equestrian property 29% 12% 12% 17% 13% 28% 20% 13% 17%
are your clients becoming more interested in the following types of homes? (percentage = respondents who said yes)
Africa Asia Australasia Europe Latin America Middle East North America Russia/CIS Global
remained the same 64% 67% 70% 57% 66% 38% 40% 63% 55%Increased 29% 22% 15% 36% 28% 62% 50% 25% 37%decreased 7% 11% 15% 7% 6% 0% 10% 13% 8%
how did that allocation change in 2014?
Africa Asia Australasia Europe Latin America Middle East North America Russia/CIS Global
remain the same 57% 53% 80% 61% 53% 46% 45% 78% 54%Increase 32% 27% 9% 33% 39% 46% 45% 11% 35%decrease 11% 20% 11% 6% 8% 8% 9% 11% 10%
how do you think it will change in 2015?
Africa Asia Australasia Europe Latin America Middle East North America Russia/CIS Global
decrease 4% 5% 6% 2% 2% 0% 0% 22% 2%Increase 36% 22% 17% 17% 29% 31% 25% 33% 22%remain the same 61% 73% 77% 81% 69% 69% 75% 44% 75%
how do you expect your clients’ philanthropic activities to change in 2015 compared with 2014?
Africa Asia Australasia Europe Latin America Middle East North America Russia/CIS Global
decrease 4% 16% 3% 9% 6% 4% 0% 22% 8%Increase 39% 31% 14% 24% 35% 40% 33% 22% 30%remain the same 57% 53% 83% 66% 59% 56% 67% 56% 62%
how do you expect your clients’ spending on luxury goods to change in 2015 compared with 2014?
Africa Asia Australasia Europe Latin America Middle East North America Russia/CIS Global
less 25% 13% 9% 10% 7% 0% 8% 0% 9%More 64% 61% 77% 74% 75% 84% 50% 89% 66%the same 11% 26% 14% 17% 19% 16% 42% 11% 25%
do your younger clients spend more on luxury goods than their parents’ generation?
Africa Asia Australasia Europe Latin America Middle East North America Russia/CIS Global
Yes 36% 39% 22% 34% 46% 31% 75% 11% 45%no 64% 61% 78% 66% 54% 69% 25% 89% 55%
are your younger clients more philanthropic than their parents’ generation?
Africa Asia Australasia Europe Latin America Middle East North America Russia/CIS Global
Yes 18% 38% 18% 27% 22% 31% 25% 33% 29%no 82% 62% 82% 73% 78% 69% 75% 67% 71%
are your clients increasingly using private jets for their business and leisure travel?
Africa Asia Australasia Europe Latin America Middle East North America Russia/CIS Global
11% 12% 4% 14% 15% 10% 7% 33% 12%
what percentage of your clients do you think are considering permanently changing their domicile or country of residence?
Africa Asia Australasia Europe Latin America Middle East North America Russia/CIS Global
average 31% 38% 42% 33% 26% 40% 24% 27% 32%
on average, what percentage of your clients’ investment portfolios is allocated to property?
Africa Asia Australasia Europe Latin America Middle East North America Russia/CIS Global
Secondary school 19% 38% 4% 19% 35% 36% 23% 61% 27%University 40% 62% 14% 34% 58% 70% 41% 70% 47%
what percentage of your clients send, or are likely to send, their children overseas for their education?
Africa Asia Australasia Europe Latin America Middle East North America Russia/CIS Global
Yes 32% 67% 13% 32% 44% 65% 27% 67% 42%no 68% 33% 87% 68% 56% 35% 73% 33% 58%
are your clients sending their children overseas for their education at a younger age?
Attitudes Survey 2015wealth and lifestyle trends Africa Asia Australasia Europe Latin America Middle East North America Russia/CIS Global
23% 22% 15% 24% 28% 36% 31% 21% 26%
what percentage of your clients do you think are considering purchasing another home in the next 12 months?
Africa Asia Australasia Europe Latin America Middle East North America Russia/CIS Global
2.5 3.3 2.3 2.6 3.0 3.8 2.9 3.0 2.9
on average, how many homes do your clients own?
Africa Asia Australasia Europe Latin America Middle East North America Russia/CIS Global
21% 28% 29% 23% 20% 27% 19% 23% 23%
on average, what percentage of your clients’ total net worth is accounted for by their main residence and any second homes that are held not purely as an investment?
prime residential property
property Investments
due to rounding, some columns may not add to 100luxury spending trends regional data available on request
Africa Asia Australasia Europe Latin America Middle East North America Russia/CIS Global
abroad 39% 38% 6% 45% 57% 77% 27% 89% 42%In their own country 61% 63% 94% 55% 44% 23% 73% 11% 58%
where are your clients most likely to invest in property?
Africa Asia Australasia Europe Latin America Middle East North America Russia/CIS Global
Yes 43% 43% 25% 44% 46% 44% 50% 44% 45%no 57% 57% 75% 56% 54% 56% 50% 56% 55%
are your younger clients more interested in property as an investment than their parents’ generation?

Housing affordability is moving up the investment agenda
Final word
Liam BaileyGlobal Head of [email protected] +44 20 7861 5133
One of the biggest trends we are monitoring across pretty much all the markets we focus on is the ongoing globalisation of demand for property. The biggest counter-trend I see at play is protectionism (pp38–39).
Compared with other capital flows, money moving into residential property often attracts controversy. New demand is accused of hiking prices, as well as creating market access and affordability issues for local residents.
The counterargument, that new investment flows lead to new supply in precisely the places where demand is highest, appears to be falling on deaf ears. As a result, taxes on expensive homes and property investments are being extended.
This renewed focus on the impact of wealth on world property markets is to some extent misplaced. Not because affordability and accessibility issues are overstated, but rather because, by focusing solely on demand, the arguments are too narrowly drawn.
Access to high-quality, truly affordable housing is set to be a dominant political theme globally for
the next decade. As The Economist magazine noted earlier this year, 60 million rich-world households spend more than 30% of their income on housing; in the emerging world 200 million households live in slums. With rapid urbanisation, these numbers will only grow.
Opportunities for investors in this area are enormous. Innovations in housing design, funding, land assembly and construction are developing rapidly. And this is an area where the flow of ideas and experience is moving both ways, between developed and emerging economies.
We are already working with a number of develop-ers who are assessing every stage of the development process to see how they can design and deliver better homes, more cheaply and more rapidly.
In my view, this area will become an increasingly dominant area of focus for our clients. As challenges and opportunities come, they don’t get much bigger, or more important.
Please contact me if you would like to discuss this or any of the issues raised in this year’s report.
Disclaimer
The Wealth Report (© knight FrankllP 2015) is produced for generalinterest only; it is not definitive and is not intended to give advice. it must not be relied upon in any way. although high standards have been used in the preparation of the information, analysis and views presented in The Wealth Report, no responsibility or liability what-
soever can be accepted by knight Frank for the contents. we make no express or implied warranty or guarantee of the accuracy of any of the contents. as far as applicable laws allow, we do not accept re-sponsibility for errors, inaccuracies or omissions, nor for loss or damage that may result directly or indi-rectly from reliance on or use of its contents. The Wealth Report does not necessarily reflect the view of knight Frank in any respect. read-ers should not take or omit to take any action as a result of information in The Wealth Report.
reproduction of this report in whole or in part is not permitted without the prior written approval of knight Frank llP. in preparing The Wealth Report, knight Frank does not imply or establish any client, advisory, financial or profes-sional relationship. through The Wealth Report, neither knight Frank
nor any other person is providing advisory, financial or other servic-es. in particular, knight Frank llP is not authorised by the Financial Services authority to undertake regulated activities (other than limited insurance intermediation activity in connection with prop-erty management).
knight Frank llP also trades asknight Frank. knight Frank llP is alimited liability partnership regis-tered in England with registered number oc305934. our registered office is 55 Baker Street, london, w1U 8an, where you may look at a list of members’ names.
The Wealth Report is compiled from information contributed by various sources including knight Frank llP, its direct Uk subsidiar-ies and a network of separate and independent overseas entities or practices offering property ser-vices. together these are generally
known as “the knight Frank global network”. Each entity or practice in the knight Frank global network is a distinct and separate legal entity. its ownership and management is distinct from that of any other en-tity or practice, whether operating under the name knight Frank or otherwise.
in any event, no entity or practice operating under the name knight Frank (including knight Frank llP) is liable for the acts or omissions of any other entity or practice. nor does it act as an agent for or have any authority (whether actual, apparent, implied or other-wise) to represent, bind or oblige in any way any other entity or practice that operates under the name knight Frank (including knight Frank llP). where applicable, refer-ences to knight Frank include the knight Frank global network.
Residential Property EnquiriesPaddy Dring+44 20 7861 [email protected]
Commercial Property EnquiriesDeborah Watt+44 20 7861 [email protected]