Properties of dark matter haloes and their correlations ...rskibba/work/Publications_files/... ·...
13
Mon. Not. R. Astron. Soc. 416, 2388–2400 (2011) doi:10.1111/j.1365-2966.2011.19218.x Properties of dark matter haloes and their correlations: the lesson from principal component analysis Ramin A. Skibba 1,2 and Andrea V. Macci` o 1 1 Max-Planck-Institut f¨ ur Astronomie, K¨ onigstuhl 17, 69117 Heidelberg, Germany 2 Steward Observatory, University of Arizona, 933 N. Cherry Ave., Tucson, AZ 85721, USA Accepted 2011 June 9. Received 2011 May 26; in original form 2010 July 7 ABSTRACT We study the correlations between the structural parameters of dark matter haloes using prin- cipal component analysis. We consider a set of eight parameters, six of which are commonly used to characterize dark matter halo properties: mass, concentration, spin, shape, overdensity and the angle ( L ) between the major axis and the angular momentum vector. Two additional parameters (x off and ρ rms ) are used to describe the degree of ‘relaxedness’ of the halo. We find that we can account for much of the variance of these properties with halo mass and concentration, on the one hand, and halo relaxedness on the other. None the less, three princi- pal components are usually required to account for most of the variance. We argue that halo mass is not as dominant as expected, which is a challenge for halo occupation models and semi-analytic models that assume that mass determines other halo (and galaxy) properties. In addition, we find that the angle L is not significantly correlated with other halo parameters, which may present a difficulty for models in which galaxy discs are oriented in haloes in a particular way. Finally, at fixed mass, we find that a halo’s environment (quantified by the large-scale overdensity) is relatively unimportant. Key words: gravitation – methods: numerical – methods: statistical – galaxies: haloes – cosmology: theory – dark matter. 1 INTRODUCTION In the paradigm of hierarchical structure formation, gravitational evolution causes dark matter (DM) particles to cluster around peaks of the initial density field and to collapse into virialized objects (haloes), which provide the potential wells in which galaxies subse- quently form (White & Rees 1978). It is therefore expected that the properties of a galaxy are correlated with the properties of its host halo. Small haloes merge to form larger and more massive haloes, which tend to be located in dense environments and are expected to host groups of galaxies. It is commonly assumed that the mass of a DM halo determines how the galaxies it hosts form and evolve; other halo properties are assumed to be less important at fixed mass. This assumption is usually made both by those who use halo models of galaxy clustering (e.g. Zehavi et al. 2005; Skibba et al. 2006; van den Bosch et al. 2007; Moster et al. 2010) and by those who use semi-analytic models of galaxy formation (e.g. Bower et al. 2006; Cattaneo et al. 2007; De Lucia & Blaizot 2007; Somerville et al. 2008). Many of such models have recently been able to provide a description, and perhaps a plausible explanation, of various galaxy statistics, such E-mail: [email protected]; [email protected] as the luminosity function, stellar mass function, colour–magnitude distribution, correlation function and mark correlation functions, lending credence to claims about the importance of halo mass. None the less, although halo properties, such as their mass, spin, concentration and shape, are correlated with each other, there is considerable scatter in these correlations (e.g. Avila-Reese et al. 2005; Macci` o et al. 2007; Macci` o, Dutton & van den Bosch 2008; Ragone-Figueroa et al. 2010). In addition, recent studies of numer- ical simulations have shown that halo formation time is correlated with the environment at fixed mass (e.g. Sheth & Tormen 2004; Gao, Springel & White 2005; Dalal et al. 2008). Some have argued that the halo occupation distribution (used in models of galaxy clustering) is correlated with formation time at fixed mass (Zentner et al. 2005a; Wechsler et al. 2006; Giocoli et al. 2010). It has also been argued that such halo ‘assembly bias’ affects the clustering of galaxies and that the effect varies with luminosity and colour (Croton, Gao & White 2007). None the less, careful studies of the environmental dependence of galaxy luminosity and colour in the real Universe have explained this dependence in terms of the envi- ronmental dependence of halo mass alone (e.g. Tinker et al. 2008a; Skibba & Sheth 2009). Such models are also encouraged by an anal- ysis of a halo-based galaxy group catalogue, in which, given a halo’s mass, the colours of the galaxies it hosts are not significantly cor- related with the large-scale density field (Blanton & Berlind 2007). C 2011 The Authors Monthly Notices of the Royal Astronomical Society C 2011 RAS
Transcript of Properties of dark matter haloes and their correlations ...rskibba/work/Publications_files/... ·...

Mon. Not. R. Astron. Soc. 416, 2388–2400 (2011) doi:10.1111/j.1365-2966.2011.19218.x
Properties of dark matter haloes and their correlations: the lesson fromprincipal component analysis
Ramin A. Skibba1,2� and Andrea V. Maccio1�1Max-Planck-Institut fur Astronomie, Konigstuhl 17, 69117 Heidelberg, Germany2Steward Observatory, University of Arizona, 933 N. Cherry Ave., Tucson, AZ 85721, USA
Accepted 2011 June 9. Received 2011 May 26; in original form 2010 July 7
ABSTRACTWe study the correlations between the structural parameters of dark matter haloes using prin-cipal component analysis. We consider a set of eight parameters, six of which are commonlyused to characterize dark matter halo properties: mass, concentration, spin, shape, overdensityand the angle (�L) between the major axis and the angular momentum vector. Two additionalparameters (xoff and ρrms) are used to describe the degree of ‘relaxedness’ of the halo. Wefind that we can account for much of the variance of these properties with halo mass andconcentration, on the one hand, and halo relaxedness on the other. None the less, three princi-pal components are usually required to account for most of the variance. We argue that halomass is not as dominant as expected, which is a challenge for halo occupation models andsemi-analytic models that assume that mass determines other halo (and galaxy) properties. Inaddition, we find that the angle �L is not significantly correlated with other halo parameters,which may present a difficulty for models in which galaxy discs are oriented in haloes in aparticular way. Finally, at fixed mass, we find that a halo’s environment (quantified by thelarge-scale overdensity) is relatively unimportant.
Key words: gravitation – methods: numerical – methods: statistical – galaxies: haloes –cosmology: theory – dark matter.
1 IN T RO D U C T I O N
In the paradigm of hierarchical structure formation, gravitationalevolution causes dark matter (DM) particles to cluster around peaksof the initial density field and to collapse into virialized objects(haloes), which provide the potential wells in which galaxies subse-quently form (White & Rees 1978). It is therefore expected that theproperties of a galaxy are correlated with the properties of its hosthalo. Small haloes merge to form larger and more massive haloes,which tend to be located in dense environments and are expected tohost groups of galaxies.
It is commonly assumed that the mass of a DM halo determineshow the galaxies it hosts form and evolve; other halo propertiesare assumed to be less important at fixed mass. This assumptionis usually made both by those who use halo models of galaxyclustering (e.g. Zehavi et al. 2005; Skibba et al. 2006; van den Boschet al. 2007; Moster et al. 2010) and by those who use semi-analyticmodels of galaxy formation (e.g. Bower et al. 2006; Cattaneo et al.2007; De Lucia & Blaizot 2007; Somerville et al. 2008). Many ofsuch models have recently been able to provide a description, andperhaps a plausible explanation, of various galaxy statistics, such
�E-mail: [email protected]; [email protected]
as the luminosity function, stellar mass function, colour–magnitudedistribution, correlation function and mark correlation functions,lending credence to claims about the importance of halo mass.
None the less, although halo properties, such as their mass, spin,concentration and shape, are correlated with each other, there isconsiderable scatter in these correlations (e.g. Avila-Reese et al.2005; Maccio et al. 2007; Maccio, Dutton & van den Bosch 2008;Ragone-Figueroa et al. 2010). In addition, recent studies of numer-ical simulations have shown that halo formation time is correlatedwith the environment at fixed mass (e.g. Sheth & Tormen 2004;Gao, Springel & White 2005; Dalal et al. 2008). Some have arguedthat the halo occupation distribution (used in models of galaxyclustering) is correlated with formation time at fixed mass (Zentneret al. 2005a; Wechsler et al. 2006; Giocoli et al. 2010). It has alsobeen argued that such halo ‘assembly bias’ affects the clusteringof galaxies and that the effect varies with luminosity and colour(Croton, Gao & White 2007). None the less, careful studies of theenvironmental dependence of galaxy luminosity and colour in thereal Universe have explained this dependence in terms of the envi-ronmental dependence of halo mass alone (e.g. Tinker et al. 2008a;Skibba & Sheth 2009). Such models are also encouraged by an anal-ysis of a halo-based galaxy group catalogue, in which, given a halo’smass, the colours of the galaxies it hosts are not significantly cor-related with the large-scale density field (Blanton & Berlind 2007).
C© 2011 The AuthorsMonthly Notices of the Royal Astronomical Society C© 2011 RAS
Properties of DM haloes 2389
In addition, the halo model can reproduce the observed non-monotonic relation between clustering strength and density (Abbas& Sheth 2007); note, however, that assembly bias effects are thoughtto be stronger for lower mass haloes (e.g. Croton et al. 2007; Wang,Mo & Jing 2007), which host fainter galaxies than the Sloan DigitalSky Survey can reliably probe. The results of these studies suggestthat assembly bias affects the formation of observed galaxies onlyweakly, if at all, although the debate is not yet resolved.
It is also commonly assumed that typical DM haloes are relaxedand in virial equilibrium. Nevertheless, Maccio et al. (2007) haveshown that many haloes are significantly unrelaxed, sometimes be-cause they are experiencing or have recently experienced a mergeror have not yet virialized. In addition, statistical studies of galaxygroups and clusters have shown that the most massive galaxy inthese systems is often significantly offset from the centre of thepotential well, which may be an indication that some of the systemsare unrelaxed (van den Bosch et al. 2005; Skibba et al. 2011).
The relation between halo formation and galaxy formation is farfrom clear, and these issues are in need of further investigation. Forexample, to what extent halo mass determines other halo proper-ties, and to what extent relaxed and unrelaxed haloes differ, remainsto be seen. The purpose of this paper is to examine the propertiesof DM haloes in numerical simulations, with principal componentanalysis (PCA). This type of analysis allows us to quantify the cor-relations between the halo properties, determine which propertiesare the most important, and to what extent halo mass is the dominantproperty. It also allows us to characterize the distinctive propertiesof relaxed and unrelaxed haloes.
This paper is organized as follows. We describe the DM halosimulations in Section 2. In Section 3, we describe our PCAs andour choice of halo properties to analyse. We then present the PCAresults in Section 4. We further examine correlations with halo massand relaxedness in Section 5. Finally, we end with a brief discussionof our results and their implications in Section 6.
2 N U M E R I C A L S I M U L AT I O N S
Table 1 lists all of the simulations used in this work. Most of themhave been already presented in Maccio et al. (2008) and Munoz-Cuartas et al. (2011). We have run simulations for several differentbox sizes, which allows us to probe halo masses covering the entirerange 1010 � M � 1015 h−1 M�. In addition, in some cases we haverun multiple simulations for the same cosmology and box size, inorder to test for the impact of cosmic variance (and to increase thefinal number of DM haloes).
All simulations have been performed with PKDGRAV, a tree codewritten by Joachim Stadel and Thomas Quinn (Stadel 2001). Thecode uses spline kernel softening, for which the forces become
Table 1. N-body simulation parameters.
Name Box size N Part. mass Force soft. Nhalo
(Mpc) (h−1 M�) (h−1 kpc) >500
W5-20.1 20 2503 1.37e7 0.43 974W5-30.1 30 3003 2.67e7 0.64 984W5-40.1 40 2503 1.09e8 0.85 1119W5-90.1 90 3003 7.21e8 1.92 1998W5-90.2 90 6003 9.02e7 0.85 16161W5-180 180 3003 5.77e9 3.83 2302W5-300.1 300 4003 1.13e10 4.74 5845W5-300.2 300 4003 1.13e10 4.74 5933
completely Newtonian at twice the softening length, ε. The physicalvalues of ε at z = 0 are listed in Table 1. The initial conditions aregenerated with the GRAFIC2 package (Bertschinger 2001).
We have set the cosmological parameters according to the fifth-year results of the Wilkinson Microwave Anisotropy Probe mission(Kogut et al. 2009), namely �m = 0.258, �L = 0.742, n = 0.963,h = 0.72 and σ 8 = 0.796.
In all of the simulations, DM haloes are identified using a spheri-cal overdensity (SO) algorithm. We use a time-varying virial densitycontrast determined using the fitting formula presented in Maininiet al. (2003). We include in the halo catalogue all the haloes withmore than 1000 particles (see Maccio et al. 2008, for further detailson our halo-finding algorithm). Note that we include only host DMhaloes in our analysis; halo substructures are not included.
2.1 Halo parameters
For each SO halo in our sample we determine a set of parameters,including the virial mass and radius, the concentration parameter,the angular momentum, the spin parameter and axial ratios (shape).Below, we briefly describe how these parameters are defined anddetermined. A more detailed discussion can be found in Maccioet al. (2007, 2008).
2.1.1 Concentration parameter
To compute the concentration of a halo, we first determine its den-sity profile. The halo centre is defined as the location of the mostbound halo particle, and we compute the density (ρ i) in 50 sphericalshells, spaced equally in logarithmic radius. Errors on the densityare computed from the Poisson noise due to the finite number of par-ticles in each mass shell. The resulting density profile is fitted witha Navarro–Frenk–White (NFW) profile (Navarro, Frenk & White1997):
ρ(r)
ρcrit= δc
(r/rs)(1 + r/rs)2. (1)
During the fitting procedure we treat both rs and δc as free pa-rameters. Their values, and associated uncertainties, are obtainedvia a χ 2 minimization procedure using the Levenberg–Marquardtmethod. We define the rms of the fit as
ρrms = 1
N
N∑i
(ln ρi − ln ρm)2, (2)
where ρm is the fitted NFW density distribution. Finally, we definethe concentration of the halo, cvir ≡ Rvir/rs, using the virial radiusobtained from the SO algorithm, and we define the error on log c as(σrs/rs)/ ln(10), where σrs is the fitting uncertainty on rs.
2.1.2 Spin parameter
The spin parameter is a dimensionless measure of the amount ofrotation of a DM halo. We use the definition introduced by Bullocket al. (2001):
λ = Jvir√2MvirVvirRvir
, (3)
where Mvir, Jvir and Vvir are the mass, total angular momentum andcircular velocity at the virial radius, respectively. See Maccio et al.(2007) for a detailed discussion and for a comparison of the differentdefinitions of the spin parameter. Note that the concentration andspin parameters are not well defined in unrelaxed haloes; for this
C© 2011 The Authors, MNRAS 416, 2388–2400Monthly Notices of the Royal Astronomical Society C© 2011 RAS

2390 R. A. Skibba and A. V. Maccio
reason, most of our analyses in Section 4 involve only relaxedhaloes.
2.1.3 Shape parameter
Determining the shape of a three-dimensional distribution of parti-cles is a non-trivial task (e.g. Jing & Suto 2002). Following Allgoodet al. (2006), we determine the shapes of our haloes starting fromthe inertia tensor. As a first step, we compute the halo’s 3 × 3inertia tensor using all the particles within the virial radius. Next,we diagonalize the inertia tensor and rotate the particle distributionaccording to the eigenvectors. In this new frame (in which the mo-ment of inertia tensor is diagonal) the ratios a3/a1 and a3/a2 (wherea1 � a2 � a3) are given by
a3
a1=
√ ∑miz
2i∑
mix2i
a3
a2=
√ ∑miz
2i∑
miy2i
. (4)
Next we again compute the inertia tensor, but this time onlyusing the particles inside the ellipsoid defined by a1, a2 and a3.When deforming the ellipsoidal volume of the halo, we keep thelongest axis (a1) equal to the original radius of the spherical volume(Rvir). We iterate this procedure until we converge to a stable set ofaxial ratios.
Since DM haloes tend to be more prolate on average (e.g. Kasun& Evrard 2005; Bett et al. 2007), a useful parameter that describesthe shape of the halo is q ≡ (a2 + a3)/2a1, with the limiting casesbeing a sphere (q = 1) and a needle (q = 0). A related parameter isthe triaxiality τ ≡ (a2
1 − a22)/(a2
1− a32), which can also be used to
quantify the prolateness of haloes, but we find that it yields nearlyidentical results as the shape parameter, so we choose to use only qin Section 4.
Note that for haloes that are not spherical, the NFW fit to thedensity profile could be affected, potentially inducing an ‘artificial’correlation between halo shape and the rms of the density profilefit. Nevertheless, although triaxial models are an improvement overspherical profile fits, Jing & Suto (2002) have shown that the dif-ferences between such fitted profiles are fairly small, and in anycase, Maccio et al. (2007) have shown that there is no significantcorrelation between halo shape and the rms of the spherical profilefit.
2.1.4 Position angle �L
We also consider the angle �L between the major axis of the halo(a1) and the angular momentum vector L. The angle �L can bethought of as a proxy for the position of a possible stellar disc(and for the orientation of satellite galaxies) within the DM halo,assuming that the angular momentum of the disc and the one ofthe DM particles will be aligned (e.g. Sharma & Steinmetz 2005;Zentner et al. 2005b; Heller, Shlosman & Athanassoula 2007; Hahn,Teyssier & Carollo 2010). Nevertheless, it is difficult for simula-tions to reproduce the angular momentum distributions of observeddisc galaxies (van den Bosch 2002; Sharma & Steinmetz 2005).More recently, Heller et al. (2007) claim to reproduce many of theproperties of observed galactic discs, and the angular momentumof their simulated discs follows that of the DM and does not de-crease too much while the discs form. Agertz et al. (2011) alsocan reproduce the angular momentum content of disc galaxies byassuming a lower star formation efficiency than other simulationsand weaker feedback energy from supernovae. In contrast, Gover-nato et al. (2010) argue that strong outflows from supernovae are
necessary to reproduce the angular momentum distribution of dwarfgalaxies, and help to yield shallow DM profiles.
We note that the shape parameter q and �L are not estimated fromall of the particles in a halo, but rather from the halo’s best-fittingellipsoid. Nevertheless, for the vast majority of the haloes, theseparameters are computed using >80 per cent of the particles, so weexpect that this does not affect or bias our results significantly. Inaddition, observational estimates of the position angles of galaxiesalso have large uncertainties (e.g. Barnes & Sellwood 2003). Inany case, although for a spherical halo �L will be poorly defined,this does not result in systematic uncertainties in our analysis or inartificial correlations between �L and halo shape.
2.1.5 Environment parameter �8
Finally, in some of our analyses we also consider the overdensity(�8), computed within a sphere of radius R = 8 h−1 Mpc centred onthe halo centre. Such an overdensity within a fixed aperture allowsus to quantify the large-scale environment of haloes. Although mosthaloes are smaller than 2 Mpc h−1 in size (e.g. Navarro et al. 1997), itis useful to focus on larger scales, in order to more clearly encompassnon-linear scales within the aperture (e.g. Abbas & Sheth 2007).
We use the 8 Mpc h−1 overdensity, �8, in our analyses in Sec-tion 4. In Appendix A, we show similar results for smaller scaleoverdensities, �2 and �4.
2.2 Relaxed and unrelaxed haloes
Our halo finder, and halo finders in general, does not distinguishbetween relaxed and unrelaxed haloes (although there are recentexceptions, using halo phase-space densities: e.g. Zemp et al. 2009;Behroozi et al., in preparation). There are many reasons why wemight want to remove unrelaxed haloes. First and foremost, un-relaxed haloes often have poorly defined centres, which makes thedetermination of a radial density profile, and hence of the concentra-tion parameter, an ill-defined problem. Moreover, unrelaxed haloesoften have shapes that are not adequately described by an ellipsoid,making our shape parameters ill defined as well.
Following Maccio et al. (2007, 2008), we decide to use a com-bination of two different parameters ρrms and xoff to determine thedynamical status of a given DM halo. The first quantity ρrms is de-fined as the rms of the NFW fit to the density profile (performed tocompute cvir). While it is true that ρrms is typically high for unre-laxed haloes, haloes with relatively few particles also have a highρrms (due to Poisson noise) even when they are relaxed; furthermore,since the spherical averaging used to compute the density profileshas a smoothing effect, not all unrelaxed haloes have a high ρrms.
In order to circumvent these problems, we combine the valueof ρrms with the xoff parameter, defined as the distance betweenthe most bound particle (used as the centre for the density profile)and the centre of mass of the halo, in units of the virial radius.This offset is a measure for the extent to which the halo is relaxed:relaxed haloes in equilibrium will have a smooth, radially symmetricdensity distribution, and thus an offset that is virtually equal to zero.Unrelaxed haloes, such as those that have only recently experienceda major merger, are likely to reveal a strongly asymmetric massdistribution, and thus a relatively large xoff .
Although some unrelaxed haloes may have a small xoff , the ad-vantage of this parameter over, for example, the actual virial ratio,2T/V , as a function of radius, is that the former is trivial to evalu-ate. In addition, the virial ratio can be quite noisy (e.g. Maccio,Murante & Bonometto 2003), while the substructure fraction,
C© 2011 The Authors, MNRAS 416, 2388–2400Monthly Notices of the Royal Astronomical Society C© 2011 RAS
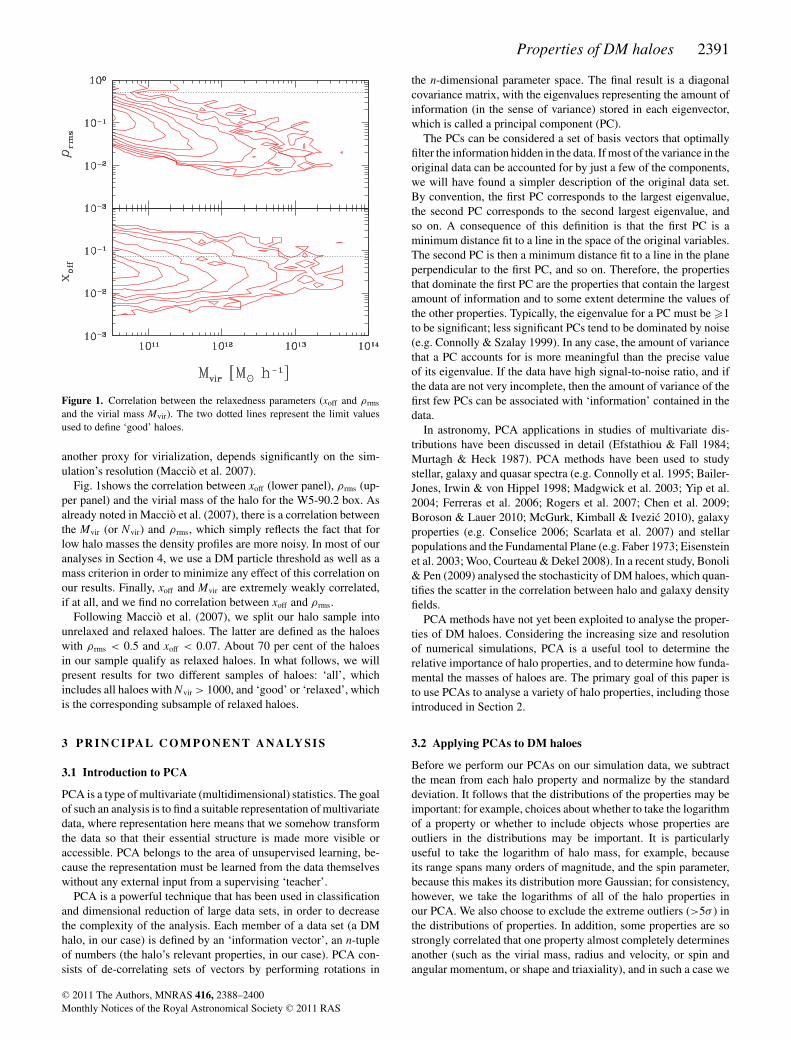
Properties of DM haloes 2391
Figure 1. Correlation between the relaxedness parameters (xoff and ρrms
and the virial mass Mvir). The two dotted lines represent the limit valuesused to define ‘good’ haloes.
another proxy for virialization, depends significantly on the sim-ulation’s resolution (Maccio et al. 2007).
Fig. 1shows the correlation between xoff (lower panel), ρrms (up-per panel) and the virial mass of the halo for the W5-90.2 box. Asalready noted in Maccio et al. (2007), there is a correlation betweenthe Mvir (or Nvir) and ρrms, which simply reflects the fact that forlow halo masses the density profiles are more noisy. In most of ouranalyses in Section 4, we use a DM particle threshold as well as amass criterion in order to minimize any effect of this correlation onour results. Finally, xoff and Mvir are extremely weakly correlated,if at all, and we find no correlation between xoff and ρrms.
Following Maccio et al. (2007), we split our halo sample intounrelaxed and relaxed haloes. The latter are defined as the haloeswith ρrms < 0.5 and xoff < 0.07. About 70 per cent of the haloesin our sample qualify as relaxed haloes. In what follows, we willpresent results for two different samples of haloes: ‘all’, whichincludes all haloes with Nvir > 1000, and ‘good’ or ‘relaxed’, whichis the corresponding subsample of relaxed haloes.
3 PR I N C I PA L C O M P O N E N T A NA LY S I S
3.1 Introduction to PCA
PCA is a type of multivariate (multidimensional) statistics. The goalof such an analysis is to find a suitable representation of multivariatedata, where representation here means that we somehow transformthe data so that their essential structure is made more visible oraccessible. PCA belongs to the area of unsupervised learning, be-cause the representation must be learned from the data themselveswithout any external input from a supervising ‘teacher’.
PCA is a powerful technique that has been used in classificationand dimensional reduction of large data sets, in order to decreasethe complexity of the analysis. Each member of a data set (a DMhalo, in our case) is defined by an ‘information vector’, an n-tupleof numbers (the halo’s relevant properties, in our case). PCA con-sists of de-correlating sets of vectors by performing rotations in
the n-dimensional parameter space. The final result is a diagonalcovariance matrix, with the eigenvalues representing the amount ofinformation (in the sense of variance) stored in each eigenvector,which is called a principal component (PC).
The PCs can be considered a set of basis vectors that optimallyfilter the information hidden in the data. If most of the variance in theoriginal data can be accounted for by just a few of the components,we will have found a simpler description of the original data set.By convention, the first PC corresponds to the largest eigenvalue,the second PC corresponds to the second largest eigenvalue, andso on. A consequence of this definition is that the first PC is aminimum distance fit to a line in the space of the original variables.The second PC is then a minimum distance fit to a line in the planeperpendicular to the first PC, and so on. Therefore, the propertiesthat dominate the first PC are the properties that contain the largestamount of information and to some extent determine the values ofthe other properties. Typically, the eigenvalue for a PC must be �1to be significant; less significant PCs tend to be dominated by noise(e.g. Connolly & Szalay 1999). In any case, the amount of variancethat a PC accounts for is more meaningful than the precise valueof its eigenvalue. If the data have high signal-to-noise ratio, and ifthe data are not very incomplete, then the amount of variance of thefirst few PCs can be associated with ‘information’ contained in thedata.
In astronomy, PCA applications in studies of multivariate dis-tributions have been discussed in detail (Efstathiou & Fall 1984;Murtagh & Heck 1987). PCA methods have been used to studystellar, galaxy and quasar spectra (e.g. Connolly et al. 1995; Bailer-Jones, Irwin & von Hippel 1998; Madgwick et al. 2003; Yip et al.2004; Ferreras et al. 2006; Rogers et al. 2007; Chen et al. 2009;Boroson & Lauer 2010; McGurk, Kimball & Ivezic 2010), galaxyproperties (e.g. Conselice 2006; Scarlata et al. 2007) and stellarpopulations and the Fundamental Plane (e.g. Faber 1973; Eisensteinet al. 2003; Woo, Courteau & Dekel 2008). In a recent study, Bonoli& Pen (2009) analysed the stochasticity of DM haloes, which quan-tifies the scatter in the correlation between halo and galaxy densityfields.
PCA methods have not yet been exploited to analyse the proper-ties of DM haloes. Considering the increasing size and resolutionof numerical simulations, PCA is a useful tool to determine therelative importance of halo properties, and to determine how funda-mental the masses of haloes are. The primary goal of this paper isto use PCAs to analyse a variety of halo properties, including thoseintroduced in Section 2.
3.2 Applying PCAs to DM haloes
Before we perform our PCAs on our simulation data, we subtractthe mean from each halo property and normalize by the standarddeviation. It follows that the distributions of the properties may beimportant: for example, choices about whether to take the logarithmof a property or whether to include objects whose properties areoutliers in the distributions may be important. It is particularlyuseful to take the logarithm of halo mass, for example, becauseits range spans many orders of magnitude, and the spin parameter,because this makes its distribution more Gaussian; for consistency,however, we take the logarithms of all of the halo properties inour PCA. We also choose to exclude the extreme outliers (>5σ ) inthe distributions of properties. In addition, some properties are sostrongly correlated that one property almost completely determinesanother (such as the virial mass, radius and velocity, or spin andangular momentum, or shape and triaxiality), and in such a case we
C© 2011 The Authors, MNRAS 416, 2388–2400Monthly Notices of the Royal Astronomical Society C© 2011 RAS

2392 R. A. Skibba and A. V. Maccio
Figure 2. Distributions of halo properties at fixed mass [log(M/h−1 M�) ∼12], for haloes with more than 1000 particles in the high-resolution 90 Mpcbox. For a given property x, we define the mean-subtracted and standarddeviation normalized quantity as x′ ≡ (x − x)/σx .
Table 2. Median, mean and standard devi-ation of halo properties at fixed mass in the90 Mpc box, whose distributions are shownin Fig. 2.
Property Median Mean Std dev
log cvir 1.043 1.039 0.107log λ −1.498 −1.513 0.252log q −0.101 −0.126 0.094log �L 0.207 0.147 0.249log xoff −1.614 −1.622 0.248log ρrms −1.439 −1.413 0.259
include only what we believe is the more important property. Byreducing the number of parameters, this tends to clarify the resultsof the PCA. We have performed numerous tests and have verifiedthat these choices do not significantly affect our results.
We perform PCAs of each of the simulations described in Sec-tion 2. We analyse all of the haloes in each box, as well as the‘relaxed’ haloes, with low values of ρrms (the rms of the NFW fitto the density profile) and xoff (the offset between the most boundparticle and the centre of mass).
The probability distributions of the halo properties are shown inFig. 2 and described in Table 2, for haloes in the 90 Mpc box, atfixed halo mass (see Section 4.2). By construction, PCA only findsindependent normal processes, and works most effectively whenthe data set is jointly normally distributed. Our halo parameters arechosen to be approximately independent, and as can be seen in thefigure, their distributions are approximately Gaussian. The shapeparameter q and the position angle �L have slightly non-Gaussiandistributions, with a tail of low values, but this is not sufficient tosignificantly affect the PCA results.
Lastly, we show the log halo mass distributions in Fig. 3, for someof the analyses in Section 4. (In particular, these are the distributionsfor the PCAs whose results are shown in Tables 3, 5, 7 and 8.)We will perform PCAs with halo mass thresholds (Section 4.1),
Figure 3. Log halo mass distributions for log(M/h−1 M�) � 12, 90 Mpcbox (solid black histogram); log(M/h−1 M�) � 12, 180 Mpc box (long-dashed red histogram); relaxed haloes with 11.85 � log(M/h−1 M�) <
12.15, 90 Mpc box (short-dashed black histogram); relaxed haloes with13.2 � log(M/h−1 M�) < 13.5, 180 Mpc box (dotted red histogram).
followed by PCAs at fixed halo mass (Section 4.2), and the massdistributions of some of these halo catalogues are shown in thefigure. When a halo mass threshold is used, the mass distributionsare highly non-Gaussian; none the less, the effect of this on the PCAresults is minimal, as we discuss in the next section.
4 R ESULTS
For the PCAs, we focus on eight halo properties: mass, concentra-tion, spin, shape, �L, xoff , ρrms and overdensity. First, in Section 4.1,we perform PCA of the haloes in our simulations using a halo massthreshold. Then in Section 4.2, we perform PCA at a fixed halomass. Lastly, we briefly discuss the lack of a correlation between�L and other halo parameters in Section 4.3.
4.1 PCAs with a halo mass threshold
The results of our PCAs of all of the haloes in the 90 and 180 Mpcboxes with log(M/h−1 M�) � 12 are shown in Tables 3 and 5;the results for the subset of relaxed haloes are shown in Tables 4
Table 3. All haloes with log(M/h−1 M�) � 12, 90 Mpc box, highresolution. N = 2183. Numbers in bold indicate dominant haloproperties in a given principal component.
Property PC1 PC2 PC3 PC4
log Mvir 0.103 − 0.761 0.148 0.500log cvir − 0.555 0.156 −0.015 −0.134log λ 0.369 0.009 0.062 −0.333log q 0.094 0.579 0.143 0.759log �L 0.001 −0.059 − 0.971 0.181log xoff 0.547 −0.018 −0.012 −0.041log ρrms 0.488 0.240 −0.107 −0.105
Eigenvalues 2.56 1.18 1.01 0.90Per cent of variance 36.5 16.9 14.4 12.8
C© 2011 The Authors, MNRAS 416, 2388–2400Monthly Notices of the Royal Astronomical Society C© 2011 RAS

Properties of DM haloes 2393
Table 4. ‘Good’ (relaxed) haloes with log(M/h−1 M�) � 12,90 Mpc box, high resolution. N = 1701.
Property PC1 PC2 PC3 PC4
log Mvir 0.163 − 0.762 0.064 0.166log cvir − 0.604 0.231 0.006 −0.114log λ 0.392 0.102 0.128 −0.221log q 0.085 0.307 0.304 0.887log �L 0.033 −0.025 − 0.928 0.300log xoff 0.543 −0.001 0.021 −0.047log ρrms 0.389 0.511 −0.162 −0.176
Eigenvalues 1.84 1.35 1.01 0.96Per cent of variance 26.3 19.2 14.5 13.7
Table 5. All haloes with log(M/h−1 M�) � 12, 180 Mpc box.N = 6391.
Property PC1 PC2 PC3 PC4
log Mvir 0.480 0.467 0.025 −0.078log cvir 0.221 − 0.639 −0.022 0.007log λ −0.320 0.417 −0.033 0.046log q −0.218 −0.023 0.263 − 0.936log �L 0.013 0.001 0.963 0.268log xoff − 0.539 0.257 −0.040 0.167log ρrms − 0.530 −0.358 −0.011 0.126
Eigenvalues 1.94 1.64 1.00 0.95Per cent of variance 27.7 23.5 14.3 13.6
Table 6. ‘Good’ (relaxed) haloes with log(M/h−1 M�) � 12,180 Mpc box. N = 3757.
Property PC1 PC2 PC3 PC4
log Mvir − 0.618 −0.098 0.030 0.011log cvir 0.443 − 0.469 −0.003 0.044log λ −0.062 0.664 −0.044 −0.012log q 0.113 0.286 0.404 0.802log �L 0.010 −0.004 0.899 −0.435log xoff 0.236 0.494 −0.164 −0.406log ρrms 0.591 0.066 0.002 −0.008
Eigenvalues 2.06 1.25 1.01 0.98Per cent of variance 29.4 17.8 14.4 14.0
and 6. Similar PCA results for smaller and larger simulation boxesare shown in Appendix A. Note that because of our resolution con-straint, in the 180 Mpc box, most of the haloes with log(M/h−1 M�)� 12 are more massive than 1012.3 h−1 M� (see Fig. 3).
We consider the following seven halo properties, of which weuse the logarithms: the mass (Mvir), the concentration (cvir), the spin(λ), the shape (q), the angle between the major axis and the totalangular momentum (�L), ρrms and xoff . We have performed tests ofthe uncertainties of the PCAs with bootstrap techniques and havefound that our errors are extremely small; hence, we have omittedthem from the tables, for clarity. In addition, our results are notsignificantly dependent on the selection criteria (i.e. the choice ofthe halo mass threshold, and for the PCAs later in this section, theparticle limit and the xoff and ρrms criteria).
One striking result is the lack of a single or pair of dominant PCs.The first two PCs usually account for only about 40–50 per cent ofthe variance. In contrast, in PCAs of galaxy spectra, the first oneor two PCs usually dominate (e.g. Connolly et al. 1995; Madgwick
Figure 4. First two PCs plotted against each other, for all haloes withlog(M/h−1 M�) � 12 in the 90 Mpc box. We are using the results fromthe first two columns of Table 3: for example, for a given halo, PC1 =−0.103 (log Mvir)′ + 0.555 (log cvir)′ − 0.369 (log λ)′ − 0.094 (log q)′ −0.001 (log �L)′ − 0.547 (log xoff )′ − 0.488 (log ρrms)′, where the halo pa-rameters are mean-subtracted and normalized by the standard deviation. Thered points are the subset of ‘good’ (i.e. relaxed) haloes.
et al. 2003). Recall that, as stated in Section 3.1, the later PCs (withlower eigenvalues) tend to be dominated by noise.
For DM haloes, no parameter or combination of parametersstrongly determines the other parameters. (This is partly by con-struction, because for closely related parameters, like mass andradius or shape and triaxiality, we have included only one of theparameters.) In other words, although halo properties are correlatedwith each other, we find no clearly fundamental correlation (nor aFundamental ‘Plane’).
This is also evident in Fig. 4,in which the first two PCs of allhaloes in the 90 Mpc box (Table 3) are shown. Some structure isapparent in the figure, with relaxed and unrelaxed haloes exhibitingdifferent distributions. The figure illustrates that the relaxed haloeshave larger values of PC1 (which is anticorrelated with the relaxed-ness parameters), and the fact that most haloes have PC2 > −2 issimply due to the halo mass threshold.
The PCA results of the different simulations are similar, butnot equivalent, most likely because of the different ranges of halomasses. In any case, in the majority of our simulation boxes, com-binations of Mvir, cvir, xoff and ρrms dominate the first two PCs.Halo mass and concentration, on the one hand, and halo relaxed-ness, on the other, can explain at least half of the variance. Note,however, that halo mass is never significant on the first PC. xoff andρrms indicate the relaxedness of haloes, and for unrelaxed haloes,the concentration is not well defined. Therefore, we argue that therelaxedness of haloes is at least as important as their mass andconcentration for determining halo properties. This is the primaryresult of our paper.
When halo parameters appear together on a PC, this can indicatea correlation between those parameters. For example, when a PC isdominated by mass and concentration, they usually have oppositesigns, consistent with the fact that these halo properties are anti-correlated (e.g. Bullock et al. 2001). Correlated halo properties donot necessarily dominate the same PCs, however, and properties
C© 2011 The Authors, MNRAS 416, 2388–2400Monthly Notices of the Royal Astronomical Society C© 2011 RAS

2394 R. A. Skibba and A. V. Maccio
dominating a PC are not necessarily correlated, although this isoften the case. If two correlated properties have substantial scatterbetween them, or if their correlation is due to more fundamen-tal correlations with a third parameter, or if two properties havestrongly correlated errors, the interpretation of PCA results may bemore complicated. With our choice of halo properties and selectioncriteria, we have attempted to minimize these complications.
Finally, note the similarities and differences between the resultsfor all haloes and for just the relaxed haloes. Most of the same haloparameters dominate the first few PCs. In addition, the PCA resultsare mostly similar in the different resolution simulation boxes, in-dicating that our results are not very sensitive to resolution, thoughthe significance of the spin parameter varies slightly. Although wefind that the PCA results presented here are statistically stable, insome cases the first PC of one simulation box resembles the secondPC of another, and vice versa, suggesting that it is the combina-tion of the first two PCs that is important. In any case, throughoutour analyses, halo mass and concentration, on the one hand, andrelaxedness parameters (quantified by xoff and ρrms), on the other,continue to dominate the first two PCs.
We also note that the halo mass distributions are non-Gaussianwhen a mass threshold is used (Fig. 3), and this could potentiallyaffect the PCA results. We have tested this effect by performingPCAs with subsamples that have Gaussian mass distributions, andby PCAs with the whole samples but with the mass distributionsrescaled (forcing them to be Gaussian, with the same rank order),and we find that the results are virtually the same, differing fromTables 3–6 by <1 per cent.
None the less, some halo parameters are accurately determinedonly for relaxed haloes (Maccio et al. 2007), such that the veryunrelaxed haloes introduce noise in the other parameters and couldrelegate them to the later PCs, or could introduce artificial corre-lations with the relaxedness parameters. For these reasons, for therest of this paper, we focus on PCA results based on the subset ofrelaxed haloes.
4.2 PCAs at fixed halo mass
As shown in Fig. 2, at fixed halo mass, the distributions of thelogarithm of most halo properties are approximately Gaussian [i.e.p(log λ|M), p(log c|M), etc., can be fitted fairly well by Gaussiandistributions]. It therefore makes sense to perform PCAs of thesevariates at fixed mass. Constraints from these PCAs could be usefulfor halo model analyses (e.g. of galaxy clustering, weak lensing,galaxy groups and clusters), and perhaps for semi-analytic modelsas well, because they reduce the complexity of such analyses toa Gaussian mixture model. Gaussian mixture models have a well-developed statistical framework and have been applied to a varietyof astrophysical studies (e.g. Kelly & McKay 2004; Hao et al. 2009;Skibba & Sheth 2009).
We first perform PCAs similar to those in Section 4.1, but nowat fixed halo mass, using the other six halo parameters. The re-sults of these PCAs are shown in Table 7 for haloes with 11.85� log(M/h−1 M�) < 12.15 in the 90 Mpc box, and in Table 8 forhaloes with 13.2 � log(M/h−1 M�) < 13.5 in the 180 Mpc box.Only haloes with more than 1000 particles are included.
The results are similar to those of the previous section, withconcentration and xoff dominating the first PC, although the spinparameter is now important on this PC as well. In addition, �L andthe shape parameter dominate the second PC. Halo model analysesoften involve constructing mock galaxy catalogues, and the mod-els are often based on the clustering and abundance of haloes as a
Table 7. ‘Good’ (relaxed) haloes with log(M/h−1 M�) ∼ 12 andmore than 1000 particles, 90 Mpc box, high resolution. N = 1056.
Property PC1 PC2 PC3 PC4
log cvir − 0.601 −0.076 0.044 −0.011log λ 0.441 −0.089 0.544 −0.048log q 0.167 − 0.591 − 0.427 − 0.654log �L −0.023 0.772 −0.113 − 0.605log xoff 0.552 0.088 0.158 −0.071log ρrms 0.334 0.183 − 0.694 0.446
Eigenvalues 1.79 1.06 0.97 0.93Per cent of variance 29.8 17.6 16.2 15.4
Table 8. ‘Good’ (relaxed) haloes with log(M/h−1 M�) ∼ 13.35 andmore than 1000 particles, 180 Mpc box. N = 416.
Property PC1 PC2 PC3 PC4
log cvir − 0.643 0.107 0.015 0.000log λ 0.496 0.141 0.339 0.120log q 0.181 − 0.567 −0.389 − 0.642log �L 0.052 − 0.588 0.715 0.058log xoff 0.520 0.058 −0.353 0.344log ρrms −0.186 − 0.546 −0.313 0.672
Eigenvalues 1.55 1.13 0.97 0.93Per cent of variance 25.8 18.8 16.2 15.6
Table 9. ‘Good’ (relaxed) haloes with log(M/h−1 M�) ∼ 13.3 andmore than 1000 particles, 180 Mpc box. N = 383.
Property PC1 PC2 PC3 PC4
log �8 −0.252 −0.103 0.761 −0.036log cvir 0.630 0.059 0.247 0.049log λ − 0.499 −0.054 0.123 0.226log q −0.126 − 0.585 0.115 − 0.667log �L −0.007 − 0.595 − 0.495 0.159log xoff 0.509 0.205 −0.149 0.187log ρrms 0.128 − 0.494 0.256 0.664
Eigenvalues 1.51 1.10 1.02 0.97Per cent of variance 21.6 15.7 14.6 13.8
function of their masses; at fixed mass, the models use halo concen-trations and density profiles. Perhaps the models could also use halospin distributions, to more accurately describe galaxy velocities, aswell as xoff distributions, to describe central galaxies offset from thehalo centres.
Next, we perform PCAs with an additional parameter, the over-density �8 within a sphere of radius 8 Mpc, which is an indicator ofa halo’s local environment (since the largest haloes have virial radiiof ∼2 Mpc/h). At a fixed halo mass, there may be a range of en-vironments: some haloes may be embedded within large structuresor filaments or surrounded by infalling haloes, while some may berelatively isolated (e.g. Colberg et al. 1999). Using a fixed halo massalso ensures that the haloes are of similar size and are much smallerthan the density aperture. We have restricted this analysis to haloeswith more than 1000 particles and with 13.15 < log(M/h−1 M�) <
13.45 in the 180 Mpc box and 13.45 < log(M/h−1 M�) < 13.75 inone of the 300 Mpc boxes. It is useful to analyse the haloes in a largesimulation box, in which cosmic variance is relatively unimportant.The results of these PCAs are shown in Tables 9 and 10.
C© 2011 The Authors, MNRAS 416, 2388–2400Monthly Notices of the Royal Astronomical Society C© 2011 RAS

Properties of DM haloes 2395
Table 10. ‘Good’ (relaxed) haloes with log(M/h−1 M�) ∼ 13.6and more than 1000 particles, 300 Mpc box. N = 944.
Property PC1 PC2 PC3 PC4
log �8 −0.138 −0.164 0.819 0.418log cvir 0.629 0.051 0.112 −0.061log λ − 0.521 −0.050 0.095 0.138log q −0.050 0.603 0.249 −0.149log �L 0.093 0.405 −0.347 0.840log xoff − 0.544 0.256 −0.206 −0.183log ρrms 0.084 0.613 0.288 −0.203
Eigenvalues 1.50 1.11 1.02 0.96Per cent of variance 21.5 15.9 14.6 13.8
We find that the local overdensity is usually significant on the thirdPC, where it is sometimes paired with the angle �L. This is con-sistent with Altay, Colberg & Croft (2006), who found that haloesare aligned with their large-scale structures (if they are located infilaments, for example), while halo shapes are not dependent onmembership of a filament. It is also consistent with Wang et al.(2011), who showed that a halo’s spin is correlated with the localoverdensity and the strength of the tidal field. In any case, in allof our simulations, the density is rarely significant on the first twoPCs. Therefore, we argue that, at fixed mass, a halo’s environment isrelatively unimportant, because it does not significantly determinethe halo’s properties. At fixed mass, a halo’s angular momentumand degree of relaxedness are much more important.
4.3 Correlation with �L
As previously stated, the angle �L can be thought of as a proxy forthe position of a possible stellar disc within the DM halo, assumingan alignment between the angular momentum of the DM particleand the stellar component (e.g. Hahn et al. 2010). Fig. 5 shows the
Figure 5. Probability distribution for the angle �L between the angularmomentum vector L and the minor (upper panel) and major (lower panel)axis of the DM distribution. The solid black line is for relaxed haloes in the90 Mpc box, while the red line is for the spin haloes (λ > 0.07, ≈12 per centof the total).
probability distribution of the cosine of �L in the high-resolution90 Mpc box. In the upper panel, the angle �L is defined as theangle between the minor axis and the angular momentum L, whilein the lower panel the major axis is used. For relaxed haloes theprobability distribution is remarkably flat in both cases, and there isno sign of a possible alignment between either the major or minoraxis and L. If we restrict our analysis to high spin haloes (λ > 0.07,red dashed line, ≈12 per cent of the total), a weak maximum atcos (�L) = 0 arises for the angle with the major axis, while thereis still no evidence for a correlation between the orientation of theminor axis and the halo angular momentum.
This result is consistent with Zentner et al. (2005b) and Kuhlen,Diemand & Madau (2007), who showed that subhaloes are dis-tributed anisotropically and are preferentially aligned with the ma-jor axis of the triaxial halo. Studies of satellite galaxies in groupshave reached similar conclusions (Yang et al. 2006; Faltenbacheret al. 2007; Kang et al. 2007; Wang et al. 2008). None the less, otherstudies have detected significant correlations between the spin axisof haloes and their minor axis, stronger than correlations with themajor axis (Bailin & Steinmetz 2005; Bett et al. 2007). It is pos-sible that the disagreement between our result (Fig. 5) and thesestudies somehow owes to the differences between SO and friends-of-friends (FOF) halo-finding algorithms. As noted by a numberof authors, there are different disadvantages to these two types ofhalo finders (e.g. Bett et al. 2007; Tinker et al. 2008b; Knebe et al.2011). In particular, SO halo finders tend to impose a more sphericalgeometry on the resulting systems. On the other hand, FOF halofinders often identify objects linked with neighbouring objects viatenuous bridges of particles, resulting in anomalously large velocitydispersions, masses and spin parameters of ≈6 per cent of objects(Bett et al. 2007). In addition, FOF halo finders define a halo cen-tre as the centre of mass, while most other algorithms (includingours) define the centre as the centre of the density profile (i.e. themost bound particle; Knebe et al. 2011). These differences withFOF halo finders may explain the disagreement about correlationsbetween the spin axis and major or minor axes of haloes.
Returning to our PCA results, in the different simulation boxes,rarely does a single halo parameter dominate a particular PC. Nonethe less, �L usually dominates the third or fourth PC, althoughsometimes the shape parameter is also significant on the same PC.In other words, one might interpret this as evidence that �L isweakly correlated with spin and/or shape, but not related to otherhalo properties. �L, which is the angle between the major axisof the halo and its angular momentum vector, is expected to beimportant for the formation of disc galaxies, because the angularmomenta of the stellar disc and the DM particles are generally,though not always, expected to be aligned (van den Bosch et al.2002; Kazantzidis et al. 2004; Sharma & Steinmetz 2005; Zentneret al. 2005b; Bett et al. 2010; Hahn et al. 2010).
In contrast to this, we show in Fig. 6 that �L is uncorrelated withthe shape parameter q. This result is independent of the value ofthe angular momentum (quantified by the spin parameter) as shownin Fig. 7.Therefore, as a consequence of our results, we argue thatit is not possible to reliably determine the angle of the angularmomentum vector from a halo’s shape. This has consequences forthe formation of disc galaxies, which we discuss in the final sectionof the paper.
5 D EPENDENCE ON HALO RELAXEDNES S
From the results of the PCAs in Sections 4.1 and 4.2, we argued thathalo ‘relaxedness’ is as important as halo mass in determining halo
C© 2011 The Authors, MNRAS 416, 2388–2400Monthly Notices of the Royal Astronomical Society C© 2011 RAS

2396 R. A. Skibba and A. V. Maccio
Figure 6. Relation between the shape (q) and the angle �L. Black circle andred dots represent haloes from the W5-30.1 and the W5-90.2 simulations,respectively. The two panels show results for all (upper) and relaxed haloes.In both cases there is no correlation between the two properties.
Figure 7. Same as Fig. 6 but of haloes with different spins. The upper panelshows results for relaxed haloes with little angular momentum (defined ashaloes with λ < 0.02), while the lower one is for relaxed haloes with a lot ofangular momentum (λ > 0.07). Again, there is no correlation between spin(λ) and the angle �L.
properties, because mass and relaxedness account for the majorityof the variance in the PCAs. This conclusion about the importance ofhalo relaxedness is consistent with other studies, such as Shaw et al.(2006), who find that the dynamical state of haloes, quantified by thevirial ratio, is correlated with halo parameters: mass, concentration,spin as well as the substructure fraction. In addition, Neto et al.(2007) define an ‘equilibrium state’ in terms of the substructurefraction, centre-of-mass displacement (like our xoff ) and virial ratio,
and find that a halo’s equilibrium state is correlated with its mass,concentration and spin.
In order to investigate this issue further, in this section we quantifyand compare correlations between halo properties and mass, andbetween them and the relaxedness parameters.
In particular, we first perform Spearman rank tests1 on some cor-relations between these parameters. We begin with correlations withhalo relaxedness parameters at fixed mass [11.85 � log(M/h−1 M�)< 12.15], using haloes with more than 1000 particles in the 90 Mpcbox. This is one of the catalogues used in Section 4.2 (see PCAresult in Table 7). The correlations between concentration and xoff ,and between spin and xoff are statistically significant, with Spearmanranks rs = −0.65 and 0.42, respectively, and remain significant ifonly ‘good’ (i.e. relaxed) haloes are selected. The correlation withshape is weaker, while that with �L is not significant at all. Of thecorrelations with ρrms, only that with concentration is significant,with rs = −0.45. Therefore, the dependence on relaxedness at fixedmass is predominantly due to xoff .
In order to perform a fair comparison with the halo mass depen-dence, we test the strength of correlations with mass at fixed re-laxedness: we use the same simulation box and select haloes withina narrow range of relaxedness parameters (xoff < 0.018 and ρrms <
0.14), such that there is a similar number of haloes (∼1300) as theprevious test at fixed mass. Only the resulting mass–concentrationcorrelation is still significant, with rs = −0.38. These results implythat the expected weak correlations between mass and the spin pa-rameter, and between mass and shape (e.g. Bett et al. 2007; Maccioet al. 2007), are no longer significant once one accounts for thedependence on halo relaxedness.
In Fig. 8, we show some of these correlations that we tested withthe Spearman rank coefficients. In the left-hand panels of Fig. 8,we show the correlation between concentration and xoff at fixedmass, and compare it to the mass–concentration relation at fixedrelaxedness parameters [similar to fig. 2 of Maccio et al. (2008)].Halo mass and the centre-of-mass offset appear to be independentlycorrelated with concentration (i.e. one is not due to the other).More massive haloes and haloes with larger offsets tend to be lessconcentrated.
We show the analogous plots with the spin parameter λ in theright-hand panels of Fig. 8. One can see no mass dependence atfixed relaxedness, although at fixed mass, haloes with larger offsetsxoff tend to have larger spin. Although the spin parameter is not welldefined for unrelaxed haloes, we see that the correlation occursfor haloes defined as relaxed [with logxoff < −1.15, or the strictercriterion in Maccio et al. (2007), logxoff < −1.40].
These tests show that halo concentration and spin are as tightlycorrelated with the relaxedness parameters (especially xoff ) as withhalo mass. This confirms our conclusion that the relaxed state of ahalo is as important as its mass, in determining its other properties.
6 D I SCUSSI ON AND C ONCLUSIONS
We used numerical simulations of DM haloes to study a variety ofhalo properties: mass, concentration, spin, shape, the angle betweenthe major axis and the angular momentum vector (�L), the distancebetween the most bound particle and the centre of mass (xoff ), therms of the NFW fit to the density profile (ρrms), and the local
1 The Spearman rank correlation coefficient may have a value between −1and 1. A positive (negative) value indicates an (anti)correlation, and a valueof 0 indicates no correlation.
C© 2011 The Authors, MNRAS 416, 2388–2400Monthly Notices of the Royal Astronomical Society C© 2011 RAS

Properties of DM haloes 2397
Figure 8. Left: Mvir versus cvir for very relaxed haloes (xoff < 0.018, ρrms < 0.14) in the upper panel, and xoff versus cvir at fixed mass (11.85 � log(M/h−1 M�)< 12.15, as in Section 4.2) in the lower panel, for haloes with more than 1000 particles in the 90 Mpc box. Right: same, but with the spin parameter, λ. Pointsindicate individual haloes, solid lines show the running medians, and dashed lines show the 16th and 84th percentiles. The vertical lines in the lower panelsindicate our cut for relaxed haloes, at xoff < 0.07.
overdensity. We analysed all of these properties together, by em-ploying PCA.
We summarize our main results as follows.
(i) There is no single dominant PC or pair of PCs. Unlike thespectra of galaxies, for DM haloes, there is no parameter or combi-nation of parameters that strongly determines the other parameters.
(ii) We find that whether a halo is relaxed or not is at least asimportant as the halo’s mass and concentration. Even for relativelyrelaxed haloes, the degree of relaxedness, quantified by xoff andρrms, is still as important as mass and concentration, and these fourproperties tend to dominate the first two PCs.
(iii) �L is not significantly correlated with any other halo prop-erties. It is therefore not possible to reliably estimate the directionof the angular momentum vector of a halo from its shape.
(iv) A halo’s ‘environment’ (quantified by the 8 Mpc overden-sity) usually dominates the third PC, where it is sometimes com-bined with the angle �L, but it is less significant than other haloproperties on the first two PCs. Therefore, at fixed halo mass, theenvironment is relatively unimportant in determining the other haloproperties.
Our results have many important implications, especially for halooccupation models and semi-analytic models. Most such modelsexplicitly assume that halo mass (or the combination of mass andconcentration) largely determines other important halo properties,and to some extent determines the properties of the galaxies hostedby a halo; however, our results show that this assumption is oftenfalse: halo mass is less dominant than one might expect. The de-gree of relaxedness of a halo is at least as important as its mass.Therefore, the relaxedness of a halo could affect the formation ofgalaxies hosted by it, independent of halo mass. In an unrelaxedhalo, for example, galaxies may experience stronger tidal forcesor their supply of gas to form stars could be disrupted. For semi-analytic models, one solution may be to quantify the relaxedness ofthe DM haloes and to use them in addition to the halo merger histo-ries. For halo occupation models, it is possible that the unrelaxed-
ness of some haloes may affect or blur the relation between halomass and central galaxy luminosity or stellar mass. In addition, it ispossible that the halo mass function and halo mass–concentrationrelation assumed in the models could be different for relaxed andunrelaxed haloes. It is not yet clear how strongly halo relaxednessmay affect results from halo occupation and semi-analytic models,and these issues deserve further study.
A related issue is that of halo ‘assembly bias’, in which the forma-tion time of haloes (or other properties related to halo assembly) iscorrelated with the environment at fixed mass (e.g. Sheth & Tormen2004; Croton et al. 2007; Wetzel et al. 2007; Fakhouri & Ma 2010;Faltenbacher & White 2010). The relaxedness of haloes, which wequantify with ρrms and xoff , is clearly related to their assembly: ahalo that has recently formed or recently experienced a merger ismore likely to be unrelaxed. Although our density parameter, �8,is subdominant in our PCAs, it is none the less possible that therelaxedness of haloes is related to their larger scale environment.Hence, the correlations with halo relaxedness may be a manifesta-tion of halo assembly bias. None the less, assembly bias may havea relatively weak effect for halo models of galaxy clustering (e.g.Blanton & Berlind 2007; Tinker et al. 2008a; Skibba & Sheth 2009).
Our result for the angle �L also has interesting implications.The fact that �L is not significantly correlated with other haloproperties may present a difficulty for some models. While theangular momentum of the stellar disc of a galaxy is thought tobe aligned with the DM particles of the host halo (such that thepole of the disc is collinear with the angular momentum vectorof the halo), our result implies that it is actually quite difficult,if not impossible, to accurately determine the orientation of thedisc simply by looking at the halo’s shape. This is consistent withhydrodynamical simulations that include baryonic cooling, whichresult in discs with spin axes that are very poorly aligned with thehalo (Bailin et al. 2005). It suggests that the direction of the angularmomentum of the baryons is not well conserved throughout the discformation process (van den Bosch et al. 2002; Yang et al. 2006).Heller et al. (2007) also argue that the shape and morphology of a
C© 2011 The Authors, MNRAS 416, 2388–2400Monthly Notices of the Royal Astronomical Society C© 2011 RAS

2398 R. A. Skibba and A. V. Maccio
disc depend on the relative angle with the major axis of the halo,but this dependence too is not well conserved. Therefore, althoughthe formation of disc galaxies and their host haloes are certainlyrelated, after they have evolved, it is not clear that one could reliablydetermine to what extent the disc remains aligned with the halo.
Finally, at the time of publication, Jeeson-Daniel et al. (2011)posted a preprint of a related study, involving PCAs of various haloproperties. Some of the results in Jeeson-Daniel et al. are consistentwith ours, such as that halo mass, concentration, substructure andrelaxedness are among a set of parameters that together accountfor a large fraction of the variance. None the less, their relaxednessparameter, which is similar to our xoff , accounts for less variance intheir PCAs than in ours.
AC K N OW L E D G M E N T S
We thank Carlo Giocoli, Ravi Sheth, Kester Smith, Vivi Tsalmantzaand Frank van den Bosch for valuable discussions that helped toimprove the quality of this paper. We also thank the anonymous ref-eree for comments that helped to clarify and strengthen the paper’sarguments. Numerical simulations were performed on the PIA andon PanStarrs2 clusters of the Max-Planck-Institut fur Astronomieat the Rechenzentrum in Garching.
RE FERENCES
Abbas U., Sheth R. K., 2007, MNRAS, 378, 641Agertz O., Teyssier R., Moore B., 2011, MNRAS, 410, 1391Allgood B., Flores R. A., Primack J. R., Kravtsov A. V., Wechsler R. H.,
Faltenbacher A., Bullock J. S., 2006, MNRAS, 367, 1781Altay G., Colberg J., Croft R. A. C., 2006, MNRAS, 370, 1422Avila Reese V., Colın P., Gottlober S., Firmani C., Maulbetsch C., 2005,
ApJ, 634, 51Bailer-Jones C. A. L., Irwin M., von Hippel T., 1998, MNRAS, 298, 361Bailin J., Steinmetz M., 2005, ApJ, 627, 647Bailin J. et al., 2005, ApJ, 627, L17Barnes E. I., Sellwood J. A., 2003, AJ, 128, 1164Bertschinger E., 2001, ApJS, 137, 1Bett P., Eke V., Frenk C. S., Jenkins A., Helly J., Navarro J., 2007, MNRAS,
376, 215Bett P., Eke V., Frenk C. S., Jenkins A., Okamoto T., 2010, MNRAS, 404,
1137Blanton M. R., Berlind A. A., 2007, ApJ, 664, 791Bonoli S., Pen U. L., 2009, MNRAS, 396, 1610Boroson T. A., Lauer T. R., 2010, AJ, 140, 390Bower R. G., Benson A. J., Malbon R., Helly J. C., Frenk C. S., Baugh C.
M., Cole S., Lacey C. G., 2006, MNRAS, 370, 645Bullock J. S., Kolatt T. S., Sigad Y., Somerville R. S., Kravtsov A. V., Klypin
A. A., Primack J. R., Dekel A., 2001, MNRAS, 321, 559Cattaneo A. et al., 2007, MNRAS, 377, 63Chen Y.-M., Wild V., Kauffmann G., Blaizot J., Davis M., Noeske K., Wang
J.-M., Willmer C., 2009, MNRAS, 393, 406Colberg J. M., White S. D. M., Jenkins A., Pearce F. R., 1999, MNRAS,
308, 593Connolly A. J., Szalay A. S., 1999, AJ, 117, 2052Connolly A. J., Szalay A. S., Bershady M. A., Kinney A. L., Calzetti D.,
1995, AJ, 110, 1071Conselice C. J., 2006, MNRAS, 373, 1389Croton D. J., Gao L., White S. D. M., 2007, MNRAS, 374, 1303Dalal N., White M., Bond J. R., Shirokov A., 2008, ApJ, 687, 12De Lucia G., Blaizot J., 2007, MNRAS, 375, 2Efstathiou G., Fall M. S., 1984, MNRAS, 206, 453Eisenstein D. J. et al., 2003, ApJ, 585, 694Faber S. M., 1973, ApJ, 179, 731Fakhouri O., Ma C.-P., 2010, MNRAS, 401, 2245Faltenbacher A., White S. D. M., 2010, ApJ, 708, 469
Faltenbacher A., Li C., Mao S., van den Bosch F. C., Yang X., Jing Y. P.,Pasquali A., Mo H. J., 2007, ApJ, 662, L71
Ferreras I., Pasquali A., de Carvalho R. R., de la Rosa I. G., Lahav O., 2006,MNRAS, 370, 828
Gao L., Springel V., White S. D. M., 2005, MNRAS, 363, L66Giocoli C., Tormen G., Sheth R. K., van den Bosch F. C., 2010, MNRAS,
404, 502Governato F. et al., 2010, Nat, 463, L203Hahn O., Teyssier R., Carollo C. M., 2010, MNRAS, 405, 274Hao J. et al., 2009, ApJ, 702, 745Heller C. H., Shlosman I., Athanassoula E., 2007, ApJ, 671, 226Jeeson-Daniel A., Dalla Vecchia C., Haas M. R., Schaye J., 2011, MNRAS,
in pressJing Y. P., Suto Y., 2002, ApJ, 574, 538Kang X., van den Bosch F. C., Yang X., Mao S., Mo H. J., Li C., Jing Y. P.,
2007, MNRAS, 378, 1531Kasun S. F., Evrard A. E., 2005, ApJ, 629, 781Kazantzidis S., Kravtsov A. V., Zentner A. R., Allgood B., Nagai D., Moore
B., 2004, ApJ, 611, L73Kelly B. C., McKay T. A., 2004, AJ, 127, 625Knebe A. et al., 2011, MNRAS, in pressKuhlen M., Diemand J., Madau P., 2007, ApJ, 671, 1135Maccio A. V., Murante G., Bonometto S. A., 2003, ApJ, 588, 35Maccio A. V., Dutton A. A., van den Bosch F. C., Moore B., Potter D.,
Stadel J., 2007, MNRAS, 378, 55Maccio A. V., Dutton A. A., van den Bosch F. C., 2008, MNRAS, 391, 1940McGurk R. C., Kimball A. E., Ivezic Z., 2010, AJ, 139, 1261Madgwick D. S., Somerville R., Lahav O., Ellis R., 2003, MNRAS, 343,
871Mainini R., Maccio A. V., Bonometto S. A., Klypin A., 2003, ApJ, 599, 24Moster B. P., Somerville R. S., Maulbetsch C., van den Bosch F. C., Maccio
A. V., Naab T., Oser L., 2010, ApJ, 710, 903Munoz-Cuartas J. C., Maccio A. V., Gottlober Dutton A. A., 2011, MNRAS,
411, 584Murtagh F., Heck A., 1987, Multivariate Data Analysis. Reidel, DordrechtNavarro J. F., Frenk C. S., White S. D. M., 1997, ApJ, 490, 493Neto A. F. et al., 2007, MNRAS, 381, 1450Ragone-Figueroa C., Plionis M., Merchan M., Gottlober S., Yepes G., 2010,
MNRAS, 407, 581Rogers B., Ferreras I., Lahav O., Bernardi M., Kaviraj S., Yi S. K., 2007,
MNRAS, 382, 750Scarlata C. et al., 2007, ApJS, 172, 406Sharma S., Steinmetz M., 2005, ApJ, 628, 21Shaw L. D., Weller J., Ostriker J. P., Bode P., 2006, ApJ, 646, 815Sheth R. K., Tormen G., 2004, MNRAS, 350, 1385Skibba R. A., Sheth R. K., 2009, MNRAS, 392, 1080Skibba R. A., Sheth R. K., Connolly A. J., Scranton R., 2006, MNRAS, 369,
68Skibba R. A., van den Bosch F. C., Yang X., More S., Mo H. J., Fontanot F.,
2011, MNRAS, 410, 417Somerville R. S., Hopkins P. F., Cox T. J., Robertson B. E., Hernquist L.,
2008, MNRAS, 391, 481Stadel J. G., 2001, PhD thesis, Univ. WashingtonTinker J. L., Conroy C., Norberg P., Patiri S. G., Weinberg D. H., Warren
M. S., 2008a, ApJ, 686, 53Tinker J., Kravtsov A. V., Klypin A., Abazajian K., Warren M., Yepes G.,
Gottlober S., Holz D. E., 2008b, ApJ, 688, 709van den Bosch F. C., 2002, MNRAS, 332, 456van den Bosch F. C., Abel T., Croft R. A. C., Hernquist L., White S. D. M.,
2002, ApJ, 576, 21van den Bosch F. C., Weinmann S. M., Yang X., Mo H. J., Li C., Jing Y. P.,
2005, MNRAS, 361, 1203van den Bosch F. C. et al., 2007, MNRAS, 376, 841Wang H. Y., Mo H. J., Jing Y. P., 2007, MNRAS, 375, 633Wang Y., Yang X., Mo H. J., Li C., van den Bosch F. C., Fan Z., Chen X.,
2008, MNRAS, 385, 1511Wang H., Mo H. J., Jing Y. P., Yang X., Wang Y., 2011, MNRAS, 413,
1973
C© 2011 The Authors, MNRAS 416, 2388–2400Monthly Notices of the Royal Astronomical Society C© 2011 RAS

Properties of DM haloes 2399
Wechsler R. H., Zentner A. R., Bullock J. S., Kravtsov A. V., Allgood B.,2006, ApJ, 652, 71
Wetzel A. A., Cohn J. D., White M., Holz D. E., Warren M. S., 2007, ApJ,656, 139
White S. D. M., Rees M. J., 1978, MNRAS, 183, 341Woo J., Courteau S., Dekel A., 2008, MNRAS, 390, 1453Yang X., van den Bosch F. C., Mo H. J., Mao S., Kang X., Weinmann
S. M., Guo Y., Jing Y. P., 2006, MNRAS, 369, 1293Yip C. W. et al., 2004, AJ, 128, 2603Zehavi I. et al., 2005, ApJ, 630, 1Zemp M., Diemand J., Kuhlen M., Madau P., Moore B., Potter D., Stadel J.,
Widrow L., 2009, MNRAS, 394, 641Zentner A. R., Berlind A. A., Bullock J. R., Kravtsov A. V., Wechsler R. H.,
2005a, ApJ, 624, 505Zentner A. R., Kravtsov A. V., Gnedin O. Y., Klypin A. A., 2005b, ApJ,
629, 219
APPENDIX A : SUPPLEMENTA RY PCASAND TESTS
In this appendix, we include additional PC analyses that can becompared to the results in Section 4.
First, we perform PCAs for halo mass threshold [log(M/h−1 M�)> 12] for the 40 and 300 Mpc simulation boxes, analogous to theresults shown in Tables 4 and 6. The results of these PCAs are shownin Tables A1 and A2. The PCAs of the 40 and 90 Mpc boxes aresimilar, although for the 40 Mpc box, λ is now very significant onthe second PC. The PCAs of the 180 and 300 Mpc boxes are similaras well, although for the 300 Mpc box, cvir is more significant onthe first PC than on the second one. In any case, even when onecompares the PCAs of the 40 and 300 Mpc boxes, which have verydifferent resolutions, the results are quite similar. We conclude thatour results are not very sensitive to the resolution of the simulations.
Table A1. Relaxed haloes with log(M/h−1 M�) �12, 40 Mpc box.N = 1822.
Property PC1 PC2 PC3 PC4
log Mvir − 0.618 0.078 −0.002 0.015log cvir 0.408 0.499 −0.015 0.078log λ −0.068 − 0.645 −0.046 −0.070log q 0.093 −0.267 0.458 0.820log �L 0.002 −0.053 − 0.881 0.467log xoff 0.292 − 0.503 −0.106 −0.313log ρrms 0.595 −0.046 −0.014 −0.022
Eigenvalues 2.14 1.26 1.01 0.97Per cent of variance 30.6 18.0 14.4 13.9
Table A2. Relaxed haloes with log(M/h−1 M�) �12 and more than1000 particles, 300 Mpc box. N = 1905.
Property PC1 PC2 PC3 PC4
log Mvir − 0.460 0.472 −0.124 −0.003log cvir 0.609 0.185 0.045 −0.009log λ −0.338 − 0.465 0.116 0.044log q 0.075 −0.367 −0.360 − 0.818log �L 0.112 −0.161 − 0.862 0.463log xoff −0.312 − 0.483 0.136 0.240log ρrms 0.434 −0.364 0.279 0.239
Eigenvalues 1.62 1.33 0.99 0.96Per cent of variance 23.2 19.0 14.2 13.7
Table A3. Relaxed haloes with log(M/h−1 M�) ∼ 13.3 and morethan 1000 particles, 180 Mpc box. N = 383.
Property PC1 PC2 PC3 PC4
log �2 0.282 0.406 0.559 0.031log cvir − 0.621 0.221 0.150 −0.023log λ 0.511 0.035 0.181 −0.290log q 0.098 − 0.542 0.201 0.755log �L −0.023 − 0.688 0.084 − 0.580log xoff 0.505 0.061 −0.201 0.062log ρrms −0.098 −0.118 0.738 −0.070
Eigenvalues 1.52 1.11 1.08 0.97Per cent of variance 21.8 15.8 15.4 13.8
Table A4. ‘Good’ (relaxed) haloes with log(M/h−1 M�) ∼ 13.3 andmore than 1000 particles, 180 Mpc box. N = 383.
Property PC1 PC2 PC3 PC4
log �4 0.233 −0.181 0.751 0.049log cvir − 0.626 0.024 0.303 −0.024log λ 0.502 −0.066 0.157 −0.271log q 0.124 − 0.569 −0.110 0.772log �L 0.131 − 0.572 − 0.442 − 0.470log xoff 0.521 0.200 −0.006 −0.037log ρrms −0.123 − 0.521 0.336 −0.325
Eigenvalues 1.51 1.10 1.03 0.97Per cent of variance 21.6 15.7 14.7 13.8
Table A5. ‘Good’ (relaxed) haloes with log(M/h−1 M�) ∼ 13.3and more than 1000 particles, 180 Mpc box. N = 383. Like Table 9,but with 1σ error added to log λ.
Property PC1 PC2 PC3 PC4
log �8 0.249 0.100 0.762 0.210log cvir − 0.663 0.022 0.195 0.176log λ 0.282 0.367 −0.020 0.639log q 0.186 0.428 0.251 − 0.713log �L 0.034 0.623 − 0.504 0.034log xoff 0.602 −0.245 −0.084 0.043log ρrms −0.143 0.472 0.240 0.073
Eigenvalues 1.38 1.12 1.02 1.00Per cent of variance 19.7 16.0 14.5 14.3
Next, we perform more PCAs at fixed mass, using smaller scaleoverdensities �2 and �4, in 2 and 4 Mpc apertures, analogous to theresults in Table 9. The results of these PCAs are shown in Tables A3and A4. When using �4, the first three PCs are essentially the sameas when �8 was used, and q still dominates the fourth PC. When�2 is used, the second and third PCs are different, although theyare dominated by the same parameters. In any case, regardless ofthe scale of the overdensity, we conclude that halo environment isless prominent in our PCAs, and therefore less important, than theother halo parameters.
Finally, while we have attempted to minimize the effects of corre-lated errors, we have not heretofore accounted for parameters withparticularly large errors. One way to test the effects of such errors isto add error (with a Gaussian distribution) to a particular parameter.Such tests yield PCA results similar to those shown in Section 4,although we find that the first few PCs are usually more robustthan the later PCs. An example is shown in Table A5, in which
C© 2011 The Authors, MNRAS 416, 2388–2400Monthly Notices of the Royal Astronomical Society C© 2011 RAS

2400 R. A. Skibba and A. V. Maccio
we have significantly increased the error of the spin parameter, by1σ . Comparing to Table 9, the numbers are slightly different, butthe dominant parameters on each PC remain the same. The onlyexception is λ itself, which is no longer significant on PC1, but isinstead slightly significant on PC2 and more significant on PC4.Similar tests with other parameters have yielded smaller changesthan shown here: for example, adding error to the concentrationdoes not affect any of the dominant parameters on the PCs, and
only slightly decreases the significance of cvir on PC1. We have alsotested the effects of asymmetric errors, but these significantly affectthe PCA results only if they are larger and much more asymmetricthan the expected errors in these simulations. We conclude that ourPCA results are robust to the parameter errors.
This paper has been typeset from a TEX/LATEX file prepared by the author.
C© 2011 The Authors, MNRAS 416, 2388–2400Monthly Notices of the Royal Astronomical Society C© 2011 RAS


![, Marcello Cacciato y arXiv:1003.4740v2 [astro-ph.CO] 30 Jun 2010 · Halo model at k ˛1 Mpc 1 3 Figure 1. Mass-concentration relations of dark-matter haloes at four di erent redshifts.](https://static.fdocuments.us/doc/165x107/5f0da8bf7e708231d43b72cd/-marcello-cacciato-y-arxiv10034740v2-astro-phco-30-jun-2010-halo-model-at.jpg)