Properties ii Functional Servicing and Preliminary Stormwater Management Report March 2015 R.J....
173
Functional Servicing and Preliminary Stormwater Management Report Paris Grand Submission GolfNorth Properties 400 Golf Course Road Conestoga, ON N0B1N0 R.J. Burnside & Associates Limited 6990 Creditview Road, Unit 2 Mississauga ON L5N 8R9 CANADA March 2015 PGD020165
Transcript of Properties ii Functional Servicing and Preliminary Stormwater Management Report March 2015 R.J....
Functional Servicing and Preliminary Stormwater Management Report Paris Grand Submission GolfNorth Properties 400 Golf Course Road Conestoga, ON N0B1N0
R.J. Burnside & Associates Limited 6990 Creditview Road, Unit 2 Mississauga ON L5N 8R9 CANADA
March 2015 PGD020165


GolfNorth Properties ii Functional Servicing and Preliminary Stormwater Management Report March 2015
R.J. Burnside & Associates Limited PGD020165 020165 FSR Preliminary Report
Table of Contents
1.0 Introduction and Previous Area Study Submission ......................................... 1
2.0 Site Description ................................................................................................... 2
3.0 Background Information ..................................................................................... 4 3.1 Additional Studies and Documentation ........................................................ 4 3.2 Development Concept ................................................................................. 4 3.3 Existing Site Conditions ............................................................................... 6
3.3.1 Topography ...................................................................................... 6 3.3.2 Soil Conditions ................................................................................. 6 3.3.3 Groundwater Conditions................................................................... 7
4.0 County of Brant Servicing Master Plan ............................................................. 8
5.0 Grading and Storm Drainage.............................................................................. 9 5.1 Site Grading ................................................................................................. 9 5.2 Existing Storm Drainage .............................................................................. 9 5.3 Proposed Storm Drainage ......................................................................... 10
5.3.1 Minor System Storm Conveyance .................................................. 10 5.3.2 Major System Storm Conveyance .................................................. 10 5.3.3 Post-Development Catchments ...................................................... 10
6.0 Stormwater Management .................................................................................. 12 6.1 Environmental Constraints ......................................................................... 12
6.1.1 Environmental and Natural Heritage Features ............................... 12 6.1.2 Gilbert Creek Flood LInes .............................................................. 12
6.2 Gilbert Creek Erosion Criteria .................................................................... 13 6.2.1 Gilbert Creek Subwatershed Study Erosion Criteria ...................... 13 6.2.2 Previous Memo – Comparison of Runoff Volumes to Gilbert Creek
SWS ............................................................................................... 14 6.2.3 Proposed Volumetric Reduction Approach .................................... 15 6.2.4 LVM/Stantec Water Balance Update .............................................. 16 6.2.5 Stormwater Management Design Implications ............................... 16
6.3 Stormwater Management Facility Design .................................................. 17 6.3.1 Design Approach ............................................................................ 17 6.3.2 Erosion Control Storage ................................................................. 18 6.3.3 Quantity Control Criteria ................................................................. 19 6.3.4 Existing Paris Links Road SWM Facility ......................................... 23 6.3.5 Existing Paris Lakes Road SWM Outfall ........................................ 24 6.3.6 Quality Control ............................................................................... 24
6.4 Site Infiltration and Water Balance ............................................................. 25 6.4.1 Gilbert Creek – WT1 ....................................................................... 26 6.4.2 South Wetland –WT2 ..................................................................... 27 6.4.3 Implementation of 3rd Pipe Diversion and Infiltration Gallery.......... 28 6.4.4 Additional Considerations and Detailed Design ............................. 28

GolfNorth Properties iii Functional Servicing and Preliminary Stormwater Management Report March 2015
R.J. Burnside & Associates Limited PGD020165 020165 FSR Preliminary Report
6.5 Thermal Impacts and Temperature Mitigation ........................................... 29 6.6 Monitoring .................................................................................................. 29 6.7 Erosion and Sediment Control ................................................................... 30 6.8 Recommendations – Stormwater Management ......................................... 31
7.0 Wastewater Servicing ....................................................................................... 32 7.1 Wastewater Design Criteria ....................................................................... 32 7.2 Design Flows ............................................................................................. 32 7.3 New Sanitary Pumping Station .................................................................. 32
7.3.1 Existing Paris Links Road SPS ...................................................... 33 7.3.2 Conveyance of Existing Flows to New Paris Grand SPS ............... 33 7.3.3 Proposed New Sanitary Pumping Station ...................................... 33 7.3.4 Staged Development on Draft Plan Lands ..................................... 34
7.4 External Sanitary Sewer System Constraints ............................................ 35 7.4.1 Paris Wastewater Treatment Plant (WWTP) .................................. 35 7.4.2 Downstream Sanitary Sewer Analysis ........................................... 35
7.5 Conclusions – Draft Plan Area Wastewater Servicing ............................... 37
8.0 Water Supply and Distribution ......................................................................... 38 8.1 Design Criteria ........................................................................................... 38 8.2 Design Flows ............................................................................................. 38 8.3 Existing Supply Conditions and System Upgrades .................................... 38 8.4 Paris Water Model – Update to Include Paris Grand Demand ................... 39 8.5 Existing GolfNorth Supply Wells ................................................................ 39 8.6 Preliminary Watermain Layout ................................................................... 40 8.7 Conclusions – Draft Plan Area Water Servicing......................................... 41
9.0 Traffic Study and Roads ................................................................................... 42 9.1 Traffic Report ............................................................................................. 42 9.2 Right-of-Way Widths .................................................................................. 42 9.3 Paris Lake Road Improvements ................................................................. 42
10.0 Summary Conclusion ....................................................................................... 43
GolfNorth Properties iv Functional Servicing and Preliminary Stormwater Management Report March 2015
R.J. Burnside & Associates Limited PGD020165 020165 FSR Preliminary Report
Tables
Table 1: Preliminary Unit Counts and Populations ............................................................ 6 Table 2: 25 mm Event (Erosion Storage) Requirements................................................. 18 Table 3: Storage Volume Alternatives for Pond 1 (100-year Design Event, SCS 24 Hour) ........................................................................................................................................ 20 Table 4: Diversion Comparison for Pond 1 (100-year Design Event, SCS 24 Hour ....... 21 Table 5: Pond 1-3 Hour Chicago SWMHYMO Modelling Outputs .................................. 21 Table 6: Pond 2 - 3 Hour Chicago SWMHYMO Modelling Outputs ................................ 22 Table 7: Diversion Comparison for Pond 3 (100-year Design Event. SCS 24 Hour) ...... 23 Table 8: Pond 3 - 24 Hour SCS - SWMHYMO Modelling Outputs .................................. 23 Table 9: Quality Control Volume Summary ..................................................................... 25 Table 10: Sanitary Design Flows .................................................................................... 32 Table 11: Downstream Sewer Surcharging with Paris Grand Flows Included ................ 36 Table 12: Preliminary Estimate of Water Demand .......................................................... 38
Figures
Figure 1: Site Location Plan .............................................................................................. 3 Figure 2: Development Concept Plan ............................................................................... 5 Figure 3: Existing Site Conditions .................................................................. Back Pocket Figure 4: Preliminary Grading Plan ................................................................ Back Pocket Figure 4A: Preliminary Plan/Profile – Paris Links Road ................................. Back Pocket Figure 5: Pre-Development Storm Drainage Plan .......................................... Back Pocket Figure 6: Post Development Storm Drainage Plan ........................................ Back Pocket Figure 6A: Post-Development Storm Drainage Plan (3rd Pipe Rooftop Collection) Back Pocket Figure 7: Preliminary Pond Design ................................................................ Back Pocket Figure 7A: Preliminary Pond Cross Sections ................................................. Back Pocket Figure 8: Preliminary Storm Servicing Plan ................................................... Back Pocket Figure 8A: Preliminary Storm Servicing Plan (3rd Pipe Rooftop Collection) ........... Back Pocket Figure 9: Preliminary Sanitary Servicing Plan ................................................ Back Pocket Figure 10: Preliminary Water Servicing Plan ................................................. Back Pocket
Appendices
Figures Appendix A LVM Borehole Data Appendix B Preliminary Storm Sewer Design Calculations Appendix C Stormwater Management Calculations and Modelling Appendix D Preliminary Sanitary Sewer Design Calculations Appendix E Downstream Sanitary Sewers – Summary Table and Constraint Maps Appendix F Sanitary Pumping Station Rationale and Preliminary Design Brief Appendix G Preliminary Water Demand Calculations and Additional Background

GolfNorth Properties v Functional Servicing and Preliminary Stormwater Management Report March 2015
R.J. Burnside & Associates Limited PGD020165 020165 FSR Preliminary Report
Disclaimer
This document contains proprietary and confidential information. As such, it is for the sole use of the addressee and R.J. Burnside & Associates Limited, and proprietary information shall not be disclosed, in any manner, to a third party except by the express written permission of R.J. Burnside & Associates Limited. This document is deemed to be the intellectual property of R.J. Burnside & Associates Limited in accordance with Canadian copyright law.

GolfNorth Properties 1 Functional Servicing and Preliminary Stormwater Management Report March 2015
R.J. Burnside & Associates Limited PGD020165 020165 FSR Preliminary Report
1.0 Introduction and Previous Area Study Submission
R.J. Burnside & Associates Limited (Burnside) has been retained by GolfNorth Properties Ltd. to complete a Functional Servicing and Preliminary Stormwater Management Report for the proposed Paris Grand residential subdivision.
The Report will support applications for Zoning Bylaw Amendment and Draft Plan of Submission approval by demonstrating that the subject lands can be provided with municipal servicing in accordance with applicable regulatory requirements and criteria.
Burnside had previously prepared an Infrastructure Servicing Study for the subject property which was included with the Paris Grand Area Study documentation submitted in February 2013. Subsequently, an initial submission of this Functional Servicing Report was included in support of an application for Draft Plan Approval in November 2013. This updated Report will serve to extend and provide additional detail as it relates to the proposed sanitary, water and stormwater servicing strategies for the subject lands and address Country and Grand River Conservation Authority comments received on the previous submission.
GolfNorth Properties 2 Functional Servicing and Preliminary Stormwater Management Report March 2015
R.J. Burnside & Associates Limited PGD020165 020165 FSR Preliminary Report
2.0 Site Description
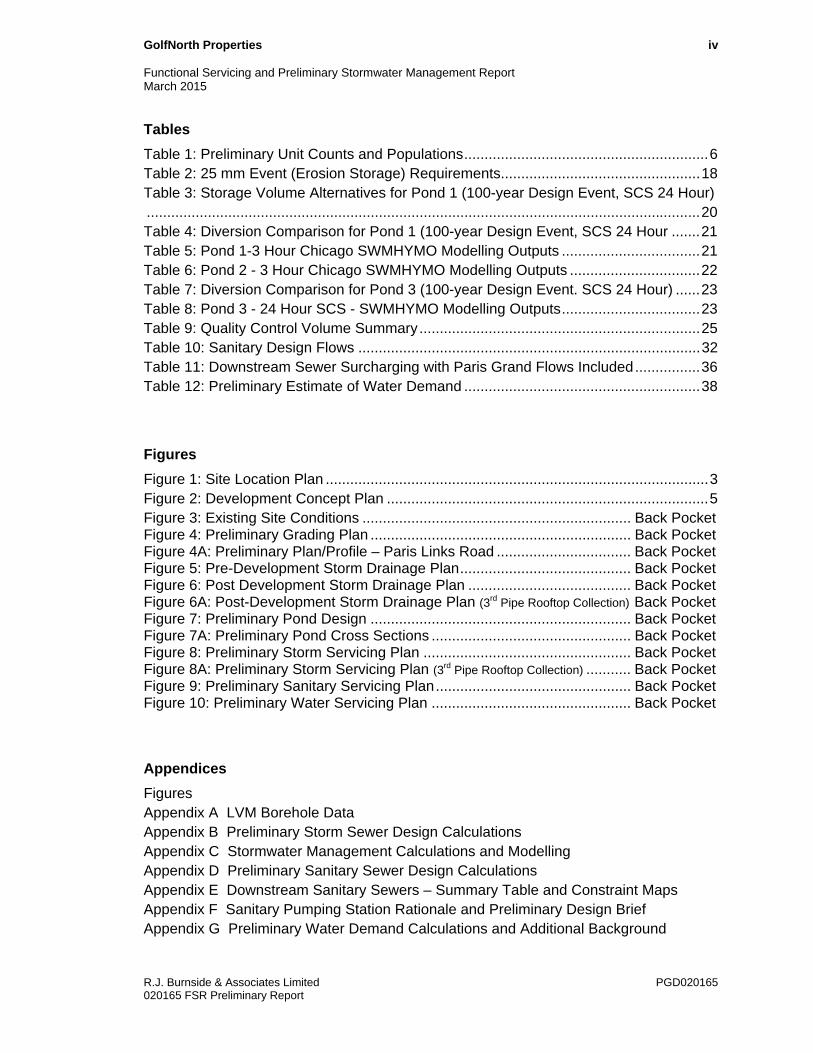
The subject lands are located within the existing urban boundary at the east limit of the former Town of Paris, Ontario (now the County of Brant) with a municipal address of 150 Paris Links Road. The property is the site of an operating 18-hole golf course (the Paris Grand Country Club). Paris Links Road divides the property into north and south parcels.
The property is bordered to the south by the Grand River, to the north by a former C.N. railway right-of-way and to the west by the built-up area of Paris. The total property holding occupies approximately 59.6 hectares. Figure 1 on the following page is a location plan showing the property in the context of the surrounding area of Paris.
The proposed Draft Plan of Subdivision provides for approximately 400 residential units, with a mix of low and medium density unit types. The Draft Plan also provides for roadways, Stormwater Management blocks, blocks for on-site water treatment and sanitary sewage pumping facilities and appropriate designations for environmental features and associated setback buffers.

File
N
am
e: 0
20
16
5_
FIG
01
(L
OC
AT
IO
N P
LA
N).d
wg
D
ate
P
lo
tte
d: M
arch
1
2, 2
01
5 - 3
:1
0 P
M
Scale
Figure No.
Figure Title
DrawnClient
Project No.
Checked Date
0 40.010.0
Meters
20.0 30.05.0
GOLFNORTH PROPERTIES
PARIS GRAND SUBDIVISON
SITE LOCATION PLAN
J.H.
N.T.S. PGD020165
FIG1
P.H. OCTOBER 2013
SCOTT AVE
WOODSLEE AVE
GR
AN
D R
IV
ER
S
T N
SILVER ST
AY
R R
D
OA
K A
VE
WEST RIVER RD S
P
A
R
K
L
I
N
K
S
R
D
W
I
L
L
O
W
S
T
GR
EE
N LIN
E
C
O
N
S
O
L
I
D
A
T
E
D
D
R
DUNDAS ST E
W
I
L
L
O
W
S
T
K
I
N
G
E
D
W
A
R
D
S
T
RE
ST
A
CR
ES
R
D
P
A
R
I
S
R
D
GOVERNORS RD W
G
R
A
N
D
R
IV
E
R
S
T
N
C
A
P
R
O
N
S
T
T
E
R
R
I
V
E
R
V
I
E
W
W
R
IV
E
R
S
T
B
R
O
A
D
W
A
Y
S
T
W
CLE
AV
ER
R
D
W
AS
H
IN
G
TO
N
S
T
R
A
C
E
S
T
C
U
R
T
IS
A
V
E
S
SITE

GolfNorth Properties 4 Functional Servicing and Preliminary Stormwater Management Report March 2015
R.J. Burnside & Associates Limited PGD020165 020165 FSR Preliminary Report
3.0 Background Information
3.1 Additional Studies and Documentation
The current report has been prepared in accordance with, and consideration of the information and recommendations provided in the following documents:
County of Brant Development and Engineering Standards, May 2014; Stormwater Management Planning and Design Manual, Ministry of Environment
(MOE), March 2003; Paris Grand Draft Plan of Subdivision and Zoning By-law Amendment - Planning
Justification Report, GSP Group Inc., November 2013; Paris Grand Country Club Environmental Impact Study, Natural Resources Solutions
Inc. (NRSI), January 2013; Response to GRCA Comments on Environmental Impact Study, Natural Resources
Solutions Inc., October 2013; Paris Grand Golf and Country Club Environmental Impact Study - Addendum Report,
Natural Resources Solutions Inc. (NRSI), March 2015; Preliminary Geotechnical Investigation Report, LVM, June 2012; Hydrogeology Study Report, LVM, March 2015 (with appended Water Balance and
Hydrological Impact Assessment Study, Stantec, March 2015); Analysis of Proposed Access Locations, Paradigm Transportation Solutions Limited,
June 2012; Paris on the Grand Residential Development TIS - Response to City of Brant
Comments, Paradigm Transportation Solutions Limited, September 2014; County of Brant Sanitary Sewer Hydraulic Design Sheets, 2012; Paris Grand Golf Club Development – Hydraulic Analysis and Field Testing,
AECOM, July 2013; Gilbert Creek Subwatershed Study, Planning and Engineering Initiatives Ltd.,
November 1999; and Design Brief - Paris Links Road SWM Facility, Totten Sims Hubicki, August 2007.
3.2 Development Concept
The development proposal includes a mix of low and medium density residential units. Figure 2 - Land Use Concept Plan on the following page is based on the current Draft Plan provided by GSP Group (January 2015). The plan indicates the areas for proposed residential lots, park dedications, Stormwater Management Blocks, Open Space dedications and buffers associated with environmental features on the property. The Plan includes residential areas designated at the block level as low and medium density residential; this has been previously discussed with County Planning and is considered acceptable for this submission.
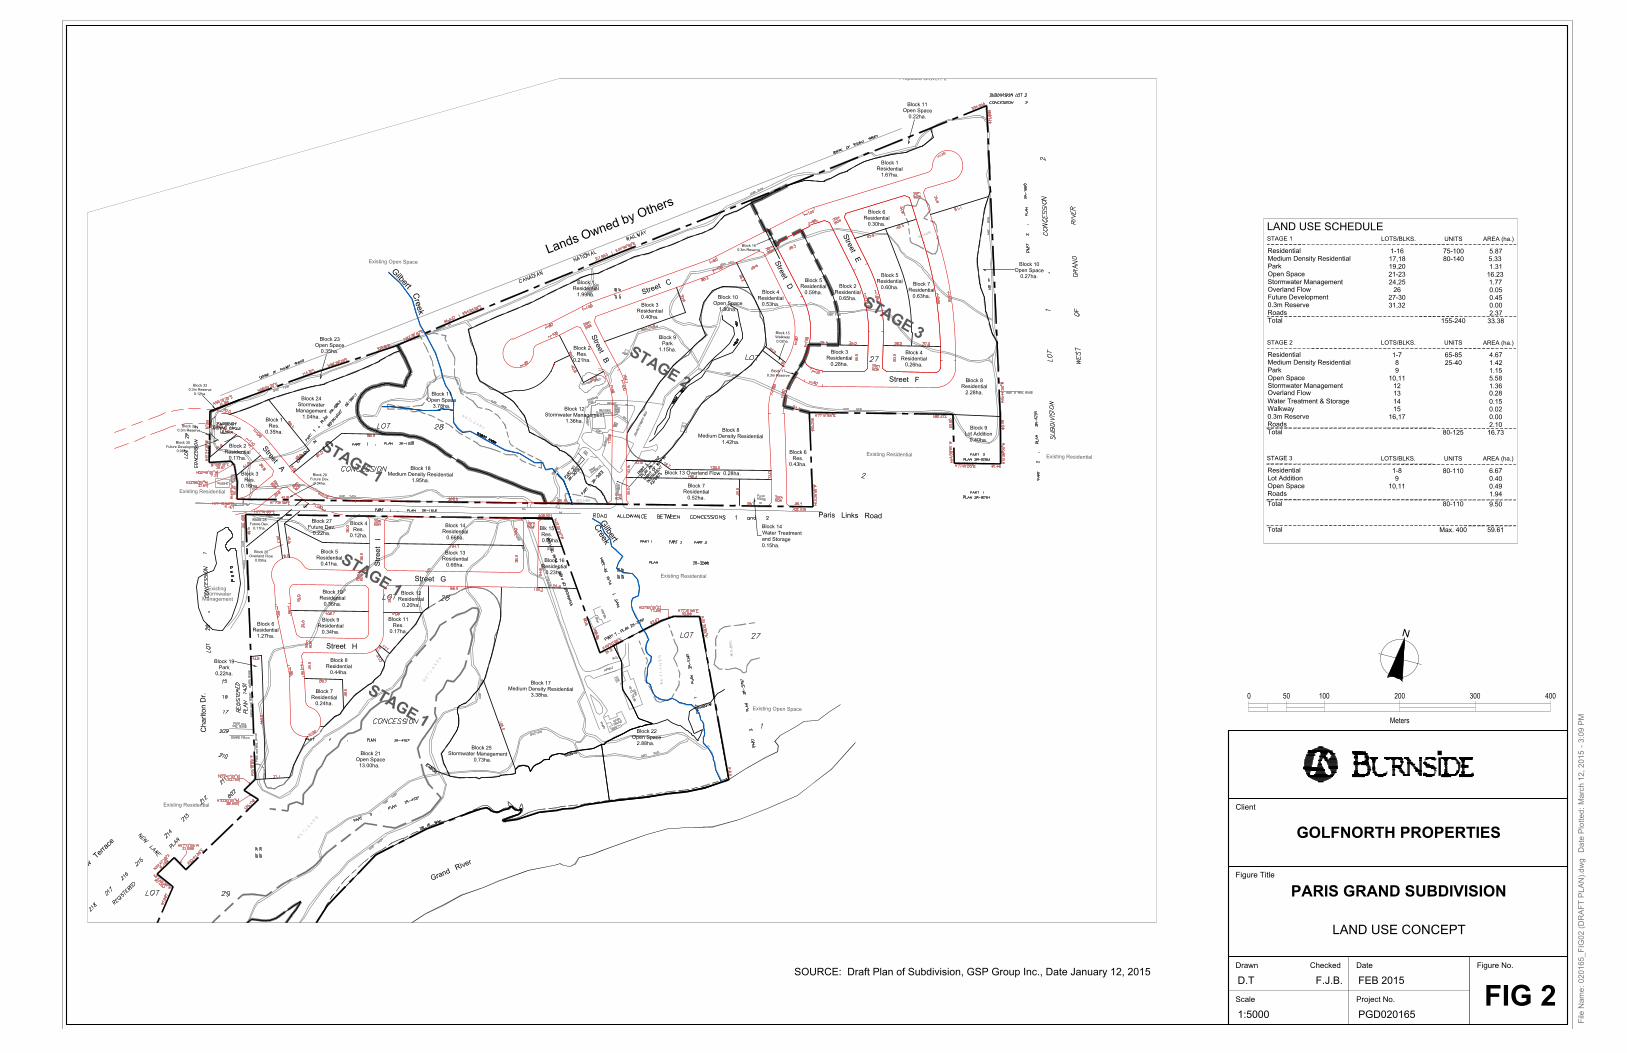
LAND USE SCHEDULE
LOTS/BLKS. UNITS
5.33
STAGE 1AREA (ha.)
1.31
0.05
16.23
2.37
Stormwater Management
Residential
Medium Density Residential
Park
Roads
Open Space
Overland Flow
0.3m Reserve
Total
1-16
17,18
19,20
31,32
21-23
80-140
24,25
26
1.77
75-100
155-240
5.87
0.00
33.38
27-30Future Development
0.45
Total59.61
LOTS/BLKS.
1.15
AREA (ha.)UNITS
0.15
Residential
1.42
STAGE 2
Open Space
2.10Roads
Medium Density Residential
Total
Park
Water Treatment & Storage
0.3m Reserve
25-40
1-7
9
8
14
0.00
0.40
Total
Stormwater Management
Max. 400
65-85
5.58
1.3612
9.50
80-1101-8
15
16,17
4.67
10,11
0.49
80-125
6.67
AREA (ha.)UNITS
Walkway
LOTS/BLKS.
10,11
0.02
STAGE 3
16.73
Roads
Residential
9
Open Space
1.94
Lot Addition
80-110
0.28Overland Flow
13
G
r
a
n
d
R
i
v
e
r
Street H
Block 10
Residential
Res.
Block 9
Residential
Residential
0.44ha.
Block 7
Residential
1.27ha.
Residential
0.35ha.
0.16ha.
Residential
Res.
Block 1
1.99ha.
Residential
0.40ha.
Residential
0.60ha.
Residential
Block 7
Block 17
0.52ha.
Block 6
Res.
0.43ha.
Block 8
Block 24
Block 18
1.95ha.
0.27ha.
1.42ha.
Block 10
R
i
v
e
r
v
i
e
w
T
e
r
r
a
c
e
Paris Links Road
Open Space
Charlton D
r.
S
t
r
e
e
t
B
S
t
r
e
e
t
A
S
t
r
e
e
t
C
13.00ha.
S
t
r
e
e
t
D
Open Space
S
t
r
e
e
t
E
Street F
Street G
Open Space
Street I
G
i
l
b
e
r
t
C
r
e
e
k
G
i
l
b
e
r
t
C
r
e
e
k
Existing Residential
Block 16
L
a
n
d
s
O
w
n
e
d
b
y
O
t
h
e
r
s
Block 14
Residential
0.66ha.
Block 13
Residential
0.66ha.
Block 10
Residential
0.36ha.
0.34ha.
Block 8
0.24ha.
Residential
Block 6
Residential
Block 2
0.17ha.
Block 3
2.28ha.
Block 1
Block 8
Block 3
Block 7
Residential
0.59ha.
Block 5
Block 2
Block 5
Block 4
0.65ha.
0.28ha.
Block 3
Block 9
Residential
0.63ha.
Residential
1.36ha.
Medium Density Residential
0.26ha.
Lot Addition
Park
0.40ha.
Stormwater Management
Block 21
Residential
0.73ha.
Block 12
3.38ha.
1.15ha.
Block 9
Management
Block 25
Stormwater Management
1.04ha.
Stormwater
Medium Density Residential
0.22ha.
Medium Density Residential
Open Space
1.80ha.
Existing Residential
Existing Residential
Existing
Proposed Gravel Pit
Block 11
Residential
Block 6
0.23ha.
Stormwater
Existing Residential
Existing Residential
0.09ha.
0.53ha.
Existing Open Space
Management
Existing Open Space
Res.
Residential
Block 4
0.30ha.
Residential
Blk 15
Walkway
0.02ha.
Block 15
Block 14
Water Treatment
and Storage
0.15ha.
2.88ha.
Block 22
Open Space
S
T
A
G
E
3
S
T
A
G
E
2
S
T
A
G
E
1
S
T
A
G
E
1
Block 2
0.21ha.
Block 27
Residential
0.41ha.
Residential
Block 12
Res.
Block 11
0.04ha.
Block 11
3.78ha.
Open Space
Block 17
0.3m Reserve
0.3m Reserve
Open Space
Block 23
Res.
0.35ha.
Future Dev.
0.20ha.
0.22ha.
Block 5
0.17ha.
Block 29
Future Dev.
Block 30
0.08ha.
Future Development
Block 26
Overland Flow
0.05ha.
Block 28
Future Dev.
0.11ha.
0.12ha.
Res.
Block 4
Block 32
0.3m Reserve
0.12ha.
Block 31
0.3m Reserve
S
T
A
G
E
1
Block 1
1.67ha.
Residential
Block 16
Block 13 Overland Flow 0.28ha.
0 400100
Meters
200 30050
N
File
N
am
e: 0
20
16
5_
FIG
02
(D
RA
FT
P
LA
N).d
wg
D
ate
P
lo
tte
d: M
arch
1
2, 2
01
5 - 3
:0
9 P
M
Scale Project No.
Figure No.
Figure Title
Drawn
Client
Checked Date
GOLFNORTH PROPERTIES
PARIS GRAND SUBDIVISION
LAND USE CONCEPT
D.T
1:5000 PGD020165
FIG 2
FEB 2015F.J.B.
SOURCE: Draft Plan of Subdivision, GSP Group Inc., Date January 12, 2015

GolfNorth Properties 6 Functional Servicing and Preliminary Stormwater Management Report March 2015
R.J. Burnside & Associates Limited PGD020165 020165 FSR Preliminary Report
The Concept Plan allows for some flexibility in densities and lot types, with a proposed maximum of 400 units. For the purpose of the analysis provided in this Report, the maximum number of units is assumed, with a split of 300 single residential and 100 medium density units.
The resulting unit breakdown is provided as Table 1 below, along with projected population based on the County’s ‘person per unit’ sanitary and water demand design criteria.
Table 1: Preliminary Unit Counts and Populations
Type No. of Units
Person/Unit
Population
Singles 300 2.89 867 Medium Density (Townhomes) 100 1.94 194 Total 400 - 1,061
3.3 Existing Site Conditions
3.3.1 Topography
Figure 3 - ‘Existing Site Conditions Plan’ (included at the back of this document) includes information from a topographical survey carried out in 2011. There is significant relief across the site, with several localized drainage divides and areas where drainage collects from multiple directions before outletting at the point of lowest relief. Existing drainage patterns and drainage catchments are indicated on Figure 5 - ‘Pre-Development Storm Drainage Plan’.
Additional discussion on the existing drainage conditions is provided in Section 5.2 of this Report.
3.3.2 Soil Conditions
LVM Inc. has provided data from twenty boreholes advanced on the site during July and August of 2011 (Preliminary Geotechnical Investigation Report, June 2012). Excerpts of the borehole data are included in Appendix A of this Report.
The boreholes were drilled to depths ranging from 1.5 to 13.5 metres and the data was used to characterize the in-situ subsoils and groundwater conditions.
The information provided by LVM indicates some variance in soil stratigraphy. However, in general over the areas to be developed (i.e. outside of areas adjacent to or within wetlands), topsoil is underlain directly by fine to coarse granular deposits of sands and gravels, with underlying silt or clay tills at depth. The thickness of the granular layer was

GolfNorth Properties 7 Functional Servicing and Preliminary Stormwater Management Report March 2015
R.J. Burnside & Associates Limited PGD020165 020165 FSR Preliminary Report
found to vary considerably. In the northwest area of the property thin layers of silt and peat were found above the granular layer.
The Geotechnical Report also identified potential ‘slope hazard’ areas along the top of bank at the Grand River and Gilbert Creek. Hazard areas are regulated by the Grand River Conservation Authority, including stipulations for erosion setback, stable slope setback, and access setback. Appropriate setbacks have been incorporated on the Draft Plan. Stormwater pond outlets will be designed to mitigate erosion and ensure there will be no adverse effects on the slopes.
3.3.3 Groundwater Conditions
Groundwater levels were recorded at the twenty borehole locations and at an additional ten piezometer locations at the creek and in the wetland areas. The initial set of readings was taken in August 2011 and follow up monitoring to obtain a full year of data has now been completed and is included in the report titled Water Balance and Hydrological Impact Assessment Study prepared by Stantec and included in the LVM Hydrogeology Study Report submitted concurrently with this application.
Observed groundwater levels at the monitoring locations typically ranged from between 3.0 to 11.5 meters below ground surface. Exceptions were noted at Boreholes 3 and 16 with groundwater in proximity to the surface elevations. Borehole 3 is located at the watercourse and Borehole 16 is within a wetland feature at the southwestern portion of the property. These locations are outside the area proposed for development. Shallow groundwater depths of 1.0 to 1.3 meters below ground surface were also observed at Boreholes 9 and 10, within the low area near the northeast site limit.
As discussed in the LVM Report, water levels recorded in areas adjacent to the wetlands indicate periodic discharging conditions and support the conclusion that the wetlands located on the banks of Gilbert Creek are connected to and supported by groundwater.

GolfNorth Properties 8 Functional Servicing and Preliminary Stormwater Management Report March 2015
R.J. Burnside & Associates Limited PGD020165 020165 FSR Preliminary Report
4.0 County of Brant Servicing Master Plan
The County of Brant is currently undertaking a Master Servicing Study (PMSP) in order to address wastewater collection and water distribution, stormwater management and traffic for the Paris community. The Study will present preferred strategies to service lands within the urban boundary through 2031. The County has confirmed that the Paris Grand development would be given consideration as a ‘Future Growth Area’ within the 2031 planning horizon in the PMSP.
At the time of this Study, the PMSP has not been completed and the revised timeframe for public presentation is unknown. Some preliminary material relating to the overall servicing scheme has been made available to the proponent in the interim.
As the Master Servicing Study is advanced, GolfNorth will participate in the review of the Study as a full stakeholder, as the final findings and recommendations will factor significantly into the ultimate servicing approach for the GolfNorth lands, particularly with regard to the sanitary and water servicing.

GolfNorth Properties 9 Functional Servicing and Preliminary Stormwater Management Report March 2015
R.J. Burnside & Associates Limited PGD020165 020165 FSR Preliminary Report
5.0 Grading and Storm Drainage
5.1 Site Grading
The conceptual site grading design provided in this report takes into consideration the following requirements and constraints:
Conformance to the County’s grading and drainage criteria; Matching of existing boundary grades at the development limits; Optimization of required earthworks; Provision for adequate cover on proposed services; and, Provision for overland flow conveyance on the roadways to the proposed stormwater
facilities (i.e., major system storm drainage and emergency overland flow).
The grading has been designed to generally follow the existing topography with the intent of matching pre- and post-development drainage patterns to the extent possible and minimizing the amount of earthworks required during development. The proposed road grades indicated on Figure 4 - Conceptual Grading Plan (included at the back of this Study) fall within the range of 0.5% to 8.0% and therefore meet the County’s criteria.
The road grades allow for overland flow conveyance on the future right-of-ways in order to direct major system storm drainage to the future stormwater facility locations.
5.2 Existing Storm Drainage
Figure 5 (Pre-Development Storm Drainage Plan, included at the back of this report) provides an overview of the existing drainage patterns and catchment boundaries over the site.
For the Study Area west of Gilbert Creek:
Approximately 7.9 ha of the western portion of the property (including areas south and north of Paris Links Road) currently drain in a north-easterly direction toward Gilbert Creek. There is a limited area along the west property boundary that drains toward the existing Paris Links Road stormwater management (SWM) facility;
Approximately 6.3 ha of area south of Paris Links Road drains toward the wetland feature in the southwest portion of the property;
The balance of the area south of Paris Links Road drains either southerly toward the Grand River, or easterly toward Gilbert Creek, as delineated on Figure 5.
For the Study Area east of Gilbert Creek:
Approximately 12.4 ha of area drains directly to Gilbert Creek or toward an internal watercourse feature which outlets at the creek;
GolfNorth Properties 10 Functional Servicing and Preliminary Stormwater Management Report March 2015
R.J. Burnside & Associates Limited PGD020165 020165 FSR Preliminary Report
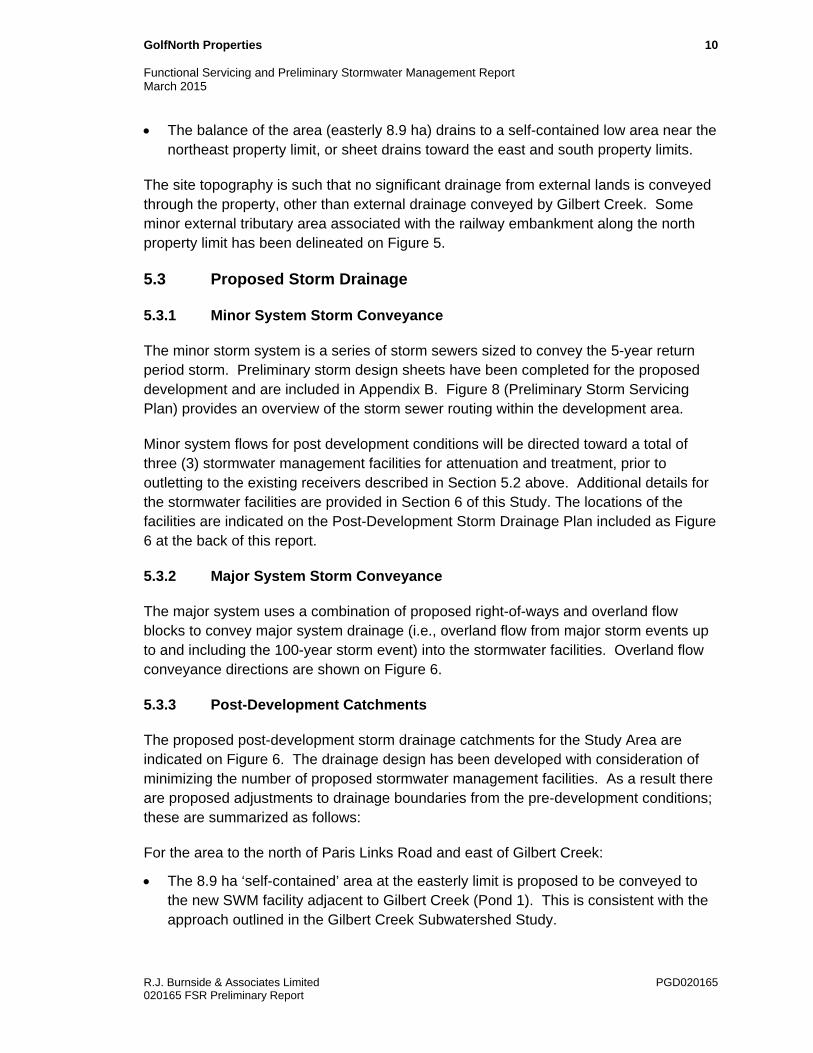
The balance of the area (easterly 8.9 ha) drains to a self-contained low area near the northeast property limit, or sheet drains toward the east and south property limits.
The site topography is such that no significant drainage from external lands is conveyed through the property, other than external drainage conveyed by Gilbert Creek. Some minor external tributary area associated with the railway embankment along the north property limit has been delineated on Figure 5.
5.3 Proposed Storm Drainage
5.3.1 Minor System Storm Conveyance
The minor storm system is a series of storm sewers sized to convey the 5-year return period storm. Preliminary storm design sheets have been completed for the proposed development and are included in Appendix B. Figure 8 (Preliminary Storm Servicing Plan) provides an overview of the storm sewer routing within the development area.
Minor system flows for post development conditions will be directed toward a total of three (3) stormwater management facilities for attenuation and treatment, prior to outletting to the existing receivers described in Section 5.2 above. Additional details for the stormwater facilities are provided in Section 6 of this Study. The locations of the facilities are indicated on the Post-Development Storm Drainage Plan included as Figure 6 at the back of this report.
5.3.2 Major System Storm Conveyance
The major system uses a combination of proposed right-of-ways and overland flow blocks to convey major system drainage (i.e., overland flow from major storm events up to and including the 100-year storm event) into the stormwater facilities. Overland flow conveyance directions are shown on Figure 6.
5.3.3 Post-Development Catchments
The proposed post-development storm drainage catchments for the Study Area are indicated on Figure 6. The drainage design has been developed with consideration of minimizing the number of proposed stormwater management facilities. As a result there are proposed adjustments to drainage boundaries from the pre-development conditions; these are summarized as follows:
For the area to the north of Paris Links Road and east of Gilbert Creek:
The 8.9 ha ‘self-contained’ area at the easterly limit is proposed to be conveyed to the new SWM facility adjacent to Gilbert Creek (Pond 1). This is consistent with the approach outlined in the Gilbert Creek Subwatershed Study.

GolfNorth Properties 11 Functional Servicing and Preliminary Stormwater Management Report March 2015
R.J. Burnside & Associates Limited PGD020165 020165 FSR Preliminary Report
For areas south of Paris Links Road:
An additional area of approximately 4.5 ha west of the central wetland area is proposed to be diverted north across Paris Links Road to the proposed stormwater facility in the northwest portion of the site (Pond 3). This will preclude the requirement for one additional SWM facility south of Paris Links Road;
All the development area to the east of the central wetland (approximately 3.9 ha) is proposed to be conveyed to the proposed SWM facility adjacent to the wetland (Pond 2). As a result, the overall catchment area draining to the proposed SWM pond/storm outlet will remain approximately equivalent to pre-development.
The increases in tributary drainage areas to the ponds have been fully considered in the preliminary design of the respective stormwater facilities. For both ponds, the design for post-development controls fully considers pre-development release rates based on drainage from existing (pre-development) areas. Further details are provided in Section 6 of this Report.

GolfNorth Properties 12 Functional Servicing and Preliminary Stormwater Management Report March 2015
R.J. Burnside & Associates Limited PGD020165 020165 FSR Preliminary Report
6.0 Stormwater Management
Stormwater management practices are planning and technical measures which will be implemented to manage the quality and quantity of urban runoff. The Ministry of Environment has developed guidelines for the quality control of stormwater runoff from proposed developments (Stormwater Management Planning and Design Manual, Ministry of Environment, MOE, March 2003). The proposed stormwater facilities for the development will be designed in accordance with the recommendations and criteria outlined in the MOE manual. Recommendations from the Gilbert Creek Subwatershed Study will also be incorporated into the overall stormwater management design for the development.
6.1 Environmental Constraints
6.1.1 Environmental and Natural Heritage Features
The Natural Resources Solutions Inc. (NRSI) Opportunities and Constraints Report recommended buffers to protect the identified natural features within or adjacent to the property. Associated setbacks from environmental features include:
10 m buffer from the drip line at woodlands; 30 m buffer from Gilbert Creek and its tributaries; 30 m setbacks from wetlands, including the Gilbert Creek wetland complex; and, 30 m setback from the Grand River.
The NRSI Report also recommends that an appropriate stormwater management and erosion control plan be developed in conjunction with the development application.
The constraints and buffers have been identified and incorporated on the current Draft Plan. Site grading, including construction of proposed stormwater facilities or other disturbance related to construction activity is not proposed to occur in these areas, with the following exceptions:
Localized grading for stormwater facility outfalls; and Construction of access for a stormwater pond located in the south west portion of the
plan (Pond 2). During consultation with the County, it was suggested that an existing golf cart pathway could be upgraded for this use, as it would eliminate the need for County access through a future medium density condominium block.
6.1.2 Gilbert Creek Flood LInes
The Gilbert Creek Subwatershed Study (SWS) included hydraulic modelling for the Gilbert Creek watercourse. The elevations provided on Map 5 of the SWS have been used to plot the 100-year and Regulatory floodlines based on elevations obtained from

GolfNorth Properties 13 Functional Servicing and Preliminary Stormwater Management Report March 2015
R.J. Burnside & Associates Limited PGD020165 020165 FSR Preliminary Report
topographical survey and the plotted floodlines are included on the grading and storm drainage figures provided in this Study.
The Regulatory floodline elevation of 230.0 metres for the Grand River has also been plotted on the drawings. The proposed development limits are outside the area defined by the floodlines.
The normal water level and proposed outlets for all three proposed stormwater facilities are above the 100-year flood elevations and the pond functionality will therefore not be impacted up to this storm event.
6.2 Gilbert Creek Erosion Criteria
6.2.1 Gilbert Creek Subwatershed Study Erosion Criteria
The Gilbert Creek SWS included Erosion Modelling using a GAWSER model for both the existing conditions of the watershed as well as a proposed future development scenario. The Erosion modelling included assumptions for future development on the GolfNorth lands between the former railway and Paris Links Road and accounted for areas draining to Gilbert Creek as follows:
1. 49 ha of existing developed area to the west of the GolfNorth property (model catchment 406);
2. 8 ha of undeveloped area, including the creek and wetlands (model catchment 4051);
3. 26 ha of future development (model catchment 4052), with an assumed imperviousness of 35%.
An additional area on the easterly portion of the Paris Grand lands that does not currently drain to the Gilbert Creek was also included in the Gilbert Creek modelling for assumed post-development conditions. The area was noted as ‘Future Potential Diversion Area’ to the east of Catchment 405 on Figure C2.7 in Section C2.5.2 of the Report
The proposed drainage from the combination of catchments 4051 and 4052 was assumed to discharge to Gilbert Creek following attenuation in a stormwater management facility.
The future development imperviousness of 35% that was applied in the original SWS modelling is low in comparison to typical developed conditions. Under the proposed development scenario for Paris Grand, it is expected that imperviousness will be higher than the original SWS model. The proposed stormwater management plan for the site

GolfNorth Properties 14 Functional Servicing and Preliminary Stormwater Management Report March 2015
R.J. Burnside & Associates Limited PGD020165 020165 FSR Preliminary Report
will incorporate measures to ensure that the erosion criteria for Gilbert Creek, as defined in the SWS, are met.
6.2.2 Previous Memo – Comparison of Runoff Volumes to Gilbert Creek SWS
Burnside prepared a memo to GRCA dated August 20, 2014 summarizing a proposed approach to mitigate potential increases in runoff to Gilbert Creek. A copy of the memo is included in Appendix C of this report. The memo highlighted the increases in capture area and post-development imperviousness with the currently proposed development. It was noted that runoff from the development would exceed the rates determined and approved in the SWS modelling if normal post- to pre- volumetric control were provided via SWM ponds. As a result, it was concluded that additional volumetric controls or diversion of flow would be required.
The memo provided a calculation of runoff volumes to Gilbert Creek under the proposed post-development land use scenario without mitigation. An approximation of runoff ‘unit rates’ was established using the 100-year runoff volumes identified in the “future development” GAWSER modelling output and associated input. The preliminary estimate of the volume reduction required is provided below as taken from the original memo:
Volumes per SWS Model with original assumptions for development a) Area 406 (development to the west): runoff 14.52 mm x49 ha = 7,115 m3 b) Area 4051 (assumed undeveloped per SWS): runoff 22.99 mm x 8 ha = 1,839 m3 Unit Rate: 1,839 m3 / 8 ha = 230 m3/ha c) Area 4052 (assumed developed per SWS @ 0.35 imp): runoff 59.9 mm x 26 ha = 15,574 m3 Unit Rate: 444 m3 / pervious ha* 887 m3 / impervious ha* Total to Gilbert Creek just above Paris Links Road: (a+b+c) = 24,528 m3 Total to Gilbert Creek from ‘assumed’ Paris Grand development: (b+c) = 17,413 m3 Volumes estimated per current development proposal through application of Unit Rates d) Area 406 (same as above) = 7,115 m3 e) Undeveloped area: 3.2 ha x 230 m3/ha = 736 m3 f) Developed area: 32.7 x (444 x 0.43 + 887 x 0.57) = 22,774 m3 Total to Gilbert Creek from Paris Grand: (e+f) = 23,510 m3
Reduction in proposed runoff volume required to meet original SWS volumes = 6,097 m3
*Unit Rate derived using SCS method
The memo included preliminary calculations indicating that diversion of rooftop areas within the catchments discharging to Gilbert Creek would generate greater than the required diversion volume in the 100 year storm event, as follows:
GolfNorth Properties 15 Functional Servicing and Preliminary Stormwater Management Report March 2015
R.J. Burnside & Associates Limited PGD020165 020165 FSR Preliminary Report
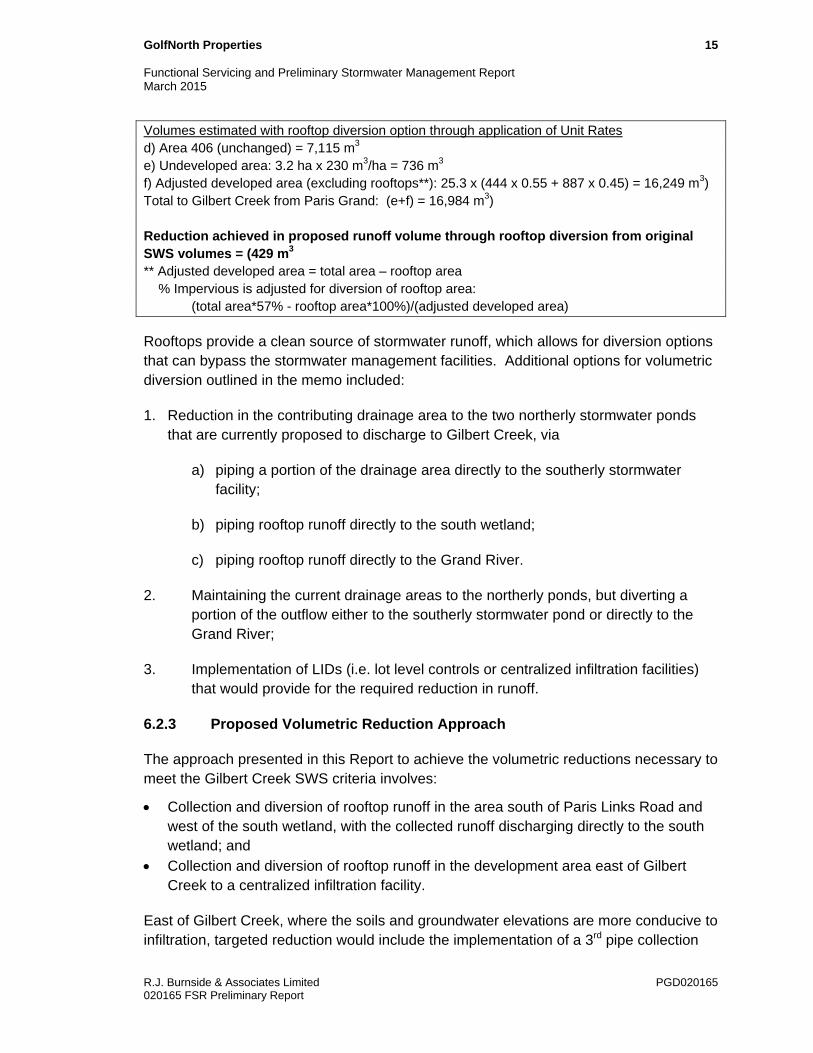
Volumes estimated with rooftop diversion option through application of Unit Rates d) Area 406 (unchanged) = 7,115 m3 e) Undeveloped area: 3.2 ha x 230 m3/ha = 736 m3 f) Adjusted developed area (excluding rooftops**): 25.3 x (444 x 0.55 + 887 x 0.45) = 16,249 m3) Total to Gilbert Creek from Paris Grand: (e+f) = 16,984 m3)
Reduction achieved in proposed runoff volume through rooftop diversion from original SWS volumes = (429 m3
** Adjusted developed area = total area – rooftop area % Impervious is adjusted for diversion of rooftop area:
(total area*57% - rooftop area*100%)/(adjusted developed area)
Rooftops provide a clean source of stormwater runoff, which allows for diversion options that can bypass the stormwater management facilities. Additional options for volumetric diversion outlined in the memo included:
1. Reduction in the contributing drainage area to the two northerly stormwater ponds that are currently proposed to discharge to Gilbert Creek, via
a) piping a portion of the drainage area directly to the southerly stormwater facility;
b) piping rooftop runoff directly to the south wetland;
c) piping rooftop runoff directly to the Grand River.
2. Maintaining the current drainage areas to the northerly ponds, but diverting a portion of the outflow either to the southerly stormwater pond or directly to the Grand River;
3. Implementation of LIDs (i.e. lot level controls or centralized infiltration facilities) that would provide for the required reduction in runoff.
6.2.3 Proposed Volumetric Reduction Approach
The approach presented in this Report to achieve the volumetric reductions necessary to meet the Gilbert Creek SWS criteria involves:
Collection and diversion of rooftop runoff in the area south of Paris Links Road and west of the south wetland, with the collected runoff discharging directly to the south wetland; and
Collection and diversion of rooftop runoff in the development area east of Gilbert Creek to a centralized infiltration facility.
East of Gilbert Creek, where the soils and groundwater elevations are more conducive to infiltration, targeted reduction would include the implementation of a 3rd pipe collection

GolfNorth Properties 16 Functional Servicing and Preliminary Stormwater Management Report March 2015
R.J. Burnside & Associates Limited PGD020165 020165 FSR Preliminary Report
system and a centralized infiltration facility on Block 13 of the Draft Plan, sufficient to infiltrate the rooftop runoff from the catchment area.
On the west side of the creek the soils and groundwater elevations are limiting with respect to infiltration. To supplement the volumetric reductions on the east side of the creek, a portion of the rooftop areas west of Gilbert Creek would also be collected and diverted to the south wetland through a 3rd pipe rooftop collection system. This would not only achieve the required volume diversion but has the additional benefit of the maintenance of volumetric inputs to the existing wetland feature.
A review of the proposed diversion as it relates to wetland capacity has been completed by NRSI and it has been confirmed that the input of the diversion flow will have no adverse impacts to the existing wetland feature.
The environmental benefits of the approach outlined above include:
Maintenance of surface hydrology to the creek (pond outflows to Gilbert Creek north of Paris Links Road);
Maintenance of water source to the wetland (direct rooftop discharge west side of Gilbert Creek south of Paris Links Road);
Promotion of infiltration and subsurface cooling of rooftop runoff through infiltration measures, and
Increased post-development infiltration to augment site water balance.
6.2.4 LVM/Stantec Water Balance Update
The Water Balance and Hydrological Impact Assessment Study prepared by Stantec (included in the LVM Hydrogeology Study Report) includes catchment based PCSWMM modelling that establishes runoff and infiltration volumes for the pre- and post-development site conditions. The LVM and Stantec reports also include discussion of infiltration potential and the Stantec Report includes mapping illustrating post-development infiltration potential over the property.
The Stantec modelling was used to refine the volumetric reductions required to meet the targets for reduction in runoff to Gilbert Creek, i.e. capture and diversion of the rooftop areas was accounted for in the modelling. Additional discussion on the proposal for flow diversion and infiltration is provided in Section 6.4 of this Report.
6.2.5 Stormwater Management Design Implications
The proposed approach for volume diversion noted above will have implications to the overall servicing and stormwater management design of the site as follows:
For SWM Pond 1 (east of Gilbert Creek):

GolfNorth Properties 17 Functional Servicing and Preliminary Stormwater Management Report March 2015
R.J. Burnside & Associates Limited PGD020165 020165 FSR Preliminary Report
For areas east of Gilbert Creek, a rooftop runoff collection system (3rd pipe) will be required to convey the 100 year design flow from the rooftops to a proposed centralized infiltration bed (located on Block 13 of the Draft Plan);
A centralized infiltration system will be required on Block 13 with capacity to infiltrate the volume from the proposed rooftops;
Storm sewer drainage areas and associated pipe size can be reduced on the basis of the redirection of the rooftop runoff into the 3rd pipe system; and
The stormwater management facility will have reduced inflow and consequently, reduced pond volumes will be required to achieve volumetric controls.
For SWM Pond 3 (west of Gilbert Creek):
For areas south of Paris Links Road tributary to Pond 3, a rooftop runoff collection pipe will be sized to convey the 100 year design flow from the rooftops to the south wetland;
Areas north of the Paris Links Road will not require diversion as rooftop diversions in Pond 1 catchment and south of Paris Links Road will achieve the overall targeted runoff reductions;
Storm sewer drainage area and conveyance pipe sizing will be reduced on the basis of the redirection of the rooftop runoff to infiltration to the south wetland; and
The stormwater management facility will have reduced inflow and consequently, reduced pond volumes will be required to achieve volumetric controls.
Additional details for the proposed flow diversion and infiltration feature is provided in Section 6.4 of this Report.
6.3 Stormwater Management Facility Design
The design concepts presented in the following sections address the recommendations provided in the Gilbert Creek SWS and incorporate design criteria per the current MOE Stormwater Planning and Design Manual.
6.3.1 Design Approach
The conceptual SWM management facility designs reflect the MOE criteria for conventional ‘wet pond’ design, as follows: 5:1 side slopes for 3 m on either side of permanent pool, 3:1 side slopes elsewhere; Retention of the 25 mm event for a minimum of 24 hours (Erosion Control); Forebay with berm containment to trap larger particulates and improve removal
performance; Adequate flow path (length to width) ratios; Maintenance access to sediment forebay and outlet structure areas; Volumetric storage to accommodate quantity control requirements;
GolfNorth Properties 18 Functional Servicing and Preliminary Stormwater Management Report March 2015
R.J. Burnside & Associates Limited PGD020165 020165 FSR Preliminary Report
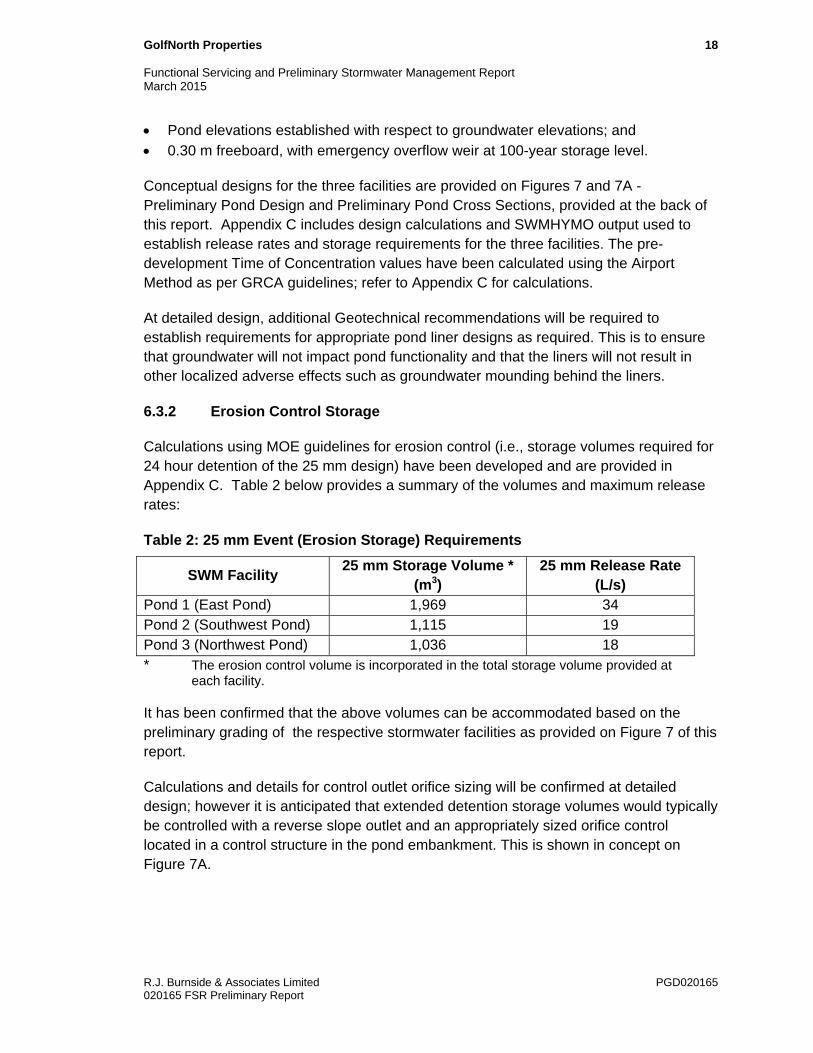
Pond elevations established with respect to groundwater elevations; and 0.30 m freeboard, with emergency overflow weir at 100-year storage level.
Conceptual designs for the three facilities are provided on Figures 7 and 7A - Preliminary Pond Design and Preliminary Pond Cross Sections, provided at the back of this report. Appendix C includes design calculations and SWMHYMO output used to establish release rates and storage requirements for the three facilities. The pre-development Time of Concentration values have been calculated using the Airport Method as per GRCA guidelines; refer to Appendix C for calculations.
At detailed design, additional Geotechnical recommendations will be required to establish requirements for appropriate pond liner designs as required. This is to ensure that groundwater will not impact pond functionality and that the liners will not result in other localized adverse effects such as groundwater mounding behind the liners.
6.3.2 Erosion Control Storage
Calculations using MOE guidelines for erosion control (i.e., storage volumes required for 24 hour detention of the 25 mm design) have been developed and are provided in Appendix C. Table 2 below provides a summary of the volumes and maximum release rates:
Table 2: 25 mm Event (Erosion Storage) Requirements
SWM Facility 25 mm Storage Volume *
(m3) 25 mm Release Rate
(L/s) Pond 1 (East Pond) 1,969 34 Pond 2 (Southwest Pond) 1,115 19 Pond 3 (Northwest Pond) 1,036 18 * The erosion control volume is incorporated in the total storage volume provided at
each facility.
It has been confirmed that the above volumes can be accommodated based on the preliminary grading of the respective stormwater facilities as provided on Figure 7 of this report.
Calculations and details for control outlet orifice sizing will be confirmed at detailed design; however it is anticipated that extended detention storage volumes would typically be controlled with a reverse slope outlet and an appropriately sized orifice control located in a control structure in the pond embankment. This is shown in concept on Figure 7A.
GolfNorth Properties 19 Functional Servicing and Preliminary Stormwater Management Report March 2015
R.J. Burnside & Associates Limited PGD020165 020165 FSR Preliminary Report
6.3.3 Quantity Control Criteria
Section C2.7 of the Gilbert Creek Subwatershed Study (SWS) provides the following recommended quantity control criteria for new development:
Control of post-development flows to pre-development levels for the 2- year through 100-year design storm events;
Maximize infiltration rates at source to maintain groundwater recharge and base flow to Gilbert Creek;
Maintain function of wetlands as these provide for additional runoff attenuation; and Minimize external areas diverted into the watershed.
In addition to the above, consideration of runoff volumes to Gilbert Creek is required to meet the objectives identified in the SWS as discussed in Section 6.2 above.
6.3.3.1 Pond 1 (East Pond) – Quantity Control Design
Based on the concept grading, the post-development drainage area to Pond 1 (east of Gilbert Creek and north of Paris Links Road) has been established at 21.47 ha, with a further breakdown by area coverage as follows:
18.51 ha low and medium density residential; 1.25 ha external area (undeveloped); and, 1.71 ha pond block.
With the incorporation of the rooftop diversion identified for this catchment, the overall area draining towards the SWM facility will be reduced. Accordingly, the modelled area for Pond 1 (east of Gilbert Creek) is 17.12 ha. This is based on the approximation of rooftop coverage being 25% of the low and medium density residential development area, consistent with the approach used in Stantec’s water balance modelling and the diversion applying to the catchment area that is internal to the Draft Plan.
SWMHYMO modelling was used to establish the allowable release rates within the development and the amount of storage that is required to meet these release rates.
In accordance with the approach recommended in the Gilbert Creek SWS, Pond 1 has been designed to include the easterly area (approximately 9.5 ha) within the Study Area that currently does not drain directly into Gilbert Creek. This area currently drains to an area of low topography that has no defined outlet.
Two scenarios were evaluated in order to determine the most conservative approach for stormwater storage design. Note that these scenarios were assessed without the inclusion of the diversion of rooftop flow:

GolfNorth Properties 20 Functional Servicing and Preliminary Stormwater Management Report March 2015
R.J. Burnside & Associates Limited PGD020165 020165 FSR Preliminary Report
Scenario 1 used the formula provided in the SWS to estimate the additional storage volume requirement due to the easterly area noted above. The following calculation was completed:
Volume required per hectare = 8.333 x I + 307.333 I = % impervious = 0.57 for the area East of Gilbert Creek V = 312 m³/ha V in m³ = 312 m³/ha x 9.525 ha V = 2972 m³
Scenario 2 incorporated the additional area into the SWMHYMO modelling, with
allowable release rates to Gilbert Creek remaining equivalent to those in Scenario 1.
Table 3 below summarizes results from both modelling scenarios for Pond 1:
Table 3: Storage Volume Alternatives for Pond 1 (100-year Design Event, SCS 24 Hour)
Alternative SWMHYMO
Pond 1 Volume (m³)
Additional Volume Calculated by SWS Storage Formula
Total Volume Required (m³)
Pre- to Post-Control with additional storage using Gilbert Creek SWS formula
4100 2972 7072
Pre- to Post- with Full Development Area modeled using SWMHYMO
9968 (not applicable) 9968
The alternative of designing Pond 1 storage based on Scenario 2 (i.e., post- to pre- control using the entire development area vs. use of the Gilbert Creek SWS formula approach) is therefore selected as it is more conservative.
It is noted that modelling included the 3 hour Chicago and the 24 hour SCS Type II distributions and the more conservative results were used for preliminary pond design. The SCS Type II distribution resulted in a 100 year storage requirement of 9,715m3 vs. the 3 hour Chicago volume of 9,968m3. All modelling has been documented in Appendix C.
Incorporating the diversion of the rooftop runoff, for all storms up to and including the 100 year event results in a reduction of the pond volume requirements. The table below identifies the comparison of parameters and calculated 100 year pond volume with and without the diversion.

GolfNorth Properties 21 Functional Servicing and Preliminary Stormwater Management Report March 2015
R.J. Burnside & Associates Limited PGD020165 020165 FSR Preliminary Report
Table 4: Diversion Comparison for Pond 1 (100-year Design Event, SCS 24 Hour
Modelled Scenario Catchment Area
(ha) Impervious
(%) Storage Volume
(m³) Original (no diversion) 21.47 57% 9968 Updated (with diversion) 17.12 46% 7019
For post- to pre- control, under the diversion scenario, the volume requirements for Pond 1 are presented as Table 5 below:
Table 5: Pond 1-3 Hour Chicago SWMHYMO Modelling Outputs
Event Pre-Development
Flow (m3/s) Post-Development
Flow (m3/s) Active Storage
Volume Required (m³)2 0.116 0.115 2271 5 0.234 0.233 3330
10 0.335 0.332 4127 25 0.479 0.479 5195
100 0.748 0.707 7019
Preliminary grading of Pond 1 shows an available active storage volume of 7,363 m³.
The Gilbert Creek 100-year flood elevation in the vicinity of the outlet of the pond is approximately 236.45 m. The proposed normal water elevation in the pond is 236.80 m and therefore the 100-year flood levels at Gilbert Creek will not impact the pond function.
6.3.3.2 Pond 2 (South Pond) – Quantity Control Design
Based on the concept grading, the post-development drainage area to Pond 2 (south of Paris Links Road, adjacent to the wetland) has been established at 6.37 ha, with additional breakdown by area coverage as follows:
5.30 ha low and medium density residential; 0.69 ha pond block; and, 0.38 ha external area (developed).
Pond 2 will require control of post development flows to pre development levels for each design storm. SWMHYMO was used to establish the allowable release rates within the development and the storage that is required to meet these release rates. Modelling was completed using both the 3 hour Chicago and the 24 hour SCS Type II distributions and the more conservative result was used for preliminary pond design. The SCS Type II distribution resulted in a 100 year storage requirement of 2,771 m3 vs. the 3 hour Chicago volume of 2,928 m3. All modelling has been documented in Appendix C.
The volume requirements for Pond 2 for are presented as Table 6 below:

GolfNorth Properties 22 Functional Servicing and Preliminary Stormwater Management Report March 2015
R.J. Burnside & Associates Limited PGD020165 020165 FSR Preliminary Report
Table 6: Pond 2 - 3 Hour Chicago SWMHYMO Modelling Outputs
Event Pre-Development
Flow (m3/s) Post-Development
Flow (m3/s) Active Storage
Volume Required (m³)2 0.077 0.051 1180 5 0.155 0.133 1525
10 0.225 0.195 1824 25 0.319 0.280 2225
100 0.499 0.386 2928
Preliminary grading of Pond 2 shows available active storage volume of 3791 m3. Pond 2 is sufficiently set back from both the Grand River and Gilbert Creek such that floodlines are not a concern.
6.3.3.3 Pond 3 (Northwest Pond) – Quantity Control Design
Based on the concept grading, the post-development drainage area to Pond 3 has been established at 11.23 ha, with additional breakdown by area coverage as follows:
9.46 ha low and medium density residential; 0.44 ha external area (developed); 0.48 ha external area (undeveloped); and, 0.85 ha pond block.
With the incorporation of the rooftop diversion identified for this catchment, the overall area draining towards the SWM facility will be reduced. Accordingly, the modelled area for Pond 3 (west of Gilbert Creek) is 9.01 ha. This is based on the approximation of rooftop coverage being 25% of the low and medium density residential development area, consistent with the approach used in Stantec’s water balance modelling and the diversion applying to the catchment area that is internal to the Draft Plan.
Pond 3 is located west of Gilbert Creek and north of Paris Links Road. This pond will require control of post development flows to pre development levels for each design storm. SWMHYMO was used to establish the allowable release rates within the development and the amount of storage that is required to meet these release rates.
The development area north of Paris Links Road is approximately 3.5 ha, which is less than the 5 ha MOE recommended drainage area required to maintain appropriate quality control function of a wet pond. The inclusion of additional tributary drainage area from south of Paris Links Road will ensure that this occurs. Storage volumes for Pond 3 have been calculated based on limiting the allowable post-development flows for the combined area to the pre-development level from the original (smaller) 3.5 ha drainage catchment.

GolfNorth Properties 23 Functional Servicing and Preliminary Stormwater Management Report March 2015
R.J. Burnside & Associates Limited PGD020165 020165 FSR Preliminary Report
The piped outlet for the existing SWM facility immediately west of the Draft Plan lands runs right on an easement that is partially within Pond 3 block. The existing sewer will be reconstructed along the new subdivision roadway and will bypass the new pond, to outlet with the new Pond 3 outlet. Further discussion is provided in Section 6.3.5 below.
Modelling, prior to incorporation of the diversion, was completed using both the 3 hour Chicago and the 24 hour SCS Type II distributions and the more conservative result was used for preliminary pond design. The SCS Type II distribution resulted in a 100 year storage requirement of 5,122 m3 vs. the 3 hour Chicago volume of 5,105 m3.
Incorporating the diversion of the rooftop runoff, for all storms up to and including the 100 year event results in a reduction of the pond volume requirements. The table below identifies the comparison of parameters and calculated 100 year pond volume with and without the diversion.
Table 7: Diversion Comparison for Pond 3 (100-year Design Event. SCS 24 Hour)
Modelled Scenario Catchment Area
(ha) Impervious
(%) Storage Volume
(m³) Original (no diversion) 11.23 57% 5,122 Updated (with diversion) 9.01 46% 3,592
For post- to pre- control, under the diversion scenario, the volume requirements for Pond 3 are presented as Table 8 below:
Table 8: Pond 3 - 24 Hour SCS - SWMHYMO Modelling Outputs
Event Pre-Development
Flow (m3/s) Post-Development
Flow (m3/s) Active Storage
Volume Required (m³)2 0.073 0.073 1149 5 0.134 0.133 1710
10 0.171 0.171 2166 25 0.233 0.232 2777
100 0.331 0.331 3779
Preliminary grading of Pond 3 shows a total available active storage volume of 4,205 m³. The Gilbert Creek 100-year flood elevation in the area of the outlet is approximately 239.2 m. This elevation is at the proposed NWL of 239.20 m and therefore the 100-year flood levels at Gilbert Creek will not impact the pond function.
6.3.4 Existing Paris Links Road SWM Facility
External drainage from the existing Paris Links Road stormwater facility (west of the Study Area) has been considered in the overall storm drainage design for the Study Area. The facility has a piped outlet that crosses the GolfNorth property within an

GolfNorth Properties 24 Functional Servicing and Preliminary Stormwater Management Report March 2015
R.J. Burnside & Associates Limited PGD020165 020165 FSR Preliminary Report
easement, outletting to a tributary of Gilbert Creek. The existing pond has a controlled 100-year release rate of 0.795 m³/s as per the TSH SWM Design Brief.
The potential of directing some of the development area drainage to the existing Paris Links Road stormwater facility was evaluated. Although a portion of the subdivision area along the west limit could potentially be directed to the existing facility, this would not preclude the requirement for a new stormwater facility to service the development area north of the road. Therefore, directing drainage to the existing facility would involve an upgrade to the existing facility in addition to construction of the new pond. It will therefore be more cost effective to construct a new pond as a standalone solution for the new development area.
6.3.5 Existing Paris Lakes Road SWM Outfall
The possibility of conveying the piped drainage from the existing Paris Links Road pond via the new local storm sewers within the study area (i.e., into Pond 3) was also evaluated. To accommodate this, the inlet at Pond 3 would have to be lowered by approximately 1.2 metres to an invert of 238.0 m. The proposed NWL and pond inlet elevation are at an elevation of 239.20 m, which is also the approximate groundwater elevation. Therefore, accommodating piped flow from the existing stormwater facility is not feasible because this would either require a fully submerged inlet, or significant lowering of the Pond 3 active storage to below the groundwater elevation.
It is therefore proposed that the existing Paris Links Road SWM pond outflows be routed in a separate new bypass sewer along the future subdivision rights-of-way to the existing storm outfall location. The proposed routing has been shown in concept on Figure 8.
6.3.6 Quality Control
The Gilbert Creek Subwatershed Study outlines that Level 1 control (i.e., ‘enhanced protection’ or 80% TSS removal) will be the appropriate level of quality control for each facility discharging to Gilbert Creek.
Calculations for permanent pool volumes based on MOE recommendations are provided in Appendix C and a summary is provided in Table 9 below. The summary table also includes estimates of available permanent pool volumes based on the conceptual stormwater facility grading provided on Figure 7.

GolfNorth Properties 25 Functional Servicing and Preliminary Stormwater Management Report March 2015
R.J. Burnside & Associates Limited PGD020165 020165 FSR Preliminary Report
Table 9: Quality Control Volume Summary
SWM Facility Tributary Area
(ha)
Water Quality
Unit Rate(m3/ha)
Volume Required
(m3)
Volume Provided
(m3)
Pond 1 (‘East Pond’) 17.12 127 2,180 5942 Pond 2 (‘Southwest Pond’) 6.37 185 1,178 1663 Pond 3 (‘Northwest Pond’) 9.01 127 1,147 2273
6.4 Site Infiltration and Water Balance
Levels of natural infiltration of rainwater are variable over the property. The LVM and Stantec reports include discussion of infiltration potential and the Stantec Report includes mapping illustrating post-development infiltration potential. In general, there is higher infiltration potential in areas east of Gilbert Creek where soils are generally more pervious and lower potential in the areas west of Gilbert Creek.
The Stantec Report includes catchment based PCSWMM modelling (completed by Stantec) for infiltration and water balance for both the pre- and post-development scenarios. In the discussion below, WT1 designates the areas tributary to Gilbert Creek and the associated wetland. WT2 designates the wetland in the southwest portion of the property, i.e. Block 21 Open Space on the Draft Plan.
The Water Balance calculations summarized below from the Stantec modelling account for diversions of rooftop areas as follows:
For areas east of Gilbert Creek and tributary to Pond 1, a rooftop runoff collection system (3rd pipe) will be implemented to convey the 100 year flow from the rooftops to a proposed centralized infiltration bed on Block 13;
For areas south of Paris Links Road tributary to Pond 3/Gilbert Creek, a rooftop runoff collection system (3rd pipe) will be sized to convey the 100 year flow from the rooftops to the south wetland;
Rooftop areas within these catchments are assumed at 25% of the development area (lots and roadways). Catchment areas and a preliminary piping layout and sizing for the 3rd pipe collection system are included on Figures 6A and 8A at the back of this Report. Sizing design sheets for the 3rd pipe systems are included in Appendix B.
GolfNorth Properties 26 Functional Servicing and Preliminary Stormwater Management Report March 2015
R.J. Burnside & Associates Limited PGD020165 020165 FSR Preliminary Report
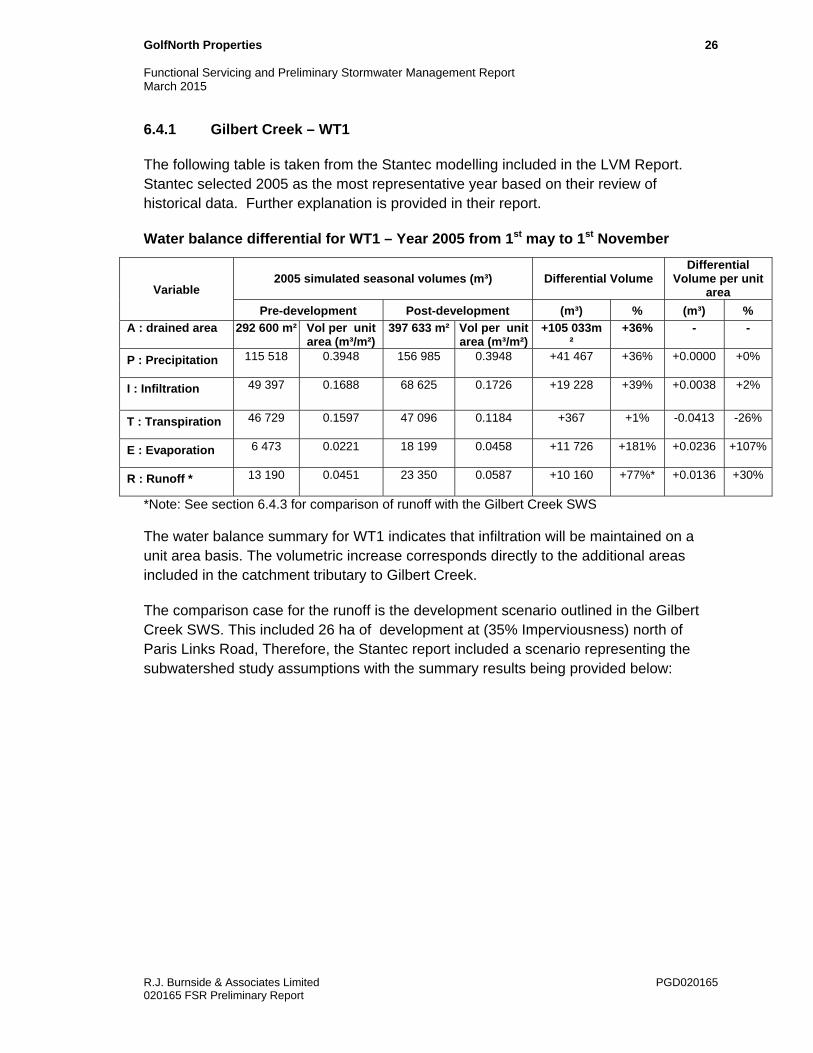
6.4.1 Gilbert Creek – WT1
The following table is taken from the Stantec modelling included in the LVM Report. Stantec selected 2005 as the most representative year based on their review of historical data. Further explanation is provided in their report.
Water balance differential for WT1 – Year 2005 from 1st may to 1st November
Variable 2005 simulated seasonal volumes (m³) Differential Volume
Differential Volume per unit
area
Pre-development Post-development (m³) % (m³) %
A : drained area 292 600 m² Vol per unit area (m³/m²)
397 633 m² Vol per unit area (m³/m²)
+105 033m²
+36% - -
P : Precipitation 115 518 0.3948 156 985 0.3948 +41 467 +36% +0.0000 +0%
I : Infiltration 49 397 0.1688 68 625 0.1726 +19 228 +39% +0.0038 +2%
T : Transpiration 46 729 0.1597 47 096 0.1184 +367 +1% -0.0413 -26%
E : Evaporation 6 473 0.0221 18 199 0.0458 +11 726 +181% +0.0236 +107%
R : Runoff * 13 190 0.0451 23 350 0.0587 +10 160 +77%* +0.0136 +30%
*Note: See section 6.4.3 for comparison of runoff with the Gilbert Creek SWS
The water balance summary for WT1 indicates that infiltration will be maintained on a unit area basis. The volumetric increase corresponds directly to the additional areas included in the catchment tributary to Gilbert Creek.
The comparison case for the runoff is the development scenario outlined in the Gilbert Creek SWS. This included 26 ha of development at (35% Imperviousness) north of Paris Links Road, Therefore, the Stantec report included a scenario representing the subwatershed study assumptions with the summary results being provided below:

GolfNorth Properties 27 Functional Servicing and Preliminary Stormwater Management Report March 2015
R.J. Burnside & Associates Limited PGD020165 020165 FSR Preliminary Report
(Runoff Comparison to Gilbert Creek Development Scenario)
Water balance comparison for WT1 – Year 2005 from 1st may to 1st November
Variable
2005 simulated seasonal volumes (m³) Differential Volume Differential Volume
per unit area
Gilbert Creek Subwatershed Study
Post-development (26ha – 35% impervious)
Presently proposed Post-development
(m³) % (m³) %
A : drained area 387 800 m² Volume per unit area (m³/m²)
397 633 m² Volume per unit area (m³/m²)
+9 833 m² 7% - -
P : Precipitation 153 103 0.3948 156 985 0.3948 +3 882 +3% +0.0000 +0%
I : Infiltration 57 168 0.1474 68 625 0.1726 +11 547 +20% +0.0252 +17%
T : Transpiration 44 535 0.1148 47 096 0.1184 +2 560 +6% +0.0036 +3%
E : Evaporation 17 218 0.0444 18 199 0.0458 +981 +6% +0.0014 +3%
R : Runoff 34 760 0.0896 23 350 0.0587 -11 410 -33% -0.0309 -34%
The values above include the assumption that rooftop capture within the 3rd pipe collection areas will result in reductions in volumetric runoff to Gilbert Creek beyond what was anticipated as a result of development in the original Subwatershed Study.
6.4.2 South Wetland –WT2
The following table is taken from the Stantec modelling included in the LVM Report.
Water balance differential for WT2 - Year 2005 from 1st May to 1st November
Variable 2005 simulated seasonal volumes (m³) Differential Volume
Differential Volume per unit area
Pre-development Post-development (m³) % (m³) %
A : drained area 170 900 m² Vol per unit area (m³/m²)
183 068 m² Vol per unit area (m³/m²)
+12 168 m² 7% - -
P : Precipitation 67 471 0.3948 72 275 0.3948 +4 804 +7% +0.0000 +0%
I : Infiltration 30 689 0.1796 27 471 0.1501 -3 218 -10% -0.0295 -16%
T : Transpiration
30 292 0.1772 21 932 0.1198 -8 360 -28% -0.0574 -32%
E : Evaporation 2 138 0.0125 7 746 0.0423 +5 608 +262% +0.0298 +238%
R : Runoff 4 480 0.0262 15 240 0.0832 +10 760 +240%* +0.0570 +218%
*Note: A discussion about the runoff is included in the NRIS report.
The water balance summary for WT2 indicates that there will be a reduction in infiltration on a unit area basis in the post-development condition. However, with the assumption of 3rd pipe diversion of rooftops in the development area south of Gilbert Creek and west of the wetland into the wet land, the overall volumetric input to the wetland (runoff + infiltration) will actually increase.

GolfNorth Properties 28 Functional Servicing and Preliminary Stormwater Management Report March 2015
R.J. Burnside & Associates Limited PGD020165 020165 FSR Preliminary Report
The NRSI Environmental Impact Study Addendum Report included with the current submission provides a review of the runoff increases and the potential impacts and concludes that these should not have significant impact to the wetland features on the site.
6.4.3 Implementation of 3rd Pipe Diversion and Infiltration Gallery
Figure 6A at the back of this Report is a catchment area plan showing the areas where the 3rd pipe rooftop collection system would be implemented. Figure 8A shows the preliminary pipe layout and sizing. A preliminary pipe sizing design sheet has been completed and included in Appendix B.
The infiltration facility on Block 13 is indicated on Figures 6A and 8A. The sizing of the facility is based on an estimated infiltration rate of 135-140 mm/hr for soil in the area of the infiltration gallery. This is taken from information provided by LVM per Table 102 in their report (a copy of this Table is also provided in Appendix C). The infiltration capacity was established using Borehole 12-11 at the west limit of Block 13 and includes a significant Factor of Safety of 2.5x to account for compaction and long term build-up of fines.
A calculation of the area requirement for the infiltration facility on Block 13 is included in Appendix C. The storage requirement is based on net rooftop capture area and a 100 year design storm rainfall depth of 87mm (consistent with the 3-hour Chicago Storm used in the SWMHYMO modelling).
From the calculation, the volumetric infiltration requirement in the 100 year event is 3,644 m3. It is assumed that the volume would be infiltrated over a maximum of 72 hours, resulting in an infiltration bed area requirement of 937 m2.
The area indicated on Block 13 for the facility is 1260 m2 (7 m x 180 m). Detailed design of the facility will include details for the recharger chambers to be installed within the block over the infiltration bed. Options for the chambers include commercially available products by manufacturers including Cultec and StormTech. Documentation for a typical Stormtech chamber unit that could be used for this application is included for reference in Appendix C.
6.4.4 Additional Considerations and Detailed Design
The current design proposal includes a conservative case for sizing and extent of the 3rd pipe collection system and for the infiltration gallery on Block 13. This approach was taken in order to ensure that sufficient area has been designated on the Draft Plan for the centralized facility and to confirm that the necessary piping network could be implemented without conflicting with other services.
GolfNorth Properties 29 Functional Servicing and Preliminary Stormwater Management Report March 2015
R.J. Burnside & Associates Limited PGD020165 020165 FSR Preliminary Report
At detailed design, further analysis can be undertaken to evaluate whether additional passive ‘low impact development’ (LID) measures can be implemented to augment or partially replace the 3rd pipe collection system or reduce the extent of the infiltration facility. This should also involve additional geotechnical work, including additional boreholes over lot areas, in order to better define where at-source infiltration measures can potentially be utilized.
Measures that can be incorporated at detailed design potentially include the following:
Maximizing the water availability in pervious areas such as grading that directs rooftop runoff to open space areas;
Increasing topsoil thickness on lot surfaces and other green areas by up to two times the normal thickness to promote infiltration;
Providing lot-level soakaway pits (infiltration galleries) for roof leaders in rear yard areas. This will be most effective where the galleries can extend across multiple rear yards and where groundwater and soil conditions permit; and
Providing for additional infiltration at SWM pond outlets where feasible.
6.5 Thermal Impacts and Temperature Mitigation
The Stantec Water Balance and Hydrological Impact Assessment Study (included in the LVM Hydrogeology Study Report) includes modelling used to evaluate potential thermal impacts associated with stormwater discharge for the development and a discussion of recommended measures for addressing the same.
The Report notes a potential increase in peak water temperature for Gilbert Creek due to discharge from the stormwater ponds (i.e. modelled increase of 2.7 degrees C).
Stantec recommends mitigation measures that would include source controls, pond shading, and buried piping at the stormwater pond inlets and outlets, all of which will be implemented during detailed design. Stantec notes specifically that the buried pipe network heat exchange was not modelled and that including this would reduce outlet temperatures by a few degrees.
6.6 Monitoring
As outlined in the Gilbert Creek SWS, monitoring of the stormwater facilities and natural features is required, particularly in the initial years of operation. This section provides a brief summary of monitoring requirements outlined in the SWS, which can be used as the basis for discussion moving forward on formalizing the specific requirements for the subdivision.
The SWS suggests that a photographic inventory of the natural heritage buffer at the limit of developing area needs to be completed prior to construction and that this

GolfNorth Properties 30 Functional Servicing and Preliminary Stormwater Management Report March 2015
R.J. Burnside & Associates Limited PGD020165 020165 FSR Preliminary Report
inventory should be updated annually until the end of the maintenance period. Fixed reference points should be depicted in each inventory to ensure direct comparisons can be made over time.
SWM facility inspections are an integral component of the monitoring program. Regular visual inspections should be conducted:
After every significant rainfall (> 30 mm) for the first two years of operation; and, Minimum of four visits per year after the first two years of operation (spring, summer,
fall and winter).
The SWS recommends that background water quality levels and other characteristics in the receiving water bodies (wetlands and Gilbert Creek) should be established prior to construction. Parameters are to include:
Flow rates Temperature Dissolved Oxygen (DO) content Phosphorous and bacteriological levels
The sampling period should continue until the end of the maintenance period for the purpose of monitoring for adverse impacts on the receiving water bodies.
The outlet channels should also be monitored with appropriate checks for evidence of erosion and/or scouring.
Any infiltration facilities’ functionality should be monitored until the maintenance period is complete and ownership is transferred to the County or property owner.
Erosion and Sediment Control Monitoring will also be required during the construction phase. This should include weekly silt fence and sediment pond inspections. Additional inspections should be carried out after rainfall events larger than 10 mm.
Checklists should be completed during each inspection. A sample inspection checklist is provided in Appendix C. The County may elect to keep a record of the completed checklists.
6.7 Erosion and Sediment Control
Erosion and Sediment Controls will be implemented for all construction activities including topsoil stripping, foundation excavation and stockpiling of materials.
The Erosion and Sediment Control strategy will consider the implementation of the following measures:

GolfNorth Properties 31 Functional Servicing and Preliminary Stormwater Management Report March 2015
R.J. Burnside & Associates Limited PGD020165 020165 FSR Preliminary Report
Temporary sediment control fence at construction limits and/or downstream of any disturbed areas prior to grading. Double row fencing may be appropriate adjacent to sensitive natural areas;
Gravel mud mats at construction vehicle access points to minimize off-site tracking of sediments;
Temporary sedimentation control ponds; Check dams, etc. for erosion / velocity control; Sediment traps in catchbasins; Routine inspection, monitoring, and repair as necessary of all temporary Erosion and
Sediment Control measures during construction; and, Removal of temporary controls once the areas they serve are restored and stable.
All reasonable measures will be taken to ensure that sediment loading is minimized both during and following construction. Additional details will be provided as part of the detailed design.
6.8 Recommendations – Stormwater Management
The preliminary conclusions resulting from the analysis provided above can be summarized as follows:
The stormwater design presented adheres to guidelines set out in the Gilbert Creek Subwatershed Study and as provided in the MOE Stormwater Management Planning and Design Manual;
Three stormwater management facilities will be constructed on-site to provide for quality control and volumetric control (i.e. flood/erosion control storage) to meet Agency requirements;
The net drainage area to the Gilbert Creek sub-watershed will increase due to an added catchment area at the west limit of the Draft Plan (consistent with the Gilbert Creek SWS);
Concerns with increased volumetric runoff to Gilbert Creek identified via comments from GRCA can be addressed via measures that will include on-site infiltration and flow diversion as outlined in the Section 6 of this Report;
Additional Low Impact Development (LID) measures including source controls can be evaluated at detailed design and implemented to augment the measures proposed in this Report; and
A preliminary summary of Erosion and Sediment Control measures has been provided to illustrate how sediment runoff and the potential for erosion can be mitigated during and following construction.

GolfNorth Properties 32 Functional Servicing and Preliminary Stormwater Management Report March 2015
R.J. Burnside & Associates Limited PGD020165 020165 FSR Preliminary Report
7.0 Wastewater Servicing
7.1 Wastewater Design Criteria
A preliminary sanitary servicing design for the development lands has been prepared. The following County of Brant criteria have been applied in generating average and peak design flows:
Residential flow rate - 350 litres per capita per day; Infiltration Allowance - 0.23 litres per second per hectare; Peaking Factor - Harmon Peaking Factor Formula (max value = 5); and, Population Density - 2.89 PPU low density / 1.94 PPU medium density.
7.2 Design Flows
A summary table with estimated sanitary flows for the development has been included in Appendix D and the flows are tabulated in Table 10 below.
Table 10: Sanitary Design Flows
Catchment Ultimate Outlet
Development Area (ha)
Total Pop’n
Peak Design Flow (L/s)*
West of Gilbert Creek Internal SPS
14.01 475 10.9
East of Gilbert Creek Internal SPS
17.25 586 13.3
Total 1061 23.5* * Accumulated flow includes a reduction due to peaking factor
The Preliminary Sanitary Servicing Plan (included as Figure 9) provides an overview of local sewer catchment areas, proposed sewer routing and pipe sizes. A preliminary sewer design sheet used for sizing of new local sewers within the Study area is included in Appendix D.
7.3 New Sanitary Pumping Station
The existing site topography will require the construction of a new sanitary pumping station to service the development lands, as most areas are below the invert of 240.0 m at the existing sanitary pumping station to the west of the proposed development. The Paris Links Road grade of 238.0 m at the Gilbert Creek crossing presents an additional constraint. The existing sewage pumping station does not have capacity to service additional lands and would require upgrading or replacement, even if partial flows could be directed by gravity to that location.

GolfNorth Properties 33 Functional Servicing and Preliminary Stormwater Management Report March 2015
R.J. Burnside & Associates Limited PGD020165 020165 FSR Preliminary Report
7.3.1 Existing Paris Links Road SPS
The existing residential area to the west (Wynfield Glen Subdivision) is serviced by the Paris Links Road sewage pumping station, located adjacent to Paris Links Road and indicated on Figure 9. The station is a wet well type (3000 mm diameter circular manhole chamber) with two marginally sized pumps.
The station services an approximate area of 28 hectares and a design population of 1160, with a design pumping rate of 26.5 L/s. Flows are pumped via an existing 200mm diameter forcemain for a distance of approximately 500 m to a gravity sewer outlet at Grand River Street North.
The existing SPS does not have capacity to accept additional flows from new development; therefore any proposal to convey additional flow to the station would involve a significant upgrade or replacement of the existing station. The County’s 2015 Development Charges Background Study (in progress) identifies upgrades to the existing station with an approximate timing of 2023, which is within the current 10-year planning period of the DC By-law. The County has expressed interest in replacing the existing station with an upsized station to service existing development and the Draft Plan lands and is open to discussion on cost-sharing for this proposal.
7.3.2 Conveyance of Existing Flows to New Paris Grand SPS
A review of the existing sewer elevations at the Paris Links Road SPS has confirmed that gravity conveyance of existing sanitary flows from the Wynfield Glen subdivision from the existing SPS location into the sewers within the new development lands would not require extended depths of sewers within the development area. Costs associated with conveying the existing flows would therefore be limited to:
Decommissioning of the existing station; Providing a gravity connection to the new sewers (approximately 120 m of sewer);
and Marginal oversizing of the some internal sewers from the connection point to the new
SPS (400 m± of upsizing from 200 mm to 250 mm diameter and 200 m± of upsizing from 250 mm to 300 mm diameter).
7.3.3 Proposed New Sanitary Pumping Station
The County has previously identified significant capacity constraints in the downstream sanitary sewers between the Grand River Street North / Paris Links Road intersection and the Paris Wastewater Treatment Plant. Additional discussion is provided in Section 7.4 below.
Analysis is provided in this section for an option where the maximum pumped flows from the combined new development and the existing SPS service area would be discharged

GolfNorth Properties 34 Functional Servicing and Preliminary Stormwater Management Report March 2015
R.J. Burnside & Associates Limited PGD020165 020165 FSR Preliminary Report
at no greater than the current SPS design pumping rate of 26.5 L/s. The option would therefore require that flow equalization storage be provided at the new SPS.
Appendix F includes calculations for the equalization storage requirement associated with the above scenario. A storage volume of 660m3 is required to attenuate flows from the Draft Plan lands plus the existing serviced area.
This modelling of the storage requirement includes a conservative assumption of significant peak extraneous flows from the existing serviced area. Flow records provided by the County for the existing station gave total annual pumping hours but no discretized data for single events (i.e., during or following major rainfall event). Total annual pumped volumes from the SPS indicate that actual pumped flows are approximately half the design average flow for the station. However, the more conservative assumptions were carried forward in the analysis.
It is recommended that a rigorous flow monitoring program be implemented at the existing station in order to provide a more accurate calibration of existing flows to be used in the modelling of the flow equalization storage required at the new SPS. This should be undertaken if the County agrees that the approach suggested above is an acceptable design solution.
A preliminary capital cost estimate for the new pumping station has been included with the SPS Design Brief included as Appendix F.
7.3.4 Staged Development on Draft Plan Lands
A Phase 1 scenario involving interim development over the westerly portion of the Draft Plan lands was considered (i.e. areas west of Gilbert Creek, design population of 475 persons). The analysis provided in Appendix F indicates that there would be an approximate flow equalization storage requirement of 170 m3 for this initial phasing.
Given that it will take several years for the development to be fully built-out, it is likely that the proposed storage at the new combined SPS could be constructed in phases. The initial equalization storage for Phase 1 could be sized at approximately 180m3 in one storage tank. Subsequently the flows and storage utilization can be monitored and the storage requirements reassessed for the purposes of future expansion. The ultimate storage required will likely be less than the theoretical maximum of 660 m3 for full development.

GolfNorth Properties 35 Functional Servicing and Preliminary Stormwater Management Report March 2015
R.J. Burnside & Associates Limited PGD020165 020165 FSR Preliminary Report
7.4 External Sanitary Sewer System Constraints
7.4.1 Paris Wastewater Treatment Plant (WWTP)
The Paris WWTP has a rated design capacity of 7,056 m3/day per the current MOE Certificate of Approval. Based on a per capita flow average of 400 L/cap/day, the station has capacity for an equivalent design population of 17,640.
The current population in the urban area of Paris is in the order of 11,763 persons (2011 Census data). It can therefore be concluded that the Paris WWTP has sufficient reserve capacity to treat the full 23.5 L/s projected design flow from the 400 units within the Draft Plan.
The County’s 2015 Development Charges Background Study (in progress) identifies upgrades to the existing Treatment Plant with an approximate timing of 2021, within the 10-year planning period of the DC By-law.
The DC Study provides forecasted growth in Southwest Paris of 2203 equivalent single detached residential units (SDU) to year 2031, with 1080 units occurring by 2021. The growth forecast for the balance of Paris is 600 units over an initial 10-year period. The 2021 timing for the WWTP expansion presented in the DC Study therefore coincides with development of 600 units within the balance of Paris including the Paris Grand development.
The County’s forthcoming Servicing Master Plan should provide confirmation that the future WWTP expansion will incorporate additional growth in the balance of Paris which may not have been considered in the 2008 DC Study.
7.4.2 Downstream Sanitary Sewer Analysis
Section 7.3 above provides an option for flow equalization at a new sanitary pumping station with the Draft Plan lands, which would result in no additional surcharging of existing sewers. However, additional analysis is provided in this section in order to determine the impact of introducing the Paris Grand development area flows directly into the existing system (i.e., without flow equalization storage at the new SPS described in Section 7.3.3 above).
The County’s current sanitary design sheets were used to evaluate existing and potential constraints in the sewers between the Study Area and the Paris WWTP and the information is summarized in the Table and Figures provided in Appendix E. Figure E-1 indicates currently surcharged sewers between the proposed development and the WWTP. Figure E-2 includes the additional surcharged sewers with the full Paris Grand development flows introduced.

GolfNorth Properties 36 Functional Servicing and Preliminary Stormwater Management Report March 2015
R.J. Burnside & Associates Limited PGD020165 020165 FSR Preliminary Report
Table 11 below is a summary of the undersized sewer lengths. The non-highlighted cells represent sewers that are surcharged under current conditions. The highlighted cells represent the additional sewer legs that are surcharged with full introduction of the Paris Grand sanitary flows.
Table 11: Downstream Sewer Surcharging with Paris Grand Flows Included
Street Name Sanitary Pipe No.
Peak Design Flow Q(d) (L/s)
Pipe Diameter
(mm
Length (m)
Grade (%)
Cap. (L/s)
GR. RIVER ST. N. PRS0360 262.04 600 94.60 0.17 253.20 GR. RIVER ST. N. PRS0238 342.52 375 71.65 3.72 338.21 WILLIAM ST. PRS0262 671.52 675 31.10 0.35 497.36 WILLIAM ST. PRS0264 283.62 675 32.32 0.03 145.61 WILLIAM ST. PRS0265 284.31 675 117.38 0.07 222.43 WILLOW ST. PRS0290 292.59 675 30.18 0.12 291.23 WILLOW ST. PRS0281 300.91 675 121.95 0.12 291.23 WILLOW ST. PRS0689 302.58 250 15.04 0.50 42.06 WILLOW ST. WSPS 302.78 200 46.67 0.50 23.20 BALL ST. PRS0038 346.80 675 82.01 0.15 325.60 BALL ST. PRS0035 360.54 675 146.65 0.16 336.28 RACE ST. PRS0030 376.62 675 115.85 0.18 356.68 RACE ST. PRS0002 392.19 675 8.84 0.21 385.26 RACE ST. PRS0001 413.02 675 65.00 0.22 394.32 * The summary above is based on a flow of 23.5 L/s introduced into the existing system.
Flows were calculated using 350 L/cap/day population flow for the new development area and no further peaking reduction of the introduced flow.
The length of downstream sewer identified as surcharged on the County’s current design sheets under existing conditions is approximately 620 m per the non-highlighted legs in the above table. The addition of the Paris Grand flows results in surcharging of an additional six legs of sewer (360 m total length), with the bulk of these legs (PRS0360, PRS238, PRS0290, PRS0281 and PRS002) having only very minor surcharging indicated.
It is noted that the County’s 2015 Development Charges Background Study identifies upgrades to the trunk sanitary sewers on Willow, Race and Ball Streets with approximate timing of 2021, which is within the current 10-year planning period of the DC By-law.

GolfNorth Properties 37 Functional Servicing and Preliminary Stormwater Management Report March 2015
R.J. Burnside & Associates Limited PGD020165 020165 FSR Preliminary Report
7.5 Conclusions – Draft Plan Area Wastewater Servicing
The preliminary conclusions resulting from the analysis provided above can be summarized as follows:
Due to topographical constraints, a new sanitary sewage pumping station will be required to service the Paris Grand development;
Based on a review the County’s current sanitary design sheets, additional lengths of downstream sewers may have to be upgraded in order to allow for conveyance of the Draft Plan area flows to the Paris WWTP;
Additional review and consultation is required to determine how the costs for upgrades to downstream sewers will be attributed to benefitting upstream parties and to the County. This should be undertaken in conjunction with the current County’s Master Servicing Study. As the upgrades would provide a benefit to existing serviced areas, this should be considered in any future update of the County’s Development Charge Bylaw;
The County’s current Development Charges Bylaw identifies upgrades to the existing Paris Links Road sanitary pumping station (approximate timing in 2023, within the 10-year planning period of the DC By-law). There would be a realized net benefit to both the Developer and the County In providing a single sanitary pumping station within the Paris Grand development, replacing the existing SPS at Paris Links Road. The combined facility would benefit existing serviced areas and this should be considered in any update of the County’s Development Charge Bylaw;
Phased development on the Study Area lands could occur immediately if flow equalization storage is provided at the new sanitary pumping station, i.e. there would be no net impact to flow conditions within the existing Paris sewer system; and,
It is recommended that a flow monitoring program be implemented at the existing Paris Links Road SPS in order to provide a more accurate calibration of existing flows to be used in the modelling of the total flow equalization storage required. This should be undertaken once the County gives an indication that the SPS replacement and upgrade incorporating flow equalization storage is an acceptable servicing alternative.

GolfNorth Properties 38 Functional Servicing and Preliminary Stormwater Management Report March 2015
R.J. Burnside & Associates Limited PGD020165 020165 FSR Preliminary Report
8.0 Water Supply and Distribution
8.1 Design Criteria
The following County of Brant criteria were applied in order to calculate water demand for the Study Area:
Average Daily Demand per-capita - 350 litres per day; Maximum Daily Demand Factor - 2.75; and, Maximum Hourly Demand Factor - 4.00.
8.2 Design Flows
A preliminary water demand calculation sheet is included in Appendix G. The resulting design flows are tabulated in Table 12 below.
Table 12: Preliminary Estimate of Water Demand
Catchment Total Pop’n
Average Day Demand
(L/s)
Max Day Demand
(L/s)
Max Hour Demand (L/s)
West of Gilbert Creek 475 1.9 5.3 7.7 East of Gilbert Creek 586 2.4 6.5 9.5 Total 4.3 11.8 17.2
8.3 Existing Supply Conditions and System Upgrades
Based on the water system map provided by the County, the proposed development is located within Pressure Zone 1 of the municipal supply system. Planned upgrades for the Paris water supply that directly impact the north Paris Area within this zone include a planned elevated storage facility, currently expected to be constructed in 2015. As this project is within the local pressure zone, there presumably will be improved supply conditions as a result of the upgrade.
The County has advised that current policy is to require that major new development within the Paris urban area provide for its own water supply (i.e., new source wells). The County would then elect to protect the new supply or have it implemented at their discretion.
The County’s current Master Servicing Study will include additional recommendations for Paris water infrastructure upgrades. GolfNorth should have full stakeholder opportunity to review and participate as the County’s Study is advanced.

GolfNorth Properties 39 Functional Servicing and Preliminary Stormwater Management Report March 2015
R.J. Burnside & Associates Limited PGD020165 020165 FSR Preliminary Report
8.4 Paris Water Model – Update to Include Paris Grand Demand
Preliminary estimates of water demand were provided to the County for the purpose of updating the existing Paris Water System hydraulic modelling to include the Draft Plan lands. The County provided results in a Report prepared by AECOM dated July 2013. The analysis included calibration using results obtained from flow testing at six hydrants fronting the development and westerly along Paris Links Road.
System pressures under all modelled scenarios generally fall in the range of 75 to 105 psi. Extrapolating from the results it was noted that greater than 150 L/s of supply would be available at a 20 psi residual system pressure. The AECOM Report is included in Appendix G of this report.
The Report notes that pressure reducing valves may be required in instances where system pressures exceed the generally recommended 100 psi maximum. From the data provided by AECOM, this has the potential to occur where proposed elevations are lower than an approximate elevation of 240.7 m. The preliminary grading prepared for this Functional Report indicated that this might occur locally in two areas:
South of Paris Links Road adjacent to Gilbert Creek, and Along frontages adjacent to Paris Links Road east of Gilbert Creek.
While the detailed hydraulic modelling for the internal subdivision area has not been developed at this stage, the following can be noted:
The highest proposed elevation within the subdivision is approximately 254.9 m, on Street C along the north limit of the Plan. The associated pressure drop associated with an elevation change of 17.2 meters (i.e. from elevation 237.7 m at the Street B/Paris Links Road intersection) would be in the order of 25 psi. Based on the AECOM modelling, it can be surmised that the maximum elevation change would still allow for more than adequate supply pressures;
There will also be internal system pipe losses over the future network; these should not have an adverse effect on the system given the adequacy of existing pressures in the overall system, but they can be minimized via appropriate looping to the supply main at Paris Links Road.
8.5 Existing GolfNorth Supply Wells
Additional evaluation of an option for potential on-site water supply is presented in this section.
There are currently two approved 300 mm diameter ‘large supply’ irrigation wells within the GolfNorth property. These locations are noted as PW1/00 and PW1/97 on the Water Servicing Plan included as Figure 10. The wells are cased bedrock wells with water

GolfNorth Properties 40 Functional Servicing and Preliminary Stormwater Management Report March 2015
R.J. Burnside & Associates Limited PGD020165 020165 FSR Preliminary Report
pumped from depths of approximately 18-25 meters. PW1/97 is the normally in use irrigation supply well for the golf course while PW1/00 is a backup irrigation well.
A copy of the Ministry approved Permit to Take Water document is included in Appendix G. The permitting allows for total water taking at 1,636 m3 per day over 214 days of seasonal operation. Based on the permit documentation, the currently approved annual water taking for the on-site well supply is 350,104 m3.
The average day demand for the GolfNorth Study area is 4.3 L/s. Extrapolating from this to obtain the annual supply required to satisfy domestic demand for the Study Area results in a supply requirement of 135,604 m3 annually. It can therefore be inferred that the existing well supply would have capacity to service the development, and there may be surplus available for County use beyond the Study Area.
If an on-site supply option is determined to be appropriate for the development, reservoir storage for fire protection will also be required.
Conversion of the on-site wells for domestic use would require treatment to potable quality, as well as re-permitting of the wells to allow for domestic use and year round water taking.
These wells and other bedrock wells in the Paris area exhibit high levels of sulfate and hardness due to the presence of gypsum. Sulfate levels in particular are a concern from a taste and odour standpoint. Sampling results confirm that on-site treatment for hardness (water softening) and sulfate removal (reverse osmosis) for potability would be required. The County is generally familiar with these treatment requirements as the water supplied from existing municipal supply wells is treated for the same general characteristics.
Block 14 on the Draft Plan is noted as a potential site for on-site water treatment and storage. A preliminary layout for the facility has been developed in order to confirm that the area has been sized appropriately. The layout is included in Appendix G of this Report. A preliminary capital cost estimate for the water treatment system and storage facility has also been included in Appendix G.
8.6 Preliminary Watermain Layout
The Preliminary Water Servicing Plan (included as Figure 10 at the back of this report) includes an internal watermain layout that follows the alignments of the proposed right-of-ways, with connections to the existing 350 mm diameter main on Paris Links Road; a total of six connections are indicated. The layout provides for excellent internal looping within the proposed system. The plan also shows the location for the Block 14 on-site water treatment and storage facility.

GolfNorth Properties 41 Functional Servicing and Preliminary Stormwater Management Report March 2015
R.J. Burnside & Associates Limited PGD020165 020165 FSR Preliminary Report
8.7 Conclusions – Draft Plan Area Water Servicing
The conclusions resulting from the analysis and discussion provided above are summarized as follows:
The County has provided an update to the Paris water system hydraulic modelling that includes projected demands for the Draft Plan lands. The results confirm that system pressures are not a constraint to servicing of the proposed development;
A proposal and costing for on-site well based supply has been presented. If this solution is implemented, there would be a realized net benefit to both the Developer and the County as a result of upgrading the existing irrigation wells for potable supply. Excess supply to augment the County’s overall supply may be available from the wells;
Implementation of on-site supply will require that the water be treated for hardness and sulfate removal. A preliminary treatment plant layout and a capital cost estimate for the facility have been provided for the County’s consideration; and
Additional review is required to determine how the costs for external upgrades to the existing County supply will be attributed to benefitting parties and to the County. This should be undertaken in conjunction with the County’s Master Servicing Study and at the Development Charge study level.

GolfNorth Properties 42 Functional Servicing and Preliminary Stormwater Management Report March 2015
R.J. Burnside & Associates Limited PGD020165 020165 FSR Preliminary Report
9.0 Traffic Study and Roads
9.1 Traffic Report
A Traffic Study was undertaken with other studies prepared in support of the previous submissions to the County (Transportation Impact Study, Paradigm Transportation Solutions Limited, January 2013). The report includes forecasts and analyses for traffic generation and associated impacts. Discussion and recommendations on external improvements are included in the PTSL Study; discussion in this Report is limited to issues with respect to the localized road frontage and proposed subdivision entrances from Paris Links Road.
9.2 Right-of-Way Widths
The proposed road network within the subject property will be designed in accordance with County Standards for 20 m right-of-ways.
9.3 Paris Lake Road Improvements
The PTSL Study includes analysis of sightline conditions for Paris Links Road with consideration of the proposed new intersection locations and based on a design speed of 70 km/h (20 km/h over a posted 50 km/h limit). The sightline conditions as they exist are substandard with respect to the existing residential driveway accesses.
With the introduction of the new street intersections, improvements are recommended that would involve reconstruction of the existing roadway to meet sightline requirements. Figure 4A of this Report is a preliminary road profile that delineates the extent of the road high point lowering that is required to mitigate the sightline issues. The proposed grades for the subdivision intersections (Figure 4) reflect the new profile grades for Paris Links Road.
The above reconstruction would be undertaken with the upgrading of Paris Links Road along the entire site frontage to an urban section, which the County will also require.
The current submission includes a response by Paradigm to the comments on the Traffic Impact Study. The response includes discussion on options to realign Paris Links Road to create a four-leg intersection with Grand River Street and/or Silver Street/Capron Street. The current Draft Plan and associated Burnside drawings reflect the roadway allowance required for this realignment within the westerly portion of the Draft Plan lands.

GolfNorth Properties 43 Functional Servicing and Preliminary Stormwater Management Report March 2015
R.J. Burnside & Associates Limited PGD020165 020165 FSR Preliminary Report
10.0 Summary Conclusion
The preceding Report provides analysis of existing servicing capacities and a review of options for servicing of the proposed Paris Grand residential subdivision development. Although several constraints exist at this time, particularly with respect to water supply and downstream sanitary conveyance capacity, options to address these constraints have been presented. In summary, this Report addresses the servicing related requirements associated with the Draft Plan and Zoning Bylaw Amendment applications for the subject property. We therefore propose that the preceding Functional Servicing and Preliminary Stormwater Management analysis be accepted for review and approval by the County of Brant in order to facilitate the Planning Approvals required before development can proceed.

Fig
ures
Figures
Figure 3 - Existing Site Conditions Figure 4 – Preliminary Grading Plan
Figure 4A – Preliminary Plan/Profile – Paris Links Road Figure 5 – Pre-Development Storm Drainage Plan
Figure 6 – Post-Development Storm Drainage Plan Figure 6A – Post-Development Storm Drainage Plan (3rd
Pipe Rooftop Collection) Figure 7 – Preliminary Pond Design
Figure 7A – Preliminary Pond Cross Sections Figure 8 – Preliminary Storm Servicing Plan
Figure 8A – Preliminary Storm Servicing Plan (3rd Pope Rooftop Collection)
Figure 9 – Preliminary Sanitary Servicing Plan Figure 10 – Preliminary Water Servicing Plan

Ap
pen
dix A
Appendix A
LVM Borehole Data

Borehole Number:
Ground Elevation:
Job No.:Project:
Location: Drill Date:
Reviewed by:
Notes:
Field Tech.:
Drill Method: Sheet: 1 of 1
Drafted by:
SOIL PROFILE SAMPLE
Depth (m)
0.00
1.00
2.00
3.00
4.00
5.00
6.00
7.00
8.00
9.00
10.00
11.00
12.00
13.00
Description
Symbol
Elevation (m)
Number
Type
N-Value
Water Content(%)
Groundwater Observationsand Standpipe Details
WP WL
01-11
n/a
P041402-301Paris Grand Country Club
150 Paris Links Road, Paris, Ontario 2011-07-28
Ground Elevation
TOPSOIL:dark brown silt, moist
SILT:brown silt, some sand and
gravel, moist
SILT TILL:stiff to very stiff brown silt, some
clay, trace sand, DTPL
occasional silt layers, moist
SILT:loose brown silt, moist; some
brown clayey silt layers, APL
compact
SAND:compact brown fine to medium
sand, trace silt, saturated
Borehole terminated at 7.62 m.
0.00
-1.00
-2.00
-3.00
-4.00
-5.00
-6.00
-7.00
-8.00
-9.00
-10.00
-11.00
-12.00
-13.00
1
2
3
4
5
6
7
SS
SS
SS
SS
SS
SS
SS
7
10
8
13
11
10
20 40 60 80
Standard Penetration
20 40 60 80
Dynamic Cone
50 100 150 200
Shear Strength (FV) kPa
50 100 150 200
Shear Strength (PP) kPa
10 20 30
bentonite seal
native cave
50 mm pipes
0.9 m slotted screen
bentonite seal
1.5 m slotted screen
sand pack
protective cover
and concrete
sand pack
F. Chartier/C. Helmer R. McMillan
Hollow Stem Auger
K. Staples
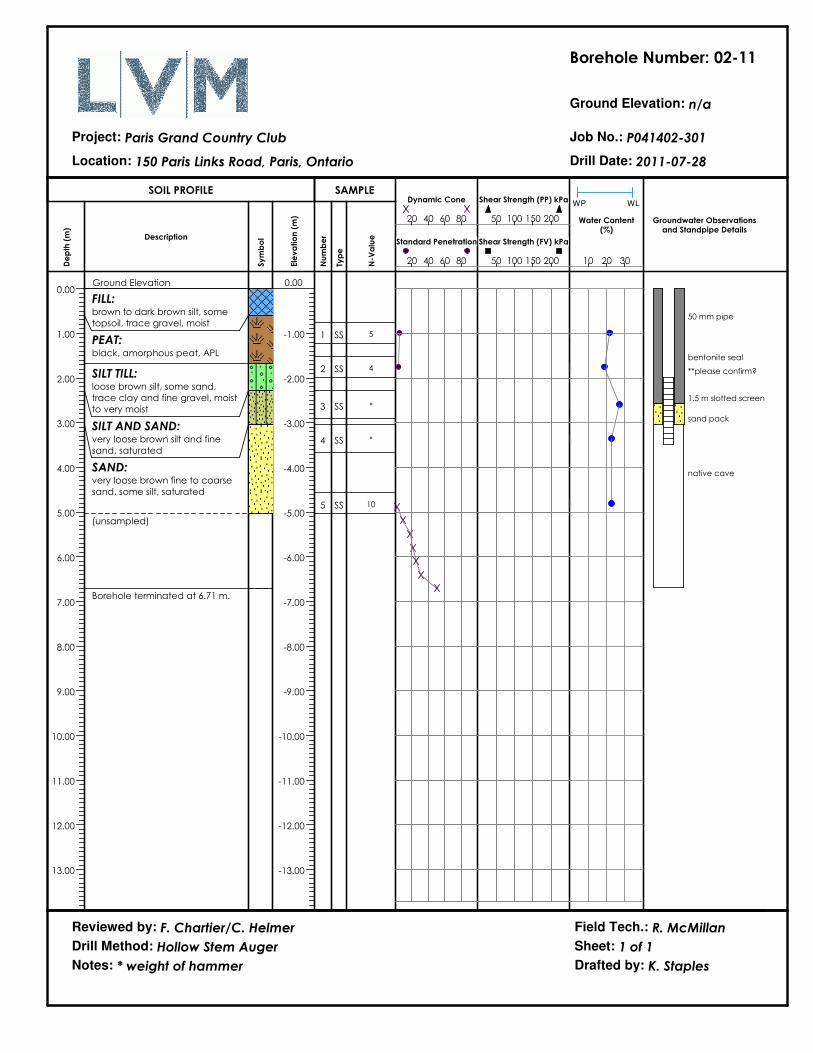
Borehole Number:
Ground Elevation:
Job No.:Project:
Location: Drill Date:
Reviewed by:
Notes:
Field Tech.:
Drill Method: Sheet: 1 of 1
Drafted by:
SOIL PROFILE SAMPLE
Depth (m)
0.00
1.00
2.00
3.00
4.00
5.00
6.00
7.00
8.00
9.00
10.00
11.00
12.00
13.00
Description
Symbol
Elevation (m)
Number
Type
N-Value
Water Content(%)
Groundwater Observationsand Standpipe Details
WP WL
02-11
n/a
P041402-301Paris Grand Country Club
150 Paris Links Road, Paris, Ontario 2011-07-28
Ground Elevation
FILL:brown to dark brown silt, some
topsoil, trace gravel, moist
PEAT:black, amorphous peat, APL
SILT TILL:loose brown silt, some sand,
trace clay and fine gravel, moist
to very moist
SILT AND SAND:very loose brown silt and fine
sand, saturated
SAND:very loose brown fine to coarse
sand, some silt, saturated
(unsampled)
Borehole terminated at 6.71 m.
0.00
-1.00
-2.00
-3.00
-4.00
-5.00
-6.00
-7.00
-8.00
-9.00
-10.00
-11.00
-12.00
-13.00
1
2
3
4
5
SS
SS
SS
SS
SS
5
4
*
*
10
20 40 60 80
Standard Penetration
20 40 60 80
Dynamic Cone
50 100 150 200
Shear Strength (FV) kPa
50 100 150 200
Shear Strength (PP) kPa
10 20 30
1.5 m slotted screen
sand pack
50 mm pipe
bentonite seal
**please confirm?
native cave
F. Chartier/C. Helmer
* weight of hammer
R. McMillan
Hollow Stem Auger
K. Staples
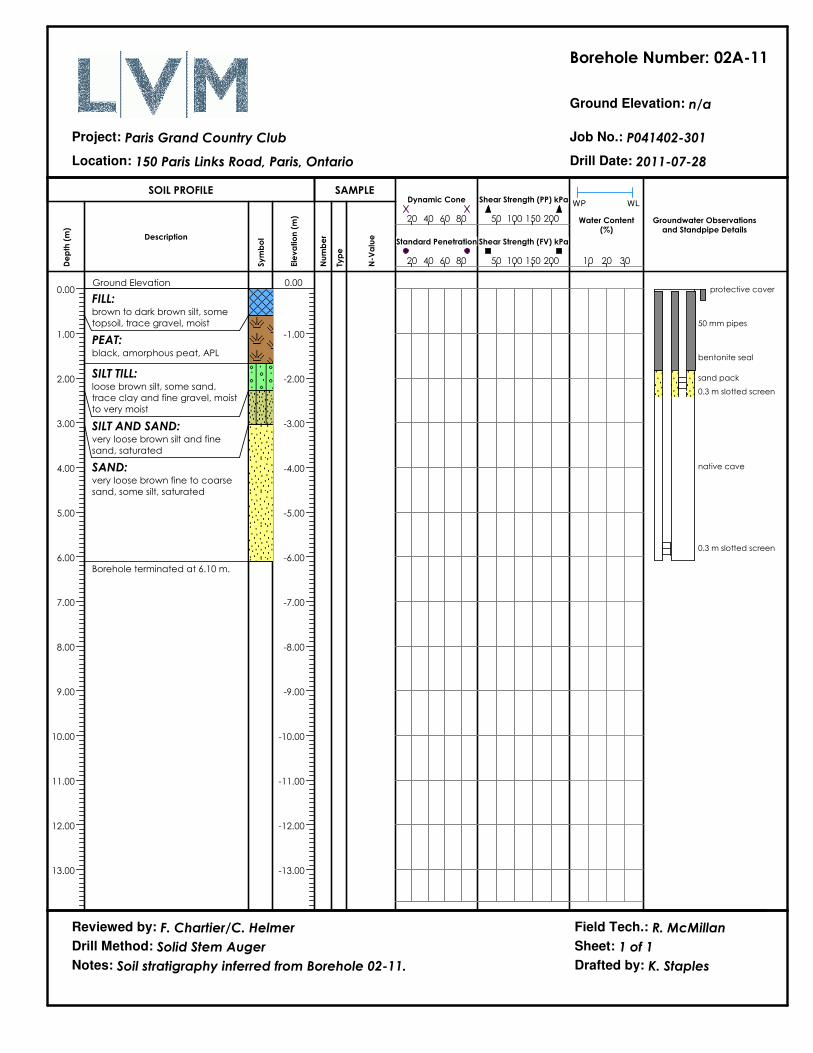
Borehole Number:
Ground Elevation:
Job No.:Project:
Location: Drill Date:
Reviewed by:
Notes:
Field Tech.:
Drill Method: Sheet: 1 of 1
Drafted by:
SOIL PROFILE SAMPLE
Depth (m)
0.00
1.00
2.00
3.00
4.00
5.00
6.00
7.00
8.00
9.00
10.00
11.00
12.00
13.00
Description
Symbol
Elevation (m)
Number
Type
N-Value
Water Content(%)
Groundwater Observationsand Standpipe Details
WP WL
02A-11
n/a
P041402-301Paris Grand Country Club
150 Paris Links Road, Paris, Ontario 2011-07-28
Ground Elevation
FILL:brown to dark brown silt, some
topsoil, trace gravel, moist
PEAT:black, amorphous peat, APL
SILT TILL:loose brown silt, some sand,
trace clay and fine gravel, moist
to very moist
SILT AND SAND:very loose brown silt and fine
sand, saturated
SAND:very loose brown fine to coarse
sand, some silt, saturated
Borehole terminated at 6.10 m.
0.00
-1.00
-2.00
-3.00
-4.00
-5.00
-6.00
-7.00
-8.00
-9.00
-10.00
-11.00
-12.00
-13.00
20 40 60 80
Standard Penetration
20 40 60 80
Dynamic Cone
50 100 150 200
Shear Strength (FV) kPa
50 100 150 200
Shear Strength (PP) kPa
10 20 30
protective cover
bentonite seal
native cave
50 mm pipes
0.3 m slotted screen
0.3 m slotted screen
sand pack
F. Chartier/C. Helmer
Soil stratigraphy inferred from Borehole 02-11.
R. McMillan
Solid Stem Auger
K. Staples

Borehole Number:
Ground Elevation:
Job No.:Project:
Location: Drill Date:
Reviewed by:
Notes:
Field Tech.:
Drill Method: Sheet: 1 of 1
Drafted by:
SOIL PROFILE SAMPLE
Depth (m)
0.00
1.00
2.00
3.00
4.00
5.00
6.00
7.00
8.00
9.00
10.00
11.00
12.00
13.00
Description
Symbol
Elevation (m)
Number
Type
N-Value
Water Content(%)
Groundwater Observationsand Standpipe Details
WP WL
03-11
n/a
P041402-301Paris Grand Country Club
150 Paris Links Road, Paris, Ontario 2011-08-05
Ground Elevation
FILL:dark brown silt (topsoil), moist
brown silt, some sand and clay,
moist
PEAT:black amorphous peat, APL
SAND AND GRAVEL:compact brown sand and
gravel, some silt, saturated
Borehole terminated at 3.81 m.
0.00
-1.00
-2.00
-3.00
-4.00
-5.00
-6.00
-7.00
-8.00
-9.00
-10.00
-11.00
-12.00
-13.00
1
2
3
AS
SS
SS
16
19
20 40 60 80
Standard Penetration
20 40 60 80
Dynamic Cone
50 100 150 200
Shear Strength (FV) kPa
50 100 150 200
Shear Strength (PP) kPa
10 20 30
protective cover
and concrete
1.5 m slotted screen
sand pack
50 mm pipe
bentonite seal
F. Chartier/C. Helmer
Auger sample taken from 0.61 to 1.22 m.
R. McMillan
Hollow Stem Auger
K. Staples
67%

Borehole Number:
Ground Elevation:
Job No.:Project:
Location: Drill Date:
Reviewed by:
Notes:
Field Tech.:
Drill Method: Sheet: 1 of 1
Drafted by:
SOIL PROFILE SAMPLE
Depth (m)
0.00
1.00
2.00
3.00
4.00
5.00
6.00
7.00
8.00
9.00
10.00
11.00
12.00
13.00
Description
Symbol
Elevation (m)
Number
Type
N-Value
Water Content(%)
Groundwater Observationsand Standpipe Details
WP WL
04-11
n/a
P041402-301Paris Grand Country Club
150 Paris Links Road, Paris, Ontario 2011-08-17
Ground Elevation
TOPSOIL:dark brown silt, moist
SILT:brown silt, some sand, moist
SAND AND GRAVEL:compact brown sand and
gravel, trace silt and cobbles,
damp
some cobbles
frequent cobbles and boulders
very dense, damp
saturated
Borehole terminated at 13.41 m.
0.00
-1.00
-2.00
-3.00
-4.00
-5.00
-6.00
-7.00
-8.00
-9.00
-10.00
-11.00
-12.00
-13.00
1
2
3
4
5
6
7
8
9
AS
SS
SS
SS
SS
SS
SS
SS
SS
10
12
22
15
19
30
30\150mm
17
20 40 60 80
Standard Penetration
20 40 60 80
Dynamic Cone
50 100 150 200
Shear Strength (FV) kPa
50 100 150 200
Shear Strength (PP) kPa
10 20 30
protective cover
and concrete
0.61 m slotted screen
native cave
50 mm pipe
bentonite seal
Water level in pipe at
11.68 m upon
completion.
F. Chartier/C. Helmer R. McMillan
Hollow Stem Auger
K. StaplesAuger sample taken from 0.61 to 0.91 m. Auger seized by cobbles; turned augers up to 12.19 m to unseize. Auger refusal at 12.80 m on fallen-in cobbles and boulder.
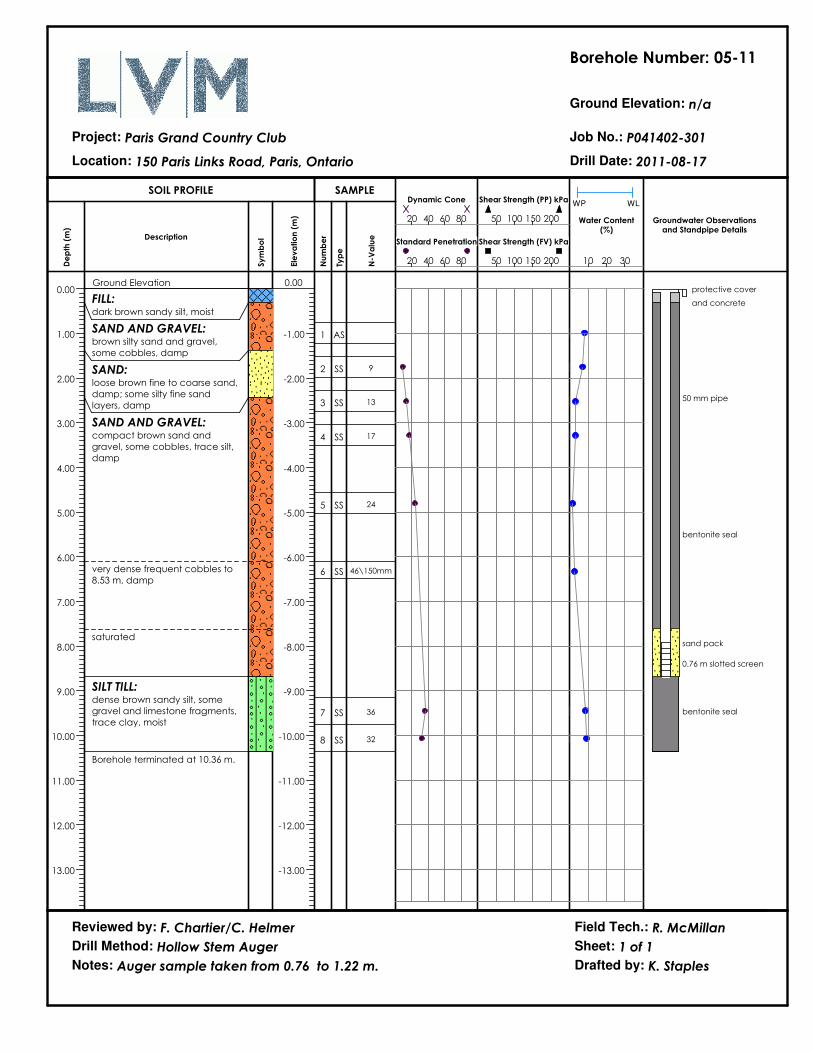
Borehole Number:
Ground Elevation:
Job No.:Project:
Location: Drill Date:
Reviewed by:
Notes:
Field Tech.:
Drill Method: Sheet: 1 of 1
Drafted by:
SOIL PROFILE SAMPLE
Depth (m)
0.00
1.00
2.00
3.00
4.00
5.00
6.00
7.00
8.00
9.00
10.00
11.00
12.00
13.00
Description
Symbol
Elevation (m)
Number
Type
N-Value
Water Content(%)
Groundwater Observationsand Standpipe Details
WP WL
05-11
n/a
P041402-301Paris Grand Country Club
150 Paris Links Road, Paris, Ontario 2011-08-17
Ground Elevation
FILL:dark brown sandy silt, moist
SAND AND GRAVEL:brown silty sand and gravel,
some cobbles, damp
SAND:loose brown fine to coarse sand,
damp; some silty fine sand
layers, damp
SAND AND GRAVEL:compact brown sand and
gravel, some cobbles, trace silt,
damp
very dense frequent cobbles to
8.53 m, damp
saturated
SILT TILL:dense brown sandy silt, some
gravel and limestone fragments,
trace clay, moist
Borehole terminated at 10.36 m.
0.00
-1.00
-2.00
-3.00
-4.00
-5.00
-6.00
-7.00
-8.00
-9.00
-10.00
-11.00
-12.00
-13.00
1
2
3
4
5
6
7
8
AS
SS
SS
SS
SS
SS
SS
SS
9
13
17
24
46\150mm
36
32
20 40 60 80
Standard Penetration
20 40 60 80
Dynamic Cone
50 100 150 200
Shear Strength (FV) kPa
50 100 150 200
Shear Strength (PP) kPa
10 20 30
protective cover
and concrete
0.76 m slotted screen
sand pack
50 mm pipe
bentonite seal
bentonite seal
F. Chartier/C. Helmer
Auger sample taken from 0.76 to 1.22 m.
R. McMillan
Hollow Stem Auger
K. Staples

Borehole Number:
Ground Elevation:
Job No.:Project:
Location: Drill Date:
Reviewed by:
Notes:
Field Tech.:
Drill Method: Sheet: 1 of 1
Drafted by:
SOIL PROFILE SAMPLE
Depth (m)
0.00
1.00
2.00
3.00
4.00
5.00
6.00
7.00
8.00
9.00
10.00
11.00
12.00
13.00
Description
Symbol
Elevation (m)
Number
Type
N-Value
Water Content(%)
Groundwater Observationsand Standpipe Details
WP WL
06-11
n/a
P041402-301Paris Grand Country Club
150 Paris Links Road, Paris, Ontario 2011-08-05
Ground Elevation
FILL:dark brown silt (topsoil), moist
brown sandy silt, trace gravel,
moist
SAND AND GRAVEL:dense brown sand and gravel,
frequent cobbles, trace silt,
damp
saturated
Borehole terminated at 12.19 m.
0.00
-1.00
-2.00
-3.00
-4.00
-5.00
-6.00
-7.00
-8.00
-9.00
-10.00
-11.00
-12.00
-13.00
1
2
5
6
7
AS
SS
SS
SS
SS
42
35\150mm
35\150mm
45
20 40 60 80
Standard Penetration
20 40 60 80
Dynamic Cone
50 100 150 200
Shear Strength (FV) kPa
50 100 150 200
Shear Strength (PP) kPa
10 20 30
protective cover
and concrete
1.5 m slotted screen
native cave
50 mm pipe
bentonite seal
Water level in pipe
at 9.75 m.
F. Chartier/C. Helmer
Auger sample taken from 0.76 to 1.22 m.
R. McMillan
Hollow Stem Auger
K. Staples
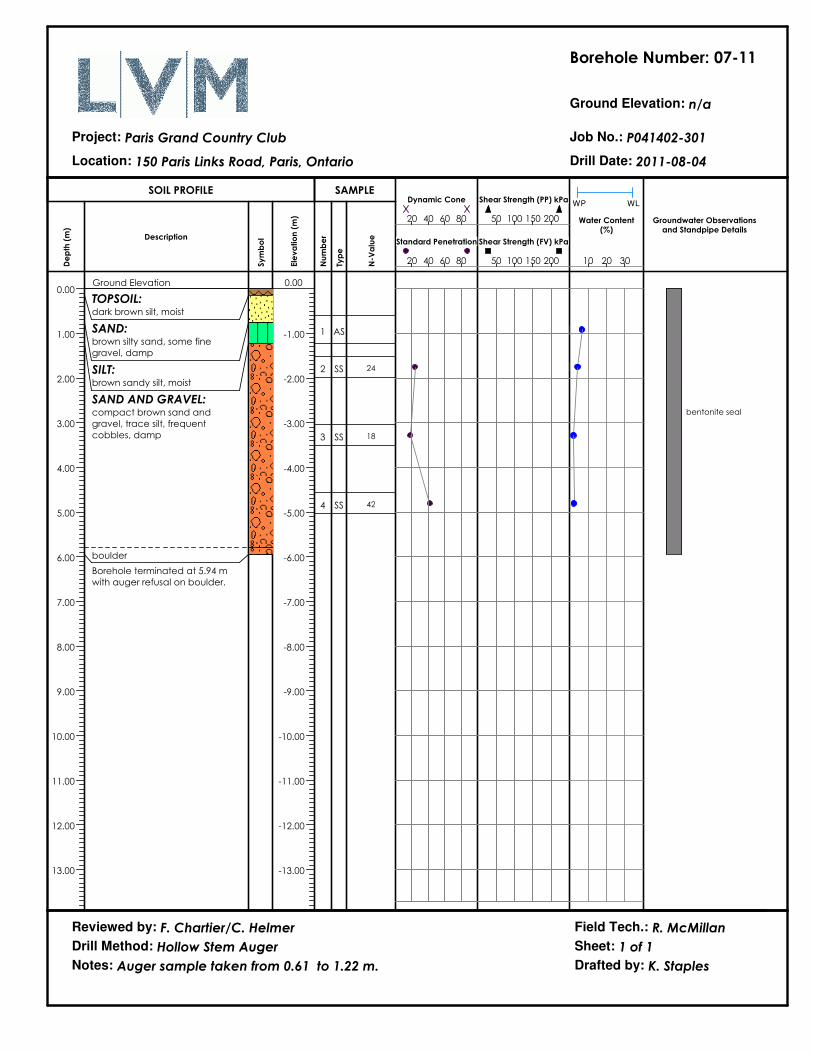
Borehole Number:
Ground Elevation:
Job No.:Project:
Location: Drill Date:
Reviewed by:
Notes:
Field Tech.:
Drill Method: Sheet: 1 of 1
Drafted by:
SOIL PROFILE SAMPLE
Depth (m)
0.00
1.00
2.00
3.00
4.00
5.00
6.00
7.00
8.00
9.00
10.00
11.00
12.00
13.00
Description
Symbol
Elevation (m)
Number
Type
N-Value
Water Content(%)
Groundwater Observationsand Standpipe Details
WP WL
07-11
n/a
P041402-301Paris Grand Country Club
150 Paris Links Road, Paris, Ontario 2011-08-04
Ground Elevation
TOPSOIL:dark brown silt, moist
SAND:brown silty sand, some fine
gravel, damp
SILT:brown sandy silt, moist
SAND AND GRAVEL:compact brown sand and
gravel, trace silt, frequent
cobbles, damp
boulder
Borehole terminated at 5.94 m
with auger refusal on boulder.
0.00
-1.00
-2.00
-3.00
-4.00
-5.00
-6.00
-7.00
-8.00
-9.00
-10.00
-11.00
-12.00
-13.00
1
2
3
4
AS
SS
SS
SS
24
18
42
20 40 60 80
Standard Penetration
20 40 60 80
Dynamic Cone
50 100 150 200
Shear Strength (FV) kPa
50 100 150 200
Shear Strength (PP) kPa
10 20 30
bentonite seal
F. Chartier/C. Helmer
Auger sample taken from 0.61 to 1.22 m.
R. McMillan
Hollow Stem Auger
K. Staples

Borehole Number:
Ground Elevation:
Job No.:Project:
Location: Drill Date:
Reviewed by:
Notes:
Field Tech.:
Drill Method: Sheet: 1 of 1
Drafted by:
SOIL PROFILE SAMPLE
Depth (m)
0.00
1.00
2.00
3.00
4.00
5.00
6.00
7.00
8.00
9.00
10.00
11.00
12.00
13.00
Description
Symbol
Elevation (m)
Number
Type
N-Value
Water Content(%)
Groundwater Observationsand Standpipe Details
WP WL
08-11
n/a
P041402-301Paris Grand Country Club
150 Paris Links Road, Paris, Ontario 2011-08-04
Ground Elevation
FILL:dark brown silt (topsoil), some
brown silt, moist
SILT:very loose brown silt, some sand
and clay, moist
SAND:compact brown fine to medium
sand, trace silt, damp
SAND AND GRAVEL:dense brown sand and gravel,
some cobbles and silt, damp
saturated
CLAY TILL:hard grey silty clay, APL **pls
confirm - text faint
Borehole terminated at 6.55 m.
0.00
-1.00
-2.00
-3.00
-4.00
-5.00
-6.00
-7.00
-8.00
-9.00
-10.00
-11.00
-12.00
-13.00
1
2
3
4
5
6
SS
SS
SS
SS
SS
SS
2
4
10
15
*
22
20 40 60 80
Standard Penetration
20 40 60 80
Dynamic Cone
50 100 150 200
Shear Strength (FV) kPa
50 100 150 200
Shear Strength (PP) kPa
10 20 30
1.5 m slotted screen
sand pack
50 mm pipe
bentonite seal
and concrete
protective cover
native cave
F. Chartier/C. Helmer
* sampler striking gravel
R. McMillan
Hollow Stem Auger
K. Staples
>
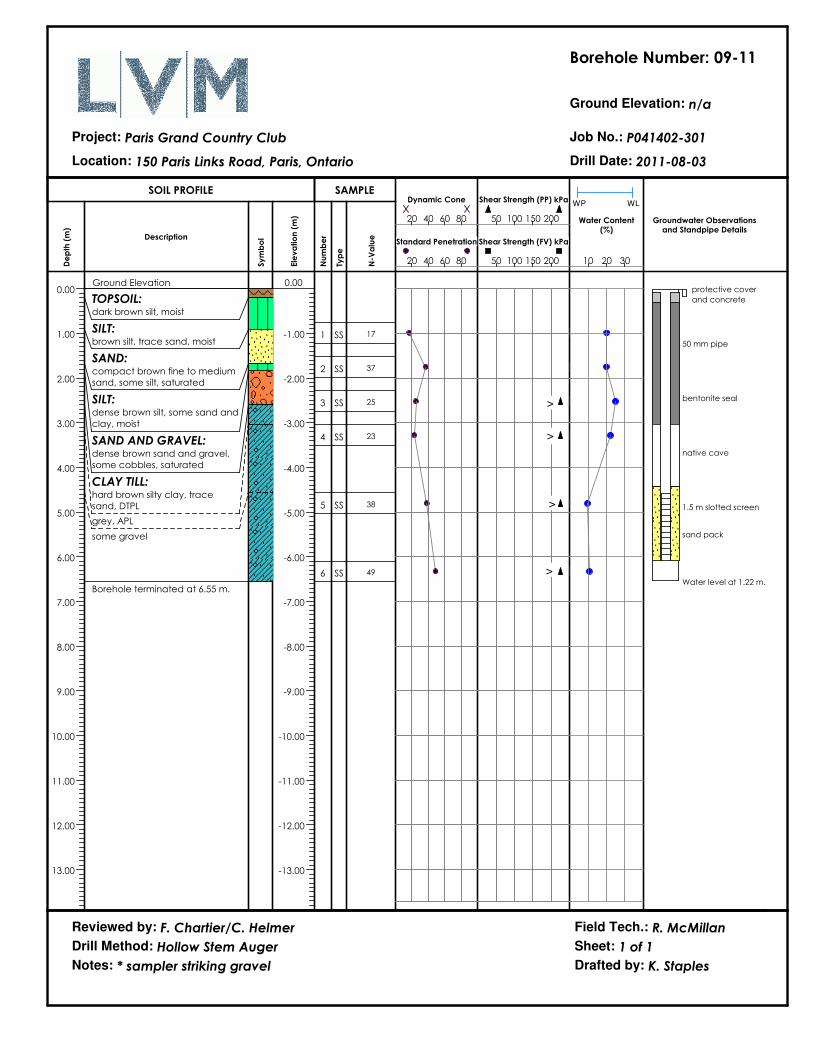
Borehole Number:
Ground Elevation:
Job No.:Project:
Location: Drill Date:
Reviewed by:
Notes:
Field Tech.:
Drill Method: Sheet: 1 of 1
Drafted by:
SOIL PROFILE SAMPLE
Depth (m)
0.00
1.00
2.00
3.00
4.00
5.00
6.00
7.00
8.00
9.00
10.00
11.00
12.00
13.00
Description
Symbol
Elevation (m)
Number
Type
N-Value
Water Content(%)
Groundwater Observationsand Standpipe Details
WP WL
09-11
n/a
P041402-301Paris Grand Country Club
150 Paris Links Road, Paris, Ontario 2011-08-03
Ground Elevation
TOPSOIL:dark brown silt, moist
SILT:brown silt, trace sand, moist
SAND:compact brown fine to medium
sand, some silt, saturated
SILT:dense brown silt, some sand and
clay, moist
SAND AND GRAVEL:dense brown sand and gravel,
some cobbles, saturated
CLAY TILL:hard brown silty clay, trace
sand, DTPL
grey, APL
some gravel
Borehole terminated at 6.55 m.
0.00
-1.00
-2.00
-3.00
-4.00
-5.00
-6.00
-7.00
-8.00
-9.00
-10.00
-11.00
-12.00
-13.00
1
2
3
4
5
6
SS
SS
SS
SS
SS
SS
17
37
25
23
38
49
20 40 60 80
Standard Penetration
20 40 60 80
Dynamic Cone
50 100 150 200
Shear Strength (FV) kPa
50 100 150 200
Shear Strength (PP) kPa
10 20 30
1.5 m slotted screen
sand pack
50 mm pipe
bentonite seal
and concrete
protective cover
native cave
Water level at 1.22 m.
F. Chartier/C. Helmer
* sampler striking gravel
R. McMillan
Hollow Stem Auger
K. Staples
>
>
>
>

Borehole Number:
Ground Elevation:
Job No.:Project:
Location: Drill Date:
Reviewed by:
Notes:
Field Tech.:
Drill Method: Sheet: 1 of 1
Drafted by:
SOIL PROFILE SAMPLE
Depth (m)
0.00
1.00
2.00
3.00
4.00
5.00
6.00
7.00
8.00
9.00
10.00
11.00
12.00
13.00
Description
Symbol
Elevation (m)
Number
Type
N-Value
Water Content(%)
Groundwater Observationsand Standpipe Details
WP WL
09A-11
n/a
P041402-301Paris Grand Country Club
150 Paris Links Road, Paris, Ontario 2011-08-03
Ground Elevation
TOPSOIL:dark brown silt, moist
SILT:brown silt, trace sand, moist
SAND:compact brown fine to medium
sand, some silt, saturated
Borehole terminated at 1.52 m.
0.00
-1.00
-2.00
-3.00
-4.00
-5.00
-6.00
-7.00
-8.00
-9.00
-10.00
-11.00
-12.00
-13.00
20 40 60 80
Standard Penetration
20 40 60 80
Dynamic Cone
50 100 150 200
Shear Strength (FV) kPa
50 100 150 200
Shear Strength (PP) kPa
10 20 30
0.6 m slotted filter
sand pack
19 mm pipe
bentonite seal
protective cover
Upon completion of
excavation, water
level at 0.91 m.
F. Chartier/C. Helmer
Soil stratigraphy inferred from Borehole 09-11.
R. McMillan
Hollow Stem Auger
K. Staples
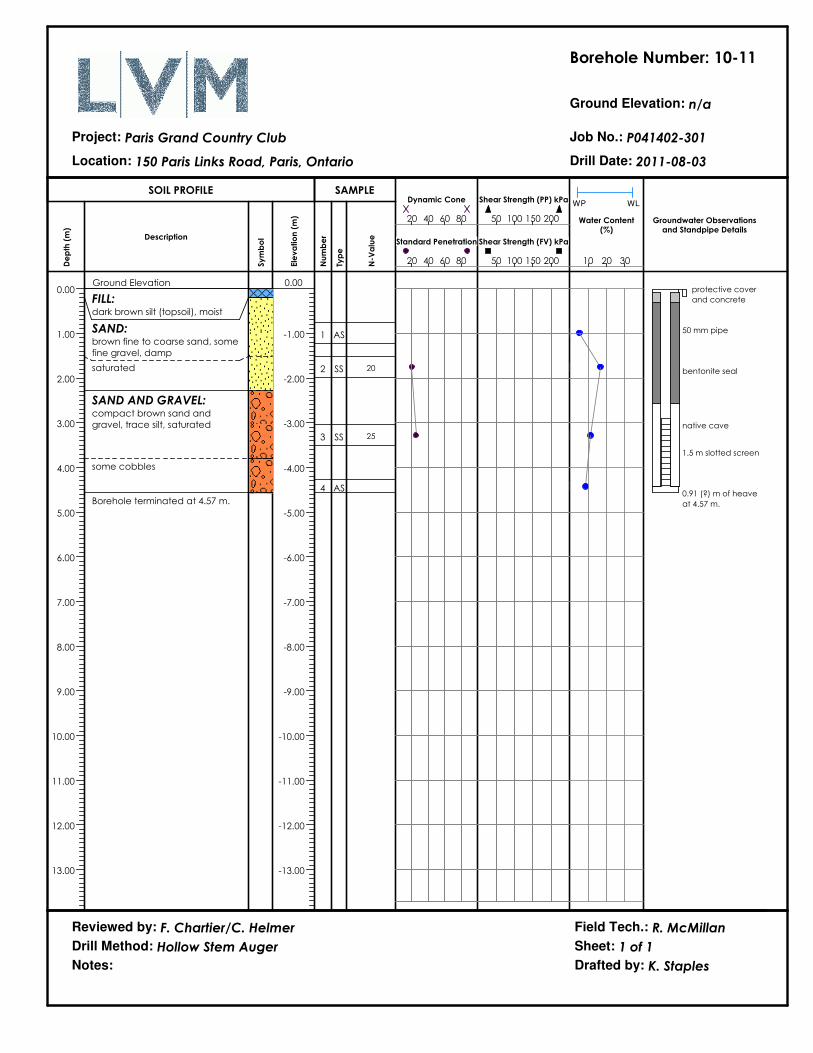
Borehole Number:
Ground Elevation:
Job No.:Project:
Location: Drill Date:
Reviewed by:
Notes:
Field Tech.:
Drill Method: Sheet: 1 of 1
Drafted by:
SOIL PROFILE SAMPLE
Depth (m)
0.00
1.00
2.00
3.00
4.00
5.00
6.00
7.00
8.00
9.00
10.00
11.00
12.00
13.00
Description
Symbol
Elevation (m)
Number
Type
N-Value
Water Content(%)
Groundwater Observationsand Standpipe Details
WP WL
10-11
n/a
P041402-301Paris Grand Country Club
150 Paris Links Road, Paris, Ontario 2011-08-03
Ground Elevation
FILL:dark brown silt (topsoil), moist
SAND:brown fine to coarse sand, some
fine gravel, damp
saturated
SAND AND GRAVEL:compact brown sand and
gravel, trace silt, saturated
some cobbles
Borehole terminated at 4.57 m.
0.00
-1.00
-2.00
-3.00
-4.00
-5.00
-6.00
-7.00
-8.00
-9.00
-10.00
-11.00
-12.00
-13.00
1
2
3
4
AS
SS
SS
AS
20
25
20 40 60 80
Standard Penetration
20 40 60 80
Dynamic Cone
50 100 150 200
Shear Strength (FV) kPa
50 100 150 200
Shear Strength (PP) kPa
10 20 30
1.5 m slotted screen
native cave
50 mm pipe
bentonite seal
protective cover
and concrete
0.91 (?) m of heave
at 4.57 m.
F. Chartier/C. Helmer R. McMillan
Hollow Stem Auger
K. Staples

Borehole Number:
Ground Elevation:
Job No.:Project:
Location: Drill Date:
Reviewed by:
Notes:
Field Tech.:
Drill Method: Sheet: 1 of 1
Drafted by:
SOIL PROFILE SAMPLE
Depth (m)
0.00
1.00
2.00
3.00
4.00
5.00
6.00
7.00
8.00
9.00
10.00
11.00
12.00
13.00
Description
Symbol
Elevation (m)
Number
Type
N-Value
Water Content(%)
Groundwater Observationsand Standpipe Details
WP WL
10A-11
n/a
P041402-301Paris Grand Country Club
150 Paris Links Road, Paris, Ontario 2011-08-03
Ground Elevation
FILL:dark brown silt (topsoil), moist
SAND:brown fine to coarse sand, some
fine gravel, damp
saturated
SAND AND GRAVEL:compact brown sand and
gravel, trace silt, saturated
some cobbles
Borehole terminated at 4.57 m.
0.00
-1.00
-2.00
-3.00
-4.00
-5.00
-6.00
-7.00
-8.00
-9.00
-10.00
-11.00
-12.00
-13.00
20 40 60 80
Standard Penetration
20 40 60 80
Dynamic Cone
50 100 150 200
Shear Strength (FV) kPa
50 100 150 200
Shear Strength (PP) kPa
10 20 30
protective cover
bentonite seal
native cave
19 mm pipes
150 mm slotted filter
150 mm slotted filter
F. Chartier/C. Helmer
Soil stratigraphy inferred from Borehole 10-11.
R. McMillan
Hollow Stem Auger
K. Staples

Borehole Number:
Ground Elevation:
Job No.:Project:
Location: Drill Date:
Reviewed by:
Notes:
Field Tech.:
Drill Method: Sheet: 1 of 1
Drafted by:
SOIL PROFILE SAMPLE
Depth (m)
0.00
1.00
2.00
3.00
4.00
5.00
6.00
7.00
8.00
9.00
10.00
11.00
12.00
13.00
Description
Symbol
Elevation (m)
Number
Type
N-Value
Water Content(%)
Groundwater Observationsand Standpipe Details
WP WL
11-11
n/a
P041402-301Paris Grand Country Club
150 Paris Links Road, Paris, Ontario 2011-08-02
Ground Elevation
TOPSOIL:dark brown silt, moist
SAND:brown silty fine sand, damp
SAND AND GRAVEL:compact brown sand and
gravel, frequent cobbles and
boulders, trace silt, damp
dense
SAND:compact brown fine to coarse
sand, trace silt and fine gravel,
damp
saturated
Borehole terminated at 11.43 m.
0.00
-1.00
-2.00
-3.00
-4.00
-5.00
-6.00
-7.00
-8.00
-9.00
-10.00
-11.00
-12.00
-13.00
1
2
3
4
SS
SS
SS
SS
22
21
38
20
20 40 60 80
Standard Penetration
20 40 60 80
Dynamic Cone
50 100 150 200
Shear Strength (FV) kPa
50 100 150 200
Shear Strength (PP) kPa
10 20 30
1.5 m slotted screen
50 mm pipe
bentonite seal
native backfill
protective cover
and concrete
F. Chartier/C. Helmer R. McMillan
Hollow Stem Auger
K. Staples

Borehole Number:
Ground Elevation:
Job No.:Project:
Location: Drill Date:
Reviewed by:
Notes:
Field Tech.:
Drill Method: Sheet: 1 of 1
Drafted by:
SOIL PROFILE SAMPLE
Depth (m)
0.00
1.00
2.00
3.00
4.00
5.00
6.00
7.00
8.00
9.00
10.00
11.00
12.00
13.00
Description
Symbol
Elevation (m)
Number
Type
N-Value
Water Content(%)
Groundwater Observationsand Standpipe Details
WP WL
12-11
n/a
P041402-301Paris Grand Country Club
150 Paris Links Road, Paris, Ontario 2011-08-02
Ground Elevation
TOPSOIL:dark brown silt, moist
SILT:brown sandy silt, some gravel,
damp
SAND AND GRAVEL:dense brown sand and gravel,
frequent cobbles, trace silt,
damp
saturated
SAND:compact brown fine to coarse
sand, some gravel, saturated
Borehole terminated at 7.62 m.
0.00
-1.00
-2.00
-3.00
-4.00
-5.00
-6.00
-7.00
-8.00
-9.00
-10.00
-11.00
-12.00
-13.00
1
2
3
4
5
SS
SS
SS
SS
AS
24
44
39
22
20 40 60 80
Standard Penetration
20 40 60 80
Dynamic Cone
50 100 150 200
Shear Strength (FV) kPa
50 100 150 200
Shear Strength (PP) kPa
10 20 30
1.5 m slotted screen
50 mm pipe
bentonite seal
sand pack
protective cover
* pls confirm *
1.07 m of heave at
7.62 m.
F. Chartier/C. Helmer R. McMillan
Hollow Stem Auger
K. Staples

Borehole Number:
Ground Elevation:
Job No.:Project:
Location: Drill Date:
Reviewed by:
Notes:
Field Tech.:
Drill Method: Sheet: 1 of 1
Drafted by:
SOIL PROFILE SAMPLE
Depth (m)
0.00
1.00
2.00
3.00
4.00
5.00
6.00
7.00
8.00
9.00
10.00
11.00
12.00
13.00
Description
Symbol
Elevation (m)
Number
Type
N-Value
Water Content(%)
Groundwater Observationsand Standpipe Details
WP WL
13-11
n/a
P041402-301Paris Grand Country Club
150 Paris Links Road, Paris, Ontario 2011-08-02
Ground Elevation
TOPSOIL:dark brown silt, moist
SAND:brown silty fine sand, trace
gravel, damp
SAND AND GRAVEL:very dense brown sand and
gravel, frequent cobbles and
boulders, damp
* very difficult drilling
saturated
Borehole terminated at 6.10 m
wih 1.22 m of heave.
0.00
-1.00
-2.00
-3.00
-4.00
-5.00
-6.00
-7.00
-8.00
-9.00
-10.00
-11.00
-12.00
-13.00
1
2
SS
SS
*
35\150mm
20 40 60 80
Standard Penetration
20 40 60 80
Dynamic Cone
50 100 150 200
Shear Strength (FV) kPa
50 100 150 200
Shear Strength (PP) kPa
10 20 30
1.5 m slotted screen
50 mm pipe
bentonite seal
native cave
protective cover
and concrete
F. Chartier/C. Helmer
* sampler striking cobble
R. McMillan
Hollow Stem Auger
K. Staples
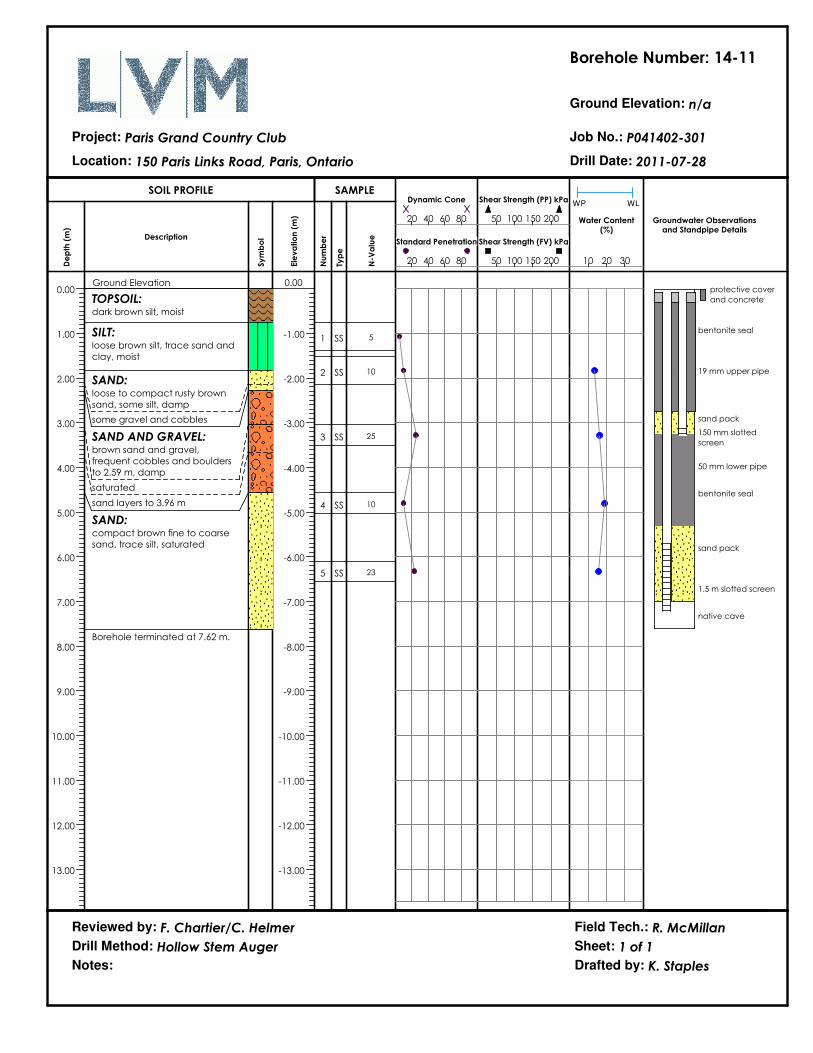
Borehole Number:
Ground Elevation:
Job No.:Project:
Location: Drill Date:
Reviewed by:
Notes:
Field Tech.:
Drill Method: Sheet: 1 of 1
Drafted by:
SOIL PROFILE SAMPLE
Depth (m)
0.00
1.00
2.00
3.00
4.00
5.00
6.00
7.00
8.00
9.00
10.00
11.00
12.00
13.00
Description
Symbol
Elevation (m)
Number
Type
N-Value
Water Content(%)
Groundwater Observationsand Standpipe Details
WP WL
14-11
n/a
P041402-301Paris Grand Country Club
150 Paris Links Road, Paris, Ontario 2011-07-28
Ground Elevation
TOPSOIL:dark brown silt, moist
SILT:loose brown silt, trace sand and
clay, moist
SAND:loose to compact rusty brown
sand, some silt, damp
some gravel and cobbles
SAND AND GRAVEL:brown sand and gravel,
frequent cobbles and boulders
to 2.59 m, damp
saturated
sand layers to 3.96 m
SAND:compact brown fine to coarse
sand, trace silt, saturated
Borehole terminated at 7.62 m.
0.00
-1.00
-2.00
-3.00
-4.00
-5.00
-6.00
-7.00
-8.00
-9.00
-10.00
-11.00
-12.00
-13.00
1
2
3
4
5
SS
SS
SS
SS
SS
5
10
25
10
23
20 40 60 80
Standard Penetration
20 40 60 80
Dynamic Cone
50 100 150 200
Shear Strength (FV) kPa
50 100 150 200
Shear Strength (PP) kPa
10 20 30
protective cover
and concrete
50 mm lower pipe
bentonite seal
native cave
19 mm upper pipe
150 mm slotted
screen
1.5 m slotted screen
sand pack
sand pack
bentonite seal
F. Chartier/C. Helmer R. McMillan
Hollow Stem Auger
K. Staples

Borehole Number:
Ground Elevation:
Job No.:Project:
Location: Drill Date:
Reviewed by:
Notes:
Field Tech.:
Drill Method: Sheet: 1 of 1
Drafted by:
SOIL PROFILE SAMPLE
Depth (m)
0.00
1.00
2.00
3.00
4.00
5.00
6.00
7.00
8.00
9.00
10.00
11.00
12.00
13.00
Description
Symbol
Elevation (m)
Number
Type
N-Value
Water Content(%)
Groundwater Observationsand Standpipe Details
WP WL
15-11
n/a
P041402-301Paris Grand Country Club
150 Paris Links Road, Paris, Ontario 2011-08-16
Ground Elevation
TOPSOIL:dark brown silt, some sand, moist
SAND AND GRAVEL:compact brown sand and
gravel, some silt, damp
dense
moist
SAND:compact brown, medium sand,
trace silt and gravel, damp
SAND AND GRAVEL:very dense brown and grey
sand and gravel, some silt,
occasional cobbles, moist
SAND:dense brown fine sand, some silt,
trace gravel, damp
moist to very moist
silty sand, wet
SILT:dense brown silt, some fine sand
and clay, trace fine gravel, wet
SAND:dense brown silty fine sand,
trace fine gravel, very moist to
wet
SAND AND GRAVEL:very dense brown silty sand and
gravel, wet to saturated
Borehole terminated at 12.50 m.
0.00
-1.00
-2.00
-3.00
-4.00
-5.00
-6.00
-7.00
-8.00
-9.00
-10.00
-11.00
-12.00
-13.00
1
2
3
4
5
6
7
8
9
10
SS
SS
SS
SS
SS
SS
SS
SS
SS
SS
26
44
24
24
56
37
39
31
41
50\150mm
20 40 60 80
Standard Penetration
20 40 60 80
Dynamic Cone
50 100 150 200
Shear Strength (FV) kPa
50 100 150 200
Shear Strength (PP) kPa
10 20 30
1.5 m slotted screen
sand pack
50 mm pipe
bentonite seal
protective cover
and concrete
F. Chartier/C. Helmer D. Souter
Hollow Stem Auger
K. Staples

Borehole Number:
Ground Elevation:
Job No.:Project:
Location: Drill Date:
Reviewed by:
Notes:
Field Tech.:
Drill Method: Sheet: 1 of 1
Drafted by:
SOIL PROFILE SAMPLE
Depth (m)
0.00
1.00
2.00
3.00
4.00
5.00
6.00
7.00
8.00
9.00
10.00
11.00
12.00
13.00
Description
Symbol
Elevation (m)
Number
Type
N-Value
Water Content(%)
Groundwater Observationsand Standpipe Details
WP WL
16-11
n/a
P041402-301Paris Grand Country Club
150 Paris Links Road, Paris, Ontario 2011-08-16
Ground Elevation
TOPSOIL:dark brown silt, some sand, trace
gravel, moist
SILT:very loose grey/brown silt, some
sand and clay, very moist
PEAT:very loose dark brown fibrous
peat, very moist
SILT TILL:very loose brown silt, some clay,
trace fine sand and gravel, wet
SAND AND GRAVEL:loose brown silty sand and
gravel, saturated
compact
SAND:compact brown silty sand, trace
gravel, saturated
SILT TILL:dense brown silt, some fine sand
and clay, trace fine gravel,
moist
some wet sand layers
Borehole terminated at 6.55 m.
0.00
-1.00
-2.00
-3.00
-4.00
-5.00
-6.00
-7.00
-8.00
-9.00
-10.00
-11.00
-12.00
-13.00
1
2
3
4
5
6
SS
SS
SS
SS
SS
SS
2
3
8
18
24
37
20 40 60 80
Standard Penetration
20 40 60 80
Dynamic Cone
50 100 150 200
Shear Strength (FV) kPa
50 100 150 200
Shear Strength (PP) kPa
10 20 30
3.0 m slotted screen
sand pack
50 mm pipe
bentonite seal
protective cover
and concrete
F. Chartier/C. Helmer D. Souter
Hollow Stem Auger
K. Staples

Borehole Number:
Ground Elevation:
Job No.:Project:
Location: Drill Date:
Reviewed by:
Notes:
Field Tech.:
Drill Method: Sheet: 1 of 1
Drafted by:
SOIL PROFILE SAMPLE
Depth (m)
0.00
1.00
2.00
3.00
4.00
5.00
6.00
7.00
8.00
9.00
10.00
11.00
12.00
13.00
Description
Symbol
Elevation (m)
Number
Type
N-Value
Water Content(%)
Groundwater Observationsand Standpipe Details
WP WL
16A-11
n/a
P041402-301Paris Grand Country Club
150 Paris Links Road, Paris, Ontario 2011-08-16
Ground Elevation
TOPSOIL:dark brown silt, some sand, trace
gravel, moist
SILT:very loose grey/brown silt, some
sand and clay, very moist
PEAT:very loose dark brown fibrous
peat, very moist
SILT TILL:very loose brown silt, some clay,
trace fine sand and gravel, wet
Borehole terminated at 2.29 m.
0.00
-1.00
-2.00
-3.00
-4.00
-5.00
-6.00
-7.00
-8.00
-9.00
-10.00
-11.00
-12.00
-13.00
20 40 60 80
Standard Penetration
20 40 60 80
Dynamic Cone
50 100 150 200
Shear Strength (FV) kPa
50 100 150 200
Shear Strength (PP) kPa
10 20 30
0.8 m slotted screen
sand pack
19 mm pipe
bentonite seal
protective cover
and concrete
F. Chartier/C. Helmer
Soil stratigraphy inferred from Borehole 16-11.
D. Souter
Hollow Stem Auger
K. Staples
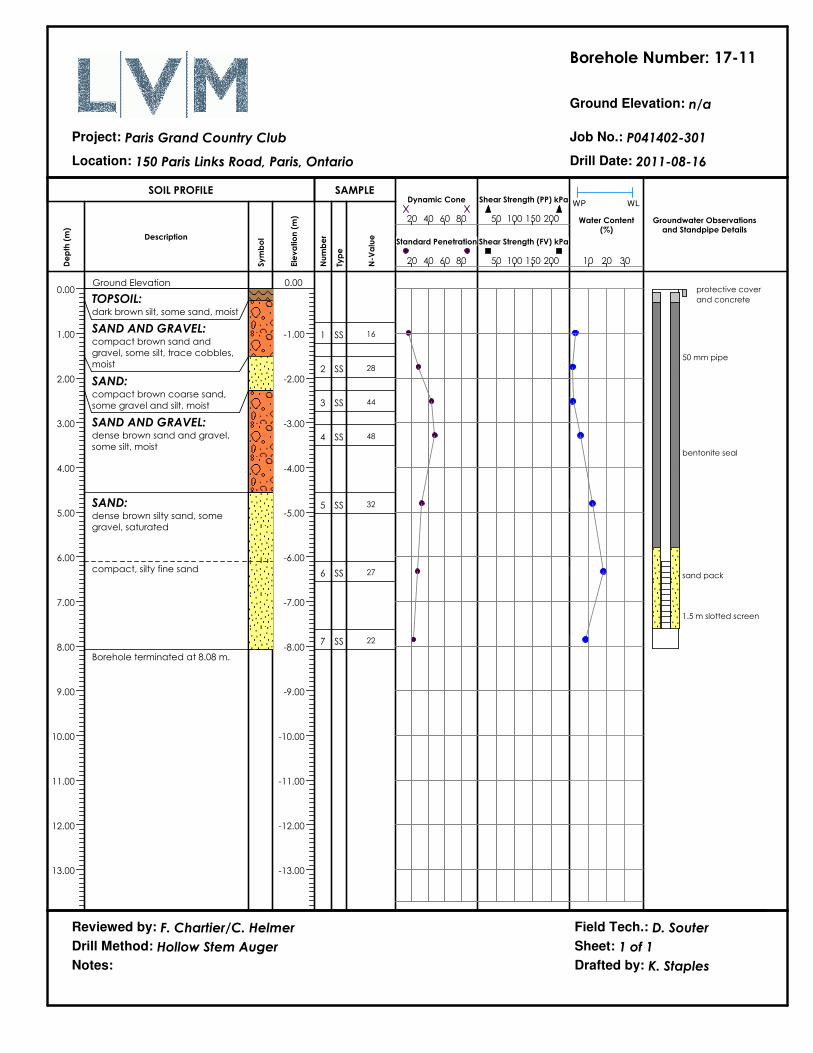
Borehole Number:
Ground Elevation:
Job No.:Project:
Location: Drill Date:
Reviewed by:
Notes:
Field Tech.:
Drill Method: Sheet: 1 of 1
Drafted by:
SOIL PROFILE SAMPLE
Depth (m)
0.00
1.00
2.00
3.00
4.00
5.00
6.00
7.00
8.00
9.00
10.00
11.00
12.00
13.00
Description
Symbol
Elevation (m)
Number
Type
N-Value
Water Content(%)
Groundwater Observationsand Standpipe Details
WP WL
17-11
n/a
P041402-301Paris Grand Country Club
150 Paris Links Road, Paris, Ontario 2011-08-16
Ground Elevation
TOPSOIL:dark brown silt, some sand, moist
SAND AND GRAVEL:compact brown sand and
gravel, some silt, trace cobbles,
moist
SAND:compact brown coarse sand,
some gravel and silt, moist
SAND AND GRAVEL:dense brown sand and gravel,
some silt, moist
SAND:dense brown silty sand, some
gravel, saturated
compact, silty fine sand
Borehole terminated at 8.08 m.
0.00
-1.00
-2.00
-3.00
-4.00
-5.00
-6.00
-7.00
-8.00
-9.00
-10.00
-11.00
-12.00
-13.00
1
2
3
4
5
6
7
SS
SS
SS
SS
SS
SS
SS
16
28
44
48
32
27
22
20 40 60 80
Standard Penetration
20 40 60 80
Dynamic Cone
50 100 150 200
Shear Strength (FV) kPa
50 100 150 200
Shear Strength (PP) kPa
10 20 30
1.5 m slotted screen
sand pack
50 mm pipe
bentonite seal
protective cover
and concrete
F. Chartier/C. Helmer D. Souter
Hollow Stem Auger
K. Staples
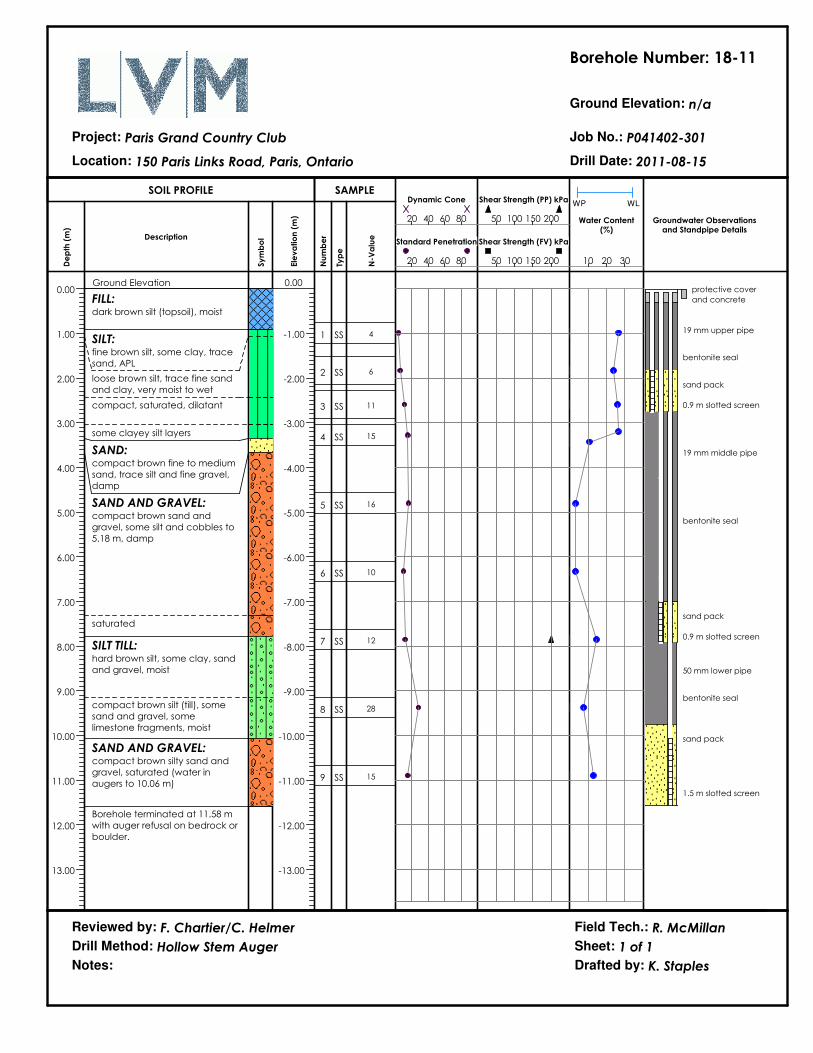
Borehole Number:
Ground Elevation:
Job No.:Project:
Location: Drill Date:
Reviewed by:
Notes:
Field Tech.:
Drill Method: Sheet: 1 of 1
Drafted by:
SOIL PROFILE SAMPLE
Depth (m)
0.00
1.00
2.00
3.00
4.00
5.00
6.00
7.00
8.00
9.00
10.00
11.00
12.00
13.00
Description
Symbol
Elevation (m)
Number
Type
N-Value
Water Content(%)
Groundwater Observationsand Standpipe Details
WP WL
18-11
n/a
P041402-301Paris Grand Country Club
150 Paris Links Road, Paris, Ontario 2011-08-15
Ground Elevation
FILL:dark brown silt (topsoil), moist
SILT:fine brown silt, some clay, trace
sand, APL
loose brown silt, trace fine sand
and clay, very moist to wet
compact, saturated, dilatant
some clayey silt layers
SAND:compact brown fine to medium
sand, trace silt and fine gravel,
damp
SAND AND GRAVEL:compact brown sand and
gravel, some silt and cobbles to
5.18 m, damp
saturated
SILT TILL:hard brown silt, some clay, sand
and gravel, moist
compact brown silt (till), some
sand and gravel, some
limestone fragments, moist
SAND AND GRAVEL:compact brown silty sand and
gravel, saturated (water in
augers to 10.06 m)
Borehole terminated at 11.58 m
with auger refusal on bedrock or
boulder.
0.00
-1.00
-2.00
-3.00
-4.00
-5.00
-6.00
-7.00
-8.00
-9.00
-10.00
-11.00
-12.00
-13.00
1
2
3
4
5
6
7
8
9
SS
SS
SS
SS
SS
SS
SS
SS
SS
4
6
11
15
16
10
12
28
15
20 40 60 80
Standard Penetration
20 40 60 80
Dynamic Cone
50 100 150 200
Shear Strength (FV) kPa
50 100 150 200
Shear Strength (PP) kPa
10 20 30
0.9 m slotted screen
0.9 m slotted screen
1.5 m slotted screen
19 mm upper pipe
19 mm middle pipe
50 mm lower pipe
sand pack
sand pack
sand pack
bentonite seal
bentonite seal
bentonite seal
protective cover
and concrete
F. Chartier/C. Helmer R. McMillan
Hollow Stem Auger
K. Staples

Borehole Number:
Ground Elevation:
Job No.:Project:
Location: Drill Date:
Reviewed by:
Notes:
Field Tech.:
Drill Method: Sheet: 1 of 1
Drafted by:
SOIL PROFILE SAMPLE
Depth (m)
0.00
1.00
2.00
3.00
4.00
5.00
6.00
7.00
8.00
9.00
10.00
11.00
12.00
13.00
Description
Symbol
Elevation (m)
Number
Type
N-Value
Water Content(%)
Groundwater Observationsand Standpipe Details
WP WL
19-11
n/a
P041402-301Paris Grand Country Club
150 Paris Links Road, Paris, Ontario 2011-08-15
Ground Elevation
TOPSOIL:dark brown silt, moist
SILT:firm brown silt, some clay, some
brown clayey silt layers, APL
SAND AND GRAVEL:dense brown sand and gravel,
trace silt, damp
SILT TILL:hard brown silt, some clay, trace
sand and gravel, DTPL; some
clayey silt layers, APL
boulder to 3.35 m
SAND TILL:loose to compact brown silty
sand (till), some gravel and
cobbles, moist (free
groundwater on gravel at 4.11
m)
frequent limestone fragments
boulder to 6.02 m
highly weathered grey limestone
with sand and silt layers, free
groundwater
Borehole terminated at 10.06 m
with auger refusal on possible
bedrock.
0.00
-1.00
-2.00
-3.00
-4.00
-5.00
-6.00
-7.00
-8.00
-9.00
-10.00
-11.00
-12.00
-13.00
1
2
3
4
5
6
7
8
SS
SS
SS
SS
SS
SS
SS
SS
6
45
30
7
13
17
18\150mm
26
20 40 60 80
Standard Penetration
20 40 60 80
Dynamic Cone
50 100 150 200
Shear Strength (FV) kPa
50 100 150 200
Shear Strength (PP) kPa
10 20 30
0.8 m slotted screen
sand pack
50 mm pipe
bentonite seal
protective cover
and concrete
F. Chartier/C. Helmer R. McMillan
Hollow Stem Auger
K. Staples
>
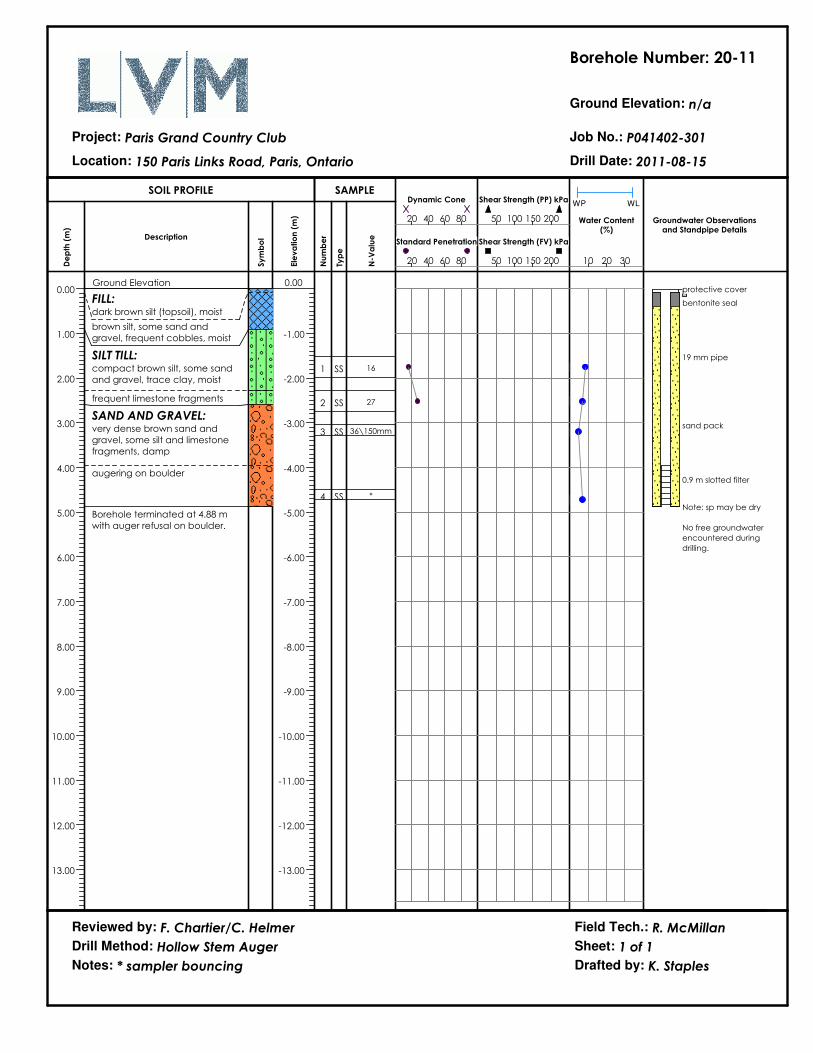
Borehole Number:
Ground Elevation:
Job No.:Project:
Location: Drill Date:
Reviewed by:
Notes:
Field Tech.:
Drill Method: Sheet: 1 of 1
Drafted by:
SOIL PROFILE SAMPLE
Depth (m)
0.00
1.00
2.00
3.00
4.00
5.00
6.00
7.00
8.00
9.00
10.00
11.00
12.00
13.00
Description
Symbol
Elevation (m)
Number
Type
N-Value
Water Content(%)
Groundwater Observationsand Standpipe Details
WP WL
20-11
n/a
P041402-301Paris Grand Country Club
150 Paris Links Road, Paris, Ontario 2011-08-15
Ground Elevation
FILL:dark brown silt (topsoil), moist
brown silt, some sand and
gravel, frequent cobbles, moist
SILT TILL:compact brown silt, some sand
and gravel, trace clay, moist
frequent limestone fragments
SAND AND GRAVEL:very dense brown sand and
gravel, some silt and limestone
fragments, damp
augering on boulder
Borehole terminated at 4.88 m
with auger refusal on boulder.
0.00
-1.00
-2.00
-3.00
-4.00
-5.00
-6.00
-7.00
-8.00
-9.00
-10.00
-11.00
-12.00
-13.00
1
2
3
4
SS
SS
SS
SS
16
27
36\150mm
*
20 40 60 80
Standard Penetration
20 40 60 80
Dynamic Cone
50 100 150 200
Shear Strength (FV) kPa
50 100 150 200
Shear Strength (PP) kPa
10 20 30
0.9 m slotted filter
sand pack
19 mm pipe
protective cover
bentonite seal
Note: sp may be dry
No free groundwater
encountered during
drilling.
F. Chartier/C. Helmer
* sampler bouncing
R. McMillan
Hollow Stem Auger
K. Staples

Appendix B
Preliminary Storm Sewer Design Calculations
Ap
pen
dix B
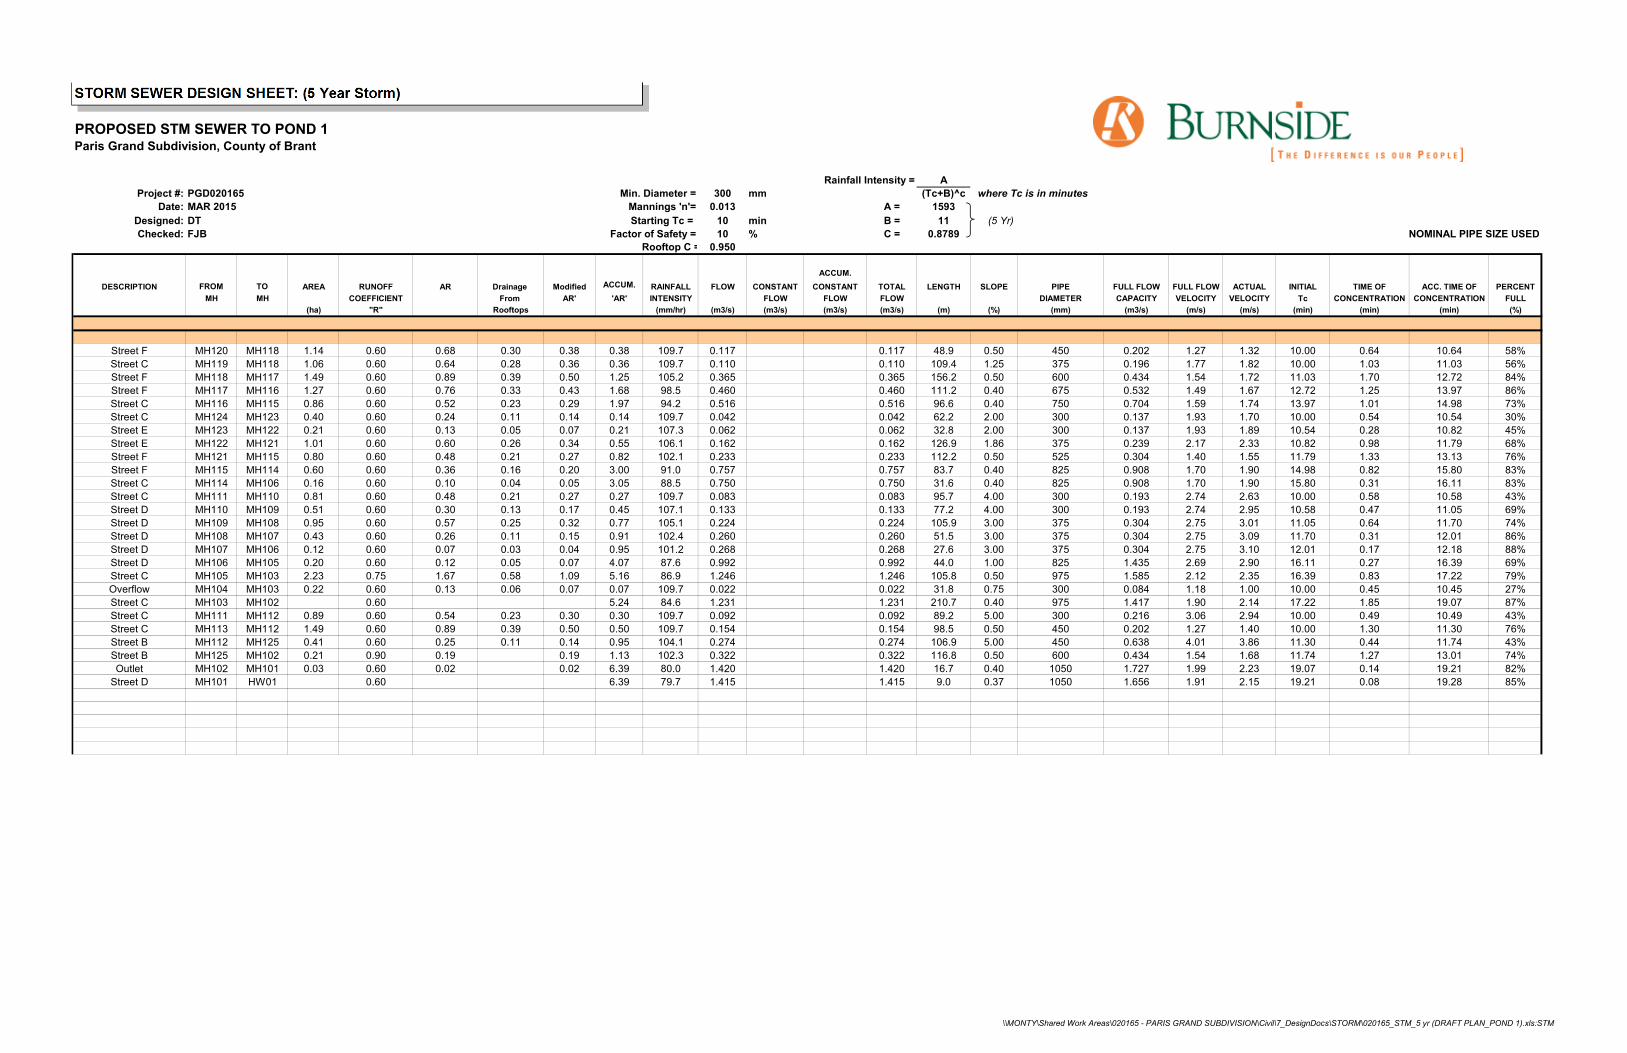
STORM SEWER DESIGN SHEET: (5 Year Storm)
PROPOSED STM SEWER TO POND 1Paris Grand Subdivision, County of Brant
Rainfall Intensity = A
Project #: PGD020165 Min. Diameter = 300 mm (Tc+B)^c where Tc is in minutes
Date: MAR 2015 Mannings 'n'= 0.013 A = 1593
Designed: DT Starting Tc = 10 min B = 11 (5 Yr)
Checked: FJB Factor of Safety = 10 % C = 0.8789 NOMINAL PIPE SIZE USED
Rooftop C = 0.950
ACCUM.
DESCRIPTION FROM TO AREA RUNOFF AR Drainage Modified ACCUM. RAINFALL FLOW CONSTANT CONSTANT TOTAL LENGTH SLOPE PIPE FULL FLOW FULL FLOW ACTUAL INITIAL TIME OF ACC. TIME OF PERCENT
MH MH COEFFICIENT From AR' 'AR' INTENSITY FLOW FLOW FLOW DIAMETER CAPACITY VELOCITY VELOCITY Tc CONCENTRATION CONCENTRATION FULL
(ha) "R" Rooftops (mm/hr) (m3/s) (m3/s) (m3/s) (m3/s) (m) (%) (mm) (m3/s) (m/s) (m/s) (min) (min) (min) (%)
Street F MH120 MH118 1.14 0.60 0.68 0.30 0.38 0.38 109.7 0.117 0.000 0.000 0.117 48.9 0.50 450 0.202 1.27 1.32 10.00 0.64 10.64 58%
Street C MH119 MH118 1.06 0.60 0.64 0.28 0.36 0.36 109.7 0.110 0.000 0.000 0.110 109.4 1.25 375 0.196 1.77 1.82 10.00 1.03 11.03 56%
Street F MH118 MH117 1.49 0.60 0.89 0.39 0.50 1.25 105.2 0.365 0.000 0.000 0.365 156.2 0.50 600 0.434 1.54 1.72 11.03 1.70 12.72 84%
Street F MH117 MH116 1.27 0.60 0.76 0.33 0.43 1.68 98.5 0.460 0.000 0.000 0.460 111.2 0.40 675 0.532 1.49 1.67 12.72 1.25 13.97 86%
Street C MH116 MH115 0.86 0.60 0.52 0.23 0.29 1.97 94.2 0.516 0.000 0.000 0.516 96.6 0.40 750 0.704 1.59 1.74 13.97 1.01 14.98 73%
Street C MH124 MH123 0.40 0.60 0.24 0.11 0.14 0.14 109.7 0.042 0.000 0.000 0.042 62.2 2.00 300 0.137 1.93 1.70 10.00 0.54 10.54 30%
Street E MH123 MH122 0.21 0.60 0.13 0.05 0.07 0.21 107.3 0.062 0.000 0.000 0.062 32.8 2.00 300 0.137 1.93 1.89 10.54 0.28 10.82 45%
Street E MH122 MH121 1.01 0.60 0.60 0.26 0.34 0.55 106.1 0.162 0.000 0.000 0.162 126.9 1.86 375 0.239 2.17 2.33 10.82 0.98 11.79 68%
Street F MH121 MH115 0.80 0.60 0.48 0.21 0.27 0.82 102.1 0.233 0.000 0.000 0.233 112.2 0.50 525 0.304 1.40 1.55 11.79 1.33 13.13 76%
Street F MH115 MH114 0.60 0.60 0.36 0.16 0.20 3.00 91.0 0.757 0.000 0.000 0.757 83.7 0.40 825 0.908 1.70 1.90 14.98 0.82 15.80 83%
Street C MH114 MH106 0.16 0.60 0.10 0.04 0.05 3.05 88.5 0.750 0.000 0.000 0.750 31.6 0.40 825 0.908 1.70 1.90 15.80 0.31 16.11 83%
Street C MH111 MH110 0.81 0.60 0.48 0.21 0.27 0.27 109.7 0.083 0.000 0.000 0.083 95.7 4.00 300 0.193 2.74 2.63 10.00 0.58 10.58 43%
Street D MH110 MH109 0.51 0.60 0.30 0.13 0.17 0.45 107.1 0.133 0.000 0.000 0.133 77.2 4.00 300 0.193 2.74 2.95 10.58 0.47 11.05 69%
Street D MH109 MH108 0.95 0.60 0.57 0.25 0.32 0.77 105.1 0.224 0.000 0.000 0.224 105.9 3.00 375 0.304 2.75 3.01 11.05 0.64 11.70 74%
Street D MH108 MH107 0.43 0.60 0.26 0.11 0.15 0.91 102.4 0.260 0.000 0.000 0.260 51.5 3.00 375 0.304 2.75 3.09 11.70 0.31 12.01 86%
Street D MH107 MH106 0.12 0.60 0.07 0.03 0.04 0.95 101.2 0.268 0.000 0.000 0.268 27.6 3.00 375 0.304 2.75 3.10 12.01 0.17 12.18 88%
Street D MH106 MH105 0.20 0.60 0.12 0.05 0.07 4.07 87.6 0.992 0.000 0.000 0.992 44.0 1.00 825 1.435 2.69 2.90 16.11 0.27 16.39 69%
Street C MH105 MH103 2.23 0.75 1.67 0.58 1.09 5.16 86.9 1.246 0.000 0.000 1.246 105.8 0.50 975 1.585 2.12 2.35 16.39 0.83 17.22 79%
Overflow MH104 MH103 0.22 0.60 0.13 0.06 0.07 0.07 109.7 0.022 0.000 0.000 0.022 31.8 0.75 300 0.084 1.18 1.00 10.00 0.45 10.45 27%
Street C MH103 MH102 0.00 0.60 0.00 0.00 0.00 5.24 84.6 1.231 0.000 0.000 1.231 210.7 0.40 975 1.417 1.90 2.14 17.22 1.85 19.07 87%
Street C MH111 MH112 0.89 0.60 0.54 0.23 0.30 0.30 109.7 0.092 0.000 0.000 0.092 89.2 5.00 300 0.216 3.06 2.94 10.00 0.49 10.49 43%
Street C MH113 MH112 1.49 0.60 0.89 0.39 0.50 0.50 109.7 0.154 0.000 0.000 0.154 98.5 0.50 450 0.202 1.27 1.40 10.00 1.30 11.30 76%
Street B MH112 MH125 0.41 0.60 0.25 0.11 0.14 0.95 104.1 0.274 0.000 0.000 0.274 106.9 5.00 450 0.638 4.01 3.86 11.30 0.44 11.74 43%
Street B MH125 MH102 0.21 0.90 0.19 0.19 1.13 102.3 0.322 0.000 0.000 0.322 116.8 0.50 600 0.434 1.54 1.68 11.74 1.27 13.01 74%
Outlet MH102 MH101 0.03 0.60 0.02 0.02 6.39 80.0 1.420 0.000 0.000 1.420 16.7 0.40 1050 1.727 1.99 2.23 19.07 0.14 19.21 82%
Street D MH101 HW01 0.00 0.60 0.00 6.39 79.7 1.415 0.000 0.000 1.415 9.0 0.37 1050 1.656 1.91 2.15 19.21 0.08 19.28 85%
0 0.00 0.00 0.00 0.00 0.0 0.000 0.000 0.000 0.000 0.0 0.00 0 0.000 0.00 0.00 0.00 0.00 0.00 0%
0 0.00 0.00 0.00 0.00 0.0 0.000 0.000 0.000 0.000 0.0 0.00 0 0.000 0.00 0.00 0.00 0.00 0.00 0%
0 0.00 0.00 0.00 0.00 0.0 0.000 0.000 0.000 0.000 0.0 0.00 0 0.000 0.00 0.00 0.00 0.00 0.00 0%
0 0.00 0.00 0.00 0.00 0.0 0.000 0.000 0.000 0.000 0.0 0.00 0 0.000 0.00 0.00 0.00 0.00 0.00 0%
0 0.00 0.00 0.00 0.00 0.0 0.000 0.000 0.000 0.000 0.0 0.00 0 0.000 0.00 0.00 0.00 0.00 0.00 0%
\\MONTY\Shared Work Areas\020165 � PARIS GRAND SUBDIVISION\Civil\7_DesignDocs\STORM\020165_STM_5 yr (DRAFT PLAN_POND 1).xls:STM

STORM SEWER DESIGN SHEET: (5 Year Storm)
PROPOSED STM SEWER TO POND 2Paris Grand Subdivision, County of Brant
Rainfall Intensity = A
Project #: PGD020165 Min. Diameter = 300 mm (Tc+B)^c where Tc is in minutes
Date: MAR 2015 Mannings 'n'= 0.013 A = 1593
Designed: DT Starting Tc = 10 min B = 11 (5 Yr)
Checked: FJB Factor of Safety = 10 % C = 0.8789 NOMINAL PIPE SIZE USED
ACCUM.
DESCRIPTION FROM TO AREA RUNOFF 'AR' ACCUM. RAINFALL FLOW CONSTANT CONSTANT TOTAL LENGTH SLOPE PIPE FULL FLOW FULL FLOW ACTUAL INITIAL TIME OF ACC. TIME OF PERCENT
MH MH COEFFICIENT 'AR' INTENSITY FLOW FLOW FLOW DIAMETER CAPACITY VELOCITY VELOCITY Tc CONCENTRATION CONCENTRATION FULL
(ha) "R" (mm/hr) (m3/s) (m3/s) (m3/s) (m3/s) (m) (%) (mm) (m3/s) (m/s) (m/s) (min) (min) (min) (%)
0 MH205 MH204 0.89 0.60 0.53 0.53 109.7 0.163 0.000 0.000 0.163 168.4 1.50 375 0.215 1.94 2.14 10.00 1.44 11.44 76%
0 MH204 MH203 0.49 0.60 0.29 0.83 103.5 0.237 0.000 0.000 0.237 98.1 1.00 450 0.285 1.79 2.01 11.44 0.91 12.36 83%
0 MH206 MH203 1.05 0.60 0.63 0.63 109.7 0.193 0.000 0.000 0.193 204.1 2.50 375 0.277 2.51 2.71 10.00 1.36 11.36 70%
0 MH203 MH202 3.34 0.60 2.00 3.46 99.9 0.960 0.000 0.000 0.960 222.6 2.25 675 1.261 3.52 3.88 12.36 1.05 13.41 76%
0 MH202 MH201 0.08 0.75 0.06 3.52 96.1 0.940 0.000 0.000 0.940 30.9 0.50 900 1.280 2.01 2.20 13.41 0.26 13.66 73%
0 MH201 MH512 0.08 0.75 0.06 3.58 95.2 0.948 0.000 0.000 0.948 8.4 2.50 900 2.862 4.50 4.04 13.66 0.03 13.70 33%
0 0.00 0.00 0.00 0.00 0.0 0.000 0.000 0.000 0.000 0.0 0.00 0 0.000 0.00 0.00 0.00 0.00 0.00 0%
0 0.00 0.00 0.00 0.00 0.0 0.000 0.000 0.000 0.000 0.0 0.00 0 0.000 0.00 0.00 0.00 0.00 0.00 0%
0 0.00 0.00 0.00 0.00 0.0 0.000 0.000 0.000 0.000 0.0 0.00 0 0.000 0.00 0.00 0.00 0.00 0.00 0%
0 0.00 0.00 0.00 0.00 0.0 0.000 0.000 0.000 0.000 0.0 0.00 0 0.000 0.00 0.00 0.00 0.00 0.00 0%
0 0.00 0.00 0.00 0.00 0.0 0.000 0.000 0.000 0.000 0.0 0.00 0 0.000 0.00 0.00 0.00 0.00 0.00 0%
0 0.00 0.00 0.00 0.00 0.0 0.000 0.000 0.000 0.000 0.0 0.00 0 0.000 0.00 0.00 0.00 0.00 0.00 0%
\\MONTY\Shared Work Areas\020165 � PARIS GRAND SUBDIVISION\Civil\7_DesignDocs\STORM\020165_STM_5 yr (DRAFT PLAN_POND 2).xls:STM

STORM SEWER DESIGN SHEET: (5 Year Storm)
PROPOSED STM SEWER TO POND 3Paris Grand Subdivision, County of Brant
Rainfall Intensity = A
Project #: PGD020165 Min. Diameter = 300 mm (Tc+B)^c where Tc is in minutes
Date: MAR 2015 Mannings 'n'= 0.013 A = 1593
Designed: DT Starting Tc = 10 min B = 11 (5 Yr)
Checked: FJB Factor of Safety = 10 % C = 0.8789 NOMINAL PIPE SIZE USED
Drainage ACCUM.
DESCRIPTION FROM TO AREA RUNOFF 'AR' from AR' ACCUM. RAINFALL FLOW CONSTANT CONSTANT TOTAL LENGTH SLOPE PIPE FULL FLOW FULL FLOW ACTUAL INITIAL TIME OF ACC. TIME OF PERCENT
MH MH COEFFICIENT Rooftops (modified) 'AR' INTENSITY FLOW FLOW FLOW DIAMETER CAPACITY VELOCITY VELOCITY Tc CONCENTRATION CONCENTRATION FULL
(ha) "R" x Rooftop C (mm/hr) (m3/s) (m3/s) (m3/s) (m3/s) (m) (%) (mm) (m3/s) (m/s) (m/s) (min) (min) (min) (%)
0 MH311 MH310 1.30 0.60 0.78 0.36 0.34 0.44 109.7 0.134 0.000 0.000 0.134 72.7 2.00 375 0.248 2.25 2.29 10.00 0.54 10.54 54%
0 MH310 MH309 0.21 0.60 0.12 0.06 0.05 0.51 107.3 0.152 0.000 0.000 0.152 35.8 1.64 375 0.224 2.03 2.18 10.54 0.29 10.83 68%
0 MH312 MH309 0.97 0.60 0.58 0.27 0.25 0.33 109.7 0.100 0.000 0.000 0.100 98.9 1.00 375 0.175 1.59 1.64 10.00 1.04 11.04 57%
0 MH309 MH308 0.30 0.70 0.21 0.08 0.08 0.97 105.1 0.283 0.000 0.000 0.283 45.6 1.71 450 0.373 2.35 2.58 11.04 0.32 11.36 76%
0 MH308 MH307 0.24 0.60 0.14 0.06 0.06 1.05 103.8 0.303 0.000 0.000 0.303 41.3 0.50 600 0.434 1.54 1.66 11.36 0.45 11.81 70%
0 MH501 MH206 0.54 0.60 0.32 0.15 0.14 0.18 109.7 0.056 0.000 0.000 0.056 72.4 1.00 300 0.097 1.37 1.42 10.00 0.88 10.88 57%
0 MH206 MH307 1.15 0.60 0.69 0.31 0.30 0.57 105.8 0.168 0.000 0.000 0.168 121.2 0.60 450 0.221 1.39 1.53 10.88 1.45 12.33 76%
0 MH307 MH306 0.32 0.60 0.19 0.00 0.00 1.81 100.0 0.504 0.000 0.000 0.504 74.7 0.31 750 0.618 1.40 1.56 12.33 0.89 13.22 82%
0 MH306 MH503 0.08 0.60 0.05 0.00 0.00 1.86 96.7 0.501 0.000 0.000 0.501 53.2 0.20 825 0.638 1.19 1.32 13.22 0.74 13.97 78%
0 MH205 MH502 0.38 0.60 0.23 0.00 0.00 0.23 109.7 0.070 0.000 0.000 0.070 68.0 2.00 300 0.137 1.93 1.95 10.00 0.59 10.59 51%
0 MH502 MH503 0.44 0.60 0.26 0.00 0.00 0.49 107.1 0.147 0.000 0.000 0.147 55.9 1.00 375 0.175 1.59 1.78 10.59 0.59 11.17 84%
0 MH503 MH508 0.08 0.60 0.05 0.00 0.00 2.41 94.2 0.629 0.000 0.000 0.629 49.6 0.47 825 0.986 1.85 1.96 13.97 0.45 14.41 64%
0 MH504 MH505 0.43 0.60 0.26 0.00 0.00 0.26 109.7 0.078 0.000 0.000 0.078 44.6 1.00 300 0.097 1.37 1.53 10.00 0.54 10.54 81%
0 MH505 MH508 0.43 0.60 0.26 0.00 0.00 0.51 107.2 0.153 0.000 0.000 0.153 69.7 0.42 450 0.185 1.17 1.30 10.54 1.00 11.54 82%
0 MH509 MH508 0.56 0.60 0.33 0.00 0.00 0.33 109.7 0.102 0.000 0.000 0.102 68.3 0.20 450 0.128 0.81 0.89 10.00 1.41 11.41 79%
0 MH508 MH 505 0.00 0.60 0.00 0.00 0.00 3.25 92.7 0.838 0.000 0.000 0.838 52.5 0.19 975 0.983 1.32 1.48 14.41 0.67 15.08 85%
0 MH 505 MH506 0.00 0.60 0.00 0.00 0.00 3.25 90.7 0.819 0.000 0.000 0.819 8.6 0.42 975 1.449 1.94 2.00 15.08 0.07 15.15 57%
0 0.00 0.00 0.00 0.00 0.00 0.0 0.000 0.000 0.000 0.000 0.0 0.00 0 0.000 0.00 0.00 0.00 0.00 0.00 0%
0 0.00 0.00 0.00 0.00 0.0 0.000 0.000 0.000 0.000 0.0 0.00 0 0.000 0.00 0.00 0.00 0.00 0.00 0%
0 0.00 0.00 0.00 0.00 0.0 0.000 0.000 0.000 0.000 0.0 0.00 0 0.000 0.00 0.00 0.00 0.00 0.00 0%
0 0.00 0.00 0.00 0.00 0.0 0.000 0.000 0.000 0.000 0.0 0.00 0 0.000 0.00 0.00 0.00 0.00 0.00 0%
0 0.00 0.00 0.00 0.00 0.0 0.000 0.000 0.000 0.000 0.0 0.00 0 0.000 0.00 0.00 0.00 0.00 0.00 0%
0 0.00 0.00 0.00 0.00 0.0 0.000 0.000 0.000 0.000 0.0 0.00 0 0.000 0.00 0.00 0.00 0.00 0.00 0%
\\MONTY\Shared Work Areas\020165 � PARIS GRAND SUBDIVISION\Civil\7_DesignDocs\STORM\020165_STM_5 yr (DRAFT PLAN_POND 3).xls:STM

STORM SEWER DESIGN SHEET: (5 Year Storm)
EX PARIS LINKS ROAD SWM POND � BYPASS TO GILBERT CREEKParis Grand Subdivision, County of Brant
Rainfall Intensity = A
Project #: PGD020165 Min. Diameter = 300 mm (Tc+B)^c where Tc is in minutes
Date: MAR 2015 Mannings 'n'= 0.013 A = 1593
Designed: DT Starting Tc = 10 min B = 11 (5 Yr)
Checked: FJB Factor of Safety = 10 % C = 0.8789 NOMINAL PIPE SIZE USED
ACCUM.
DESCRIPTION FROM TO AREA RUNOFF 'AR' ACCUM. RAINFALL FLOW CONSTANT CONSTANT TOTAL LENGTH SLOPE PIPE FULL FLOW FULL FLOW INITIAL TIME OF ACC. TIME OF PERCENT
MH MH COEFFICIENT 'AR' INTENSITY FLOW FLOW FLOW DIAMETER CAPACITY VELOCITY Tc CONCENTRATION CONCENTRATION FULL
(ha) "R" (mm/hr) (m3/s) (m3/s) (m3/s) (m3/s) (m) (%) (mm) (m3/s) (m/s) (min) (min) (min) (%)
OUTLET FROM EX POND EX STM MH05 EX STM MH04 0.03 0.60 0.02 0.02 109.7 0.005 0.795 0.795 0.800 23.6 0.76 600 0.536 1.90 10.00 0.21 10.21 149%
SWM BLOCK EX STM MH04 EX STM MH 03 (MODIFIED) 0.03 0.60 0.02 0.03 108.7 0.011 0.000 0.795 0.806 31.9 0.30 600 0.336 1.19 10.21 0.45 10.65 240%
ACROSS PARIS LINKS EX STM MH 03 (MODIFIED) MH 600 0.00 0.60 0.00 0.03 106.8 0.010 0.000 0.795 0.805 79.3 0.50 600 0.434 1.54 10.65 0.86 11.52 185%
TO GILBERT CREEK MH 600 MH 601 0.00 0.60 0.00 0.03 103.2 0.010 0.000 0.795 0.805 91.1 0.20 600 0.275 0.97 11.52 1.56 13.08 293%
0 MH 601 MH 602 0.00 0.60 0.00 0.03 97.2 0.009 0.000 0.795 0.804 62.1 0.20 600 0.275 0.97 13.08 1.07 14.15 293%
0 MH 602 MH 603 0.00 0.60 0.00 0.03 93.6 0.009 0.000 0.795 0.804 8.4 0.20 600 0.275 0.97 14.15 0.14 14.29 293%
0 0.00 0.00 0.00 0.00 0.0 0.000 0.000 0.000 0.000 0.0 0.00 0 0.000 0.00 0.00 0.00 0.00 0%
0 0.00 0.00 0.00 0.00 0.0 0.000 0.000 0.000 0.000 0.0 0.00 0 0.000 0.00 0.00 0.00 0.00 0%
0 0.00 0.00 0.00 0.00 0.0 0.000 0.000 0.000 0.000 0.0 0.00 0 0.000 0.00 0.00 0.00 0.00 0%
0 0.00 0.00 0.00 0.00 0.0 0.000 0.000 0.000 0.000 0.0 0.00 0 0.000 0.00 0.00 0.00 0.00 0%
0 0.00 0.00 0.00 0.00 0.0 0.000 0.000 0.000 0.000 0.0 0.00 0 0.000 0.00 0.00 0.00 0.00 0%
0 0.00 0.00 0.00 0.00 0.0 0.000 0.000 0.000 0.000 0.0 0.00 0 0.000 0.00 0.00 0.00 0.00 0%
0 0.00 0.00 0.00 0.00 0.0 0.000 0.000 0.000 0.000 0.0 0.00 0 0.000 0.00 0.00 0.00 0.00 0%
0 0.00 0.00 0.00 0.00 0.0 0.000 0.000 0.000 0.000 0.0 0.00 0 0.000 0.00 0.00 0.00 0.00 0%
\\MONTY\Shared Work Areas\020165 � PARIS GRAND SUBDIVISION\Civil\7_DesignDocs\STORM\020165_STM_5 yr (DRAFT PLAN_EX SWM BYPASS TO GILBERT).xls:STM

STORM SEWER DESIGN SHEET: (5 Year Storm)
PARIS LINKS ROAD DRAINAGE TO GILBERT CK (BETWEEN STREET B & D)Paris Grand Subdivision, County of Brant
Rainfall Intensity = A
Project #: PGD020165 Min. Diameter = 300 mm (Tc+B)^c where Tc is in minutes
Date: OCT 2013 Mannings 'n'= 0.013 A = 1593
Designed: TPH Starting Tc = 10 min B = 11 (5 Yr)
Checked: FJB Factor of Safety = 10 % C = 0.8789 NOMINAL PIPE SIZE USED
ACCUM.
DESCRIPTION FROM TO AREA RUNOFF 'AR' ACCUM. RAINFALL FLOW CONSTANT CONSTANT TOTAL LENGTH SLOPE PIPE FULL FLOW FULL FLOW ACTUAL INITIAL TIME OF ACC. TIME OF PERCENT
MH MH COEFFICIENT 'AR' INTENSITY FLOW FLOW FLOW DIAMETER CAPACITY VELOCITY VELOCITY Tc CONCENTRATION CONCENTRATION FULL
(ha) "R" (mm/hr) (m3/s) (m3/s) (m3/s) (m3/s) (m) (%) (mm) (m3/s) (m/s) (m/s) (min) (min) (min) (%)
0 MH403 MH402 1.17 0.60 0.70 0.70 109.7 0.214 0.000 0.000 0.214 211.4 1.50 450 0.349 2.20 2.31 10.00 1.60 11.60 61%
0 MH402 MH401 0.01 0.90 0.01 0.71 102.8 0.203 0.000 0.000 0.203 8.1 0.50 525 0.304 1.40 1.50 11.60 0.10 11.70 67%
0 0.00 0.00 0.00 0.00 0.0 0.000 0.000 0.000 0.000 0.0 0.00 0 0.000 0.00 0.00 0.00 0.00 0.00 0%
\\Monty\Shared Work Areas\020165 - PARIS GRAND SUBDIVISION\Civil\SUBMISSIONS\131111 (FSR SUB TO BRANT)\APPENDICES\B - Preliminary Storm Sewer Design Sheets\05 020165_STM_5 yr (DRAFT PLAN_PARIS TO GILBERT).xls:STM
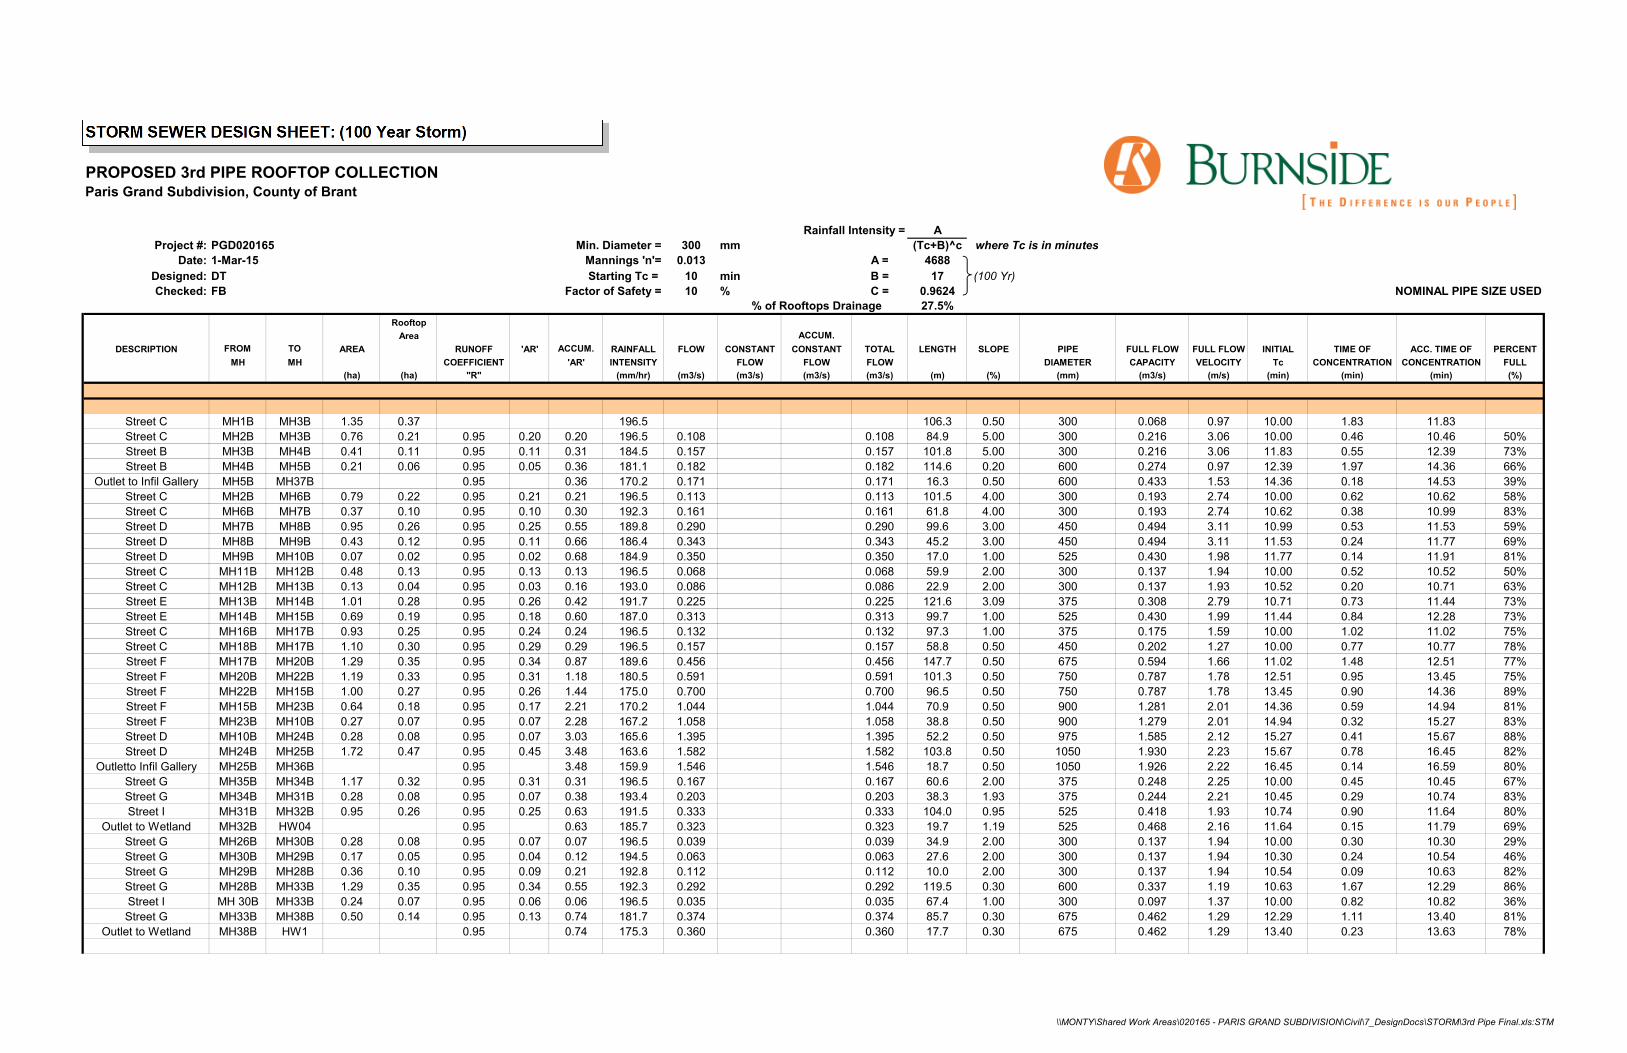
STORM SEWER DESIGN SHEET: (100 Year Storm)
PROPOSED 3rd PIPE ROOFTOP COLLECTIONParis Grand Subdivision, County of Brant
Rainfall Intensity = A
Project #: PGD020165 Min. Diameter = 300 mm (Tc+B)^c where Tc is in minutes
Date: Mannings 'n'= 0.013 A = 4688
Designed: DT Starting Tc = 10 min B = 17 (100 Yr)
Checked: FB Factor of Safety = 10 % C = 0.9624 NOMINAL PIPE SIZE USED
% of Rooftops Drainage 27.5%
Rooftop
Area ACCUM.
DESCRIPTION FROM TO AREA RUNOFF 'AR' ACCUM. RAINFALL FLOW CONSTANT CONSTANT TOTAL LENGTH SLOPE PIPE FULL FLOW FULL FLOW INITIAL TIME OF ACC. TIME OF PERCENT
MH MH COEFFICIENT 'AR' INTENSITY FLOW FLOW FLOW DIAMETER CAPACITY VELOCITY Tc CONCENTRATION CONCENTRATION FULL
(ha) (ha) "R" (mm/hr) (m3/s) (m3/s) (m3/s) (m3/s) (m) (%) (mm) (m3/s) (m/s) (min) (min) (min) (%)
Street C MH1B MH3B 1.35 0.37 0.00 0.00 0.00 196.5 0.000 0.000 0.000 0.000 106.3 0.50 300 0.068 0.97 10.00 1.83 11.83 0%
Street C MH2B MH3B 0.76 0.21 0.95 0.20 0.20 196.5 0.108 0.000 0.000 0.108 84.9 5.00 300 0.216 3.06 10.00 0.46 10.46 50%
Street B MH3B MH4B 0.41 0.11 0.95 0.11 0.31 184.5 0.157 0.000 0.000 0.157 101.8 5.00 300 0.216 3.06 11.83 0.55 12.39 73%
Street B MH4B MH5B 0.21 0.06 0.95 0.05 0.36 181.1 0.182 0.000 0.000 0.182 114.6 0.20 600 0.274 0.97 12.39 1.97 14.36 66%
Outlet to Infil Gallery MH5B MH37B 0.00 0.00 0.95 0.00 0.36 170.2 0.171 0.000 0.000 0.171 16.3 0.50 600 0.433 1.53 14.36 0.18 14.53 39%
Street C MH2B MH6B 0.79 0.22 0.95 0.21 0.21 196.5 0.113 0.000 0.000 0.113 101.5 4.00 300 0.193 2.74 10.00 0.62 10.62 58%
Street C MH6B MH7B 0.37 0.10 0.95 0.10 0.30 192.3 0.161 0.000 0.000 0.161 61.8 4.00 300 0.193 2.74 10.62 0.38 10.99 83%
Street D MH7B MH8B 0.95 0.26 0.95 0.25 0.55 189.8 0.290 0.000 0.000 0.290 99.6 3.00 450 0.494 3.11 10.99 0.53 11.53 59%
Street D MH8B MH9B 0.43 0.12 0.95 0.11 0.66 186.4 0.343 0.000 0.000 0.343 45.2 3.00 450 0.494 3.11 11.53 0.24 11.77 69%
Street D MH9B MH10B 0.07 0.02 0.95 0.02 0.68 184.9 0.350 0.000 0.000 0.350 17.0 1.00 525 0.430 1.98 11.77 0.14 11.91 81%
Street C MH11B MH12B 0.48 0.13 0.95 0.13 0.13 196.5 0.068 0.000 0.000 0.068 59.9 2.00 300 0.137 1.94 10.00 0.52 10.52 50%
Street C MH12B MH13B 0.13 0.04 0.95 0.03 0.16 193.0 0.086 0.000 0.000 0.086 22.9 2.00 300 0.137 1.93 10.52 0.20 10.71 63%
Street E MH13B MH14B 1.01 0.28 0.95 0.26 0.42 191.7 0.225 0.000 0.000 0.225 121.6 3.09 375 0.308 2.79 10.71 0.73 11.44 73%
Street E MH14B MH15B 0.69 0.19 0.95 0.18 0.60 187.0 0.313 0.000 0.000 0.313 99.7 1.00 525 0.430 1.99 11.44 0.84 12.28 73%
Street C MH16B MH17B 0.93 0.25 0.95 0.24 0.24 196.5 0.132 0.000 0.000 0.132 97.3 1.00 375 0.175 1.59 10.00 1.02 11.02 75%
Street C MH18B MH17B 1.10 0.30 0.95 0.29 0.29 196.5 0.157 0.000 0.000 0.157 58.8 0.50 450 0.202 1.27 10.00 0.77 10.77 78%
Street F MH17B MH20B 1.29 0.35 0.95 0.34 0.87 189.6 0.456 0.000 0.000 0.456 147.7 0.50 675 0.594 1.66 11.02 1.48 12.51 77%
Street F MH20B MH22B 1.19 0.33 0.95 0.31 1.18 180.5 0.591 0.000 0.000 0.591 101.3 0.50 750 0.787 1.78 12.51 0.95 13.45 75%
Street F MH22B MH15B 1.00 0.27 0.95 0.26 1.44 175.0 0.700 0.000 0.000 0.700 96.5 0.50 750 0.787 1.78 13.45 0.90 14.36 89%
Street F MH15B MH23B 0.64 0.18 0.95 0.17 2.21 170.2 1.044 0.000 0.000 1.044 70.9 0.50 900 1.281 2.01 14.36 0.59 14.94 81%
Street F MH23B MH10B 0.27 0.07 0.95 0.07 2.28 167.2 1.058 0.000 0.000 1.058 38.8 0.50 900 1.279 2.01 14.94 0.32 15.27 83%
Street D MH10B MH24B 0.28 0.08 0.95 0.07 3.03 165.6 1.395 0.000 0.000 1.395 52.2 0.50 975 1.585 2.12 15.27 0.41 15.67 88%
Street D MH24B MH25B 1.72 0.47 0.95 0.45 3.48 163.6 1.582 0.000 0.000 1.582 103.8 0.50 1050 1.930 2.23 15.67 0.78 16.45 82%
Outletto Infil Gallery MH25B MH36B 0.00 0.00 0.95 0.00 3.48 159.9 1.546 0.000 0.000 1.546 18.7 0.50 1050 1.926 2.22 16.45 0.14 16.59 80%
Street G MH35B MH34B 1.17 0.32 0.95 0.31 0.31 196.5 0.167 0.000 0.000 0.167 60.6 2.00 375 0.248 2.25 10.00 0.45 10.45 67%
Street G MH34B MH31B 0.28 0.08 0.95 0.07 0.38 193.4 0.203 0.000 0.000 0.203 38.3 1.93 375 0.244 2.21 10.45 0.29 10.74 83%
Street I MH31B MH32B 0.95 0.26 0.95 0.25 0.63 191.5 0.333 0.000 0.000 0.333 104.0 0.95 525 0.418 1.93 10.74 0.90 11.64 80%
Outlet to Wetland MH32B HW04 0.00 0.00 0.95 0.00 0.63 185.7 0.323 0.000 0.000 0.323 19.7 1.19 525 0.468 2.16 11.64 0.15 11.79 69%
Street G MH26B MH30B 0.28 0.08 0.95 0.07 0.07 196.5 0.039 0.000 0.000 0.039 34.9 2.00 300 0.137 1.94 10.00 0.30 10.30 29%
Street G MH30B MH29B 0.17 0.05 0.95 0.04 0.12 194.5 0.063 0.000 0.000 0.063 27.6 2.00 300 0.137 1.94 10.30 0.24 10.54 46%
Street G MH29B MH28B 0.36 0.10 0.95 0.09 0.21 192.8 0.112 0.000 0.000 0.112 10.0 2.00 300 0.137 1.94 10.54 0.09 10.63 82%
Street G MH28B MH33B 1.29 0.35 0.95 0.34 0.55 192.3 0.292 0.000 0.000 0.292 119.5 0.30 600 0.337 1.19 10.63 1.67 12.29 86%
Street I MH 30B MH33B 0.24 0.07 0.95 0.06 0.06 196.5 0.035 0.000 0.000 0.035 67.4 1.00 300 0.097 1.37 10.00 0.82 10.82 36%
Street G MH33B MH38B 0.50 0.14 0.95 0.13 0.74 181.7 0.374 0.000 0.000 0.374 85.7 0.30 675 0.462 1.29 12.29 1.11 13.40 81%
Outlet to Wetland MH38B HW1 0.00 0.95 0.00 0.74 175.3 0.360 0.000 0.000 0.360 17.7 0.30 675 0.462 1.29 13.40 0.23 13.63 78%
0 0.00 0.00 0.00 0.00 0.0 0.000 0.000 0.000 0.000 0.0 0.00 0 0.000 0.00 0.00 0.00 0.00 0%
1EMarE15
\\MONTY\Shared Work Areas\020165 � PARIS GRAND SUBDIVISION\Civil\7_DesignDocs\STORM\3rd Pipe Final.xls:STM

Appendix C
Stormwater Management Calculations and Modelling
Ap
pen
dix C


Airport Method for Time to Peak Calculations
Most applicable for a relatively flat, consistent watershed with little variability in slopes or cover.
Paris Grand - PGD020165
Natural Area Watershed Information 11/11/2013
Area Length Slope CN Time to Peak Time to Peak
WS (ha) (m) (m/m) (min) (hrs)
101 13.01 538 0.019 70 31.20 0.52
102 6.86 332 0.020 70 24.10 0.40
103 6.27 192 0.020 70 18.33 0.31
NOTE: Time to Peak = 0.60Tc
Tc = 0.87 hrs

Project: Paris Grand
Location: Paris
Project #: PGD020165
Designer: L. Garner
Date: 12-Mar-2015
Composite Runoff Coefficent Calculations
POND 1 - EAST OF GILBERT CREEK
Total Area = 21.47 ha
Area (ha) A x C
Low Density incl ROWs = 16.81 0.60 10.09
Medium Density = 1.70 0.75 1.27
SWM Block (Allowance) = 1.71 0.75 1.28
External Area (Undeveloped)= 1.25 0.25 0.31
21.47 0.60 = C (comp)
POND 2 -SOUTH
Total Area = 6.37 ha
Area (ha) A x C
Low Density incl ROWs = 1.96 0.60 1.18
Medium Density = 3.34 0.75 2.51
SWM Block (Allowance) = 0.69 0.75 0.52
External Area (Paris Rd ROW) = 0.38 0.60 0.23
6.37 0.69 = C (comp)
POND 3 - WEST OF GILBERT CREEK
Total Area = 11.23 ha
Area (ha) A x C
Low Density incl ROWs = 8.05 0.60 4.83
Medium Density = 1.41 0.75 1.06
SWM Block (Allowance) = 0.85 0.75 0.64
External Area (Paris Rd ROW) = 0.44 0.60 0.27
External Area (Undeveloped)= 0.48 0.25 0.12
11.23 0.60 = C (comp)
Brant Runoff
'C'
Brant Runoff
'C'
Brant Runoff
'C'
20120927 Composite Runoff Coefficient and Total Imperviousness Calcs

Project: Paris Grand
Location: Paris
Project #: PGD020165
Designer: L. Garner
Date: 12-Mar-2015
Runoff Coefficient and % Imperviousness Calculations
POND 1 - EAST OF GILBERT CREEK
RC (Runoff Coefficient) = 0.60 Composite RC calculated on previous page
imp (imperviousness) = ?
RC = 0.7imp + 0.2
imp = 0.57
POND 2 -SOUTH
RC (Runoff Coefficient) = 0.69 Composite RC calculated on previous page
imp (imperviousness) = ?
RC = 0.7imp + 0.2
imp = 0.70
POND 3 - WEST OF GILBERT CREEK
RC (Runoff Coefficient) = 0.60 Composite RC calculated on previous page
imp (imperviousness) = ?
RC = 0.7imp + 0.2
imp = 0.57
20120927 Composite Runoff Coefficient and Total Imperviousness Calcs
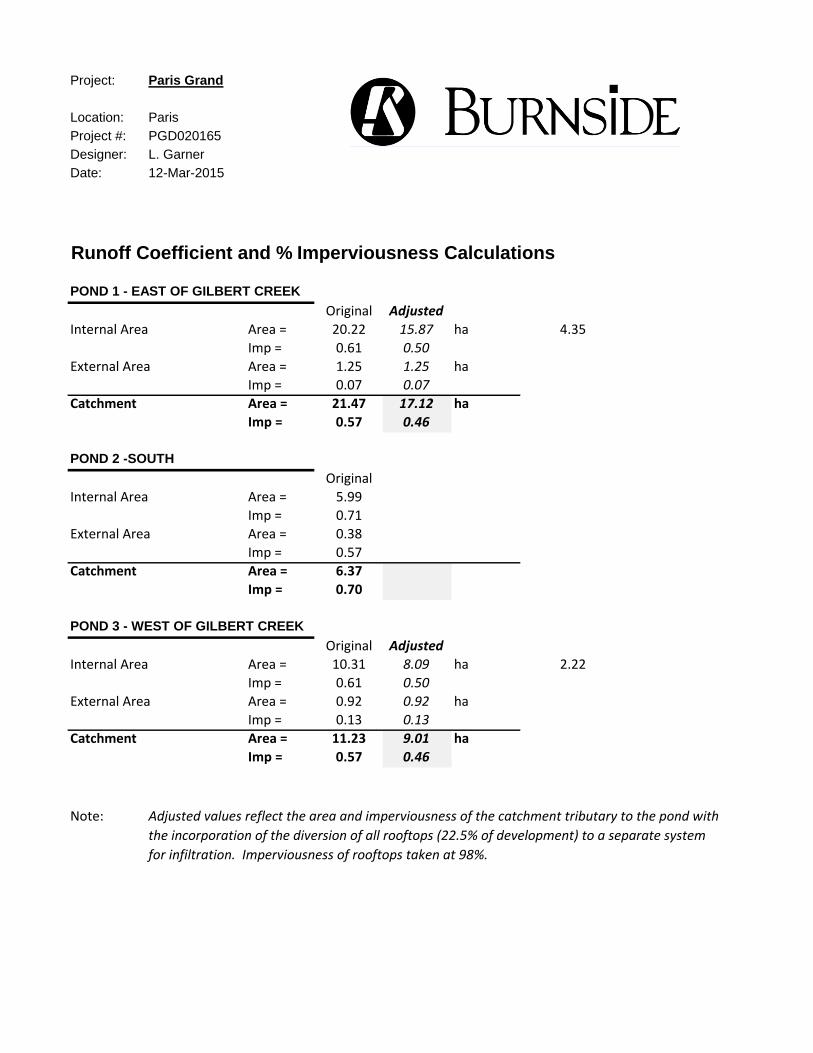
Project: Paris Grand
Location: Paris
Project #: PGD020165
Designer: L. Garner
Date: 12-Mar-2015
Runoff Coefficient and % Imperviousness Calculations
POND 1 - EAST OF GILBERT CREEK
Original Adjusted
Internal Area Area = 20.22 15.87 ha 4.35
Imp = 0.61 0.50
External Area Area = 1.25 1.25 ha
Imp = 0.07 0.07
Catchment Area = 21.47 17.12 ha
Imp = 0.57 0.46
POND 2 -SOUTH
Original
Internal Area Area = 5.99
Imp = 0.71
External Area Area = 0.38
Imp = 0.57
Catchment Area = 6.37
Imp = 0.70
POND 3 - WEST OF GILBERT CREEK
Original Adjusted
Internal Area Area = 10.31 8.09 ha 2.22
Imp = 0.61 0.50
External Area Area = 0.92 0.92 ha
Imp = 0.13 0.13
Catchment Area = 11.23 9.01 ha
Imp = 0.57 0.46
Note: Adjusted values reflect the area and imperviousness of the catchment tributary to the pond with
the incorporation of the diversion of all rooftops (22.5% of development) to a separate system
for infiltration. Imperviousness of rooftops taken at 98%.

POND 1
MOE Tables for Level of Quality Control
Taken from Stormwater Management Planning and Deisgn Manual (2003)
Table 3.2 Water Quality Storage Requirements Based on Receiving Waters.
WET POND
INPUT SITE IMPERVIOUS VALUE TO OBTAIN STORAGE VOLUME REQUIREMENTS
IMPERVIOUSNESS 46 %
Protection Level (1, 2, or 3) 1
NOTE - 40 cu.m/ha has been removed from MOE table values for Ex. Detention Portion
Enhanced (Level 1) Protection
Imperviousness (%)
Permanent Pool
StorageVolume (cu.m./ha)
35 100
55 150
70 185
85 210
46 127 *design site
95.0 236 Extrapolated
REQUIRED PERMANENT POOL VOLUME
127 cu.m/ha x 17.12 ha = 2179.9957 m³
y = 2.2237x + 25.046
0
50
100
150
200
250
0 20 40 60 80 100
P.P
. S
tora
ge
Vo
lum
e
(cu
m/h
a)
Impervious Level
ENHANCED (Level 1) PROTECTION

POND 2
MOE Tables for Level of Quality Control
Taken from Stormwater Management Planning and Deisgn Manual (2003)
Table 3.2 Water Quality Storage Requirements Based on Receiving Waters.
WET POND
INPUT SITE IMPERVIOUS VALUE TO OBTAIN STORAGE VOLUME REQUIREMENTS
IMPERVIOUSNESS 70 %
Protection Level (1, 2, or 3) 1
NOTE - 40 cu.m/ha has been removed from MOE table values for Ex. Detention Portion
Enhanced (Level 1) Protection
Imperviousness (%)
Permanent Pool
StorageVolume (cu.m./ha)
35 100
55 150
70 185
85 210
REQUIRED PERMANENT POOL VOLUME
185 cu.m/ha x 6.37 ha = 1178.45 m³
y = 2.2237x + 25.046
0
50
100
150
200
250
0 20 40 60 80 100P.P
. S
tora
ge
Vo
lum
e
(cu
m/h
a)
Impervious Level
ENHANCED (Level 1) PROTECTION
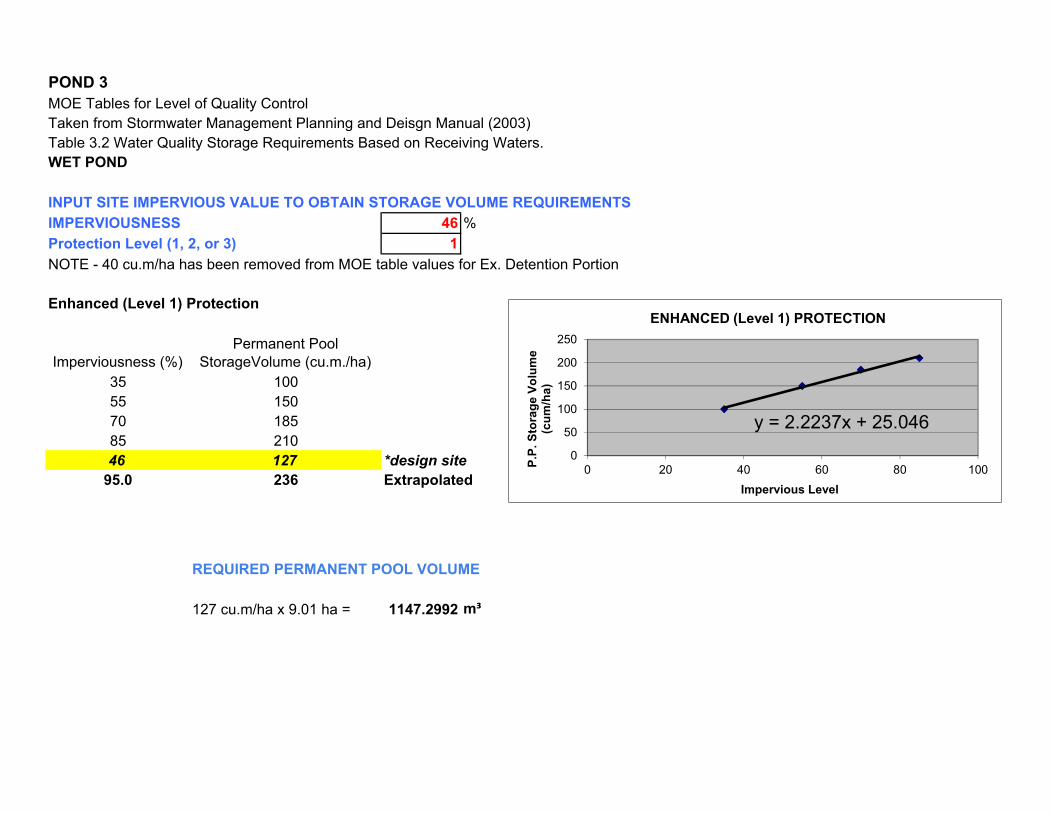
POND 3
MOE Tables for Level of Quality Control
Taken from Stormwater Management Planning and Deisgn Manual (2003)
Table 3.2 Water Quality Storage Requirements Based on Receiving Waters.
WET POND
INPUT SITE IMPERVIOUS VALUE TO OBTAIN STORAGE VOLUME REQUIREMENTS
IMPERVIOUSNESS 46 %
Protection Level (1, 2, or 3) 1
NOTE - 40 cu.m/ha has been removed from MOE table values for Ex. Detention Portion
Enhanced (Level 1) Protection
Imperviousness (%)
Permanent Pool
StorageVolume (cu.m./ha)
35 100
55 150
70 185
85 210
46 127 *design site
95.0 236 Extrapolated
REQUIRED PERMANENT POOL VOLUME
127 cu.m/ha x 9.01 ha = 1147.2992 m³
y = 2.2237x + 25.046
0
50
100
150
200
250
0 20 40 60 80 100
P.P
. S
tora
ge
Vo
lum
e
(cu
m/h
a)
Impervious Level
ENHANCED (Level 1) PROTECTION

Project: Paris Grand
Location: Paris
Project #: PGD020165
Designer: L. Garner
Date: 27-Sep-2012
Extended Detention Storage Required25 mm over 24 hours (MOE, Stormwater Management Planning and Design Guidelines, 2003)
POND 1 - EAST OF GILBERT CREEK
Area = 17.12 ha
Imp= 0.46 %
V= 25 mm x A x I x 10 = 1968.80 m³ [Storage Volume Required]
1968.80 m³ /24/3600 x 1.5 = 0.034 m³/s [Peak Flow Required]
Peaking Factor
POND 2 -SOUTH
Area = 6.37 ha
Imp= 0.7 %
V= 25 mm x A xI x 10 = 1114.75 m³ [Storage Volume Required]
1114.75 m³ /24/3600 x 1.5 = 0.019 m³/s [Peak Flow Required]
Peaking Factor
POND 3 - WEST OF GILBERT CREEK
Area = 9.01 ha
Imp= 0.46 %
V= 25 mm x A xI x 10 = 1036.15 m³ [Storage Volume Required]
1036.15 m³ /24/3600 x 1.5 = 0.018 m³/s [Peak Flow Required]
Peaking Factor
20120927 Extended Detention Calcs

Project: Paris Grand - Pond 1 (Northeast)
Project #: PGD020165
Designed By: Mona Xu
Checked By: L. Niemi
Date: 12-Mar-2015
ELEV Elev Diff
Forebay Main Cell Total Volume Storage Provided
TOP OF POND 238.10 8826.06
(@ 3:1) 0.30 2545.58
100 YEAR 237.80 8144.49
(@ 3:1) 0.40 3160.43
slope transition 237.40 7657.68
(@ 5:1) 0.30 2199.66
BERM 237.10 7006.75
(@ 5:1) 0.30 1986.04 237.1480292
PERM POOL 236.80 6233.52
(@ 5:1) 0.60 3310.32
slope transition 236.20 4800.88
(@ 3:1) 0.60 2643.04
BOTTOM 235.60 4009.25
Total Depth: 2.50
(mm) (%) (m/s) (L/s)
675 1.00 2.35 840.59
latest
AREAS
7346.14
5953.36
Dia
me
ter
Slo
pe
Ve
locity
Fu
ll F
low
Ca
pa
city

Project: Paris Grand - Pond 2 (South)
Project #: PGD020165
Designed By: O. Feniak
Checked By: K.Harrington
Date: 11-Nov-2013
ELEV Elev Diff
Forebay Main Cell Total Volume Storage Provided
TOP OF POND 232.95 3421.00
(@ 3:1) 0.30 996.75
100 YEAR 232.65 3224.00
(@ 3:1) 0.80 2379.20
slope transition 231.85 2724.00
(@ 5:1) 0.30 762.30
BERM 231.55 2358.00
(@ 5:1) 0.30 650.10 231.8059473
PERM POOL 231.25 1976.00
(@ 5:1) 0.60 983.40
slope transition 230.65 1302.00
(@ 3:1) 0.60 679.80
BOTTOM 230.05 964.00
Total Depth: 2.90
(mm) (%) (m/s) (L/s)
525 1.00 1.99 430.06
3791.60
1663.20
latest
AREAS
Dia
me
ter
Slo
pe
Ve
locity
Fu
ll F
low
Ca
pa
city

Project: Paris Grand - Pond 3 (Northwest)
Project #: PGD020165
Designed By: Mona Xu
Checked By: L. Niemi
Date: 12-Mar-2015
ELEV Elev Diff
Forebay Main Cell Total Volume Active Storage
TOP OF POND 240.50 5948.71
0.30 1689.46
100 YEAR 240.20 5314.35
0.70 3176.52
BERM 239.50 3761.41
0.30 1028.22 239.4456679
PERM POOL 239.20 608.12 2485.25 3093.37
1.20 2273.28
BOTTOM 238.00 159.47 743.00 902.47
Total Depth: 2.50
(mm) (%) (m/s) (L/s)
600 1.00 2.17 614.01
4204.73
latest
AREAS
Dia
me
ter
Slo
pe
Ve
locity
Fu
ll F
low
Ca
pa
city
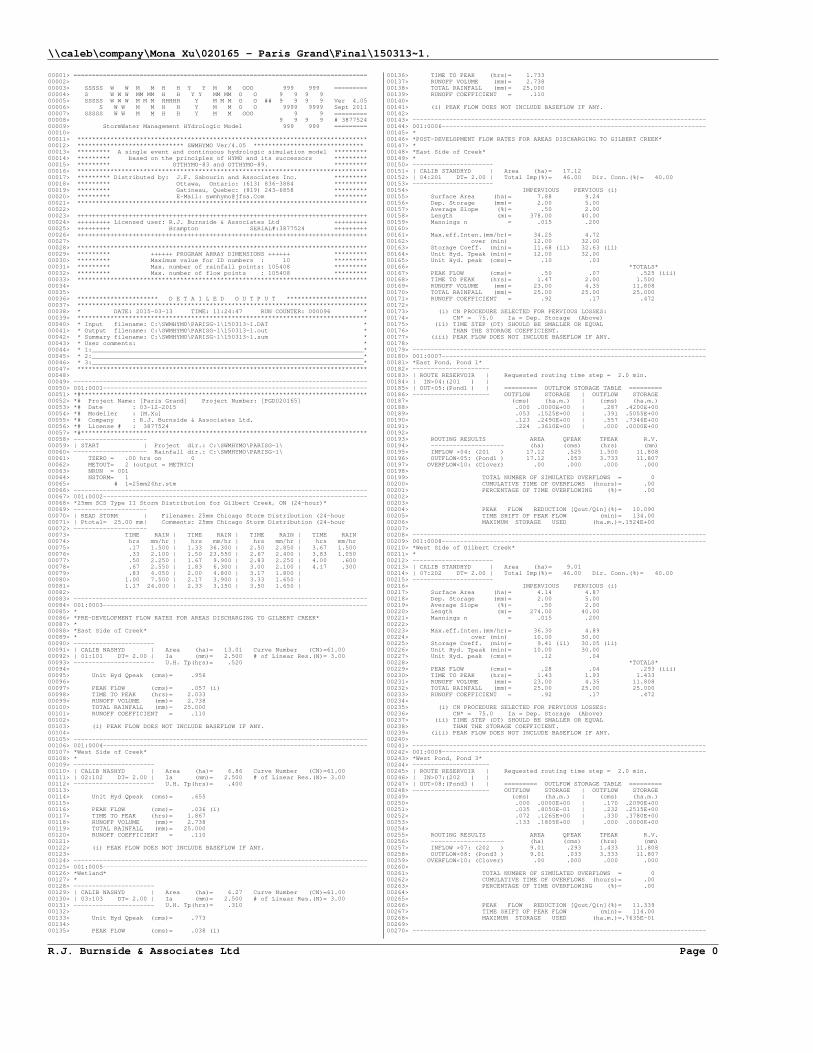
\\caleb\company\Mona Xu\020165 - Paris Grand\Final\150313~1.
R.J. Burnside & Associates Ltd Page 0
00001> ================================================================================00002> 00003> SSSSS W W M M H H Y Y M M OOO 999 999 =========00004> S W W W MM MM H H Y Y MM MM O O 9 9 9 9 00005> SSSSS W W W M M M HHHHH Y M M M O O ## 9 9 9 9 Ver 4.0500006> S W W M M H H Y M M O O 9999 9999 Sept 201100007> SSSSS W W M M H H Y M M OOO 9 9 =========00008> 9 9 9 9 # 387752400009> StormWater Management HYdrologic Model 999 999 =========00010> 00011> *******************************************************************************00012> ***************************** SWMHYMO Ver/4.05 ******************************00013> ********* A single event and continuous hydrologic simulation model *********00014> ********* based on the principles of HYMO and its successors *********00015> ********* OTTHYMO-83 and OTTHYMO-89. *********00016> *******************************************************************************00017> ********* Distributed by: J.F. Sabourin and Associates Inc. *********00018> ********* Ottawa, Ontario: (613) 836-3884 *********00019> ********* Gatineau, Quebec: (819) 243-6858 *********00020> ********* E-Mail: [email protected] *********00021> *******************************************************************************00022> 00023> +++++++++++++++++++++++++++++++++++++++++++++++++++++++++++++++++++++++++++++++00024> +++++++++ Licensed user: R.J. Burnside & Associates Ltd +++++++++00025> +++++++++ Brampton SERIAL#:3877524 +++++++++00026> +++++++++++++++++++++++++++++++++++++++++++++++++++++++++++++++++++++++++++++++00027> 00028> *******************************************************************************00029> ********* ++++++ PROGRAM ARRAY DIMENSIONS ++++++ *********00030> ********* Maximum value for ID numbers : 10 *********00031> ********* Max. number of rainfall points: 105408 *********00032> ********* Max. number of flow points : 105408 *********00033> *******************************************************************************00034> 00035> 00036> ********************** D E T A I L E D O U T P U T **********************00037> *******************************************************************************00038> * DATE: 2015-03-13 TIME: 11:24:47 RUN COUNTER: 000096 *00039> *******************************************************************************00040> * Input filename: C:\SWMHYMO\PARISG~1\150313~1.DAT *00041> * Output filename: C:\SWMHYMO\PARISG~1\150313~1.out *00042> * Summary filename: C:\SWMHYMO\PARISG~1\150313~1.sum *00043> * User comments: *00044> * 1:__________________________________________________________________________*00045> * 2:__________________________________________________________________________*00046> * 3:__________________________________________________________________________*00047> *******************************************************************************00048> 00049> --------------------------------------------------------------------------------00050> 001:0001------------------------------------------------------------------------00051> *#******************************************************************************00052> *# Project Name: [Paris Grand] Project Number: [PGD020165] 00053> *# Date : 03-12-2015 00054> *# Modeller : [M.Xu] 00055> *# Company : R.J. Burnside & Associates Ltd. 00056> *# License # : 3877524 00057> *#******************************************************************************00058> --------------------00059> | START | Project dir.: C:\SWMHYMO\PARISG~1\ 00060> -------------------- Rainfall dir.: C:\SWMHYMO\PARISG~1\ 00061> TZERO = .00 hrs on 000062> METOUT= 2 (output = METRIC) 00063> NRUN = 00100064> NSTORM= 100065> # 1=25mm24hr.stm 00066> --------------------------------------------------------------------------------00067> 001:0002------------------------------------------------------------------------00068> *25mm SCS Type II Storm Distribution for Gilbert Creek, ON (24-hour)* 00069> --------------------00070> | READ STORM | Filename: 25mm Chicago Storm Distribution (24-hour00071> | Ptotal= 25.00 mm| Comments: 25mm Chicago Storm Distribution (24-hour00072> --------------------00073> TIME RAIN | TIME RAIN | TIME RAIN | TIME RAIN00074> hrs mm/hr | hrs mm/hr | hrs mm/hr | hrs mm/hr00075> .17 1.500 | 1.33 36.300 | 2.50 2.850 | 3.67 1.50000076> .33 2.100 | 1.50 23.550 | 2.67 2.400 | 3.83 1.05000077> .50 2.250 | 1.67 9.900 | 2.83 2.250 | 4.00 .60000078> .67 2.550 | 1.83 6.300 | 3.00 2.100 | 4.17 .30000079> .83 4.050 | 2.00 4.800 | 3.17 1.800 |00080> 1.00 7.500 | 2.17 3.900 | 3.33 1.650 |00081> 1.17 24.000 | 2.33 3.150 | 3.50 1.650 |00082> 00083> --------------------------------------------------------------------------------00084> 001:0003------------------------------------------------------------------------00085> * 00086> *PRE-DEVELOPMENT FLOW RATES FOR AREAS DISCHARGING TO GILBERT CREEK* 00087> * 00088> *East Side of Creek* 00089> * 00090> ----------------------00091> | CALIB NASHYD | Area (ha)= 13.01 Curve Number (CN)=61.0000092> | 01:101 DT= 2.00 | Ia (mm)= 2.500 # of Linear Res.(N)= 3.0000093> ---------------------- U.H. Tp(hrs)= .52000094> 00095> Unit Hyd Qpeak (cms)= .95600096> 00097> PEAK FLOW (cms)= .057 (i)00098> TIME TO PEAK (hrs)= 2.03300099> RUNOFF VOLUME (mm)= 2.73800100> TOTAL RAINFALL (mm)= 25.00000101> RUNOFF COEFFICIENT = .11000102> 00103> (i) PEAK FLOW DOES NOT INCLUDE BASEFLOW IF ANY.00104> 00105> --------------------------------------------------------------------------------00106> 001:0004------------------------------------------------------------------------00107> *West Side of Creek* 00108> * 00109> ----------------------00110> | CALIB NASHYD | Area (ha)= 6.86 Curve Number (CN)=61.0000111> | 02:102 DT= 2.00 | Ia (mm)= 2.500 # of Linear Res.(N)= 3.0000112> ---------------------- U.H. Tp(hrs)= .40000113> 00114> Unit Hyd Qpeak (cms)= .65500115> 00116> PEAK FLOW (cms)= .036 (i)00117> TIME TO PEAK (hrs)= 1.86700118> RUNOFF VOLUME (mm)= 2.73800119> TOTAL RAINFALL (mm)= 25.00000120> RUNOFF COEFFICIENT = .11000121> 00122> (i) PEAK FLOW DOES NOT INCLUDE BASEFLOW IF ANY.00123> 00124> --------------------------------------------------------------------------------00125> 001:0005------------------------------------------------------------------------00126> *Wetland* 00127> * 00128> ----------------------00129> | CALIB NASHYD | Area (ha)= 6.27 Curve Number (CN)=61.0000130> | 03:103 DT= 2.00 | Ia (mm)= 2.500 # of Linear Res.(N)= 3.0000131> ---------------------- U.H. Tp(hrs)= .31000132> 00133> Unit Hyd Qpeak (cms)= .77300134> 00135> PEAK FLOW (cms)= .038 (i)
00136> TIME TO PEAK (hrs)= 1.73300137> RUNOFF VOLUME (mm)= 2.73800138> TOTAL RAINFALL (mm)= 25.00000139> RUNOFF COEFFICIENT = .11000140> 00141> (i) PEAK FLOW DOES NOT INCLUDE BASEFLOW IF ANY.00142> 00143> --------------------------------------------------------------------------------00144> 001:0006------------------------------------------------------------------------00145> * 00146> *POST-DEVELOPMENT FLOW RATES FOR AREAS DISCHARGING TO GILBERT CREEK* 00147> * 00148> *East Side of Creek* 00149> * 00150> ----------------------00151> | CALIB STANDHYD | Area (ha)= 17.1200152> | 04:201 DT= 2.00 | Total Imp(%)= 46.00 Dir. Conn.(%)= 40.0000153> ----------------------00154> IMPERVIOUS PERVIOUS (i)00155> Surface Area (ha)= 7.88 9.2400156> Dep. Storage (mm)= 2.00 5.0000157> Average Slope (%)= .50 2.0000158> Length (m)= 378.00 40.0000159> Mannings n = .015 .20000160> 00161> Max.eff.Inten.(mm/hr)= 34.25 4.7200162> over (min) 12.00 32.0000163> Storage Coeff. (min)= 11.68 (ii) 32.63 (ii)00164> Unit Hyd. Tpeak (min)= 12.00 32.0000165> Unit Hyd. peak (cms)= .10 .0300166> *TOTALS*00167> PEAK FLOW (cms)= .50 .07 .525 (iii)00168> TIME TO PEAK (hrs)= 1.47 2.00 1.50000169> RUNOFF VOLUME (mm)= 23.00 4.35 11.80800170> TOTAL RAINFALL (mm)= 25.00 25.00 25.00000171> RUNOFF COEFFICIENT = .92 .17 .47200172> 00173> (i) CN PROCEDURE SELECTED FOR PERVIOUS LOSSES:00174> CN* = 75.0 Ia = Dep. Storage (Above)00175> (ii) TIME STEP (DT) SHOULD BE SMALLER OR EQUAL00176> THAN THE STORAGE COEFFICIENT.00177> (iii) PEAK FLOW DOES NOT INCLUDE BASEFLOW IF ANY.00178> 00179> --------------------------------------------------------------------------------00180> 001:0007------------------------------------------------------------------------00181> *East Pond, Pond 1* 00182> ---------------------00183> | ROUTE RESERVOIR | Requested routing time step = 2.0 min.00184> | IN>04:(201 ) |00185> | OUT<05:(Pond1 ) | ========= OUTLFOW STORAGE TABLE =========00186> --------------------- OUTFLOW STORAGE | OUTFLOW STORAGE00187> (cms) (ha.m.) | (cms) (ha.m.)00188> .000 .0000E+00 | .287 .4200E+0000189> .053 .1525E+00 | .391 .5055E+0000190> .123 .2490E+00 | .557 .7346E+0000191> .224 .3610E+00 | .000 .0000E+0000192> 00193> ROUTING RESULTS AREA QPEAK TPEAK R.V.00194> -------------------- (ha) (cms) (hrs) (mm)00195> INFLOW >04: (201 ) 17.12 .525 1.500 11.80800196> OUTFLOW<05: (Pond1 ) 17.12 .053 3.733 11.80700197> OVERFLOW<10: (C1over) .00 .000 .000 .00000198> 00199> TOTAL NUMBER OF SIMULATED OVERFLOWS = 000200> CUMULATIVE TIME OF OVERFLOWS (hours)= .0000201> PERCENTAGE OF TIME OVERFLOWING (%)= .0000202> 00203> 00204> PEAK FLOW REDUCTION [Qout/Qin](%)= 10.09000205> TIME SHIFT OF PEAK FLOW (min)= 134.0000206> MAXIMUM STORAGE USED (ha.m.)=.1524E+0000207> 00208> --------------------------------------------------------------------------------00209> 001:0008------------------------------------------------------------------------00210> *West Side of Gilbert Creek* 00211> * 00212> ----------------------00213> | CALIB STANDHYD | Area (ha)= 9.0100214> | 07:202 DT= 2.00 | Total Imp(%)= 46.00 Dir. Conn.(%)= 40.0000215> ----------------------00216> IMPERVIOUS PERVIOUS (i)00217> Surface Area (ha)= 4.14 4.8700218> Dep. Storage (mm)= 2.00 5.0000219> Average Slope (%)= .50 2.0000220> Length (m)= 274.00 40.0000221> Mannings n = .015 .20000222> 00223> Max.eff.Inten.(mm/hr)= 36.30 4.8900224> over (min) 10.00 30.0000225> Storage Coeff. (min)= 9.41 (ii) 30.05 (ii)00226> Unit Hyd. Tpeak (min)= 10.00 30.0000227> Unit Hyd. peak (cms)= .12 .0400228> *TOTALS*00229> PEAK FLOW (cms)= .28 .04 .293 (iii)00230> TIME TO PEAK (hrs)= 1.43 1.93 1.43300231> RUNOFF VOLUME (mm)= 23.00 4.35 11.80800232> TOTAL RAINFALL (mm)= 25.00 25.00 25.00000233> RUNOFF COEFFICIENT = .92 .17 .47200234> 00235> (i) CN PROCEDURE SELECTED FOR PERVIOUS LOSSES:00236> CN* = 75.0 Ia = Dep. Storage (Above)00237> (ii) TIME STEP (DT) SHOULD BE SMALLER OR EQUAL00238> THAN THE STORAGE COEFFICIENT.00239> (iii) PEAK FLOW DOES NOT INCLUDE BASEFLOW IF ANY.00240> 00241> --------------------------------------------------------------------------------00242> 001:0009------------------------------------------------------------------------00243> *West Pond, Pond 3* 00244> ---------------------00245> | ROUTE RESERVOIR | Requested routing time step = 2.0 min.00246> | IN>07:(202 ) |00247> | OUT<08:(Pond3 ) | ========= OUTLFOW STORAGE TABLE =========00248> --------------------- OUTFLOW STORAGE | OUTFLOW STORAGE00249> (cms) (ha.m.) | (cms) (ha.m.)00250> .000 .0000E+00 | .170 .2090E+0000251> .035 .8050E-01 | .232 .2515E+0000252> .072 .1265E+00 | .330 .3780E+0000253> .133 .1805E+00 | .000 .0000E+0000254> 00255> ROUTING RESULTS AREA QPEAK TPEAK R.V.00256> -------------------- (ha) (cms) (hrs) (mm)00257> INFLOW >07: (202 ) 9.01 .293 1.433 11.80800258> OUTFLOW<08: (Pond3 ) 9.01 .033 3.333 11.80700259> OVERFLOW<10: (C1over) .00 .000 .000 .00000260> 00261> TOTAL NUMBER OF SIMULATED OVERFLOWS = 000262> CUMULATIVE TIME OF OVERFLOWS (hours)= .0000263> PERCENTAGE OF TIME OVERFLOWING (%)= .0000264> 00265> 00266> PEAK FLOW REDUCTION [Qout/Qin](%)= 11.33900267> TIME SHIFT OF PEAK FLOW (min)= 114.0000268> MAXIMUM STORAGE USED (ha.m.)=.7635E-0100269> 00270> --------------------------------------------------------------------------------

\\caleb\company\Mona Xu\020165 - Paris Grand\Final\150313~1.
R.J. Burnside & Associates Ltd Page 1
00271> 001:0010------------------------------------------------------------------------00272> *South Pond to Wetland* 00273> * 00274> ----------------------00275> | CALIB STANDHYD | Area (ha)= 6.3700276> | 09:203 DT= 2.00 | Total Imp(%)= 70.00 Dir. Conn.(%)= 55.0000277> ----------------------00278> IMPERVIOUS PERVIOUS (i)00279> Surface Area (ha)= 4.46 1.9100280> Dep. Storage (mm)= 2.00 5.0000281> Average Slope (%)= .50 2.0000282> Length (m)= 206.00 40.0000283> Mannings n = .015 .20000284> 00285> Max.eff.Inten.(mm/hr)= 36.30 10.3000286> over (min) 8.00 24.0000287> Storage Coeff. (min)= 7.93 (ii) 23.26 (ii)00288> Unit Hyd. Tpeak (min)= 8.00 24.0000289> Unit Hyd. peak (cms)= .14 .0500290> *TOTALS*00291> PEAK FLOW (cms)= .29 .03 .301 (iii)00292> TIME TO PEAK (hrs)= 1.40 1.80 1.40000293> RUNOFF VOLUME (mm)= 23.00 6.01 15.35400294> TOTAL RAINFALL (mm)= 25.00 25.00 25.00000295> RUNOFF COEFFICIENT = .92 .24 .61400296> 00297> (i) CN PROCEDURE SELECTED FOR PERVIOUS LOSSES:00298> CN* = 75.0 Ia = Dep. Storage (Above)00299> (ii) TIME STEP (DT) SHOULD BE SMALLER OR EQUAL00300> THAN THE STORAGE COEFFICIENT.00301> (iii) PEAK FLOW DOES NOT INCLUDE BASEFLOW IF ANY.00302> 00303> --------------------------------------------------------------------------------00304> 001:0011------------------------------------------------------------------------00305> *South Pond, Pond 2* 00306> ---------------------00307> | ROUTE RESERVOIR | Requested routing time step = 2.0 min.00308> | IN>09:(203 ) |00309> | OUT<07:(Pond2 ) | ========= OUTLFOW STORAGE TABLE =========00310> --------------------- OUTFLOW STORAGE | OUTFLOW STORAGE00311> (cms) (ha.m.) | (cms) (ha.m.)00312> .000 .0000E+00 | .170 .1920E+0000313> .002 .1115E+00 | .232 .2250E+0000314> .073 .1320E+00 | .330 .3791E+0000315> .133 .1670E+00 | .000 .0000E+0000316> 00317> ROUTING RESULTS AREA QPEAK TPEAK R.V.00318> -------------------- (ha) (cms) (hrs) (mm)00319> INFLOW >09: (203 ) 6.37 .301 1.400 15.35400320> OUTFLOW<07: (Pond2 ) 6.37 .002 4.700 15.35200321> OVERFLOW<10: (C1over) .00 .000 .000 .00000322> 00323> TOTAL NUMBER OF SIMULATED OVERFLOWS = 000324> CUMULATIVE TIME OF OVERFLOWS (hours)= .0000325> PERCENTAGE OF TIME OVERFLOWING (%)= .0000326> 00327> 00328> PEAK FLOW REDUCTION [Qout/Qin](%)= .54300329> TIME SHIFT OF PEAK FLOW (min)= 198.0000330> MAXIMUM STORAGE USED (ha.m.)=.9593E-0100331> 00332> --------------------------------------------------------------------------------00333> 001:0012------------------------------------------------------------------------00334> ** END OF RUN : 100335> 00336> *******************************************************************************00337> 00338> 00339> 00340> 00341> 00342> --------------------00343> | START | Project dir.: C:\SWMHYMO\PARISG~1\ 00344> -------------------- Rainfall dir.: C:\SWMHYMO\PARISG~1\ 00345> TZERO = .00 hrs on 000346> METOUT= 2 (output = METRIC) 00347> NRUN = 00200348> NSTORM= 100349> # 1=2SCS24.stm 00350> --------------------------------------------------------------------------------00351> 002:0002------------------------------------------------------------------------00352> *#******************************************************************************00353> *# Project Name: [Paris Grand] Project Number: [PGD020165] 00354> *# Date : 03-12-2015 00355> *# Modeller : [M.Xu] 00356> *# Company : R.J. Burnside & Associates Ltd. 00357> *# License # : 3877524 00358> *#******************************************************************************00359> --------------------------------------------------------------------------------00360> 002:0002------------------------------------------------------------------------00361> *25mm SCS Type II Storm Distribution for Gilbert Creek, ON (24-hour)* 00362> --------------------00363> | READ STORM | Filename: 2-Year SCS Type-II Storm Distribution (200364> | Ptotal= 48.00 mm| Comments: 2-Year SCS Type-II Storm Distribution (200365> --------------------00366> TIME RAIN | TIME RAIN | TIME RAIN | TIME RAIN00367> hrs mm/hr | hrs mm/hr | hrs mm/hr | hrs mm/hr00368> 1.00 .480 | 7.00 .960 | 13.00 5.760 | 19.00 .96000369> 2.00 .480 | 8.00 .960 | 14.00 2.400 | 20.00 .48000370> 3.00 .480 | 9.00 1.440 | 15.00 1.440 | 21.00 .48000371> 4.00 .960 | 10.00 1.440 | 16.00 1.440 | 22.00 .96000372> 5.00 .480 | 11.00 2.400 | 17.00 .960 | 23.00 .48000373> 6.00 .960 | 12.00 20.160 | 18.00 .960 | 24.00 .48000374> 00375> --------------------------------------------------------------------------------00376> 002:0003------------------------------------------------------------------------00377> * 00378> *PRE-DEVELOPMENT FLOW RATES FOR AREAS DISCHARGING TO GILBERT CREEK* 00379> * 00380> *East Side of Creek* 00381> * 00382> ----------------------00383> | CALIB NASHYD | Area (ha)= 13.01 Curve Number (CN)=61.0000384> | 01:101 DT= 2.00 | Ia (mm)= 2.500 # of Linear Res.(N)= 3.0000385> ---------------------- U.H. Tp(hrs)= .52000386> 00387> Unit Hyd Qpeak (cms)= .95600388> 00389> PEAK FLOW (cms)= .123 (i)00390> TIME TO PEAK (hrs)= 12.30000391> RUNOFF VOLUME (mm)= 9.95800392> TOTAL RAINFALL (mm)= 48.00000393> RUNOFF COEFFICIENT = .20700394> 00395> (i) PEAK FLOW DOES NOT INCLUDE BASEFLOW IF ANY.00396> 00397> --------------------------------------------------------------------------------00398> 002:0004------------------------------------------------------------------------00399> *West Side of Creek* 00400> * 00401> ----------------------00402> | CALIB NASHYD | Area (ha)= 6.86 Curve Number (CN)=61.0000403> | 02:102 DT= 2.00 | Ia (mm)= 2.500 # of Linear Res.(N)= 3.0000404> ---------------------- U.H. Tp(hrs)= .40000405>
00406> Unit Hyd Qpeak (cms)= .65500407> 00408> PEAK FLOW (cms)= .073 (i)00409> TIME TO PEAK (hrs)= 12.16700410> RUNOFF VOLUME (mm)= 9.95800411> TOTAL RAINFALL (mm)= 48.00000412> RUNOFF COEFFICIENT = .20700413> 00414> (i) PEAK FLOW DOES NOT INCLUDE BASEFLOW IF ANY.00415> 00416> --------------------------------------------------------------------------------00417> 002:0005------------------------------------------------------------------------00418> *Wetland* 00419> * 00420> ----------------------00421> | CALIB NASHYD | Area (ha)= 6.27 Curve Number (CN)=61.0000422> | 03:103 DT= 2.00 | Ia (mm)= 2.500 # of Linear Res.(N)= 3.0000423> ---------------------- U.H. Tp(hrs)= .31000424> 00425> Unit Hyd Qpeak (cms)= .77300426> 00427> PEAK FLOW (cms)= .074 (i)00428> TIME TO PEAK (hrs)= 12.10000429> RUNOFF VOLUME (mm)= 9.95800430> TOTAL RAINFALL (mm)= 48.00000431> RUNOFF COEFFICIENT = .20700432> 00433> (i) PEAK FLOW DOES NOT INCLUDE BASEFLOW IF ANY.00434> 00435> --------------------------------------------------------------------------------00436> 002:0006------------------------------------------------------------------------00437> * 00438> *POST-DEVELOPMENT FLOW RATES FOR AREAS DISCHARGING TO GILBERT CREEK* 00439> * 00440> *East Side of Creek* 00441> * 00442> ----------------------00443> | CALIB STANDHYD | Area (ha)= 17.1200444> | 04:201 DT= 2.00 | Total Imp(%)= 46.00 Dir. Conn.(%)= 40.0000445> ----------------------00446> IMPERVIOUS PERVIOUS (i)00447> Surface Area (ha)= 7.88 9.2400448> Dep. Storage (mm)= 2.00 5.0000449> Average Slope (%)= .50 2.0000450> Length (m)= 378.00 40.0000451> Mannings n = .015 .20000452> 00453> Max.eff.Inten.(mm/hr)= 20.16 8.7800454> over (min) 14.00 30.0000455> Storage Coeff. (min)= 14.44 (ii) 30.78 (ii)00456> Unit Hyd. Tpeak (min)= 14.00 30.0000457> Unit Hyd. peak (cms)= .08 .0400458> *TOTALS*00459> PEAK FLOW (cms)= .37 .16 .514 (iii)00460> TIME TO PEAK (hrs)= 12.00 12.27 12.03300461> RUNOFF VOLUME (mm)= 46.00 15.81 27.88500462> TOTAL RAINFALL (mm)= 48.00 48.00 48.00000463> RUNOFF COEFFICIENT = .96 .33 .58100464> 00465> (i) CN PROCEDURE SELECTED FOR PERVIOUS LOSSES:00466> CN* = 75.0 Ia = Dep. Storage (Above)00467> (ii) TIME STEP (DT) SHOULD BE SMALLER OR EQUAL00468> THAN THE STORAGE COEFFICIENT.00469> (iii) PEAK FLOW DOES NOT INCLUDE BASEFLOW IF ANY.00470> 00471> --------------------------------------------------------------------------------00472> 002:0007------------------------------------------------------------------------00473> *East Pond, Pond 1* 00474> ---------------------00475> | ROUTE RESERVOIR | Requested routing time step = 2.0 min.00476> | IN>04:(201 ) |00477> | OUT<05:(Pond1 ) | ========= OUTLFOW STORAGE TABLE =========00478> --------------------- OUTFLOW STORAGE | OUTFLOW STORAGE00479> (cms) (ha.m.) | (cms) (ha.m.)00480> .000 .0000E+00 | .287 .4200E+0000481> .053 .1525E+00 | .391 .5055E+0000482> .123 .2490E+00 | .557 .7346E+0000483> .224 .3610E+00 | .000 .0000E+0000484> 00485> ROUTING RESULTS AREA QPEAK TPEAK R.V.00486> -------------------- (ha) (cms) (hrs) (mm)00487> INFLOW >04: (201 ) 17.12 .514 12.033 27.88500488> OUTFLOW<05: (Pond1 ) 17.12 .123 13.600 27.88500489> OVERFLOW<10: (C1over) .00 .000 .000 .00000490> 00491> TOTAL NUMBER OF SIMULATED OVERFLOWS = 000492> CUMULATIVE TIME OF OVERFLOWS (hours)= .0000493> PERCENTAGE OF TIME OVERFLOWING (%)= .0000494> 00495> 00496> PEAK FLOW REDUCTION [Qout/Qin](%)= 23.91700497> TIME SHIFT OF PEAK FLOW (min)= 94.0000498> MAXIMUM STORAGE USED (ha.m.)=.2490E+0000499> 00500> --------------------------------------------------------------------------------00501> 002:0008------------------------------------------------------------------------00502> *West Side of Gilbert Creek* 00503> * 00504> ----------------------00505> | CALIB STANDHYD | Area (ha)= 9.0100506> | 07:202 DT= 2.00 | Total Imp(%)= 46.00 Dir. Conn.(%)= 40.0000507> ----------------------00508> IMPERVIOUS PERVIOUS (i)00509> Surface Area (ha)= 4.14 4.8700510> Dep. Storage (mm)= 2.00 5.0000511> Average Slope (%)= .50 2.0000512> Length (m)= 274.00 40.0000513> Mannings n = .015 .20000514> 00515> Max.eff.Inten.(mm/hr)= 20.16 8.8800516> over (min) 12.00 28.0000517> Storage Coeff. (min)= 11.91 (ii) 28.17 (ii)00518> Unit Hyd. Tpeak (min)= 12.00 28.0000519> Unit Hyd. peak (cms)= .09 .0400520> *TOTALS*00521> PEAK FLOW (cms)= .20 .09 .277 (iii)00522> TIME TO PEAK (hrs)= 12.00 12.23 12.03300523> RUNOFF VOLUME (mm)= 46.00 15.81 27.88500524> TOTAL RAINFALL (mm)= 48.00 48.00 48.00000525> RUNOFF COEFFICIENT = .96 .33 .58100526> 00527> (i) CN PROCEDURE SELECTED FOR PERVIOUS LOSSES:00528> CN* = 75.0 Ia = Dep. Storage (Above)00529> (ii) TIME STEP (DT) SHOULD BE SMALLER OR EQUAL00530> THAN THE STORAGE COEFFICIENT.00531> (iii) PEAK FLOW DOES NOT INCLUDE BASEFLOW IF ANY.00532> 00533> --------------------------------------------------------------------------------00534> 002:0009------------------------------------------------------------------------00535> *West Pond, Pond 3* 00536> ---------------------00537> | ROUTE RESERVOIR | Requested routing time step = 2.0 min.00538> | IN>07:(202 ) |00539> | OUT<08:(Pond3 ) | ========= OUTLFOW STORAGE TABLE =========00540> --------------------- OUTFLOW STORAGE | OUTFLOW STORAGE

\\caleb\company\Mona Xu\020165 - Paris Grand\Final\150313~1.
R.J. Burnside & Associates Ltd Page 2
00541> (cms) (ha.m.) | (cms) (ha.m.)00542> .000 .0000E+00 | .170 .2090E+0000543> .035 .8050E-01 | .232 .2515E+0000544> .072 .1265E+00 | .330 .3780E+0000545> .133 .1805E+00 | .000 .0000E+0000546> 00547> ROUTING RESULTS AREA QPEAK TPEAK R.V.00548> -------------------- (ha) (cms) (hrs) (mm)00549> INFLOW >07: (202 ) 9.01 .277 12.033 27.88500550> OUTFLOW<08: (Pond3 ) 9.01 .071 13.433 27.88500551> OVERFLOW<10: (C1over) .00 .000 .000 .00000552> 00553> TOTAL NUMBER OF SIMULATED OVERFLOWS = 000554> CUMULATIVE TIME OF OVERFLOWS (hours)= .0000555> PERCENTAGE OF TIME OVERFLOWING (%)= .0000556> 00557> 00558> PEAK FLOW REDUCTION [Qout/Qin](%)= 25.66100559> TIME SHIFT OF PEAK FLOW (min)= 84.0000560> MAXIMUM STORAGE USED (ha.m.)=.1254E+0000561> 00562> --------------------------------------------------------------------------------00563> 002:0010------------------------------------------------------------------------00564> *South Pond to Wetland* 00565> * 00566> ----------------------00567> | CALIB STANDHYD | Area (ha)= 6.3700568> | 09:203 DT= 2.00 | Total Imp(%)= 70.00 Dir. Conn.(%)= 55.0000569> ----------------------00570> IMPERVIOUS PERVIOUS (i)00571> Surface Area (ha)= 4.46 1.9100572> Dep. Storage (mm)= 2.00 5.0000573> Average Slope (%)= .50 2.0000574> Length (m)= 206.00 40.0000575> Mannings n = .015 .20000576> 00577> Max.eff.Inten.(mm/hr)= 20.16 15.2500578> over (min) 10.00 24.0000579> Storage Coeff. (min)= 10.03 (ii) 23.13 (ii)00580> Unit Hyd. Tpeak (min)= 10.00 24.0000581> Unit Hyd. peak (cms)= .11 .0500582> *TOTALS*00583> PEAK FLOW (cms)= .20 .06 .255 (iii)00584> TIME TO PEAK (hrs)= 12.00 12.17 12.00000585> RUNOFF VOLUME (mm)= 46.00 19.73 34.17900586> TOTAL RAINFALL (mm)= 48.00 48.00 48.00000587> RUNOFF COEFFICIENT = .96 .41 .71200588> 00589> (i) CN PROCEDURE SELECTED FOR PERVIOUS LOSSES:00590> CN* = 75.0 Ia = Dep. Storage (Above)00591> (ii) TIME STEP (DT) SHOULD BE SMALLER OR EQUAL00592> THAN THE STORAGE COEFFICIENT.00593> (iii) PEAK FLOW DOES NOT INCLUDE BASEFLOW IF ANY.00594> 00595> --------------------------------------------------------------------------------00596> 002:0011------------------------------------------------------------------------00597> *South Pond, Pond 2* 00598> ---------------------00599> | ROUTE RESERVOIR | Requested routing time step = 2.0 min.00600> | IN>09:(203 ) |00601> | OUT<07:(Pond2 ) | ========= OUTLFOW STORAGE TABLE =========00602> --------------------- OUTFLOW STORAGE | OUTFLOW STORAGE00603> (cms) (ha.m.) | (cms) (ha.m.)00604> .000 .0000E+00 | .170 .1920E+0000605> .002 .1115E+00 | .232 .2250E+0000606> .073 .1320E+00 | .330 .3791E+0000607> .133 .1670E+00 | .000 .0000E+0000608> 00609> ROUTING RESULTS AREA QPEAK TPEAK R.V.00610> -------------------- (ha) (cms) (hrs) (mm)00611> INFLOW >09: (203 ) 6.37 .255 12.000 34.17900612> OUTFLOW<07: (Pond2 ) 6.37 .073 13.167 34.17400613> OVERFLOW<10: (C1over) .00 .000 .000 .00000614> 00615> TOTAL NUMBER OF SIMULATED OVERFLOWS = 000616> CUMULATIVE TIME OF OVERFLOWS (hours)= .0000617> PERCENTAGE OF TIME OVERFLOWING (%)= .0000618> 00619> 00620> PEAK FLOW REDUCTION [Qout/Qin](%)= 28.65300621> TIME SHIFT OF PEAK FLOW (min)= 70.0000622> MAXIMUM STORAGE USED (ha.m.)=.1321E+0000623> 00624> --------------------------------------------------------------------------------00625> 002:0012------------------------------------------------------------------------00626> --------------------------------------------------------------------------------00627> 002:0002------------------------------------------------------------------------00628> ** END OF RUN : 200629> 00630> *******************************************************************************00631> 00632> 00633> 00634> 00635> 00636> --------------------00637> | START | Project dir.: C:\SWMHYMO\PARISG~1\ 00638> -------------------- Rainfall dir.: C:\SWMHYMO\PARISG~1\ 00639> TZERO = .00 hrs on 000640> METOUT= 2 (output = METRIC) 00641> NRUN = 00300642> NSTORM= 100643> # 1=5SCS24.stm 00644> --------------------------------------------------------------------------------00645> 003:0002------------------------------------------------------------------------00646> *#******************************************************************************00647> *# Project Name: [Paris Grand] Project Number: [PGD020165] 00648> *# Date : 03-12-2015 00649> *# Modeller : [M.Xu] 00650> *# Company : R.J. Burnside & Associates Ltd. 00651> *# License # : 3877524 00652> *#******************************************************************************00653> --------------------------------------------------------------------------------00654> 003:0002------------------------------------------------------------------------00655> *25mm SCS Type II Storm Distribution for Gilbert Creek, ON (24-hour)* 00656> --------------------00657> | READ STORM | Filename: 5-Year SCS Type-II Storm Distribution (200658> | Ptotal= 66.00 mm| Comments: 5-Year SCS Type-II Storm Distribution (200659> --------------------00660> TIME RAIN | TIME RAIN | TIME RAIN | TIME RAIN00661> hrs mm/hr | hrs mm/hr | hrs mm/hr | hrs mm/hr00662> 1.00 .660 | 7.00 1.320 | 13.00 7.920 | 19.00 1.32000663> 2.00 .660 | 8.00 1.320 | 14.00 3.300 | 20.00 .66000664> 3.00 .660 | 9.00 1.980 | 15.00 1.980 | 21.00 .66000665> 4.00 1.320 | 10.00 1.980 | 16.00 1.980 | 22.00 1.32000666> 5.00 .660 | 11.00 3.300 | 17.00 1.320 | 23.00 .66000667> 6.00 1.320 | 12.00 27.720 | 18.00 1.320 | 24.00 .66000668> 00669> --------------------------------------------------------------------------------00670> 003:0003------------------------------------------------------------------------00671> * 00672> *PRE-DEVELOPMENT FLOW RATES FOR AREAS DISCHARGING TO GILBERT CREEK* 00673> * 00674> *East Side of Creek* 00675> *
00676> ----------------------00677> | CALIB NASHYD | Area (ha)= 13.01 Curve Number (CN)=61.0000678> | 01:101 DT= 2.00 | Ia (mm)= 2.500 # of Linear Res.(N)= 3.0000679> ---------------------- U.H. Tp(hrs)= .52000680> 00681> Unit Hyd Qpeak (cms)= .95600682> 00683> PEAK FLOW (cms)= .224 (i)00684> TIME TO PEAK (hrs)= 12.26700685> RUNOFF VOLUME (mm)= 17.85000686> TOTAL RAINFALL (mm)= 66.00000687> RUNOFF COEFFICIENT = .27000688> 00689> (i) PEAK FLOW DOES NOT INCLUDE BASEFLOW IF ANY.00690> 00691> --------------------------------------------------------------------------------00692> 003:0004------------------------------------------------------------------------00693> *West Side of Creek* 00694> * 00695> ----------------------00696> | CALIB NASHYD | Area (ha)= 6.86 Curve Number (CN)=61.0000697> | 02:102 DT= 2.00 | Ia (mm)= 2.500 # of Linear Res.(N)= 3.0000698> ---------------------- U.H. Tp(hrs)= .40000699> 00700> Unit Hyd Qpeak (cms)= .65500701> 00702> PEAK FLOW (cms)= .134 (i)00703> TIME TO PEAK (hrs)= 12.16700704> RUNOFF VOLUME (mm)= 17.85000705> TOTAL RAINFALL (mm)= 66.00000706> RUNOFF COEFFICIENT = .27000707> 00708> (i) PEAK FLOW DOES NOT INCLUDE BASEFLOW IF ANY.00709> 00710> --------------------------------------------------------------------------------00711> 003:0005------------------------------------------------------------------------00712> *Wetland* 00713> * 00714> ----------------------00715> | CALIB NASHYD | Area (ha)= 6.27 Curve Number (CN)=61.0000716> | 03:103 DT= 2.00 | Ia (mm)= 2.500 # of Linear Res.(N)= 3.0000717> ---------------------- U.H. Tp(hrs)= .31000718> 00719> Unit Hyd Qpeak (cms)= .77300720> 00721> PEAK FLOW (cms)= .134 (i)00722> TIME TO PEAK (hrs)= 12.10000723> RUNOFF VOLUME (mm)= 17.85000724> TOTAL RAINFALL (mm)= 66.00000725> RUNOFF COEFFICIENT = .27000726> 00727> (i) PEAK FLOW DOES NOT INCLUDE BASEFLOW IF ANY.00728> 00729> --------------------------------------------------------------------------------00730> 003:0006------------------------------------------------------------------------00731> * 00732> *POST-DEVELOPMENT FLOW RATES FOR AREAS DISCHARGING TO GILBERT CREEK* 00733> * 00734> *East Side of Creek* 00735> * 00736> ----------------------00737> | CALIB STANDHYD | Area (ha)= 17.1200738> | 04:201 DT= 2.00 | Total Imp(%)= 46.00 Dir. Conn.(%)= 40.0000739> ----------------------00740> IMPERVIOUS PERVIOUS (i)00741> Surface Area (ha)= 7.88 9.2400742> Dep. Storage (mm)= 2.00 5.0000743> Average Slope (%)= .50 2.0000744> Length (m)= 378.00 40.0000745> Mannings n = .015 .20000746> 00747> Max.eff.Inten.(mm/hr)= 27.72 15.5900748> over (min) 12.00 26.0000749> Storage Coeff. (min)= 12.71 (ii) 25.70 (ii)00750> Unit Hyd. Tpeak (min)= 12.00 26.0000751> Unit Hyd. peak (cms)= .09 .0400752> *TOTALS*00753> PEAK FLOW (cms)= .52 .31 .803 (iii)00754> TIME TO PEAK (hrs)= 12.00 12.20 12.03300755> RUNOFF VOLUME (mm)= 64.00 27.46 42.08100756> TOTAL RAINFALL (mm)= 66.00 66.00 66.00000757> RUNOFF COEFFICIENT = .97 .42 .63800758> 00759> (i) CN PROCEDURE SELECTED FOR PERVIOUS LOSSES:00760> CN* = 75.0 Ia = Dep. Storage (Above)00761> (ii) TIME STEP (DT) SHOULD BE SMALLER OR EQUAL00762> THAN THE STORAGE COEFFICIENT.00763> (iii) PEAK FLOW DOES NOT INCLUDE BASEFLOW IF ANY.00764> 00765> --------------------------------------------------------------------------------00766> 003:0007------------------------------------------------------------------------00767> *East Pond, Pond 1* 00768> ---------------------00769> | ROUTE RESERVOIR | Requested routing time step = 2.0 min.00770> | IN>04:(201 ) |00771> | OUT<05:(Pond1 ) | ========= OUTLFOW STORAGE TABLE =========00772> --------------------- OUTFLOW STORAGE | OUTFLOW STORAGE00773> (cms) (ha.m.) | (cms) (ha.m.)00774> .000 .0000E+00 | .287 .4200E+0000775> .053 .1525E+00 | .391 .5055E+0000776> .123 .2490E+00 | .557 .7346E+0000777> .224 .3610E+00 | .000 .0000E+0000778> 00779> ROUTING RESULTS AREA QPEAK TPEAK R.V.00780> -------------------- (ha) (cms) (hrs) (mm)00781> INFLOW >04: (201 ) 17.12 .803 12.033 42.08100782> OUTFLOW<05: (Pond1 ) 17.12 .222 13.367 42.08000783> OVERFLOW<10: (C1over) .00 .000 .000 .00000784> 00785> TOTAL NUMBER OF SIMULATED OVERFLOWS = 000786> CUMULATIVE TIME OF OVERFLOWS (hours)= .0000787> PERCENTAGE OF TIME OVERFLOWING (%)= .0000788> 00789> 00790> PEAK FLOW REDUCTION [Qout/Qin](%)= 27.62900791> TIME SHIFT OF PEAK FLOW (min)= 80.0000792> MAXIMUM STORAGE USED (ha.m.)=.3588E+0000793> 00794> --------------------------------------------------------------------------------00795> 003:0008------------------------------------------------------------------------00796> *West Side of Gilbert Creek* 00797> * 00798> ----------------------00799> | CALIB STANDHYD | Area (ha)= 9.0100800> | 07:202 DT= 2.00 | Total Imp(%)= 46.00 Dir. Conn.(%)= 40.0000801> ----------------------00802> IMPERVIOUS PERVIOUS (i)00803> Surface Area (ha)= 4.14 4.8700804> Dep. Storage (mm)= 2.00 5.0000805> Average Slope (%)= .50 2.0000806> Length (m)= 274.00 40.0000807> Mannings n = .015 .20000808> 00809> Max.eff.Inten.(mm/hr)= 27.72 15.7200810> over (min) 10.00 24.00
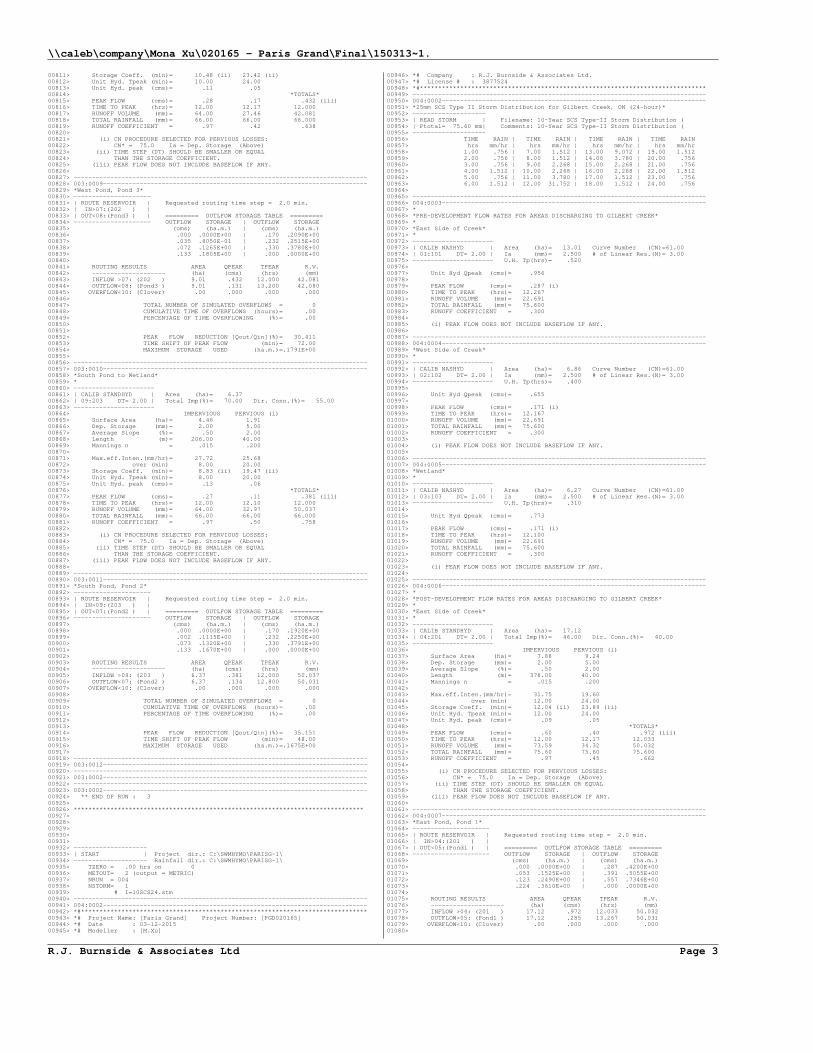
\\caleb\company\Mona Xu\020165 - Paris Grand\Final\150313~1.
R.J. Burnside & Associates Ltd Page 3
00811> Storage Coeff. (min)= 10.48 (ii) 23.42 (ii)00812> Unit Hyd. Tpeak (min)= 10.00 24.0000813> Unit Hyd. peak (cms)= .11 .0500814> *TOTALS*00815> PEAK FLOW (cms)= .28 .17 .432 (iii)00816> TIME TO PEAK (hrs)= 12.00 12.17 12.00000817> RUNOFF VOLUME (mm)= 64.00 27.46 42.08100818> TOTAL RAINFALL (mm)= 66.00 66.00 66.00000819> RUNOFF COEFFICIENT = .97 .42 .63800820> 00821> (i) CN PROCEDURE SELECTED FOR PERVIOUS LOSSES:00822> CN* = 75.0 Ia = Dep. Storage (Above)00823> (ii) TIME STEP (DT) SHOULD BE SMALLER OR EQUAL00824> THAN THE STORAGE COEFFICIENT.00825> (iii) PEAK FLOW DOES NOT INCLUDE BASEFLOW IF ANY.00826> 00827> --------------------------------------------------------------------------------00828> 003:0009------------------------------------------------------------------------00829> *West Pond, Pond 3* 00830> ---------------------00831> | ROUTE RESERVOIR | Requested routing time step = 2.0 min.00832> | IN>07:(202 ) |00833> | OUT<08:(Pond3 ) | ========= OUTLFOW STORAGE TABLE =========00834> --------------------- OUTFLOW STORAGE | OUTFLOW STORAGE00835> (cms) (ha.m.) | (cms) (ha.m.)00836> .000 .0000E+00 | .170 .2090E+0000837> .035 .8050E-01 | .232 .2515E+0000838> .072 .1265E+00 | .330 .3780E+0000839> .133 .1805E+00 | .000 .0000E+0000840> 00841> ROUTING RESULTS AREA QPEAK TPEAK R.V.00842> -------------------- (ha) (cms) (hrs) (mm)00843> INFLOW >07: (202 ) 9.01 .432 12.000 42.08100844> OUTFLOW<08: (Pond3 ) 9.01 .131 13.200 42.08000845> OVERFLOW<10: (C1over) .00 .000 .000 .00000846> 00847> TOTAL NUMBER OF SIMULATED OVERFLOWS = 000848> CUMULATIVE TIME OF OVERFLOWS (hours)= .0000849> PERCENTAGE OF TIME OVERFLOWING (%)= .0000850> 00851> 00852> PEAK FLOW REDUCTION [Qout/Qin](%)= 30.41100853> TIME SHIFT OF PEAK FLOW (min)= 72.0000854> MAXIMUM STORAGE USED (ha.m.)=.1791E+0000855> 00856> --------------------------------------------------------------------------------00857> 003:0010------------------------------------------------------------------------00858> *South Pond to Wetland* 00859> * 00860> ----------------------00861> | CALIB STANDHYD | Area (ha)= 6.3700862> | 09:203 DT= 2.00 | Total Imp(%)= 70.00 Dir. Conn.(%)= 55.0000863> ----------------------00864> IMPERVIOUS PERVIOUS (i)00865> Surface Area (ha)= 4.46 1.9100866> Dep. Storage (mm)= 2.00 5.0000867> Average Slope (%)= .50 2.0000868> Length (m)= 206.00 40.0000869> Mannings n = .015 .20000870> 00871> Max.eff.Inten.(mm/hr)= 27.72 25.6800872> over (min) 8.00 20.0000873> Storage Coeff. (min)= 8.83 (ii) 19.47 (ii)00874> Unit Hyd. Tpeak (min)= 8.00 20.0000875> Unit Hyd. peak (cms)= .13 .0600876> *TOTALS*00877> PEAK FLOW (cms)= .27 .11 .381 (iii)00878> TIME TO PEAK (hrs)= 12.00 12.10 12.00000879> RUNOFF VOLUME (mm)= 64.00 32.97 50.03700880> TOTAL RAINFALL (mm)= 66.00 66.00 66.00000881> RUNOFF COEFFICIENT = .97 .50 .75800882> 00883> (i) CN PROCEDURE SELECTED FOR PERVIOUS LOSSES:00884> CN* = 75.0 Ia = Dep. Storage (Above)00885> (ii) TIME STEP (DT) SHOULD BE SMALLER OR EQUAL00886> THAN THE STORAGE COEFFICIENT.00887> (iii) PEAK FLOW DOES NOT INCLUDE BASEFLOW IF ANY.00888> 00889> --------------------------------------------------------------------------------00890> 003:0011------------------------------------------------------------------------00891> *South Pond, Pond 2* 00892> ---------------------00893> | ROUTE RESERVOIR | Requested routing time step = 2.0 min.00894> | IN>09:(203 ) |00895> | OUT<07:(Pond2 ) | ========= OUTLFOW STORAGE TABLE =========00896> --------------------- OUTFLOW STORAGE | OUTFLOW STORAGE00897> (cms) (ha.m.) | (cms) (ha.m.)00898> .000 .0000E+00 | .170 .1920E+0000899> .002 .1115E+00 | .232 .2250E+0000900> .073 .1320E+00 | .330 .3791E+0000901> .133 .1670E+00 | .000 .0000E+0000902> 00903> ROUTING RESULTS AREA QPEAK TPEAK R.V.00904> -------------------- (ha) (cms) (hrs) (mm)00905> INFLOW >09: (203 ) 6.37 .381 12.000 50.03700906> OUTFLOW<07: (Pond2 ) 6.37 .134 12.800 50.03100907> OVERFLOW<10: (C1over) .00 .000 .000 .00000908> 00909> TOTAL NUMBER OF SIMULATED OVERFLOWS = 000910> CUMULATIVE TIME OF OVERFLOWS (hours)= .0000911> PERCENTAGE OF TIME OVERFLOWING (%)= .0000912> 00913> 00914> PEAK FLOW REDUCTION [Qout/Qin](%)= 35.15100915> TIME SHIFT OF PEAK FLOW (min)= 48.0000916> MAXIMUM STORAGE USED (ha.m.)=.1675E+0000917> 00918> --------------------------------------------------------------------------------00919> 003:0012------------------------------------------------------------------------00920> --------------------------------------------------------------------------------00921> 003:0002------------------------------------------------------------------------00922> --------------------------------------------------------------------------------00923> 003:0002------------------------------------------------------------------------00924> ** END OF RUN : 300925> 00926> *******************************************************************************00927> 00928> 00929> 00930> 00931> 00932> --------------------00933> | START | Project dir.: C:\SWMHYMO\PARISG~1\ 00934> -------------------- Rainfall dir.: C:\SWMHYMO\PARISG~1\ 00935> TZERO = .00 hrs on 000936> METOUT= 2 (output = METRIC) 00937> NRUN = 00400938> NSTORM= 100939> # 1=10SCS24.stm 00940> --------------------------------------------------------------------------------00941> 004:0002------------------------------------------------------------------------00942> *#******************************************************************************00943> *# Project Name: [Paris Grand] Project Number: [PGD020165] 00944> *# Date : 03-12-2015 00945> *# Modeller : [M.Xu]
00946> *# Company : R.J. Burnside & Associates Ltd. 00947> *# License # : 3877524 00948> *#******************************************************************************00949> --------------------------------------------------------------------------------00950> 004:0002------------------------------------------------------------------------00951> *25mm SCS Type II Storm Distribution for Gilbert Creek, ON (24-hour)* 00952> --------------------00953> | READ STORM | Filename: 10-Year SCS Type-II Storm Distribution (00954> | Ptotal= 75.60 mm| Comments: 10-Year SCS Type-II Storm Distribution (00955> --------------------00956> TIME RAIN | TIME RAIN | TIME RAIN | TIME RAIN00957> hrs mm/hr | hrs mm/hr | hrs mm/hr | hrs mm/hr00958> 1.00 .756 | 7.00 1.512 | 13.00 9.072 | 19.00 1.51200959> 2.00 .756 | 8.00 1.512 | 14.00 3.780 | 20.00 .75600960> 3.00 .756 | 9.00 2.268 | 15.00 2.268 | 21.00 .75600961> 4.00 1.512 | 10.00 2.268 | 16.00 2.268 | 22.00 1.51200962> 5.00 .756 | 11.00 3.780 | 17.00 1.512 | 23.00 .75600963> 6.00 1.512 | 12.00 31.752 | 18.00 1.512 | 24.00 .75600964> 00965> --------------------------------------------------------------------------------00966> 004:0003------------------------------------------------------------------------00967> * 00968> *PRE-DEVELOPMENT FLOW RATES FOR AREAS DISCHARGING TO GILBERT CREEK* 00969> * 00970> *East Side of Creek* 00971> * 00972> ----------------------00973> | CALIB NASHYD | Area (ha)= 13.01 Curve Number (CN)=61.0000974> | 01:101 DT= 2.00 | Ia (mm)= 2.500 # of Linear Res.(N)= 3.0000975> ---------------------- U.H. Tp(hrs)= .52000976> 00977> Unit Hyd Qpeak (cms)= .95600978> 00979> PEAK FLOW (cms)= .287 (i)00980> TIME TO PEAK (hrs)= 12.26700981> RUNOFF VOLUME (mm)= 22.69100982> TOTAL RAINFALL (mm)= 75.60000983> RUNOFF COEFFICIENT = .30000984> 00985> (i) PEAK FLOW DOES NOT INCLUDE BASEFLOW IF ANY.00986> 00987> --------------------------------------------------------------------------------00988> 004:0004------------------------------------------------------------------------00989> *West Side of Creek* 00990> * 00991> ----------------------00992> | CALIB NASHYD | Area (ha)= 6.86 Curve Number (CN)=61.0000993> | 02:102 DT= 2.00 | Ia (mm)= 2.500 # of Linear Res.(N)= 3.0000994> ---------------------- U.H. Tp(hrs)= .40000995> 00996> Unit Hyd Qpeak (cms)= .65500997> 00998> PEAK FLOW (cms)= .171 (i)00999> TIME TO PEAK (hrs)= 12.16701000> RUNOFF VOLUME (mm)= 22.69101001> TOTAL RAINFALL (mm)= 75.60001002> RUNOFF COEFFICIENT = .30001003> 01004> (i) PEAK FLOW DOES NOT INCLUDE BASEFLOW IF ANY.01005> 01006> --------------------------------------------------------------------------------01007> 004:0005------------------------------------------------------------------------01008> *Wetland* 01009> * 01010> ----------------------01011> | CALIB NASHYD | Area (ha)= 6.27 Curve Number (CN)=61.0001012> | 03:103 DT= 2.00 | Ia (mm)= 2.500 # of Linear Res.(N)= 3.0001013> ---------------------- U.H. Tp(hrs)= .31001014> 01015> Unit Hyd Qpeak (cms)= .77301016> 01017> PEAK FLOW (cms)= .171 (i)01018> TIME TO PEAK (hrs)= 12.10001019> RUNOFF VOLUME (mm)= 22.69101020> TOTAL RAINFALL (mm)= 75.60001021> RUNOFF COEFFICIENT = .30001022> 01023> (i) PEAK FLOW DOES NOT INCLUDE BASEFLOW IF ANY.01024> 01025> --------------------------------------------------------------------------------01026> 004:0006------------------------------------------------------------------------01027> * 01028> *POST-DEVELOPMENT FLOW RATES FOR AREAS DISCHARGING TO GILBERT CREEK* 01029> * 01030> *East Side of Creek* 01031> * 01032> ----------------------01033> | CALIB STANDHYD | Area (ha)= 17.1201034> | 04:201 DT= 2.00 | Total Imp(%)= 46.00 Dir. Conn.(%)= 40.0001035> ----------------------01036> IMPERVIOUS PERVIOUS (i)01037> Surface Area (ha)= 7.88 9.2401038> Dep. Storage (mm)= 2.00 5.0001039> Average Slope (%)= .50 2.0001040> Length (m)= 378.00 40.0001041> Mannings n = .015 .20001042> 01043> Max.eff.Inten.(mm/hr)= 31.75 19.6001044> over (min) 12.00 24.0001045> Storage Coeff. (min)= 12.04 (ii) 23.89 (ii)01046> Unit Hyd. Tpeak (min)= 12.00 24.0001047> Unit Hyd. peak (cms)= .09 .0501048> *TOTALS*01049> PEAK FLOW (cms)= .60 .40 .972 (iii)01050> TIME TO PEAK (hrs)= 12.00 12.17 12.03301051> RUNOFF VOLUME (mm)= 73.59 34.32 50.03201052> TOTAL RAINFALL (mm)= 75.60 75.60 75.60001053> RUNOFF COEFFICIENT = .97 .45 .66201054> 01055> (i) CN PROCEDURE SELECTED FOR PERVIOUS LOSSES:01056> CN* = 75.0 Ia = Dep. Storage (Above)01057> (ii) TIME STEP (DT) SHOULD BE SMALLER OR EQUAL01058> THAN THE STORAGE COEFFICIENT.01059> (iii) PEAK FLOW DOES NOT INCLUDE BASEFLOW IF ANY.01060> 01061> --------------------------------------------------------------------------------01062> 004:0007------------------------------------------------------------------------01063> *East Pond, Pond 1* 01064> ---------------------01065> | ROUTE RESERVOIR | Requested routing time step = 2.0 min.01066> | IN>04:(201 ) |01067> | OUT<05:(Pond1 ) | ========= OUTLFOW STORAGE TABLE =========01068> --------------------- OUTFLOW STORAGE | OUTFLOW STORAGE01069> (cms) (ha.m.) | (cms) (ha.m.)01070> .000 .0000E+00 | .287 .4200E+0001071> .053 .1525E+00 | .391 .5055E+0001072> .123 .2490E+00 | .557 .7346E+0001073> .224 .3610E+00 | .000 .0000E+0001074> 01075> ROUTING RESULTS AREA QPEAK TPEAK R.V.01076> -------------------- (ha) (cms) (hrs) (mm)01077> INFLOW >04: (201 ) 17.12 .972 12.033 50.03201078> OUTFLOW<05: (Pond1 ) 17.12 .285 13.267 50.03101079> OVERFLOW<10: (C1over) .00 .000 .000 .00001080>

\\caleb\company\Mona Xu\020165 - Paris Grand\Final\150313~1.
R.J. Burnside & Associates Ltd Page 4
01081> TOTAL NUMBER OF SIMULATED OVERFLOWS = 001082> CUMULATIVE TIME OF OVERFLOWS (hours)= .0001083> PERCENTAGE OF TIME OVERFLOWING (%)= .0001084> 01085> 01086> PEAK FLOW REDUCTION [Qout/Qin](%)= 29.31701087> TIME SHIFT OF PEAK FLOW (min)= 74.0001088> MAXIMUM STORAGE USED (ha.m.)=.4181E+0001089> 01090> --------------------------------------------------------------------------------01091> 004:0008------------------------------------------------------------------------01092> *West Side of Gilbert Creek* 01093> * 01094> ----------------------01095> | CALIB STANDHYD | Area (ha)= 9.0101096> | 07:202 DT= 2.00 | Total Imp(%)= 46.00 Dir. Conn.(%)= 40.0001097> ----------------------01098> IMPERVIOUS PERVIOUS (i)01099> Surface Area (ha)= 4.14 4.8701100> Dep. Storage (mm)= 2.00 5.0001101> Average Slope (%)= .50 2.0001102> Length (m)= 274.00 40.0001103> Mannings n = .015 .20001104> 01105> Max.eff.Inten.(mm/hr)= 31.75 19.7601106> over (min) 10.00 22.0001107> Storage Coeff. (min)= 9.93 (ii) 21.74 (ii)01108> Unit Hyd. Tpeak (min)= 10.00 22.0001109> Unit Hyd. peak (cms)= .11 .0501110> *TOTALS*01111> PEAK FLOW (cms)= .32 .22 .523 (iii)01112> TIME TO PEAK (hrs)= 12.00 12.13 12.00001113> RUNOFF VOLUME (mm)= 73.60 34.32 50.03201114> TOTAL RAINFALL (mm)= 75.60 75.60 75.60001115> RUNOFF COEFFICIENT = .97 .45 .66201116> 01117> (i) CN PROCEDURE SELECTED FOR PERVIOUS LOSSES:01118> CN* = 75.0 Ia = Dep. Storage (Above)01119> (ii) TIME STEP (DT) SHOULD BE SMALLER OR EQUAL01120> THAN THE STORAGE COEFFICIENT.01121> (iii) PEAK FLOW DOES NOT INCLUDE BASEFLOW IF ANY.01122> 01123> --------------------------------------------------------------------------------01124> 004:0009------------------------------------------------------------------------01125> *West Pond, Pond 3* 01126> ---------------------01127> | ROUTE RESERVOIR | Requested routing time step = 2.0 min.01128> | IN>07:(202 ) |01129> | OUT<08:(Pond3 ) | ========= OUTLFOW STORAGE TABLE =========01130> --------------------- OUTFLOW STORAGE | OUTFLOW STORAGE01131> (cms) (ha.m.) | (cms) (ha.m.)01132> .000 .0000E+00 | .170 .2090E+0001133> .035 .8050E-01 | .232 .2515E+0001134> .072 .1265E+00 | .330 .3780E+0001135> .133 .1805E+00 | .000 .0000E+0001136> 01137> ROUTING RESULTS AREA QPEAK TPEAK R.V.01138> -------------------- (ha) (cms) (hrs) (mm)01139> INFLOW >07: (202 ) 9.01 .523 12.000 50.03201140> OUTFLOW<08: (Pond3 ) 9.01 .168 13.133 50.03101141> OVERFLOW<10: (C1over) .00 .000 .000 .00001142> 01143> TOTAL NUMBER OF SIMULATED OVERFLOWS = 001144> CUMULATIVE TIME OF OVERFLOWS (hours)= .0001145> PERCENTAGE OF TIME OVERFLOWING (%)= .0001146> 01147> 01148> PEAK FLOW REDUCTION [Qout/Qin](%)= 32.22401149> TIME SHIFT OF PEAK FLOW (min)= 68.0001150> MAXIMUM STORAGE USED (ha.m.)=.2078E+0001151> 01152> --------------------------------------------------------------------------------01153> 004:0010------------------------------------------------------------------------01154> *South Pond to Wetland* 01155> * 01156> ----------------------01157> | CALIB STANDHYD | Area (ha)= 6.3701158> | 09:203 DT= 2.00 | Total Imp(%)= 70.00 Dir. Conn.(%)= 55.0001159> ----------------------01160> IMPERVIOUS PERVIOUS (i)01161> Surface Area (ha)= 4.46 1.9101162> Dep. Storage (mm)= 2.00 5.0001163> Average Slope (%)= .50 2.0001164> Length (m)= 206.00 40.0001165> Mannings n = .015 .20001166> 01167> Max.eff.Inten.(mm/hr)= 31.75 31.6201168> over (min) 8.00 18.0001169> Storage Coeff. (min)= 8.37 (ii) 18.15 (ii)01170> Unit Hyd. Tpeak (min)= 8.00 18.0001171> Unit Hyd. peak (cms)= .14 .0601172> *TOTALS*01173> PEAK FLOW (cms)= .31 .14 .451 (iii)01174> TIME TO PEAK (hrs)= 12.00 12.07 12.00001175> RUNOFF VOLUME (mm)= 73.60 40.57 58.73901176> TOTAL RAINFALL (mm)= 75.60 75.60 75.60001177> RUNOFF COEFFICIENT = .97 .54 .77701178> 01179> (i) CN PROCEDURE SELECTED FOR PERVIOUS LOSSES:01180> CN* = 75.0 Ia = Dep. Storage (Above)01181> (ii) TIME STEP (DT) SHOULD BE SMALLER OR EQUAL01182> THAN THE STORAGE COEFFICIENT.01183> (iii) PEAK FLOW DOES NOT INCLUDE BASEFLOW IF ANY.01184> 01185> --------------------------------------------------------------------------------01186> 004:0011------------------------------------------------------------------------01187> *South Pond, Pond 2* 01188> ---------------------01189> | ROUTE RESERVOIR | Requested routing time step = 2.0 min.01190> | IN>09:(203 ) |01191> | OUT<07:(Pond2 ) | ========= OUTLFOW STORAGE TABLE =========01192> --------------------- OUTFLOW STORAGE | OUTFLOW STORAGE01193> (cms) (ha.m.) | (cms) (ha.m.)01194> .000 .0000E+00 | .170 .1920E+0001195> .002 .1115E+00 | .232 .2250E+0001196> .073 .1320E+00 | .330 .3791E+0001197> .133 .1670E+00 | .000 .0000E+0001198> 01199> ROUTING RESULTS AREA QPEAK TPEAK R.V.01200> -------------------- (ha) (cms) (hrs) (mm)01201> INFLOW >09: (203 ) 6.37 .451 12.000 58.73901202> OUTFLOW<07: (Pond2 ) 6.37 .166 12.633 58.72801203> OVERFLOW<10: (C1over) .00 .000 .000 .00001204> 01205> TOTAL NUMBER OF SIMULATED OVERFLOWS = 001206> CUMULATIVE TIME OF OVERFLOWS (hours)= .0001207> PERCENTAGE OF TIME OVERFLOWING (%)= .0001208> 01209> 01210> PEAK FLOW REDUCTION [Qout/Qin](%)= 36.94201211> TIME SHIFT OF PEAK FLOW (min)= 38.0001212> MAXIMUM STORAGE USED (ha.m.)=.1896E+0001213> 01214> --------------------------------------------------------------------------------01215> 004:0012------------------------------------------------------------------------
01216> --------------------------------------------------------------------------------01217> 004:0002------------------------------------------------------------------------01218> --------------------------------------------------------------------------------01219> 004:0002------------------------------------------------------------------------01220> --------------------------------------------------------------------------------01221> 004:0002------------------------------------------------------------------------01222> ** END OF RUN : 401223> 01224> *******************************************************************************01225> 01226> 01227> 01228> 01229> 01230> --------------------01231> | START | Project dir.: C:\SWMHYMO\PARISG~1\ 01232> -------------------- Rainfall dir.: C:\SWMHYMO\PARISG~1\ 01233> TZERO = .00 hrs on 001234> METOUT= 2 (output = METRIC) 01235> NRUN = 00501236> NSTORM= 101237> # 1=25SCS24.stm 01238> --------------------------------------------------------------------------------01239> 005:0002------------------------------------------------------------------------01240> *#******************************************************************************01241> *# Project Name: [Paris Grand] Project Number: [PGD020165] 01242> *# Date : 03-12-2015 01243> *# Modeller : [M.Xu] 01244> *# Company : R.J. Burnside & Associates Ltd. 01245> *# License # : 3877524 01246> *#******************************************************************************01247> --------------------------------------------------------------------------------01248> 005:0002------------------------------------------------------------------------01249> *25mm SCS Type II Storm Distribution for Gilbert Creek, ON (24-hour)* 01250> --------------------01251> | READ STORM | Filename: 25-Year SCS Type-II Storm Distribution (01252> | Ptotal= 90.00 mm| Comments: 25-Year SCS Type-II Storm Distribution (01253> --------------------01254> TIME RAIN | TIME RAIN | TIME RAIN | TIME RAIN01255> hrs mm/hr | hrs mm/hr | hrs mm/hr | hrs mm/hr01256> 1.00 .900 | 7.00 1.800 | 13.00 10.800 | 19.00 1.80001257> 2.00 .900 | 8.00 1.800 | 14.00 4.500 | 20.00 .90001258> 3.00 .900 | 9.00 2.700 | 15.00 2.700 | 21.00 .90001259> 4.00 1.800 | 10.00 2.700 | 16.00 2.700 | 22.00 1.80001260> 5.00 .900 | 11.00 4.500 | 17.00 1.800 | 23.00 .90001261> 6.00 1.800 | 12.00 37.800 | 18.00 1.800 | 24.00 .90001262> 01263> --------------------------------------------------------------------------------01264> 005:0003------------------------------------------------------------------------01265> * 01266> *PRE-DEVELOPMENT FLOW RATES FOR AREAS DISCHARGING TO GILBERT CREEK* 01267> * 01268> *East Side of Creek* 01269> * 01270> ----------------------01271> | CALIB NASHYD | Area (ha)= 13.01 Curve Number (CN)=61.0001272> | 01:101 DT= 2.00 | Ia (mm)= 2.500 # of Linear Res.(N)= 3.0001273> ---------------------- U.H. Tp(hrs)= .52001274> 01275> Unit Hyd Qpeak (cms)= .95601276> 01277> PEAK FLOW (cms)= .392 (i)01278> TIME TO PEAK (hrs)= 12.26701279> RUNOFF VOLUME (mm)= 30.63801280> TOTAL RAINFALL (mm)= 90.00001281> RUNOFF COEFFICIENT = .34001282> 01283> (i) PEAK FLOW DOES NOT INCLUDE BASEFLOW IF ANY.01284> 01285> --------------------------------------------------------------------------------01286> 005:0004------------------------------------------------------------------------01287> *West Side of Creek* 01288> * 01289> ----------------------01290> | CALIB NASHYD | Area (ha)= 6.86 Curve Number (CN)=61.0001291> | 02:102 DT= 2.00 | Ia (mm)= 2.500 # of Linear Res.(N)= 3.0001292> ---------------------- U.H. Tp(hrs)= .40001293> 01294> Unit Hyd Qpeak (cms)= .65501295> 01296> PEAK FLOW (cms)= .233 (i)01297> TIME TO PEAK (hrs)= 12.16701298> RUNOFF VOLUME (mm)= 30.63801299> TOTAL RAINFALL (mm)= 90.00001300> RUNOFF COEFFICIENT = .34001301> 01302> (i) PEAK FLOW DOES NOT INCLUDE BASEFLOW IF ANY.01303> 01304> --------------------------------------------------------------------------------01305> 005:0005------------------------------------------------------------------------01306> *Wetland* 01307> * 01308> ----------------------01309> | CALIB NASHYD | Area (ha)= 6.27 Curve Number (CN)=61.0001310> | 03:103 DT= 2.00 | Ia (mm)= 2.500 # of Linear Res.(N)= 3.0001311> ---------------------- U.H. Tp(hrs)= .31001312> 01313> Unit Hyd Qpeak (cms)= .77301314> 01315> PEAK FLOW (cms)= .233 (i)01316> TIME TO PEAK (hrs)= 12.10001317> RUNOFF VOLUME (mm)= 30.63801318> TOTAL RAINFALL (mm)= 90.00001319> RUNOFF COEFFICIENT = .34001320> 01321> (i) PEAK FLOW DOES NOT INCLUDE BASEFLOW IF ANY.01322> 01323> --------------------------------------------------------------------------------01324> 005:0006------------------------------------------------------------------------01325> * 01326> *POST-DEVELOPMENT FLOW RATES FOR AREAS DISCHARGING TO GILBERT CREEK* 01327> * 01328> *East Side of Creek* 01329> * 01330> ----------------------01331> | CALIB STANDHYD | Area (ha)= 17.1201332> | 04:201 DT= 2.00 | Total Imp(%)= 46.00 Dir. Conn.(%)= 40.0001333> ----------------------01334> IMPERVIOUS PERVIOUS (i)01335> Surface Area (ha)= 7.88 9.2401336> Dep. Storage (mm)= 2.00 5.0001337> Average Slope (%)= .50 2.0001338> Length (m)= 378.00 40.0001339> Mannings n = .015 .20001340> 01341> Max.eff.Inten.(mm/hr)= 37.80 25.9001342> over (min) 12.00 22.0001343> Storage Coeff. (min)= 11.23 (ii) 21.83 (ii)01344> Unit Hyd. Tpeak (min)= 12.00 22.0001345> Unit Hyd. peak (cms)= .10 .0501346> *TOTALS*01347> PEAK FLOW (cms)= .71 .54 1.235 (iii)01348> TIME TO PEAK (hrs)= 12.00 12.13 12.03301349> RUNOFF VOLUME (mm)= 88.00 45.20 62.32501350> TOTAL RAINFALL (mm)= 90.00 90.00 90.000
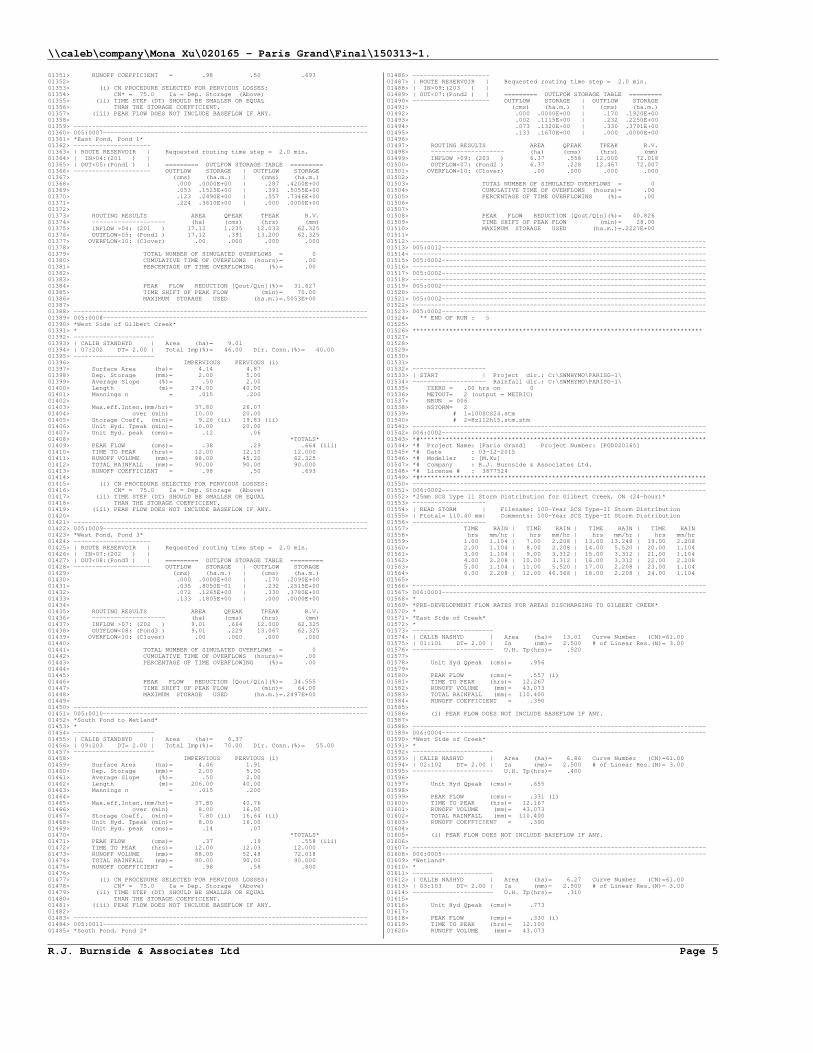
\\caleb\company\Mona Xu\020165 - Paris Grand\Final\150313~1.
R.J. Burnside & Associates Ltd Page 5
01351> RUNOFF COEFFICIENT = .98 .50 .69301352> 01353> (i) CN PROCEDURE SELECTED FOR PERVIOUS LOSSES:01354> CN* = 75.0 Ia = Dep. Storage (Above)01355> (ii) TIME STEP (DT) SHOULD BE SMALLER OR EQUAL01356> THAN THE STORAGE COEFFICIENT.01357> (iii) PEAK FLOW DOES NOT INCLUDE BASEFLOW IF ANY.01358> 01359> --------------------------------------------------------------------------------01360> 005:0007------------------------------------------------------------------------01361> *East Pond, Pond 1* 01362> ---------------------01363> | ROUTE RESERVOIR | Requested routing time step = 2.0 min.01364> | IN>04:(201 ) |01365> | OUT<05:(Pond1 ) | ========= OUTLFOW STORAGE TABLE =========01366> --------------------- OUTFLOW STORAGE | OUTFLOW STORAGE01367> (cms) (ha.m.) | (cms) (ha.m.)01368> .000 .0000E+00 | .287 .4200E+0001369> .053 .1525E+00 | .391 .5055E+0001370> .123 .2490E+00 | .557 .7346E+0001371> .224 .3610E+00 | .000 .0000E+0001372> 01373> ROUTING RESULTS AREA QPEAK TPEAK R.V.01374> -------------------- (ha) (cms) (hrs) (mm)01375> INFLOW >04: (201 ) 17.12 1.235 12.033 62.32501376> OUTFLOW<05: (Pond1 ) 17.12 .391 13.200 62.32501377> OVERFLOW<10: (C1over) .00 .000 .000 .00001378> 01379> TOTAL NUMBER OF SIMULATED OVERFLOWS = 001380> CUMULATIVE TIME OF OVERFLOWS (hours)= .0001381> PERCENTAGE OF TIME OVERFLOWING (%)= .0001382> 01383> 01384> PEAK FLOW REDUCTION [Qout/Qin](%)= 31.62701385> TIME SHIFT OF PEAK FLOW (min)= 70.0001386> MAXIMUM STORAGE USED (ha.m.)=.5053E+0001387> 01388> --------------------------------------------------------------------------------01389> 005:0008------------------------------------------------------------------------01390> *West Side of Gilbert Creek* 01391> * 01392> ----------------------01393> | CALIB STANDHYD | Area (ha)= 9.0101394> | 07:202 DT= 2.00 | Total Imp(%)= 46.00 Dir. Conn.(%)= 40.0001395> ----------------------01396> IMPERVIOUS PERVIOUS (i)01397> Surface Area (ha)= 4.14 4.8701398> Dep. Storage (mm)= 2.00 5.0001399> Average Slope (%)= .50 2.0001400> Length (m)= 274.00 40.0001401> Mannings n = .015 .20001402> 01403> Max.eff.Inten.(mm/hr)= 37.80 26.0701404> over (min) 10.00 20.0001405> Storage Coeff. (min)= 9.26 (ii) 19.83 (ii)01406> Unit Hyd. Tpeak (min)= 10.00 20.0001407> Unit Hyd. peak (cms)= .12 .0601408> *TOTALS*01409> PEAK FLOW (cms)= .38 .29 .664 (iii)01410> TIME TO PEAK (hrs)= 12.00 12.10 12.00001411> RUNOFF VOLUME (mm)= 88.00 45.20 62.32501412> TOTAL RAINFALL (mm)= 90.00 90.00 90.00001413> RUNOFF COEFFICIENT = .98 .50 .69301414> 01415> (i) CN PROCEDURE SELECTED FOR PERVIOUS LOSSES:01416> CN* = 75.0 Ia = Dep. Storage (Above)01417> (ii) TIME STEP (DT) SHOULD BE SMALLER OR EQUAL01418> THAN THE STORAGE COEFFICIENT.01419> (iii) PEAK FLOW DOES NOT INCLUDE BASEFLOW IF ANY.01420> 01421> --------------------------------------------------------------------------------01422> 005:0009------------------------------------------------------------------------01423> *West Pond, Pond 3* 01424> ---------------------01425> | ROUTE RESERVOIR | Requested routing time step = 2.0 min.01426> | IN>07:(202 ) |01427> | OUT<08:(Pond3 ) | ========= OUTLFOW STORAGE TABLE =========01428> --------------------- OUTFLOW STORAGE | OUTFLOW STORAGE01429> (cms) (ha.m.) | (cms) (ha.m.)01430> .000 .0000E+00 | .170 .2090E+0001431> .035 .8050E-01 | .232 .2515E+0001432> .072 .1265E+00 | .330 .3780E+0001433> .133 .1805E+00 | .000 .0000E+0001434> 01435> ROUTING RESULTS AREA QPEAK TPEAK R.V.01436> -------------------- (ha) (cms) (hrs) (mm)01437> INFLOW >07: (202 ) 9.01 .664 12.000 62.32501438> OUTFLOW<08: (Pond3 ) 9.01 .229 13.067 62.32501439> OVERFLOW<10: (C1over) .00 .000 .000 .00001440> 01441> TOTAL NUMBER OF SIMULATED OVERFLOWS = 001442> CUMULATIVE TIME OF OVERFLOWS (hours)= .0001443> PERCENTAGE OF TIME OVERFLOWING (%)= .0001444> 01445> 01446> PEAK FLOW REDUCTION [Qout/Qin](%)= 34.55501447> TIME SHIFT OF PEAK FLOW (min)= 64.0001448> MAXIMUM STORAGE USED (ha.m.)=.2497E+0001449> 01450> --------------------------------------------------------------------------------01451> 005:0010------------------------------------------------------------------------01452> *South Pond to Wetland* 01453> * 01454> ----------------------01455> | CALIB STANDHYD | Area (ha)= 6.3701456> | 09:203 DT= 2.00 | Total Imp(%)= 70.00 Dir. Conn.(%)= 55.0001457> ----------------------01458> IMPERVIOUS PERVIOUS (i)01459> Surface Area (ha)= 4.46 1.9101460> Dep. Storage (mm)= 2.00 5.0001461> Average Slope (%)= .50 2.0001462> Length (m)= 206.00 40.0001463> Mannings n = .015 .20001464> 01465> Max.eff.Inten.(mm/hr)= 37.80 40.7601466> over (min) 8.00 16.0001467> Storage Coeff. (min)= 7.80 (ii) 16.64 (ii)01468> Unit Hyd. Tpeak (min)= 8.00 16.0001469> Unit Hyd. peak (cms)= .14 .0701470> *TOTALS*01471> PEAK FLOW (cms)= .37 .19 .558 (iii)01472> TIME TO PEAK (hrs)= 12.00 12.03 12.00001473> RUNOFF VOLUME (mm)= 88.00 52.48 72.01801474> TOTAL RAINFALL (mm)= 90.00 90.00 90.00001475> RUNOFF COEFFICIENT = .98 .58 .80001476> 01477> (i) CN PROCEDURE SELECTED FOR PERVIOUS LOSSES:01478> CN* = 75.0 Ia = Dep. Storage (Above)01479> (ii) TIME STEP (DT) SHOULD BE SMALLER OR EQUAL01480> THAN THE STORAGE COEFFICIENT.01481> (iii) PEAK FLOW DOES NOT INCLUDE BASEFLOW IF ANY.01482> 01483> --------------------------------------------------------------------------------01484> 005:0011------------------------------------------------------------------------01485> *South Pond, Pond 2*
01486> ---------------------01487> | ROUTE RESERVOIR | Requested routing time step = 2.0 min.01488> | IN>09:(203 ) |01489> | OUT<07:(Pond2 ) | ========= OUTLFOW STORAGE TABLE =========01490> --------------------- OUTFLOW STORAGE | OUTFLOW STORAGE01491> (cms) (ha.m.) | (cms) (ha.m.)01492> .000 .0000E+00 | .170 .1920E+0001493> .002 .1115E+00 | .232 .2250E+0001494> .073 .1320E+00 | .330 .3791E+0001495> .133 .1670E+00 | .000 .0000E+0001496> 01497> ROUTING RESULTS AREA QPEAK TPEAK R.V.01498> -------------------- (ha) (cms) (hrs) (mm)01499> INFLOW >09: (203 ) 6.37 .558 12.000 72.01801500> OUTFLOW<07: (Pond2 ) 6.37 .228 12.467 72.00701501> OVERFLOW<10: (C1over) .00 .000 .000 .00001502> 01503> TOTAL NUMBER OF SIMULATED OVERFLOWS = 001504> CUMULATIVE TIME OF OVERFLOWS (hours)= .0001505> PERCENTAGE OF TIME OVERFLOWING (%)= .0001506> 01507> 01508> PEAK FLOW REDUCTION [Qout/Qin](%)= 40.82601509> TIME SHIFT OF PEAK FLOW (min)= 28.0001510> MAXIMUM STORAGE USED (ha.m.)=.2227E+0001511> 01512> --------------------------------------------------------------------------------01513> 005:0012------------------------------------------------------------------------01514> --------------------------------------------------------------------------------01515> 005:0002------------------------------------------------------------------------01516> --------------------------------------------------------------------------------01517> 005:0002------------------------------------------------------------------------01518> --------------------------------------------------------------------------------01519> 005:0002------------------------------------------------------------------------01520> --------------------------------------------------------------------------------01521> 005:0002------------------------------------------------------------------------01522> --------------------------------------------------------------------------------01523> 005:0002------------------------------------------------------------------------01524> ** END OF RUN : 501525> 01526> *******************************************************************************01527> 01528> 01529> 01530> 01531> 01532> --------------------01533> | START | Project dir.: C:\SWMHYMO\PARISG~1\ 01534> -------------------- Rainfall dir.: C:\SWMHYMO\PARISG~1\ 01535> TZERO = .00 hrs on 001536> METOUT= 2 (output = METRIC) 01537> NRUN = 00601538> NSTORM= 201539> # 1=100SCS24.stm 01540> # 2=Hzl12h15.stm.stm 01541> --------------------------------------------------------------------------------01542> 006:0002------------------------------------------------------------------------01543> *#******************************************************************************01544> *# Project Name: [Paris Grand] Project Number: [PGD020165] 01545> *# Date : 03-12-2015 01546> *# Modeller : [M.Xu] 01547> *# Company : R.J. Burnside & Associates Ltd. 01548> *# License # : 3877524 01549> *#******************************************************************************01550> --------------------------------------------------------------------------------01551> 006:0002------------------------------------------------------------------------01552> *25mm SCS Type II Storm Distribution for Gilbert Creek, ON (24-hour)* 01553> --------------------01554> | READ STORM | Filename: 100-Year SCS Type-II Storm Distribution 01555> | Ptotal= 110.40 mm| Comments: 100-Year SCS Type-II Storm Distribution 01556> --------------------01557> TIME RAIN | TIME RAIN | TIME RAIN | TIME RAIN01558> hrs mm/hr | hrs mm/hr | hrs mm/hr | hrs mm/hr01559> 1.00 1.104 | 7.00 2.208 | 13.00 13.248 | 19.00 2.20801560> 2.00 1.104 | 8.00 2.208 | 14.00 5.520 | 20.00 1.10401561> 3.00 1.104 | 9.00 3.312 | 15.00 3.312 | 21.00 1.10401562> 4.00 2.208 | 10.00 3.312 | 16.00 3.312 | 22.00 2.20801563> 5.00 1.104 | 11.00 5.520 | 17.00 2.208 | 23.00 1.10401564> 6.00 2.208 | 12.00 46.368 | 18.00 2.208 | 24.00 1.10401565> 01566> --------------------------------------------------------------------------------01567> 006:0003------------------------------------------------------------------------01568> * 01569> *PRE-DEVELOPMENT FLOW RATES FOR AREAS DISCHARGING TO GILBERT CREEK* 01570> * 01571> *East Side of Creek* 01572> * 01573> ----------------------01574> | CALIB NASHYD | Area (ha)= 13.01 Curve Number (CN)=61.0001575> | 01:101 DT= 2.00 | Ia (mm)= 2.500 # of Linear Res.(N)= 3.0001576> ---------------------- U.H. Tp(hrs)= .52001577> 01578> Unit Hyd Qpeak (cms)= .95601579> 01580> PEAK FLOW (cms)= .557 (i)01581> TIME TO PEAK (hrs)= 12.26701582> RUNOFF VOLUME (mm)= 43.07301583> TOTAL RAINFALL (mm)= 110.40001584> RUNOFF COEFFICIENT = .39001585> 01586> (i) PEAK FLOW DOES NOT INCLUDE BASEFLOW IF ANY.01587> 01588> --------------------------------------------------------------------------------01589> 006:0004------------------------------------------------------------------------01590> *West Side of Creek* 01591> * 01592> ----------------------01593> | CALIB NASHYD | Area (ha)= 6.86 Curve Number (CN)=61.0001594> | 02:102 DT= 2.00 | Ia (mm)= 2.500 # of Linear Res.(N)= 3.0001595> ---------------------- U.H. Tp(hrs)= .40001596> 01597> Unit Hyd Qpeak (cms)= .65501598> 01599> PEAK FLOW (cms)= .331 (i)01600> TIME TO PEAK (hrs)= 12.16701601> RUNOFF VOLUME (mm)= 43.07301602> TOTAL RAINFALL (mm)= 110.40001603> RUNOFF COEFFICIENT = .39001604> 01605> (i) PEAK FLOW DOES NOT INCLUDE BASEFLOW IF ANY.01606> 01607> --------------------------------------------------------------------------------01608> 006:0005------------------------------------------------------------------------01609> *Wetland* 01610> * 01611> ----------------------01612> | CALIB NASHYD | Area (ha)= 6.27 Curve Number (CN)=61.0001613> | 03:103 DT= 2.00 | Ia (mm)= 2.500 # of Linear Res.(N)= 3.0001614> ---------------------- U.H. Tp(hrs)= .31001615> 01616> Unit Hyd Qpeak (cms)= .77301617> 01618> PEAK FLOW (cms)= .330 (i)01619> TIME TO PEAK (hrs)= 12.10001620> RUNOFF VOLUME (mm)= 43.073
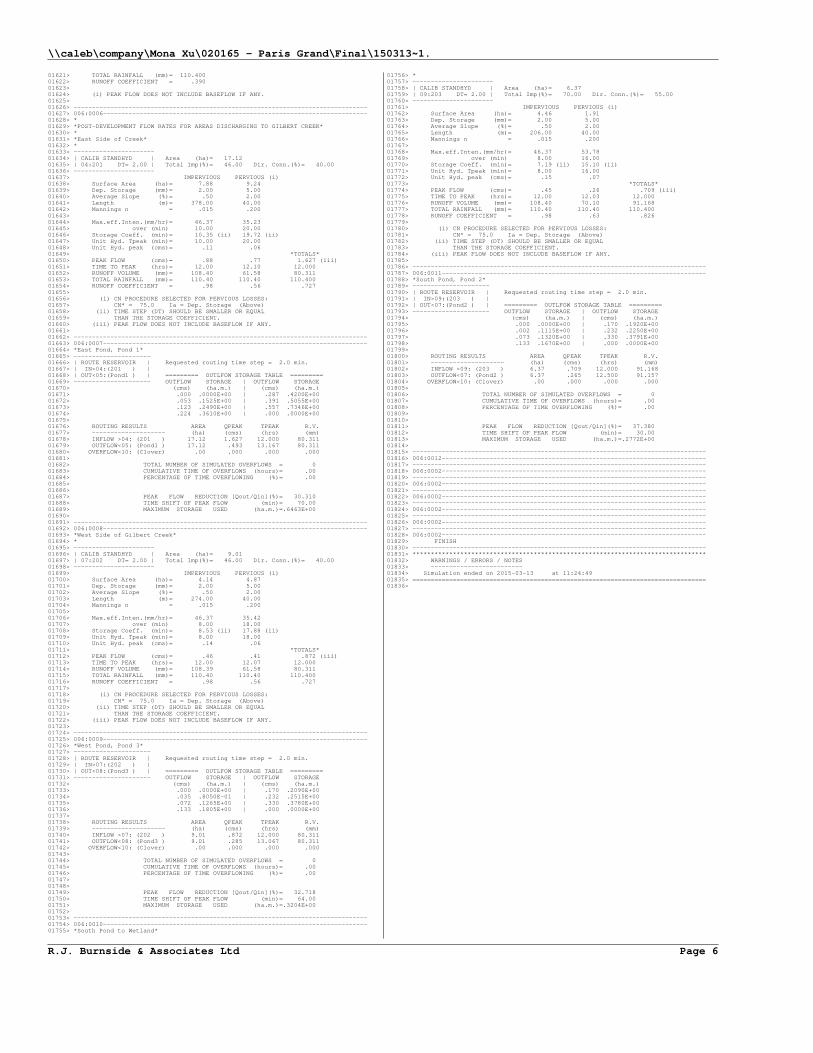
\\caleb\company\Mona Xu\020165 - Paris Grand\Final\150313~1.
R.J. Burnside & Associates Ltd Page 6
01621> TOTAL RAINFALL (mm)= 110.40001622> RUNOFF COEFFICIENT = .39001623> 01624> (i) PEAK FLOW DOES NOT INCLUDE BASEFLOW IF ANY.01625> 01626> --------------------------------------------------------------------------------01627> 006:0006------------------------------------------------------------------------01628> * 01629> *POST-DEVELOPMENT FLOW RATES FOR AREAS DISCHARGING TO GILBERT CREEK* 01630> * 01631> *East Side of Creek* 01632> * 01633> ----------------------01634> | CALIB STANDHYD | Area (ha)= 17.1201635> | 04:201 DT= 2.00 | Total Imp(%)= 46.00 Dir. Conn.(%)= 40.0001636> ----------------------01637> IMPERVIOUS PERVIOUS (i)01638> Surface Area (ha)= 7.88 9.2401639> Dep. Storage (mm)= 2.00 5.0001640> Average Slope (%)= .50 2.0001641> Length (m)= 378.00 40.0001642> Mannings n = .015 .20001643> 01644> Max.eff.Inten.(mm/hr)= 46.37 35.2301645> over (min) 10.00 20.0001646> Storage Coeff. (min)= 10.35 (ii) 19.72 (ii)01647> Unit Hyd. Tpeak (min)= 10.00 20.0001648> Unit Hyd. peak (cms)= .11 .0601649> *TOTALS*01650> PEAK FLOW (cms)= .88 .77 1.627 (iii)01651> TIME TO PEAK (hrs)= 12.00 12.10 12.00001652> RUNOFF VOLUME (mm)= 108.40 61.58 80.31101653> TOTAL RAINFALL (mm)= 110.40 110.40 110.40001654> RUNOFF COEFFICIENT = .98 .56 .72701655> 01656> (i) CN PROCEDURE SELECTED FOR PERVIOUS LOSSES:01657> CN* = 75.0 Ia = Dep. Storage (Above)01658> (ii) TIME STEP (DT) SHOULD BE SMALLER OR EQUAL01659> THAN THE STORAGE COEFFICIENT.01660> (iii) PEAK FLOW DOES NOT INCLUDE BASEFLOW IF ANY.01661> 01662> --------------------------------------------------------------------------------01663> 006:0007------------------------------------------------------------------------01664> *East Pond, Pond 1* 01665> ---------------------01666> | ROUTE RESERVOIR | Requested routing time step = 2.0 min.01667> | IN>04:(201 ) |01668> | OUT<05:(Pond1 ) | ========= OUTLFOW STORAGE TABLE =========01669> --------------------- OUTFLOW STORAGE | OUTFLOW STORAGE01670> (cms) (ha.m.) | (cms) (ha.m.)01671> .000 .0000E+00 | .287 .4200E+0001672> .053 .1525E+00 | .391 .5055E+0001673> .123 .2490E+00 | .557 .7346E+0001674> .224 .3610E+00 | .000 .0000E+0001675> 01676> ROUTING RESULTS AREA QPEAK TPEAK R.V.01677> -------------------- (ha) (cms) (hrs) (mm)01678> INFLOW >04: (201 ) 17.12 1.627 12.000 80.31101679> OUTFLOW<05: (Pond1 ) 17.12 .493 13.167 80.31101680> OVERFLOW<10: (C1over) .00 .000 .000 .00001681> 01682> TOTAL NUMBER OF SIMULATED OVERFLOWS = 001683> CUMULATIVE TIME OF OVERFLOWS (hours)= .0001684> PERCENTAGE OF TIME OVERFLOWING (%)= .0001685> 01686> 01687> PEAK FLOW REDUCTION [Qout/Qin](%)= 30.31001688> TIME SHIFT OF PEAK FLOW (min)= 70.0001689> MAXIMUM STORAGE USED (ha.m.)=.6463E+0001690> 01691> --------------------------------------------------------------------------------01692> 006:0008------------------------------------------------------------------------01693> *West Side of Gilbert Creek* 01694> * 01695> ----------------------01696> | CALIB STANDHYD | Area (ha)= 9.0101697> | 07:202 DT= 2.00 | Total Imp(%)= 46.00 Dir. Conn.(%)= 40.0001698> ----------------------01699> IMPERVIOUS PERVIOUS (i)01700> Surface Area (ha)= 4.14 4.8701701> Dep. Storage (mm)= 2.00 5.0001702> Average Slope (%)= .50 2.0001703> Length (m)= 274.00 40.0001704> Mannings n = .015 .20001705> 01706> Max.eff.Inten.(mm/hr)= 46.37 35.4201707> over (min) 8.00 18.0001708> Storage Coeff. (min)= 8.53 (ii) 17.88 (ii)01709> Unit Hyd. Tpeak (min)= 8.00 18.0001710> Unit Hyd. peak (cms)= .14 .0601711> *TOTALS*01712> PEAK FLOW (cms)= .46 .41 .872 (iii)01713> TIME TO PEAK (hrs)= 12.00 12.07 12.00001714> RUNOFF VOLUME (mm)= 108.39 61.58 80.31101715> TOTAL RAINFALL (mm)= 110.40 110.40 110.40001716> RUNOFF COEFFICIENT = .98 .56 .72701717> 01718> (i) CN PROCEDURE SELECTED FOR PERVIOUS LOSSES:01719> CN* = 75.0 Ia = Dep. Storage (Above)01720> (ii) TIME STEP (DT) SHOULD BE SMALLER OR EQUAL01721> THAN THE STORAGE COEFFICIENT.01722> (iii) PEAK FLOW DOES NOT INCLUDE BASEFLOW IF ANY.01723> 01724> --------------------------------------------------------------------------------01725> 006:0009------------------------------------------------------------------------01726> *West Pond, Pond 3* 01727> ---------------------01728> | ROUTE RESERVOIR | Requested routing time step = 2.0 min.01729> | IN>07:(202 ) |01730> | OUT<08:(Pond3 ) | ========= OUTLFOW STORAGE TABLE =========01731> --------------------- OUTFLOW STORAGE | OUTFLOW STORAGE01732> (cms) (ha.m.) | (cms) (ha.m.)01733> .000 .0000E+00 | .170 .2090E+0001734> .035 .8050E-01 | .232 .2515E+0001735> .072 .1265E+00 | .330 .3780E+0001736> .133 .1805E+00 | .000 .0000E+0001737> 01738> ROUTING RESULTS AREA QPEAK TPEAK R.V.01739> -------------------- (ha) (cms) (hrs) (mm)01740> INFLOW >07: (202 ) 9.01 .872 12.000 80.31101741> OUTFLOW<08: (Pond3 ) 9.01 .285 13.067 80.31101742> OVERFLOW<10: (C1over) .00 .000 .000 .00001743> 01744> TOTAL NUMBER OF SIMULATED OVERFLOWS = 001745> CUMULATIVE TIME OF OVERFLOWS (hours)= .0001746> PERCENTAGE OF TIME OVERFLOWING (%)= .0001747> 01748> 01749> PEAK FLOW REDUCTION [Qout/Qin](%)= 32.71801750> TIME SHIFT OF PEAK FLOW (min)= 64.0001751> MAXIMUM STORAGE USED (ha.m.)=.3204E+0001752> 01753> --------------------------------------------------------------------------------01754> 006:0010------------------------------------------------------------------------01755> *South Pond to Wetland*
01756> * 01757> ----------------------01758> | CALIB STANDHYD | Area (ha)= 6.3701759> | 09:203 DT= 2.00 | Total Imp(%)= 70.00 Dir. Conn.(%)= 55.0001760> ----------------------01761> IMPERVIOUS PERVIOUS (i)01762> Surface Area (ha)= 4.46 1.9101763> Dep. Storage (mm)= 2.00 5.0001764> Average Slope (%)= .50 2.0001765> Length (m)= 206.00 40.0001766> Mannings n = .015 .20001767> 01768> Max.eff.Inten.(mm/hr)= 46.37 53.7801769> over (min) 8.00 16.0001770> Storage Coeff. (min)= 7.19 (ii) 15.10 (ii)01771> Unit Hyd. Tpeak (min)= 8.00 16.0001772> Unit Hyd. peak (cms)= .15 .0701773> *TOTALS*01774> PEAK FLOW (cms)= .45 .26 .709 (iii)01775> TIME TO PEAK (hrs)= 12.00 12.03 12.00001776> RUNOFF VOLUME (mm)= 108.40 70.10 91.16801777> TOTAL RAINFALL (mm)= 110.40 110.40 110.40001778> RUNOFF COEFFICIENT = .98 .63 .82601779> 01780> (i) CN PROCEDURE SELECTED FOR PERVIOUS LOSSES:01781> CN* = 75.0 Ia = Dep. Storage (Above)01782> (ii) TIME STEP (DT) SHOULD BE SMALLER OR EQUAL01783> THAN THE STORAGE COEFFICIENT.01784> (iii) PEAK FLOW DOES NOT INCLUDE BASEFLOW IF ANY.01785> 01786> --------------------------------------------------------------------------------01787> 006:0011------------------------------------------------------------------------01788> *South Pond, Pond 2* 01789> ---------------------01790> | ROUTE RESERVOIR | Requested routing time step = 2.0 min.01791> | IN>09:(203 ) |01792> | OUT<07:(Pond2 ) | ========= OUTLFOW STORAGE TABLE =========01793> --------------------- OUTFLOW STORAGE | OUTFLOW STORAGE01794> (cms) (ha.m.) | (cms) (ha.m.)01795> .000 .0000E+00 | .170 .1920E+0001796> .002 .1115E+00 | .232 .2250E+0001797> .073 .1320E+00 | .330 .3791E+0001798> .133 .1670E+00 | .000 .0000E+0001799> 01800> ROUTING RESULTS AREA QPEAK TPEAK R.V.01801> -------------------- (ha) (cms) (hrs) (mm)01802> INFLOW >09: (203 ) 6.37 .709 12.000 91.16801803> OUTFLOW<07: (Pond2 ) 6.37 .265 12.500 91.15701804> OVERFLOW<10: (C1over) .00 .000 .000 .00001805> 01806> TOTAL NUMBER OF SIMULATED OVERFLOWS = 001807> CUMULATIVE TIME OF OVERFLOWS (hours)= .0001808> PERCENTAGE OF TIME OVERFLOWING (%)= .0001809> 01810> 01811> PEAK FLOW REDUCTION [Qout/Qin](%)= 37.38001812> TIME SHIFT OF PEAK FLOW (min)= 30.0001813> MAXIMUM STORAGE USED (ha.m.)=.2772E+0001814> 01815> --------------------------------------------------------------------------------01816> 006:0012------------------------------------------------------------------------01817> --------------------------------------------------------------------------------01818> 006:0002------------------------------------------------------------------------01819> --------------------------------------------------------------------------------01820> 006:0002------------------------------------------------------------------------01821> --------------------------------------------------------------------------------01822> 006:0002------------------------------------------------------------------------01823> --------------------------------------------------------------------------------01824> 006:0002------------------------------------------------------------------------01825> --------------------------------------------------------------------------------01826> 006:0002------------------------------------------------------------------------01827> --------------------------------------------------------------------------------01828> 006:0002------------------------------------------------------------------------01829> FINISH01830> --------------------------------------------------------------------------------01831> ********************************************************************************01832> WARNINGS / ERRORS / NOTES01833> -------------------------01834> Simulation ended on 2015-03-13 at 11:24:4901835> ================================================================================01836>

(C:\...201503~1.out) R.J. Burnside & Associates Ltd
R.J. Burnside & Associates Ltd Page 0
00001> ================================================================================00002> 00003> SSSSS W W M M H H Y Y M M OOO 999 999 =========00004> S W W W MM MM H H Y Y MM MM O O 9 9 9 9 00005> SSSSS W W W M M M HHHHH Y M M M O O ## 9 9 9 9 Ver 4.0500006> S W W M M H H Y M M O O 9999 9999 Sept 201100007> SSSSS W W M M H H Y M M OOO 9 9 =========00008> 9 9 9 9 # 387752400009> StormWater Management HYdrologic Model 999 999 =========00010> 00011> *******************************************************************************00012> ***************************** SWMHYMO Ver/4.05 ******************************00013> ********* A single event and continuous hydrologic simulation model *********00014> ********* based on the principles of HYMO and its successors *********00015> ********* OTTHYMO-83 and OTTHYMO-89. *********00016> *******************************************************************************00017> ********* Distributed by: J.F. Sabourin and Associates Inc. *********00018> ********* Ottawa, Ontario: (613) 836-3884 *********00019> ********* Gatineau, Quebec: (819) 243-6858 *********00020> ********* E-Mail: [email protected] *********00021> *******************************************************************************00022> 00023> +++++++++++++++++++++++++++++++++++++++++++++++++++++++++++++++++++++++++++++++00024> +++++++++ Licensed user: R.J. Burnside & Associates Ltd +++++++++00025> +++++++++ Brampton SERIAL#:3877524 +++++++++00026> +++++++++++++++++++++++++++++++++++++++++++++++++++++++++++++++++++++++++++++++00027> 00028> *******************************************************************************00029> ********* ++++++ PROGRAM ARRAY DIMENSIONS ++++++ *********00030> ********* Maximum value for ID numbers : 10 *********00031> ********* Max. number of rainfall points: 105408 *********00032> ********* Max. number of flow points : 105408 *********00033> *******************************************************************************00034> 00035> 00036> ********************** D E T A I L E D O U T P U T **********************00037> *******************************************************************************00038> * DATE: 2015-03-12 TIME: 12:24:39 RUN COUNTER: 000083 *00039> *******************************************************************************00040> * Input filename: C:\SWMHYMO\PARISG~1\201503~1.DAT *00041> * Output filename: C:\SWMHYMO\PARISG~1\201503~1.out *00042> * Summary filename: C:\SWMHYMO\PARISG~1\201503~1.sum *00043> * User comments: *00044> * 1:__________________________________________________________________________*00045> * 2:__________________________________________________________________________*00046> * 3:__________________________________________________________________________*00047> *******************************************************************************00048> 00049> --------------------------------------------------------------------------------00050> 001:0001------------------------------------------------------------------------00051> *#******************************************************************************00052> *# Project Name: [Paris Grand] Project Number: [PGD020165] 00053> *# Date : 13-03-2015 00054> *# Modeller : [M.Xu] 00055> *# Company : R.J. Burnside & Associates Ltd. 00056> *# License # : 3877524 00057> *#******************************************************************************00058> *25mm Chicago Storm Distribution for Credit Valley, ON (4-hour)* 00059> --------------------00060> | START | Project dir.: C:\SWMHYMO\PARISG~1\ 00061> -------------------- Rainfall dir.: C:\SWMHYMO\PARISG~1\ 00062> TZERO = .00 hrs on 000063> METOUT= 2 (output = METRIC) 00064> NRUN = 00100065> NSTORM= 100066> # 1=25mm4hr.stm 00067> --------------------------------------------------------------------------------00068> 001:0002------------------------------------------------------------------------00069> --------------------00070> | READ STORM | Filename: 25mm Chicago Storm Distribution (24-hour00071> | Ptotal= 25.00 mm| Comments: 25mm Chicago Storm Distribution (24-hour00072> --------------------00073> TIME RAIN | TIME RAIN | TIME RAIN | TIME RAIN00074> hrs mm/hr | hrs mm/hr | hrs mm/hr | hrs mm/hr00075> .17 1.500 | 1.33 36.300 | 2.50 2.850 | 3.67 1.50000076> .33 2.100 | 1.50 23.550 | 2.67 2.400 | 3.83 1.05000077> .50 2.250 | 1.67 9.900 | 2.83 2.250 | 4.00 .60000078> .67 2.550 | 1.83 6.300 | 3.00 2.100 | 4.17 .30000079> .83 4.050 | 2.00 4.800 | 3.17 1.800 |00080> 1.00 7.500 | 2.17 3.900 | 3.33 1.650 |00081> 1.17 24.000 | 2.33 3.150 | 3.50 1.650 |00082> 00083> --------------------------------------------------------------------------------00084> 001:0003------------------------------------------------------------------------00085> * 00086> *PRE-DEVELOPMENT FLOW RATES FOR AREAS DISCHARGING TO GILBERT CREEK* 00087> * 00088> *East Side of Creek* 00089> * 00090> ----------------------00091> | CALIB NASHYD | Area (ha)= 13.01 Curve Number (CN)=61.0000092> | 01:101 DT= 2.00 | Ia (mm)= 2.500 # of Linear Res.(N)= 3.0000093> ---------------------- U.H. Tp(hrs)= .52000094> 00095> Unit Hyd Qpeak (cms)= .95600096> 00097> PEAK FLOW (cms)= .057 (i)00098> TIME TO PEAK (hrs)= 2.03300099> RUNOFF VOLUME (mm)= 2.73800100> TOTAL RAINFALL (mm)= 25.00000101> RUNOFF COEFFICIENT = .11000102> 00103> (i) PEAK FLOW DOES NOT INCLUDE BASEFLOW IF ANY.00104> 00105> --------------------------------------------------------------------------------00106> 001:0004------------------------------------------------------------------------00107> *West Side of Creek* 00108> * 00109> ----------------------00110> | CALIB NASHYD | Area (ha)= 6.86 Curve Number (CN)=61.0000111> | 02:102 DT= 2.00 | Ia (mm)= 2.500 # of Linear Res.(N)= 3.0000112> ---------------------- U.H. Tp(hrs)= .40000113> 00114> Unit Hyd Qpeak (cms)= .65500115> 00116> PEAK FLOW (cms)= .036 (i)00117> TIME TO PEAK (hrs)= 1.86700118> RUNOFF VOLUME (mm)= 2.73800119> TOTAL RAINFALL (mm)= 25.00000120> RUNOFF COEFFICIENT = .11000121> 00122> (i) PEAK FLOW DOES NOT INCLUDE BASEFLOW IF ANY.00123> 00124> --------------------------------------------------------------------------------00125> 001:0005------------------------------------------------------------------------00126> *Wetland* 00127> * 00128> ----------------------00129> | CALIB NASHYD | Area (ha)= 6.27 Curve Number (CN)=61.0000130> | 03:103 DT= 2.00 | Ia (mm)= 2.500 # of Linear Res.(N)= 3.0000131> ---------------------- U.H. Tp(hrs)= .31000132> 00133> Unit Hyd Qpeak (cms)= .77300134> 00135> PEAK FLOW (cms)= .038 (i)
00136> TIME TO PEAK (hrs)= 1.73300137> RUNOFF VOLUME (mm)= 2.73800138> TOTAL RAINFALL (mm)= 25.00000139> RUNOFF COEFFICIENT = .11000140> 00141> (i) PEAK FLOW DOES NOT INCLUDE BASEFLOW IF ANY.00142> 00143> --------------------------------------------------------------------------------00144> 001:0006------------------------------------------------------------------------00145> * 00146> *POST-DEVELOPMENT FLOW RATES FOR AREAS DISCHARGING TO GILBERT CREEK* 00147> * 00148> *East Side of Creek* 00149> * 00150> ----------------------00151> | CALIB STANDHYD | Area (ha)= 17.1200152> | 04:201 DT= 2.00 | Total Imp(%)= 46.00 Dir. Conn.(%)= 40.0000153> ----------------------00154> IMPERVIOUS PERVIOUS (i)00155> Surface Area (ha)= 7.88 9.2400156> Dep. Storage (mm)= 2.00 5.0000157> Average Slope (%)= .50 2.0000158> Length (m)= 378.00 40.0000159> Mannings n = .015 .20000160> 00161> Max.eff.Inten.(mm/hr)= 34.25 4.7200162> over (min) 12.00 32.0000163> Storage Coeff. (min)= 11.68 (ii) 32.63 (ii)00164> Unit Hyd. Tpeak (min)= 12.00 32.0000165> Unit Hyd. peak (cms)= .10 .0300166> *TOTALS*00167> PEAK FLOW (cms)= .50 .07 .525 (iii)00168> TIME TO PEAK (hrs)= 1.47 2.00 1.50000169> RUNOFF VOLUME (mm)= 23.00 4.35 11.80800170> TOTAL RAINFALL (mm)= 25.00 25.00 25.00000171> RUNOFF COEFFICIENT = .92 .17 .47200172> 00173> (i) CN PROCEDURE SELECTED FOR PERVIOUS LOSSES:00174> CN* = 75.0 Ia = Dep. Storage (Above)00175> (ii) TIME STEP (DT) SHOULD BE SMALLER OR EQUAL00176> THAN THE STORAGE COEFFICIENT.00177> (iii) PEAK FLOW DOES NOT INCLUDE BASEFLOW IF ANY.00178> 00179> --------------------------------------------------------------------------------00180> 001:0007------------------------------------------------------------------------00181> *East Pond, Pond 1* 00182> ---------------------00183> | ROUTE RESERVOIR | Requested routing time step = 2.0 min.00184> | IN>04:(201 ) |00185> | OUT<05:(Pond1 ) | ========= OUTLFOW STORAGE TABLE =========00186> --------------------- OUTFLOW STORAGE | OUTFLOW STORAGE00187> (cms) (ha.m.) | (cms) (ha.m.)00188> .000 .0000E+00 | .333 .4130E+0000189> .053 .1525E+00 | .479 .5190E+0000190> .115 .2270E+00 | .748 .7346E+0000191> .233 .3340E+00 | .000 .0000E+0000192> 00193> ROUTING RESULTS AREA QPEAK TPEAK R.V.00194> -------------------- (ha) (cms) (hrs) (mm)00195> INFLOW >04: (201 ) 17.12 .525 1.500 11.80800196> OUTFLOW<05: (Pond1 ) 17.12 .053 3.733 11.80700197> OVERFLOW<10: (C1over) .00 .000 .000 .00000198> 00199> TOTAL NUMBER OF SIMULATED OVERFLOWS = 000200> CUMULATIVE TIME OF OVERFLOWS (hours)= .0000201> PERCENTAGE OF TIME OVERFLOWING (%)= .0000202> 00203> 00204> PEAK FLOW REDUCTION [Qout/Qin](%)= 10.09000205> TIME SHIFT OF PEAK FLOW (min)= 134.0000206> MAXIMUM STORAGE USED (ha.m.)=.1524E+0000207> 00208> --------------------------------------------------------------------------------00209> 001:0008------------------------------------------------------------------------00210> *West Side of Gilbert Creek* 00211> * 00212> ----------------------00213> | CALIB STANDHYD | Area (ha)= 9.0100214> | 07:202 DT= 2.00 | Total Imp(%)= 46.00 Dir. Conn.(%)= 40.0000215> ----------------------00216> IMPERVIOUS PERVIOUS (i)00217> Surface Area (ha)= 4.14 4.8700218> Dep. Storage (mm)= 2.00 5.0000219> Average Slope (%)= .50 2.0000220> Length (m)= 274.00 40.0000221> Mannings n = .015 .20000222> 00223> Max.eff.Inten.(mm/hr)= 36.30 4.8900224> over (min) 10.00 30.0000225> Storage Coeff. (min)= 9.41 (ii) 30.05 (ii)00226> Unit Hyd. Tpeak (min)= 10.00 30.0000227> Unit Hyd. peak (cms)= .12 .0400228> *TOTALS*00229> PEAK FLOW (cms)= .28 .04 .293 (iii)00230> TIME TO PEAK (hrs)= 1.43 1.93 1.43300231> RUNOFF VOLUME (mm)= 23.00 4.35 11.80800232> TOTAL RAINFALL (mm)= 25.00 25.00 25.00000233> RUNOFF COEFFICIENT = .92 .17 .47200234> 00235> (i) CN PROCEDURE SELECTED FOR PERVIOUS LOSSES:00236> CN* = 75.0 Ia = Dep. Storage (Above)00237> (ii) TIME STEP (DT) SHOULD BE SMALLER OR EQUAL00238> THAN THE STORAGE COEFFICIENT.00239> (iii) PEAK FLOW DOES NOT INCLUDE BASEFLOW IF ANY.00240> 00241> --------------------------------------------------------------------------------00242> 001:0009------------------------------------------------------------------------00243> *West Pond, Pond 3* 00244> ---------------------00245> | ROUTE RESERVOIR | Requested routing time step = 2.0 min.00246> | IN>07:(202 ) |00247> | OUT<08:(Pond3 ) | ========= OUTLFOW STORAGE TABLE =========00248> --------------------- OUTFLOW STORAGE | OUTFLOW STORAGE00249> (cms) (ha.m.) | (cms) (ha.m.)00250> **** ERROR: Check the OUTFLOW-STORAGE table. 00251> .000 .0000E+00 | .171 .2170E+0000252> .028 .8050E-01 | .233 .2785E+0000253> .073 .1150E+00 | .331 .3780E+0000254> .134 .1715E+00 | 10.000 .0000E+0000255> 00256> ROUTING RESULTS AREA QPEAK TPEAK R.V.00257> -------------------- (ha) (cms) (hrs) (mm)00258> INFLOW >07: (202 ) 9.01 .293 1.433 11.80800259> OUTFLOW<08: (Pond3 ) 9.01 .028 3.700 11.80700260> 00261> PEAK FLOW REDUCTION [Qout/Qin](%)= 9.54100262> TIME SHIFT OF PEAK FLOW (min)= 136.0000263> MAXIMUM STORAGE USED (ha.m.)=.8030E-0100264> 00265> --------------------------------------------------------------------------------00266> 001:0010------------------------------------------------------------------------00267> *South Pond to Wetland* 00268> * 00269> ----------------------00270> | CALIB STANDHYD | Area (ha)= 6.37
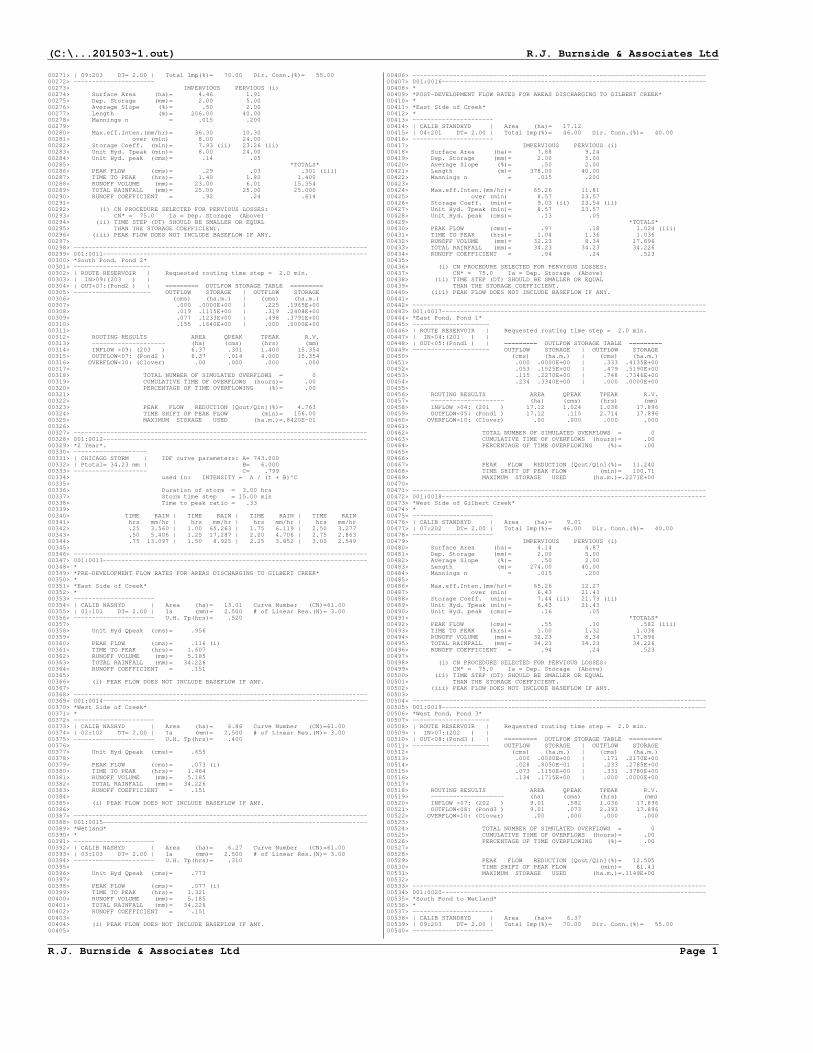
(C:\...201503~1.out) R.J. Burnside & Associates Ltd
R.J. Burnside & Associates Ltd Page 1
00271> | 09:203 DT= 2.00 | Total Imp(%)= 70.00 Dir. Conn.(%)= 55.0000272> ----------------------00273> IMPERVIOUS PERVIOUS (i)00274> Surface Area (ha)= 4.46 1.9100275> Dep. Storage (mm)= 2.00 5.0000276> Average Slope (%)= .50 2.0000277> Length (m)= 206.00 40.0000278> Mannings n = .015 .20000279> 00280> Max.eff.Inten.(mm/hr)= 36.30 10.3000281> over (min) 8.00 24.0000282> Storage Coeff. (min)= 7.93 (ii) 23.26 (ii)00283> Unit Hyd. Tpeak (min)= 8.00 24.0000284> Unit Hyd. peak (cms)= .14 .0500285> *TOTALS*00286> PEAK FLOW (cms)= .29 .03 .301 (iii)00287> TIME TO PEAK (hrs)= 1.40 1.80 1.40000288> RUNOFF VOLUME (mm)= 23.00 6.01 15.35400289> TOTAL RAINFALL (mm)= 25.00 25.00 25.00000290> RUNOFF COEFFICIENT = .92 .24 .61400291> 00292> (i) CN PROCEDURE SELECTED FOR PERVIOUS LOSSES:00293> CN* = 75.0 Ia = Dep. Storage (Above)00294> (ii) TIME STEP (DT) SHOULD BE SMALLER OR EQUAL00295> THAN THE STORAGE COEFFICIENT.00296> (iii) PEAK FLOW DOES NOT INCLUDE BASEFLOW IF ANY.00297> 00298> --------------------------------------------------------------------------------00299> 001:0011------------------------------------------------------------------------00300> *South Pond, Pond 2* 00301> ---------------------00302> | ROUTE RESERVOIR | Requested routing time step = 2.0 min.00303> | IN>09:(203 ) |00304> | OUT<07:(Pond2 ) | ========= OUTLFOW STORAGE TABLE =========00305> --------------------- OUTFLOW STORAGE | OUTFLOW STORAGE00306> (cms) (ha.m.) | (cms) (ha.m.)00307> .000 .0000E+00 | .225 .1965E+0000308> .019 .1115E+00 | .319 .2408E+0000309> .077 .1233E+00 | .498 .3791E+0000310> .155 .1640E+00 | .000 .0000E+0000311> 00312> ROUTING RESULTS AREA QPEAK TPEAK R.V.00313> -------------------- (ha) (cms) (hrs) (mm)00314> INFLOW >09: (203 ) 6.37 .301 1.400 15.35400315> OUTFLOW<07: (Pond2 ) 6.37 .014 4.000 15.35400316> OVERFLOW<10: (C1over) .00 .000 .000 .00000317> 00318> TOTAL NUMBER OF SIMULATED OVERFLOWS = 000319> CUMULATIVE TIME OF OVERFLOWS (hours)= .0000320> PERCENTAGE OF TIME OVERFLOWING (%)= .0000321> 00322> 00323> PEAK FLOW REDUCTION [Qout/Qin](%)= 4.76300324> TIME SHIFT OF PEAK FLOW (min)= 156.0000325> MAXIMUM STORAGE USED (ha.m.)=.8420E-0100326> 00327> --------------------------------------------------------------------------------00328> 001:0012------------------------------------------------------------------------00329> *2 Year*. 00330> --------------------00331> | CHICAGO STORM | IDF curve parameters: A= 743.00000332> | Ptotal= 34.23 mm | B= 6.00000333> -------------------- C= .79900334> used in: INTENSITY = A / (t + B)^C00335> 00336> Duration of storm = 3.00 hrs00337> Storm time step = 15.00 min00338> Time to peak ratio = .3300339> 00340> TIME RAIN | TIME RAIN | TIME RAIN | TIME RAIN00341> hrs mm/hr | hrs mm/hr | hrs mm/hr | hrs mm/hr00342> .25 3.560 | 1.00 65.263 | 1.75 6.119 | 2.50 3.27700343> .50 5.406 | 1.25 17.287 | 2.00 4.706 | 2.75 2.86300344> .75 13.097 | 1.50 8.925 | 2.25 3.852 | 3.00 2.54900345> 00346> --------------------------------------------------------------------------------00347> 001:0013------------------------------------------------------------------------00348> * 00349> *PRE-DEVELOPMENT FLOW RATES FOR AREAS DISCHARGING TO GILBERT CREEK* 00350> * 00351> *East Side of Creek* 00352> * 00353> ----------------------00354> | CALIB NASHYD | Area (ha)= 13.01 Curve Number (CN)=61.0000355> | 01:101 DT= 2.00 | Ia (mm)= 2.500 # of Linear Res.(N)= 3.0000356> ---------------------- U.H. Tp(hrs)= .52000357> 00358> Unit Hyd Qpeak (cms)= .95600359> 00360> PEAK FLOW (cms)= .116 (i)00361> TIME TO PEAK (hrs)= 1.60700362> RUNOFF VOLUME (mm)= 5.18500363> TOTAL RAINFALL (mm)= 34.22600364> RUNOFF COEFFICIENT = .15100365> 00366> (i) PEAK FLOW DOES NOT INCLUDE BASEFLOW IF ANY.00367> 00368> --------------------------------------------------------------------------------00369> 001:0014------------------------------------------------------------------------00370> *West Side of Creek* 00371> * 00372> ----------------------00373> | CALIB NASHYD | Area (ha)= 6.86 Curve Number (CN)=61.0000374> | 02:102 DT= 2.00 | Ia (mm)= 2.500 # of Linear Res.(N)= 3.0000375> ---------------------- U.H. Tp(hrs)= .40000376> 00377> Unit Hyd Qpeak (cms)= .65500378> 00379> PEAK FLOW (cms)= .073 (i)00380> TIME TO PEAK (hrs)= 1.46400381> RUNOFF VOLUME (mm)= 5.18500382> TOTAL RAINFALL (mm)= 34.22600383> RUNOFF COEFFICIENT = .15100384> 00385> (i) PEAK FLOW DOES NOT INCLUDE BASEFLOW IF ANY.00386> 00387> --------------------------------------------------------------------------------00388> 001:0015------------------------------------------------------------------------00389> *Wetland* 00390> * 00391> ----------------------00392> | CALIB NASHYD | Area (ha)= 6.27 Curve Number (CN)=61.0000393> | 03:103 DT= 2.00 | Ia (mm)= 2.500 # of Linear Res.(N)= 3.0000394> ---------------------- U.H. Tp(hrs)= .31000395> 00396> Unit Hyd Qpeak (cms)= .77300397> 00398> PEAK FLOW (cms)= .077 (i)00399> TIME TO PEAK (hrs)= 1.32100400> RUNOFF VOLUME (mm)= 5.18500401> TOTAL RAINFALL (mm)= 34.22600402> RUNOFF COEFFICIENT = .15100403> 00404> (i) PEAK FLOW DOES NOT INCLUDE BASEFLOW IF ANY.00405>
00406> --------------------------------------------------------------------------------00407> 001:0016------------------------------------------------------------------------00408> * 00409> *POST-DEVELOPMENT FLOW RATES FOR AREAS DISCHARGING TO GILBERT CREEK* 00410> * 00411> *East Side of Creek* 00412> * 00413> ----------------------00414> | CALIB STANDHYD | Area (ha)= 17.1200415> | 04:201 DT= 2.00 | Total Imp(%)= 46.00 Dir. Conn.(%)= 40.0000416> ----------------------00417> IMPERVIOUS PERVIOUS (i)00418> Surface Area (ha)= 7.88 9.2400419> Dep. Storage (mm)= 2.00 5.0000420> Average Slope (%)= .50 2.0000421> Length (m)= 378.00 40.0000422> Mannings n = .015 .20000423> 00424> Max.eff.Inten.(mm/hr)= 65.26 11.8100425> over (min) 8.57 23.5700426> Storage Coeff. (min)= 9.03 (ii) 23.54 (ii)00427> Unit Hyd. Tpeak (min)= 8.57 23.5700428> Unit Hyd. peak (cms)= .13 .0500429> *TOTALS*00430> PEAK FLOW (cms)= .97 .18 1.024 (iii)00431> TIME TO PEAK (hrs)= 1.04 1.36 1.03600432> RUNOFF VOLUME (mm)= 32.23 8.34 17.89600433> TOTAL RAINFALL (mm)= 34.23 34.23 34.22600434> RUNOFF COEFFICIENT = .94 .24 .52300435> 00436> (i) CN PROCEDURE SELECTED FOR PERVIOUS LOSSES:00437> CN* = 75.0 Ia = Dep. Storage (Above)00438> (ii) TIME STEP (DT) SHOULD BE SMALLER OR EQUAL00439> THAN THE STORAGE COEFFICIENT.00440> (iii) PEAK FLOW DOES NOT INCLUDE BASEFLOW IF ANY.00441> 00442> --------------------------------------------------------------------------------00443> 001:0017------------------------------------------------------------------------00444> *East Pond, Pond 1* 00445> ---------------------00446> | ROUTE RESERVOIR | Requested routing time step = 2.0 min.00447> | IN>04:(201 ) |00448> | OUT<05:(Pond1 ) | ========= OUTLFOW STORAGE TABLE =========00449> --------------------- OUTFLOW STORAGE | OUTFLOW STORAGE00450> (cms) (ha.m.) | (cms) (ha.m.)00451> .000 .0000E+00 | .333 .4135E+0000452> .053 .1525E+00 | .479 .5190E+0000453> .115 .2270E+00 | .748 .7346E+0000454> .234 .3340E+00 | .000 .0000E+0000455> 00456> ROUTING RESULTS AREA QPEAK TPEAK R.V.00457> -------------------- (ha) (cms) (hrs) (mm)00458> INFLOW >04: (201 ) 17.12 1.024 1.036 17.89600459> OUTFLOW<05: (Pond1 ) 17.12 .115 2.714 17.89600460> OVERFLOW<10: (C1over) .00 .000 .000 .00000461> 00462> TOTAL NUMBER OF SIMULATED OVERFLOWS = 000463> CUMULATIVE TIME OF OVERFLOWS (hours)= .0000464> PERCENTAGE OF TIME OVERFLOWING (%)= .0000465> 00466> 00467> PEAK FLOW REDUCTION [Qout/Qin](%)= 11.24000468> TIME SHIFT OF PEAK FLOW (min)= 100.7100469> MAXIMUM STORAGE USED (ha.m.)=.2271E+0000470> 00471> --------------------------------------------------------------------------------00472> 001:0018------------------------------------------------------------------------00473> *West Side of Gilbert Creek* 00474> * 00475> ----------------------00476> | CALIB STANDHYD | Area (ha)= 9.0100477> | 07:202 DT= 2.00 | Total Imp(%)= 46.00 Dir. Conn.(%)= 40.0000478> ----------------------00479> IMPERVIOUS PERVIOUS (i)00480> Surface Area (ha)= 4.14 4.8700481> Dep. Storage (mm)= 2.00 5.0000482> Average Slope (%)= .50 2.0000483> Length (m)= 274.00 40.0000484> Mannings n = .015 .20000485> 00486> Max.eff.Inten.(mm/hr)= 65.26 12.2700487> over (min) 6.43 21.4300488> Storage Coeff. (min)= 7.44 (ii) 21.73 (ii)00489> Unit Hyd. Tpeak (min)= 6.43 21.4300490> Unit Hyd. peak (cms)= .16 .0500491> *TOTALS*00492> PEAK FLOW (cms)= .55 .10 .582 (iii)00493> TIME TO PEAK (hrs)= 1.00 1.32 1.03600494> RUNOFF VOLUME (mm)= 32.23 8.34 17.89600495> TOTAL RAINFALL (mm)= 34.23 34.23 34.22600496> RUNOFF COEFFICIENT = .94 .24 .52300497> 00498> (i) CN PROCEDURE SELECTED FOR PERVIOUS LOSSES:00499> CN* = 75.0 Ia = Dep. Storage (Above)00500> (ii) TIME STEP (DT) SHOULD BE SMALLER OR EQUAL00501> THAN THE STORAGE COEFFICIENT.00502> (iii) PEAK FLOW DOES NOT INCLUDE BASEFLOW IF ANY.00503> 00504> --------------------------------------------------------------------------------00505> 001:0019------------------------------------------------------------------------00506> *West Pond, Pond 3* 00507> ---------------------00508> | ROUTE RESERVOIR | Requested routing time step = 2.0 min.00509> | IN>07:(202 ) |00510> | OUT<08:(Pond3 ) | ========= OUTLFOW STORAGE TABLE =========00511> --------------------- OUTFLOW STORAGE | OUTFLOW STORAGE00512> (cms) (ha.m.) | (cms) (ha.m.)00513> .000 .0000E+00 | .171 .2170E+0000514> .028 .8050E-01 | .233 .2785E+0000515> .073 .1150E+00 | .331 .3780E+0000516> .134 .1715E+00 | .000 .0000E+0000517> 00518> ROUTING RESULTS AREA QPEAK TPEAK R.V.00519> -------------------- (ha) (cms) (hrs) (mm)00520> INFLOW >07: (202 ) 9.01 .582 1.036 17.89600521> OUTFLOW<08: (Pond3 ) 9.01 .073 2.393 17.89600522> OVERFLOW<10: (C1over) .00 .000 .000 .00000523> 00524> TOTAL NUMBER OF SIMULATED OVERFLOWS = 000525> CUMULATIVE TIME OF OVERFLOWS (hours)= .0000526> PERCENTAGE OF TIME OVERFLOWING (%)= .0000527> 00528> 00529> PEAK FLOW REDUCTION [Qout/Qin](%)= 12.50500530> TIME SHIFT OF PEAK FLOW (min)= 81.4300531> MAXIMUM STORAGE USED (ha.m.)=.1149E+0000532> 00533> --------------------------------------------------------------------------------00534> 001:0020------------------------------------------------------------------------00535> *South Pond to Wetland* 00536> * 00537> ----------------------00538> | CALIB STANDHYD | Area (ha)= 6.3700539> | 09:203 DT= 2.00 | Total Imp(%)= 70.00 Dir. Conn.(%)= 55.0000540> ----------------------

(C:\...201503~1.out) R.J. Burnside & Associates Ltd
R.J. Burnside & Associates Ltd Page 2
00541> IMPERVIOUS PERVIOUS (i)00542> Surface Area (ha)= 4.46 1.9100543> Dep. Storage (mm)= 2.00 5.0000544> Average Slope (%)= .50 2.0000545> Length (m)= 206.00 40.0000546> Mannings n = .015 .20000547> 00548> Max.eff.Inten.(mm/hr)= 65.26 25.0800549> over (min) 6.43 17.1400550> Storage Coeff. (min)= 6.27 (ii) 17.01 (ii)00551> Unit Hyd. Tpeak (min)= 6.43 17.1400552> Unit Hyd. peak (cms)= .18 .0700553> *TOTALS*00554> PEAK FLOW (cms)= .56 .08 .598 (iii)00555> TIME TO PEAK (hrs)= 1.00 1.25 1.00000556> RUNOFF VOLUME (mm)= 32.23 10.93 22.64200557> TOTAL RAINFALL (mm)= 34.23 34.23 34.22600558> RUNOFF COEFFICIENT = .94 .32 .66200559> 00560> (i) CN PROCEDURE SELECTED FOR PERVIOUS LOSSES:00561> CN* = 75.0 Ia = Dep. Storage (Above)00562> (ii) TIME STEP (DT) SHOULD BE SMALLER OR EQUAL00563> THAN THE STORAGE COEFFICIENT.00564> (iii) PEAK FLOW DOES NOT INCLUDE BASEFLOW IF ANY.00565> 00566> --------------------------------------------------------------------------------00567> 001:0021------------------------------------------------------------------------00568> *South Pond, Pond 2* 00569> ---------------------00570> | ROUTE RESERVOIR | Requested routing time step = 2.0 min.00571> | IN>09:(203 ) |00572> | OUT<07:(Pond2 ) | ========= OUTLFOW STORAGE TABLE =========00573> --------------------- OUTFLOW STORAGE | OUTFLOW STORAGE00574> (cms) (ha.m.) | (cms) (ha.m.)00575> .000 .0000E+00 | .225 .1965E+0000576> .019 .1115E+00 | .319 .2408E+0000577> .077 .1233E+00 | .498 .3791E+0000578> .155 .1640E+00 | .000 .0000E+0000579> 00580> ROUTING RESULTS AREA QPEAK TPEAK R.V.00581> -------------------- (ha) (cms) (hrs) (mm)00582> INFLOW >09: (203 ) 6.37 .598 1.000 22.64200583> OUTFLOW<07: (Pond2 ) 6.37 .051 2.536 22.64100584> OVERFLOW<10: (C1over) .00 .000 .000 .00000585> 00586> TOTAL NUMBER OF SIMULATED OVERFLOWS = 000587> CUMULATIVE TIME OF OVERFLOWS (hours)= .0000588> PERCENTAGE OF TIME OVERFLOWING (%)= .0000589> 00590> 00591> PEAK FLOW REDUCTION [Qout/Qin](%)= 8.53000592> TIME SHIFT OF PEAK FLOW (min)= 92.1400593> MAXIMUM STORAGE USED (ha.m.)=.1180E+0000594> 00595> --------------------------------------------------------------------------------00596> 001:0022------------------------------------------------------------------------00597> *5 Year*. 00598> --------------------00599> | CHICAGO STORM | IDF curve parameters: A=1593.00000600> | Ptotal= 47.20 mm | B= 11.00000601> -------------------- C= .87900602> used in: INTENSITY = A / (t + B)^C00603> 00604> Duration of storm = 3.00 hrs00605> Storm time step = 15.00 min00606> Time to peak ratio = .3300607> 00608> TIME RAIN | TIME RAIN | TIME RAIN | TIME RAIN00609> hrs mm/hr | hrs mm/hr | hrs mm/hr | hrs mm/hr00610> .25 4.040 | 1.00 90.907 | 1.75 7.975 | 2.50 3.63400611> .50 6.847 | 1.25 26.993 | 2.00 5.739 | 2.75 3.06500612> .75 19.816 | 1.50 12.669 | 2.25 4.457 | 3.00 2.65000613> 00614> --------------------------------------------------------------------------------00615> 001:0023------------------------------------------------------------------------00616> * 00617> *PRE-DEVELOPMENT FLOW RATES FOR AREAS DISCHARGING TO GILBERT CREEK* 00618> * 00619> *East Side of Creek* 00620> * 00621> ----------------------00622> | CALIB NASHYD | Area (ha)= 13.01 Curve Number (CN)=61.0000623> | 01:101 DT= 2.00 | Ia (mm)= 2.500 # of Linear Res.(N)= 3.0000624> ---------------------- U.H. Tp(hrs)= .52000625> 00626> Unit Hyd Qpeak (cms)= .95600627> 00628> PEAK FLOW (cms)= .234 (i)00629> TIME TO PEAK (hrs)= 1.60700630> RUNOFF VOLUME (mm)= 9.64800631> TOTAL RAINFALL (mm)= 47.19800632> RUNOFF COEFFICIENT = .20400633> 00634> (i) PEAK FLOW DOES NOT INCLUDE BASEFLOW IF ANY.00635> 00636> --------------------------------------------------------------------------------00637> 001:0024------------------------------------------------------------------------00638> *West Side of Creek* 00639> * 00640> ----------------------00641> | CALIB NASHYD | Area (ha)= 6.86 Curve Number (CN)=61.0000642> | 02:102 DT= 2.00 | Ia (mm)= 2.500 # of Linear Res.(N)= 3.0000643> ---------------------- U.H. Tp(hrs)= .40000644> 00645> Unit Hyd Qpeak (cms)= .65500646> 00647> PEAK FLOW (cms)= .146 (i)00648> TIME TO PEAK (hrs)= 1.46400649> RUNOFF VOLUME (mm)= 9.64800650> TOTAL RAINFALL (mm)= 47.19800651> RUNOFF COEFFICIENT = .20400652> 00653> (i) PEAK FLOW DOES NOT INCLUDE BASEFLOW IF ANY.00654> 00655> --------------------------------------------------------------------------------00656> 001:0025------------------------------------------------------------------------00657> *Wetland* 00658> * 00659> ----------------------00660> | CALIB NASHYD | Area (ha)= 6.27 Curve Number (CN)=61.0000661> | 03:103 DT= 2.00 | Ia (mm)= 2.500 # of Linear Res.(N)= 3.0000662> ---------------------- U.H. Tp(hrs)= .31000663> 00664> Unit Hyd Qpeak (cms)= .77300665> 00666> PEAK FLOW (cms)= .155 (i)00667> TIME TO PEAK (hrs)= 1.32100668> RUNOFF VOLUME (mm)= 9.64800669> TOTAL RAINFALL (mm)= 47.19800670> RUNOFF COEFFICIENT = .20400671> 00672> (i) PEAK FLOW DOES NOT INCLUDE BASEFLOW IF ANY.00673> 00674> --------------------------------------------------------------------------------00675> 001:0026------------------------------------------------------------------------
00676> * 00677> *POST-DEVELOPMENT FLOW RATES FOR AREAS DISCHARGING TO GILBERT CREEK* 00678> * 00679> *East Side of Creek* 00680> * 00681> ----------------------00682> | CALIB STANDHYD | Area (ha)= 17.1200683> | 04:201 DT= 2.00 | Total Imp(%)= 46.00 Dir. Conn.(%)= 40.0000684> ----------------------00685> IMPERVIOUS PERVIOUS (i)00686> Surface Area (ha)= 7.88 9.2400687> Dep. Storage (mm)= 2.00 5.0000688> Average Slope (%)= .50 2.0000689> Length (m)= 378.00 40.0000690> Mannings n = .015 .20000691> 00692> Max.eff.Inten.(mm/hr)= 90.91 25.5700693> over (min) 8.57 19.2900694> Storage Coeff. (min)= 7.91 (ii) 18.56 (ii)00695> Unit Hyd. Tpeak (min)= 8.57 19.2900696> Unit Hyd. peak (cms)= .14 .0600697> *TOTALS*00698> PEAK FLOW (cms)= 1.41 .42 1.611 (iii)00699> TIME TO PEAK (hrs)= 1.04 1.29 1.07100700> RUNOFF VOLUME (mm)= 45.20 15.33 27.28000701> TOTAL RAINFALL (mm)= 47.20 47.20 47.19800702> RUNOFF COEFFICIENT = .96 .32 .57800703> 00704> (i) CN PROCEDURE SELECTED FOR PERVIOUS LOSSES:00705> CN* = 75.0 Ia = Dep. Storage (Above)00706> (ii) TIME STEP (DT) SHOULD BE SMALLER OR EQUAL00707> THAN THE STORAGE COEFFICIENT.00708> (iii) PEAK FLOW DOES NOT INCLUDE BASEFLOW IF ANY.00709> 00710> --------------------------------------------------------------------------------00711> 001:0027------------------------------------------------------------------------00712> *East Pond, Pond 1* 00713> ---------------------00714> | ROUTE RESERVOIR | Requested routing time step = 2.0 min.00715> | IN>04:(201 ) |00716> | OUT<05:(Pond1 ) | ========= OUTLFOW STORAGE TABLE =========00717> --------------------- OUTFLOW STORAGE | OUTFLOW STORAGE00718> (cms) (ha.m.) | (cms) (ha.m.)00719> .000 .0000E+00 | .333 .4135E+0000720> .053 .1525E+00 | .479 .5190E+0000721> .115 .2270E+00 | .748 .7346E+0000722> .234 .3340E+00 | .000 .0000E+0000723> 00724> ROUTING RESULTS AREA QPEAK TPEAK R.V.00725> -------------------- (ha) (cms) (hrs) (mm)00726> INFLOW >04: (201 ) 17.12 1.611 1.071 27.28000727> OUTFLOW<05: (Pond1 ) 17.12 .233 2.179 27.27900728> OVERFLOW<10: (C1over) .00 .000 .000 .00000729> 00730> TOTAL NUMBER OF SIMULATED OVERFLOWS = 000731> CUMULATIVE TIME OF OVERFLOWS (hours)= .0000732> PERCENTAGE OF TIME OVERFLOWING (%)= .0000733> 00734> 00735> PEAK FLOW REDUCTION [Qout/Qin](%)= 14.45400736> TIME SHIFT OF PEAK FLOW (min)= 66.4300737> MAXIMUM STORAGE USED (ha.m.)=.3330E+0000738> 00739> --------------------------------------------------------------------------------00740> 001:0028------------------------------------------------------------------------00741> *West Side of Gilbert Creek* 00742> * 00743> ----------------------00744> | CALIB STANDHYD | Area (ha)= 9.0100745> | 07:202 DT= 2.00 | Total Imp(%)= 46.00 Dir. Conn.(%)= 40.0000746> ----------------------00747> IMPERVIOUS PERVIOUS (i)00748> Surface Area (ha)= 4.14 4.8700749> Dep. Storage (mm)= 2.00 5.0000750> Average Slope (%)= .50 2.0000751> Length (m)= 274.00 40.0000752> Mannings n = .015 .20000753> 00754> Max.eff.Inten.(mm/hr)= 90.91 27.0100755> over (min) 6.43 17.1400756> Storage Coeff. (min)= 6.52 (ii) 16.94 (ii)00757> Unit Hyd. Tpeak (min)= 6.43 17.1400758> Unit Hyd. peak (cms)= .17 .0700759> *TOTALS*00760> PEAK FLOW (cms)= .80 .23 .911 (iii)00761> TIME TO PEAK (hrs)= 1.00 1.25 1.03600762> RUNOFF VOLUME (mm)= 45.20 15.33 27.28000763> TOTAL RAINFALL (mm)= 47.20 47.20 47.19800764> RUNOFF COEFFICIENT = .96 .32 .57800765> 00766> (i) CN PROCEDURE SELECTED FOR PERVIOUS LOSSES:00767> CN* = 75.0 Ia = Dep. Storage (Above)00768> (ii) TIME STEP (DT) SHOULD BE SMALLER OR EQUAL00769> THAN THE STORAGE COEFFICIENT.00770> (iii) PEAK FLOW DOES NOT INCLUDE BASEFLOW IF ANY.00771> 00772> --------------------------------------------------------------------------------00773> 001:0029------------------------------------------------------------------------00774> *West Pond, Pond 3* 00775> ---------------------00776> | ROUTE RESERVOIR | Requested routing time step = 2.0 min.00777> | IN>07:(202 ) |00778> | OUT<08:(Pond3 ) | ========= OUTLFOW STORAGE TABLE =========00779> --------------------- OUTFLOW STORAGE | OUTFLOW STORAGE00780> (cms) (ha.m.) | (cms) (ha.m.)00781> .000 .0000E+00 | .171 .2170E+0000782> .028 .8050E-01 | .233 .2785E+0000783> .073 .1150E+00 | .331 .3780E+0000784> .134 .1715E+00 | .000 .0000E+0000785> 00786> ROUTING RESULTS AREA QPEAK TPEAK R.V.00787> -------------------- (ha) (cms) (hrs) (mm)00788> INFLOW >07: (202 ) 9.01 .911 1.036 27.28000789> OUTFLOW<08: (Pond3 ) 9.01 .133 2.071 27.27900790> OVERFLOW<10: (C1over) .00 .000 .000 .00000791> 00792> TOTAL NUMBER OF SIMULATED OVERFLOWS = 000793> CUMULATIVE TIME OF OVERFLOWS (hours)= .0000794> PERCENTAGE OF TIME OVERFLOWING (%)= .0000795> 00796> 00797> PEAK FLOW REDUCTION [Qout/Qin](%)= 14.64800798> TIME SHIFT OF PEAK FLOW (min)= 62.1400799> MAXIMUM STORAGE USED (ha.m.)=.1710E+0000800> 00801> --------------------------------------------------------------------------------00802> 001:0030------------------------------------------------------------------------00803> *South Pond to Wetland* 00804> * 00805> ----------------------00806> | CALIB STANDHYD | Area (ha)= 6.3700807> | 09:203 DT= 2.00 | Total Imp(%)= 70.00 Dir. Conn.(%)= 55.0000808> ----------------------00809> IMPERVIOUS PERVIOUS (i)00810> Surface Area (ha)= 4.46 1.91
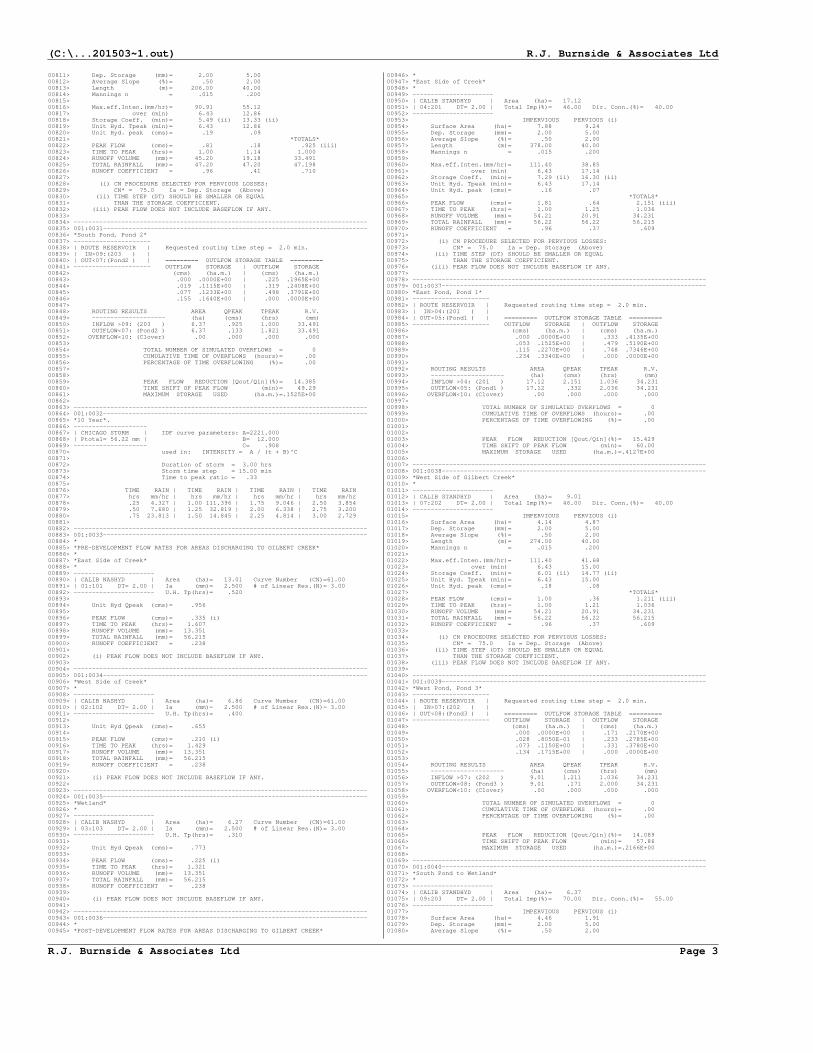
(C:\...201503~1.out) R.J. Burnside & Associates Ltd
R.J. Burnside & Associates Ltd Page 3
00811> Dep. Storage (mm)= 2.00 5.0000812> Average Slope (%)= .50 2.0000813> Length (m)= 206.00 40.0000814> Mannings n = .015 .20000815> 00816> Max.eff.Inten.(mm/hr)= 90.91 55.1200817> over (min) 6.43 12.8600818> Storage Coeff. (min)= 5.49 (ii) 13.33 (ii)00819> Unit Hyd. Tpeak (min)= 6.43 12.8600820> Unit Hyd. peak (cms)= .19 .0900821> *TOTALS*00822> PEAK FLOW (cms)= .81 .18 .925 (iii)00823> TIME TO PEAK (hrs)= 1.00 1.14 1.00000824> RUNOFF VOLUME (mm)= 45.20 19.18 33.49100825> TOTAL RAINFALL (mm)= 47.20 47.20 47.19800826> RUNOFF COEFFICIENT = .96 .41 .71000827> 00828> (i) CN PROCEDURE SELECTED FOR PERVIOUS LOSSES:00829> CN* = 75.0 Ia = Dep. Storage (Above)00830> (ii) TIME STEP (DT) SHOULD BE SMALLER OR EQUAL00831> THAN THE STORAGE COEFFICIENT.00832> (iii) PEAK FLOW DOES NOT INCLUDE BASEFLOW IF ANY.00833> 00834> --------------------------------------------------------------------------------00835> 001:0031------------------------------------------------------------------------00836> *South Pond, Pond 2* 00837> ---------------------00838> | ROUTE RESERVOIR | Requested routing time step = 2.0 min.00839> | IN>09:(203 ) |00840> | OUT<07:(Pond2 ) | ========= OUTLFOW STORAGE TABLE =========00841> --------------------- OUTFLOW STORAGE | OUTFLOW STORAGE00842> (cms) (ha.m.) | (cms) (ha.m.)00843> .000 .0000E+00 | .225 .1965E+0000844> .019 .1115E+00 | .319 .2408E+0000845> .077 .1233E+00 | .498 .3791E+0000846> .155 .1640E+00 | .000 .0000E+0000847> 00848> ROUTING RESULTS AREA QPEAK TPEAK R.V.00849> -------------------- (ha) (cms) (hrs) (mm)00850> INFLOW >09: (203 ) 6.37 .925 1.000 33.49100851> OUTFLOW<07: (Pond2 ) 6.37 .133 1.821 33.49100852> OVERFLOW<10: (C1over) .00 .000 .000 .00000853> 00854> TOTAL NUMBER OF SIMULATED OVERFLOWS = 000855> CUMULATIVE TIME OF OVERFLOWS (hours)= .0000856> PERCENTAGE OF TIME OVERFLOWING (%)= .0000857> 00858> 00859> PEAK FLOW REDUCTION [Qout/Qin](%)= 14.38500860> TIME SHIFT OF PEAK FLOW (min)= 49.2900861> MAXIMUM STORAGE USED (ha.m.)=.1525E+0000862> 00863> --------------------------------------------------------------------------------00864> 001:0032------------------------------------------------------------------------00865> *10 Year*. 00866> --------------------00867> | CHICAGO STORM | IDF curve parameters: A=2221.00000868> | Ptotal= 56.22 mm | B= 12.00000869> -------------------- C= .90800870> used in: INTENSITY = A / (t + B)^C00871> 00872> Duration of storm = 3.00 hrs00873> Storm time step = 15.00 min00874> Time to peak ratio = .3300875> 00876> TIME RAIN | TIME RAIN | TIME RAIN | TIME RAIN00877> hrs mm/hr | hrs mm/hr | hrs mm/hr | hrs mm/hr00878> .25 4.327 | 1.00 111.396 | 1.75 9.046 | 2.50 3.85400879> .50 7.680 | 1.25 32.819 | 2.00 6.338 | 2.75 3.20000880> .75 23.813 | 1.50 14.845 | 2.25 4.814 | 3.00 2.72900881> 00882> --------------------------------------------------------------------------------00883> 001:0033------------------------------------------------------------------------00884> * 00885> *PRE-DEVELOPMENT FLOW RATES FOR AREAS DISCHARGING TO GILBERT CREEK* 00886> * 00887> *East Side of Creek* 00888> * 00889> ----------------------00890> | CALIB NASHYD | Area (ha)= 13.01 Curve Number (CN)=61.0000891> | 01:101 DT= 2.00 | Ia (mm)= 2.500 # of Linear Res.(N)= 3.0000892> ---------------------- U.H. Tp(hrs)= .52000893> 00894> Unit Hyd Qpeak (cms)= .95600895> 00896> PEAK FLOW (cms)= .335 (i)00897> TIME TO PEAK (hrs)= 1.60700898> RUNOFF VOLUME (mm)= 13.35100899> TOTAL RAINFALL (mm)= 56.21500900> RUNOFF COEFFICIENT = .23800901> 00902> (i) PEAK FLOW DOES NOT INCLUDE BASEFLOW IF ANY.00903> 00904> --------------------------------------------------------------------------------00905> 001:0034------------------------------------------------------------------------00906> *West Side of Creek* 00907> * 00908> ----------------------00909> | CALIB NASHYD | Area (ha)= 6.86 Curve Number (CN)=61.0000910> | 02:102 DT= 2.00 | Ia (mm)= 2.500 # of Linear Res.(N)= 3.0000911> ---------------------- U.H. Tp(hrs)= .40000912> 00913> Unit Hyd Qpeak (cms)= .65500914> 00915> PEAK FLOW (cms)= .210 (i)00916> TIME TO PEAK (hrs)= 1.42900917> RUNOFF VOLUME (mm)= 13.35100918> TOTAL RAINFALL (mm)= 56.21500919> RUNOFF COEFFICIENT = .23800920> 00921> (i) PEAK FLOW DOES NOT INCLUDE BASEFLOW IF ANY.00922> 00923> --------------------------------------------------------------------------------00924> 001:0035------------------------------------------------------------------------00925> *Wetland* 00926> * 00927> ----------------------00928> | CALIB NASHYD | Area (ha)= 6.27 Curve Number (CN)=61.0000929> | 03:103 DT= 2.00 | Ia (mm)= 2.500 # of Linear Res.(N)= 3.0000930> ---------------------- U.H. Tp(hrs)= .31000931> 00932> Unit Hyd Qpeak (cms)= .77300933> 00934> PEAK FLOW (cms)= .225 (i)00935> TIME TO PEAK (hrs)= 1.32100936> RUNOFF VOLUME (mm)= 13.35100937> TOTAL RAINFALL (mm)= 56.21500938> RUNOFF COEFFICIENT = .23800939> 00940> (i) PEAK FLOW DOES NOT INCLUDE BASEFLOW IF ANY.00941> 00942> --------------------------------------------------------------------------------00943> 001:0036------------------------------------------------------------------------00944> * 00945> *POST-DEVELOPMENT FLOW RATES FOR AREAS DISCHARGING TO GILBERT CREEK*
00946> * 00947> *East Side of Creek* 00948> * 00949> ----------------------00950> | CALIB STANDHYD | Area (ha)= 17.1200951> | 04:201 DT= 2.00 | Total Imp(%)= 46.00 Dir. Conn.(%)= 40.0000952> ----------------------00953> IMPERVIOUS PERVIOUS (i)00954> Surface Area (ha)= 7.88 9.2400955> Dep. Storage (mm)= 2.00 5.0000956> Average Slope (%)= .50 2.0000957> Length (m)= 378.00 40.0000958> Mannings n = .015 .20000959> 00960> Max.eff.Inten.(mm/hr)= 111.40 38.8500961> over (min) 6.43 17.1400962> Storage Coeff. (min)= 7.29 (ii) 16.30 (ii)00963> Unit Hyd. Tpeak (min)= 6.43 17.1400964> Unit Hyd. peak (cms)= .16 .0700965> *TOTALS*00966> PEAK FLOW (cms)= 1.81 .64 2.151 (iii)00967> TIME TO PEAK (hrs)= 1.00 1.25 1.03600968> RUNOFF VOLUME (mm)= 54.21 20.91 34.23100969> TOTAL RAINFALL (mm)= 56.22 56.22 56.21500970> RUNOFF COEFFICIENT = .96 .37 .60900971> 00972> (i) CN PROCEDURE SELECTED FOR PERVIOUS LOSSES:00973> CN* = 75.0 Ia = Dep. Storage (Above)00974> (ii) TIME STEP (DT) SHOULD BE SMALLER OR EQUAL00975> THAN THE STORAGE COEFFICIENT.00976> (iii) PEAK FLOW DOES NOT INCLUDE BASEFLOW IF ANY.00977> 00978> --------------------------------------------------------------------------------00979> 001:0037------------------------------------------------------------------------00980> *East Pond, Pond 1* 00981> ---------------------00982> | ROUTE RESERVOIR | Requested routing time step = 2.0 min.00983> | IN>04:(201 ) |00984> | OUT<05:(Pond1 ) | ========= OUTLFOW STORAGE TABLE =========00985> --------------------- OUTFLOW STORAGE | OUTFLOW STORAGE00986> (cms) (ha.m.) | (cms) (ha.m.)00987> .000 .0000E+00 | .333 .4135E+0000988> .053 .1525E+00 | .479 .5190E+0000989> .115 .2270E+00 | .748 .7346E+0000990> .234 .3340E+00 | .000 .0000E+0000991> 00992> ROUTING RESULTS AREA QPEAK TPEAK R.V.00993> -------------------- (ha) (cms) (hrs) (mm)00994> INFLOW >04: (201 ) 17.12 2.151 1.036 34.23100995> OUTFLOW<05: (Pond1 ) 17.12 .332 2.036 34.23100996> OVERFLOW<10: (C1over) .00 .000 .000 .00000997> 00998> TOTAL NUMBER OF SIMULATED OVERFLOWS = 000999> CUMULATIVE TIME OF OVERFLOWS (hours)= .0001000> PERCENTAGE OF TIME OVERFLOWING (%)= .0001001> 01002> 01003> PEAK FLOW REDUCTION [Qout/Qin](%)= 15.42901004> TIME SHIFT OF PEAK FLOW (min)= 60.0001005> MAXIMUM STORAGE USED (ha.m.)=.4127E+0001006> 01007> --------------------------------------------------------------------------------01008> 001:0038------------------------------------------------------------------------01009> *West Side of Gilbert Creek* 01010> * 01011> ----------------------01012> | CALIB STANDHYD | Area (ha)= 9.0101013> | 07:202 DT= 2.00 | Total Imp(%)= 46.00 Dir. Conn.(%)= 40.0001014> ----------------------01015> IMPERVIOUS PERVIOUS (i)01016> Surface Area (ha)= 4.14 4.8701017> Dep. Storage (mm)= 2.00 5.0001018> Average Slope (%)= .50 2.0001019> Length (m)= 274.00 40.0001020> Mannings n = .015 .20001021> 01022> Max.eff.Inten.(mm/hr)= 111.40 41.6801023> over (min) 6.43 15.0001024> Storage Coeff. (min)= 6.01 (ii) 14.77 (ii)01025> Unit Hyd. Tpeak (min)= 6.43 15.0001026> Unit Hyd. peak (cms)= .18 .0801027> *TOTALS*01028> PEAK FLOW (cms)= 1.00 .36 1.211 (iii)01029> TIME TO PEAK (hrs)= 1.00 1.21 1.03601030> RUNOFF VOLUME (mm)= 54.21 20.91 34.23101031> TOTAL RAINFALL (mm)= 56.22 56.22 56.21501032> RUNOFF COEFFICIENT = .96 .37 .60901033> 01034> (i) CN PROCEDURE SELECTED FOR PERVIOUS LOSSES:01035> CN* = 75.0 Ia = Dep. Storage (Above)01036> (ii) TIME STEP (DT) SHOULD BE SMALLER OR EQUAL01037> THAN THE STORAGE COEFFICIENT.01038> (iii) PEAK FLOW DOES NOT INCLUDE BASEFLOW IF ANY.01039> 01040> --------------------------------------------------------------------------------01041> 001:0039------------------------------------------------------------------------01042> *West Pond, Pond 3* 01043> ---------------------01044> | ROUTE RESERVOIR | Requested routing time step = 2.0 min.01045> | IN>07:(202 ) |01046> | OUT<08:(Pond3 ) | ========= OUTLFOW STORAGE TABLE =========01047> --------------------- OUTFLOW STORAGE | OUTFLOW STORAGE01048> (cms) (ha.m.) | (cms) (ha.m.)01049> .000 .0000E+00 | .171 .2170E+0001050> .028 .8050E-01 | .233 .2785E+0001051> .073 .1150E+00 | .331 .3780E+0001052> .134 .1715E+00 | .000 .0000E+0001053> 01054> ROUTING RESULTS AREA QPEAK TPEAK R.V.01055> -------------------- (ha) (cms) (hrs) (mm)01056> INFLOW >07: (202 ) 9.01 1.211 1.036 34.23101057> OUTFLOW<08: (Pond3 ) 9.01 .171 2.000 34.23101058> OVERFLOW<10: (C1over) .00 .000 .000 .00001059> 01060> TOTAL NUMBER OF SIMULATED OVERFLOWS = 001061> CUMULATIVE TIME OF OVERFLOWS (hours)= .0001062> PERCENTAGE OF TIME OVERFLOWING (%)= .0001063> 01064> 01065> PEAK FLOW REDUCTION [Qout/Qin](%)= 14.08901066> TIME SHIFT OF PEAK FLOW (min)= 57.8601067> MAXIMUM STORAGE USED (ha.m.)=.2166E+0001068> 01069> --------------------------------------------------------------------------------01070> 001:0040------------------------------------------------------------------------01071> *South Pond to Wetland* 01072> * 01073> ----------------------01074> | CALIB STANDHYD | Area (ha)= 6.3701075> | 09:203 DT= 2.00 | Total Imp(%)= 70.00 Dir. Conn.(%)= 55.0001076> ----------------------01077> IMPERVIOUS PERVIOUS (i)01078> Surface Area (ha)= 4.46 1.9101079> Dep. Storage (mm)= 2.00 5.0001080> Average Slope (%)= .50 2.00

(C:\...201503~1.out) R.J. Burnside & Associates Ltd
R.J. Burnside & Associates Ltd Page 4
01081> Length (m)= 206.00 40.0001082> Mannings n = .015 .20001083> 01084> Max.eff.Inten.(mm/hr)= 111.40 77.4501085> over (min) 4.29 12.8601086> Storage Coeff. (min)= 5.06 (ii) 11.90 (ii)01087> Unit Hyd. Tpeak (min)= 4.29 12.8601088> Unit Hyd. peak (cms)= .23 .0901089> *TOTALS*01090> PEAK FLOW (cms)= 1.03 .27 1.204 (iii)01091> TIME TO PEAK (hrs)= 1.00 1.14 1.00001092> RUNOFF VOLUME (mm)= 54.21 25.58 41.32901093> TOTAL RAINFALL (mm)= 56.22 56.22 56.21501094> RUNOFF COEFFICIENT = .96 .46 .73501095> 01096> (i) CN PROCEDURE SELECTED FOR PERVIOUS LOSSES:01097> CN* = 75.0 Ia = Dep. Storage (Above)01098> (ii) TIME STEP (DT) SHOULD BE SMALLER OR EQUAL01099> THAN THE STORAGE COEFFICIENT.01100> (iii) PEAK FLOW DOES NOT INCLUDE BASEFLOW IF ANY.01101> 01102> --------------------------------------------------------------------------------01103> 001:0041------------------------------------------------------------------------01104> *South Pond, Pond 2* 01105> ---------------------01106> | ROUTE RESERVOIR | Requested routing time step = 2.0 min.01107> | IN>09:(203 ) |01108> | OUT<07:(Pond2 ) | ========= OUTLFOW STORAGE TABLE =========01109> --------------------- OUTFLOW STORAGE | OUTFLOW STORAGE01110> (cms) (ha.m.) | (cms) (ha.m.)01111> .000 .0000E+00 | .225 .1965E+0001112> .019 .1115E+00 | .319 .2408E+0001113> .077 .1233E+00 | .498 .3791E+0001114> .155 .1640E+00 | .000 .0000E+0001115> 01116> ROUTING RESULTS AREA QPEAK TPEAK R.V.01117> -------------------- (ha) (cms) (hrs) (mm)01118> INFLOW >09: (203 ) 6.37 1.204 1.000 41.32901119> OUTFLOW<07: (Pond2 ) 6.37 .195 1.679 41.32801120> OVERFLOW<10: (C1over) .00 .000 .000 .00001121> 01122> TOTAL NUMBER OF SIMULATED OVERFLOWS = 001123> CUMULATIVE TIME OF OVERFLOWS (hours)= .0001124> PERCENTAGE OF TIME OVERFLOWING (%)= .0001125> 01126> 01127> PEAK FLOW REDUCTION [Qout/Qin](%)= 16.17401128> TIME SHIFT OF PEAK FLOW (min)= 40.7101129> MAXIMUM STORAGE USED (ha.m.)=.1824E+0001130> 01131> --------------------------------------------------------------------------------01132> 001:0042------------------------------------------------------------------------01133> *25 Year*. 01134> --------------------01135> | CHICAGO STORM | IDF curve parameters: A=3158.00001136> | Ptotal= 68.17 mm | B= 15.00001137> -------------------- C= .93601138> used in: INTENSITY = A / (t + B)^C01139> 01140> Duration of storm = 3.00 hrs01141> Storm time step = 15.00 min01142> Time to peak ratio = .3301143> 01144> TIME RAIN | TIME RAIN | TIME RAIN | TIME RAIN01145> hrs mm/hr | hrs mm/hr | hrs mm/hr | hrs mm/hr01146> .25 5.055 | 1.00 131.089 | 1.75 11.242 | 2.50 4.44601147> .50 9.440 | 1.25 42.051 | 2.00 7.669 | 2.75 3.61701148> .75 30.458 | 1.50 18.914 | 2.25 5.682 | 3.00 3.02801149> 01150> --------------------------------------------------------------------------------01151> 001:0043------------------------------------------------------------------------01152> * 01153> *PRE-DEVELOPMENT FLOW RATES FOR AREAS DISCHARGING TO GILBERT CREEK* 01154> * 01155> *East Side of Creek* 01156> * 01157> ----------------------01158> | CALIB NASHYD | Area (ha)= 13.01 Curve Number (CN)=61.0001159> | 01:101 DT= 2.00 | Ia (mm)= 2.500 # of Linear Res.(N)= 3.0001160> ---------------------- U.H. Tp(hrs)= .52001161> 01162> Unit Hyd Qpeak (cms)= .95601163> 01164> PEAK FLOW (cms)= .479 (i)01165> TIME TO PEAK (hrs)= 1.60701166> RUNOFF VOLUME (mm)= 18.91101167> TOTAL RAINFALL (mm)= 68.17301168> RUNOFF COEFFICIENT = .27701169> 01170> (i) PEAK FLOW DOES NOT INCLUDE BASEFLOW IF ANY.01171> 01172> --------------------------------------------------------------------------------01173> 001:0044------------------------------------------------------------------------01174> *West Side of Creek* 01175> * 01176> ----------------------01177> | CALIB NASHYD | Area (ha)= 6.86 Curve Number (CN)=61.0001178> | 02:102 DT= 2.00 | Ia (mm)= 2.500 # of Linear Res.(N)= 3.0001179> ---------------------- U.H. Tp(hrs)= .40001180> 01181> Unit Hyd Qpeak (cms)= .65501182> 01183> PEAK FLOW (cms)= .299 (i)01184> TIME TO PEAK (hrs)= 1.46401185> RUNOFF VOLUME (mm)= 18.91101186> TOTAL RAINFALL (mm)= 68.17301187> RUNOFF COEFFICIENT = .27701188> 01189> (i) PEAK FLOW DOES NOT INCLUDE BASEFLOW IF ANY.01190> 01191> --------------------------------------------------------------------------------01192> 001:0045------------------------------------------------------------------------01193> *Wetland* 01194> * 01195> ----------------------01196> | CALIB NASHYD | Area (ha)= 6.27 Curve Number (CN)=61.0001197> | 03:103 DT= 2.00 | Ia (mm)= 2.500 # of Linear Res.(N)= 3.0001198> ---------------------- U.H. Tp(hrs)= .31001199> 01200> Unit Hyd Qpeak (cms)= .77301201> 01202> PEAK FLOW (cms)= .319 (i)01203> TIME TO PEAK (hrs)= 1.32101204> RUNOFF VOLUME (mm)= 18.91101205> TOTAL RAINFALL (mm)= 68.17301206> RUNOFF COEFFICIENT = .27701207> 01208> (i) PEAK FLOW DOES NOT INCLUDE BASEFLOW IF ANY.01209> 01210> --------------------------------------------------------------------------------01211> 001:0046------------------------------------------------------------------------01212> * 01213> *POST-DEVELOPMENT FLOW RATES FOR AREAS DISCHARGING TO GILBERT CREEK* 01214> * 01215> *East Side of Creek*
01216> * 01217> ----------------------01218> | CALIB STANDHYD | Area (ha)= 17.1201219> | 04:201 DT= 2.00 | Total Imp(%)= 46.00 Dir. Conn.(%)= 40.0001220> ----------------------01221> IMPERVIOUS PERVIOUS (i)01222> Surface Area (ha)= 7.88 9.2401223> Dep. Storage (mm)= 2.00 5.0001224> Average Slope (%)= .50 2.0001225> Length (m)= 378.00 40.0001226> Mannings n = .015 .20001227> 01228> Max.eff.Inten.(mm/hr)= 131.09 57.5301229> over (min) 6.43 15.0001230> Storage Coeff. (min)= 6.83 (ii) 14.53 (ii)01231> Unit Hyd. Tpeak (min)= 6.43 15.0001232> Unit Hyd. peak (cms)= .17 .0801233> *TOTALS*01234> PEAK FLOW (cms)= 2.17 .95 2.787 (iii)01235> TIME TO PEAK (hrs)= 1.00 1.21 1.03601236> RUNOFF VOLUME (mm)= 66.17 28.98 43.86001237> TOTAL RAINFALL (mm)= 68.17 68.17 68.17301238> RUNOFF COEFFICIENT = .97 .43 .64301239> 01240> (i) CN PROCEDURE SELECTED FOR PERVIOUS LOSSES:01241> CN* = 75.0 Ia = Dep. Storage (Above)01242> (ii) TIME STEP (DT) SHOULD BE SMALLER OR EQUAL01243> THAN THE STORAGE COEFFICIENT.01244> (iii) PEAK FLOW DOES NOT INCLUDE BASEFLOW IF ANY.01245> 01246> --------------------------------------------------------------------------------01247> 001:0047------------------------------------------------------------------------01248> *East Pond, Pond 1* 01249> ---------------------01250> | ROUTE RESERVOIR | Requested routing time step = 2.0 min.01251> | IN>04:(201 ) |01252> | OUT<05:(Pond1 ) | ========= OUTLFOW STORAGE TABLE =========01253> --------------------- OUTFLOW STORAGE | OUTFLOW STORAGE01254> (cms) (ha.m.) | (cms) (ha.m.)01255> .000 .0000E+00 | .333 .4135E+0001256> .053 .1525E+00 | .479 .5190E+0001257> .115 .2270E+00 | .748 .7346E+0001258> .234 .3340E+00 | .000 .0000E+0001259> 01260> ROUTING RESULTS AREA QPEAK TPEAK R.V.01261> -------------------- (ha) (cms) (hrs) (mm)01262> INFLOW >04: (201 ) 17.12 2.787 1.036 43.86001263> OUTFLOW<05: (Pond1 ) 17.12 .479 1.929 43.86001264> OVERFLOW<10: (C1over) .00 .000 .000 .00001265> 01266> TOTAL NUMBER OF SIMULATED OVERFLOWS = 001267> CUMULATIVE TIME OF OVERFLOWS (hours)= .0001268> PERCENTAGE OF TIME OVERFLOWING (%)= .0001269> 01270> 01271> PEAK FLOW REDUCTION [Qout/Qin](%)= 17.20301272> TIME SHIFT OF PEAK FLOW (min)= 53.5701273> MAXIMUM STORAGE USED (ha.m.)=.5195E+0001274> 01275> --------------------------------------------------------------------------------01276> 001:0048------------------------------------------------------------------------01277> *West Side of Gilbert Creek* 01278> * 01279> ----------------------01280> | CALIB STANDHYD | Area (ha)= 9.0101281> | 07:202 DT= 2.00 | Total Imp(%)= 46.00 Dir. Conn.(%)= 40.0001282> ----------------------01283> IMPERVIOUS PERVIOUS (i)01284> Surface Area (ha)= 4.14 4.8701285> Dep. Storage (mm)= 2.00 5.0001286> Average Slope (%)= .50 2.0001287> Length (m)= 274.00 40.0001288> Mannings n = .015 .20001289> 01290> Max.eff.Inten.(mm/hr)= 131.09 62.2401291> over (min) 6.43 12.8601292> Storage Coeff. (min)= 5.63 (ii) 13.09 (ii)01293> Unit Hyd. Tpeak (min)= 6.43 12.8601294> Unit Hyd. peak (cms)= .19 .0901295> *TOTALS*01296> PEAK FLOW (cms)= 1.20 .53 1.574 (iii)01297> TIME TO PEAK (hrs)= 1.00 1.14 1.03601298> RUNOFF VOLUME (mm)= 66.17 28.98 43.86001299> TOTAL RAINFALL (mm)= 68.17 68.17 68.17301300> RUNOFF COEFFICIENT = .97 .43 .64301301> 01302> (i) CN PROCEDURE SELECTED FOR PERVIOUS LOSSES:01303> CN* = 75.0 Ia = Dep. Storage (Above)01304> (ii) TIME STEP (DT) SHOULD BE SMALLER OR EQUAL01305> THAN THE STORAGE COEFFICIENT.01306> (iii) PEAK FLOW DOES NOT INCLUDE BASEFLOW IF ANY.01307> 01308> --------------------------------------------------------------------------------01309> 001:0049------------------------------------------------------------------------01310> *West Pond, Pond 3* 01311> ---------------------01312> | ROUTE RESERVOIR | Requested routing time step = 2.0 min.01313> | IN>07:(202 ) |01314> | OUT<08:(Pond3 ) | ========= OUTLFOW STORAGE TABLE =========01315> --------------------- OUTFLOW STORAGE | OUTFLOW STORAGE01316> (cms) (ha.m.) | (cms) (ha.m.)01317> .000 .0000E+00 | .171 .2170E+0001318> .028 .8050E-01 | .233 .2785E+0001319> .073 .1150E+00 | .331 .3780E+0001320> .134 .1715E+00 | .000 .0000E+0001321> 01322> ROUTING RESULTS AREA QPEAK TPEAK R.V.01323> -------------------- (ha) (cms) (hrs) (mm)01324> INFLOW >07: (202 ) 9.01 1.574 1.036 43.86001325> OUTFLOW<08: (Pond3 ) 9.01 .232 1.929 43.86001326> OVERFLOW<10: (C1over) .00 .000 .000 .00001327> 01328> TOTAL NUMBER OF SIMULATED OVERFLOWS = 001329> CUMULATIVE TIME OF OVERFLOWS (hours)= .0001330> PERCENTAGE OF TIME OVERFLOWING (%)= .0001331> 01332> 01333> PEAK FLOW REDUCTION [Qout/Qin](%)= 14.74701334> TIME SHIFT OF PEAK FLOW (min)= 53.5701335> MAXIMUM STORAGE USED (ha.m.)=.2777E+0001336> 01337> --------------------------------------------------------------------------------01338> 001:0050------------------------------------------------------------------------01339> *South Pond to Wetland* 01340> * 01341> ----------------------01342> | CALIB STANDHYD | Area (ha)= 6.3701343> | 09:203 DT= 2.00 | Total Imp(%)= 70.00 Dir. Conn.(%)= 55.0001344> ----------------------01345> IMPERVIOUS PERVIOUS (i)01346> Surface Area (ha)= 4.46 1.9101347> Dep. Storage (mm)= 2.00 5.0001348> Average Slope (%)= .50 2.0001349> Length (m)= 206.00 40.0001350> Mannings n = .015 .200

(C:\...201503~1.out) R.J. Burnside & Associates Ltd
R.J. Burnside & Associates Ltd Page 5
01351> 01352> Max.eff.Inten.(mm/hr)= 131.09 109.1301353> over (min) 4.29 10.7101354> Storage Coeff. (min)= 4.74 (ii) 10.71 (ii)01355> Unit Hyd. Tpeak (min)= 4.29 10.7101356> Unit Hyd. peak (cms)= .24 .1101357> *TOTALS*01358> PEAK FLOW (cms)= 1.22 .38 1.518 (iii)01359> TIME TO PEAK (hrs)= 1.00 1.11 1.00001360> RUNOFF VOLUME (mm)= 66.17 34.66 51.99401361> TOTAL RAINFALL (mm)= 68.17 68.17 68.17301362> RUNOFF COEFFICIENT = .97 .51 .76301363> 01364> (i) CN PROCEDURE SELECTED FOR PERVIOUS LOSSES:01365> CN* = 75.0 Ia = Dep. Storage (Above)01366> (ii) TIME STEP (DT) SHOULD BE SMALLER OR EQUAL01367> THAN THE STORAGE COEFFICIENT.01368> (iii) PEAK FLOW DOES NOT INCLUDE BASEFLOW IF ANY.01369> 01370> --------------------------------------------------------------------------------01371> 001:0051------------------------------------------------------------------------01372> *South Pond, Pond 2* 01373> ---------------------01374> | ROUTE RESERVOIR | Requested routing time step = 2.0 min.01375> | IN>09:(203 ) |01376> | OUT<07:(Pond2 ) | ========= OUTLFOW STORAGE TABLE =========01377> --------------------- OUTFLOW STORAGE | OUTFLOW STORAGE01378> (cms) (ha.m.) | (cms) (ha.m.)01379> .000 .0000E+00 | .225 .1965E+0001380> .019 .1115E+00 | .319 .2408E+0001381> .077 .1233E+00 | .498 .3791E+0001382> .155 .1640E+00 | .000 .0000E+0001383> 01384> ROUTING RESULTS AREA QPEAK TPEAK R.V.01385> -------------------- (ha) (cms) (hrs) (mm)01386> INFLOW >09: (203 ) 6.37 1.518 1.000 51.99401387> OUTFLOW<07: (Pond2 ) 6.37 .280 1.607 51.99301388> OVERFLOW<10: (C1over) .00 .000 .000 .00001389> 01390> TOTAL NUMBER OF SIMULATED OVERFLOWS = 001391> CUMULATIVE TIME OF OVERFLOWS (hours)= .0001392> PERCENTAGE OF TIME OVERFLOWING (%)= .0001393> 01394> 01395> PEAK FLOW REDUCTION [Qout/Qin](%)= 18.46501396> TIME SHIFT OF PEAK FLOW (min)= 36.4301397> MAXIMUM STORAGE USED (ha.m.)=.2225E+0001398> 01399> --------------------------------------------------------------------------------01400> 001:0052------------------------------------------------------------------------01401> *100 Year*. 01402> --------------------01403> | CHICAGO STORM | IDF curve parameters: A=4688.00001404> | Ptotal= 86.96 mm | B= 17.00001405> -------------------- C= .96201406> used in: INTENSITY = A / (t + B)^C01407> 01408> Duration of storm = 3.00 hrs01409> Storm time step = 15.00 min01410> Time to peak ratio = .3301411> 01412> TIME RAIN | TIME RAIN | TIME RAIN | TIME RAIN01413> hrs mm/hr | hrs mm/hr | hrs mm/hr | hrs mm/hr01414> .25 6.009 | 1.00 166.890 | 1.75 14.226 | 2.50 5.21601415> .50 11.818 | 1.25 55.371 | 2.00 9.451 | 2.75 4.15101416> .75 39.928 | 1.50 24.551 | 2.25 6.826 | 3.00 3.40501417> 01418> --------------------------------------------------------------------------------01419> 001:0053------------------------------------------------------------------------01420> * 01421> *PRE-DEVELOPMENT FLOW RATES FOR AREAS DISCHARGING TO GILBERT CREEK* 01422> * 01423> *East Side of Creek* 01424> * 01425> ----------------------01426> | CALIB NASHYD | Area (ha)= 13.01 Curve Number (CN)=61.0001427> | 01:101 DT= 2.00 | Ia (mm)= 2.500 # of Linear Res.(N)= 3.0001428> ---------------------- U.H. Tp(hrs)= .52001429> 01430> Unit Hyd Qpeak (cms)= .95601431> 01432> PEAK FLOW (cms)= .748 (i)01433> TIME TO PEAK (hrs)= 1.60701434> RUNOFF VOLUME (mm)= 28.89801435> TOTAL RAINFALL (mm)= 86.96101436> RUNOFF COEFFICIENT = .33201437> 01438> (i) PEAK FLOW DOES NOT INCLUDE BASEFLOW IF ANY.01439> 01440> --------------------------------------------------------------------------------01441> 001:0054------------------------------------------------------------------------01442> *West Side of Creek* 01443> * 01444> ----------------------01445> | CALIB NASHYD | Area (ha)= 6.86 Curve Number (CN)=61.0001446> | 02:102 DT= 2.00 | Ia (mm)= 2.500 # of Linear Res.(N)= 3.0001447> ---------------------- U.H. Tp(hrs)= .40001448> 01449> Unit Hyd Qpeak (cms)= .65501450> 01451> PEAK FLOW (cms)= .467 (i)01452> TIME TO PEAK (hrs)= 1.42901453> RUNOFF VOLUME (mm)= 28.89801454> TOTAL RAINFALL (mm)= 86.96101455> RUNOFF COEFFICIENT = .33201456> 01457> (i) PEAK FLOW DOES NOT INCLUDE BASEFLOW IF ANY.01458> 01459> --------------------------------------------------------------------------------01460> 001:0055------------------------------------------------------------------------01461> *Wetland* 01462> * 01463> ----------------------01464> | CALIB NASHYD | Area (ha)= 6.27 Curve Number (CN)=61.0001465> | 03:103 DT= 2.00 | Ia (mm)= 2.500 # of Linear Res.(N)= 3.0001466> ---------------------- U.H. Tp(hrs)= .31001467> 01468> Unit Hyd Qpeak (cms)= .77301469> 01470> PEAK FLOW (cms)= .499 (i)01471> TIME TO PEAK (hrs)= 1.32101472> RUNOFF VOLUME (mm)= 28.89801473> TOTAL RAINFALL (mm)= 86.96101474> RUNOFF COEFFICIENT = .33201475> 01476> (i) PEAK FLOW DOES NOT INCLUDE BASEFLOW IF ANY.01477> 01478> --------------------------------------------------------------------------------01479> 001:0056------------------------------------------------------------------------01480> * 01481> *POST-DEVELOPMENT FLOW RATES FOR AREAS DISCHARGING TO GILBERT CREEK* 01482> * 01483> *East Side of Creek* 01484> * 01485> ----------------------
01486> | CALIB STANDHYD | Area (ha)= 17.1201487> | 04:201 DT= 2.00 | Total Imp(%)= 46.00 Dir. Conn.(%)= 40.0001488> ----------------------01489> IMPERVIOUS PERVIOUS (i)01490> Surface Area (ha)= 7.88 9.2401491> Dep. Storage (mm)= 2.00 5.0001492> Average Slope (%)= .50 2.0001493> Length (m)= 378.00 40.0001494> Mannings n = .015 .20001495> 01496> Max.eff.Inten.(mm/hr)= 166.89 94.0001497> over (min) 6.43 12.8601498> Storage Coeff. (min)= 6.20 (ii) 12.53 (ii)01499> Unit Hyd. Tpeak (min)= 6.43 12.8601500> Unit Hyd. peak (cms)= .18 .0901501> *TOTALS*01502> PEAK FLOW (cms)= 2.84 1.55 4.022 (iii)01503> TIME TO PEAK (hrs)= 1.00 1.14 1.03601504> RUNOFF VOLUME (mm)= 84.96 42.86 59.69901505> TOTAL RAINFALL (mm)= 86.96 86.96 86.96101506> RUNOFF COEFFICIENT = .98 .49 .68701507> 01508> (i) CN PROCEDURE SELECTED FOR PERVIOUS LOSSES:01509> CN* = 75.0 Ia = Dep. Storage (Above)01510> (ii) TIME STEP (DT) SHOULD BE SMALLER OR EQUAL01511> THAN THE STORAGE COEFFICIENT.01512> (iii) PEAK FLOW DOES NOT INCLUDE BASEFLOW IF ANY.01513> 01514> --------------------------------------------------------------------------------01515> 001:0057------------------------------------------------------------------------01516> *East Pond, Pond 1* 01517> ---------------------01518> | ROUTE RESERVOIR | Requested routing time step = 2.0 min.01519> | IN>04:(201 ) |01520> | OUT<05:(Pond1 ) | ========= OUTLFOW STORAGE TABLE =========01521> --------------------- OUTFLOW STORAGE | OUTFLOW STORAGE01522> (cms) (ha.m.) | (cms) (ha.m.)01523> .000 .0000E+00 | .333 .4135E+0001524> .053 .1525E+00 | .479 .5190E+0001525> .115 .2270E+00 | .748 .7346E+0001526> .234 .3340E+00 | .000 .0000E+0001527> 01528> ROUTING RESULTS AREA QPEAK TPEAK R.V.01529> -------------------- (ha) (cms) (hrs) (mm)01530> INFLOW >04: (201 ) 17.12 4.022 1.036 59.69901531> OUTFLOW<05: (Pond1 ) 17.12 .707 1.821 59.69801532> OVERFLOW<10: (C1over) .00 .000 .000 .00001533> 01534> TOTAL NUMBER OF SIMULATED OVERFLOWS = 001535> CUMULATIVE TIME OF OVERFLOWS (hours)= .0001536> PERCENTAGE OF TIME OVERFLOWING (%)= .0001537> 01538> 01539> PEAK FLOW REDUCTION [Qout/Qin](%)= 17.57801540> TIME SHIFT OF PEAK FLOW (min)= 47.1401541> MAXIMUM STORAGE USED (ha.m.)=.7019E+0001542> 01543> --------------------------------------------------------------------------------01544> 001:0058------------------------------------------------------------------------01545> *West Side of Gilbert Creek* 01546> * 01547> ----------------------01548> | CALIB STANDHYD | Area (ha)= 9.0101549> | 07:202 DT= 2.00 | Total Imp(%)= 46.00 Dir. Conn.(%)= 40.0001550> ----------------------01551> IMPERVIOUS PERVIOUS (i)01552> Surface Area (ha)= 4.14 4.8701553> Dep. Storage (mm)= 2.00 5.0001554> Average Slope (%)= .50 2.0001555> Length (m)= 274.00 40.0001556> Mannings n = .015 .20001557> 01558> Max.eff.Inten.(mm/hr)= 166.89 99.5601559> over (min) 4.29 10.7101560> Storage Coeff. (min)= 5.11 (ii) 11.30 (ii)01561> Unit Hyd. Tpeak (min)= 4.29 10.7101562> Unit Hyd. peak (cms)= .23 .1001563> *TOTALS*01564> PEAK FLOW (cms)= 1.58 .87 2.248 (iii)01565> TIME TO PEAK (hrs)= 1.00 1.11 1.00001566> RUNOFF VOLUME (mm)= 84.96 42.86 59.69901567> TOTAL RAINFALL (mm)= 86.96 86.96 86.96101568> RUNOFF COEFFICIENT = .98 .49 .68701569> 01570> (i) CN PROCEDURE SELECTED FOR PERVIOUS LOSSES:01571> CN* = 75.0 Ia = Dep. Storage (Above)01572> (ii) TIME STEP (DT) SHOULD BE SMALLER OR EQUAL01573> THAN THE STORAGE COEFFICIENT.01574> (iii) PEAK FLOW DOES NOT INCLUDE BASEFLOW IF ANY.01575> 01576> --------------------------------------------------------------------------------01577> 001:0059------------------------------------------------------------------------01578> *West Pond, Pond 3* 01579> ---------------------01580> | ROUTE RESERVOIR | Requested routing time step = 2.0 min.01581> | IN>07:(202 ) |01582> | OUT<08:(Pond3 ) | ========= OUTLFOW STORAGE TABLE =========01583> --------------------- OUTFLOW STORAGE | OUTFLOW STORAGE01584> (cms) (ha.m.) | (cms) (ha.m.)01585> .000 .0000E+00 | .171 .2170E+0001586> .028 .8050E-01 | .233 .2785E+0001587> .073 .1150E+00 | .331 .3780E+0001588> .134 .1715E+00 | .000 .0000E+0001589> 01590> ROUTING RESULTS AREA QPEAK TPEAK R.V.01591> -------------------- (ha) (cms) (hrs) (mm)01592> INFLOW >07: (202 ) 9.01 2.248 1.000 59.69901593> OUTFLOW<08: (Pond3 ) 8.99 .331 1.750 59.69801594> OVERFLOW<10: (C1over) .02 .081 1.750 59.69901595> 01596> TOTAL NUMBER OF SIMULATED OVERFLOWS = 201597> CUMULATIVE TIME OF OVERFLOWS (hours)= .0701598> PERCENTAGE OF TIME OVERFLOWING (%)= .0701599> 01600> 01601> PEAK FLOW REDUCTION [Qout/Qin](%)= 14.72201602> TIME SHIFT OF PEAK FLOW (min)= 45.0001603> MAXIMUM STORAGE USED (ha.m.)=.3779E+0001604> 01605> --------------------------------------------------------------------------------01606> 001:0060------------------------------------------------------------------------01607> *South Pond to Wetland* 01608> * 01609> ----------------------01610> | CALIB STANDHYD | Area (ha)= 6.3701611> | 09:203 DT= 2.00 | Total Imp(%)= 70.00 Dir. Conn.(%)= 55.0001612> ----------------------01613> IMPERVIOUS PERVIOUS (i)01614> Surface Area (ha)= 4.46 1.9101615> Dep. Storage (mm)= 2.00 5.0001616> Average Slope (%)= .50 2.0001617> Length (m)= 206.00 40.0001618> Mannings n = .015 .20001619> 01620> Max.eff.Inten.(mm/hr)= 166.89 164.90

(C:\...201503~1.out) R.J. Burnside & Associates Ltd
R.J. Burnside & Associates Ltd Page 6
01621> over (min) 4.29 8.5701622> Storage Coeff. (min)= 4.31 (ii) 9.36 (ii)01623> Unit Hyd. Tpeak (min)= 4.29 8.5701624> Unit Hyd. peak (cms)= .26 .1201625> *TOTALS*01626> PEAK FLOW (cms)= 1.57 .60 2.105 (iii)01627> TIME TO PEAK (hrs)= 1.00 1.07 1.00001628> RUNOFF VOLUME (mm)= 84.96 49.93 69.19601629> TOTAL RAINFALL (mm)= 86.96 86.96 86.96101630> RUNOFF COEFFICIENT = .98 .57 .79601631> 01632> (i) CN PROCEDURE SELECTED FOR PERVIOUS LOSSES:01633> CN* = 75.0 Ia = Dep. Storage (Above)01634> (ii) TIME STEP (DT) SHOULD BE SMALLER OR EQUAL01635> THAN THE STORAGE COEFFICIENT.01636> (iii) PEAK FLOW DOES NOT INCLUDE BASEFLOW IF ANY.01637> 01638> --------------------------------------------------------------------------------01639> 001:0061------------------------------------------------------------------------01640> *South Pond, Pond 2* 01641> ---------------------01642> | ROUTE RESERVOIR | Requested routing time step = 2.0 min.01643> | IN>09:(203 ) |01644> | OUT<07:(Pond2 ) | ========= OUTLFOW STORAGE TABLE =========01645> --------------------- OUTFLOW STORAGE | OUTFLOW STORAGE01646> (cms) (ha.m.) | (cms) (ha.m.)01647> .000 .0000E+00 | .225 .1965E+0001648> .019 .1115E+00 | .319 .2408E+0001649> .077 .1233E+00 | .498 .3791E+0001650> .155 .1640E+00 | .000 .0000E+0001651> 01652> ROUTING RESULTS AREA QPEAK TPEAK R.V.01653> -------------------- (ha) (cms) (hrs) (mm)01654> INFLOW >09: (203 ) 6.37 2.105 1.000 69.19601655> OUTFLOW<07: (Pond2 ) 6.37 .386 1.571 69.19501656> OVERFLOW<10: (C1over) .00 .000 .000 .00001657> 01658> TOTAL NUMBER OF SIMULATED OVERFLOWS = 001659> CUMULATIVE TIME OF OVERFLOWS (hours)= .0001660> PERCENTAGE OF TIME OVERFLOWING (%)= .0001661> 01662> 01663> PEAK FLOW REDUCTION [Qout/Qin](%)= 18.35001664> TIME SHIFT OF PEAK FLOW (min)= 34.2901665> MAXIMUM STORAGE USED (ha.m.)=.2928E+0001666> 01667> --------------------------------------------------------------------------------01668> 001:0062------------------------------------------------------------------------01669> FINISH01670> --------------------------------------------------------------------------------01671> ********************************************************************************01672> WARNINGS / ERRORS / NOTES01673> -------------------------01674> 001:0009 ROUTE RESERVOIR 01675> **** ERROR: Check the OUTFLOW-STORAGE table. 01676> Simulation ended on 2015-03-12 at 12:24:4001677> ================================================================================01678> 01679>

OGS / Pond Inspection / Monitoring Checklist
Date:
Item Maintenance Required
(Y/N)
Comments
1. Outlet Blockage – If the pond has not drained 48 hours after a rainfall check and remove any blockages in the control manhole.
2. Inlet Blockage - If there is sediment backing up into the pond inlet pipe, it is time to clean out the pond.
3. Sediment Depth – If maximum depth of 0.7 m of sediment has collected in the forebay, and if sediment is backing up into inlet pipe, the pond will need to be cleaned out. The calculations show that this will occur approximately every 15 years.
4. Shoreline Vegetation – If the vegetation is dead remove and replace the vegetation.
5. Upland Vegetation – If the vegetation is dead remove and replace the vegetation.
6. Trash Build-up – Any trash around the ditch inlet catch basin at the outlet will need to be removed.
7. Outlet to creek – Any signs of erosion indicates the need to apply stone or coir matting.
8. Berm Stability – If there are any signs of cracking or slumping call the engineer.
9. Hickenbottom Outlet – Check sediment accumulation at horizontal hickenbottom with stone jacket at outlet. If structure is clogged, clean out any sediment or debris. Clogging will be indicated by the pond not draining.
10. Outlet Structure – Raise control manhole lid and check for free flow. Remove any blockages that may be prohibiting free flow.
11. Maintenance Access – Check to ensure road is in fair condition and restore road as necessary.

Project: Paris Grand
Location: Paris ONProject #: PGD 020165Designer: Felix BrockwayDate: 12-Mar-2015
BLOCK 13Preliminary Infiltration Gallery Sizing
A = 1000 * V where: A = m2 infiltration bottom trench area (tbd)P * n * delta T V = 3644 m3 volume to be infiltrated *
P = 135 mm/hr percolation rate for native soil ** = 1000 * 3644 n = 0.4 bedding porosity value (clear stone)
135 * 0.40 * 72 delta T = 72 hours Retention Time
A = 937 m2
* - Volume to be infiltrated = rooftop diversion area from design sheets * 100 year rainfall depth * 0.95(0.95 factor applied to account for evaporation and depression storage losses)
= 4.41ha * 10000 m2/ha* 0.087m * 0.95= 3644 m3
** - 135 mm/hr value from LVM Hydrogeology Study Report - Appendix Table 102 for Borehole 12-11

160-P041402-0302-HD-R-0001-01 Table 102
TABLE 102
HYDRAULIC CONDUCTIVITY ESTIMATES
Paris Grand Country Club 150 Paris Links Road
Paris, Ontario
BH NAME
GROUND ELEVATION
(mASL)
GRAIN SIZE ANALYSES SLUG TESTS - HVORSLEV METHOD
SOIL DESCRIPTION SAMPLE DEPTH (mBGS)
HYDRAULIC CONDUCTIVITY
(m/sec) FORMULA
INFILTRATION RATE
(mm/hr) SOIL DESCRIPTION
SCREENED INTERVAL (mBGS)
HYDRAULIC CONDUCTIVITY
(m/sec) BH 01-11 246.16 Clayey Silt 2.29 – 2.74 < 1 x 10⁻⁶ ** 15‐20 Sand 6.1 – 7.6 4.5 x 10⁻⁴
BH 02-11 240.74 Sand, some Silt 4.57 – 5.03 7.0 x 10⁻⁶ Kozeny-Carmen 25‐30 Silt Till / Silt and Sand / Sand, some Silt 3.0 – 4.5 1.2 x 10⁻⁶
BH 03-11 239.05 Sand and Gravel 1.52 – 2.74 1.8 x 10⁻⁵ Kozeny-Carmen 30‐40 Sand and Gravel 2.3 – 3.8 8.6 x 10⁻⁵
BH 04-11 246.71 Sand and Gravel 10.67 – 12.80 8.9 x 10⁻⁵ Kozeny-Carmen 50‐60 Sand and Gravel 12.0 – 12.6 1.2 x 10⁻⁶
BH 05-11 241.33 Sandy Gravel, some Silt 2.29 – 3.51 6.6 x 10⁻⁶ Kozeny-Carmen 25‐30 Sand and Gravel 7.9 – 8.6 9.5 x 10⁻⁷ (*)
BH 06-11 251.25 Sandy Silt 10.67 – 11.12 1.8 x 10⁻⁷ Kaubisch 135‐140 Sand and Gravel 10.4 – 11.9 8.0 x 10⁻⁶
BH 07-11 - Sandy Gravel 3.05 – 5.03 7.4 x 10⁻⁵ Kozeny-Carmen 55‐60 - - -
BH 08-11 244.96 Sand and Gravel 4.57 – 4.72 7.8 x 10⁻⁶ Kozeny-Carmen 25‐30 Sand and Gravel 4.3 – 5.8 1.5 x 10⁻⁴
BH 09-11 245.05 Sandy, Gravelly Silt 4.57 – 5.03 2.8 x 10⁻⁷ Kaubisch 10‐15 Silt Till 4.6 – 6.1 4.5 x 10⁻⁴ (*)
BH 10-11 239.45 Gravelly Sand 3.05 – 3.51 1.8 x 10⁻⁴ Kozeny-Carmen 55‐60 Sand and Gravel 2.9 – 4.3 2.5 x 10⁻⁵
BH 11-11 245.44 Sand 9.14 – 9.60 5.3 x 10⁻⁴ Kozeny-Carmen 25‐30 Sand 9.8 – 11.3 2.5 x 10⁻⁵
BH 12-11 240.92 Gravelly Sand 6.20 – 6.55 9.0 x 10⁻⁵ Kozeny-Carmen 135‐140 Sand, some Gravel 5.9 – 7.4 7.0 x 10⁻⁴
BH 13-11 239.22 Sand and Gravel 4.57 – 4.88 8.0 x 10⁻⁵ Kozeny-Carmen 75‐80 Sand and Gravel 3.8 – 5.3 2.0 x 10⁻⁶
BH 14-11 242.89 Silty Sand 6.20 – 6.55 2.6 x 10⁻⁶ Kozeny-Carmen 100‐105 Sand, some Silt 5.6 – 7.1 1.5 x 10⁻⁴
BH 15-11 251.32 Sand and Gravel 12.18 – 12.50 6.6 x 10⁻⁶ Kozeny-Carman 55‐60 Sand 10.6 – 12.1 Dry
BH 16-11 238.59 Silty Sand 2.29 – 3.51 5.3 x 10⁻⁶ Kaubisch 55‐60 Silty Sand and Gravel / Silty Sand / Silt Till 3.0 – 4.5 9.0 x 10⁻⁷
BH 17-11 242.92 Silty Sand 6.10 – 6.55 4.2 x 10⁻⁶ Kozeny-Carmen 20‐25 Silty Sand 6.1 – 7.6 2.5 x 10⁻⁵
BH 18-11 236.12 Silty Sand 10.67 – 11.12 1.3 x 10⁻⁶ Kaubisch 25‐30 Silty Sand and Gravel 10.1 – 11.6 9.0 x 10⁻⁴
BH 19-11 233.59 Silty Sand 9.14 – 9.45 2.6 x 10⁻⁶ Kaubisch 25‐30 Limestone Bedrock 9.1 – 9.9 6.0 x 10⁻⁸
BH 20-11 230.71 Sand and Gravel, Some
Silt 3.05 – 3.20 8.6 x 10⁻⁶ Kaubisch 25‐30 - - -
Notes: 1. mBGS – metres below ground surface. 2. BH 07-11 encountered large boulders, and was terminated before reaching the water table. 3. While some grain size analyses did not fall strictly within the criteria of any formula, the Kozeny-Carman and Kaubisch formulae were applied in all cases to obtain a reasonable estimate of the soil hydraulic conductivity. 4. * – the slug test result is not representative of the soil type encountered, and is considered erroneous.

100.0" (2540 mm)
60.0"(1524 mm)
52.0" (1321 mm)
48.3" (1227 mm)INSTALLED
StormTech MC-4500 Chamber (not to scale)
Nominal Chamber Specifications
Size (L x W x H) 52" (1321 mm) x 100" (2540 mm) x 60" (1524 mm)
Chamber Storage 106.5 ft3 (3.01 m3)
Min. Installed Storage* 162.6 ft3 (4.60 m3)
Nominal Weight 120 lbs (54.4 kg)
Shipping
8 chambers/pallet
11 pallets/truck
StormTech MC-4500 End Cap (not to scale)
Nominal End Cap Specifications
Size (L x W x H) 35.1" (891 mm) x 90.2" (2291 mm) x 59.4" (1509 mm)
End Cap Storage 35.7 ft3 (1.01 m3)
Min. Installed Storage* 108.7 ft3 (3.08 m3)
Nominal Weight 120 lbs (54.4 kg)
* This assumes a minimum of 12" (305 mm) of stone above, 9" (229 mm) of stone below chambers,9” (229 mm) of stone between chambers/end caps and 40% stone porosity.
*This assumes a minimum of 12" (305 mm) of stone above, 9" (229 mm) of stone below, 12" (305 mm) ofstone perimeter, 9” (229 mm) of stone between chambers/end caps and 40% stone porosity.
MC-4500 ChamberStormTech™ MC-4500 ChamberDesigned to meet the most stringent industryperformance standards for superior structuralintegrity while providing designers with acost-effective method to save valuable landand protect water resources. The StormTechsystem is designed primarily to be used under parking lots thus maximizing landusage for commercial and municipal applications.

NOTE: Assumes 9" (229 mm) min. row spacing, 12" (305 mm) min. of stoneabove, 40% stone porosity and includes the bare chamber/end cap volume.End cap volume assumes 12" (305 mm) min. stone perimeter.
Storage Volume Per Chamber/End Cap ft3 (m3)
Bare Chamber/End Cap and StoneUnit Volume — Stone Foundation
Storage Depth in. (mm)
ft3 (m3) 9" (229 mm) 12" (305 mm) 15" (381 mm) 18" (457 mm)
Chamber 106.5 (3.02) 162.6 (4.60) 166.3 (4.71) 169.9 (4.81) 173.6 (4.91)
End Cap 35.7 (1.01) 108.7 (3.08) 111.9 (3.17) 115.2 (3.26) 118.4 (3.35)
Amount of Stone Per Chamber
NOTE: Assumes 12" (305 mm) of stone above, 9" (229 mm) min. row spacing, and 12" (305 mm) min. of perimeter stone in front of end caps.
ENGLISH Stone Foundation Depth
tons (yds3) 9" (229 mm) 12" (305 mm) 15" (381 mm) 18" (457 mm)
Chamber 7.4 (5.2) 7.8 (5.5) 8.3 (5.9) 8.8 (6.2)
End Cap 9.6 (6.8) 10.0 (7.1) 10.4 (7.4) 10.9 (7.7)
METRIC kg (m3) 229 mm 305 mm 381 mm 457 mmChamber 6681 (4.0) 7117 (4.2) 7552 (4.5) 7987 (4.7)
End Cap 8691 (5.2) 9075 (5.4) 9460 (5.6) 9845 (5.9)
Volume of Excavation Per Chamber/End Cap in yd3 (m3)
NOTE: Assumes 9" (229 mm) min. of separation between chamber rows, 12" (305 mm) min. of perimeter in front of end caps, and 24" (610 mm) of cover.The volume of excavation will vary as the depth of cover increases.
Stone Foundation Depth
9" (229 mm) 12" (305 mm) 15" (381 mm) 18" (457 mm)
Chamber 10.5 (8.0) 10.8 (8.3) 11.2 (8.5) 11.5 (8.8)
End Cap 9.3 (7.1) 9.6 (7.3) 9.9 (7.6) 10.2 (7.8)
General Cross Section**Contact your local StormTech representative or visit www.stormtech.com for a copy of the latest installation instructions.
Printed in the U.S.A. on recycled paper© 2010. StormTech, Inc. S26B1110
20 Beaver Road, Suite 104 Wethersfield Connecticut 06109
860.529.8188 888.892.2694 fax 866.328.8401 fax 860-529-8040 www.stormtech.com
Detention Retention Water Quality
Division of
MADE IN THE U.S.A.
*Advanced Drainage Systems, the ADS logo, the green stripe, are registered trademarks of Advanced Drainage Systems. StormTech and MC-4500 are registered trademarks of StormTech, Inc. Green Building Council Member logo is a registered trademark of the U.S. Green Building Council.ADS “Terms and Conditions of Sale” are available on the ADS website, www.ads-pipe.com

R.J. Burnside & Associates Limited 6990 Creditview Road, Unit 2 Mississauga ON L5N 8R9 CANADA telephone (905) 821-1800 fax (905) 821-1809 web www.rjburnside.com
Memorandum
Date: August 20, 2014 Project No.: PGD020165.0000
Project Name: Paris Grand Subdivision Gilbert Creek SWS – Erosion Criteria Gawser Model Review – Proposal for Volume Controls
Client Name: County of Brant (Paris) Ontario
To: Ms. Janet Engels, Grand River Conservation Authority (GRCA)
From: Mr. Felix Brockway and Ms. Lorena Niemi
As per our August 18 discussion regarding the proposed discharge to Gilbert Creek for the above noted project, this memo summarizes the options and proposed approach for ensuring the Paris Grand development will adhere to the Gilbert Creek Erosion Modelling criteria, as provided in GAWSER model included in the Gilbert Creek Subwatershed Study (SWS), Planning and Engineering Initiatives Ltd., November 1999. As discussed, the specific concern relates to proposed increases in development area and site imperviousness beyond that which was anticipated in the SWS modelling. This memorandum is intended to outline the specifics of the issue and identify potential solutions for GRCA consideration. We have included Figure C2.7 from the SWS and calculations in support of our approach with this memorandum for ease of reference.
Our review of the original “future development” GAWSER modelling has noted the following:
The modelling accounted for areas draining to Gilbert Creek between the former railway and Paris Links Road as follows: 49 ha of existing developed area to the west (Catchment 406); 8 ha of undeveloped area, including the creek and wetlands (area 4051); 26 ha of future development (Catchment 4052), with an assumed imperviousness of
35%; An additional area on the easterly portion of the Paris Grand lands that does not
currently drain to the Gilbert Creek was also included in the modelling for assumed post-development conditions (noted as Future Potential Diversion Area to the east of Catchment 405 on Figure C2.7).
The proposed drainage from the combination of Catchments 4051 and 4052 discharges to Gilbert Creek following attenuation in a stormwater management facility.
The future development imperviousness of 35% in the original SWS modelling is abnormally low for the developed condition. We believe the modelled imperviousness reflected intention to keep a portion of the site in golf course use, which is not consistent with the currently proposed plans.

Memorandum Page 2 of 4
PGD020165.0000
August 20, 2014
The proposed development for the above noted areas as outlined in our current Functional Servicing Report and SWM Report includes:
49 ha of existing developed area to the west (Catchment 406 – unchanged); 3.2 ha of undeveloped area, including the creek and wetlands; and, 32.7 ha of proposed development (Catchment 4052), with an assumed imperviousness of
57%. The 32.7 ha area incorporates the Potential diversion Area highlighted in the SWS. The proposed drainage from Catchment 4052 discharges to Gilbert Creek following
attenuation in a stormwater management facility.
Based on the increases in development area and total imperviousness, it can be inferred that runoff volumes from the proposed development will exceed the rates determined and approved in the SWS modelling. If runoff volumes increase significantly, the result will be an increase in the hours of exceedance (even with the post- to pre-controls provided via SWM ponds) beyond that anticipated and recognized in the SWS.
Comparison of Runoff Volumes to Gilbert Creek (Gilbert Creek SWS vs. Current Proposal)
The runoff volumes from the Gilbert Creek SWS modelling were compared to potential runoff volumes based on the current Draft Plan. Runoff ‘unit rates’ for the approved future development condition were established using the runoff volumes, during the 100-year rainfall event, as identified in the “future development” GAWSER modelling output and associated input. The calculation of runoff volumes got Gilbert Creek under the proposed post-development scenario were established on the basis of the land uses per the current Draft Plan.
Volumes per SWS Model with original assumptions for development a) Area 406 (development to the west): runoff 14.52mm x49 ha = 7,115 m3
Unit Rate: 7,115 m3 / 49 ha = 145 m3/ha b) Area 4051 (assumed undeveloped per SWS): runoff 22.99mm x 8 ha = 1,839 m3 Unit Rate: 1,839 m3 / 8 ha = 230 m3/ha c) Area 4052 (assumed developed per [email protected] imp): runoff 59.9mm x 26 ha = 15,574 m3 Unit Rate: 444 m3 /pervious ha* 887 m3 /impervious ha* Total to Gilbert Creek just above Paris Links Road: (a+b+c) = 24,528 m3 Total to Gilbert Creek from ‘assumed’ Paris Grand development: (b+c) = 17,413 m3 Volumes estimated per current development proposal through application of Unit Rates d) Area 406 (same as above) = 7,115 m3 e) Undeveloped area: 3.2 ha x 230 m3/ha = 736 m3 f) Developed area: 32.7 x (444 x 0.43 + 887 x 0.57) = 22,774 m3 Total to Gilbert Creek from Paris Grand: (e+f) = 23,510 m3
Reduction in proposed runoff volume required to meet original SWS volumes = 6,097 m3
*Unit Rate derived using SCS method per attached calculation

Memorandum Page 3 of 4
PGD020165.0000
August 20, 2014
Preliminary Evaluation of Options to Mitigate Increase in Volume
In order to achieve the reductions required to bring the runoff volumes in line with the GAWSER modelling, net runoff to Gilbert Creek must decrease. Based on included preliminary calculations using the unit rate methodology identified above, the rooftop area within the catchments discharging to Gilbert Creek will generate greater than the required diversion volume in the 100-year storm event. Rooftops provide a clean source of stormwater runoff, which allows for diversion options that can bypass the stormwater management facilities. Potentially, the volumetric diversion can be achieved via one or a combination of the following measures:
a) A reduction in the contributing drainage area to the two northerly stormwater ponds that are currently proposed to discharge to Gilbert Creek, by: Piping a portion of the drainage area directly to the southerly stormwater facility; Piping rooftop runoff directly to the wetland; Piping rooftop runoff directly to the Grand River.
b) Maintaining the current drainage areas to the northerly ponds, but diverting a portion of the outflow either to the southerly stormwater pond or directly to the Grand River.
c) Implementation of LIDs (i.e., lot level controls or centralized infiltration facilities) that would provide for the required reduction in runoff.
The preferred approach to achieve the volumetric balance between the SWS and current proposed scenario is a combination of options a) and c).
East of Gilbert Creek, where the soils and groundwater elevations are conducive to infiltration, targeted reduction would include the implementation of LID measures with the provision of at source infiltration of the rooftop runoff. Depending on the capacity of the soils, to be reviewed and confirmed by LVM, a centralized infiltration facility could be included in the design as required. The efforts for volume reduction east of Gilbert Creek through LID measures would be maximized to achieve as much of the reduction as feasible.
To supplement to volume reductions on the east side of the creek, additional measures may be required in the development west of Gilbert Creek. On the west side of the creek the soils and groundwater elevations are limiting with respect to infiltration. The proposed approach to volume reduction in this area would be the diversion of the rooftop runoff directly to the wetland through a separate collection system. This would not only achieve the required volume diversion but has the additional benefit of the maintenance of a water supply to the existing wetland feature.
It was concluded that the approach outlined above may provide the best solution in the following context:
Maintenance of surface hydrology to creek (pond outflow to east side Gilbert Creek north of Paris Links Road).
Maintenance of water source to the wetland (direct rooftop discharge west side of Gilbert Creek south of Paris Links Road).
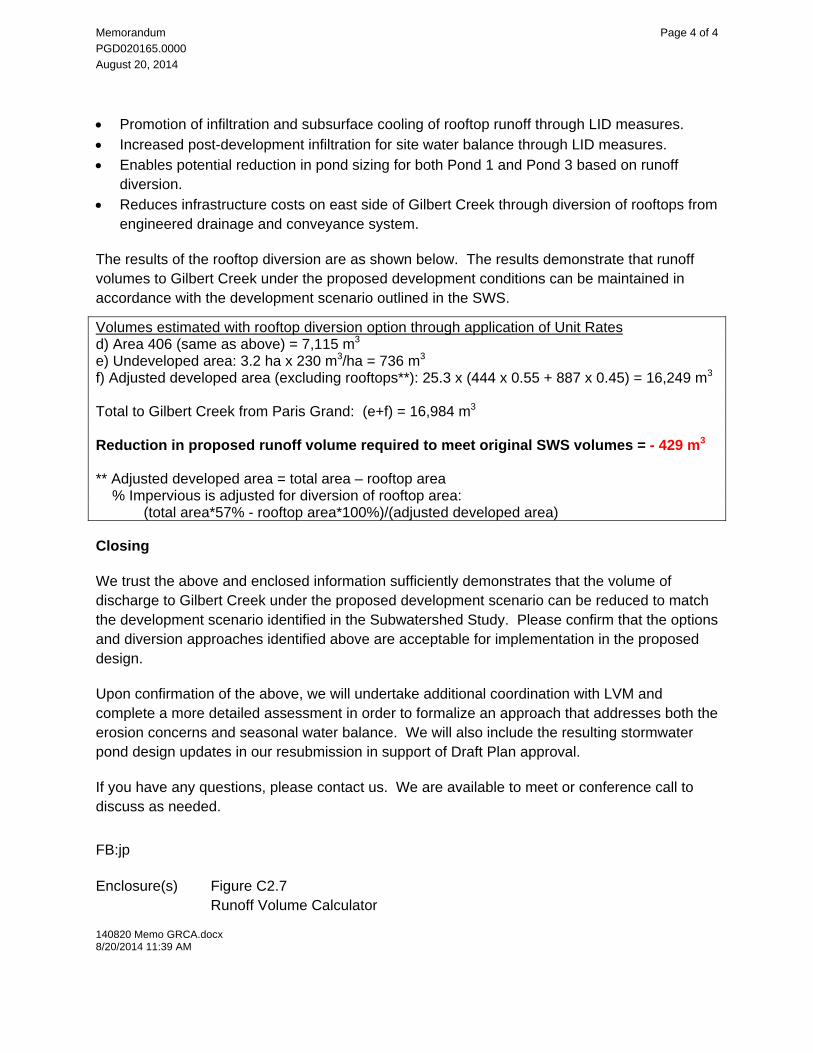
Memorandum Page 4 of 4
PGD020165.0000
August 20, 2014
Promotion of infiltration and subsurface cooling of rooftop runoff through LID measures. Increased post-development infiltration for site water balance through LID measures. Enables potential reduction in pond sizing for both Pond 1 and Pond 3 based on runoff
diversion. Reduces infrastructure costs on east side of Gilbert Creek through diversion of rooftops from
engineered drainage and conveyance system.
The results of the rooftop diversion are as shown below. The results demonstrate that runoff volumes to Gilbert Creek under the proposed development conditions can be maintained in accordance with the development scenario outlined in the SWS.
Volumes estimated with rooftop diversion option through application of Unit Rates d) Area 406 (same as above) = 7,115 m3 e) Undeveloped area: 3.2 ha x 230 m3/ha = 736 m3 f) Adjusted developed area (excluding rooftops**): 25.3 x (444 x 0.55 + 887 x 0.45) = 16,249 m3 Total to Gilbert Creek from Paris Grand: (e+f) = 16,984 m3
Reduction in proposed runoff volume required to meet original SWS volumes = - 429 m3
** Adjusted developed area = total area – rooftop area % Impervious is adjusted for diversion of rooftop area:
(total area*57% - rooftop area*100%)/(adjusted developed area)
Closing
We trust the above and enclosed information sufficiently demonstrates that the volume of discharge to Gilbert Creek under the proposed development scenario can be reduced to match the development scenario identified in the Subwatershed Study. Please confirm that the options and diversion approaches identified above are acceptable for implementation in the proposed design.
Upon confirmation of the above, we will undertake additional coordination with LVM and complete a more detailed assessment in order to formalize an approach that addresses both the erosion concerns and seasonal water balance. We will also include the resulting stormwater pond design updates in our resubmission in support of Draft Plan approval.
If you have any questions, please contact us. We are available to meet or conference call to discuss as needed.
FB:jp Enclosure(s) Figure C2.7
Runoff Volume Calculator 140820 Memo GRCA.docx 8/20/2014 11:39 AM
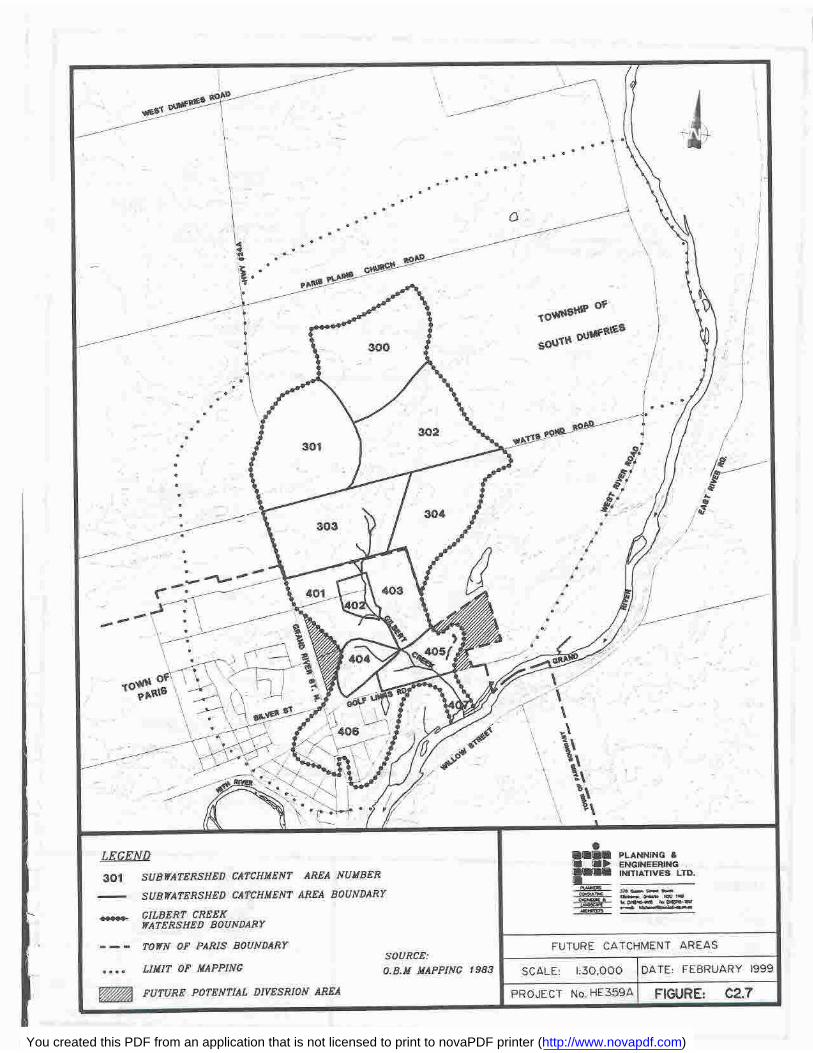
You created this PDF from an application that is not licensed to print to novaPDF printer (http://www.novapdf.com)

GILBERT CREEK - SITE RUNOFF VOLUME CALCULATIONS
Project: Paris Grand Subdivision
File: PGD020165
Designed by: L. Niemi
Date: 19-Aug-14
GAWSER Modelling Results/Parameters - per approved Subwatershed Study
Catchment 406
Drainage Area (ha) 49.00 ha
Runoff Volume 14.52 mm 7114.8 cu.m
Unit Rate 145 cu.m/ha
Catchment 4051
Drainage Area (ha) 8.00 ha
Runoff Volume 22.99 mm 1839.2 cu.m
Unit Rate 230 cu.m/ha
Catchment 4052
Drainage Area (ha) 26.00 ha
Runoff Volume 59.90 mm 15574 cu.m
Unit Rate Impervious Area 887 cu.m/ha
Unit Rate Pervious Area 444 cu.m/ha
Total GAWSER MODELLED VOLUME from C4051 + C4052 17413 cu.m
SCS Method for Determination of Unit Rate Based on Know Volume and Waterhsed Parameters
Q = (P-IA)^2/P-(IA-S)
S = -254+25400/CN
T IMP = 35.0 %
Pervious Area Impervious Area
P = 96.1 mm P = 96.105 mm
IA = 2.5 mm IA = 2.5 mm
CN = 71 CN = 98
S = 103.7 S = 5.2
Q = 44.4 mm Q = 88.7 mm
per imp total
SCS Runoff Volume 44.4 88.7 mm
Drainage Area 16.90 9.10 26.00 ha
Runoff Volume 7503 8071 15574 cu.m
Unit Rate 444.0 886.9 cu.m/ha
Proposed Modelling Results/Parameters per proposed Development Scenario
Catchment 406
Drainage Area (ha) 49.00 ha
Unit Rate 145 mm/ha
Runoff Volume 7115 cu.m
Catchment 4051
Drainage Area (ha) 3.20 ha
Unit Rate 230 mm/ha
Runoff Volume 736 cu.m
Catchment 4052
Drainage Area (ha) 32.70 ha
Percent Imp (%) 57%
Unit Rate Impervious Area 887 cu.m/ha
Unit Rate Pervious Area 444 cu.m/ha
Runoff Volume 22774 cu.m
Total Calculated VOLUME from C4051 + C4052 23510 cu.m
REQUIRED REDUCTION 6097 cu.m
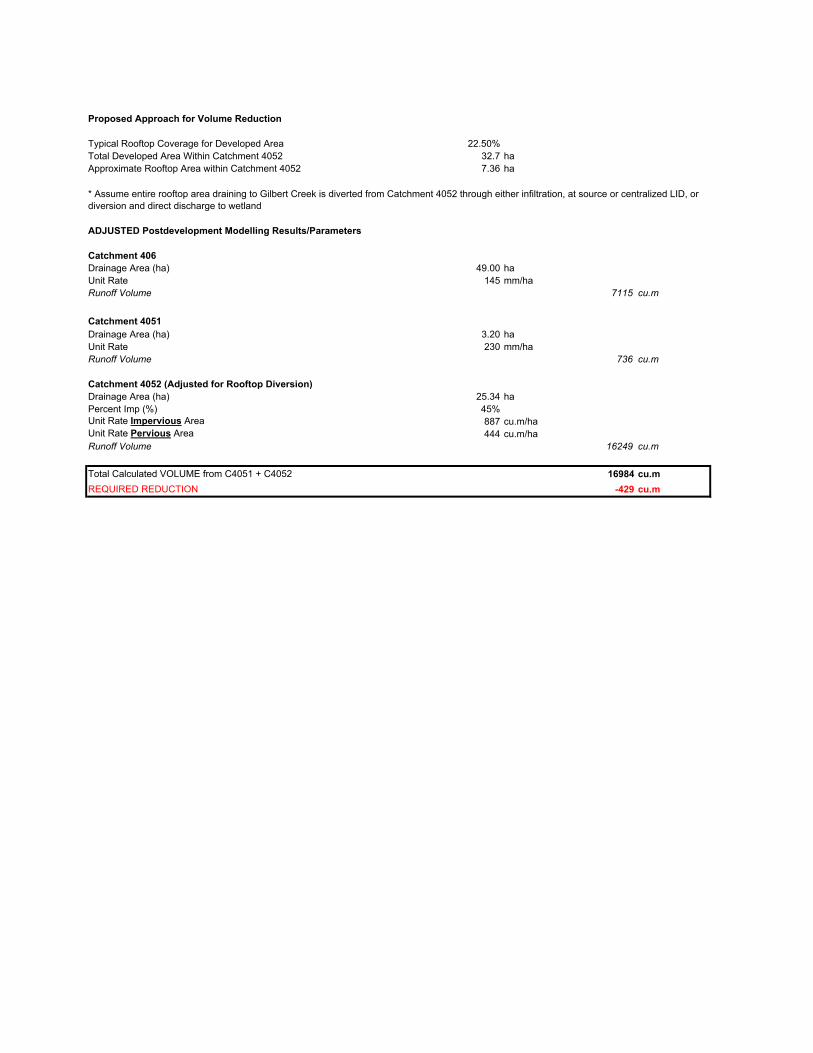
Proposed Approach for Volume Reduction
Typical Rooftop Coverage for Developed Area 22.50%
Total Developed Area Within Catchment 4052 32.7 ha
Approximate Rooftop Area within Catchment 4052 7.36 ha
ADJUSTED Postdevelopment Modelling Results/Parameters
Catchment 406
Drainage Area (ha) 49.00 ha
Unit Rate 145 mm/ha
Runoff Volume 7115 cu.m
Catchment 4051
Drainage Area (ha) 3.20 ha
Unit Rate 230 mm/ha
Runoff Volume 736 cu.m
Catchment 4052 (Adjusted for Rooftop Diversion)
Drainage Area (ha) 25.34 ha
Percent Imp (%) 45%
Unit Rate Impervious Area 887 cu.m/ha
Unit Rate Pervious Area 444 cu.m/ha
Runoff Volume 16249 cu.m
Total Calculated VOLUME from C4051 + C4052 16984 cu.m
REQUIRED REDUCTION -429 cu.m
* Assume entire rooftop area draining to Gilbert Creek is diverted from Catchment 4052 through either infiltration, at source or centralized LID, or
diversion and direct discharge to wetland

Appendix D
Preliminary Sanitary Sewer Design Calculations
Ap
pen
dix D

SANITARY DEMAND
Design Parameters
Average Residential Day Demand 350 L/cap per day
Infiltration Flow 0.23 L/ha*s
Maximum Low Density Residential Units 290 units
Maximum Medium Density Residential Units 120 units
Persons Per Unit - Low Density Residential 2.89 persons
Persons Per Unit - Medium Density Residential 1.94 persons
46.9 36.3
Design Spec. Source: County of Brant Development and Engineering Standards, Section 17 - Sanitary, March 2013.
Based on GSP Draft Plan - March 11, 2013
DESCRIPTION
LOW RES MED RES ROW NON-RES SWM BLOCKS OPEN SPACE BLOCKS TOTAL TOTAL LOW RES LOW RES MED RES MED RES TOTAL
AVG.
DRY
WEATHE
R FLOW PEAK FACTOR
PEAKED
FLOW
INFILTRA
TION
FLOW DESIGN FLOW
BLOCKS BLOCKS BLOCKS BLOCKS (NOT INCLUDED) (NOT INCLUDED) PROPERTY INFILTRATION AREA BLOCKS BLOCKS BLOCKS BLOCKS (l/s) M (l/s) (l/s) (l/s)
(ha) (ha) (ha) (ha) (ha) (ha) (ha) (ha) (persons) (units) (persons) (persons) (persons)
WEST OF GILBERT CREEK 6.828 4.738 2.393 0.052 1.616 19.669 35.296 14.011 320 111 172 89 492 2.0 4.0 7.9 3.2 11.2
STREET A
STREET G
STREET H
STREET I
EAST OF GILBERT CREEK 11.036 1.679 3.993 0.543 1.869 5.206 24.326 17.251 518 179 61 31 579 2.3 3.9 9.2 4.0 13.2
STREET B
STREET C
STREET D
STREET E
STREET F
TOTAL 17.864 6.417 6.386 0.595 3.485 24.875 59.622 31.262 838 233 1071 4.3 3.8 16.4 7.2 23.6
LAND USE AREAS POPULATIONS SANITARY DEMANDS
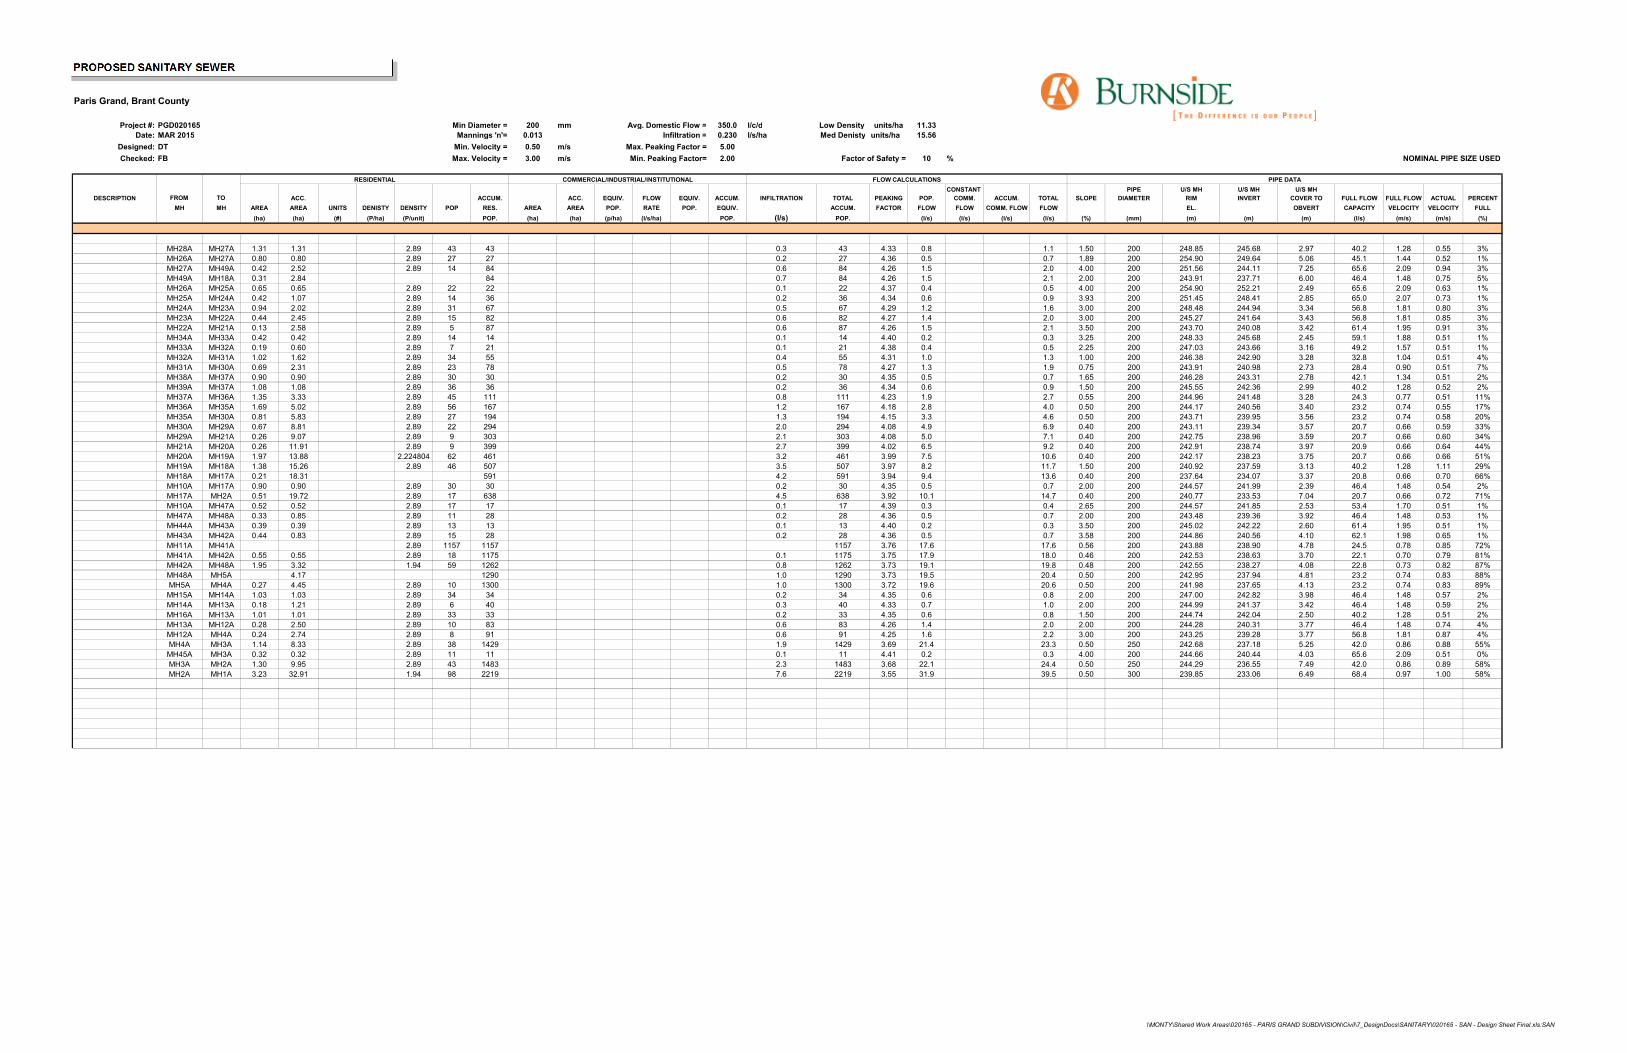
PROPOSED SANITARY SEWER
Paris Grand, Brant County
Project #: PGD020165 Min Diameter = 200 mm Avg. Domestic Flow = 350.0 l/c/d Low Density units/ha 11.33
Date: MAR 2015 Mannings 'n'= 0.013 Infiltration = 0.230 l/s/ha Med Denisty units/ha 15.56
Designed: DT Min. Velocity = 0.50 m/s Max. Peaking Factor = 5.00
Checked: FB Max. Velocity = 3.00 m/s Min. Peaking Factor= 2.00 Factor of Safety = 10 % NOMINAL PIPE SIZE USED
RESIDENTIAL COMMERCIAL/INDUSTRIAL/INSTITUTIONAL FLOW CALCULATIONS PIPE DATA
CONSTANT PIPE U/S MH U/S MH U/S MH
DESCRIPTION FROM TO ACC. ACCUM. ACC. EQUIV. FLOW EQUIV. ACCUM. INFILTRATION TOTAL PEAKING POP. COMM. ACCUM. TOTAL SLOPE DIAMETER RIM INVERT COVER TO FULL FLOW FULL FLOW ACTUAL PERCENT
MH MH AREA AREA UNITS DENISTY DENSITY POP RES. AREA AREA POP. RATE POP. EQUIV. ACCUM. FACTOR FLOW FLOW COMM. FLOW FLOW EL. OBVERT CAPACITY VELOCITY VELOCITY FULL
(ha) (ha) (#) (P/ha) (P/unit) POP. (ha) (ha) (p/ha) (l/s/ha) POP. (l/s) POP. (l/s) (l/s) (l/s) (l/s) (%) (mm) (m) (m) (m) (l/s) (m/s) (m/s) (%)
0 MH28A MH27A 1.31 1.31 0 2.89 43 43 0.00 0.00 0 0.000 0 0 0.3 43 4.33 0.8 0.0 0.0 1.1 1.50 200 248.85 245.68 2.97 40.2 1.28 0.55 3%
0 MH26A MH27A 0.80 0.80 0 2.89 27 27 0.00 0.00 0 0.000 0 0 0.2 27 4.36 0.5 0.0 0.0 0.7 1.89 200 254.90 249.64 5.06 45.1 1.44 0.52 1%
0 MH27A MH49A 0.42 2.52 0 2.89 14 84 0.00 0.00 0 0.000 0 0 0.6 84 4.26 1.5 0.0 0.0 2.0 4.00 200 251.56 244.11 7.25 65.6 2.09 0.94 3%
0 MH49A MH18A 0.31 2.84 0 0 0 84 0.00 0.00 0 0.000 0 0 0.7 84 4.26 1.5 0.0 0.0 2.1 2.00 200 243.91 237.71 6.00 46.4 1.48 0.75 5%
0 MH26A MH25A 0.65 0.65 0 2.89 22 22 0.00 0.00 0 0.000 0 0 0.1 22 4.37 0.4 0.0 0.0 0.5 4.00 200 254.90 252.21 2.49 65.6 2.09 0.63 1%
0 MH25A MH24A 0.42 1.07 0 2.89 14 36 0.00 0.00 0 0.000 0 0 0.2 36 4.34 0.6 0.0 0.0 0.9 3.93 200 251.45 248.41 2.85 65.0 2.07 0.73 1%
0 MH24A MH23A 0.94 2.02 0 2.89 31 67 0.00 0.00 0 0.000 0 0 0.5 67 4.29 1.2 0.0 0.0 1.6 3.00 200 248.48 244.94 3.34 56.8 1.81 0.80 3%
0 MH23A MH22A 0.44 2.45 0 2.89 15 82 0.00 0.00 0 0.000 0 0 0.6 82 4.27 1.4 0.0 0.0 2.0 3.00 200 245.27 241.64 3.43 56.8 1.81 0.85 3%
0 MH22A MH21A 0.13 2.58 0 2.89 5 87 0.00 0.00 0 0.000 0 0 0.6 87 4.26 1.5 0.0 0.0 2.1 3.50 200 243.70 240.08 3.42 61.4 1.95 0.91 3%
0 MH34A MH33A 0.42 0.42 0 2.89 14 14 0.00 0.00 0 0.000 0 0 0.1 14 4.40 0.2 0.0 0.0 0.3 3.25 200 248.33 245.68 2.45 59.1 1.88 0.51 1%
0 MH33A MH32A 0.19 0.60 0 2.89 7 21 0.00 0.00 0 0.000 0 0 0.1 21 4.38 0.4 0.0 0.0 0.5 2.25 200 247.03 243.66 3.16 49.2 1.57 0.51 1%
0 MH32A MH31A 1.02 1.62 0 2.89 34 55 0.00 0.00 0 0.000 0 0 0.4 55 4.31 1.0 0.0 0.0 1.3 1.00 200 246.38 242.90 3.28 32.8 1.04 0.51 4%
0 MH31A MH30A 0.69 2.31 0 2.89 23 78 0.00 0.00 0 0.000 0 0 0.5 78 4.27 1.3 0.0 0.0 1.9 0.75 200 243.91 240.98 2.73 28.4 0.90 0.51 7%
0 MH38A MH37A 0.90 0.90 0 2.89 30 30 0.00 0.00 0 0.000 0 0 0.2 30 4.35 0.5 0.0 0.0 0.7 1.65 200 246.28 243.31 2.78 42.1 1.34 0.51 2%
0 MH39A MH37A 1.08 1.08 0 2.89 36 36 0.00 0.00 0 0.000 0 0 0.2 36 4.34 0.6 0.0 0.0 0.9 1.50 200 245.55 242.36 2.99 40.2 1.28 0.52 2%
0 MH37A MH36A 1.35 3.33 0 2.89 45 111 0.00 0.00 0 0.000 0 0 0.8 111 4.23 1.9 0.0 0.0 2.7 0.55 200 244.96 241.48 3.28 24.3 0.77 0.51 11%
0 MH36A MH35A 1.69 5.02 0 2.89 56 167 0.00 0.00 0 0.000 0 0 1.2 167 4.18 2.8 0.0 0.0 4.0 0.50 200 244.17 240.56 3.40 23.2 0.74 0.55 17%
0 MH35A MH30A 0.81 5.83 0 2.89 27 194 0.00 0.00 0 0.000 0 0 1.3 194 4.15 3.3 0.0 0.0 4.6 0.50 200 243.71 239.95 3.56 23.2 0.74 0.58 20%
0 MH30A MH29A 0.67 8.81 0 2.89 22 294 0.00 0.00 0 0.000 0 0 2.0 294 4.08 4.9 0.0 0.0 6.9 0.40 200 243.11 239.34 3.57 20.7 0.66 0.59 33%
0 MH29A MH21A 0.26 9.07 0 2.89 9 303 0.00 0.00 0 0.000 0 0 2.1 303 4.08 5.0 0.0 0.0 7.1 0.40 200 242.75 238.96 3.59 20.7 0.66 0.60 34%
0 MH21A MH20A 0.26 11.91 0 2.89 9 399 0.00 0.00 0 0.000 0 0 2.7 399 4.02 6.5 0.0 0.0 9.2 0.40 200 242.91 238.74 3.97 20.9 0.66 0.64 44%
0 MH20A MH19A 1.97 13.88 0 2.224804 62 461 0.00 0.00 0 0.000 0 0 3.2 461 3.99 7.5 0.0 0.0 10.6 0.40 200 242.17 238.23 3.75 20.7 0.66 0.66 51%
0 MH19A MH18A 1.38 15.26 0 2.89 46 507 0.00 0.00 0 0.000 0 0 3.5 507 3.97 8.2 0.0 0.0 11.7 1.50 200 240.92 237.59 3.13 40.2 1.28 1.11 29%
0 MH18A MH17A 0.21 18.31 0 0 0 591 0.00 0.00 0 0.000 0 0 4.2 591 3.94 9.4 0.0 0.0 13.6 0.40 200 237.64 234.07 3.37 20.8 0.66 0.70 66%
0 MH10A MH17A 0.90 0.90 0 2.89 30 30 0.00 0.00 0 0.000 0 0 0.2 30 4.35 0.5 0.0 0.0 0.7 2.00 200 244.57 241.99 2.39 46.4 1.48 0.54 2%
0 MH17A MH2A 0.51 19.72 0 2.89 17 638 0.00 0.00 0 0.000 0 0 4.5 638 3.92 10.1 0.0 0.0 14.7 0.40 200 240.77 233.53 7.04 20.7 0.66 0.72 71%
0 MH10A MH47A 0.52 0.52 0 2.89 17 17 0.00 0.00 0 0.000 0 0 0.1 17 4.39 0.3 0.0 0.0 0.4 2.65 200 244.57 241.85 2.53 53.4 1.70 0.51 1%
0 MH47A MH48A 0.33 0.85 0 2.89 11 28 0.00 0.00 0 0.000 0 0 0.2 28 4.36 0.5 0.0 0.0 0.7 2.00 200 243.48 239.36 3.92 46.4 1.48 0.53 1%
0 MH44A MH43A 0.39 0.39 0 2.89 13 13 0.00 0.00 0 0.000 0 0 0.1 13 4.40 0.2 0.0 0.0 0.3 3.50 200 245.02 242.22 2.60 61.4 1.95 0.51 1%
0 MH43A MH42A 0.44 0.83 0 2.89 15 28 0.00 0.00 0 0.000 0 0 0.2 28 4.36 0.5 0.0 0.0 0.7 3.58 200 244.86 240.56 4.10 62.1 1.98 0.65 1%
0 MH11A MH41A 0.00 0.00 0 2.89 1157 1157 0.00 0.00 0 0.000 0 0 0.0 1157 3.76 17.6 0.0 0.0 17.6 0.56 200 243.88 238.90 4.78 24.5 0.78 0.85 72%
0 MH41A MH42A 0.55 0.55 0 2.89 18 1175 0.00 0.00 0 0.000 0 0 0.1 1175 3.75 17.9 0.0 0.0 18.0 0.46 200 242.53 238.63 3.70 22.1 0.70 0.79 81%
0 MH42A MH48A 1.95 3.32 0 1.94 59 1262 0.00 0.00 0 0.000 0 0 0.8 1262 3.73 19.1 0.0 0.0 19.8 0.48 200 242.55 238.27 4.08 22.8 0.73 0.82 87%
0 MH48A MH5A 0.00 4.17 0 0 0 1290 0.00 0.00 0 0.000 0 0 1.0 1290 3.73 19.5 0.0 0.0 20.4 0.50 200 242.95 237.94 4.81 23.2 0.74 0.83 88%
0 MH5A MH4A 0.27 4.45 0 2.89 10 1300 0.00 0.00 0 0.000 0 0 1.0 1300 3.72 19.6 0.0 0.0 20.6 0.50 200 241.98 237.65 4.13 23.2 0.74 0.83 89%
0 MH15A MH14A 1.03 1.03 0 2.89 34 34 0.00 0.00 0 0.000 0 0 0.2 34 4.35 0.6 0.0 0.0 0.8 2.00 200 247.00 242.82 3.98 46.4 1.48 0.57 2%
0 MH14A MH13A 0.18 1.21 0 2.89 6 40 0.00 0.00 0 0.000 0 0 0.3 40 4.33 0.7 0.0 0.0 1.0 2.00 200 244.99 241.37 3.42 46.4 1.48 0.59 2%
0 MH16A MH13A 1.01 1.01 0 2.89 33 33 0.00 0.00 0 0.000 0 0 0.2 33 4.35 0.6 0.0 0.0 0.8 1.50 200 244.74 242.04 2.50 40.2 1.28 0.51 2%
0 MH13A MH12A 0.28 2.50 0 2.89 10 83 0.00 0.00 0 0.000 0 0 0.6 83 4.26 1.4 0.0 0.0 2.0 2.00 200 244.28 240.31 3.77 46.4 1.48 0.74 4%
0 MH12A MH4A 0.24 2.74 0 2.89 8 91 0.00 0.00 0 0.000 0 0 0.6 91 4.25 1.6 0.0 0.0 2.2 3.00 200 243.25 239.28 3.77 56.8 1.81 0.87 4%
0 MH4A MH3A 1.14 8.33 0 2.89 38 1429 0.00 0.00 0 0.000 0 0 1.9 1429 3.69 21.4 0.0 0.0 23.3 0.50 250 242.68 237.18 5.25 42.0 0.86 0.88 55%
0 MH45A MH3A 0.32 0.32 0 2.89 11 11 0.00 0.00 0 0.000 0 0 0.1 11 4.41 0.2 0.0 0.0 0.3 4.00 200 244.66 240.44 4.03 65.6 2.09 0.51 0%
0 MH3A MH2A 1.30 9.95 0 2.89 43 1483 0.00 0.00 0 0.000 0 0 2.3 1483 3.68 22.1 0.0 0.0 24.4 0.50 250 244.29 236.55 7.49 42.0 0.86 0.89 58%
0 MH2A MH1A 3.23 32.91 0 1.94 98 2219 0.00 0.00 0 0.000 0 0 7.6 2219 3.55 31.9 0.0 0.0 39.5 0.50 300 239.85 233.06 6.49 68.4 0.97 1.00 58%
0 0.00 0.00 0 0 0 0 0.00 0.00 0 0.000 0 0 0.0 0 0.00 0.0 0.0 0.0 0.0 0.00 0 0.0 0.00 0.00 0%
0 0.00 0.00 0 0 0 0 0.00 0.00 0 0.000 0 0 0.0 0 0.00 0.0 0.0 0.0 0.0 0.00 0 0.0 0.00 0.00 0%
0 0.00 0.00 0 0 0 0 0.00 0.00 0 0.000 0 0 0.0 0 0.00 0.0 0.0 0.0 0.0 0.00 0 0.0 0.00 0.00 0%
0 0.00 0.00 0 0 0 0 0.00 0.00 0 0.000 0 0 0.0 0 0.00 0.0 0.0 0.0 0.0 0.00 0 0.0 0.00 0.00 0%
0 0.00 0.00 0 0 0 0 0.00 0.00 0 0.000 0 0 0.0 0 0.00 0.0 0.0 0.0 0.0 0.00 0 0.0 0.00 0.00 0%
0 0.00 0.00 0 0 0 0 0.00 0.00 0 0.000 0 0 0.0 0 0.00 0.0 0.0 0.0 0.0 0.00 0 0.0 0.00 0.00 0%
0 0.00 0.00 0 0 0 0 0.00 0.00 0 0.000 0 0 0.0 0 0.00 0.0 0.0 0.0 0.0 0.00 0 0.0 0.00 0.00 0%
\\MONTY\Shared Work Areas\020165 � PARIS GRAND SUBDIVISION\Civil\7_DesignDocs\SANITARY\020165 � SAN � Design Sheet Final.xls:SAN

Appendix E
Downstream Sanitary Sewers – Summary Table and Constraint Maps
Ap
pen
dix E

PARIS SANITARY SEWER CAPACITY SANITARY SEWERS DOWNSTREAM OF PARIS GRAND SUBDIVISION
Street Name
Sanitary
Pipe No.
Current
From Utility
(New)
Utility
Type
To Utility
(New) Utility Type
Primary
Type of
Develop
Local
Pop
Total
Pop
Total
Pop
(1000's) Area (ha)
Total
Area (ha)
Peaking
Factor M
Actual
Peaking
Factor M
Peak
Design
Flow Q(d)
(L/s)
Peak
Design
Localized
(L/s)
Pipe
Diameter
(mm)
Length
(m) Grade (%) Grade Pipe Material
Pipe Area
(mm2)
Wetted
Perimeter
(mm)
Hydraulic
Radius (mm) Capacity (L/s)
Velocity
(m/s)
Is the Sewer
Sized
Properly?
# of
Services Year built
IMPACTED
SEWER BY NEW
SUBDIVISION?
1 GRAND RIVER ST. N. PRS0360 PRS1143 MH PRS1180 MH Inst 108.9 7928.8 7.93 1.75 143.68 3.40 3.40 262.04 3.19 600 94.60 0.17 0.00 PVC 282743.34 1884.96 150.00 253.20 0.90 No 2 1998 YES
2 GRAND RIVER ST. N. PRS0238 PRS1230 MH PRS1229 MH Com 41.1 9643.5 9.64 0.66 187.81 3.40 3.40 342.52 1.20 375 71.65 3.72 0.04 CONC 110446.62 1178.10 93.75 338.21 3.06 No 13 1963 YES
3 WILLIAM ST. PRS0262 PRS1229 MH PRS1928 MH Com 5.6 18212.8 18.21 0.09 368.21 3.40 3.40 671.52 0.16 675 31.10 0.35 0.00 CONC 357847.04 2120.58 168.75 497.36 1.39 No 0 1963 YES
4 WILLIAM ST. PRS0264 PRS1195 MH PRS1196 MH Res 14.8 18227.6 18.23 0.39 368.60 2.69 2.69 283.62 0.25 675 32.32 0.03 0.00 CONC 357847.04 2120.58 168.75 145.61 0.41 No 2 1963 YES
5 WILLIAM ST. PRS0265 PRS1196 MH PRS1194 MH Res 45.2 18272.8 18.27 1.19 369.79 2.69 2.69 284.31 0.77 675 117.38 0.07 0.00 CONC 357847.04 2120.58 168.75 222.43 0.62 No 9 1963 YES
6 WILLOW ST. PRS0290 PRS1192 MH PRS1197 MH Res 0.8 18845.6 18.85 0.02 383.10 2.68 2.68 292.59 0.01 675 30.18 0.12 0.00 AC 357847.04 2120.58 168.75 291.23 0.81 No 0 1963 YES
7 WILLOW ST. PRS0281 PRS1204 MH PRS1205 MH Res 42.6 19396.6 19.40 1.12 397.60 2.67 2.67 300.91 0.72 675 121.95 0.12 0.00 CONC 357847.04 2120.58 168.75 291.23 0.81 No 6 1963 YES
8 WILLOW ST. PRS0689 PRS1206 MH PRS3005 WSPS Res 8.7 19522.4 19.52 0.23 399.89 2.66 2.66 302.58 0.15 250 15.04 0.50 0.01 STEEL 49087.39 785.40 62.50 42.06 0.86 No 0 1963 YES
9 WILLOW ST. WSPS MH Res 13.3 19535.7 19.54 0.35 400.24 2.66 2.66 302.78 0.22 200 46.67 0.50 0.01 STEEL 31415.93 628.32 50.00 23.20 0.74 No 0 0 YES
10 BALL ST. PRS0038 PRS1277 MH PRS1278 MH Res 23.2 22552.6 22.55 0.61 475.00 2.60 2.60 346.80 0.38 675 82.01 0.15 0.00 CONC 357847.04 2120.58 168.75 325.60 0.91 No 0 1963 YES
11 BALL ST. PRS0035 PRS1304 MH PRS1305 MH Res 42.2 23481.3 23.48 1.11 499.44 2.58 2.58 360.54 0.70 675 146.65 0.16 0.00 CONC 357847.04 2120.58 168.75 336.28 0.94 No 0 0 YES
12 RACE ST. PRS0030 PRS1310 MH PRS1900 MH Res 27.7 24573.8 24.57 0.73 528.19 2.56 2.56 376.62 0.46 675 115.85 0.18 0.00 CONC 357847.04 2120.58 168.75 356.68 1.00 No 0 1963 YES
13 RACE ST. PRS0002 PRS1312 MH PRS1313 MH Res 25.8 25637.1 25.64 0.68 556.17 2.54 2.54 392.19 0.42 675 8.84 0.21 0.00 AC 357847.04 2120.58 168.75 385.26 1.08 No 0 1963 YES
14 RACE ST. PRS0001 PRS1313 MH PRS3004 WPCP Res 22.4 27184.8 27.18 0.59 589.43 2.52 2.52 413.02 0.36 675 65.00 0.22 0.00 CONC 357847.04 2120.58 168.75 394.32 1.10 No 0 1963 YES
LEGEND
Downstream sanitary sewers surcharged under both pre and post development conditions
Downstream sanitary sewers surcharged under post-development conditions only
NOTES:
1) Existing Sanitary Sewer Capacity information taken from the County of Brant Infrastructure Study, Paris-Sanitray Sewer Capacity - Existing Conditions - Table 2 (Rest Acres Active), Last Updated December 4, 2012.

EX
IS
TIN
G W
AS
TE
WA
TE
R
TR
EA
TM
EN
T P
LA
NT
250Ø SAN
EX
IT
SIN
G P
AR
IS
LIN
KS
R
OA
D S
EW
AG
E
PU
MP
IN
G S
TA
TIO
N
300Ø SAN
200Ø FM
600Ø SAN
600Ø SAN
200Ø SAN
600Ø SAN
200Ø
SA
N
200Ø SAN
250Ø SAN
600Ø SAN
600Ø SAN
375Ø SAN
250Ø SAN
200Ø SAN
375Ø SAN
200Ø
SA
N
250Ø SAN
375Ø SAN
EX
. W
IL
LO
W S
T.
SE
WA
GE
P
UM
P
ST
AT
IO
N
TWIN 400Ø FM
675Ø SAN
675Ø
SA
N
675Ø SAN
675Ø
SA
N
IN
VE
RT
ED
S
YP
HO
N U
ND
ER
G
RA
ND
R
IV
ER
:
1- 250Ø SAN & 2-400Ø CONCRETE ENCASED
250Ø SAN
250Ø SAN
200Ø SAN
200Ø SAN
675Ø SAN
675Ø SAN
675Ø SAN
675Ø SAN
200Ø SAN
675Ø
SA
N
200Ø
SA
N
675Ø
SA
N
SU
BJE
CT
LA
ND
S
300Ø
SA
N
250Ø SAN
FM
SU
BJE
CT
LA
ND
S
PR
S0
00
1
PR
S0
26
4
PR
S0
26
5
PR
S0
68
9
WS
PS
PR
S0
03
8
450Ø SAN
350Ø FM
EX
IS
TIN
G S
AN
F
M D
IS
CH
AR
GE
TO
E
X. S
AN
S
EW
ER
L
EG
PR
S0
43
3 A
T M
H P
RS
11
14
PR
S0
03
0
PR
S0
03
5
N
GO
LF
NO
RT
H P
RO
PE
RT
IE
S
PA
RIS
G
RA
ND
S
UB
DIV
IS
IO
N
SA
NIT
AR
Y S
EW
ER
C
ON
ST
RA
IN
T M
AP
(P
RE
-D
EV
ELO
PM
EN
T C
ON
DIT
IO
NS
)
TP
H
NT
S020165
FJB
JA
N 2013
Scale
Project N
o.
Figure N
o.
Figure T
itle
Draw
nC
lient
File Name: 020165_APPEND E-1 (PRE DEV SAN CONSTRAINTS).dwg Date Plotted: January 25, 2013 - 9:42 AM
Checked
Date
AP
PE
ND
IX
E-1
SU
BJE
CT
P
RO
PE
RT
Y
PR
S0
03
8
NO
TE
S:
1) A
PP
RO
XIM
AT
E LA
YO
UT
E
XIS
TIN
G S
AN
IT
AR
Y S
EW
ER
S
YS
TE
M D
EV
ELO
PE
D F
RO
M V
AR
IO
US
PLA
N &
P
RO
FILE
D
RA
WIN
GS
P
RO
VID
ED
B
Y T
HE
C
OU
NT
Y O
F B
RA
NT
.
2) E
XIS
TIN
G S
AN
IT
AR
Y S
EW
ER
C
AP
AC
IT
Y IN
FO
RM
AT
IO
N T
AK
EN
F
RO
M T
HE
C
OU
NT
Y O
F
BR
AN
T IN
FR
AS
TR
UC
TU
RE
S
TU
DY
, P
AR
IS
- S
AN
IT
AR
Y S
EW
ER
C
AP
AC
IT
Y - E
XIS
TIN
G
CO
ND
IT
IO
NS
- T
AB
LE
2 (R
ES
T A
CR
ES
A
CT
IV
E), LA
ST
U
PD
AT
ED
D
EC
EM
BE
R 4, 2012.

EX
IS
TIN
G W
AS
TE
WA
TE
R
TR
EA
TM
EN
T P
LA
NT
250Ø SAN
EX
IT
SIN
G P
AR
IS
LIN
KS
R
OA
D S
EW
AG
E
PU
MP
IN
G S
TA
TIO
N
(D
EC
OM
MIS
SIO
NE
D)
300Ø SAN
200Ø FM
600Ø SAN
600Ø SAN
200Ø SAN
600Ø SAN
200Ø
SA
N
200Ø SAN
250Ø SAN
600Ø SAN
600Ø SAN
375Ø SAN
250Ø SAN
200Ø SAN
375Ø SAN
200Ø
SA
N
250Ø SAN
375Ø SAN
EX
. W
IL
LO
W S
T.
SE
WA
GE
P
UM
P
ST
AT
IO
N
TWIN 400Ø FM
675Ø SAN
675Ø
SA
N
675Ø SAN
675Ø
SA
N
IN
VE
RT
ED
S
YP
HO
N U
ND
ER
G
RA
ND
R
IV
ER
:
1- 250Ø SAN & 2-400Ø CONCRETE ENCASED
250Ø SAN
250Ø SAN
200Ø SAN
200Ø SAN
675Ø SAN
675Ø SAN
675Ø SAN
675Ø SAN
200Ø SAN
675Ø
SA
N
200Ø
SA
N
675Ø
SA
N
SU
BJE
CT
LA
ND
S
300Ø
SA
N
250Ø SAN
FM
SU
BJE
CT
LA
ND
S
PR
S0
26
4
PR
S0
26
5
PR
S0
29
0
PR
S0
68
9
WS
PS
PR
S0
23
8
PR
S0
36
0
450Ø SAN
350Ø FM
EX
IS
TIN
G S
AN
F
M D
IS
CH
AR
GE
TO
E
X. S
AN
S
EW
ER
L
EG
PR
S0
43
3 A
T M
H P
RS
11
14
PR
OP
OS
ED
S
EW
AG
E
PU
MP
IN
G S
TA
TIO
N
PR
S0
26
2
PR
S0
28
1
PR
S0
00
2
PR
S0
00
1
PR
S0
03
8
PR
S0
03
0
PR
S0
03
5
N
GO
LF
NO
RT
H P
RO
PE
RT
IE
S
PA
RIS
G
RA
ND
S
UB
DIV
IS
IO
N
SA
NIT
AR
Y S
EW
ER
C
ON
ST
RA
IN
T M
AP
(P
OS
T-D
EV
ELO
PM
EN
T C
ON
DIT
IO
NS
)
TP
H
NT
S020165
FJB
JA
N 2013
Scale
Project N
o.
Figure N
o.
Figure T
itle
Draw
nC
lient
File Name: 020165_APPEND E-2 (POST SAN CONSTRAINTS).dwg Date Plotted: January 25, 2013 - 9:44 AM
Checked
Date
AP
PE
ND
IX
E-2
SU
BJE
CT
P
RO
PE
RT
Y
PR
S0
03
8
NO
TE
S:
1) A
PP
RO
XIM
AT
E LA
YO
UT
E
XIS
TIN
G S
AN
IT
AR
Y S
EW
ER
S
YS
TE
M D
EV
ELO
PE
D F
RO
M V
AR
IO
US
PLA
N &
P
RO
FILE
D
RA
WIN
GS
P
RO
VID
ED
B
Y T
HE
C
OU
NT
Y O
F B
RA
NT
.
2) E
XIS
TIN
G S
AN
IT
AR
Y S
EW
ER
C
AP
AC
IT
Y IN
FO
RM
AT
IO
N T
AK
EN
F
RO
M T
HE
C
OU
NT
Y O
F
BR
AN
T IN
FR
AS
TR
UC
TU
RE
S
TU
DY
, P
AR
IS
- S
AN
IT
AR
Y S
EW
ER
C
AP
AC
IT
Y - E
XIS
TIN
G
CO
ND
IT
IO
NS
- T
AB
LE
2 (R
ES
T A
CR
ES
A
CT
IV
E), LA
ST
U
PD
AT
ED
D
EC
EM
BE
R 4, 2012.

Appendix F
Sanitary Pumping Station Rationale and Preliminary Design Brief
Ap
pen
dix F

Project No. PGD020165
Date: 5-Nov-13
Project: Paris Grand Subdivision SPS
Peak Flow: 50.2 L/sMax Flow to
Sewer: 26.5 L/s
1 General (Mob, Demob, etc.) 1 LS $100,000 $100,000
2 Excavation, Site Preparation, Shoring, Backfill 2,000 cum $20.00 $40,000
3 Concrete (Wet and Dry Well, EQ Tank) 1 LS $472,000 $472,000
4 Pumps and Controls 1 LS $100,000 $100,000
5 Process Piping 1 LS $250,000 $250,000
6 Valves (Supply and Install) 1 LS $125,000 $125,000
7 Electrical Power and Controls 1 LS $300,000 $300,000
8 Genset 1 LS $100,000 $100,000
9
Aeration in EQ Tank (Blowers, Air Piping, Diffuers,
Installation) 1 LS $125,000 $125,000
10 Control Building 50 sqm $1,500 $75,000
11
Import and Place Granulars (under tanks, pipe
bedding) 150 cum $50 $7,500
12 Restoration 1 LS $25,000 $25,000
Subtotal $1,719,500
Contingencies 30 % $516,000
TOTAL: $2,235,500
PRELIMINARY CONSTRUCTION COST ESTIMATE
TOTAL ITEM NO. DESCRIPTION QUANTITY UNIT UNIT PRICE
R. J. Burnside & Associates Limited

�������� ������������� ���������������������������������������������������������������
������������������������� ������ � ���!"!#$%������&�'�(��)*+�)��#,#!"%�����������������������������-.!!�����/����
��� ��������������������������������������� �����&���������������������������������������������0���&������������������������������0��1��������0���� 2���������-3������������ ������/������������ �����&��������1������������������-���/��0����������1����1���������0���&��������������������������������������� �4�������50���&����������1���������������#67$8����������������,�!���-#!9/�����������������1���1�����:������1��0��1���� ����� �����1�����������50�����������0�����1����1�����������&��������0������������ �4�����8�2�����������������������������;���0�������"!!�����������������������50���&�����������������������������<����������8����0������������1����������0������������50�����������1�������0����������0�����������������������0��0��������������0�������8����1��������0����������1������������������������������� ���0��<������������8��0���&�����������������������������&��������,,� =���>���������&�����������������0�8��0�������#�������������������,,7�7�0����8��������"�������������������,,%�6�0������50�������8��0������������������1�������0������������������������&��������",!��,=����3�������0����0�����������&��������0��������0����������������������1�������1� �������0���������������� ��������������������������� 50���������1�������1��1�������������������0��<������������9���������������)��������������8�10��0���������������1����,%!� =������8��������������������1�������!�",� =������0�������������������������� ������ ����������� �������������
��������� ��! ���"������
����������#���������
$% !
���&��� $% !
�� ������ $% !
� � � � � �3���������� ����<���4� #.�!##� .7%� #�6� 7�7� #!�6�� � � � � �)���������� ����<���4� #7�"%#� %?$� "�.� 6�.� #,�,�� � � � � ������� ����� �� ��� ��� �����50���������1�������1�����������0���&����������������1�����4��������0��<�����������������������1���<����������������-"!##/����

�������� '������������ ���������������������������������������������������������������
������������������������� ������ � ���!"!#$%������&�'�(��)*+�)��#,#!"%�����������������������������-.!!�����/����
�����'���������� ������ ��������� �����"����� ���
���� ��! ���"������
����������#������
��� $% !
���&��� $% !
�� ������ $% !
)&������������� "7�?$� ##$!� %�.� "!�"� "$�%������� ����������������������������������0�8��0��������������������1�����������:������������������������������1����1���������0����������������������������@�������������������0���&����������1���������������������������0��������������A�1����8����1���������������1���������� ����:����������������������0��1����1�����������0������������������������0���&���������8����0��<�����1�����0��0�����1��������������������������8������������������������0���������������������0���&���������8����1��������0����������0��������������8����1���� ��������������������������1�������������������������� ��0��0���&���������������������������������������������������������� ���0��<������������8����������������0����0��������0�������������������0���������������������������0���&��������������������������������1�����������0���� 2����������@�����������0�����������������- ����0���/�����������������������������0���1������������������������0�����0�������������������0������ �������0���&��������������1���50�������8��0�������������1���������� ���0�����������������������������0����&���� �����0������� ������+������������������0������������ ������8��0�������1����������1���������������>�����#�B�C�������0��������������1���������1����0��������� 2�����������0��������50����������������������������0���&����������������1�����������1�����������0���� 2��������������0���1������:��������������������������������������0�������@��������0����:�������������1���� �����0���1��1�����8�10�����0���������������������������0���������0��0���������������������8�10��0�1������4��������������0������������������A�1����8�����������������0������������������������������������������ �������4���������������0����:�������������0�����������>�����"�B�����������1��:����D�����������1���1�����������������8�1��0�������1�����������������0���������������0�������������1�����+�����������������0�������������:����D���������������:����8�������������1���������������������1�0�������0������0���&�������� ������8���������1�0�������0������0���������������������50��������������������1��������������1���0��������������5� ���'#��>�����1�1�������������"$�%� =�8�������������1����1������������� �����0������1��������������������0���������0������������1������������������������0��"$�%� =���50��������������������0�������1�������������E�

�������� (������������ ���������������������������������������������������������������
������������������������� ������ � ���!"!#$%������&�'�(��)*+�)��#,#!"%�����������������������������-.!!�����/����
�•� '��1�����0�������������1����������������"$�%� =��•� +���������1�������0����������������������� �������0�������������1���0���
���18�1��0������4�1���1���0������1�������������&��������".�0�������•� +���������1�������0���&�������� ���������� �����������������1���0������18�
1��0������4�1���1���0������1���������������������50������ �������0������������������������������0����������0����������������������������1��0��0���1������������
���������0�����������8��0����&�������:����������������������������&��������$$!��,8� �������0�������� ����(������ ����������.!!�������'����0����#�����-������1���������� ����<���4�1��0���������������������.7%�������/8��0����:����������������������������&��������#7!��,��50��������������0�����������������0�1���'�������'#���'"���<�����������0�����������������������������0����#�1��������������������������������������������������0������1������4���������������������0��������������� �������� ����(���8����1��������0��������0�����������������1�������1������������������� ��������0��������������- ���������������0���&�������������������/8����������������������������0����:����������������0������50����������:����D�������������1�������������������&��������#?!��,8�10��0�1������:���������4������&��������6������8�%���1�����.�������������������1�����0����������0�����1��:����D�������4������ ���������8����0�����1��:����D���������������:����������0���� ��������������������������������������������������'�����������&�����8��0������������4������ �������������0�������������0��������#?!��,����08�10��0�1����������������������7"!��,����������"������������)�����������$���"����*������ +�������������������0��������������1�������0���1����8��0���������1������:������������������������0���������������������������������0���&�������������������0���� ����������������������8����1��������0�������������D������0���������������8��0�������������������������� ��������1���1���=���1������������������0���������50�������������������� ����� ��������������������� ������0�������������50��������������1���� ���:������1��0��1��*���� ���'��:�����������-*'�/�������������1�������1���� ����:��������0�����0�����������50���������������1���� �����0��0���10���0�����1����������������������1�������&������"$�%� =�8����1�1���� �����������������(��������������4�����������������������30���0�����������0��1���1���������1���8����1�������0������������4�1�������� ��4������0��1���1���������������������������

�������� +������������ ���������������������������������������������������������������
������������������������� ������ � ���!"!#$%������&�'�(��)*+�)��#,#!"%�����������������������������-.!!�����/����
���������������������0��������������������0�1���'������',�-�������1/���'������'.�-�����������1/�����"��������,������������� •� )���������0������������������1��0��������������������������1���������1���
�0������������D��•� <�����������1���1������������������������������0��������������������•� �������������0���&��������1�����������������������������0�����1������0��
�1���1�������������������•� ����������0��������1�������0����1����������������������0��������������������0��
�1���������1���-"$�%� =�/�•� ����������1��:����D������������1�����������0��"$�%� =�8� ������������������(����
����������4��50�������������������1���� �������������0�����0����8�1��0�#?!��,����0����������0���8�������������#?!��,������0�����0���0������ ��:�����0����8������10���0�����1��1�������
���
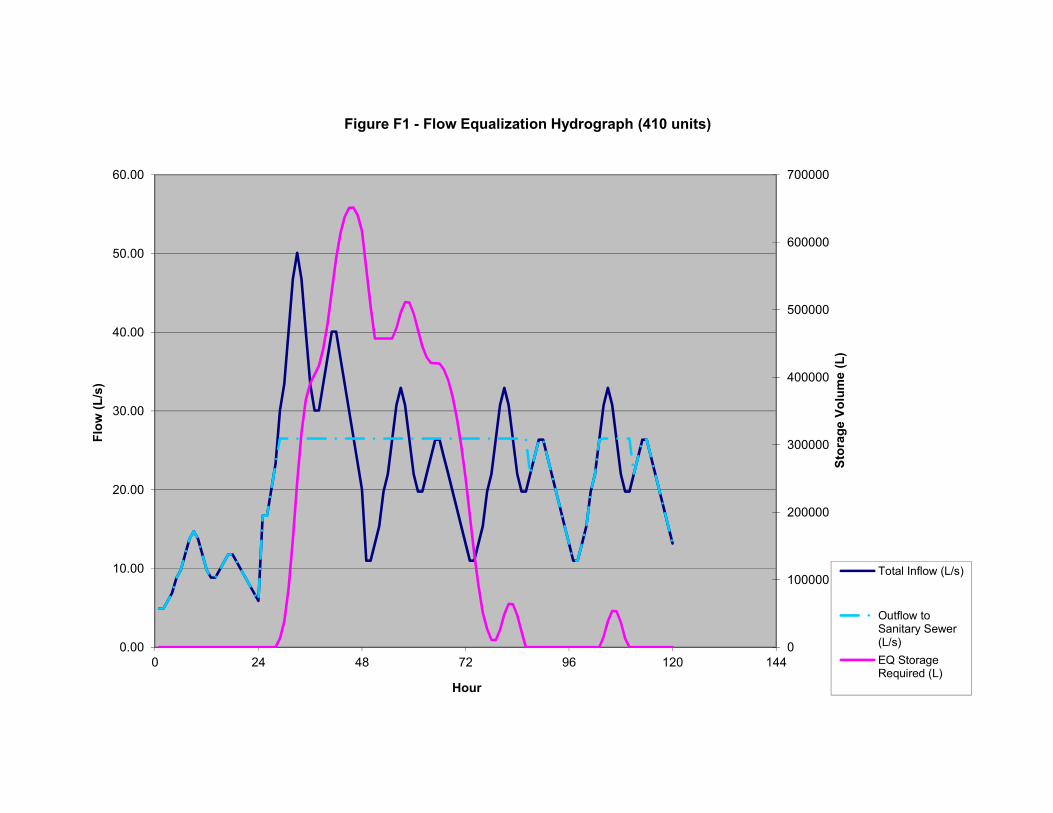
0
100000
200000
300000
400000
500000
600000
700000
0.00
10.00
20.00
30.00
40.00
50.00
60.00
0 24 48 72 96 120 144
Storage Volume (L)
Flow (L/s)
Hour
Figure F1 - Flow Equalization Hydrograph (410 units)
Total Inflow (L/s)
Outflow toSanitary Sewer(L/s)
EQ StorageRequired (L)
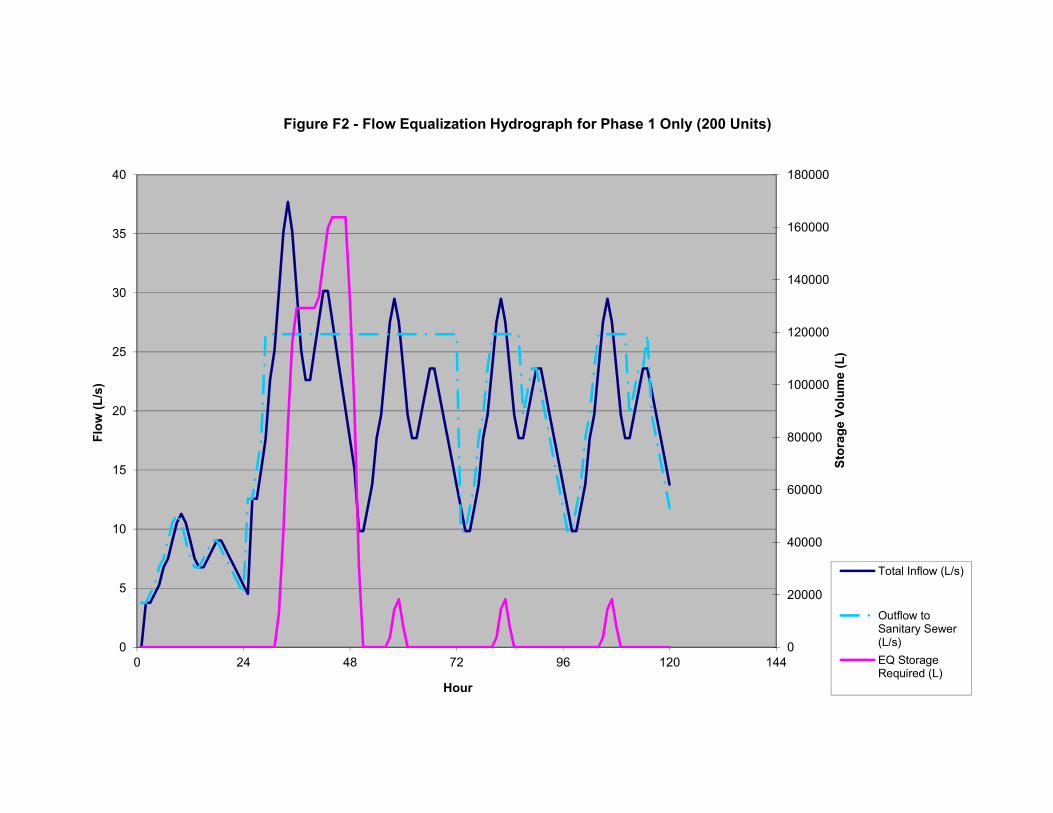
0
20000
40000
60000
80000
100000
120000
140000
160000
180000
0
5
10
15
20
25
30
35
40
0 24 48 72 96 120 144
Sto
rage V
olu
me (L)
Flo
w (L/s
)
Hour
Figure F2 - Flow Equalization Hydrograph for Phase 1 Only (200 Units)
Total Inflow (L/s)
Outflow toSanitary Sewer(L/s)
EQ StorageRequired (L)


Appendix G
Preliminary Water Demand Calculations and Additional Background
Ap
pen
dix G

WATER DEMAND
Design Parameters
Average Daily Demand per capita 350 L/cap per day
Maximum Daily Demand Factor 2.75
Maximum Hourly Demand Factor (Residential) 4.00
Maximum Low Density Residential Units 300 units
Maximum Medium Density Residential Units 100 units
Persons Per Unit - Low Density Residential 2.89 persons
Persons Per Unit - Medium Density Residential 1.94 persons
Design Spec. Source: County of Brant Development and Engineering Standards, Section 18 - Watermains, March 2013.
Based on GSP Draft Plan - March 11, 2013
DESCRIPTION
LOW RES MED RES ROW NON-RES SWM BLOCKS OPEN SPACE BLOCKS TOTAL TOTAL LOW RES MED RES TOTAL
AVG
DEMAND
MAX DAY
DEMAND
MAX
HOUR
DEMAND
BLOCKS BLOCKS BLOCKS BLOCKS (NOT INCLUDED) (NOT INCLUDED) PROPERTY INFILTRATION AREA BLOCKS BLOCKS (l/s) (l/s) (l/s)
(ha) (ha) (ha) (ha) (ha) (ha) (ha) (ha) (persons) (persons) (persons)
West Of Gilbert Creek 6.828 4.738 2.393 0.052 1.616 19.669 35.296 14.011 331 143 475 1.9 5.3 7.7
STREET A
East of Gilbert Creek 11.036 1.679 3.993 0.543 1.869 5.206 24.326 17.251 536 51 586 2.4 6.5 9.5
STREET B
STREET C
STREET D
STREET E
STREET F
TOTAL 17.864 6.417 6.386 0.595 3.485 24.875 59.622 31.262 867 194 1061 4.3 11.8 17.2
LAND USE AREAS POPULATIONS Water Demands
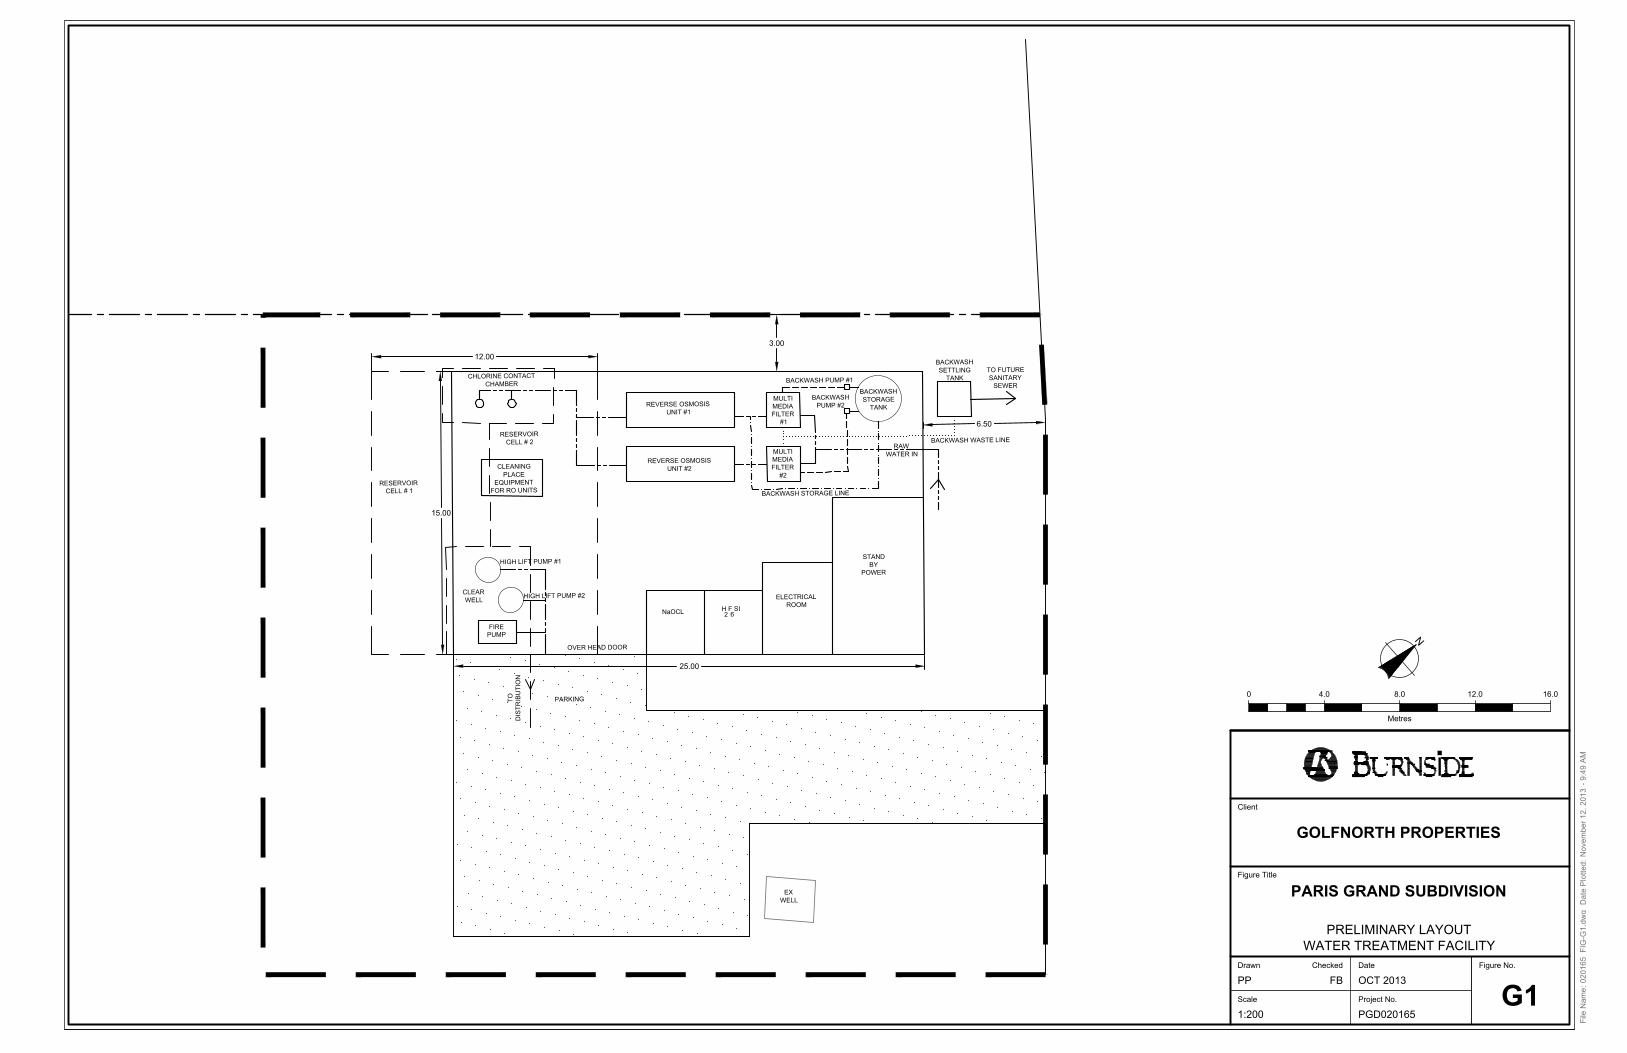
BACKWASH
SETTLING
TANK
MULTI
MEDIA
FILTER
#1
RAW
WATER IN
STAND
BY
POWER
ELECTRICAL
ROOM
H F SI
NaOCL
62
REVERSE OSMOSIS
UNIT #1
CLEANING
PLACE
EQUIPMENT
FOR RO UNITS
HIGH LIFT PUMP #1
FIRE
PUMP
PARKING
3.00
6.50
25.00
15.00
12.00
RESERVOIR
CELL # 1
EX
WELL
CHLORINE CONTACT
CHAMBER
RESERVOIR
CELL # 2
CLEAR
WELL
TO
DIS
TR
IB
UT
IO
N
TO FUTURE
SANITARY
SEWER
BACKWASH WASTE LINE
BACKWASH STORAGE LINE
BACKWASH
STORAGE
TANK
BACKWASH PUMP #1
BACKWASH
PUMP #2
MULTI
MEDIA
FILTER
#2
REVERSE OSMOSIS
UNIT #2
HIGH LIFT PUMP #2
OVER HEAD DOOR
N
File
N
am
e: 0
20
16
5_
FIG
-G
1.d
wg
D
ate
P
lo
tte
d: N
ove
mb
er 1
2, 2
01
3 - 9
:4
9 A
M
Scale Project No.
Figure No.
Figure Title
Drawn
Client
Checked Date
GOLFNORTH PROPERTIES
PARIS GRAND SUBDIVISION
PRELIMINARY LAYOUT
WATER TREATMENT FACILITY
PP
1:200 PGD020165
G1
OCT 2013FB
0 16.04.0 8.0 12.0
Metres

PRELIMINARY CONSTRUCTION COST ESTIMATER. J. Burnside & Associates Limited
Project: Paris Grand Subdivision SPS
Project No. PGD020165 Date: 1-Nov-13
Treatment sized for 960 m³/day
(Includes Fire Storage Reservoir)
CAPITAL
Item Unit Units Cost per unit Price Comment
Well Pump LS 2 30,000$ 60,000$ Prorated from Tenders
Yard Piping m 150 450$ 67,500$ Estimate
Building (including electrical, mechanical, etc.) m² 400 2,000$ 800,000$ Estimate
R/O Treatment LS 1 510,000$ 510,000$ GE
Pre-treatment/CIP LS 1 117,200$ 117,200$ Pro Aqua
Reservoir/clearwell LS 1 273,000$ 273,000$ Estimate
Standby Power LS 1 75,000$ 75,000$ LCC
Fire Pump LS 1 40,000$ 40,000$ LCC
High Lift Pumps ea 2 20,000$ 40,000$ Prorated from Tenders
VFDs ea 2 15,000$ 30,000$ Prorated from Tenders
Sodium Hypochlorite systems (Pre, post, tanks) LS 1 24,800$ 24,800$ Metcon
Hydrofluosilicic acid system (pumps, tanks) LS 1 12,400$ 12,400$ Estimate
SCADA system LS 1 60,000$ 60,000$ LCC
Process Piping Allowance LS 1 130,000$ 130,000$ Estimate
Excavation/backfill LS 1 3,400$ 3,400$ Estimate
Instrumentation and control allowance LS 1 100,000$ 100,000$ Estimate
Total cost 2,343,300$
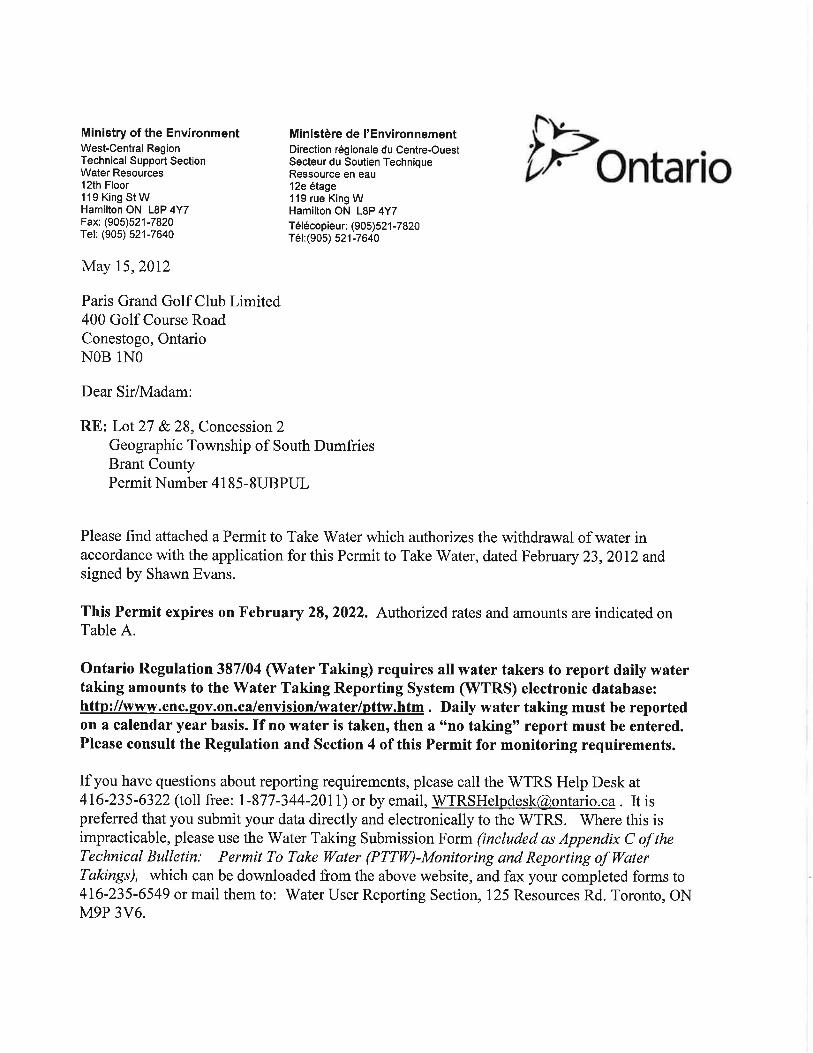


County of Brant, Public Works Department
Grand Paris Golf Hydraulic Analysis andField Testing – Final Report

AECOM
105 Commerce Valley Drive West, Floor 7 905 886 7022 tel
Markham, ON, Canada L3T 7W3 905 886 9494 fax
www.aecom.com
RPT-2013-07-15 Grand Paris Golf Hydraulic Analysis FINAL Report-60158239.docx
July 15, 2013
Mr. Don CunninghamDevelopment TechnologistCounty of Brant – Development Services Department66 Grand River Street NorthParis, ONN3L 2M2
Dear Sir;
Regarding: Hydraulic Modelling Analysis and Fire Hydrant Testing for Grand Paris GolfClub, Paris, Ontario.
This letter report summarizes the assumptions, conditions, and findings of the hydraulic analysis forthe Paris Grand Golf Club development and the results of the hydrant flow testing within developmentto support hydraulic modeling results.
The scope of work included updating the hydraulic model to reflect the proposed development withinGrand Paris Golf Club, incorporating the demands as provided by R.J. Burnside & AssociatesLimited, conducting field testing to validate the modeling results, undertaking hydraulic modelinganalysis, and summarizing and submitting a technical report including findings and recommendations.The present technical report aims to include all the assignments identified in the original scope ofwork.
Figure 1 shows the location and details of the proposed development. Ground elevations wereprovided along Paris Links Road and the intersection of the local roads. Modeling junctions wereadded at these intersections and ground elevations were included as per information provided. Figure1 also shows the modeling junction IDs corresponding to the street intersections. These modelingjunctions IDs can be referenced thereafter in the modeling results section.

Page 2July 15, 2013
Figure 1 Proposed Grand Paris Golf Club Development
Water Demands
Water demands were provided by R.J. Burnside & Associates Limited and updated in the hydraulicmodel. These demands are summarized in Table 1.
Table 1 Summary of Water Demands and Fire Flow Requirements
Node ID Elevation (m) ADD (L/s) MDD (L/s) PHD (L/s) Fire FlowNeeded (L/s)
J-573 242.00 1.15 3.15 4.55 38J-574 243.80 0.30 0.80 1.15 38WN-04520 240.77 0.85 2.35 3.40 38WN-00417 237.65 1.35 3.70 5.35 38WN-00418 240.85 1.35 3.70 5.35 38

Page 3July 15, 2013
Hydraulic Model Results
Analyses were conducted using a number of demand conditions and fire flow requirements. Themodel was run under average daily demand (ADD), maximum daily demand (MDD), and peak hourlydemand (PHD) conditions, as well as for MDD plus fire flow (FF). A fire flow requirement of 38 L/swas provided by RJ Burnside for the analysis.
Table 2 shows the summary of modeling results with respect to system pressure. The resultsindicated that pressure would fluctuate between 75 and 105 Psi, slightly higher than therecommended maximum pressure of 100 Psi. Ground elevations within the development were notprovided, only along Paris Links Road. Depending on the final grading for the lots of the proposeddevelopment, there could be a need for installing individual property pressure reducing valves toregulate pressure to acceptable levels.
Table 2 Summary of Modeling Results
Node IDMin.
PressureADD (Psi)
Max.PressureADD (Psi)
Min.Pressure
MDD (Psi)
Max.Pressure
MDD (Psi)
Min.PressurePHD (Psi)
Max.PressurePHD (Psi)
J-573 97.5 98.4 83.8 96.5 77.2 77.2J-574 95.0 96.0 81.3 94.0 74.8 74.8WN-04520 99.4 100.4 85.9 98.4 79.4 79.4WN-00417 103.9 104.9 90.4 102.9 83.9 83.9WN-00418 99.4 100.4 86.0 98.4 79.6 79.6
Fire flow simulations were conducted along Paris Links Road at the entrance of the development.These results are summarized in Table 3. The minimum fire flow available under MDD plus fire flowconditions is 180 L/s, well above the required 38 L/s. This flow is obtained while simultaneouslymaintaining 20 Psi pressure or higher in any location within the pressure zone.
Table 3 Summary of Fire Flow Results
Node ID Elevation(m)
Satisfies FireFlow
Constraints?
Fire Flow(Needed)
(L/s)
Fire Flow(Available)
(L/s)
Pressure(Residual Lower
Limit) (psi)
Pressure (CalculatedResidual @ Total
Flow Needed) (psi)
J-573 242 TRUE 38 179.75 20 84.7
J-574 243.8 TRUE 38 180.72 20 82.2
WN-04520 240.77 TRUE 38 182.95 20 86.6
WN-00417 237.65 TRUE 38 183.61 20 91.1
WN-00418 240.85 TRUE 38 184.44 20 86.6

Page 4July 15, 2013
Fire Hydrant Testing
AECOM completed hydrant flow testing within the Paris Links Road for model validation purposes.Four tests were undertaken to support the validation of the modeling results. The modeling resultswere reasonably close to those results obtained during the field testing in spite of the fact thatpotentially there were differences in system demands and boundary conditions.
Requirements
Hydrant flow testing was conducted in accordance with National Fire Protection Association (NFPA)291 and American Water Works Association (AWWA) M17. NFPA 291 recommends a pressure dropof at least 25% from static to residual pressure during the test. AWWA M17 recommends a drop of atleast 10 psi from static to residual pressure. These requirements were targeted while conducting thefield testing.
If the requirements of the pressure drop were not met with a single hydrant port, a second port wasopened. If the pressure drop was not obtained during the testing, the hydrant set-up was re-arrangedto incorporate the use of a second hydrant to aid in dropping the pressure during the testing toacceptable levels.
Field Testing Program
For the hydrant flow testing program, the following procedures and considerations were followed:
1. Specific flow and residual pressure hydrants were selected for each test that were consideredaccessible, in good working order and could be safely flow used without damage or disruption.
2. Each test was planned in detail beforehand to determine specific hydrant and valve use andoperation.
3. A meeting with the County’s Operations Staff was conducted before the testing to review theproposed testing program.
4. Field testing was conducted by AECOM with support of a field crew from the Countyexperienced in flow testing.
5. Pitotless Nozzles of various diameters were used. Little Hose Monster units, gate valves, anddischarge flow-rate gauges with remote readers were also utilized. Each of the other hydrants(pressure hydrants) was fitted with a digital pressure gauge and a logger that recorded pressureevery 10 seconds. The Little Hose Monster allowed the flow to be directed away to the curb avoidingwater damage to landscaping adjacent to the hydrants.
6. Dechlor Demon units were used for dechlorinating discharge water while flow testing withoutaffecting flow-rate measurements. Sodium sulfite dechlorination tablets and Hach test strips, 10pmmCI were used for dechlorinating discharge water and verification of concentrations.

Page 5July 15, 2013
7. Data from the field tests was recorded on customized data forms prepared beforehand. Theforms included details on hydrant ID, flow and residual hydrants, street and closest cross-streetname, residual pressure, static pressure, and flows.
8. SCADA data was obtained for the entire test period and used to compare field testing results.This information was used in conjunction with the field testing data to validate the hydraulic modelingresults.
Field Testing Results
The original plan was to undertake two (2) fire hydrant tests but four (4) were completed as there wassufficient time and all the equipment was readily available. Details of the tests and results aresummarized in Table 4. Maps of the locations of the tests are provided in Appendix A. Recording logsand calculation sheets are provided in Appendix B.
Table 4 Field Testing Results
Test ID LocationQ min @ 20 psi
(L/s)Pressure Drop
(%)
Test 1-A Paris Links Road 159.8 40.9
Test 1-B Paris Links Road 150.2 36.1
Test 2-A Paris Links Road 205.6 18.4
Test 2-B Paris Links Road 193.3 21.2
Appendix C shows pressure logger data recorded simultaneously while performing the testing.Appendix D shows some photos taken during the tests.
Validating Hydraulic Model with Field Testing Results
The results of the field testing validate the results obtained from the hydraulic model, as these werereally close, in spite of the fact that the boundary conditions (i.e. system demand in pressure zone 1,Telfer BS, and Gilbert BS) may have been different.
Conclusions
The field results confirmed the adequacy and validity of the hydraulic model as the modelingresults reasonably match the field testing results.
There is sufficient fire flow capacity in the system for the Grand Paris Golf Club proposeddevelopment.

Page 6July 15, 2013
Most of the pressures were observed to be within acceptable limits with the exception ofsome values especially for ADD conditions. These pressure values were in excess of 100Psi, which is the recommended maximum pressure.
Based on the final grading for the lots of the proposed development, there could be a need ofinstalling pressure reducing valves to regulate pressure to acceptable levels.
Should you have any questions or require any further information, please feel free to contact FreddyBaron on 905 747 7415 at your convenience.
Very truly yours,AECOM Canada Ltd.
Freddy Baron, P.Eng.Project Engineer
Appendix A
Appendix A
Location of Fire Hydrant Tests

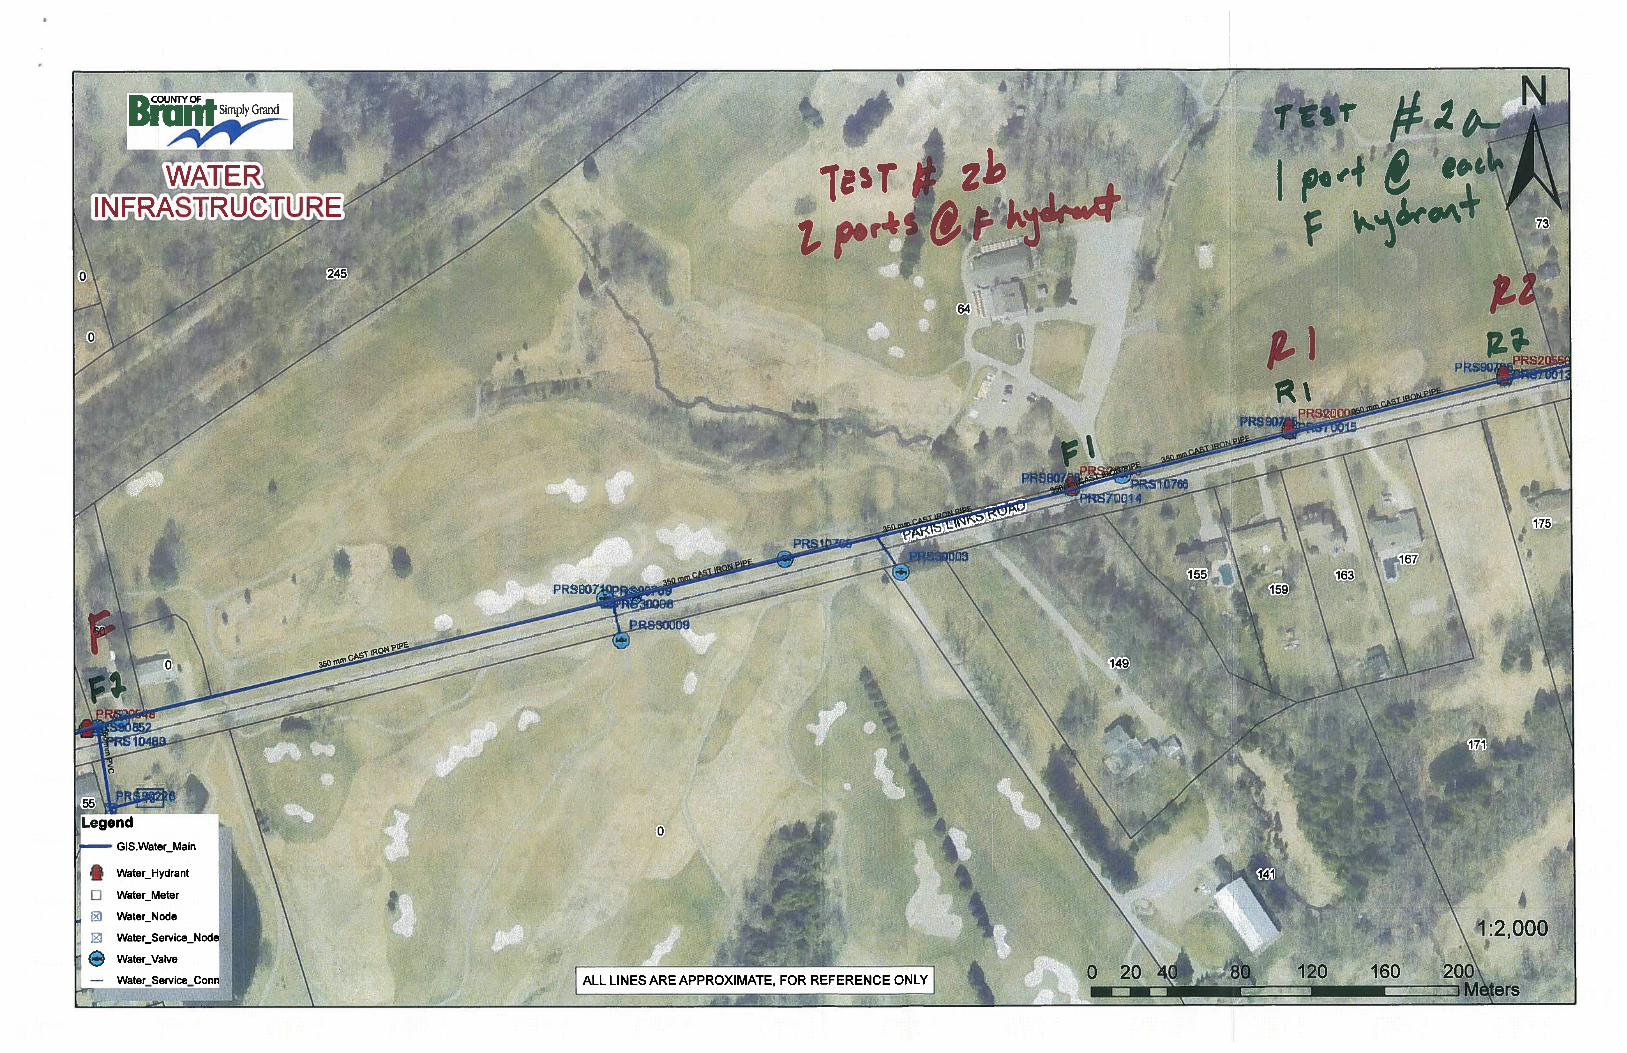

Appendix B
Appendix B
Field Logs – Fire Hydrant Tests

Hydrant Test Calculation Sheet
Project:
Owner: Date: 5/15/2013
Test Number: Time: 9:15 AM
Location: Field Crew: CA, AP
ID
Pipe Diameter (mm) 350
Pipe Material CI
Inches Inches
Static -- -- 0 92 89 0.0
hydrants 1 / 2 2" 2" 35 31 1796 54.8 52.7 113.1
2 0 0.0
3 0 0.0
4 0 0.0
5 0 0.0
6 0 0.0
R1 R2 F Flow @ 20 psi R1 R2
Hydrant Elevation (m) 241.00 242.00 238.00 P (psi) 20.0 20.0
Hydrant Spigot Elevation1 (m) 0.00 0.00 Q^1.852 12240.8 12052.6
Static Pressures (psi) 92.30 89.10 Q (L/s) 161.2 159.8
Hydraulic Grade Line (m) 306.00 304.74 12052.6
Pressure Drop (%) 40.6% 40.9% 159.8
1. If hydrant elevation is actually ground elevation, measure this.
2. Q^1.852 is used to determine a more accurate approximation of the extrapolated available flow at 20 psi residual pressure. (Haestad, et al., 2004)
Field Test Schematic
Field Notes:
Flowed Hydrant (F2): Paris Links Road
R2 (psi) L/s
Q ^1.852 min (@20 psi)
Residual Hydrant (R1): Paris Links Road
Residual Hydrant (R2): Paris Links Road
Address
- Main PS active- 1 (one) PS east of our location was also active
Grand Paris Golf Club
County of Brant
1 - aCounty of Brant
Flowed Hydrant (F1): Paris Links Road
Q min (@ 20 psi) (L/s)
TEST No.Nozzles Used
Pitot 1 Pitot 2 U.S.G.P.M. R1 (psi)
y = -0.0059x + 92.3R² = 1
y = -0.0057x + 89.1R² = 1
0
10
20
30
40
50
60
70
80
90
100
0 2000 4000 6000 8000 10000 12000 14000
Re
sid
ua
l Pre
ss
ure
(p
si)
Q^1.852 (l/s)
R1 (psi)
R2 (psi)
Q ^1.852 min (@20 psi)
Linear (R1 (psi))
Linear (R2 (psi))
Golf
R1F1R2 F2
Paris Links Road

Hydrant Test Calculation Sheet
Project:
Owner: Date: 5/15/2013
Test Number: Time: 9:30 AM
Location: Field Crew: CA, AP
ID
Pipe Diameter (mm) 350
Pipe Material CI
Inches Inches
Static -- -- 0 93 0 0.0
hydrant 1 2" 0 30 856 73.4 53.9
2 2" 2" 25 25 1564 59.4 98.4
3 0 0.0
4 0 0.0
5 0 0.0
6 0 0.0
R1 R2 F Flow @ 20 psi R1 R2
Hydrant Elevation (m) 241.00 242.00 238.00 P (psi) 20.0 20.0
Hydrant Spigot Elevation1 (m) 0.00 0.00 Q^1.852 10740.4 #DIV/0!
Static Pressures (psi) 93.00 Q (L/s) 150.2 #DIV/0!
Hydraulic Grade Line (m) 306.49 242.00 10740.4
Pressure Drop (%) 36.1% #DIV/0! 150.2
1. If hydrant elevation is actually ground elevation, measure this.
2. Q^1.852 is used to determine a more accurate approximation of the extrapolated available flow at 20 psi residual pressure. (Haestad, et al., 2004)
Field Test Schematic
Field Notes:
Pitot 1 Pitot 2 U.S.G.P.M. R1 (psi) R2 (psi)
Residual Hydrant (R1): Paris Links Road
Residual Hydrant (R2): Paris Links Road
Address
- Main PS active- 1 (one) PS east of our location was also active
Grand Paris Golf Club
County of Brant
1 - bCounty of Brant
Flowed Hydrant (F1): Paris Links Road
Q ^1.852 min (@20 psi)
Q min (@ 20 psi) (L/s)
Flowed Hydrant (F2): Paris Links Road
TEST No.Nozzles Used
L/s
y = -0.0065x + 89.302R² = 0.9171
0
10
20
30
40
50
60
70
80
90
100
0 2000 4000 6000 8000 10000 12000
Re
sid
ua
l Pre
ss
ure
(p
si)
Q^1.852 (l/s)
R1 (psi)
R2 (psi)
Q ^1.852 min (@20 psi)
Linear (R1 (psi))
Linear (R2 (psi))
Golf
R1F1R2
Paris Links Road

Hydrant Test Calculation Sheet
Project:
Owner: Date: 5/15/2013
Test Number: Time: 10:00 AM
Location: Field Crew: CA, AP
ID
Pipe Diameter (mm) 350
Pipe Material CI
Inches Inches
Static -- -- -- -- 0 86 89 0.0
hydrants 1 / 2 2" 2" 27 20 1512 70.3 74.7 95.2
2 0 0.0
3 0 0.0
4 0 0.0
5 0 0.0
6 0 0.0
R1 R2 F Flow @ 20 psi R1 R2
Hydrant Elevation (m) 241.00 242.00 238.00 P (psi) 20.0 20.0
Hydrant Spigot Elevation1 (m) 0.00 0.00 Q^1.852 19219.9 22151.6
Static Pressures (psi) 86.20 89.10 Q (L/s) 205.6 222.0
Hydraulic Grade Line (m) 301.70 304.74 19219.9
Pressure Drop (%) 18.4% 16.2% 205.6
1. If hydrant elevation is actually ground elevation, measure this.
2. Q^1.852 is used to determine a more accurate approximation of the extrapolated available flow at 20 psi residual pressure. (Haestad, et al., 2004)
Field Test Schematic
Field Notes:
Pitot 1 Pitot 2 U.S.G.P.M. R1 (psi) R2 (psi)
Residual Hydrant (R1): Paris Links Road
Residual Hydrant (R2): Paris Links Road
Address
Grand Paris Golf Club
County of Brant
2 - aCounty of Brant
Flowed Hydrant (F1): Paris Links Road
Q ^1.852 min (@20 psi)
Q min (@ 20 psi) (L/s)
Flowed Hydrant (F2): Paris Links Road
TEST No.Nozzles Used
L/s
y = -0.0034x + 86.2R² = 1
y = -0.0031x + 89.1R² = 1
0
10
20
30
40
50
60
70
80
90
100
0 5000 10000 15000 20000 25000
Re
sid
ua
l Pre
ss
ure
(p
si)
Q^1.852 (l/s)
R1 (psi)
R2 (psi)
Q ^1.852 min (@20 psi)
Linear (R1 (psi))
Linear (R2 (psi))
Golf
R1F1 R2F2
Paris Links Road

Hydrant Test Calculation Sheet
Project:
Owner: Date: 5/15/2013
Test Number: Time: 10:30 AM
Location: Field Crew: CA, AP
ID
Pipe Diameter (mm) 350
Pipe Material CI
Inches Inches
Static -- -- -- -- 0 95 0 0.0
hydrant 1 2" 0 27 812 81.6 86.3 51.2
2 2" 2" 20 25 1481 74.5 78.5 93.3
3 0 0.0
4 0 0.0
5 0 0.0
6 0 0.0
R1 R2 F Flow @ 20 psi R1 R2
Hydrant Elevation (m) 241.00 242.00 238.00 P (psi) 20.0 20.0
Hydrant Spigot Elevation1 (m) 0.00 0.00 Q^1.852 17139.7 26813.7
Static Pressures (psi) 94.50 Q (L/s) 193.3 246.1
Hydraulic Grade Line (m) 307.55 242.00 17139.7
Pressure Drop (%) 21.2% #DIV/0! 193.3
1. If hydrant elevation is actually ground elevation, measure this.
2. Q^1.852 is used to determine a more accurate approximation of the extrapolated available flow at 20 psi residual pressure. (Haestad, et al., 2004)
Field Test Schematic
Field Notes:
Pitot 1 Pitot 2 U.S.G.P.M. R1 (psi) R2 (psi)
Residual Hydrant (R1): Paris Links Road
Residual Hydrant (R2): Paris Links Road
Address
- See Test 1-a- Sprinklers were on for golf course
Grand Paris Golf Club
County of Brant
2 - bCounty of Brant
Flowed Hydrant (F1): Paris Links Road
Q ^1.852 min (@20 psi)
Q min (@ 20 psi) (L/s)
Flowed Hydrant (F2): Paris Links Road
TEST No.Nozzles Used
L/s
y = -0.0042x + 91.778R² = 0.8753
y = -0.0026x + 90.123R² = 1
0
10
20
30
40
50
60
70
80
90
100
0 2000 4000 6000 8000 10000 12000 14000 16000 18000
Re
sid
ua
l Pre
ss
ure
(p
si)
Q^1.852 (l/s)
R1 (psi)
R2 (psi)
Q ^1.852 min (@20 psi)
Linear (R1 (psi))
Linear (R2 (psi))
Golf
R1 R2F1
Paris Links Road

Appendix C
Appendix C
Pressure Logger Data

0
10
20
30
40
50
60
70
80
90
100
110
8:3015 Wed May 2013
9:00 9:30 10:00 10:30 11:00
Downloaded Data - Wednesday, May 15, 2013
Date/Time
R1-Pressure/psig Min: -1.2 Max: 108.3
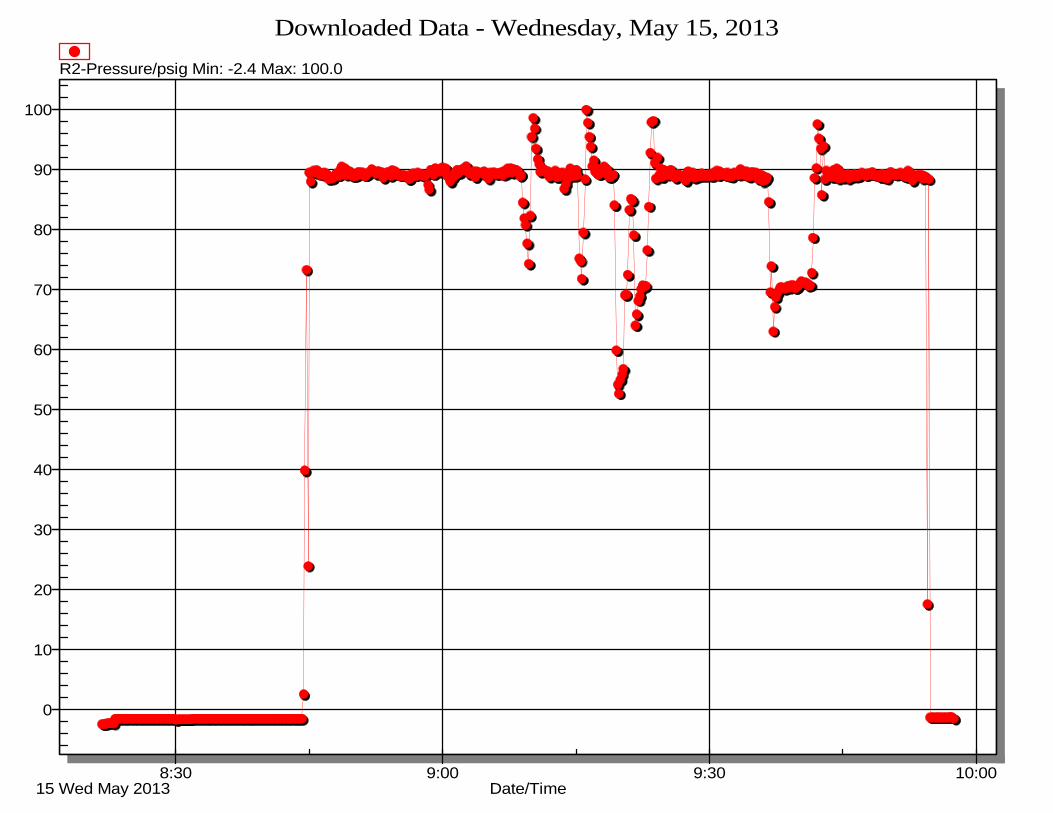
0
10
20
30
40
50
60
70
80
90
100
8:3015 Wed May 2013
9:00 9:30 10:00
Downloaded Data - Wednesday, May 15, 2013
Date/Time
R2-Pressure/psig Min: -2.4 Max: 100.0

0
10
20
30
40
50
60
70
80
90
100
110
10:0015 Wed May 2013
10:30 11:00
Downloaded Data - Wednesday, May 15, 2013
Date/Time
R2-Pressure/psig Min: -1.4 Max: 109.3

Appendix D
Appendix D
Field Testing Photos
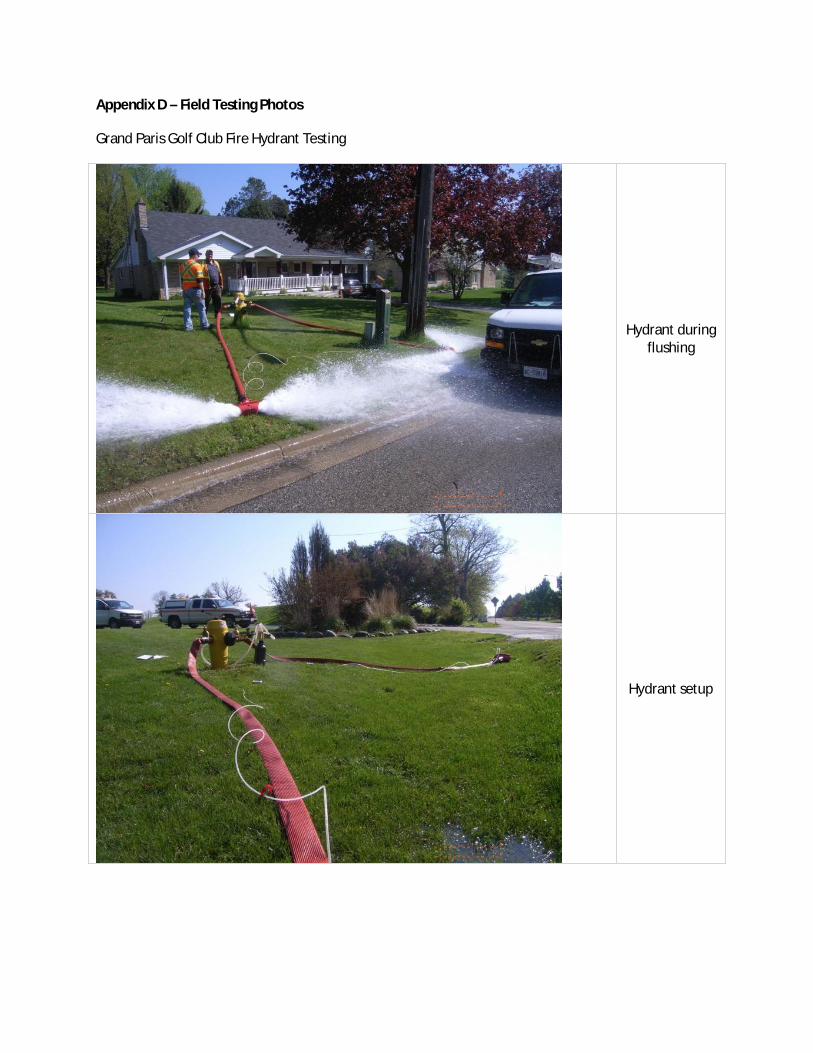
Appendix D – Field Testing Photos
Grand Paris Golf Club Fire Hydrant Testing
Hydrant duringflushing
Hydrant setup

Pressure logger
Dechlorinationequipment