Proof of Effectiveness of PASCOFLAIR® in Subjects ...file.scirp.org/pdf/PP_2016103113541804.pdf ·...
19
Pharmacology & Pharmacy, 2016, 7, 424-442 http://www.scirp.org/journal/pp ISSN Online: 2157-9431 ISSN Print: 2157-9423 DOI: 10.4236/pp.2016.710050 October 31, 2016 Proof of Effectiveness of PASCOFLAIR ® in Subjects Suffering from Examination Anxiety Using Quantitative EEG in Combination with Eye-Tracking (EnkephaloVision). A Double-Blind, Randomized, Placebo Controlled, 2-Armed, Phase IV Study in Parallel Design Wilfried Dimpfel 1 , Gwladys N. Chiegoua Dipah 2 , Samir Suliman 2 1 Justus-Liebig-University, Giessen, Germany 2 NeuroCode AG, Wetzlar, Germany Abstract The pharmaco-dynamic action of plant-derived drugs still remains a big challenge in the field of pharmacology. This applies especially for the discovering of the possible mechanism of action. With respect to the brain, surrogate parameters may be very helpful. Non-invasive pharmaco-EEG has been proven to provide valid information on drug effects in general. Fast dynamic EEG recording with epoch length of 364 ms has now been achieved in combination with Eye-Tracking in order to elucidate single scenes during cognitive and emotional challenges (EnkephaloVision). The present investigation deals with the psychophysiological characterization of the effect of a plant-derived preparation marketed in Germany under the name of PASCOFLAIR® containing 425 mg of passionflower extract in subjects suffering from examination anxiety. Forty healthy volunteer subjects (17 men and 23 woman), with ages varying between 18 and 40 years (26 ± 6.726 for men and 25 ± 5.397 for women) were in- cluded into the study when having a score higher than 60 in the PAF (Prüfung- sangstfragebogen). Spectral power analysis of pre-drug data with respect to beta waves revealed a significant correlation to the score of the PAF. Increases of delta, theta and beta waves as induced by 4 cognitive and 4 emotional challenges were at- tenuated in the presence of 2 tablets of PASCOFLAIR® already 45 minutes after in- take in a statistically significant manner in comparison to placebo. Regarding attenu- ation of beta1 and beta2 spectral power, effects on glutamatergic and GABAergic How to cite this paper: Dimpfel, W., Di- pah, G.N.C. and Suliman, S. (2016) Proof of Effectiveness of PASCOFLAIR® in Subjects Suffering from Examination Anxiety Using Quantitative EEG in Combination with Eye- Tracking (EnkephaloVision). A Double- Blind, Randomized, Placebo Controlled, 2-Armed, Phase IV Study in Parallel Design. Pharmacology & Pharmacy, 7, 424-442. http://dx.doi.org/10.4236/pp.2016.710050 Received: September 15, 2016 Accepted: October 28, 2016 Published: October 31, 2016 Copyright © 2016 by authors and Scientific Research Publishing Inc. This work is licensed under the Creative Commons Attribution International License (CC BY 4.0). http://creativecommons.org/licenses/by/4.0/ Open Access
Transcript of Proof of Effectiveness of PASCOFLAIR® in Subjects ...file.scirp.org/pdf/PP_2016103113541804.pdf ·...

Pharmacology & Pharmacy, 2016, 7, 424-442 http://www.scirp.org/journal/pp
ISSN Online: 2157-9431 ISSN Print: 2157-9423
DOI: 10.4236/pp.2016.710050 October 31, 2016
Proof of Effectiveness of PASCOFLAIR® in Subjects Suffering from Examination Anxiety Using Quantitative EEG in Combination with Eye-Tracking (EnkephaloVision). A Double-Blind, Randomized, Placebo Controlled, 2-Armed, Phase IV Study in Parallel Design
Wilfried Dimpfel1, Gwladys N. Chiegoua Dipah2, Samir Suliman2
1Justus-Liebig-University, Giessen, Germany 2NeuroCode AG, Wetzlar, Germany
Abstract The pharmaco-dynamic action of plant-derived drugs still remains a big challenge in the field of pharmacology. This applies especially for the discovering of the possible mechanism of action. With respect to the brain, surrogate parameters may be very helpful. Non-invasive pharmaco-EEG has been proven to provide valid information on drug effects in general. Fast dynamic EEG recording with epoch length of 364 ms has now been achieved in combination with Eye-Tracking in order to elucidate single scenes during cognitive and emotional challenges (EnkephaloVision). The present investigation deals with the psychophysiological characterization of the effect of a plant-derived preparation marketed in Germany under the name of PASCOFLAIR® containing 425 mg of passionflower extract in subjects suffering from examination anxiety. Forty healthy volunteer subjects (17 men and 23 woman), with ages varying between 18 and 40 years (26 ± 6.726 for men and 25 ± 5.397 for women) were in-cluded into the study when having a score higher than 60 in the PAF (Prüfung-sangstfragebogen). Spectral power analysis of pre-drug data with respect to beta waves revealed a significant correlation to the score of the PAF. Increases of delta, theta and beta waves as induced by 4 cognitive and 4 emotional challenges were at-tenuated in the presence of 2 tablets of PASCOFLAIR® already 45 minutes after in-take in a statistically significant manner in comparison to placebo. Regarding attenu-ation of beta1 and beta2 spectral power, effects on glutamatergic and GABAergic
How to cite this paper: Dimpfel, W., Di-pah, G.N.C. and Suliman, S. (2016) Proof of Effectiveness of PASCOFLAIR® in Subjects Suffering from Examination Anxiety Using Quantitative EEG in Combination with Eye- Tracking (EnkephaloVision). A Double- Blind, Randomized, Placebo Controlled, 2-Armed, Phase IV Study in Parallel Design. Pharmacology & Pharmacy, 7, 424-442. http://dx.doi.org/10.4236/pp.2016.710050 Received: September 15, 2016 Accepted: October 28, 2016 Published: October 31, 2016 Copyright © 2016 by authors and Scientific Research Publishing Inc. This work is licensed under the Creative Commons Attribution International License (CC BY 4.0). http://creativecommons.org/licenses/by/4.0/
Open Access

W. Dimpfel et al.
425
neurotransmission, respectively, can be suspected according to our knowledge of frequency—transmitter relations. Accordingly, this attenuation must be interpreted as ability to counteract examination induced stress symptoms. Results confirm and extend earlier experimental data showing a calming action of PASCOFLAIR®.
Keywords EEG, Source Density, Spectral Power, PASCOFLAIR®, Psychophysiology, Cognition, Emotion, Stress, CATEEM®, Neurocode-Tracking, Eye-Tracking, Enkephalovision
1. Introduction
PASCOFLAIR® is a herbal drug marketed in Germany for treatment of restlessness and nervousness as well as for better coping with stress. Its pharmacodynamic active ingre-dient is an extract of passionflower. Efficient calming down has been reported in the past without interfering with cognitive performance in healthy subjects [1]. Also many other herbal preparations have been tested using neurophysiological techniques [2] [3]. There is convincing evidence that emotional states directly relate to brain electric activ-ity in terms of spectral frequency changes [4]. The present investigation aimed at the possibility that PASCOFLAIR® might be able to help subjects suffering from examina-tion anxiety. In order to test this, a new design of a clinical study was used, namely “EnkephaloVision”. This new approach consists of the combination of quantitative EEG recording providing very high time resolution of epochs of 364 ms (Neurocode- Tracking) with conventional Eye-Tracking. This method has already been used suc-cessfully for characterization of other herbal extracts [5] [6].
According to our experience, when presenting videos with emotional content, re-producible changes of brain electric activity have been recorded. Especially, horror clips induced strong transient increases of spectral beta power. This led to the hypothesis, that spectral beta power might be a good indicator of stressful reactions. Therefore, 40 subjects suffering from examination (or test) anxiety were exposed visually to 4 cogni-tive and 4 emotional challenges by asking for task performance and watching video clips of short duration. Video presentations are well suited to induce emotional stress (called emphatic stress) as proven by significant physiological increases of cortisol le-vels [7].
2. Methods
The double-blind, randomized, placebo-controlled, two-armed study was conducted from May to August 2015 in the research labs of NeuroCode AG, Wetzlar, Germany. The medical investigation was approved by the ethics committee of the Hessen State Medical Association (Frankfurt, Germany) and government authorities (BfArM, Bonn, Germany) before initiation. Subjects signed an informed consent, which contained de-tailed information about the study. They were randomized to receive either placebo or verum according a randomization schedule, that was generated by a statistician. The

W. Dimpfel et al.
426
investigator, the medical staff, the study assistants and subjects were kept blind to the allocation. Verum and placebo tablets were undistinguishable and both were blistered, packed and labeled identically. The study was performed under the EudraCT-Nr. 2014- 003369-50. Approval of the ethic committee (Landesärztekammer Hessen, Frankfurt, Germany) was on 17.12.2014. The study was performed in accordance with the current version of the declaration of Helsinki (52nd WMA General Assembly, Edinburgh, Scot-land, October 2000). The trial was conducted in agreement with the International Con-ference on Harmonization (ICH) guidelines on Good Clinical Practice (GCP).
2.1. Subjects
Forty healthy volunteer subjects (17 men and 23 woman), with ages varying between 18 and 40 years (26 ± 6.726 for men and 25 ± 5.397 for women) were recruited by adver-tisement and filling out a questionnaire dealing with examination anxiety, called PAF-questionnaire (Prüfungsangstfragebogen PAF-S, Hogrefe Verlag, Göttingen, Germany [8]). Subjects having a score between 61 and 80 were included in the study and they underwent a medical examination before entering the trial. Results from sev-eral questionnaires did not reveal greater differences between the two groups. Results are listed in Table 1.
According to the literature reproducible changes of brain electric activity are de-scribed as the resultant of showing videos with emotional content by subjects [9]. These changes occurred especially by presenting horror clips, which induced strong transient increases of spectral beta activity in the brain. This led to the hypothesis, that spectral beta power might be a good indicator of stressful reactions as already reported earlier [10].
This hypothesis was also verified in this study by all emotional challenges. For illu-stration two representative scenes from a video were chosen (video clip from “examina-tion anxiety” and “at the dentist”). As we can see in Figure 1 and Figure 2, both scenes showed a high beta activity in the temporal lobe (blue color in the bar graph or blue spot in the map) as an indicator of stress.
Table 1. Comparison between groups with respect to questionnaires: PAF = Prüfungsangstfra-gebogen (exam anxiety), HAMA = Hamilton Anxiety Scale, dental treatment anxiety, SD = stan-dard deviation, SEM = standard error of the mean, n = number of subjects, verum = PASCOFLAIR® 425 mg.
Questionnaires All subjects n = 40 Placebo n = 20 Verum n = 20
PAF
Mean 65.95 65.50 66.40
SD 4.03 4.07 4.04
SEM 0.64 0.91 0.90
HAMA Mean 15.13 15.50 14.75
SD 6.57 7.55 5.59 SEM 1.04 1.69 1.25
Dental treatment anxiety
Mean 5.00 4.80 5.20 SD 3.27 3.44 3.16
SEM 0.52 0.77 0.71

W. Dimpfel et al.
427
Figure 1. Representative scene of 364 ms duration taken from the video clip “examination an-xiety” showing high beta activity in the temporal lobe (blue color on electrode positions T5 and T6 in the bar graph and blue spot on the map) indicating enhanced stress. Red spot in inserted im-age represents eye glance on examination candidate.
The exclusion criteria were: hypersensitivity to the ingredients of the investigational
product, acute or chronic disease, use of antidepressants, psychotropic drugs or cen-trally acting antihypertensives, use of clinically relevant medication during last fourteen days before and during the study period, presence of clinically relevant pathological EEG features or artifact-free portion of the screening EEG less than 30%, participation in another clinical trial within the last 60 days, positive alcohol or drug test, history of alcohol or drug abuse, body mass index less than 18 or more than 32, misuse of coffee or tea (more than 4 cups a day) or tobacco (more than 20 cigarettes a day), use of beve-rages containing caffeine preceding the EEG recording, smoking on the study day (day A), excursions of safety parameters, bad compliance, cancellation of informed consent, positive pregnancy test or nursing.
2.2. EEG-Recording
In this Study the Neurocode-Tracking software was used for EEG-recording on the ex-perimental day (day A). This is a 17 channel EEG recording combined with Eye- Tracking. A detailed description of EEG-recording has been published earlier with a new modified software for analysis of shorter times epochs of 364 ms duration [11] (neo-CATEEM®, supplied by MEWICON CATEEM-Tec GmbH, 4164 Schwarzenberg am Böhmerwald, Austria). In short: For the new approach EEG frequency ranges had to be adjusted slightly to give the following exact ranges. Delta: 1.375 - 4.125 Hz; Theta:

W. Dimpfel et al.
428
Figure 2. Representative scene taken from the video clip “at the dentist” showing high beta activ-ity in the temporal lobe (blue color on electrode positions T3 and T5 in the bar graph and blue spot on the map) indicating enhanced stress. Red spot in inserted image represents eye glance on mouth under treatment.
4.125 - 6.875 Hz; Alpha1: 6.875 - 9.625 Hz; Alpha2: 9.625 - 12.375 Hz; Beta1: 12.375 - 17.875 Hz; Beta2: 17.875 - 34.375 Hz. This adjustment is a precondition for the new fast dynamic frequency analysis (Neurocode-Tracking) because under this condition each frequency range from delta up to alpha2 contains only one frequency (middle frequen-cy within the particular frequency band). Data were analyzed in current source density mode. All other features remained identical to the classic analysis used now for nearly 20 years. Maps were constructed by transforming spectral power values into spectral colours followed by additive colour mixture (RGB-mode like in TV).
EEG-recording occurred at two different times: before and 45 min after intake of the study medication (i.e. placebo/verum). Subjects fulfilling all inclusion criteria were in-vited to come with empty stomach on the experimental day (day A). After having a breakfast, they underwent clinical examination and were assigned at random to one of the two study medications (i.e. placebo or verum). They also answered a simple ques-tionnaire, called HAMA [12] (Hamilton Anxiety Scale, CIPS: Collegium Internationale Psychiatriae Scalarum) with questions about their general health (anamnesis) and their anxiety. Before recording of the first EEG (first presentation), subjects were informed and made familiar to the Neurocode-Tracking. Each subject spent around 43 min in the facility’s break room after the medication intake.
EEG recording was performed in the presence of a video clip, which contained sever-al different cognitive and emotional challenges in series (Table 2). At the beginning,

W. Dimpfel et al.
429
Table 2. Audio-visual challenges during EEG recordings at experimental day (day A).
Neurocode-Tracking in Combination with Eye-Tracking Audio-visual Presentation
Elements Time
1 Instructions of volunteers in the Neurocode-Tracking method 5 min. 00 s
2 Gong (for synchronization Neurocode-Tracking (qEEG and Eye-Tracking)) 21 s
3 Eyes open (Black Screen) 1 min. 00 s
4 Fix Cross (Eyes open) 1 min. 00 s
5 Exam Anxiety-Video 1 min. 55 s
6 Memory Test (n = 4 tasks) including instructions 1 min. 35 s
7 Stroop Test (n = 1 foil) 1 min. 00 s
8 Picture Comparison (n = 1 foil) with 8 errors 1 min. 00 s
9 Brain Teaser (n = 10 tasks) 5 min. 03 s
10 Horror-Video 1 min. 00 s
11 Dentist Pain-Video 52 s
12 Emergency-OP-Video 1 min. 11 s
Total Time 21 min. 12 s
after a gong for synchronization purposes, a fixation cross was presented for 1 minute as reference. The total video was presented twice: During baseline recording and 45 min after intake of two 425 mg tablets PASCOFLAIR® or placebo tablets on the exami-nation day (day A). A time line is given in Figure 3.
2.3. Statistical Analyses
EEG data from the first recording session before intake of the tablets are given as abso-lute values (µV2). These Data were set to 100% for statistical evaluation using the non-parametric Wilcoxon test and electrophysiological changes produced by the investiga-tional products (i.e. placebo and verum) were depicted as %-changes thereof. In order to document statistically the different electric reaction of the brain to various cognitive and emotional loads, data from each part of the presentation were divided by the data obtained during fixation of the cross on the monitor (1 minute) at the beginning. Comparison of PASCOFLAIR® versus placebo was accomplished by evaluation of the second recording of the day 45 minutes (0.75 h) after intake.
Further evaluations were done using the linear discriminant analysis according to Fischer. Results from the first three discriminant functions were projected into space (X, Y and Z coordinates), whereas results from the fourth to sixth discriminant func-tions were coded into red, green and blue color, respectively, followed an additive color mixture (so-called RGB-mode). Sample size was defined according to several earlier studies performed under identical conditions.
2.4. Extract
PASCOFLAIR® is a coated tablet which contains 425 mg dry extract of Passiflora L.

W. Dimpfel et al.
430
Figure 3. Time line of the experimental day (day A).
(aerial parts) corresponding to 2.125 - 2.975 g of passionflower. Ethanol 50% (v/v) is used as extract medium. PASCOFLAIR® 425 mg is used in herbal medicine for the treatment of anxiety, restlessness, sleeplessness and mental stress. The manufacture of the placebo tablets was based on the verum except for the active ingredient, that was replaced by a mixture of microcrystalline cellulose, cellulose powder, silica, highly dis-persed and stearic acid. The investigational products (PASCOFLAIR® 425 mg and pla- cebo) were carried out by Pascoe pharmazeutische Präparate GmbH, Giessen, Germa-ny.
2.5. Efficacy and Safety Parameters
For safety assessments, physical examinations, clinical laboratory tests and a 12-lead electrocardiogram (ECG) were performed before (screening day) and after drug intake (final examination day). Samples for blood chemistry (including creatinine, glucose, aspartate aminotransferase (AST), alanine aminotransferase (ALT) and gamma-glut- amyl transferase (Gamma-GT)), hematology (including platelet count, red blood cell (RBC) count, hemoglobin, hematocrit, mean corpuscular volume (MCV), mean cor-puscular hemoglobin (MCH)) and urine analysis (including specific gravity, power of hydrogen (pH), glucose, protein, blood and ketones and microscopic examination) were collected in our institute and the analyses were performed in a central laboratory. Vital signs (pulse rate and blood pressure), temperature and adverse events were rec-orded at each visit.
3. Results 3.1. Frequency Changes in the Presence of Cognitive and Emotional
Challenges
Forty subjects were recruited for this study on the base of filling out a questionnaire dealing with examination anxiety. Concomitant presentation of a series of mental and emotional challenges during recording of the EEG was performed before and 45 mi-nutes after intake of 2 tablets of PASCOFLAIR®. The absolute starting values of spectral power in the six frequency ranges (delta to beta2) are given in Table 2. These values do not differ from each other in a statistically significant way suggesting that both groups-

W. Dimpfel et al.
431
placebo and verum-have a similar starting position. This allows for a pre-post compar-ison of drug action. These absolute values are set to 100% for further analysis and drug induced changes are documented in % of these starting values.
In order to relate the result from the questionnaire with EEG parameters a correla-tion was searched based on the first recordings before administration of the drug. The result indicates that absolute spectral beta1 and beta2 power from all 40 subjects during the recording condition “eyes open” in a relaxed state before drug administration cor-related with the score values of the questionnaire. Since increases of beta power mainly emerge in fronto-temporal brain areas, spectral power was calculated for the combina-tion of all frontal and temporal electrodes for correlation purposes. Figure 4 document the results of this analysis showing a correlation coefficient of r = 0.32 (p < 0.031) for beta1 and of r = 0.33 (p < 0.024) for beta2 spectral power. According to the correlations found, increases of beta power were the main target to look for uncovering drug effects related to exam anxiety and stress.
Next step in the analysis was to find out if the different cognitive and visually pre-sented emotional challenges lead to increases of delta, theta and spectral beta power among other changes before the intake of verum/placebo. For this purpose, data from each challenge were averaged over the presentation time in order to follow each of the brain regions with respect to the pattern of spectral power changes with respect to each frequency. As documented in Table 3 all challenges except for the stroop test and the clips “examination anxiety” and “dentist pain” induced statistically significant beta power besides massive increases of delta and theta spectral power (except for emotional challenges!).
Figure 4. Correlation between PAF examination anxiety questionnaire (score on abscissa) and spectral beta1 power (left), beta2 power (right) during the recording condition “eyes open” before drug intake. Spectral power was averaged including all frontal and temporal electrodes. Ordinate: spectral power, Abscissa: score of questionnaire PAF. Correlation coefficient beta1 (r = 0.315; p = 0.031) and beta2 (r = 0.334; p = 0.024).

W. Dimpfel et al.
432
Table 3. Spectral power before intake of verum/placebo with respect to 17 locations under the recording condition “eyes open”. Compar-ison of the absolute starting values of both groups of subjects. Data are given as µV2 within each frequency range (delta-beta2). Med = median value. Electrode positions according to the so-called 10/20 system [13]. Verum = PASCOFLAIR®, n = number of subjects.
Absolute Spectral Power during relaxation (eyes open) 0h before acute intake at day A
Delta Theta Alpha1 Alpha2 Beta1 Beta2 Subjects n = 20 n = 20 n = 20 n = 20 n = 20 n = 20 n = 20 n = 20 n = 20 n = 20 n = 20 n = 20
Electrode Placebo Verum Placebo Verum Placebo Verum Placebo Verum Placebo Verum Placebo Verum Cz 1.46 1.49 1.25 1.13 1.06 0.97 0.74 0.70 0.71 0.54 0.91 0.96 Fz 2.37 2.31 1.57 1.65 1.04 1.32 0.67 0.79 0.75 0.67 1.02 0.93 F3 1.74 2.23 1.09 1.49 0.82 1.12 0.62 0.83 0.81 0.88 2.02 1.49 C3 0.98 1.04 0.84 0.86 0.89 0.81 1.16 0.73 1.10 0.95 1.27 1.54 P3 0.73 0.72 0.52 0.58 0.47 0.57 0.46 0.65 0.45 0.62 0.50 0.69 Pz 1.15 0.92 0.79 0.77 0.65 0.95 0.65 1.25 0.84 0.79 0.71 0.64 P4 0.77 0.86 0.52 0.59 0.50 0.91 0.54 0.81 0.73 0.71 0.80 0.71 C4 0.98 1.19 0.74 0.86 0.56 0.94 0.58 0.96 0.89 0.91 1.13 1.24 F4 1.83 1.91 1.34 1.41 1.23 1.06 0.86 0.80 0.88 0.89 1.43 1.53 F7 5.58 6.41 3.28 3.03 1.82 2.01 1.32 1.77 1.69 1.59 2.33 2.38 T3 2.47 2.82 1.89 2.10 1.28 1.63 1.42 1.36 1.85 1.73 1.93 2.41 T5 2.17 1.77 1.58 1.61 1.30 1.36 1.20 1.43 1.64 1.52 1.37 1.53 O1 1.93 2.16 1.34 1.37 1.42 1.10 1.39 1.42 1.36 1.39 1.81 2.05 O2 1.99 2.31 1.39 1.45 0.91 1.75 0.91 2.12 1.28 1.64 1.82 1.76 T6 2.11 2.17 1.43 1.69 1.60 2.11 2.42 3.27 2.22 1.97 1.52 1.87 T4 3.05 2.58 2.00 1.70 1.23 1.37 1.45 1.49 2.01 2.35 2.91 3.92 F8 5.62 5.06 3.08 2.74 1.72 1.92 1.38 2.01 1.78 1.61 3.23 2.82
Med 1.81 2.00 1.24 1.43 1.18 1.12 0.81 1.10 1.15 1.18 1.35 1.48
3.2. Pharmacodynamic Effects of PASCOFLAIR®
After establishment of spectral beta power as related to emotional stress, this parameter was looked at when comparing spectral changes induced by the placebo or the verum group. For example, a comparison of the same single scenery before and after intake of PASCOFLAIR® revealed a reduction of beta power at several electrode positions when considered for all 20 subjects per group (blue color in the bar graph of Figure 5(a) and Figure 5(b). The reduction is also well documented by means of the maps, where less blue color dominates.
Regarding the effect of PASCOFLAIR® on different brain regions under the record-ing condition “eyes open” a general decrease of beta power (blue) is recognized. How-ever, only beta1 at P3 and beta2 at T4 were statistically conspicuous (p < 0.10). In the occipital region alpha2 increases were observed, mostly at the electrode position O2. Complete data are given in Figure 6. When subjects were asked to fix a cross on the screen for one minute, intake of PASCOFLAIR® led to a reduction of beta power in fronto-temporal areas (statistically conspicuous or significant at F3, T3, T4 and F8) as well as at P3. Data are also documented in Figure 6.
Performance of a memory test also led to decreases of beta power in the presence of PASCOFLAIR®. With regard to spectral beta power, frontal as well as parieto-occipital regions (electrode positions P3 and O1) showed a diminution in a statistically conspi-cuous or significant manner (statistically conspicuous or significant at F3, F7 and T5). Under this recording condition also delta and theta power were attenuated significantly

W. Dimpfel et al.
433
Figure 5. Comparison of an arbitrarily chosen but representative single scene of 364 ms duration before (a) and after intake of PASCOFLAIR® (b). Data taken from the emergency video clip were averaged for all 20 subjects. Eye-Track results are depicted in the up-per image, EEG data are depicted in the lower image. Frequency changes are documented in the bar graph (ordinate: global median power from 1 to 301 %). Delta waves are coded into red, theta into orange, alpha1 into yellow, alpha2 into green, beta1 into turquoise, beta2 into blue.
by PASCOFLAIR® as depicted in Figure 6. During performance of the Stroop test again a fronto-temporal reduction of beta power was discovered (statistically conspicuous or significant at F3, F7 and T6) again accompanied by the parietal region represented by electrode position P3. Complete set of data is documented in Figure 6.
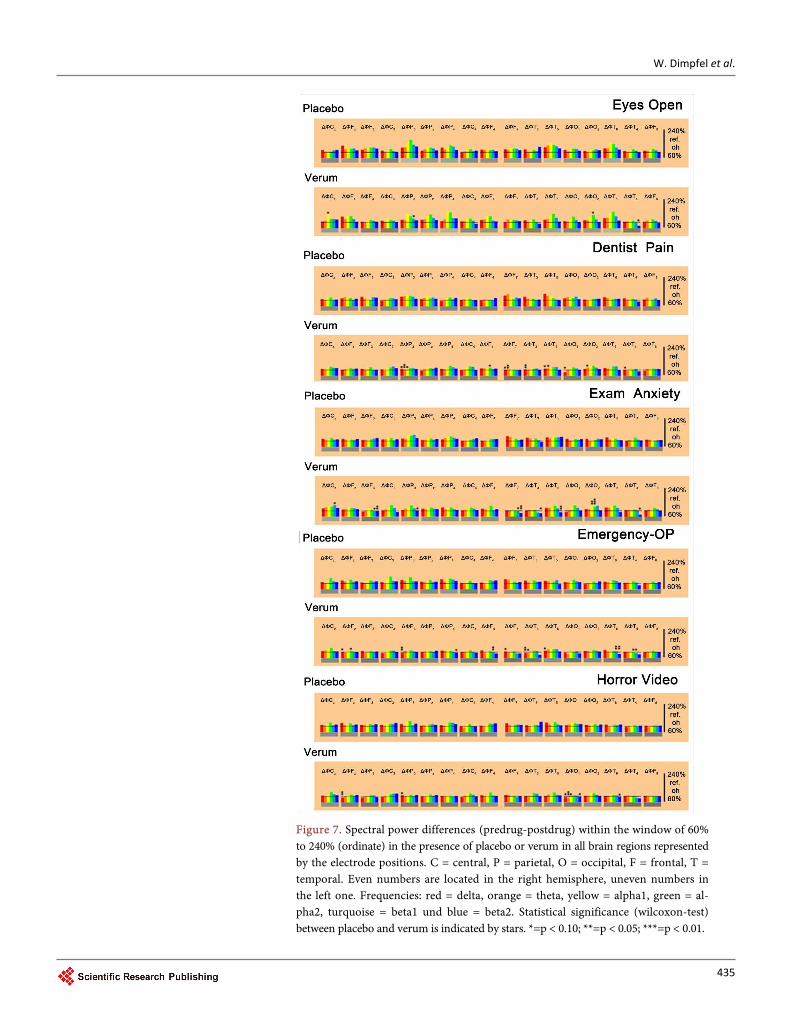
The recording condition in the presence of the video clip “exam anxiety” revealed reduction of beta power in fronto-temporal areas (statistically conspicuous or signifi-cant at electrode positions F3, F7, T3, T5 and T4). Complete data are documented in Fig-ure 7. The recording condition “emergency-OP” also provided evidence for reduction of beta power mainly in fronto-temporal areas (statistically conspicuous or significant at electrode positions F4, T6 and T4). Here also diminution of delta waves emerged, which were statistically conspicuous or significant at Fz, P3, F7, T3 and T5. Data are shown in Figure 7.
Remarkably, 7 challenges showed a statistically conspicuous lower production of beta power at the left parietal lobe (electrode position P3) besides the general fronto-temp- oral areas 45 minutes after intake of PASCOFLAIR®. There was virtually no effect in central brain areas. An overview on statistically relevant power decreases at different

W. Dimpfel et al.
434
Figure 6. Spectral power differences (predrug-postdrug) within the window of 60% to 240% (ordinate) in the presence of placebo or verum in all brain regions represented by the electrode positions. C = central, P = parietal, O = occipital, F = frontal, T = temporal. Even numbers are located in the right hemisphere, uneven numbers in the left one. Frequencies: red = delta, orange = theta, yellow = alpha1, green = alpha2, turquoise = beta1 und blue = beta2. Statistical significance (Wilcoxon-Test) be-tween placebo and verum is indicated by stars. *=p < 0.10; **=p < 0.05; ***=p < 0.01.
W. Dimpfel et al.
435
Figure 7. Spectral power differences (predrug-postdrug) within the window of 60% to 240% (ordinate) in the presence of placebo or verum in all brain regions represented by the electrode positions. C = central, P = parietal, O = occipital, F = frontal, T = temporal. Even numbers are located in the right hemisphere, uneven numbers in the left one. Frequencies: red = delta, orange = theta, yellow = alpha1, green = al-pha2, turquoise = beta1 und blue = beta2. Statistical significance (wilcoxon-test) between placebo and verum is indicated by stars. *=p < 0.10; **=p < 0.05; ***=p < 0.01.

W. Dimpfel et al.
436
electrode positions is given in Table 4. Decreases of delta and theta power occur mainly on the left hemisphere with the exception of T4 and F8. Decreases in beta1 and beta2 likewise are observed mainly in the left hemisphere except for T4 and F8. Fur-ther exceptions are for beta1 at electrode position F4 and for beta2 at electrode posi-tion P4.
Table 4. Overview on statistically conspicuous (p < 0.10) or significant (p < 0.05 or less) decreases of spectral power in delta (upper left), theta (upper right), beta1 (lower left) and beta2 (lower right) images. FX = Fix Cross, ME = Memory Test, ST = Stroop test, PC = picture comparison, BT = brain teaser, EO = eyes open, PD = dentist pain, EA = exam anxiety, E-OP = emergency-OP, HV = horror video, E = electrode positions.
Delta E FX ME ST PC BT EO DP EA E-OP HV Theta E FX ME ST PC BT EO DP EA E-OP HV
Cz Cz Fz X X Fz F3 F3 X C3 X X X X C3 X P3 X X X X P3 X X Pz Pz P4 P4 C4 C4 F4 F4 F7 X X F7 X X T3 X X X X T3 X X T5 X X X X T5 X X O1 X X X X O1 X X O2 O2 X T6 T6 T4 X X T4 X X F8 X F8
Beta1 E FX ME ST PC BT EO DP EA E-OP HV Beta2 E FX ME ST PC BT EO DP EA E-OP HV
Cz X Cz Fz Fz F3 X X X F3 X X X X X C3 C3 P3 X X X X P3 X X X X Pz Pz P4 P4 X C4 C4 F4 X F4 F7 X F7 X X X T3 T3 X X T5 X T5 X X O1 O1 X X O2 O2 T6 X T6 X X X T4 X X X X T4 X X X X F8 X F8

W. Dimpfel et al.
437
With respect to data averaged by including all electrodes a general lower production of beta1 and beta2 waves is seen. In the case of the beta2 waves a statistically conspi-cuous lower production was seen during the two video-clips dealing with examination anxiety and an emergency surgery (OP). Data for beta2 wave reduction for all elec-trodes are given in Table 4. With respect to beta2 waves a statistically conspicuous lower production was seen when watching the emergency clip, and a statistically significant lower production during watching the examination video clip. A similar effect was also seen with regard to the parieto-occipital area, where also during viewing the emergency clip statistically significantly less beta2 waves were produced besides the statistically conspicuous reduction when watching the horror video. Interestingly, delta and theta attenuation was observed very often during watching the video on dentist performance, but no attenuation of beta waves was observed under this condition. In general, changes of spectral power varied according to the test. For example, during watching the examination video, no attenuation of delta or theta activity was observed, however, attenuation of beta1 and beta2 power was seen in fronto-temporal areas and P3.
3.3. Discriminant Analysis
Finally, all 102 parameters (17 electrode positions × 6 frequency ranges) were fed into a linear discriminant analysis for comparison with other drugs. As documented in Figure 8 the effect of PASCOFLAIR® (verum) was projected at a considerable distance to the ef-fect of its placebo proving its fast effectiveness within 45 min after intake.
3.4. Performance in Psychometric Tests
Analysis of the mental performance during the cognitive testing did not reveal any dif-ference with respect to drug intake. Results are documented in Table 5.
4. Discussion
To follow the pharmaco-dynamic action of plant-derived drugs still remains a big chal-lenge in the field of pharmacology. This applies especially for the discovering the possible
Table 5. Mental performance in three cognitive tests: Picture comparison, Memory test and brain teaser before and after intake of 2 tab-lets PASCOFLAIR® (verum) or placebo. Data are given in % of maximally reachable success (=100%). SD = standard deviation, SEM = standard error of the mean, h = hour.
Performance of Picture Comparison Performance of Memory Test Performance of Brain Teaser
Placebo Verum Placebo Verum Placebo Verum
0h
Mean 58.13 61.88
0h
Mean 87.25 90.00
0h
Mean 72.50 70.00
SD 13.00 14.89 SD 17.43 18.85 SD 19.97 21.03
SEM 2.91 3.33 SEM 3.90 4.22 SEM 4.47 4.70
0.75h
Mean 66.88 69.38
0.75h
Mean 85.00 83.50
0.75h
Mean 75.00 73.50
SD 11.67 13.13 SD 17.01 26.11 SD 13.57 13.87
SEM 2.61 2.94 SEM 3.80 5.84 SEM 3.04 3.10

W. Dimpfel et al.
438
Figure 8. Result of discriminant analysis based on all brain regions and frequencies 45 minutes after intake. Results from the first three discriminant functions are depicted with the space coordinates x, y and z. Results from the next three discriminant functions are depicted as RGB colour mixture like in TV technology. Results from placebo and verum are marked red. Difference to baseline is taken for each drug. Diazepam and fluoxetine are looked at 1 hour after intake, hypericum after 2 hours, all other preparations 3 hours after intake. Please note that there is no preparation in the direct vicinity of PASCOFLAIR® (verum is far in the back, when looking into the three- dimensional space!).
mechanism of action. With respect to the brain, surrogate parameters may be very helpful and possibly are able to replace directly psychometric measurements [14]. Another surrogate parameter obtained from nuclear magnetic resonance measure-ments known as BOLD response has been related to electrophysiological signatures based on EEG frequencies [15]. These authors brought up evidence, that beta1 power extracted from the posterior cingulate cortex correlated positively with the activity in the right supplementary cortex and that beta2 power extracted from the precuneus correlated positively with activity in the left frontal pole. In contrast to the indirect character of the BOLD signal, electroencephalography (EEG) is a direct measure of neuronal activity, and provides an effective means of measuring neuronal firing [16] [17].
A first important result in the present study was obtained by searching for a rela-tionship between the questionnaire “examination anxiety” called “PAF” in this report and quantitative EEG changes in terms of spectral power. For the median over all elec-trodes of beta1 as well as of beta2 power a statistically significant correlation was found.

W. Dimpfel et al.
439
As already detected in the correlation analysis mainly fronto-temporal brain areas were involved plus the left parietal brain area represented by the electrode position P3. In-creases in these areas have also been described in the presence of anxiety shortly before treatment at a dentist (Inaugural dissertation by Johanna Reuter, to be published). In-crease of beta waves in the temporal and frontal lobe of the brain has already been seen in earlier experiments during watching horror videos (Dimpfel, unpublished). In a study on students it was observed that in subjects with high motivation and anxiety lev-el the relative delta activity increased in right frontal brain areas, whereas in student with medium motivation immediately before an examination the relative beta2 power increases in right frontal brain areas [18].
This suggested a closer look at changes of delta and beta waves in order to proof the efficacy of PASCOFLAIR®. A further precondition for this goal consisted in the question if the selected audio-visual challenges result in an increase of spectral beta power in comparison to just starring at a fixation cross on the screen. This was clearly the case, by it confirming that beta power should be selected as the target of quantitative EEG analysis in order to proof the efficacy of PASCOFLAIR®. In addition to these changes of beta spectral power, statistically significant increases of delta and theta power during most of the different challenges indicated a great mental activation (Table 6) and
Table 6. Overview on changes in spectral power induced by all challenges with respect to all fre-quencies (beta power shadowed). Data are given in µV2 (bold) for the fronto-temporal brain area (combination of all frontal and temporal electrodes) n = 40 (baseline 0 h). Statistical significance (sign-test) in comparison to watching a fixation cross on the screen is indicated as “p<” beneath the spectral power.
E-Combination [µV2] Fz3478 T3456 Delta Theta Alpha1 Alpha2 Beta1 Beta2
Fix Cross 2.37 1.80 1.49 1.25 1.33 1.93
Memory 3.19 1.95 1.28 1.21 1.49 2.13
0.000001 0.017 0.154 0.039 0.017
Stroop 2.83 1.95 1.18 0.89 1.36 1.70
0.0002 0.039 0.006 0.000001
Picture Comparison 3.54 2.14 1.38 1.04 1.45 2.36
0.000001 0.00004 0.081 0.039 0.0007
Brain Teaser 3.22 2.21 1.38 1.10 1.59 2.27
0.000001 0.0002 0.017 0.039
Eyes Open 2.47 1.71 1.43 1.38 1.46 2.00
Dentist Pain 2.95 1.76 1.21 1.00 1.41 2.20
0.081 0.002 0.006 0.038
Exam Anxiety 2.73 1.76 1.21 1.14 1.39 1.97
0.002 0.017 0.0002
Emergency-OP 2.81 1.87 1.24 1.12 1.57 2.19
0.002 0.039 0.081 0.039 0.039
Horror Video 2.79 1.78 1.22 1.00 1.46 2.02
0.017 0.039 0.006 0.039 0.081

W. Dimpfel et al.
440
confirm results already published during similar or identical presentations [9]. Com-paring now the changes of spectral power in the presence of PASCOFLAIR® with the changes as observed in the presence of placebo, a reduction of delta and theta power and clearly lower increases of beta power were observed in nearly all challenges (s. overview in Table 4). The reduction of spectral power increases of beta waves can therefore be taken surely as a surrogate parameter for the anti-stress and calming effect of PASCOFLAIR®. The fact that always the same fronto-temporal electrodes and P3 showed more or less statistically conspicuous or significant reductions in the beta range provides safe evidence that subjects experienced less stress and anxiety leading to high-er focusing on the presented tasks. Reduction of anxiety in the presence of Pascoflair® has been reported in ambulatory surgery patients [19].
According to earlier investigations changes in beta1 power are related to glutamater-gic neurotransmission, whereas changes in beta2 frequencies are related to GABAergic transmission [6]. But there is also evidence from earlier experiments, that beta1 waves are under the control of GABA [20]. However, it is generally accepted, that spectral be-ta power is related to GABAergic transmission [21].
Due to the influence of PASCOFLAIR® on beta activity its mechanism of action can be assumed to be related to changes of glutamatergic and GABAergic transmission, re-spectively. Modulation of the γ-Aminobutyric Acid (GABA) system by Passiflora in-carnata has been recognized earlier based on in vitro experiments [22]. The current re-sults confirm this hypothesis, however, point to an involvement of the glutamatergic system as well. Interestingly, psychometric performance indicated no negative influence on cognitive function. Finally, discriminant analysis confirmed statistically the quick and efficient effectiveness of PASCOFLAIR® in relation to other drugs or herbal prepa-rations confirming and extending the data from the earlier publication. The fast begin of effectiveness defined as cerebral bioavailability of PASCOFLAIR® (within 30 minutes) has been detected already earlier [1]. In this earlier publication 3 tablets were adminis-tered. In the present investigation only 2 tablets were given and fast effectiveness con-firmed at 45 minutes after intake. A further difference to the earlier experimental series consisted in the fact that now subjects suffering from examination anxiety were tested.
5. Conclusion
Psychophysiological characterization of the effect of PASCOFLAIR® in subjects suffer-ing from examination anxiety revealed attenuation of delta, theta and beta spectral power during cognitive and emotional challenges in several brain regions. In view of a significant correlation between beta power and the score of exam anxiety questionnaire PAF (Prüfungsangstfragebogen) this attenuation must be interpreted as ability to counteract examination induced stress symptoms. Results confirm and extend earlier experimental data showing a calming action of PASCOFLAIR®.
Acknowledgements
Mrs. Ingrid K. Keplinger-Dimpfel is thanked for performance of the logistics of the

W. Dimpfel et al.
441
study and quality control. We greatly appreciate the experimental work as well as the data documentation performed by Mrs. Leonie Schombert.
References [1] Dimpfel, W., Koch, K. and Weiss, G. (2012) Single Dose Effects of PASCOFLAIR® on
Current Source Density (CSD) of Human EEG. Neuroscience & Medicine, 3, 130-140. http://dx.doi.org/10.4236/nm.2012.32018
[2] Dimpfel, W., Pischel, I. and Lehnfeld, R. (2004) Effects of a Lozenge Containing Lavender Oil, Extractsfrom Hops, Lemon Balmand Oat on Electrical Brain Activity of Volunteers. European Journal of Medical Research, 9, 423-431.
[3] Dimpfel, W., Koch, K. and Weiss, G. (2011) Early Effect of NEURAPAS® Balance on Current Source Density (CSD) of Human EEG. BMC Psychiatry, 11, 123-138. http://dx.doi.org/10.1186/1471-244X-11-123
[4] Wyczesany, M., Kaiser, J. and Coenen, A.M.L. (2008) Subjective Mood Estimationco-Varies with Spectral Power EEG Characteristics. Acta Neurobiologiae Experimentalis, 68, 180-192.
[5] Dimpfel, W. (2014) Neurophysiological Effects of Rhodiola Rosea Extract Containing Capsules (A Double-Blind, Randomised, Placebo-Controlled Study). International Journal of Nutrition and Food Sciences, 3, 157-165.
[6] Dimpfel, W. (2015) Drug Discovery and Translational Medicine Based on Neurophys- iological Techniques. A Holistic Approach Tosavinganimals. Demand, Norderstedt.
[7] Engert, V., Plessow, F., Miller, R., Kirchbaum, C. and Singer, T. (2014) Cortisol Increase in Empathic Stress Ismodulatedby Emotional Closeness and Observation Modality. Psychoneuroendocrinology, 45, 192-201. http://dx.doi.org/10.1016/j.psyneuen.2014.04.005
[8] Hodapp, V., Rohrmann, S. and Ringeisen, T. (2011) Prüfungsangstfragebogen PAF-S. Hogrefe Verlag, Göttingen.
[9] Dimpfel, W., Chiegoua Dipah, G. and Gericke, N. (2016) Enkephalo Vision: Anatomical Functionality Indicatedby Ultrashort Transient Regional EEG Spectral Power Changes during Cognitiveand Emotional Challenges. World Journal of Neuroscience, 6, 90-108. http://dx.doi.org/10.4236/wjns.2016.62012
[10] Dimpfel, W. (2007) Psychophysiological Effects of Neurexan on Stress-Induced Electro- Psychograms. International Congress on Stress Responses in Biology and Medicine, Budapest, 23-26 August 2007, 23-26.
[11] Dimpfel, W. and Hofmann, H.C. (2014) Neurocode-Tracking Based on Quantitative Fast Dynamic EEG Recording in Combinationwith Eye-Tracking. World Journal of Neuroscience, 4, 106-119. http://dx.doi.org/10.4236/wjns.2014.42013
[12] Hamilton, M. (1959) The Assessment of Anxiety States by Rating. British Journal of Medical Psychology, 32, 50-55. http://dx.doi.org/10.1111/j.2044-8341.1959.tb00467.x
[13] Jasper, H.H. (1958) The Ten-Twenty Electrode System of the International Federation. Electroencephalography and Clinical Neurophysiology, 10, 371-375.
[14] Corradini, P.L. and Persinger, M.A. (2015) Replace Psychmetric Inferences with Direct Brain Measurements: LORETA Reflects Traditional Cerebral Loci for Neuropsychological Tests. Neuroscience and Medicine, 6, 107-115. http://dx.doi.org/10.4236/nm.2015.63018
[15] Neuner, I., Arrubla, J., Werner, C.J., Hitz, K., Boers, F., Kawohl, W. and Shah, N.J. (2014) The Default Mode Network and EEG Regional Spectral Power: A Simultaneous fMRI-EEG Study. PLoS ONE, 9, e88214. http://dx.doi.org/10.1371/journal.pone.0088214

W. Dimpfel et al.
442
[16] Nunez, P.L. and Silberstein, R.B. (2000) On the Relationship of Synaptic Activity to Macroscopic-Measurements: Does Co-Registration of EEG with fMRI Make Sense? Brain Topography, 13, 79-96. http://dx.doi.org/10.1023/A:1026683200895
[17] Laufs, H., Krakow, K., Sterzer, P., Eger, E., Beyerle, A., Salek-Haddadi, A. and Kleinschmidt, A. (2003) Electroencephalographic Signatures of Attentional and Cognitive Default Modes in Spontaneous Brain Activity Fluctuations at Rest. Proceedings of the National Academy of Sciences of the United States of America, 100, 11053-11058. http://dx.doi.org/10.1073/pnas.1831638100
[18] Dzhebrailova, T.D., Korobeĭnikova, I.I. and Rudneva, L.P. (2014) Motivation Effect on EEG Spectral Power and Heart Rate Parameters in Students during Examination Stress. Rossiĭskii fiziologicheskiĭ zhurnal imeni IM Sechenova, 100, 1076-1087.
[19] Movafegh, A., Alizadeh, R., Hajimohamadi, F., Esfehani, F. and Nejatfar, M. (2008) Preoperative Oral Passiflora Incarnata Reduces Anxiety in Ambulatory Surgery Patients: A Double-Blind, Placebo-Controlled Study. Anesthesia and Analgesia, 106, 1728-1732. http://dx.doi.org/10.1213/ane.0b013e318172c3f9
[20] Malizia, A.L., Gunn, R.N., Wilson, S.J., Waters, S.H., Bloomfield, P.M., Cunningham, V.J. and Nutt, D.J. (1996) Benzodiazepine Sitepharmacokinetic/Pharmacodynamic Quantifi- cation in Man: Direct Measurement of Drug Occupancy and Effects on the Human Brain in Vivo. Neuropharmacology, 35, 1483-1491. http://dx.doi.org/10.1016/S0028-3908(96)00072-X
[21] Christian, E.P., Snyder, D.H., Song, W., Gurley, D.A., Smolka, J., Maier, D.L., Ding, M., Gharahdaghi, F., Liu, X.F., Chopra, M., Ribadeneira, M., Chapdelaine, M.J., Dudley, A., Arriza, J.L., Maciag, C., Quirk, M.C. and Doherty, J.J. (2015) EEG-β/γ Spectral Power Elevation in Rat: A Translatable Biomarker Elicited by GABA(Aα2/3)-Positive Allosteric Modulators at Nonsed Atinganxiolytic Doses. Journal of Neurophysiology, 113, 116-131. http://dx.doi.org/10.1152/jn.00539.2013
[22] Appel, K., Rose, T., Fiebich, B., Kammler, T., Hoffmann, C. and Weiss, G. (2011) Modulation of the γ-Aminobutyric Acid (GABA) System by Passiflora incarnata L. Phy- totherapy Research, 25, 838-843. http://dx.doi.org/10.1002/ptr.3352
Submit or recommend next manuscript to SCIRP and we will provide best service for you:
Accepting pre-submission inquiries through Email, Facebook, LinkedIn, Twitter, etc. A wide selection of journals (inclusive of 9 subjects, more than 200 journals) Providing 24-hour high-quality service User-friendly online submission system Fair and swift peer-review system Efficient typesetting and proofreading procedure Display of the result of downloads and visits, as well as the number of cited articles Maximum dissemination of your research work
Submit your manuscript at: http://papersubmission.scirp.org/ Or contact [email protected]