Proms Feasibility Study Final - National Bowel Cancer Audit
12
NATIONAL BOWEL CANCER AUDIT The feasibility of reporting Patient Reported Outcome Measures as part of a national colorectal cancer audit NBOCA: Feasibility Study Date of publication: Thursday 9 th August 2018 About HQIP, the National Clinical Audit and Patient Outcomes Programme and how it is funded: The Healthcare Quality Improvement Partnership (HQIP) is led by a consortium of the Academy of Medical Royal Colleges, the Royal College of Nursing and National Voices. Its aim is to promote quality improvement, and in particular, to increase the impact that clinical audit has on healthcare quality in England and Wales. HQIP holds the contract to manage and develop the National Clinical Audit and Patient Outcomes Programme (NCAPOP), comprising more around 40 programmes covering care provided to people with a wide range of medical, surgical and mental health conditions. The programme is funded by NHS England, the Welsh Government and, with some individual programmes, also funded by the Health Departments of the Scotland, Northern Ireland and the Channel Islands. www.hqip.org.uk.
Transcript of Proms Feasibility Study Final - National Bowel Cancer Audit

NATIONAL BOWEL CANCER AUDIT
The feasibility of reporting Patient Reported Outcome Measures as
part of a national colorectal cancer audit
NBOCA: Feasibility Study
Date of publication: Thursday 9th August 2018
About HQIP, the National Clinical Audit and Patient Outcomes Programme and how it
is funded:
The Healthcare Quality Improvement Partnership (HQIP) is led by a consortium of the Academy of
Medical Royal Colleges, the Royal College of Nursing and National Voices. Its aim is to promote
quality improvement, and in particular, to increase the impact that clinical audit has on healthcare
quality in England and Wales. HQIP holds the contract to manage and develop the National Clinical
Audit and Patient Outcomes Programme (NCAPOP), comprising more around 40 programmes
covering care provided to people with a wide range of medical, surgical and mental health conditions.
The programme is funded by NHS England, the Welsh Government and, with some individual
programmes, also funded by the Health Departments of the Scotland, Northern Ireland and the
Channel Islands. www.hqip.org.uk.
NBOCA PROMs Feasibility Study 2018
2
Introduction
As survival from colorectal cancer improves, there are an increasing number of people living
with or beyond this diagnosis in the United Kingdom (UK)1. However, many of these patients
will have undergone treatment such as surgery, radiotherapy and chemotherapy. As a result
of this, the quality of life of survivors may be significantly reduced.
The Independent Cancer Taskforce report - published in 2015 - provided a wide range of
recommendations on how the National Health Service (NHS) can reduce preventable
cancers, increasing cancer survival and improving patient experience and quality of life by
2020. NHS England and other Arm’s Length Bodies commitment to driving the local delivery
of these recommendations and improving the long term quality of life of people diagnosed
with cancer is a key part of this.
NHS England’s National Cancer PROMs Programme of the National Survivorship Initiative2
collected Patient Reported Outcome Measures (PROMs) for colorectal cancer patients in a
one-off study in 2013. Patients were between one- and three-years from diagnosis at the
point of being surveyed.
The aim of this study was to link the PROMs survey data to the National Bowel Cancer Audit
(NBOCA) data to establish the feasibility of reporting PROMs as part of a national clinical
audit. This was assessed according to i) the characteristics of responders compared to all
eligible patients ii) the representativeness of the responders at different points along their
pathway from diagnosis, iii) hospital trust variation in response rate, and iv) the validity of the
measures in comparison to NBOCA measures.
Methods
Public Health England PROMs survey
A survey was sent out in January 2013 to a cohort of individuals identified via the National
Cancer Registration Service, now known as the National Cancer Registration and Analysis
Service (NCRAS). The following inclusion criteria were used:
Aged over 16 years
Diagnosed with colorectal cancer (International Statistical Classification of Diseases
and Related Health Problems 10th Revision (ICD10) codes C18-20) in 2010 or 2011
and still alive in January 2013
Treatment received in the NHS in England.
34,467 individuals in the NCRAS data who met the inclusion criteria were sent the
questionnaire by post. Of these, 21,802 individuals returned partially or fully completed
questionnaires, giving a response rate of 63.3%.
The questionnaire comprised of 76 questions with an additional comments box. These
questions were divided into the following sections:
General questions - types of treatment received

NBOCA PROMs Feasibility Study 2018
3
Outcome questions - EQ-5D health-related quality of life measure3, a subset of
questions from the Functional Assessment of Cancer Therapy (FACT) instrument
and the Social Difficulties Inventory (SDI) instrument.
Overall support and care - questions covering primary and secondary care received
About you - demographic questions
Linkage to National Bowel Cancer Audit data
There were 36,080 eligible patients identified in the NBOCA data diagnosed between 1st
January 2010 and 31st December 2011 and alive on 1st January 2013.
Linkage of the two datasets was performed based on NHS number, sex, date of birth and
postcode. Data from 18,618 out of the 21,802 (85.4%) individual responses were linked to
NBOCA data.
The NBOCA data were linked to Hospital Episode Statistics (HES) data for additional clinical
variables such as stoma formation and closure. There was a linked HES record for 16,147
patients with a survey response. Some patients had to be excluded due to ineligible Office of
Population Censuses and Surveys (OPCS) codes meaning that procedural details could not
be obtained. Full details of linkage and included patients are shown in Figure 1.
Figure 1 - Flow diagram of study inclusion and data linkage
Feasibility analyses
i) Characteristics of respondents compared to all eligible patients
The characteristics of the 18,004 NBOCA patients with a survey response were compared to
those of the 18,076 patients identified as eligible in the NBOCA dataset for whom there was
no linked survey response.

NBOCA PROMs Feasibility Study 2018
4
ii) Representativeness of the responders at different points from diagnosis
NBOCA data was used to identify date of diagnosis to compare patient characteristics
according to time from diagnosis to survey completion.
iii) Hospital trust variation in response rate
To examine regional variation in response rate, trust and network of diagnosis was
ascertained from NBOCA data.
iv) Validity of measures
For assessing the validity of the survey data, firstly, the agreement between survey
responses and NBOCA/ HES data was compared for whether patients reported undergoing
surgery, receiving radiotherapy or having a stoma.
Secondly, to assess the validity of the EQ-5D health-related quality of life measure, its
correlation with patient demographics, tumour characteristics and treatment modalities was
measured. The five-level version of EQ-5D scores on five domains (mobility, self-care, usual
activities, pain/discomfort and anxiety/depression) which are then summed to give a single
index score. Scores range from -0.5 to 1, where 1 is the maximum score for an individual
reporting no problems in any domain.
It was not possible to use the Functional Assessment of Cancer Therapy (FACT) instrument
to measure quality of life as it has only been validated when all items are measured, and
only a subset of its items were included in the survey.
Results
i) Characteristics of respondents
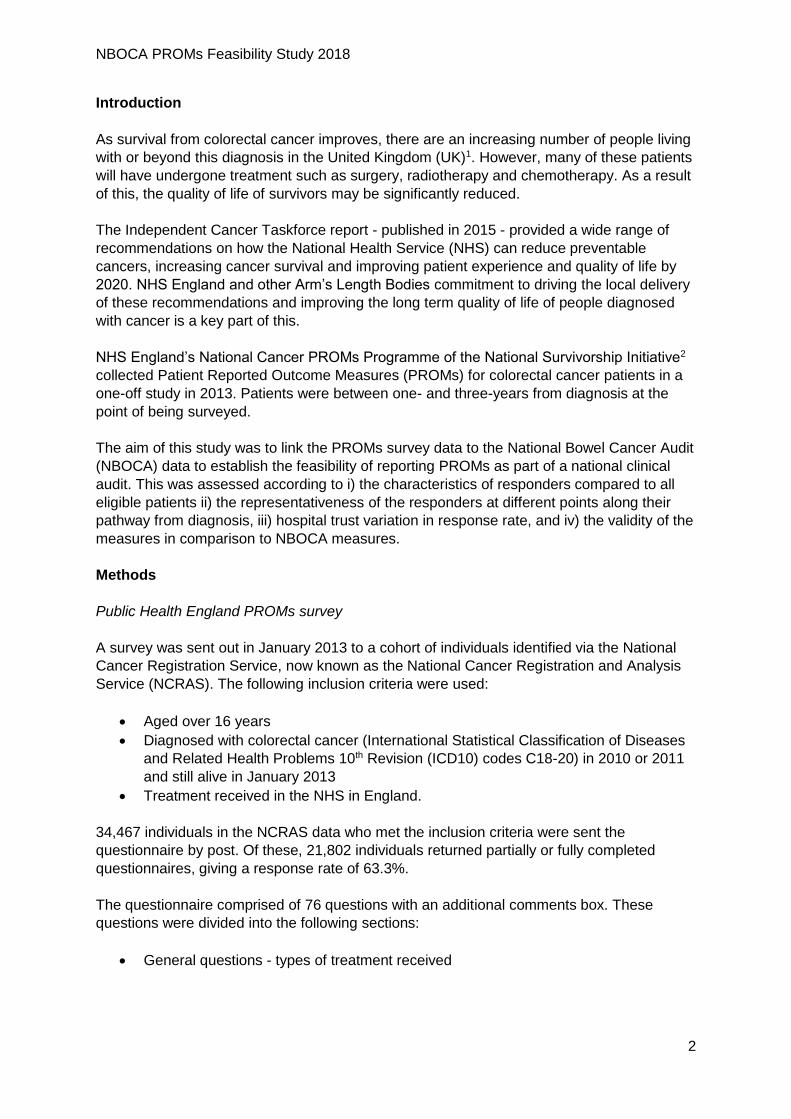
The clinico-pathological characteristics of patients with survey responses and those with no
responses are shown in Table 1. There was no difference in response according to age in
patients under 85 years. Very elderly patients were, however, less likely to respond. Patients
with a completed survey also tended to have less co-morbidities, be less deprived, and were
more likely to have had a major resection. Patients without a response were also more likely
to have missing NBOCA data.
The clinico-pathological characteristics of patients who underwent a major resection with
survey responses and those with no responses are shown in Table 2. Patients with a survey
response tended to have a lower American Society of Anaesthesiologists (ASA) grade but,
generally, the exclusion of those who did not have a major resection made those patients
with a response more representative.
NBOCA PROMs Feasibility Study 2018
5
Table 1 - Characteristics of patients according to PROMS survey response or no response
No response (%)
N=18076
Response (%)
N=18004
Time from diagnosis
12-18 months 5258 (54) 4505 (46)
18-24 months 4577 (50) 4663 (50)
24-30 months 4188 (47) 4789 (53)
30-36 months 4053 (50) 4047 (50)
Age at diagnosis
(years)
≤64 5755 (50) 5879 (50)
65-74 5641 (47) 6491 (53)
75-84 5058 (52) 4684 (48)
≥85 1622 (63) 950 (37)
Charlson co-
morbidity score*
0 11206 (46) 13322 (53)
1 3787 (43) 3306 (57)
≥2 1298 (59) 913 (41)
Missing 1785 463
Index of multiple
deprivation** quintile
1 (most deprived) 3199 (60) 2157 (40)
2 3413 (54) 2933 (46)
3 3770 (49) 3862 (51)
4 3932 (47) 4352 (53)
5 (least deprived) 3540 (43) 4656 (57)
Missing 222 44
Emergency
admission
No 13744 (47) 15549 (53)
Yes 2384 (56) 1906 (44)
Missing 1948 549
T-stage***
0 240 (48) 265 (52)
1 1808 (62) 1105 (38)
2 2381 (45) 2964 (55)
3 7265 (45) 8958 (55)
4 2797 (49) 2861 (51)
Missing 3585 1851
N-stage***
0 8901 (47) 9906 (53)
1 3553 (46) 4147 (54)
2 1896 (48) 2018 (52)
Missing 3726 1933
M-stage***
No 13161 (47) 14872 (53)
Yes 1626 (53) 1436 (47)
Missing 3289 1696
Major resection No 5375 (67) 2692 (33)
Yes 12701 (45) 15312 (55)
*Charlson co-morbidity score – contains 19 categories of co-morbidity and predicts ten-year mortality for a patient who may
have a range of co-morbid conditions. Each condition is assigned a score dependant on its contributing risk of death.
**Index of Multiple Deprivation (IMD) – measure of socioeconomic status. The IMD ranks 32 482 geographical areas of
England according to their level of deprivation measured across seven domains. Patients are grouped in to five socioeconomic
categories based on quintiles of the national ranking of these areas.
***TNM staging – describes the stage of a cancer with alphanumeric codes. T describes the size of the tumour and whether it
has invaded surrounding tissue. N describes involvement of lymph nodes. M describes distant metastasis. Increasing numerical
values correspond to advancing disease.

NBOCA PROMs Feasibility Study 2018
6
Table 2 - Characteristics of patients undergoing major resection according to response
No response (%)
N=12701
Response (%)
N=15312
Time from
diagnosis
12-18 months 3493 (48) 3747 (52)
18-24 months 3258 (45) 3972 (55)
24-30 months 3042 (42) 4165 (58)
30-36 months 2908 (46) 3428 (54)
Age at
diagnosis
(years)
≤64 4108 (45) 4981(55)
65-74 3972 (42) 5569 (58)
75-84 3685 (48) 4035 (52)
≥85 936 (56) 727 (44)
Charlson co-
morbidity score
0 8426 (42) 11468 (58)
1 2839 (50) 2829 (50)
≥2 925 (55) 752 (45)
Missing 511 263
Index of
multiple
deprivation
quintile
1 (most deprived) 2243 (55) 1825 (45)
2 2439 (50) 2476 (50)
3 2618 (44) 3337 (56)
4 2771 (43) 3676 (57)
5 (least deprived) 2475 (38) 3970 (62)
Missing 155 28
Emergency
admission
No 10318 (44) 13384 (56)
Yes 1773 (53) 1598 (47)
Missing 610 330
ASA grade
1 1662 (41) 2402 (59)
2 6228 (43) 8192 (57)
3 3017 (51) 2915 (49)
4 283 (60) 192 (40)
Missing 1511 1611
T-stage
0 214 (47) 244 (53)
1 1054 (54) 894 (46)
2 1996 (53) 2696 (57)
3 6312 (43) 8258 (57)
4 2398 (48) 2594 (52)
Missing 727 626
N-stage
0 7494 (45) 9142 (55)
1 2953 (44) 3738 (56)
2 1540 (46) 1780 (54)
Missing 714 652
M-stage
0 11017 (45) 13709 (55)
1 1132 (50) 1142 (50)
Missing 552 461
Operative
urgency
Elective/Scheduled 10794 (45) 13407 (55)
Emergency/Urgent 1720 (50) 1674 (49)
Missing 187 231

NBOCA PROMs Feasibility Study 2018
7
ii) Representativeness of the responders at different points from diagnosis
The response rate by patient characteristics according to months from diagnosis are shown
in Table 3. Response rate according to characteristics did not appear to change over time
except for the response rate for patients with more advanced tumours (i.e. those with T3/4,
N2 and M1 disease) which appeared to increase up until 24-30 months and then reduce
again in the 30-36 month period.
Table 3 - Response rate by patient characteristics according to months from diagnosis
12-18
months N=4505
18-24 months N=4663
24-30 months N=4789
30-36 months N=4047
Gender Male 2657 (57) 2684 (51) 2795 (54) 2332 (51)
Female 1848 (45) 1976 (50) 1993 (52) 1715 (48)
Age
18-64 1411 (47) 1582 (51) 1546 (53) 1340 (44)
65-74 1608 (50) 1640 (54) 1740 (57) 1502 (54)
75-84 1223 (45) 1200 (49) 1259 (52) 1002 (47)
≥85 263 (33) 241 (37) 243 (41) 203 (38)
Charlson co-
morbidity score
0 3232 (50) 3467 (55) 3606 (58) 3017 (54)
1 876 (44) 842 (45) 852 (49) 736 (48)
≥2 278 (41) 231 (41) 208 (40) 196 (43)
Index of multiple
deprivation quintile
1 (most deprived)
535 (37) 562 (40) 572 (43) 488 (41)
2 744 (43) 782 (48) 781 (49) 626 (46)
3 957 (47) 1021 (52) 992 (53) 892 (51)
4 1030 (45) 1109 (53) 1197 (57) 1016 (54)
5 (least deprived)
1225 (54) 1176 (56) 1239 (61) 1016 (55)
Emergency
admission
No 3871 (49) 4037 (54) 4129 (56) 3512 (53)
Yes 498 (41) 485 (44) 511 (48) 412 (46)
T-stage
0 48 (45) 83 (56) 84 (56) 50 (50)
1 290 (36) 274 (38) 300 (40) 241 (37)
2 731 (51) 799 (58) 789 (59) 645 (54)
3 2253 (51) 2295 (55) 2397 (59) 2013 (56)
4 759 (47) 735 (50) 748 (54) 619 (53)
N-stage
0 2385 (49) 2602 (54) 2690 (56) 2229 (52)
1 1113 (51) 1039 (53) 1092 (58) 903 (54)
2 566 (48) 526 (50) 511 (55) 415 (56)
M-stage 0 3668 (49) 3861 (54) 4017 (56) 3326 (53)
1 425 (43) 374 (44) 365 (52) 272 (51)
Major resection No 758 (30) 691 (35) 624 (35) 619 (35)
Yes 3747 (52) 3972 (55) 4165 (58) 3428 (54)
NBOCA PROMs Feasibility Study 2018
8
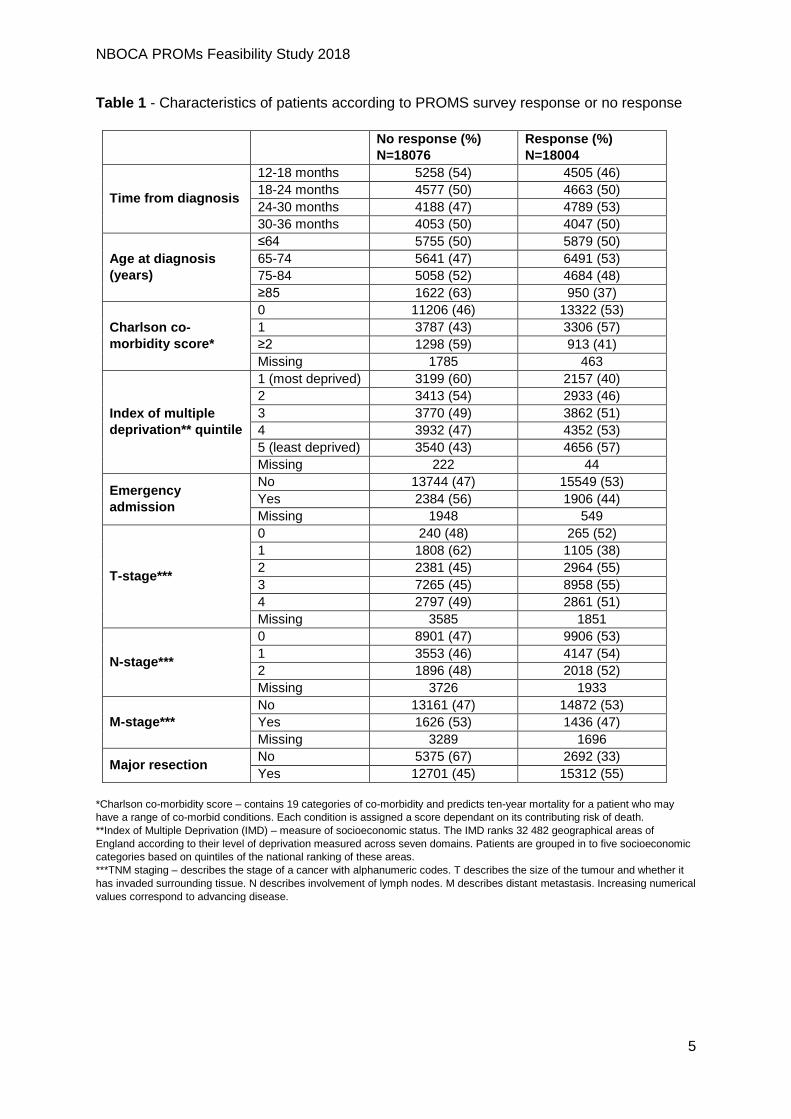
iii) Hospital trust variation in response rate
There was significant variation in the proportion of patients with a completed questionnaire
according to hospital trust of diagnosis as shown in Figure 2. There were 64/142 hospital
trusts outside the 95% confidence intervals (up to 7 would be expected by chance alone).
The range in response rate by hospital trust was large. There were 26 trusts with a response
rate lower than 40% and 13 trusts with a response rate over 60%.
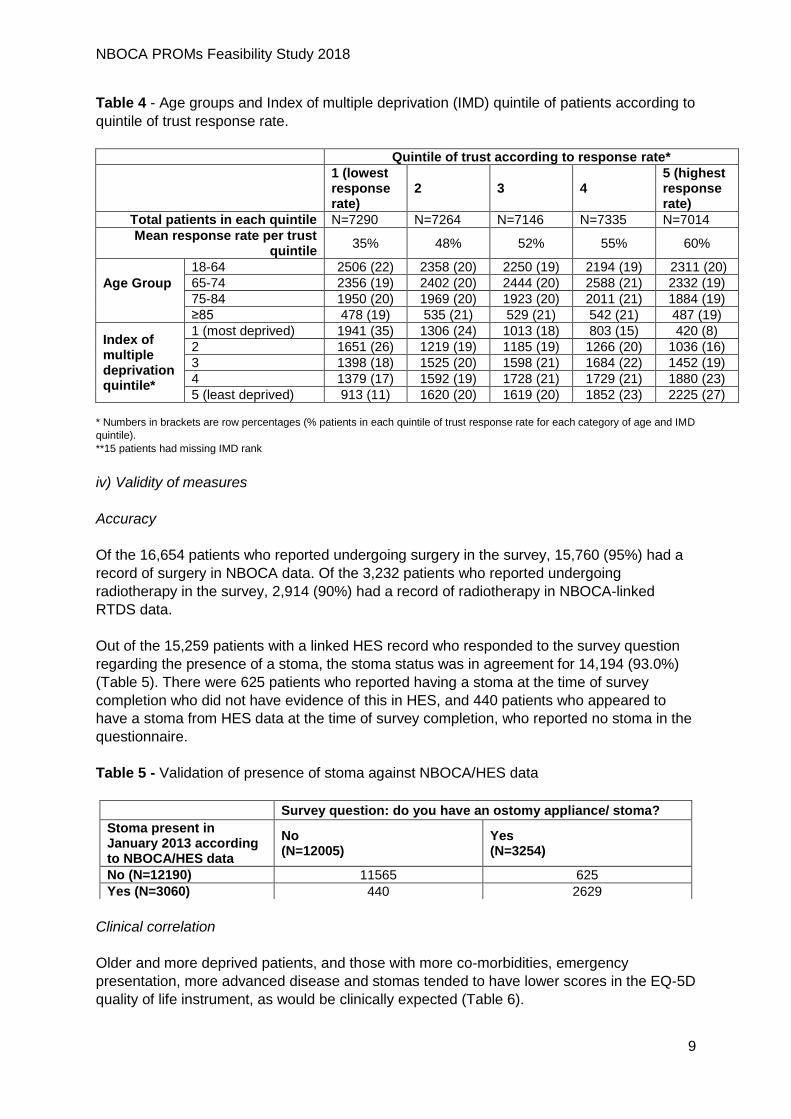
Table 4 demonstrates the age groups and index of multiple deprivation quintile of patients
according to quintile of trust response rate. Age group did not markedly vary according to
Trust response rate quintiles. Trusts within the quintile with the lowest response rate clearly
had a higher proportion of more deprived patients and lower proportion of less deprived
patients. Similarly, trusts within the quintile with the highest response rate clearly had a
higher proportion of less deprived patients and lower proportion of most deprived patients.
Figure 2 - Funnel plots of proportion of patients with completed questionnaire according to
hospital trust of diagnosis
01
02
03
04
05
06
07
08
09
01
00
Com
ple
ted q
uestio
na
ire
(%
)
0 200 400 600 800
Number of patients
Target value 95% limits
Trust value 99.8% limits
NBOCA PROMs Feasibility Study 2018
9
Table 4 - Age groups and Index of multiple deprivation (IMD) quintile of patients according to
quintile of trust response rate.
Quintile of trust according to response rate* 1 (lowest response rate)
2 3 4 5 (highest response rate)
Total patients in each quintile N=7290 N=7264 N=7146 N=7335 N=7014
Mean response rate per trust quintile
35% 48% 52% 55% 60%
Age Group
18-64 2506 (22) 2358 (20) 2250 (19) 2194 (19) 2311 (20)
65-74 2356 (19) 2402 (20) 2444 (20) 2588 (21) 2332 (19)
75-84 1950 (20) 1969 (20) 1923 (20) 2011 (21) 1884 (19)
≥85 478 (19) 535 (21) 529 (21) 542 (21) 487 (19)
Index of multiple deprivation quintile*
1 (most deprived) 1941 (35) 1306 (24) 1013 (18) 803 (15) 420 (8)
2 1651 (26) 1219 (19) 1185 (19) 1266 (20) 1036 (16)
3 1398 (18) 1525 (20) 1598 (21) 1684 (22) 1452 (19)
4 1379 (17) 1592 (19) 1728 (21) 1729 (21) 1880 (23)
5 (least deprived) 913 (11) 1620 (20) 1619 (20) 1852 (23) 2225 (27)
* Numbers in brackets are row percentages (% patients in each quintile of trust response rate for each category of age and IMD
quintile).
**15 patients had missing IMD rank
iv) Validity of measures
Accuracy
Of the 16,654 patients who reported undergoing surgery in the survey, 15,760 (95%) had a
record of surgery in NBOCA data. Of the 3,232 patients who reported undergoing
radiotherapy in the survey, 2,914 (90%) had a record of radiotherapy in NBOCA-linked
RTDS data.
Out of the 15,259 patients with a linked HES record who responded to the survey question
regarding the presence of a stoma, the stoma status was in agreement for 14,194 (93.0%)
(Table 5). There were 625 patients who reported having a stoma at the time of survey
completion who did not have evidence of this in HES, and 440 patients who appeared to
have a stoma from HES data at the time of survey completion, who reported no stoma in the
questionnaire.
Table 5 - Validation of presence of stoma against NBOCA/HES data
Clinical correlation
Older and more deprived patients, and those with more co-morbidities, emergency
presentation, more advanced disease and stomas tended to have lower scores in the EQ-5D
quality of life instrument, as would be clinically expected (Table 6).
Survey question: do you have an ostomy appliance/ stoma?
Stoma present in January 2013 according to NBOCA/HES data
No (N=12005)
Yes (N=3254)
No (N=12190) 11565 625
Yes (N=3060) 440 2629

NBOCA PROMs Feasibility Study 2018
10
Table 6 - Mean EQ-5D score according to patient clinico-pathological characteristics. The
EQ-5D score has a range of -0.5 (worst quality of life) to 1 (best quality of life).
There were 4,004 patients identified as having a major resection for rectal cancer. Of these,
3,827 were survey respondents. 1,909 of these respondents having major resection for
rectal cancer underwent radiotherapy, with 1,677 patients having clearly defined pre- or
post-operative regimens.
In rectal cancer patients who had undergone major resection, those who had received long
course radiotherapy pre-operatively tended to have a lower EQ-5D score than patients with
no record of radiotherapy (Table 7).
Mean EQ-5D score
Time from
diagnosis
12-18 months 0.79
18-24 months 0.80
24-30 months 0.79
30-36 months 0.79
Age at diagnosis
(years)
18-64 0.80
65-74 0.82
75-84 0.76
≥85 0.67
No. of
comorbidities
(Charlson score)
0 0.81
1 0.74
≥2 0.64
IMD deprivation
quintile
1 (most deprived) 0.71
2 0.76
3 0.79
4 0.81
5 (least deprived) 0.83
Emergency
admission
No 0.80
Yes 0.73
Colorectal cancer
site
Right 0.79
Left 0.81
Rectum 0.77
T-stage
0 0.79
1 0.84
2 0.81
3 0.79
4 0.76
N-stage
0 0.81
1 0.78
2 0.77
M-stage No 0.80
Yes 0.73
Major resection No 0.74
Yes 0.80
Presence of a
stoma
No 0.81
Yes 0.72

NBOCA PROMs Feasibility Study 2018
11
Table 7 - Mean EQ-5D score according to patient clinico-pathological characteristics in
rectal cancer patients undergoing major resection according to radiotherapy received
(N=3595).
Mean EQ-5D score
Long-course (pre-surgery) N=1067
0.75
Long-course (post-surgery) N=75
0.80
Short-course (immediately before surgery) N=510
0.77
Short-course (with delay) N=25 0.75
No radiotherapy N=1918 0.80
Summary and conclusions
This report details the results of a study examining the feasibility of reporting PROMs as part
of a national audit of colorectal cancer patients in order to assess the quality of life in
survivors.
Overall, PROMs survey responses did differ according to patient characteristics. Patients
were less likely to respond if they were elderly, co-morbid, deprived or admitted as an
emergency. Response rates did not vary considerably suggesting no optimal time for survey
completion.
A slightly higher number of eligible patients were identified by NBOCA than NCRAS. There
was reasonable linkage of the two datasets and linkage to HES. Improvements are required
in overall response rate to the survey, as well as optimisation of linkage of NBOCA records
to PROMs surveys. There was wide variation in response rate according to hospital trust of
diagnosis. This may, in part, be explained by differences in deprivation and linkage rates
between trusts, but requires further investigation.
This report demonstrates good accuracy and validity of survey responses such as whether
patients underwent surgery, had radiotherapy or have a stoma, when compared to NBOCA
data. It also showed that quality of life scores tended to be lower in patients that we would
expect to have a poorer quality of life (e.g. elderly patients, those with advanced disease,
those with stomas).
Overall, this study supports the accuracy and validity of Patient Reported Outcome
Measures in a national study of colorectal cancer survivors. Clinical correlation of results has
been demonstrated providing evidence to support the PROMs survey as a useful tool in
measuring quality of life.
The study demonstrates the value of linking PROMs with national clinical datasets; such
linkage allows validation of patient responses and access to more detailed data facilitating
improved understanding and interpretation of these responses. Linkage of national clinical
audit data to quality of life indicators would allow the assessment of the impact of different
treatment modalities on survivors’ quality of life and target important areas for improvement.
It could also provide a source of information for patients at the start of their cancer pathway
in terms of helping them to make more informed decisions about their choice of treatment
and facilitate discussion of expectations.

NBOCA PROMs Feasibility Study 2018
12
Unfortunately the cancer-specific quality of life instrument included in the survey was only
collected for a selection of items and therefore could not be used in this feasibility study.
However, as recommended by the Independent Cancer Taskforce Report, NHS England is
piloting a quality of life metric in three tumour sites (breast, colorectal and prostate), prior to
national roll-out. This should provide further evidence of the effectiveness of PROMs as a
tool for measuring quality of life in cancer survivors.
This study demonstrates the value of collection of PROMS data on a national level. It
highlights, however, lower response rates for certain patient groups, and particularly large
variation in response rate by hospital trust. Currently, NBOCA performance indicators are
clinical measures and incorporation of patient perspectives via PROMs would be invaluable
in further evaluating quality of care. However, given the variation in response rate by trust,
and the lack of representativeness of responders, monitoring of provider performance based
on PROMs data, collected by postal survey, can only be used if the impact of patient
characteristics on response rates is taken into account.
References
1. Maddams J, Utley M, Moller H. Projections of cancer prevalence in the United
Kingdom, 2010-2040. Brit J Cancer 2012; 107:1195-1202.
2. Glaser et al. Quality of Life of Colorectal Cancer Survivors in England: Report on a
National Survey of Colorectal Cancer Survivors using Patient Reported Outcome
Measures (PROMS). NHS England 2015
3. EQ-5D. 2017. Available from [https://euroqol.org/eq-5d-instruments/]