Prompt Oil Price ($/bbl) $53.95 ($2.07) (3.7%) Let’s ... · Viper Energy Partners LP, a...
16
1 August 5, 2019 $2.2 $8.0 $9.9 $10.7 $4.9 $15.8 $21.2 $21.9 $24.1 $17.0 $9.1 $9.2 $20.8 $8.2 $31.6 $19.5 $1.7 $7.4 -- 50 100 150 200 250 300 350 400 450 500 -- $5 $10 $15 $20 $25 $30 $35 $40 1Q15 2Q15 3Q15 4Q15 1Q16 2Q16 3Q16 4Q16 1Q17 2Q17 3Q17 4Q17 1Q18 2Q18 3Q18 4Q18 1Q19 2Q19 3Q19 61% 83% 74% 79% 39% 52% 62% 71% 93% 24% 68% 82% 91% 64% 46% 93% 51% 95% 73% Number of Transactions Transaction Value ($bn) Asset Corporate Number of Transactions % Oil % Oil % Oil $64.3 Indicator Current Value Week's Change % Change Direction Prompt Oil Price ($/bbl) $53.95 ($2.07) (3.7%) Prompt Gas Price ($/mmbtu) $2.20 ($0.04) (1.8%) Wkly Trans. Value ($mm) $3,015 $2,030 206% Wkly Trans. Count 8 4 100% US Rig Count 942 (4) (0.4%) US Oil Prod'n (mmbbl/d) 12.2 0.9 8.0% US Gas Prod'n (bcf/d) (1) 109.2 (0.7) (0.6%) US Oil Storage (mmbbl) 436.5 (8.5) (1.9%) US Gas Storage (tcf) 2.6 0.1 2.5% Ecopetrol and Occidental Petroleum Corporation formed a $1.5 billion joint venture to develop acreage in Midland Basin Viper Energy Partners signed an agreement to acquire mineral and royalty interests from Diamondback Energy in a transaction valued at $700 million Osaka Gas acquired Sabine Oil & Gas for $610 million (see page 4 for more detail) Continental Resources acquired additional leasehold in the SCOOP for $79.5 million Continental concurrently announced that it sold its eastern STACK water gathering and recycling system in Blaine County, OK for $85 million to Lagoon Water Solutions Harvest Oil & Gas Corporation divested Barnett Shale assets for $72 million Whiting Petroleum sold 6,800 non-op net acres for $53 million INPEX Corporation acquired U.S. Gulf of Mexico assets from Anadarko Concho Resources and Solaris Water Midstream formed a joint venture focused on optimizing produced water logistics at scale in the Northern Delaware Basin Debt Markets Ten issuers priced 12 tranches for $8.1 billion in proceeds U.S. high yield funds reported an outflow of $115 million High yield index yield was 6.01%; high yield energy index yield was 8.45% Source: BMO Transaction Database, Baker Hughes, BMO Commodity Products Group, Bloomberg, EIA, PLS Note: Current quarter’s data is through the week covered by this issue. 1. EIA U.S. natural gas gross withdrawals and production reported monthly as of May 2019. 2. S&P E&P = S&P Oil & Gas E&P Select Industry, SPX = S&P 500 Index. Key Industry Indicators Quarterly Deal Activity S&P E&P (2) underperformed last week (3.8)% vs. SPX (2) (1.7)% The major U.S. equity indexes finished mostly lower last week. Consumer discretionary, consumer staples, financials, industrials, materials, health care, and technology finished lower. Real estate finished higher Equity Markets Oil ended last week down. On Thursday, WTI had the worst drop in four years. President Trump announced 10% tariffs on an additional $300 billion of Chinese imports, including technology products and consumer products. The U.S. Fed announced a rate cut. The news of a tighter military alliance between Russia and Iran with planned activities in the Strait also affected the market. Additionally, Israel expanded airstrikes against Iranian assets in Iraq and Syria in the last couple of weeks. The near-term contract closed down $2.07, or 3.7%, at $53.95 Natural gas ended last week down. Cameron LNG received FERC approval to start service. Transwestern announced a force majeure on its westbound line from WAHA to New Mexico following a compressor malfunction. There was also an explosion on TETCO that caused a force majeure to be issued south of the Dansville Compressor station in Kentucky. The EIA storage number had a higher build than expected. The near-term contract closed down $0.04, or 1.8%, at $2.20 Commodities Week in Review Covering the Week of July 26 to August 1, 2019 All references to last week in the comments below are through Thursday
Transcript of Prompt Oil Price ($/bbl) $53.95 ($2.07) (3.7%) Let’s ... · Viper Energy Partners LP, a...

1
August 5, 2019
$2.2
$8.0
$9.9 $10.7
$4.9
$15.8
$21.2 $21.9 $24.1
$17.0
$9.1 $9.2
$20.8
$8.2
$31.6
$19.5
$1.7
$7.4
--
50
100
150
200
250
300
350
400
450
500
--
$5
$10
$15
$20
$25
$30
$35
$40
1Q15 2Q15 3Q15 4Q15 1Q16 2Q16 3Q16 4Q16 1Q17 2Q17 3Q17 4Q17 1Q18 2Q18 3Q18 4Q18 1Q19 2Q19 3Q19
61% 83% 74% 79% 39% 52% 62% 71% 93% 24% 68% 82% 91% 64% 46% 93% 51% 95% 73%
Nu
mb
er
of
Tra
ns
ac
tio
ns
Tra
ns
ac
tio
n V
alu
e (
$b
n)
Asset Corporate Number of Transactions
% Oil% Oil% Oil
$64.3
IndicatorCurrent
Value
Week's
Change
%
Change Direction
Prompt Oil Price ($/bbl) $53.95 ($2.07) (3.7%)
Prompt Gas Price ($/mmbtu) $2.20 ($0.04) (1.8%)
Wkly Trans. Value ($mm) $3,015 $2,030 206%
Wkly Trans. Count 8 4 100%
US Rig Count 942 (4) (0.4%)
US Oil Prod'n (mmbbl/d) 12.2 0.9 8.0%
US Gas Prod'n (bcf/d)(1) 109.2 (0.7) (0.6%)
US Oil Storage (mmbbl) 436.5 (8.5) (1.9%)
US Gas Storage (tcf) 2.6 0.1 2.5%
Ecopetrol and Occidental Petroleum Corporation formed a $1.5
billion joint venture to develop acreage in Midland Basin
Viper Energy Partners signed an agreement to acquire mineral
and royalty interests from Diamondback Energy in a transaction
valued at $700 million
Osaka Gas acquired Sabine Oil & Gas for $610 million (see page
4 for more detail)
Continental Resources acquired additional leasehold in the
SCOOP for $79.5 million
Continental concurrently announced that it sold its eastern
STACK water gathering and recycling system in Blaine County,
OK for $85 million to Lagoon Water Solutions
Harvest Oil & Gas Corporation divested Barnett Shale assets for
$72 million
Whiting Petroleum sold 6,800 non-op net acres for $53 million
INPEX Corporation acquired U.S. Gulf of Mexico assets from
Anadarko
Concho Resources and Solaris Water Midstream formed a joint
venture focused on optimizing produced water logistics at scale in
the Northern Delaware Basin
Debt
Markets
Ten issuers priced 12 tranches for $8.1 billion in proceeds
U.S. high yield funds reported an outflow of $115 million
High yield index yield was 6.01%; high yield energy index yield was 8.45%
Source: BMO Transaction Database, Baker Hughes, BMO Commodity Products Group, Bloomberg, EIA, PLS
Note: Current quarter’s data is through the week covered by this issue.
1. EIA U.S. natural gas gross withdrawals and production reported monthly as of May 2019.
2. S&P E&P = S&P Oil & Gas E&P Select Industry, SPX = S&P 500 Index.
Key Industry Indicators
Quarterly Deal Activity
S&P E&P(2) underperformed last week (3.8)% vs. SPX(2) (1.7)%
The major U.S. equity indexes finished mostly lower last week. Consumer discretionary, consumer staples,
financials, industrials, materials, health care, and technology finished lower. Real estate finished higher
Equity
Markets
Oil ended last week down. On Thursday, WTI had the worst drop in four years. President Trump announced
10% tariffs on an additional $300 billion of Chinese imports, including technology products and consumer
products. The U.S. Fed announced a rate cut. The news of a tighter military alliance between Russia and Iran
with planned activities in the Strait also affected the market. Additionally, Israel expanded airstrikes against
Iranian assets in Iraq and Syria in the last couple of weeks. The near-term contract closed down $2.07, or
3.7%, at $53.95
Natural gas ended last week down. Cameron LNG received FERC approval to start service. Transwestern
announced a force majeure on its westbound line from WAHA to New Mexico following a compressor
malfunction. There was also an explosion on TETCO that caused a force majeure to be issued south of the
Dansville Compressor station in Kentucky. The EIA storage number had a higher build than expected. The
near-term contract closed down $0.04, or 1.8%, at $2.20
Commodities
Week in Review
Let’s follow these guidelines when sorting articles:
• First priority: Domestic A&D, ranked by size
• Next: Domestic M&A
• Then: US companies doing international deals (like
Noble’s Tamar)
• Then: Others (Cabot’s Lackawanna)
• Then: Prices, rig count, completions, etc.
To paste the arrows with colors,
• FactSet
• Settings
• Presentation Linking and Formatting
• Import
• Colors
• Change Color Font Covering the Week of July 26 to August 1, 2019
This is the final issue for 2018. The Market Monitor will
return on Monday, January 7th. Happy Holidays from the
BMO Capital Markets team!
The October issue of BMO Calgary’s A&D (Canadian) Market
Monitor went live last week – read more here
All references to last week in the comments below are through Thursday
WTI had the worst drop in four years on Thursday. President Trump
announced 10% tariffs on an additional $300 billion of Chinese imports,
including technology products and many consumer products. The U.S.
Fed announced a rate cut. The news of a tighter military alliance
between Russia and Iran with planned activities in the Strait also
affected the market. Additionally, Israel expanded airstrikes against
Iranian assets in Iraq and Syria in the last couple of weeks.
Cameron LNG received FERC approval to start service. Transwestern
announced a force majeure on its westbound line from WAHA to New
Mexico following a compressor malfunction. There was also an
explosion on TETCO that caused a force majeure to be issued south of
the Dansville Compressor station in Kentucky. The EIA storage number
had a higher build than expected.
[TBU]
[TBU]
[TBU]
[TBU]
[TBU]
[TBU] [TBU]
[TBU]
2
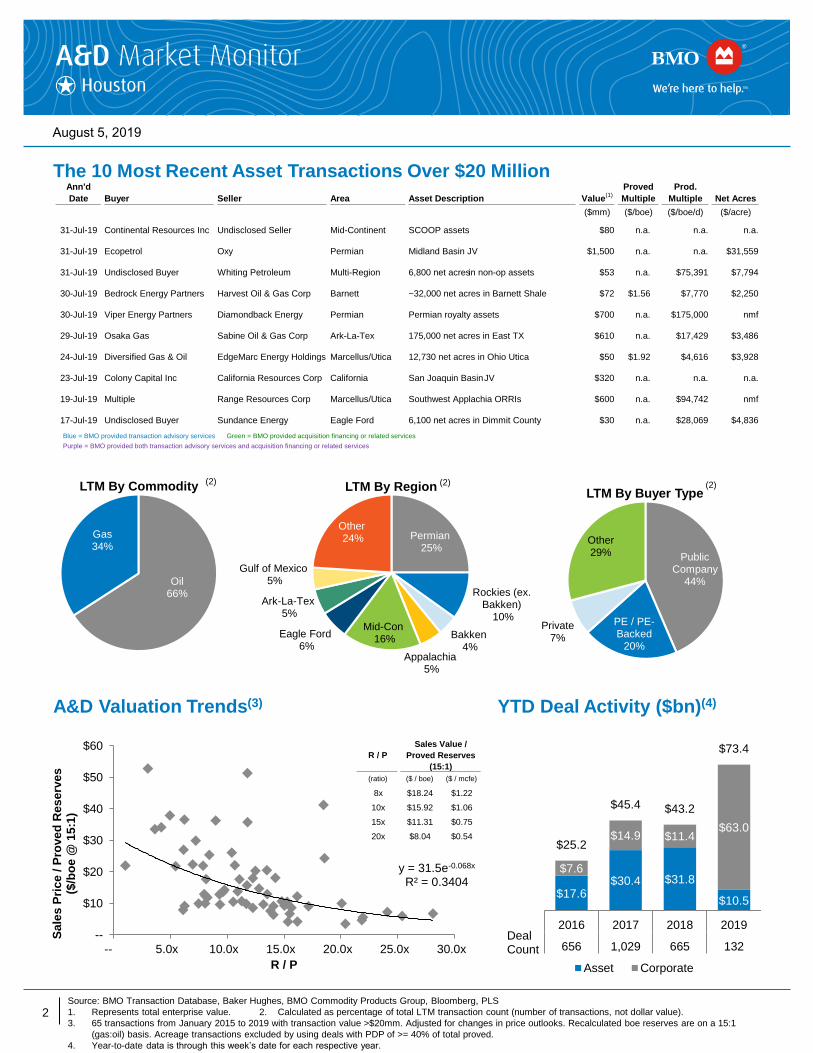
August 5, 2019
Ann'd
Date Buyer Seller Area Asset Description Value(1)
Proved
Multiple
Prod.
Multiple Net Acres
($mm) ($/boe) ($/boe/d) ($/acre)
31-Jul-19 Continental Resources Inc Undisclosed Seller Mid-Continent SCOOP assets $80 n.a. n.a. n.a.
31-Jul-19 Ecopetrol Oxy Permian Midland Basin JV $1,500 n.a. n.a. $31,559
31-Jul-19 Undisclosed Buyer Whiting Petroleum Multi-Region 6,800 net acres in non-op assets $53 n.a. $75,391 $7,794
30-Jul-19 Bedrock Energy Partners Harvest Oil & Gas Corp Barnett ~32,000 net acres in Barnett Shale $72 $1.56 $7,770 $2,250
30-Jul-19 Viper Energy Partners Diamondback Energy Permian Permian royalty assets $700 n.a. $175,000 nmf
29-Jul-19 Osaka Gas Sabine Oil & Gas Corp Ark-La-Tex 175,000 net acres in East TX $610 n.a. $17,429 $3,486
24-Jul-19 Diversified Gas & Oil EdgeMarc Energy Holdings Marcellus/Utica 12,730 net acres in Ohio Utica $50 $1.92 $4,616 $3,928
23-Jul-19 Colony Capital Inc California Resources Corp California San Joaquin Basin JV $320 n.a. n.a. n.a.
19-Jul-19 Multiple Range Resources Corp Marcellus/Utica Southwest Applachia ORRIs $600 n.a. $94,742 nmf
17-Jul-19 Undisclosed Buyer Sundance Energy Eagle Ford 6,100 net acres in Dimmit County $30 n.a. $28,069 $4,836
Blue = BMO provided transaction advisory services Green = BMO provided acquisition financing or related services
Purple = BMO provided both transaction advisory services and acquisition financing or related services
Oil66%
Gas34%
LTM By Commodity
Permian25%
Rockies (ex. Bakken)
10%
Bakken4%
Appalachia5%
Mid-Con16%
Eagle Ford6%
Ark-La-Tex5%
Gulf of Mexico5%
Other24%
LTM By Region
Public Company
44%
PE / PE-Backed
20%
Private7%
Other29%
LTM By Buyer Type
R / P
Sales Value /
Proved Reserves
(15:1)
(ratio) ($ / boe) ($ / mcfe)
8x $18.24 $1.22
10x $15.92 $1.06
15x $11.31 $0.75
20x $8.04 $0.54
y = 31.5e-0.068x
R² = 0.3404
--
$10
$20
$30
$40
$50
$60
-- 5.0x 10.0x 15.0x 20.0x 25.0x 30.0x
Sa
les
Pri
ce
/ P
rove
d R
es
erv
es
($
/bo
e @
15
:1)
R / P
The 10 Most Recent Asset Transactions Over $20 Million
A&D Valuation Trends(3)
Source: BMO Transaction Database, Baker Hughes, BMO Commodity Products Group, Bloomberg, PLS
1. Represents total enterprise value. 2. Calculated as percentage of total LTM transaction count (number of transactions, not dollar value).
3. 65 transactions from January 2015 to 2019 with transaction value >$20mm. Adjusted for changes in price outlooks. Recalculated boe reserves are on a 15:1
(gas:oil) basis. Acreage transactions excluded by using deals with PDP of >= 40% of total proved.
4. Year-to-date data is through this week’s date for each respective year.
(2) (2) (2)
Confirm number of transactions weekly --->
[TBU]
[TBU]
[TBU]
YTD Deal Activity ($bn)(4)
$17.6 $30.4 $31.8
$10.5
$7.6
$14.9 $11.4 $63.0
$25.2
$45.4 $43.2
$73.4
2016 2017 2018 2019
656 1,029 665 132
Asset Corporate
Deal Count

3
August 5, 2019
Select Significant Deals on the Market
Disclaimer: The foregoing links are for convenience only and relate to materials that were not prepared or reviewed by BMO Capital Markets. BMO Capital Markets takes
no responsibility for and makes no representations with respect to the contents thereof. These materials may be inconsistent with the views of BMO Capital Markets.
Source of Select Significant Deals on the Market: BMO Transaction Database
Source of Headlines: Press releases
Industry Headlines
Appalachia
2 Deals
Mid-Con
6 Deals
Eagle Ford
9 Deals
Permian
17 Deals
Other
11 Deals
Rockies
4 Deals
(Click headline to link to the full article)
M&A&D Headlines
Bakken
5 Deals
Ark-La-Tex
3 Deals
BMO Deals (Status)
Enerplus Elm Coulee (In Market) – See page 6
OPEC Production Lowest Since 2014 as U.S. Squeeze on
Iran Continues
Industry Economist Sees Headwinds Inhibiting U.S., Texas
Upstream Expansion During 2H-2019
BP Avoids Sending its Tankers through the Strait of Hormuz
Big Crude Inventories Draw Gives Bullish Boost to Oil
EIA: U.S. Crude Oil Production Continues to Set Records
Global Energy Workforce Shifting from Onshore Shale to
Offshore
Oil Slides as Dollar Strengthens After Fed's Cautious Rate
Cut
Excess Supply Drives Asia LNG to 10-Year Low
Concho Resources Inc. and Solaris Water Midstream Form
Joint Venture for Produced Water Management in the
Northern Delaware Basin
Ecopetrol and Occidental Form Strategic Partnership to
Develop Acreage in Midland Basin
Viper Energy Partners LP, a Subsidiary of Diamondback
Energy, Inc., Reports Second Quarter 2019 Financial and
Operating Results; Announces Significant Drop Down
Transaction
Japan's Osaka Gas to Buy Sabine Oil for $610 Million
ConocoPhillips Reports Second-Quarter 2019 Results;
Delivered Strong Free Cash Flow and Financial Returns;
Raised 2019 Planned Share Buybacks (includes A&D
announcement)
Continental Resources Announces $85 Million Divestiture of
Water Handling Facility in STACK and Strategic Initiatives
(includes A&D announcement)
Harvest Oil & Gas Announces Divestiture of Barnett Shale
Assets
Whiting Petroleum Corporation Announces Second Quarter
2019 Financial and Operating Results (includes A&D
announcement)
INPEX Acquires Keathley Canyon Blocks 921/965
Talos Energy Announces Full Year 2019 Operating
and Financial Guidance (includes A&D
announcement)
BMO Deals (Status)
Juno Permian (In Market) – See page 4
Rio Glasscock County (In Market) – See page 5
[TBU]
[TBU] [TBU]
7/28/2019
Appalachia 2
Ark-La-Tex 3
Bakken 5
Eagle Ford 9
Mid-Con 6
Other 11
Permian 17
Rockies 4
57
[TBU]

4
August 5, 2019
On July 29, 2019, Osaka Gas Co Ltd (“Osaka”)
announced it acquired Sabine Oil & Gas Corporation
(“Sabine”) for $610 million
This transaction is expected to close by YE 2019
TRANSACTION SUMMARY
Source: Press releases, company disclosure, marketing brochure
1. Value adjusted by $2,000 per flowing mcfe/d.
ASSET SUMMARY
175,000 net acres in East Texas
Primarily in Harrison, Panola, Rusk, and Upshur
counties, TX
66,768 net acres targeting the Haynesville
1,200 wells producing 210 mmcfe/d
Significant drilling inventory in the Haynesville and
Cotton Valley formations
Proved developed reserves of 490 bcfe
~1,695 undeveloped locations
1,066 Haynesville
620 Cotton Valley
9 Other
Interesting Deal of the Week:
Osaka Gas Acquires Sabine Oil & Gas for $610 Million
ACQUIRED ASSETS TRANSACTION METRICS
Rockies
Permian
Gulf of Mexico
Algeria
Ghana
Mozambique
This transaction marks the first acquisition of a U.S.
shale gas developer by a Japanese company
In July 2018, Osaka bought a 35% stake in the
eastern half of the asset being developed by Sabine
OBSERVATIONS
Purchase Price (US$ mm)
Total Consideration $610
Metrics
Net Acres 175,000
Haynesville Net Acres 66,768
Net Production (mcfe/d) 210,000
Undeveloped Locations 1,695
Proved Developed Reserves (bcfe) 490
Multiples
TEV / Net Acres ($/acre) $3,486
TEV / Adj. Net Acres ($/acre)(1) $1,086
TEV / Haynesville Net Acres ($/acre) $9,136
TEV / Adj. Haynesville Net Acres ($/acre)(1) $2,846
TEV / Net Production ($/mcfe/d) $2,905
TEV / Net Location ($mm/location) $0.4
TEV / Adj. Net Location ($mm/location)(1) $0.1
TEV / PD Reserves ($/mcfe) $1.24
Sabine Assets

5
August 5, 2019
25%
35%
45%
55%
65%
Feb-16 Aug-16 Feb-17 Aug-17 Feb-18 Aug-18 Feb-19 Aug-19
% o
f W
TI
NGL as % of WTI
$1
$2
$3
$4
$5
Jul-18 Jan-19 Jul-19 Jan-20 Jul-20
($/m
mb
tu)
$20
$30
$40
$50
$60
$70
$80
Jul-18 Jan-19 Jul-19 Jan-20 Jul-20
($/b
bl)
Historical Prices as of 01-Aug-19 Close ($/gal)
NGLs Current Last Wk. 6 Mo. Ago 1 Yr. Ago
Ethane $0.13 $0.14 $0.35 $0.37
Propane $0.45 $0.49 $0.70 $0.94
Butane $0.47 $0.50 $0.75 $1.03
Iso-butane $0.66 $0.60 $0.93 $1.15
Pentane+ $1.03 $1.03 $1.19 $1.51
NYMEX Gas Futures as of 01-Aug-19 Close ($/mmbtu)
Period(1) Current Last Wk. 6 Mo. Ago 1 Yr. Ago
12 Mo. Strip $2.40 $2.41 $2.84 $2.76
2019 $2.30 $2.32 $2.79 $2.71
2020 $2.48 $2.49 $2.70 $2.60
2021 $2.55 $2.55 $2.62 $2.57
2022 $2.73 $2.73 $2.80 $2.71
2023 $2.73 $2.73 $2.80 $2.71
NYMEX WTI Futures as of 01-Aug-19 Close ($/bbl) NYMEX Gas Futures as of 01-Aug-19 Close ($/mmbtu)
Period(1) Current Last Wk. 6 Mo. Ago 1 Yr. Ago
12 Mo. Strip $53.37 $55.71 $56.33 $64.62
2019 $53.99 $56.18 $56.32 $63.69
2020 $52.65 $55.06 $55.82 $60.52
2021 $50.77 $53.09 $54.77 $57.99
2022 $50.21 $52.27 $54.22 $56.13
2023 $50.64 $52.31 $54.13 $54.91
NGL PRICING(2)
HENRY HUB NATURAL GAS (HISTORICAL / FORECAST)
Commodity Prices
Source: BMO Commodity Products Group, Bloomberg, FactSet
1. Future prices are calendar year average unless stated otherwise.
2. Assumes typical Gulf Coast barrel composition.
WTI OIL (HISTORICAL / FORECAST)
Links:
http://www.nasdaq.com/markets/crude-oil.aspx
http://www.bloomberg.com/quote/CL1:COM
http://www.nasdaq.com/markets/natural-gas.aspx
http://www.bloomberg.com/quote/NG1:COM
Link to Detailed
Futures Data
Link to Detailed
Historical Graph
Link to Detailed
Futures Data
Link to Detailed
Historical Graph
[TBU]
[TBU]
[TBU]

6
August 5, 2019
Clearbrook
Midland
Cushing
St. James
(LLS)
East Coast
U.S. (Brent)
Midland Sweet-
Sour Spread
EMS
AECO
Northern
California
Sumas
Southern
California
El Paso - SJ
Waha
HSC
Henry Hub
Panhandle
CIG Chicago
Dominion
Transco
NATURAL GAS PRICING & DIFFERENTIALS TO HENRY HUB ($ / MMBTU) – AS OF 01-AUG-19
Commodity Prices (cont’d)
OIL PRICING & DIFFERENTIALS TO CUSHING WTI ($ / BBL) – AS OF 01-AUG-19
Legend
Price
Diff.
Legend
Price
Diff.
Source: BMO Commodity Products Group, Bloomberg
Note: Prices and differentials are for prompt month futures except for Clearbrook which is based on spot prices.
MAPS IN
MASTER VIEW
TBU
[TBU]
[TBU]
$53.95
($1.08) $57.80
$3.85
$1.67
($0.53)
$1.62
($0.58)
$2.20
$1.99
($0.21)
$54.03
$0.08
$60.50
$6.55
$56.20
$2.25
$47.21
($6.74)
$1.86
($0.34)
$2.11
($0.09)
$1.20
($1.00)
$1.55
($0.65)$1.67
($0.53)$2.27
$0.07
$0.94
($1.26)$1.80
($0.40)
$2.56
$0.36
[TBU]

7
August 5, 2019
0%
10%
20%
30%
40%
50%
--
100
200
300
400
500
Jan-15 Jan-16 Jan-17 Jan-18 Jan-19
H V+D % of Total Rigs
Item Value Wkly Change Last Week Item Value Wkly Change Last Week
Rig Count 442 (1) 443 Oil Differential ($1.00) $1.85 ($2.85)
Permitting Activity 122 (90) 212 Gas Differential ($1.03) $0.35 ($1.39)
-$4.80
-$3.20
-$1.60
$0.00
$1.60
Jan-15 Jan-16 Jan-17 Jan-18 Jan-19
-$18.00
-$12.00
-$6.00
$0.00
$6.00
$ /
mm
btu
$ /
bb
l
Midland Waha
1,148 1,223993
1,212
1,010868
1,247
1,0651,207
1,050
1,256
910760
Jul-18 Sep-18 Nov-18 Jan-19 Mar-19 May-19 Jul-19
H V+D
5,000
6,000
7,000
8,000
9,000
10,000
11,000
12,000
13,000
14,000
1,000
1,500
2,000
2,500
3,000
3,500
4,000
4,500
Jan-15 Jul-15 Jan-16 Jul-16 Jan-17 Jul-17 Jan-18 Jul-18 Jan-19
mm
cf/
d
mb
bl/
d
Oil Gas
4,038
13,520
--
$50,000
$100,000
$150,000
$200,000
1Q
15
2Q
15
3Q
15
4Q
15
1Q
16
2Q
16
3Q
16
4Q
16
1Q
17
2Q
17
3Q
17
4Q
17
1Q
18
2Q
18
3Q
18
4Q
18
1Q
19
2Q
19
3Q
19
1 2 6 9 5 7 11 9 9 6 1 0 7 2 5 4 1 2 1
$ /
bo
e/d
# Deals
$119,063
--$10,000$20,000$30,000$40,000$50,000$60,000
1Q
15
2Q
15
3Q
15
4Q
15
1Q
16
2Q
16
3Q
16
4Q
16
1Q
17
2Q
17
3Q
17
4Q
17
1Q
18
2Q
18
3Q
18
4Q
18
1Q
19
2Q
19
3Q
19
1 2 8 8 6 6 12 13 15 7 3 2 7 2 5 4 1 2 0
$ /
acre
# Deals
$25,753
Ann'd
Date Buyer Seller Asset Description Value(1)
Proved
Multiple
Prod.
Multiple Net Acres
($mm) ($/boe) ($/boe/d) ($/acre)(2)
31-Jul-19 Ecopetrol Oxy Midland Basin JV $1,500 n.a. n.a. $31,559
30-Jul-19 Viper Energy Partners Diamondback Energy Permian royalty assets $700 n.a. $175,000 nmf
24-Jun-19 Alliance Resource Partners Wing Resources Midland Basin mineral interests $145 n.a. n.a. nmf
07-May-19 Sabinal; Undisclosed Diamondback Energy CBP, NW Shelf, & Midland Basin $322 n.a. $49,538 $2,927
08-Apr-19 Sequitur Energy Resources Callon 9,850 net acres in Reagan & Upton, TX $260 n.a. $65,000 $26,396
Mean $585 n.a. $96,513 $20,294
Median $322 n.a. $65,000 $26,396
Blue = BMO provided transaction advisory services Green = BMO provided acquisition financing or related services
Purple = BMO provided both transaction advisory services and acquisition financing or related services
GROSS PRODUCTION
TRANSACTION ACTIVITY (EXCLUDES CORPORATE DEALS)
TRANSACTION PRODUCTION MULTIPLES(3) TRANSACTION ADJUSTED NET ACRE MULTIPLES(3,4)
PERMITTING ACTIVITY BY MONTH
DIFFERENTIALS
Permian Snapshot
RIG COUNT
Source: BMO Transaction Database, Baker Hughes, BMO Commodity Products Group, Bloomberg, Drilling Info, PLS
Note: Current quarter’s data is through the week covered by this issue.
1. Represents total enterprise value. Excludes transactions with deal value <$20 million. 2. $/acre multiple not adjusted for value associated with production.
3. Red line denotes average since 01-Jan-17. Calculated as the weighted average of each quarter’s transactions.
4. Production valued at $45,000/boepd in 2014, $30,000/boepd in 2015, $35,000/boepd in 2016 & 2017, and $40,000/boepd in 2018 & 2019.
[TBU]
[TBU]
[TBU] [TBU]
[TBU] [TBU]
[TBU]

8
August 5, 2019
Item Value Wkly Change Last Week Item Value Wkly Change Last Week
Rig Count 81 -- 81 Oil Differential $4.10 ($0.55) $4.65
Permitting Activity 41 (17) 58 Gas Differential ($0.09) ($0.01) ($0.08)
0%
5%
10%
15%
20%
--
100
200
300
Jan-15 Jan-16 Jan-17 Jan-18 Jan-19
H V+D % of Total Rigs
-$0.30
-$0.20
-$0.10
$0.00
$0.10
$0.20
$0.30
$0.40
$0.50
Jan-15 Jan-16 Jan-17 Jan-18 Jan-19
-$6.00
-$4.00
-$2.00
$0.00
$2.00
$4.00
$6.00
$8.00
$10.00
$ /
mm
btu
$ /
bb
l
MEH HSC
379
455
329402
350315
398
353
472
351401
222174
Jul-18 Sep-18 Nov-18 Jan-19 Mar-19 May-19 Jul-19
H V+D
--$10,000$20,000$30,000$40,000$50,000$60,000
1Q
15
2Q
15
3Q
15
4Q
15
1Q
16
2Q
16
3Q
16
4Q
16
1Q
17
2Q
17
3Q
17
4Q
17
1Q
18
2Q
18
3Q
18
4Q
18
1Q
19
2Q
19
3Q
19
0 1 2 1 2 2 0 4 2 3 1 2 4 2 1 3 0 0 0
$ /
acre
# Deals
$6,130
--
$50,000
$100,000
$150,000
1Q
15
2Q
15
3Q
15
4Q
15
1Q
16
2Q
16
3Q
16
4Q
16
1Q
17
2Q
17
3Q
17
4Q
17
1Q
18
2Q
18
3Q
18
4Q
18
1Q
19
2Q
19
3Q
19
1 1 3 1 2 2 2 4 4 3 1 2 7 2 0 3 0 0 1
$ /
bo
e/d
# Deals
$68,384
6,000
6,500
7,000
7,500
8,000
1,000
1,200
1,400
1,600
1,800
2,000
Jan-15 Jul-15 Jan-16 Jul-16 Jan-17 Jul-17 Jan-18 Jul-18 Jan-19
mm
cf/
d
mb
bl/
d
Oil Gas
1,344
6,908
Ann'd
Date Buyer Seller Asset Description Value(1)
Proved
Multiple
Prod.
Multiple Net Acres
($mm) ($/boe) ($/boe/d) ($/acre)(2)
17-Jul-19 Undisclosed Buyer Sundance Energy 6,100 net acres in Dimmit County $30 n.a. $28,069 $4,836
19-Nov-18 Lonestar Resources Inc Sabine Oil & Gas Corp 2,706 net acres in Eagle Ford $39 $2.98 $48,375 $14,302
20-Sep-18 WildHorse Undisclosed Seller 20,305 net Eagle Ford/Austin Chalk acres $35 n.a. n.a. $1,743
07-Sep-18 Undisclosed Buyer Viking Minerals LLC 1,191 net royalty acres in Eagle Ford $28 n.a. n.a. nmf
31-Jul-18 EP Energy Corp Undisclosed Seller Additional working interests in Eagle Ford $31 n.a. n.a. n.a.
Mean $33 $2.98 $38,222 $6,960
Median $31 $2.98 $38,222 $4,836
Blue = BMO provided transaction advisory services Green = BMO provided acquisition financing or related services
Purple = BMO provided both transaction advisory services and acquisition financing or related services
Eagle Ford Snapshot
TRANSACTION ACTIVITY (EXCLUDES CORPORATE DEALS)
PERMITTING ACTIVITY BY MONTH
DIFFERENTIALS RIG COUNT
Source: BMO Transaction Database, Baker Hughes, BMO Commodity Products Group, Bloomberg, Drilling Info, PLS
Note: Current quarter’s data is through the week covered by this issue.
1. Represents total enterprise value. Excludes transactions with deal value <$20 million. 2. $/acre multiple not adjusted for value associated with production.
3. Red line denotes average since 01-Jan-17. Calculated as the weighted average of each quarter’s transactions.
4. Production valued at $45,000/boepd in 2014, $30,000/boepd in 2015, $35,000/boepd in 2016 & 2017, and $40,000/boepd in 2018 & 2019.
TRANSACTION PRODUCTION MULTIPLES(3) TRANSACTION ADJUSTED NET ACRE MULTIPLES(3,4)
GROSS PRODUCTION

9
August 5, 2019
0%
5%
10%
15%
20%
--
20
40
60
80
Jan-15 Jan-16 Jan-17 Jan-18 Jan-19
H V+D % of Total Rigs
Item Value Wkly Change Last Week Item Value Wkly Change Last Week
Rig Count 58 -- 58 Oil Differential $4.75 ($1.50) $6.25
Permitting Activity 22 2 20 Gas Differential -- -- --
--
$2.00
$4.00
$6.00
$8.00
$10.00
Jan-15 Jan-16 Jan-17 Jan-18 Jan-19
--
$2.00
$4.00
$6.00
$8.00
$10.00
$ /
mm
btu
$ /
bb
l
LLS Henry Hub
163 168 177 180
115
105
174
113 116 116132
82 87
Jul-18 Sep-18 Nov-18 Jan-19 Mar-19 May-19 Jul-19
H V+D
5,000
6,000
7,000
8,000
9,000
10,000
11,000
12,000
70
80
90
100
110
120
Jan-15 Jul-15 Jan-16 Jul-16 Jan-17 Jul-17 Jan-18 Jul-18 Jan-19
mm
cf/
d
mb
bl/
d
Oil Gas
79
11,229
--$2,000$4,000$6,000$8,000
$10,000$12,000
1Q
15
2Q
15
3Q
15
4Q
15
1Q
16
2Q
16
3Q
16
4Q
16
1Q
17
2Q
17
3Q
17
4Q
17
1Q
18
2Q
18
3Q
18
4Q
18
1Q
19
2Q
19
3Q
19
0 0 5 1 1 3 2 3 0 2 2 0 1 1 2 1 0 1 1
$ /
mcfe
/d
# Deals
$4,808
--
$5,000
$10,000
$15,000
$20,000
1Q
15
2Q
15
3Q
15
4Q
15
1Q
16
2Q
16
3Q
16
4Q
16
1Q
17
2Q
17
3Q
17
4Q
17
1Q
18
2Q
18
3Q
18
4Q
18
1Q
19
2Q
19
3Q
19
0 0 3 1 1 2 1 3 0 1 2 0 1 1 1 1 0 1 1
$ /
acre
# Deals
$3,267
Ann'd
Date Buyer Seller Asset Description Value(1)
Proved
Multiple
Prod.
Multiple Net Acres
($mm) ($/mcfe) ($/mcfe/d) ($/acre)(2)
29-Jul-19 Osaka Gas Sabine Oil & Gas Corp 175,000 net acres in East TX $610 n.a. $2,905 $9,136
19-Dec-18 Comstock Shelby Shale LLC 6,023 net acres in Haynesville $21 n.a. n.a. $3,404
19-Nov-18 Aethon III QEP Resources Inc 49,700 net acres in Haynesville $735 $0.77 $2,475 $14,789
05-Sep-18 Viking Energy Group Multiple Sellers Texas and Louisiana assets $100 n.a. n.a. n.a.
05-Sep-18 Equinor Texegy LLC 60,000 net acres in Austin Chalk $75 n.a. n.a. $1,250
Mean $308 $0.77 $2,690 $7,145
Median $100 $0.77 $2,690 $6,270
Blue = BMO provided transaction advisory services Green = BMO provided acquisition financing or related services
Purple = BMO provided both transaction advisory services and acquisition financing or related services
Ark-La-Tex Snapshot
TRANSACTION ACTIVITY (EXCLUDES CORPORATE DEALS)
PERMITTING ACTIVITY BY MONTH
DIFFERENTIALS RIG COUNT
Source: BMO Transaction Database, Baker Hughes, BMO Commodity Products Group, Bloomberg, Drilling Info, PLS
Note: Current quarter’s data is through the week covered by this issue.
1. Represents total enterprise value. Excludes transactions with deal value <$20 million. 2. $/acre multiple not adjusted for value associated with production.
3. Red line denotes average since 01-Jan-17. Calculated as the weighted average of each quarter’s transactions.
4. Production valued at $3,000/mcfepd in 2014, and $2,000/mcfepd in 2015, 2016, 2017, 2018, and 2019.
TRANSACTION PRODUCTION MULTIPLES(3) TRANSACTION ADJUSTED NET ACRE MULTIPLES(3,4)
GROSS PRODUCTION

10
August 5, 2019
0%
5%
10%
15%
20%
--
50
100
150
Jan-15 Jan-16 Jan-17 Jan-18 Jan-19
H V+D % of Total Rigs
Item Value Wkly Change Last Week Item Value Wkly Change Last Week
Rig Count 72 -- 72 Oil Differential $6.55 ($1.00) $7.55
Permitting Activity 17 (25) 42 Gas Differential ($0.37) ($0.07) ($0.30)
-$3.00
-$2.00
-$1.00
$0.00
$1.00
$2.00
$3.00
Jan-15 Jan-16 Jan-17 Jan-18 Jan-19
-$15.00
-$10.00
-$5.00
$0.00
$5.00
$10.00
$15.00
$ /
mm
btu
$ /
bb
l
Brent Dominion
269
493
373 370305
258
397
276
382419
384
248 233
Jul-18 Sep-18 Nov-18 Jan-19 Mar-19 May-19 Jul-19
H V+D
--$5,000
$10,000$15,000$20,000$25,000$30,000
1Q
15
2Q
15
3Q
15
4Q
15
1Q
16
2Q
16
3Q
16
4Q
16
1Q
17
2Q
17
3Q
17
4Q
17
1Q
18
2Q
18
3Q
18
4Q
18
1Q
19
2Q
19
3Q
19
0 1 0 0 1 2 2 3 2 5 1 4 3 4 3 1 1 0 2
$ /
mcfe
/d
# Deals
$4,878
--$2,000$4,000$6,000$8,000
$10,000$12,000
1Q
15
2Q
15
3Q
15
4Q
15
1Q
16
2Q
16
3Q
16
4Q
16
1Q
17
2Q
17
3Q
17
4Q
17
1Q
18
2Q
18
3Q
18
4Q
18
1Q
19
2Q
19
3Q
19
0 1 0 0 1 2 2 4 2 4 1 3 1 3 2 0 0 0 0
$ /
acre
# Deals
$2,083
Ann'd
Date Buyer Seller Asset Description Value(1)
Proved
Multiple
Prod.
Multiple Net Acres
($mm) ($/mcfe) ($/mcfe/d) ($/acre)(2)
24-Jul-19 Diversified Gas & Oil EdgeMarc Energy Holdings 12,730 net acres in Ohio Utica $50 $0.32 $769 $3,928
19-Jul-19 Multiple Range Resources Corp Southwest Applachia ORRIs $600 n.a. $15,790 nmf
30-Jun-19 Undisclosed Buyer Range Resources Corp 20,000 non-producing net acres in PA $34 n.a. n.a. $1,700
27-Mar-19 Diversified Gas & Oil HG Energy II LLC Huckleberry assets in Appalachia $400 n.a. $3,227 n.a.
15-Oct-18 Undisclosed Buyer Range Resources Corp Overriding royalty interests in Appalachia $300 n.a. $17,649 nmf
Mean $277 $0.32 $9,359 $2,814
Median $300 $0.32 $9,509 $2,814
Blue = BMO provided transaction advisory services Green = BMO provided acquisition financing or related services
Purple = BMO provided both transaction advisory services and acquisition financing or related services
14,000
19,000
24,000
29,000
34,000
50
70
90
110
130
150
170
Jan-15 Jul-15 Jan-16 Jul-16 Jan-17 Jul-17 Jan-18 Jul-18 Jan-19
mm
cf/
d
mb
bl/
d
Oil Gas
101
30,246
Appalachia Snapshot
TRANSACTION ACTIVITY (EXCLUDES CORPORATE DEALS)
PERMITTING ACTIVITY BY MONTH
DIFFERENTIALS RIG COUNT
Source: BMO Transaction Database, Baker Hughes, BMO Commodity Products Group, Bloomberg, Drilling Info, PLS
Note: Current quarter’s data is through the week covered by this issue.
1. Represents total enterprise value. Excludes transactions with deal value <$20 million. 2. $/acre multiple not adjusted for value associated with production.
3. Red line denotes average since 01-Jan-17. Calculated as the weighted average of each quarter’s transactions.
4. Production valued at $3,000/mcfepd in 2014, and $2,000/mcfepd in 2015, 2016, 2017, 2018, and 2019.
TRANSACTION PRODUCTION MULTIPLES(3) TRANSACTION ADJUSTED NET ACRE MULTIPLES(3,4)
GROSS PRODUCTION

11
August 5, 2019
Item Value Wkly Change Last Week Item Value Wkly Change Last Week
Rig Count 47 -- 47 Oil Differential $2.25 $1.75 $0.50
Permitting Activity 16 (18) 34 Gas Differential ($0.58) ($0.10) ($0.48)
0%
5%
10%
15%
20%
--
50
100
150
200
Jan-15 Jan-16 Jan-17 Jan-18 Jan-19
H V+D % of Total Rigs
-$1.00
-$0.50
$0.00
$0.50
Jan-15 Jan-16 Jan-17 Jan-18 Jan-19
-$20.00
-$10.00
$0.00
$10.00
$ /
mm
btu
$ /
bb
l
Clearbrook CIG
171 164
127
201
128
96
133114
144 138 145 144 148
Jul-18 Sep-18 Nov-18 Jan-19 Mar-19 May-19 Jul-19
H V+D
1,100
1,300
1,500
1,700
1,900
2,100
2,300
2,500
2,700
2,900
800
900
1,000
1,100
1,200
1,300
1,400
1,500
Jan-15 Jul-15 Jan-16 Jul-16 Jan-17 Jul-17 Jan-18 Jul-18 Jan-19
mm
cf/
d
mb
bl/
d
Oil Gas
1,413
2,884
--
$5,000
$10,000
$15,000
$20,000
$25,000
1Q
15
2Q
15
3Q
15
4Q
15
1Q
16
2Q
16
3Q
16
4Q
16
1Q
17
2Q
17
3Q
17
4Q
17
1Q
18
2Q
18
3Q
18
4Q
18
1Q
19
2Q
19
3Q
19
0 0 1 2 0 0 2 3 1 0 3 2 0 5 2 0 0 1 0
$ /
acre
# Deals
$2,702
--
$20,000
$40,000
$60,000
$80,000
1Q
15
2Q
15
3Q
15
4Q
15
1Q
16
2Q
16
3Q
16
4Q
16
1Q
17
2Q
17
3Q
17
4Q
17
1Q
18
2Q
18
3Q
18
4Q
18
1Q
19
2Q
19
3Q
19
0 1 1 4 0 2 3 3 0 1 3 3 0 6 3 0 0 1 0
$ /
bo
e/d
# Deals
$43,737
Ann'd
Date Buyer Seller Asset Description Value(1)
Proved
Multiple
Prod.
Multiple Net Acres
($mm) ($/boe) ($/boe/d) ($/acre)(2)
22-Apr-19 Northern Oil and Gas Flywheel Energy LLC 18,000 net acres in Williston Basin $310 n.a. $47,014 $17,238
31-Jul-18 Northern Oil and Gas W Energy Partners 10,600 net acres in Williston Basin $288 n.a. $42,708 $27,196
18-Jul-18 Northern Oil and Gas Pivotal Petroleum Partners LP Producing assets in Williston Basin $152 n.a. $37,032 n.a.
12-Jul-18 PetroShale Inc Slawson Exploration Co 1,981 net acres in Williston Basin $55 $6.04 $100,000 $27,764
06-Jul-18 Energy Resources 12 LP Bruin E&P Partners LLC 2.8% non-operated WI in Bakken assets $83 n.a. n.a. n.a.
Mean $178 $6.04 $56,688 $24,066
Median $152 $6.04 $44,861 $27,196
Blue = BMO provided transaction advisory services Green = BMO provided acquisition financing or related services
Purple = BMO provided both transaction advisory services and acquisition financing or related services
Bakken Snapshot
TRANSACTION ACTIVITY (EXCLUDES CORPORATE DEALS)
PERMITTING ACTIVITY BY MONTH
DIFFERENTIALS RIG COUNT
Source: BMO Transaction Database, Baker Hughes, BMO Commodity Products Group, Bloomberg, Drilling Info, PLS
Note: Current quarter’s data is through the week covered by this issue.
1. Represents total enterprise value. Excludes transactions with deal value <$20 million. 2. $/acre multiple not adjusted for value associated with production.
3. Red line denotes average since 01-Jan-17. Calculated as the weighted average of each quarter’s transactions.
4. Production valued at $45,000/boepd in 2014, $30,000/boepd in 2015, $35,000/boepd in 2016 & 2017, and $40,000/boepd in 2018 & 2019.
TRANSACTION PRODUCTION MULTIPLES(3) TRANSACTION ADJUSTED NET ACRE MULTIPLES(3,4)
GROSS PRODUCTION

12
August 5, 2019
0%
5%
10%
15%
20%
--
50
100
150
Jan-15 Jan-16 Jan-17 Jan-18 Jan-19
H V+D % of Total Rigs
Item Value Wkly Change Last Week Item Value Wkly Change Last Week
Rig Count 77 -- 77 Oil Differential $2.25 $1.75 $0.50
Permitting Activity 55 (1) 56 Gas Differential ($0.58) ($0.10) ($0.48)
-$1.00
-$0.50
$0.00
$0.50
Jan-15 Jan-16 Jan-17 Jan-18 Jan-19
-$20.00
-$10.00
$0.00
$10.00
$ /
mm
btu
$ /
bb
l
Clearbrook CIG
683
526 512
689
829 812
352402
494
328
164259 266
Jul-18 Sep-18 Nov-18 Jan-19 Mar-19 May-19 Jul-19
H V+D
12,500
13,000
13,500
14,000
14,500
15,000
15,500
500
600
700
800
900
1,000
Jan-15 Jul-15 Jan-16 Jul-16 Jan-17 Jul-17 Jan-18 Jul-18 Jan-19
mm
cf/
d
mb
bl/
d
Oil Gas
873
13,639
--
$5,000
$10,000
$15,000
$20,000
1Q
15
2Q
15
3Q
15
4Q
15
1Q
16
2Q
16
3Q
16
4Q
16
1Q
17
2Q
17
3Q
17
4Q
17
1Q
18
2Q
18
3Q
18
4Q
18
1Q
19
2Q
19
3Q
19
0 0 3 3 0 1 1 0 1 0 1 5 2 0 2 1 0 0 0
$ /
acre
# Deals
$4,655
--$20,000$40,000$60,000$80,000
$100,000$120,000
1Q
15
2Q
15
3Q
15
4Q
15
1Q
16
2Q
16
3Q
16
4Q
16
1Q
17
2Q
17
3Q
17
4Q
17
1Q
18
2Q
18
3Q
18
4Q
18
1Q
19
2Q
19
3Q
19
2 0 4 4 1 6 2 0 1 6 3 9 3 1 3 1 1 0 0
$ /
bo
e/d
# Deals
$37,548
Ann'd
Date Buyer Seller Asset Description Value(1)
Proved
Multiple
Prod.
Multiple Net Acres
($mm) ($/boe) ($/boe/d) ($/acre)(2)
14-Feb-19 Undisclosed Buyer Harvest Oil & Gas Corp San Juan Basin assets $43 $1.57 $10,835 n.a.
31-Jan-19 Undisclosed Buyer Extraction Oil & Gas 5,000 net acres in Powder River $22 n.a. n.a. $4,480
01-Oct-18 DJR Energy LLC Encana 182,000 net acres in San Juan Basin $480 n.a. $88,889 $2,637
28-Aug-18 Vermilion Energy Inc Massif Oil & Gas LLC 55,000 acres in Powder River Basin $150 n.a. $56,604 $2,727
28-Aug-18 Rebellion Energy II LLC Liberty Resources II LLC 19,000 net acres in Powder River Basin $100 n.a. n.a. $5,263
Mean $159 $1.57 $52,109 $3,777
Median $100 $1.57 $56,604 $3,604
Blue = BMO provided transaction advisory services Green = BMO provided acquisition financing or related services
Purple = BMO provided both transaction advisory services and acquisition financing or related services
TRANSACTION ACTIVITY (EXCLUDES CORPORATE DEALS)
PERMITTING ACTIVITY BY MONTH
DIFFERENTIALS
Rockies (excl. Bakken) Snapshot
RIG COUNT
Source: BMO Transaction Database, Baker Hughes, BMO Commodity Products Group, Bloomberg, Drilling Info, PLS
Note: Current quarter’s data is through the week covered by this issue.
1. Represents total enterprise value. Excludes transactions with deal value <$20 million. 2. $/acre multiple not adjusted for value associated with production.
3. Red line denotes average since 01-Jan-17. Calculated as the weighted average of each quarter’s transactions.
4. Production valued at $45,000/boepd in 2014, $30,000/boepd in 2015, $35,000/boepd in 2016 & 2017, and $40,000/boepd in 2018 & 2019.
TRANSACTION PRODUCTION MULTIPLES(3) TRANSACTION ADJUSTED NET ACRE MULTIPLES(3,4)
GROSS PRODUCTION

13
August 5, 2019
0%
5%
10%
15%
20%
--
100
200
300
400
Jan-15 Jan-16 Jan-17 Jan-18 Jan-19
H V+D % of Total Rigs
Item Value Wkly Change Last Week Item Value Wkly Change Last Week
Rig Count 95 (4) 99 Oil Differential -- -- --
Permitting Activity 48 (33) 81 Gas Differential ($0.66) $0.05 ($0.70)
-$1.00
-$0.75
-$0.50
-$0.25
$0.00
$0.25
Jan-15 Jan-16 Jan-17 Jan-18 Jan-19
-$1.00
-$0.75
-$0.50
-$0.25
$0.00
$0.25
$ /
mm
btu
$ /
bb
l
Cushing Panhandle
465497
449405 382 355
403
339
435389
298350 329
Jul-18 Sep-18 Nov-18 Jan-19 Mar-19 May-19 Jul-19
H V+D
8,000
10,000
12,000
14,000
16,000
18,000
550
600
650
700
750
800
Jan-15 Jul-15 Jan-16 Jul-16 Jan-17 Jul-17 Jan-18 Jul-18 Jan-19
mm
cf/
d
mb
bl/
d
Oil Gas
598
11,593
Ann'd
Date Buyer Seller Asset Description Value(1)
Proved
Multiple
Prod.
Multiple Net Acres
($mm) ($/boe) ($/boe/d) ($/acre)(2)
31-Jul-19 Continental Resources Inc Undisclosed Seller SCOOP assets $80 n.a. n.a. n.a.
08-Jul-19 NextEra Energy Inc Encana 140,000 net acres in Arkoma Basin $165 n.a. $12,857 $1,179
12-Jun-19 Glendale Energy; TPG Undisclosed Seller Non-op interests in STACK $55 n.a. n.a. n.a.
29-Apr-19 Undisclosed Buyer Riviera Resources Inc Non-op Hugoton Basin $31 n.a. n.a. n.a.
31-Mar-19 Red Wolf Apache 56k net acres in SCOOP/STACK/Merge $245 n.a. $18,421 $4,375
Mean $115 n.a. $15,639 $2,777
Median $80 n.a. $15,639 $2,777
Blue = BMO provided transaction advisory services Green = BMO provided acquisition financing or related services
Purple = BMO provided both transaction advisory services and acquisition financing or related services
--
$5,000
$10,000
$15,000
$20,000
1Q
15
2Q
15
3Q
15
4Q
15
1Q
16
2Q
16
3Q
16
4Q
16
1Q
17
2Q
17
3Q
17
4Q
17
1Q
18
2Q
18
3Q
18
4Q
18
1Q
19
2Q
19
3Q
19
1 3 1 2 0 3 3 2 4 1 2 1 0 0 0 1 0 0 0
$ /
acre
# Deals
$5,760
--
$50,000
$100,000
$150,000
$200,000
1Q
15
2Q
15
3Q
15
4Q
15
1Q
16
2Q
16
3Q
16
4Q
16
1Q
17
2Q
17
3Q
17
4Q
17
1Q
18
2Q
18
3Q
18
4Q
18
1Q
19
2Q
19
3Q
19
1 4 1 3 1 6 3 1 4 2 4 5 2 2 5 4 2 0 1
$ /
bo
e/d
# Deals
$42,527
Mid-Continent Snapshot
TRANSACTION ACTIVITY (EXCLUDES CORPORATE DEALS)
PERMITTING ACTIVITY BY MONTH
DIFFERENTIALS RIG COUNT
Source: BMO Transaction Database, Baker Hughes, BMO Commodity Products Group, Bloomberg, Drilling Info, PLS
Note: Current quarter’s data is through the week covered by this issue.
1. Represents total enterprise value. Excludes transactions with deal value <$20 million. 2. $/acre multiple not adjusted for value associated with production.
3. Red line denotes average since 01-Jan-17. Calculated as the weighted average of each quarter’s transactions.
4. Production valued at $45,000/boepd in 2014, $30,000/boepd in 2015, $35,000/boepd in 2016 & 2017, and $40,000/boepd in 2018 & 2019.
TRANSACTION PRODUCTION MULTIPLES(3) TRANSACTION ADJUSTED NET ACRE MULTIPLES(3,4)
GROSS PRODUCTION

14
August 5, 2019
0%
5%
10%
15%
20%
--
10
20
30
40
Jan-15 Jan-16 Jan-17 Jan-18 Jan-19
Deep Water Shelf % of Total Rigs
Item Value Wkly Change Last Week Item Value Wkly Change Last Week
Rig Count 22 (1) 23 Oil Differential $4.75 ($1.50) $6.25
Permitting Activity 18 6 12 Gas Differential -- -- --
--
$2.00
$4.00
$6.00
$8.00
$10.00
Jan-15 Jan-16 Jan-17 Jan-18 Jan-19
--
$2.00
$4.00
$6.00
$8.00
$10.00
$ /
mm
btu
$ /
bb
l
LLS Henry Hub
2932 33
39
32 30 32 33
2629
26 27
41
Jul-18 Sep-18 Nov-18 Jan-19 Mar-19 May-19 Jul-192,000
2,500
3,000
3,500
4,000
4,500
1,000
1,200
1,400
1,600
1,800
2,000
2,200
Jan-15 Jul-15 Jan-16 Jul-16 Jan-17 Jul-17 Jan-18 Jul-18 Jan-19
mm
cf/
d
mb
bl/
d
Oil Gas1,909
3,093
--
$10
$20
$30
$40
1Q
15
2Q
15
3Q
15
4Q
15
1Q
16
2Q
16
3Q
16
4Q
16
1Q
17
2Q
17
3Q
17
4Q
17
1Q
18
2Q
18
3Q
18
4Q
18
1Q
19
2Q
19
3Q
19
0 0 1 0 0 0 2 1 0 0 0 1 2 1 0 1 1 2 0
$ /
bo
e
# Deals
$16.39
--
$15,000
$30,000
$45,000
$60,000
1Q
15
2Q
15
3Q
15
4Q
15
1Q
16
2Q
16
3Q
16
4Q
16
1Q
17
2Q
17
3Q
17
4Q
17
1Q
18
2Q
18
3Q
18
4Q
18
1Q
19
2Q
19
3Q
19
0 0 1 1 0 0 2 0 0 0 0 1 2 2 2 1 1 3 0
$ /
bo
e/d
# Deals
$32,727
Ann'd
Date Buyer Seller Asset Description Value(2)
Proved
Multiple
Prod.
Multiple Net Acres
($mm) ($/boe) ($/boe/d) ($/acre)(3)
27-Jun-19 W&T Offshore ExxonMobil Mobile Bay assets $200 $2.70 $10,101 n.a.
13-May-19 Equinor Shell 22.45% WI in Caesar-Tonga Field $965 n.a. $60,313 n.a.
23-Apr-19 Murphy LLOG Bluewater LLC Mississippi Canyon & Green Canyon $1,375 $20.83 $36,184 n.a.
16-Jan-19 Talos Energy Inc Samson Energy Co LLC Non-op Gulf of Mexico working interest $30 $13.45 $17,939 n.a.
10-Oct-18 Murphy Petrobras Gulf of Mexico joint venture $900 $15.00 $21,951 n.a.
Mean $694 $13.00 $29,298 n.a.
Median $900 $14.23 $21,951 n.a.
Blue = BMO provided transaction advisory services Green = BMO provided acquisition financing or related services
Purple = BMO provided both transaction advisory services and acquisition financing or related services
Gulf of Mexico Snapshot
PERMITTING ACTIVITY BY MONTH(1)
DIFFERENTIALS RIG COUNT
Source: BMO Transaction Database, Baker Hughes, BMO Commodity Products Group, Bloomberg, Drilling Info, PLS
Note: Current quarter’s data is through the week covered by this issue.
1. Permits include directional and unidentified drilling permits. 2. Represents total enterprise value. Excludes transactions with deal value <$20 million.
3. $/acre multiple not adjusted for value associated with production.
4. Red line denotes average since 01-Jan-17. Calculated as the weighted average of each quarter’s transactions.
GROSS PRODUCTION
TRANSACTION ACTIVITY (EXCLUDES CORPORATE DEALS)
TRANSACTION PRODUCTION MULTIPLES(4) TRANSACTION PROVED RESERVE MULTIPLES(4)

15
August 5, 2019
Upcoming Industry Events
Disclaimer: The foregoing links are for convenience only and relate to materials that were not prepared or reviewed by BMO Capital Markets. BMO Capital Markets takes
no responsibility for and makes no representations with respect to the contents thereof. These materials may be inconsistent with the views of BMO Capital Markets.
Click event to open
April 2019 Apr 22-23 Mineral & Royalty Conference
June 2019 Jun 24-26 IPAA Midyear Meeting
August 2019 Aug 14 IPAA Leaders in Industry Luncheon
Aug 20 IPAA Oil & Gas Overview Course
Aug 20 Houston Producers Forum Luncheon
Aug 21-22 Summer NAPE
Aug 23 ADAM-Houston Monthly Luncheon
September 2019 Sep 11 IPAA Leaders in Industry Luncheon
Sep 17 Houston Producers Forum Luncheon
Sep 20 ADAM-Houston Monthly Luncheon
Sep 24-26 DUG Eagle Ford (San Antonio)
Sep 30-Oct 2 SPE Annual Technical Conference and Exhibition
October 2019 Oct 9 IPAA Leaders in Industry Luncheon
Oct 15 Houston Producers Forum Luncheon
Oct 18 ADAM-Houston Monthly Luncheon
Oct 22-23 A&D Strategies and Opportunities Conference
2020
Jul 22-24 SPE Unconventional Resources Technology
Aug 11-14 Enercom Oil & Gas Conference
Sep 8-10 DUG Eagle Ford (San Antonio)
Oct 27-28 A&D Strategies and Opportunities Conference
Nov 2-4 Executive Oil Conference & Exhibition
November 2019 Nov 4-6 Executive Oil Conference & Exhibition
Nov 13 IPAA Leaders in Industry Luncheon
Nov 15 ADAM-Houston Monthly Luncheon
Nov 19 IPAA Oil & Gas for Newcomers
Nov 19 Houston Producers Forum Luncheon
Nov 19-21 DUG Midcontinent (Oklahoma City)
Nov 20-21 11th Annual North America Assembly & Dinner
December 2019 Dec 5 177th OPEC Meeting
Dec 11 IPAA Leaders in Industry Luncheon
Dec 17 Houston Producers Forum Luncheon
Dec 20 ADAM-Houston Monthly Luncheon
January 2019 Jan 15 Houston Producers Forum Luncheon
Jan 25 ADAM-Houston Monthly Luncheon
Jan 24 IPAA Private Capital Conference
May 2019
May 21 Houston Producers Forum Luncheon
May 22 SPE Business Development Group Meeting
March 2019 Mar 26-28 International Petroleum Technology Conference
January 2020 Jan 23 IPAA Private Capital Conference
Jan 17 ADAM-Houston Monthly Luncheon
Jan 21 Houston Producers Forum Luncheon
February 2020 Feb 3-7 NAPE Summit Week
Feb 19 Houston Producers Forum Luncheon
Feb 18-19 DUG Rockies (Denver)
March 2020 Mar 2 Energy Capital Conference
Mar 4 Women in Energy Luncheon
Mar 3-5 IADC/SPE International Drilling Conference
Mar 9-13 Houston CERA Week
Mar 17 Houston Producers Forum Luncheon
Mar 20 ADAM-Houston Monthly Luncheon
April 2020 Apr 6-8 DUG Permian (Fort Worth)
Apr 17 ADAM-Houston Monthly Luncheon
Apr 20-22 OGIS New York
Apr 21 Houston Producers Forum Luncheon
May 2020 May 15 ADAM-Houston Monthly Luncheon
May 19 Houston Producers Forum Luncheon
May 19-20 DUG Haynesville (Shreveport)
June 2020 Jun 16 Houston Producers Forum Luncheon
Jun 16-18 DUG East (Pittsburgh)
Jun 19 ADAM-Houston Monthly Luncheon

16
August 5, 2019
SCOOP/STACK/Merge
DJ-Niobrara
Eagle Ford
Haynesville
Granite Wash
GOM
Permian
Marcellus
Utica
Williston
Gulf Coast Onshore
Piceance
Powder River Green River
Legend
Current
Change
This material is prepared by the BMO Capital Markets’ Investment and Corporate Banking Department, for distribution to BMO Capital Markets’ clientele. It is not a product of
BMO Capital Markets’ Research Department. The views of the Investment and Corporate Banking Department may differ from those of the Research Department.
BMO Capital Markets is a trade name used by BMO Financial Group for the wholesale banking businesses of Bank of Montreal, BMO Harris Bank N.A. (member FDIC), Bank of Montreal
Ireland p.l.c., and Bank of Montreal (China) Co. Ltd and the institutional broker dealer businesses of BMO Capital Markets Corp. (Member FINRA and SIPC) in the U.S., BMO Nesbitt
Burns Inc. (Member Investment Industry Regulatory Organization of Canada and Member Canadian Investor Protection Fund) in Canada and Asia, Bank of Montreal Ireland p.l.c.
(authorised and regulated by the Central bank of Ireland) in Europe and BMO Capital Markets Limited (authorized and regulated by the Financial Conduct Authority) in the UK and
Australia. “Nesbitt Burns” is a registered trademark of BMO Nesbitt Burns Inc., used under license. “BMO Capital Markets” is a trademark of Bank of Montreal, used under license. "BMO
(M-Bar roundel symbol)" is a registered trademark of Bank of Montreal, used under license.
Bank of Montreal or its subsidiaries (“BMO Financial Group”) has lending arrangements with, or provide other remunerated services to, many issuers covered by BMO Capital Markets.
The opinions, estimates and projections contained in this report are those of BMO Capital Markets as of the date of this report and are subject to change without notice. BMO Capital
Markets endeavors to ensure that the contents have been compiled or derived from sources that we believe are reliable and contain information and opinions that are accurate and
complete. However, BMO Capital Markets makes no representation or warranty, express or implied, in respect thereof, takes no responsibility for any errors and omissions contained
herein and accepts no liability whatsoever for any loss arising from any use of, or reliance on, this report or its contents. Information may be available to BMO Capital Markets or its
affiliates that is not reflected in this report. The information in this report is not intended to be used as the primary basis of investment decisions, and because of individual client
objectives, should not be construed as advice designed to meet the particular investment needs of any investor. This material is for information purposes only and is not an offer to sell or
the solicitation of an offer to buy any security. BMO Capital Markets or its affiliates will buy from or sell to customers the securities of issuers mentioned in this report on a principal basis.
BMO Capital Markets or its affiliates, officers, directors or employees have a long or short position in many of the securities discussed herein, related securities or in options, futures or
other derivative instruments based thereon. BMO Capital Markets may act as financial advisor and/or underwriter for the issuers mentioned herein and may receive remuneration for
same. The reader should assume that BMO Capital Markets or its affiliates may have a conflict of interest and should not rely solely on this report in evaluating whether or not to buy or
sell securities of issuers discussed herein.
All values in this document are in US$ unless otherwise specified.
Source of rig count stats: Baker Hughes
Rig Count Summary MAPS IN
MASTER VIEW
Contacts
Disclaimer
Jason Martinez
MD & Head of U.S. A&D
713-546-9771
Howard Barnwell
MD & Transactions Mgr.
713-546-9767
Rob Priske
MD & Transactions Mgr.
713-546-9727
Dan Schockling
Director & Head of Commercial
713-518-1223
Michael Hackett
Vice President
Marian Yu
Associate
Aaron Moeller
Associate
BMO uses updated basin outlines, and the resulting rig counts, to more accurately represent current basin knowledge. The data below reflect these changes
and is different than those shown by Baker Hughes. The totals are the same.
442
(1)
47
--
15
--
57
--29
--
22
(1)
5
(3)75
(1)
58
--
81
--
18
(1)
6
--
23
--17
--
[TBU] This
Week Change
Last
Week
Last
Year
Total Rigs 942 (4) 946 1,044
Oil 770 (6) 776 859
Gas 171 2 169 183
Miscellaneous 1 -- 1 2
Directional 67 -- 67 64
Horizontal 819 (4) 823 912
Vertical 56 -- 56 68
Basin
Permian 442 (1) 443 480
SCOOP/STACK/Merge 75 (1) 76 106
Granite Wash 5 (3) 8 25
Eagle Ford 81 -- 81 97
Haynesville 58 -- 58 55
Marcellus 57 -- 57 53
Utica 15 -- 15 23
Williston 47 -- 47 56
DJ-Niobrara 29 -- 29 26
Green River 17 -- 17 18
Powder River 23 -- 23 16
Piceance 6 -- 6 7
Gulf Coast Onshore 18 (1) 19 21
GOM 22 (1) 23 16
Alaska 12 3 9 5
Other 35 -- 35 40
Mid-Con 15 -- 15 20
Rockies 2 -- 2 2
Western 18 -- 18 16
Eastern -- -- -- 2
Chelsea Neville
Transactions Coordinator