Subscribed NYC 2017: Aligning Pricing and Revenue – Two Sides Of A Very Valuable Coin

TRANSPARENCYINTERNATIONAL
the global coalition against corruption
PROMOTING REVENUE TRANSPARENCY 2011 REPORT ON OIL AND GAS COMPANIES
©2011 Transparency International. All rights reserved.
ISBN: 978-3-935711-66-1
Printed on 100% recycled paper.
Author: Barbara Kowalczyk-Hoyer
Design: Sophie Everett
Acknowledgements: We would like to thank all the individuals who contributed to all stages of the research and the preparation of the report. Our gratitude goes to many TI colleagues who have invested time and effort, among them François Valérian, Susan Côté-Freeman and Peter Wilkinson. Special thanks also go to Antoine Heuty, Karin Lissakers, Juan Carlos Quiroz and Robert Ruby of our co-branding partner the Revenue Watch Institute for their valuable contributions.
Every effort has been made to verify the accuracy of the information contained in this report. All information was believed to be correct as of February 2011. Nevertheless, Transparency International cannot accept responsibility for the consequences of its use for other purposes or in other contexts.
© Cover photo: AFP/Getty Images
Transparency International (TI) is the global civil society organisation leading the fight against corruption. Through more than 90 chapters worldwide and an international secretariat in Berlin, TI raises awareness of the damaging effects of corruption and works with partners in government, business and civil society to develop and implement effective measures to tackle it.
www.transparency.org
The Revenue Watch Institute promotes the effective, transparent and accountable management of oil, gas and mineral resources for the public good. Through capacity building, technical assistance, research, funding and advocacy, we help countries to realize the development benefits of their natural resource wealth.
www.revenuewatch.org
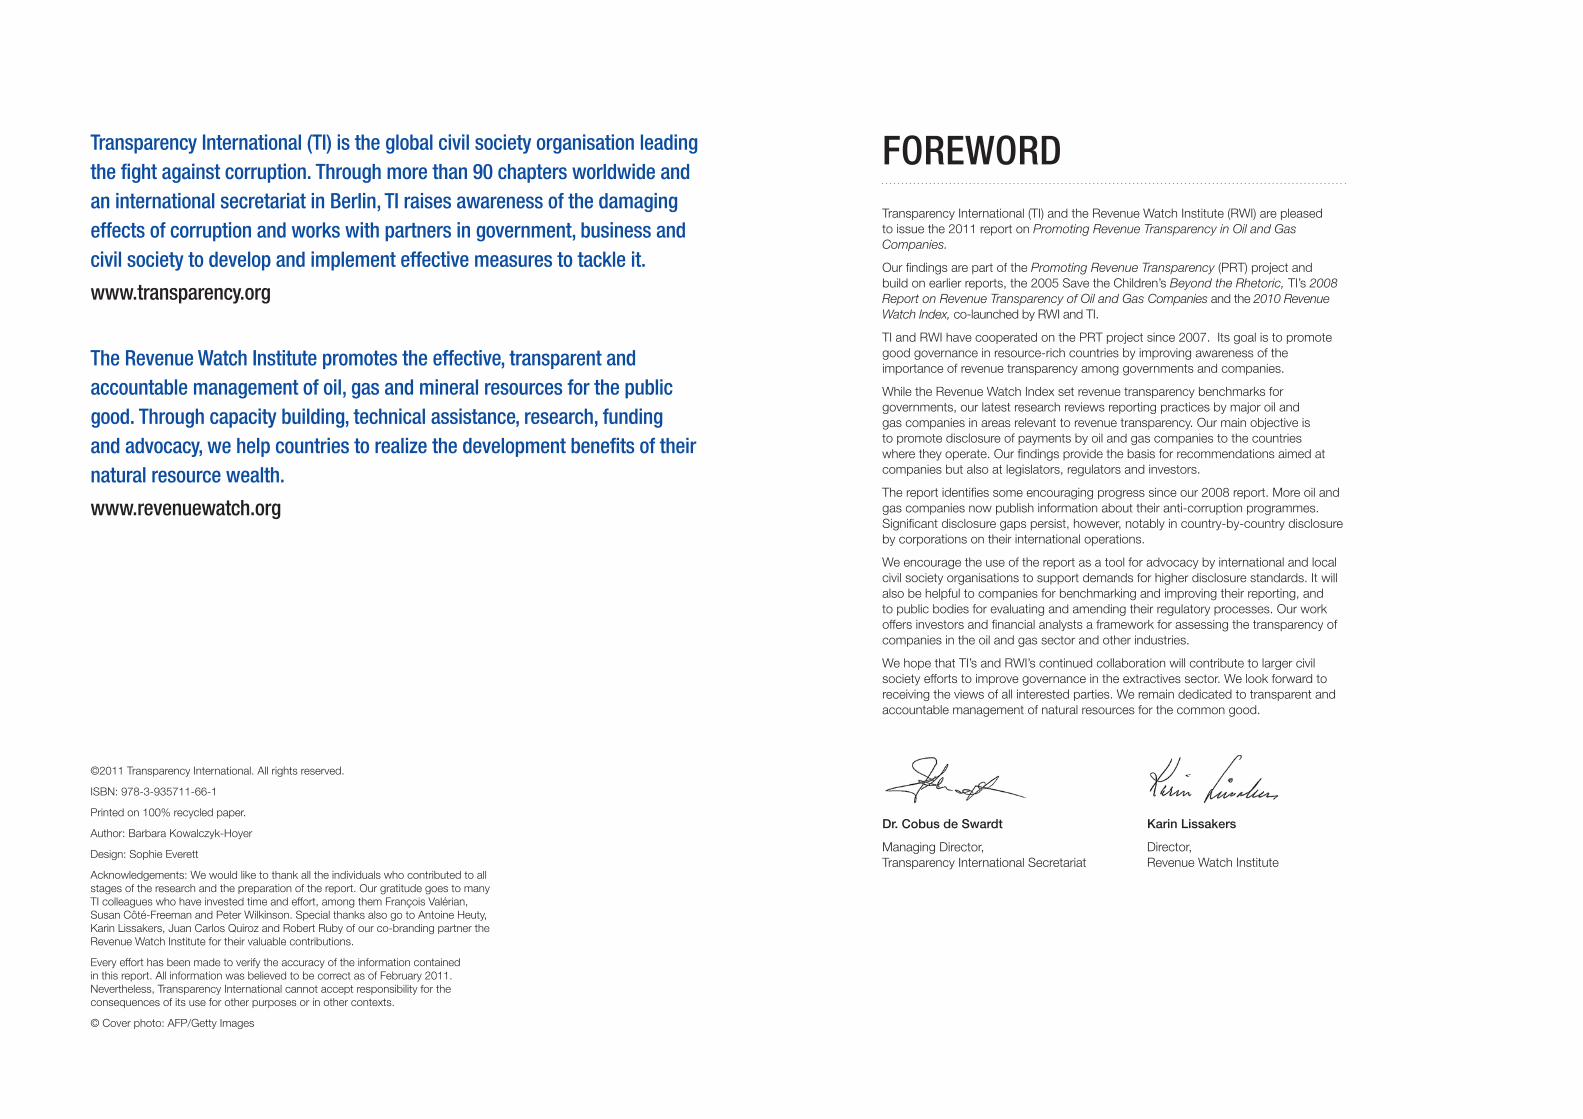
FOREWORDTransparency International (TI) and the Revenue Watch Institute (RWI) are pleased to issue the 2011 report on Promoting Revenue Transparency in Oil and Gas Companies.
Our findings are part of the Promoting Revenue Transparency (PRT) project and build on earlier reports, the 2005 Save the Children’s Beyond the Rhetoric, TI’s 2008 Report on Revenue Transparency of Oil and Gas Companies and the 2010 Revenue Watch Index, co-launched by RWI and TI.
TI and RWI have cooperated on the PRT project since 2007. Its goal is to promote good governance in resource-rich countries by improving awareness of the importance of revenue transparency among governments and companies.
While the Revenue Watch Index set revenue transparency benchmarks for governments, our latest research reviews reporting practices by major oil and gas companies in areas relevant to revenue transparency. Our main objective is to promote disclosure of payments by oil and gas companies to the countries where they operate. Our findings provide the basis for recommendations aimed at companies but also at legislators, regulators and investors.
The report identifies some encouraging progress since our 2008 report. More oil and gas companies now publish information about their anti-corruption programmes. Significant disclosure gaps persist, however, notably in country-by-country disclosure by corporations on their international operations.
We encourage the use of the report as a tool for advocacy by international and local civil society organisations to support demands for higher disclosure standards. It will also be helpful to companies for benchmarking and improving their reporting, and to public bodies for evaluating and amending their regulatory processes. Our work offers investors and financial analysts a framework for assessing the transparency of companies in the oil and gas sector and other industries.
We hope that TI’s and RWI’s continued collaboration will contribute to larger civil society efforts to improve governance in the extractives sector. We look forward to receiving the views of all interested parties. We remain dedicated to transparent and accountable management of natural resources for the common good.
Dr. Cobus de Swardt
Managing Director, Transparency International Secretariat
Karin Lissakers
Director, Revenue Watch Institute
CONTENTSMAJOR RESULTS 2
EXECUTIVE SUMMARY 4
1. Why transparency in the oil and gas sector matters 5
2. Methodology 6
3. Major findings 7
4. Key policy recommendations 8
RESULTS OF THE ANALYSIS 12
1. General results 12
2. Reporting on anti-corruption programmes (section 1) 14
3. Organisational disclosure (section 2) 22
4. Country-level disclosure (section 3) 30
5. National oil company specific (section 4) 43
6. Cross-section analysis 48
8. 2011 vs. 2008 results 51
CONCLUSION 52
ANNEXES 53
Annex 1 - History of the project 53
Annex 2 – Methodology and questionnaire guide 55
Annex 3 – Building a ‘perfect score company’ 65
Annex 4 – Country-level disclosure on domestic operations 70
Annex 5 - Data tables with sources 73
Annex 6 – Data sharing with companies - an example of a data set 110
Annex 7 – Oil and gas industry background relevant to the PRT report 113
LIST OF TABLES AND DIAGRAMS 118
BIBLIOGRAPHY 119
END NOTES 120
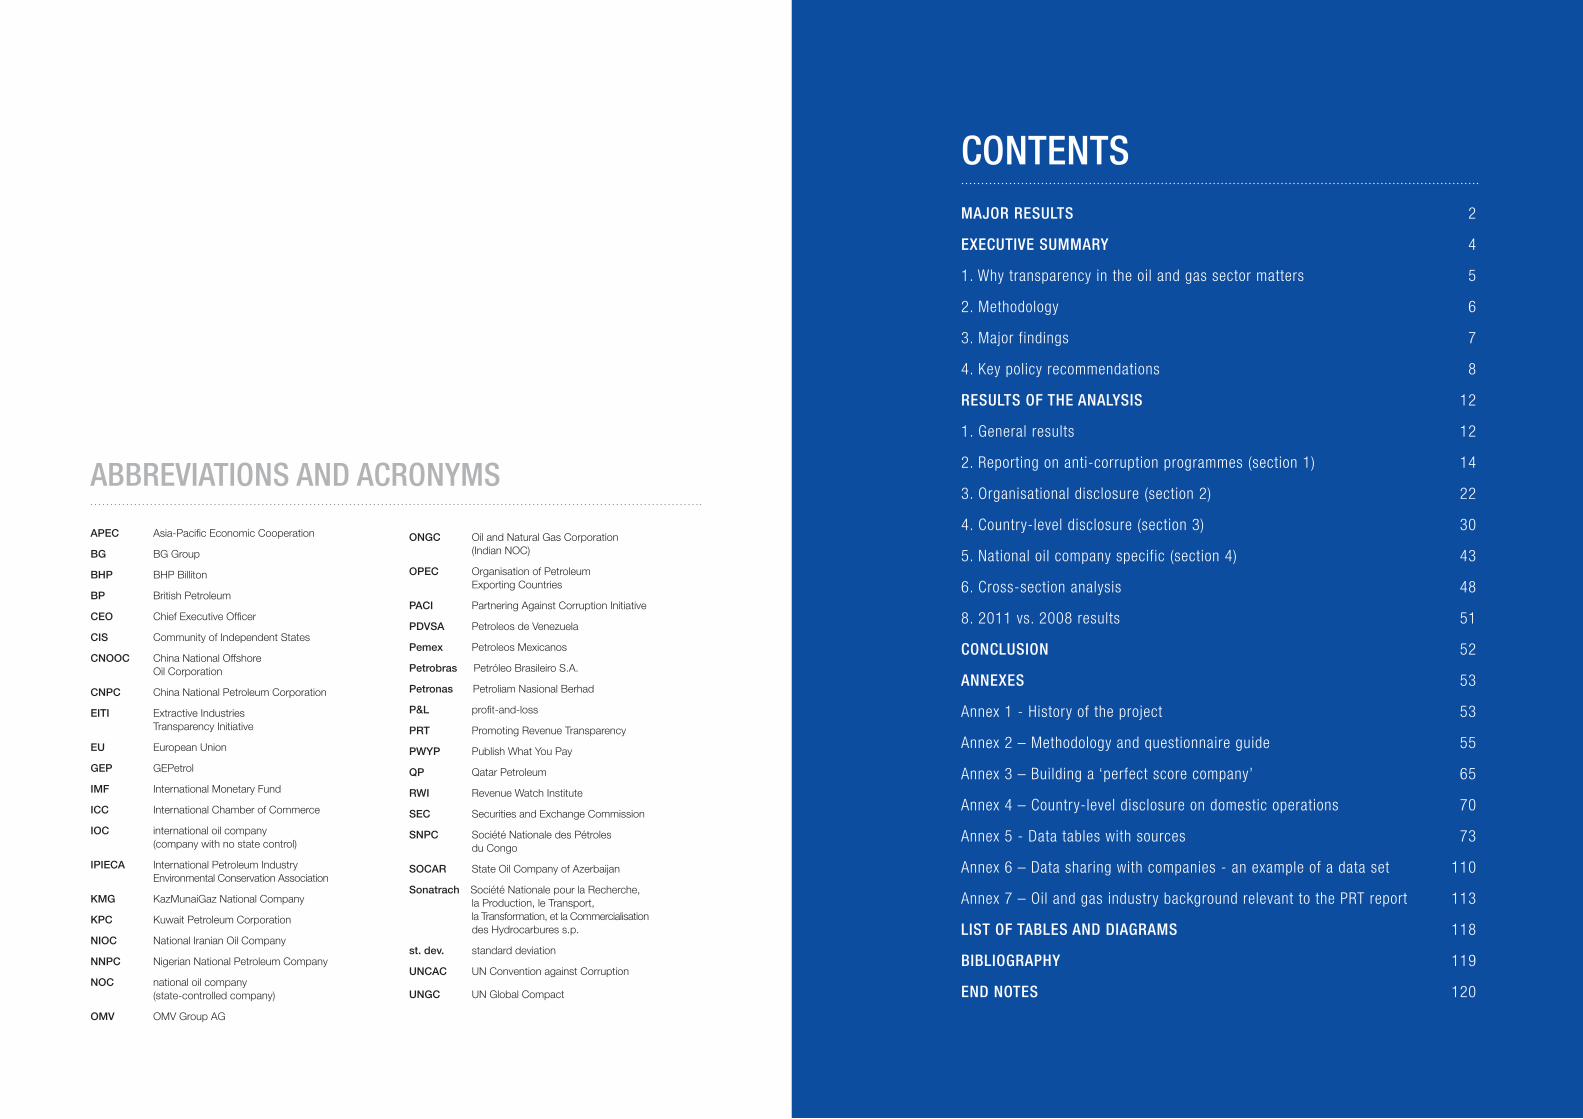
ABBREVIATIONS AND ACRONYMS
APEC Asia-Pacific Economic Cooperation
BG BG Group
BHP BHP Billiton
BP British Petroleum
CEO Chief Executive Officer
CIS Community of Independent States
CNOOC China National Offshore Oil Corporation
CNPC China National Petroleum Corporation
EITI Extractive Industries Transparency Initiative
EU European Union
GEP GEPetrol
IMF International Monetary Fund
ICC International Chamber of Commerce
IOC international oil company (company with no state control)
IPIECA International Petroleum Industry Environmental Conservation Association
KMG KazMunaiGaz National Company
KPC Kuwait Petroleum Corporation
NIOC National Iranian Oil Company
NNPC Nigerian National Petroleum Company
NOC national oil company (state-controlled company)
OMV OMV Group AG
ONGC Oil and Natural Gas Corporation (Indian NOC)
OPEC Organisation of Petroleum Exporting Countries
PACI Partnering Against Corruption Initiative
PDVSA Petroleos de Venezuela
Pemex Petroleos Mexicanos
Petrobras Petróleo Brasileiro S.A.
Petronas Petroliam Nasional Berhad
P&L profit-and-loss
PRT Promoting Revenue Transparency
PWYP Publish What You Pay
QP Qatar Petroleum
RWI Revenue Watch Institute
SEC Securities and Exchange Commission
SNPC Société Nationale des Pétroles du Congo
SOCAR State Oil Company of Azerbaijan
Sonatrach Société Nationale pour la Recherche, la Production, le Transport, la Transformation, et la Commercialisation des Hydrocarbures s.p.
st. dev. standard deviation
UNCAC UN Convention against Corruption
UNGC UN Global Compact
REPO
RTIN
G ON
AN
TI-C
ORRU
PTIO
N P
ROGR
AMM
ES
ORGA
NIS
ATIO
NAL
DIS
CLOS
URE
COUN
TRY-
LEVE
L DI
SCLO
SURE
- IN
TERN
ATIO
NAL
OPER
ATIO
NS43%AVERAGE
65%AVERAGE
16%AVERAGE
INTERNATIONAL OIL COMPANIES (IOCs)
NATIONAL OIL COMPANIES (NOCs)
93%
84%
84%
81%
78%
78%
78%
77%
75%
75%
72%
71%
71%
67%
67%
64%
61%
61%
61%
57%
45%
43%
41%
35%
32%
32%
32%
30%
29%
28%
28%
16%
13%
9%
9%
0%
100%
100%
100%
94%
94%
88% 88%
88%
88%
88%
88%
88%
88%
88%
81%
81%
81%
75%
75%
75%
75%
75%
75%
75%
75%
75%
75%
69%
63%
63%
56%
56%
50%
50%
44%
44%
44%
38%
31%
25%
19%
19%
13%
0%
69%
54%
40%
38%
29%
25%
20%
18%
16%
15%
19%
15%
15%
14%
14%
13%
12%
12%
11%
10%
10%
8%
8%
6%
2%
1%
0%
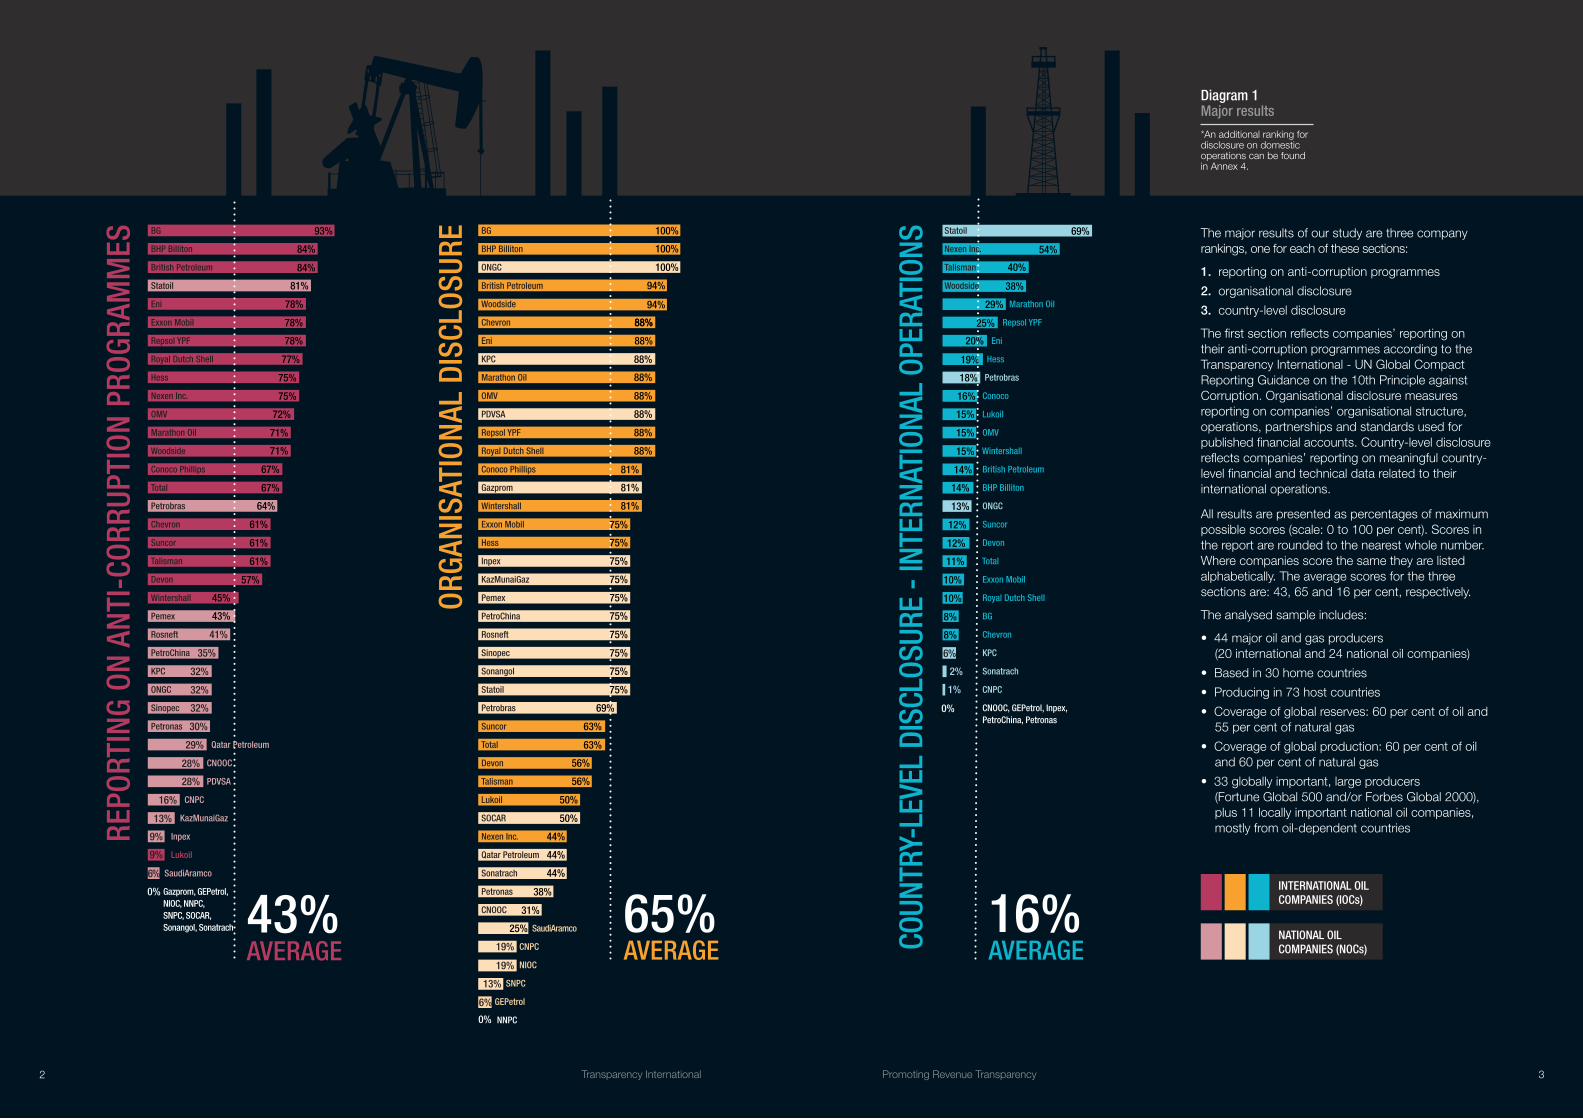
The major results of our study are three company rankings, one for each of these sections:
1. reporting on anti-corruption programmes
2. organisational disclosure
3. country-level disclosure
The first section reflects companies’ reporting on their anti-corruption programmes according to the Transparency International - UN Global Compact Reporting Guidance on the 10th Principle against Corruption. Organisational disclosure measures reporting on companies’ organisational structure, operations, partnerships and standards used for published financial accounts. Country-level disclosure reflects companies’ reporting on meaningful country-level financial and technical data related to their international operations.
All results are presented as percentages of maximum possible scores (scale: 0 to 100 per cent). Scores in the report are rounded to the nearest whole number. Where companies score the same they are listed alphabetically. The average scores for the three sections are: 43, 65 and 16 per cent, respectively.
The analysed sample includes:
• 44 major oil and gas producers (20 international and 24 national oil companies)
• Based in 30 home countries
• Producing in 73 host countries
• Coverage of global reserves: 60 per cent of oil and 55 per cent of natural gas
• Coverage of global production: 60 per cent of oil and 60 per cent of natural gas
• 33 globally important, large producers (Fortune Global 500 and/or Forbes Global 2000), plus 11 locally important national oil companies, mostly from oil-dependent countries
6%
6%
BG
BHP Billiton
British Petroleum
Statoil
Eni
Exxon Mobil
Repsol YPF
Royal Dutch Shell
Hess
Nexen Inc.
OMV
Marathon Oil
Woodside
Conoco Phillips
Total
Petrobras
Chevron
Suncor
Talisman
Devon
Wintershall
Pemex
Rosneft
PetroChina
KPC
ONGC
Sinopec
Petronas
Qatar Petroleum
CNOOC
PDVSA
CNPC
KazMunaiGaz
Inpex
Lukoil
SaudiAramco
Gazprom, GEPetrol, NIOC, NNPC, SNPC, SOCAR, Sonangol, Sonatrach
BG
BHP Billiton
ONGC
British Petroleum
Woodside
Chevron
Eni
KPC
Marathon Oil
OMV
PDVSA
Repsol YPF
Royal Dutch Shell
Conoco Phillips
Gazprom
Wintershall
Exxon Mobil
Hess
Inpex
KazMunaiGaz
Pemex
PetroChina
Rosneft
Sinopec
Sonangol
Statoil
Petrobras
Suncor
Total
Devon
Talisman
Lukoil
SOCAR
Nexen Inc.
Qatar Petroleum
Sonatrach
Petronas
CNOOC
SaudiAramco
CNPC
NIOC
SNPC
GEPetrol
NNPC
Statoil
Nexen Inc.
Talisman
Woodside
Marathon Oil
Repsol YPF
Eni
Hess
Petrobras
Conoco
Lukoil
OMV
Wintershall
British Petroleum
BHP Billiton
ONGC
Suncor
Devon
Total
Exxon Mobil
Royal Dutch Shell
BG
Chevron
KPC
Sonatrach
CNPC
CNOOC, GEPetrol, Inpex, PetroChina, Petronas
Diagram 1 Major results
*An additional ranking for disclosure on domestic operations can be found in Annex 4.
2 Transparency International Promoting Revenue Transparency 3
EXECUTIVE SUMMARYCompanies create value for their shareholders, but they should also share this value transparently in the countries in which they work, to promote economic development. There are three ways to promote fair sharing through greater transparency. First, sound, publicly disclosed anti-corruption programmes are essential to prevent individuals from misappropriating revenues. Second, value can be shared with business partners, provided these relationships are fully disclosed and the operating subsidiaries are made known to the public. Lastly, precise information about how much revenue goes to state budgets and how much is retained by companies must be fully disclosed to the public.
The Promoting Revenue Transparency project aims to make revenues from oil and gas extraction transparent and, as a result, more beneficial to the societies of resource-rich countries. In order to achieve this goal, we have analysed 44 leading global oil and gas producers, including both international oil companies (IOCs) and national oil companies (NOCs),1 in terms of their reporting on anti-corruption programmes, organisational disclosure and country-level disclosure. Our findings are intended to serve as a basis for improvement in corporate reporting by the sector, towards enhancing the transparency and accountability of these revenues.
1. WHY TRANSPARENCY IN THE OIL AND GAS SECTOR MATTERSOil and gas producers transfer considerable funds to host governments – in the form of license fees, royalties,2 dividends, taxes and support for local communities. These large financial inflows should contribute substantially to social and economic development, yet many resource-rich countries have been unable to transform resource wealth into wellbeing.3 When revenues from the extractive sector are not managed with transparency and accountability, mineral and petroleum wealth can fuel large-scale corruption, as well as poverty, injustice and conflict. One of the explanations for this phenomenon is that large revenue inflows lead to excessive rent-seeking.4
The question is how to make oil and gas revenues work for societies and not against them. The relevance of this question is strengthened by the fact that resource dependency is mostly a problem in poorer regions.5
The combination of high revenues of the oil and gas industry, high poverty levels in many oil-producing countries and, finally, high corruption risk6 makes transparency critical. Oil and gas rents7 can constitute a powerful budgetary instrument whose proper use is strongly dependent on government transparency and accountability. This money can foster long-term socioeconomic development, but it can also be misused, for example, to extend the political and economic power of a ruling elite. In a positive scenario, governments could use oil and gas rents to support education, healthcare, clean water supply, transportation infrastructure, small-scale entrepreneurship or even economic diversification – which are all basic conditions to lift people out of extreme poverty and foster long-term development. Citizens of resource-rich countries should have the right to know how their resources are managed, what income they bring and how this income is allocated.
Exploitation of natural resources and the related foreign direct investment also have an impact on local communities. There are both opportunities and risks related to such investments, which engage the labour market, the environment and local social structures.
This is another important reason why information transparency should be a basic principle in the extractive sector.
Our study evaluates companies on several important aspects of transparency. Why is each of these aspects important? First, anti-corruption programmes constitute the basic preventive anti-corruption measure applied by companies. Evaluating public reporting on programmes such as this is the only way for civil society to know if such programmes are in place. Such reporting demonstrates companies’ public commitment to fighting corruption. Second, we analyse organisational disclosure – reporting on relationships among companies, their subsidiaries and their partners, as well as the adequacy of their financial statements. This is necessary for transparent contracts and financial flows both inside and outside companies. Third, we analyse country-level disclosure concerning both transfers to governments and data that gives an insight into value sharing between host countries and companies. Such information is necessary for communities, civil society organisations and other stakeholders to monitor the management of natural resources in their countries and to hold their governments to account. Fourth, we examine certain NOC-specific issues that are necessary for transparency in the oil and gas sectors.
In our 2008 Promoting Revenue Transparency (PRT) report, we recommended that ‘home governments and appropriate regulatory agencies should consider introducing mandatory revenue transparency reporting for the operations of companies at home and abroad’.8 The importance of such disclosure in the extractive sector was recently acknowledged by legislative changes in Hong Kong9 and in the US (the Dodd-Frank financial reform legislation).10 When the new regulations are implemented, they should considerably enhance the overall transparency of financial flows to governments of oil and gas producing countries. Speaking in support of the new US law, Senator Richard Lugar said: ‘Too often, oil money intended for the nation’s poor ends up lining the pockets of the rich… The ‘resource curse’ affects us as well as producing countries. It exacerbates global poverty which can be a seedbed for terrorism, it empowers autocrats and dictators, and it can crimp world petroleum supplies by breeding instability’.11
4 Transparency International Promoting Revenue Transparency 5

2. METHODOLOGY12
Our report focuses on companies and their efforts to increase transparency and fight corruption, as well as their contribution to disclosing financial and other flows to host governments. We analyse 44 major oil and natural gas producers from 30 countries. We also analyse their country-level disclosure in all countries within their upstream production,13 which totalled 73 at the time of data collection. Our sample covers about 60 per cent of proved global oil reserves and more than 60 per cent of global oil production. Concerning natural gas, analysed companies cover about 55 per cent of proved global reserves and nearly 60 per cent of global production.14
The major results of the analysis are three separate company rankings, one for each of the sections: reporting on anti-corruption programmes, organisational disclosure and country-level disclosure. No combined cross-section score or ranking has been calculated because we found such results of low informative value, as there is little correlation among the results of different sections.15 All data was collected through desk research based exclusively on publicly available information or documents.16 Preliminary data was shared with companies, and 24 of the 44 companies made a thorough data review. We made no judgment on the levels of integrity of companies’ practices; our evaluation is only based on disclosed relevant information.
The questionnaire contains 51 questions focusing on the corporate information flow.17 The questions are organised into four sections:
SECTION 1. Reporting on anti-corruption programmes (questions 1-28) The first section follows the elements of Transparency International – UN Global Compact (UNGC) Reporting Guidance on the 10th Principle against Corruption.18 The questions refer to reporting on different elements of anti-corruption programmes, including policies, management systems and performance. Since the evaluation is based on reporting, some companies might under-report but perform well, while some good reporters may not perform as well as they imply.
SECTION 2. Organisational disclosure (questions 29-36)The second section includes a set of questions focusing on companies’ subsidiaries, partners and fields of operations. It also asks about the reliability of companies’ accounts (applied accounting standards and independent audit). All questions in this section focus on performance.
SECTION 3. Country-level disclosure (questions 37-46)This section asks about a limited set of operating and financial data, including money transfers to host governments. For each company, the entire set of questions is asked separately for each country within its upstream producing activities. The score for each question in this section, therefore, is a score for average country reporting.19 All questions focus on performance.
Our set of questions on country-level disclosure embraces a broader spectrum of data than Extractive Industries Transparency Initiative (EITI) reporting or what is required by the recently passed US legislation.20 In addition to transfers to governments, we ask for certain operating data (reserves and production) and certain data from profit-and-loss (P&L) accounts – all on a country-by-country basis. The intention behind this is to address a broader range of questions related to revenue transparency in the sector. One issue is to keep a record of money transfers to governments, and another is to allow civil society organisations to find out the value-sharing rules applied in their countries. They should have access to information about how value generated in extractive industries is shared between governments (societies) and companies.
SECTION 4. NOC-specific (questions 47-51)Questions in the fourth section apply only to the 24 NOCs in the sample. Not all of these questions apply to all NOCs, because some imply companies’ engagement in certain quasi-governmental activities. However, this is not always the case.
The first two sections focus on corporate preventive efforts aimed at increasing transparency and fighting corruption within their corporate structures, while the other two focus on corporate contribution to the disclosure of flows to host governments.
Each question was scored individually, and for each of the first three sections the total scores were calculated.21 For Sections 1 and 2, these were the simple sums of scores; for Section 3, for each country of operations a simple sum of scores for questions 37 to 46, and then the average among all such sums was calculated. The NOC-specific questions (Section 4) were evaluated separately with no general ranking.
3. MAJOR FINDINGSCompany rankings for Sections 1, 2 and 3 are presented in Diagram 1.22 The major findings are summarised below.
REPORTING ON ANTI-CORRUPTION PROGRAMMESMore and more, oil and gas companies are adopting and making publicly available anti-corruption programmes, the content of which is becoming increasingly similar. Nevertheless, there is a considerable group of companies, mostly non-listed23 NOCs that still do not publish their anti-corruption codes, policies or measures.
Based on our review of publicly available information, there are several important elements of anti-corruption programmes that appear to be rarely implemented by companies: the prohibition of facilitation payments, anti-corruption training for business partners or reporting on corruption-related incidents.
On average, IOCs report considerably better than NOCs (see Diagram 1).
ORGANISATIONAL DISCLOSUREPublic disclosure of partnerships and subsidiaries, including their countries of incorporation, are key elements of organisational disclosure. The average results in this section are relatively high. The domination of IOCs over NOCs is less obvious than in section 1, as European and North American companies are reluctant to reveal their partners in upstream operations; the latter also do not disclose much information on their non-consolidated subsidiaries.
COUNTRY-LEVEL DISCLOSURECountry-level disclosure on international operations has improved since the first PRT report was released. Reporting on production levels has become a broadly accepted standard (an average score of 71 per cent) and there are examples of good disclosure for each remaining type of data. There were positive signals from several companies that intend to increase their country -level reporting soon. This promising trend should be strengthened by the recently passed US legislation.
Nonetheless, in spite of this positive trend, country-level disclosure on international operations remains very weak; it received the lowest average score among all sections. Concerning governmental transfers and P&L data, many companies do not disclose any such information, and the average scores ranged from 4 to 20 per cent.
The host country environment itself cannot be exclusively blamed for poor disclosure. In the same host countries, often described as ‘difficult environments’, some companies disclose extensive information, while others disclose only very sparse information or none at all.
The average score for country-level disclosure on international operations was almost twice as high for IOCs as for NOCs. Concerning disclosure on domestic operations, NOCs performed better than IOCs, supplying 9 of the top 10.
NOC-SPECIFIC ISSUESPublic listing and independence from quasi-governmental functions (those performed on behalf of the government) are the major factors differentiating NOC performance. Listed NOCs with no quasi-governmental functions perform the best in all evaluated sections.
Since the first PRT report was published in 2008, there has been considerable progress in corporate reporting by NOCs. Eleven companies have begun publishing corporate documents, including their anti-corruption programmes such as codes of conduct and sustainability reports, as well as annual reports.
REGIONAL PERFORMANCERegional performance is mixed, though IOC-dominated regions (Australia, Europe and North America) lead in most rankings.
6 Transparency International 7Promoting Revenue Transparency
Companies from IOC-dominated regions perform the best in terms of reporting on anti-corruption programmes and country-level disclosure of international operations. On organisational disclosure, Latin American companies perform better than those from North America. Also, CIS-based companies come very close to the leaders.
EITI SUPPORT AND TRANSPARENCYFor NOCs, EITI support correlates positively with performance in all evaluated sections. For IOCs, this is the case only for reporting on anti-corruption programmes and organisational disclosure, while for country-level disclosure the correlation is negative.
TOP PERFORMERS Repsol is the only company that reached the top 10 for all three major rankings. Eight companies scored above average in all three rankings: Conoco, Eni, Hess, Marathon, Petrobras, Repsol, Statoil, and Woodside. All of them support the EITI.
4. KEY POLICY RECOMMENDATIONSWe have formulated several major recommendations on the basis of our analysis and resulting conclusions. They concern diverse parties: companies, public bodies and the investor community.
FOR ALL COMPANIES:
1. Detailed anti-corruption programmes should be publicly availableWe strongly recommend that companies review their reporting on anti-corruption programmes according to the TI - UNGC Reporting Guidance on the 10th Principle against Corruption. Several companies already meet the criteria, except for independent external assurance (D1524). Nonetheless, most companies do not follow the guidance, and their publicly available documents on anti-corruption programmes lack many key elements.
Some companies still do not make their codes of conduct publicly available. We strongly recommend that all such documents be published on websites, with no password protection.
2. Companies should undertake voluntary independent assurance of anti-corruption programmesNo company reviewed in this PRT project reported on independent assurance of its anti-corruption programme.
Corruption is a major risk factor of concern for companies and their stakeholders. We encourage companies to undertake voluntary independent assurance along the lines of the TI Framework for Voluntary Independent Assurance. Such a practice would assist companies in formulating and implementing proper programmes, while providing an objective and comparable assessment of a company’s anti-corruption efforts.
3. Companies should publish details of their subsidiaries and fields of operationsCompanies should make public details of their subsidiaries, both fully and non-fully consolidated, including subsidiaries’ countries of incorporation and parent companies’ interests. The same should hold for information on companies’ fields of operations, their interests and partners.
All such information should be clearly stated and easily accessible on the companies’ websites. Stakeholders should be able to easily trace the connections between diverse companies, the division of responsibilities and interests, and consequently the possible routes of financial flows.
4. Oil and gas companies should increase their reporting on a country-by-country basisVery few companies report substantial information on a country-by-country basis. However, some companies already recognise the importance of such reporting and provide broad voluntary country-level disclosure, which shows that they do not see it as a competitive disadvantage. Country-level reporting is an inherent part of true transparency, and necessary to assure good management of natural resources.
Companies’ country-by-country reporting should include transfers to governments (direct and indirect), basic operating data and key elements of profit-and-loss accounts. This data should allow stakeholders to trace how value is shared and how funds flow between companies and governments. Both elements are necessary for good management of natural resources.
5. Companies should join the Extractive Industries Transparency InitiativeThe Extractive Industries Transparency Initiative (EITI) offers a simple mechanism to ensure the systematic disclosure and dissemination of information on payments and revenue from mining and oil and gas. Therefore companies should join the EITI as a way to promote both corporate and government transparency.
6. Companies should create and maintain active corporate websitesPublic information can be most easily and inexpensively accessed on the Internet. Therefore a corporate website is an ideal repository for information on a company. However, corporate information is often spread throughout different web pages, databases and libraries, making it almost impossible for an independent stakeholder to access key information within a reasonable amount of time.
We believe that if a company truly intends to make its information publicly available, it should maintain an informative, user-friendly and updated website. All corporate documents and publications should be directly downloadable, particularly annual reports, stock exchange fillings, social responsibility reports and corporate codes of conduct. All externally published information relevant for the company (i.e. EITI reports from countries where a company participates in the initiative) should either be on its website or linked to it. The website should include active contact information for any member of the public interested in further information. Each corporate website should have an English version, which allows for global comparisons and analyses that can be further used by local NGOs and other stakeholders. It is important for websites to be regularly updated, including media releases and all published data.
FOR NOCS:
7. All NOCs should introduce internationally or generally accepted accounting standards, as well as independent auditing of their accounts A number of non-listed NOCs still do not publish their accounts in line with internationally or generally accepted accounting standards, others do not reveal the standards they use, and some do not undergo independent auditing. Accordingly, even if they publish their financial and operating reports, it is difficult to judge the quality and comparability of the data against international standards.
8. The relationships between home governments and NOCs should be clear and publicly disclosedNOCs hold special positions because governments are their controlling owners. This influences not only competition in the extractive market but also the transparency of public financial flows and company governance.
The rules that regulate relations between governments and NOCs must be very carefully set and publicly known. All quasi-governmental functions of NOCs, if any, must be reported because they concern the management of public resources, which should be performed for the public good.
Even though non-listed NOCs are not regulated by stock exchanges, they should be accountable to their stakeholders, just as listed companies are accountable to their investors.
FOR PUBLIC BODIES:
9. The European Union should amend relevant legislation to require EU-registered companies to report on their operations on a country-by-country basisIn July 2010 the US Congress passed the Dodd-Frank Wall Street Reform and Consumer Protection Act, which requires all companies registered with the US Securities and Exchange Commission to publicly report on a country-by-country basis their payments to governments related to the extraction of hydrocarbons and minerals. This important piece of legislation is in line with one of the major recommendations of the 2008 PRT report.
We encourage EU authorities to follow this example and additionally to extend required country-by-country reporting to operating and key P&L data. This should allow for the monitoring of both money flows and value-sharing processes.
8 Transparency International 9Promoting Revenue Transparency

10. All governments that are home to oil and gas producers should require companies to report on their operations on a country-by-country basis We strongly encourage governments, including the US, to follow up on and broaden the spectrum of required country-by-country reporting. Companies should report not only on their governmental transfers but also on their operations and key P&L elements.
11. Stock exchanges should enforce regulations providing for country-level reportingWe strongly encourage all major stock exchanges to enforce appropriate requirements and regulations aimed at providing more country-level reporting by companies, primarily among producers of natural resources. Such information should include transfers to governments, basic operating data and key elements of profit-and-loss accounts.
Stock exchanges have to be transparent in order to ensure a publicly accountable and efficient market. Each step toward increasing the level of transparency decreases the level of unforeseen risk and consequent excessive volatility. Any such regulation would have a double positive effect – directly forcing companies to engage in better disclosure, and indirectly lowering the risk of investors’ decisions.
FOR THE INVESTOR COMMUNITY:
12. International rating agencies and risk analysts should include transparency measures in their risk evaluation modelsCorruption constitutes a major risk for companies and their stakeholders. Anti-corruption programmes, organisational transparency and country-level revenue transparency can lower the risk of corruption. This is especially true for industries that are highly vulnerable to corruption. A thorough risk analysis should therefore include a corruption risk assessment.
We strongly encourage all rating agencies and risk analysts to include corporate transparency measures in their risk evaluation models. Sound anti-corruption programmes and transparent reporting should become necessary standards for highly rated companies.
13. The International Accounting Standards Board should require companies to report key information on a country-by-country basisThe International Accounting Standards Board (IASB) should complete its work on new financial reporting standards to require extractive companies to report country-by-country data on reserves, volumes, key P&L elements, as well as benefit streams to governments. This information is valuable for investors as well as for the governments and citizens of resource-producing countries. A new international accounting standard for the extractive companies has become all the more essential since the passage of the 2010 Wall Street Reform and Consumer Protection Act in the US. This reform would also help standardise reporting between international and domestic companies, and thus level the playing field.
14. Corporate responsibility indices should include reporting on anti-corruption programmes, organisational disclosure and country-level disclosureTransparency and accountability are important elements of corporate responsibility. This is especially true for the extractive industries, where transparency and accountability lead to better management of natural resources, which is particularly critical in poor countries.
Accordingly, we recommend that all three elements of corporate transparency be included in corporate responsibility indices: reporting on anti-corruption programmes, organisational disclosure and country-level disclosure.
© Flickr/Robert Galloway
10 Transparency International 11Promoting Revenue Transparency

RESULTS OF THE ANALYSIS
1. GENERAL RESULTSThe analysis of collected data led to very different results for each analysed section. On average, companies performed relatively well on organisational disclosure, worse on reporting on anti-corruption programmes and very poorly on country-level disclosure.
For organisational disclosure, the average score was 65 per cent, with only one company scoring zero. For reporting on anti-corruption programmes, the average score was 43 per cent; this section had the highest number of zero-scoring companies, with eight evaluated companies awarded no points for their reporting on anti-corruption programmes. For country-level disclosure, we evaluated international and domestic operations separately. Disclosure on international operations was evaluated for only 31 out of 44 companies, because 13 companies do not produce hydrocarbons abroad. The average score was 16 per cent, with five companies scoring zero. For domestic operations (calculated for all 44 companies), the results were considerably better; the average score was 53 per cent, with four companies scoring zero. No company scored zero in all of the first three sections.
The last section, with five NOC-specific questions, resulted in a very complex picture of this group. The NOCs constitute a heterogeneous group, requiring case-by-case analysis. The major differentiating factor among these companies was their public listing on a stock exchange. Accordingly, we divided NOCs into three groups: publicly listed NOCs, NOCs with listed major upstream subsidiaries, and non-listed NOCs.
Using the division between IOCs and NOCs, as well as the NOC-grouping according to their listing status, we checked for relative average performance of each relevant company group (see Diagram 3). IOCs were the only group scoring above average in all three sections. Listed NOCs achieved above-average results on organisational disclosure and country-level disclosure. The remaining NOCs, both those with listed subsidiaries and those that are non-listed, underperformed significantly in all three sections.
Another interesting finding was how NOCs and IOCs performed depending on their EITI support. Both NOCs and IOCs who support the EITI outperformed the average in all three sections. Non-EITI supporter IOCs underperformed on organisational disclosure, but surprisingly they performed better than EITI-supporter IOCs on country-level disclosure. Non-EITI supporter NOCs underperformed in all the sections. EITI support coincides with better performance for NOCs, while the effect is mixed for IOCs.
Diagram 2 General results in section 1, 2 and 3
Each point illustrates one company
100%
80%
60%
40%
20%
0%
Diagram 3 Relative performance IOCs and NOC-groups
Performance measured as relative to the average of each section (sample average =1)
Diagram 4 Relative performance NOCs vs. IOCs and EITI-support vs. Non-support
Performance measured as relative to the average of each section (sample average =1)
ABOVE AVERAGE
BELOW AVERAGE IOCs
listed NOCs NOCs with listed
subsidiariesnon-listed
NOCs
NOCs EITI IOCs non-EITI
IOCs EITI
NOCs non-EITI
ORGANISATIONAL DISCLOSURE
REPORTING ON ANTI- CORRUPTION PROGRAMME
COUNTRY-LEVEL DISCLOSURE (INTERNATIONAL OPERATIONS)
ABOVE AVERAGE
BELOW AVERAGE
SAMPLE
SAMPLE
12 Transparency International 13Promoting Revenue Transparency

REPORTING ON ANTI-CORRUPTION PROGRAMMES
43%AVERAGE SCORE
93%HIGHEST PERFORMING:
BG
0%WORST PERFORMING:
GAZPROM, GEPETROL, NIOC, NNPC, SNPC, SOCAR,
SONANGOL, SONATRACH
© Flickr/Adib Roy
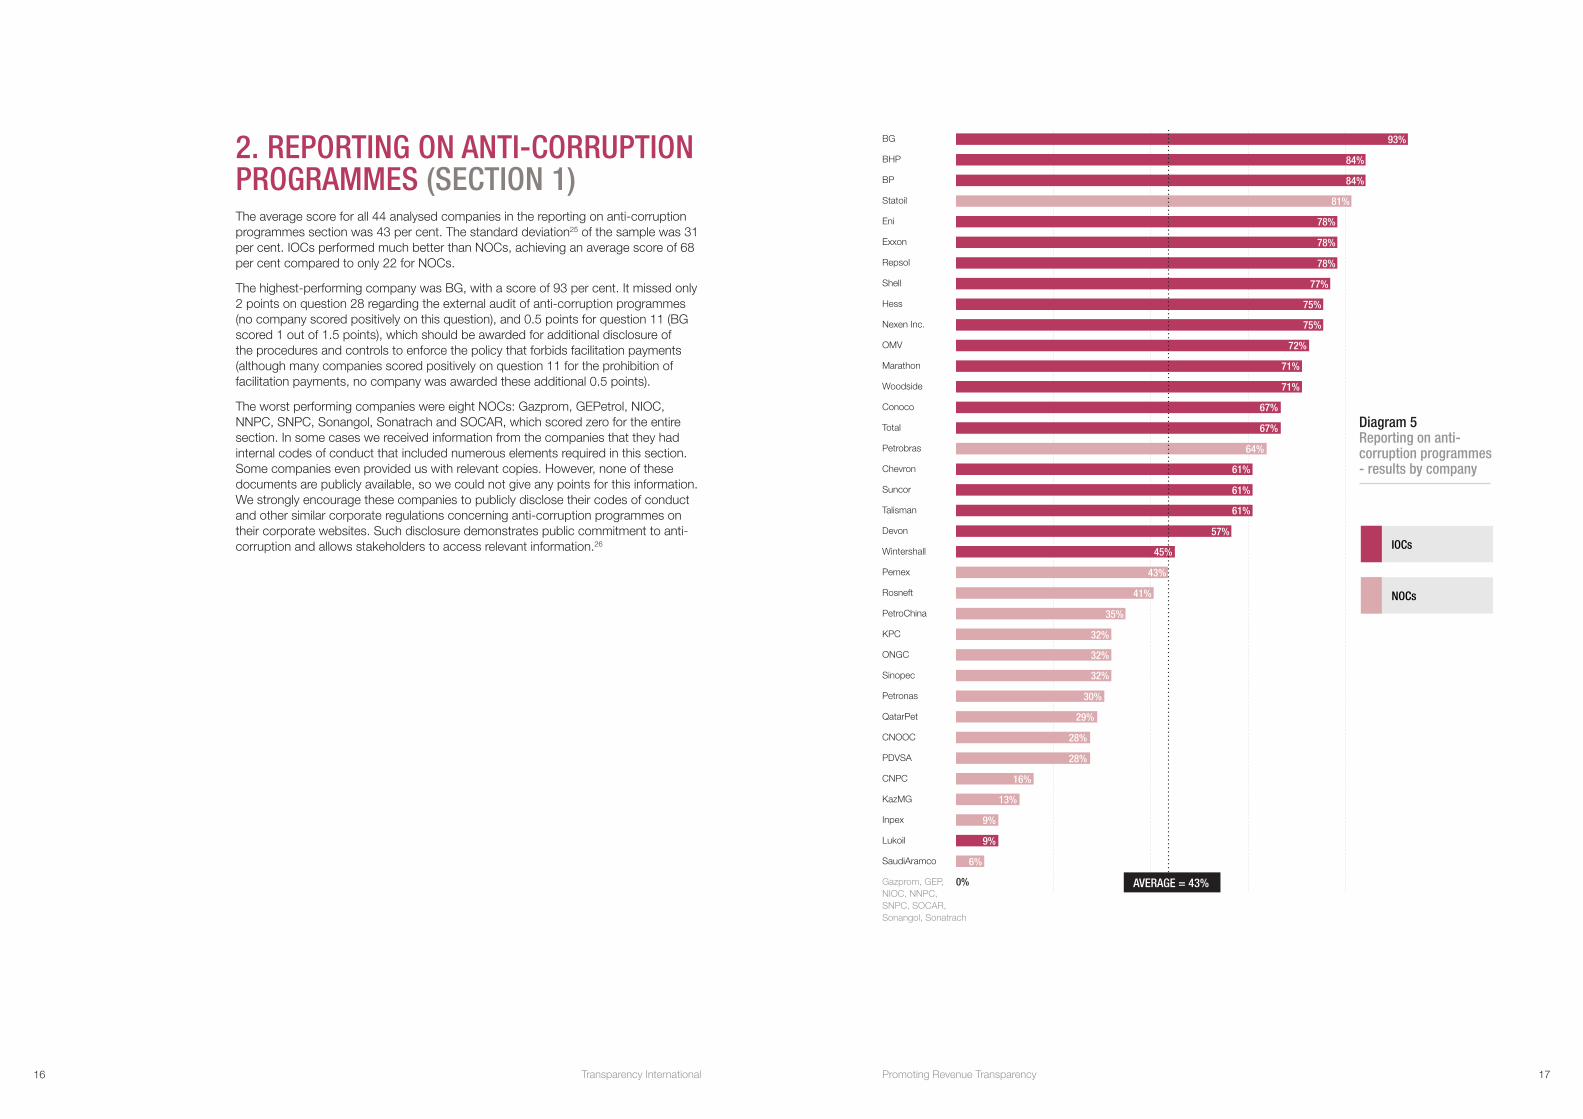
2. REPORTING ON ANTI-CORRUPTION PROGRAMMES (SECTION 1)The average score for all 44 analysed companies in the reporting on anti-corruption programmes section was 43 per cent. The standard deviation25 of the sample was 31 per cent. IOCs performed much better than NOCs, achieving an average score of 68 per cent compared to only 22 for NOCs.
The highest-performing company was BG, with a score of 93 per cent. It missed only 2 points on question 28 regarding the external audit of anti-corruption programmes (no company scored positively on this question), and 0.5 points for question 11 (BG scored 1 out of 1.5 points), which should be awarded for additional disclosure of the procedures and controls to enforce the policy that forbids facilitation payments (although many companies scored positively on question 11 for the prohibition of facilitation payments, no company was awarded these additional 0.5 points).
The worst performing companies were eight NOCs: Gazprom, GEPetrol, NIOC, NNPC, SNPC, Sonangol, Sonatrach and SOCAR, which scored zero for the entire section. In some cases we received information from the companies that they had internal codes of conduct that included numerous elements required in this section. Some companies even provided us with relevant copies. However, none of these documents are publicly available, so we could not give any points for this information. We strongly encourage these companies to publicly disclose their codes of conduct and other similar corporate regulations concerning anti-corruption programmes on their corporate websites. Such disclosure demonstrates public commitment to anti-corruption and allows stakeholders to access relevant information.26
Diagram 5 Reporting on anti-corruption programmes - results by company
BG
BHP
BP
Statoil
Eni
Exxon
Repsol
Shell
Hess
Nexen Inc.
OMV
Marathon
Woodside
Conoco
Total
Petrobras
Chevron
Suncor
Talisman
Devon
Wintershall
Pemex
Rosneft
PetroChina
KPC
ONGC
Sinopec
Petronas
QatarPet
CNOOC
PDVSA
CNPC
KazMG
Inpex
Lukoil
SaudiAramco
Gazprom, GEP, NIOC, NNPC, SNPC, SOCAR, Sonangol, Sonatrach
93%
84%
84%
81%
78%
78%
78%
77%
75%
75%
72%
71%
71%
67%
67%
64%
61%
61%
61%
57%
45%
43%
41%
35%
32%
32%
32%
30%
29%
28%
28%
16%
13%
9%
9%
6%
0% AVERAGE = 43%
IOCs
NOCs
16 Transparency International 17Promoting Revenue Transparency
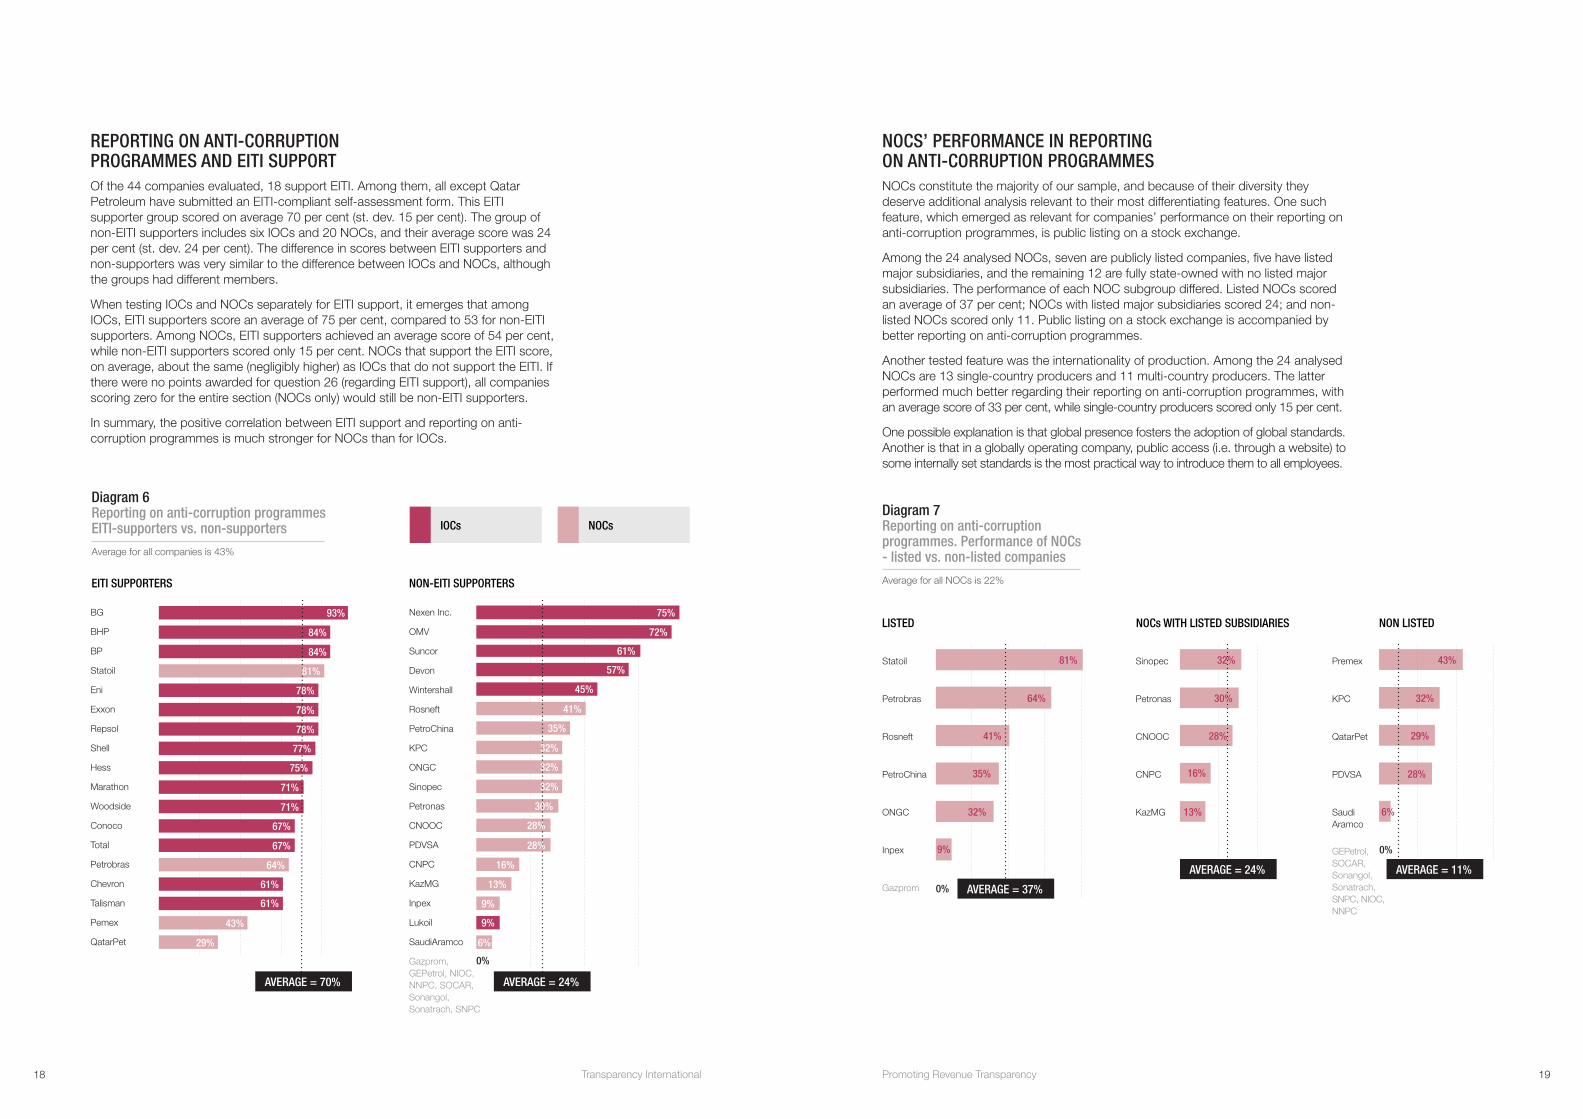
REPORTING ON ANTI-CORRUPTION PROGRAMMES AND EITI SUPPORTOf the 44 companies evaluated, 18 support EITI. Among them, all except Qatar Petroleum have submitted an EITI-compliant self-assessment form. This EITI supporter group scored on average 70 per cent (st. dev. 15 per cent). The group of non-EITI supporters includes six IOCs and 20 NOCs, and their average score was 24 per cent (st. dev. 24 per cent). The difference in scores between EITI supporters and non-supporters was very similar to the difference between IOCs and NOCs, although the groups had different members.
When testing IOCs and NOCs separately for EITI support, it emerges that among IOCs, EITI supporters score an average of 75 per cent, compared to 53 for non-EITI supporters. Among NOCs, EITI supporters achieved an average score of 54 per cent, while non-EITI supporters scored only 15 per cent. NOCs that support the EITI score, on average, about the same (negligibly higher) as IOCs that do not support the EITI. If there were no points awarded for question 26 (regarding EITI support), all companies scoring zero for the entire section (NOCs only) would still be non-EITI supporters.
In summary, the positive correlation between EITI support and reporting on anti-corruption programmes is much stronger for NOCs than for IOCs.
Diagram 6 Reporting on anti-corruption programmes EITI-supporters vs. non-supporters
Average for all companies is 43%
IOCs NOCs
BG
BHP
BP
Statoil
Eni
Exxon
Repsol
Shell
Hess
Marathon
Woodside
Conoco
Total
Petrobras
Chevron
Talisman
Pemex
QatarPet
Nexen Inc.
OMV
Suncor
Devon
Wintershall
Rosneft
PetroChina
KPC
ONGC
Sinopec
Petronas
CNOOC
PDVSA
CNPC
KazMG
Inpex
Lukoil
SaudiAramco
Gazprom, GEPetrol, NIOC, NNPC, SOCAR, Sonangol, Sonatrach, SNPC
AVERAGE = 70% AVERAGE = 24%
93%
84%
84%
81%
78%
78%
78%
77%
75%
71%
71%
67%
67%
64%
61%
61%
43%
29%
75%
72%
61%
57%
45%
41%
35%
32%
32%
32%
30%
28%
28%
16%
13%
9%
9%
6%
0%
NOCS’ PERFORMANCE IN REPORTING ON ANTI-CORRUPTION PROGRAMMESNOCs constitute the majority of our sample, and because of their diversity they deserve additional analysis relevant to their most differentiating features. One such feature, which emerged as relevant for companies’ performance on their reporting on anti-corruption programmes, is public listing on a stock exchange.
Among the 24 analysed NOCs, seven are publicly listed companies, five have listed major subsidiaries, and the remaining 12 are fully state-owned with no listed major subsidiaries. The performance of each NOC subgroup differed. Listed NOCs scored an average of 37 per cent; NOCs with listed major subsidiaries scored 24; and non-listed NOCs scored only 11. Public listing on a stock exchange is accompanied by better reporting on anti-corruption programmes.
Another tested feature was the internationality of production. Among the 24 analysed NOCs are 13 single-country producers and 11 multi-country producers. The latter performed much better regarding their reporting on anti-corruption programmes, with an average score of 33 per cent, while single-country producers scored only 15 per cent.
One possible explanation is that global presence fosters the adoption of global standards. Another is that in a globally operating company, public access (i.e. through a website) to some internally set standards is the most practical way to introduce them to all employees.
Diagram 7 Reporting on anti-corruption programmes. Performance of NOCs - listed vs. non-listed companies
Average for all NOCs is 22%
LISTED NOCs WITH LISTED SUBSIDIARIES NON LISTED
Statoil
Petrobras
Rosneft
PetroChina
ONGC
Inpex
Gazprom
Sinopec
Petronas
CNOOC
CNPC
KazMG
Premex
KPC
QatarPet
PDVSA
Saudi Aramco
GEPetrol, SOCAR, Sonangol, Sonatrach, SNPC, NIOC, NNPC
AVERAGE = 37%
AVERAGE = 24% AVERAGE = 11%
81%
64%
41%
35%
32%
9%
0%
32%
30%
28%
16%
13%
43%
32%
29%
28%
6%
0%
EITI SUPPORTERS NON-EITI SUPPORTERS
18 Transparency International 19Promoting Revenue Transparency
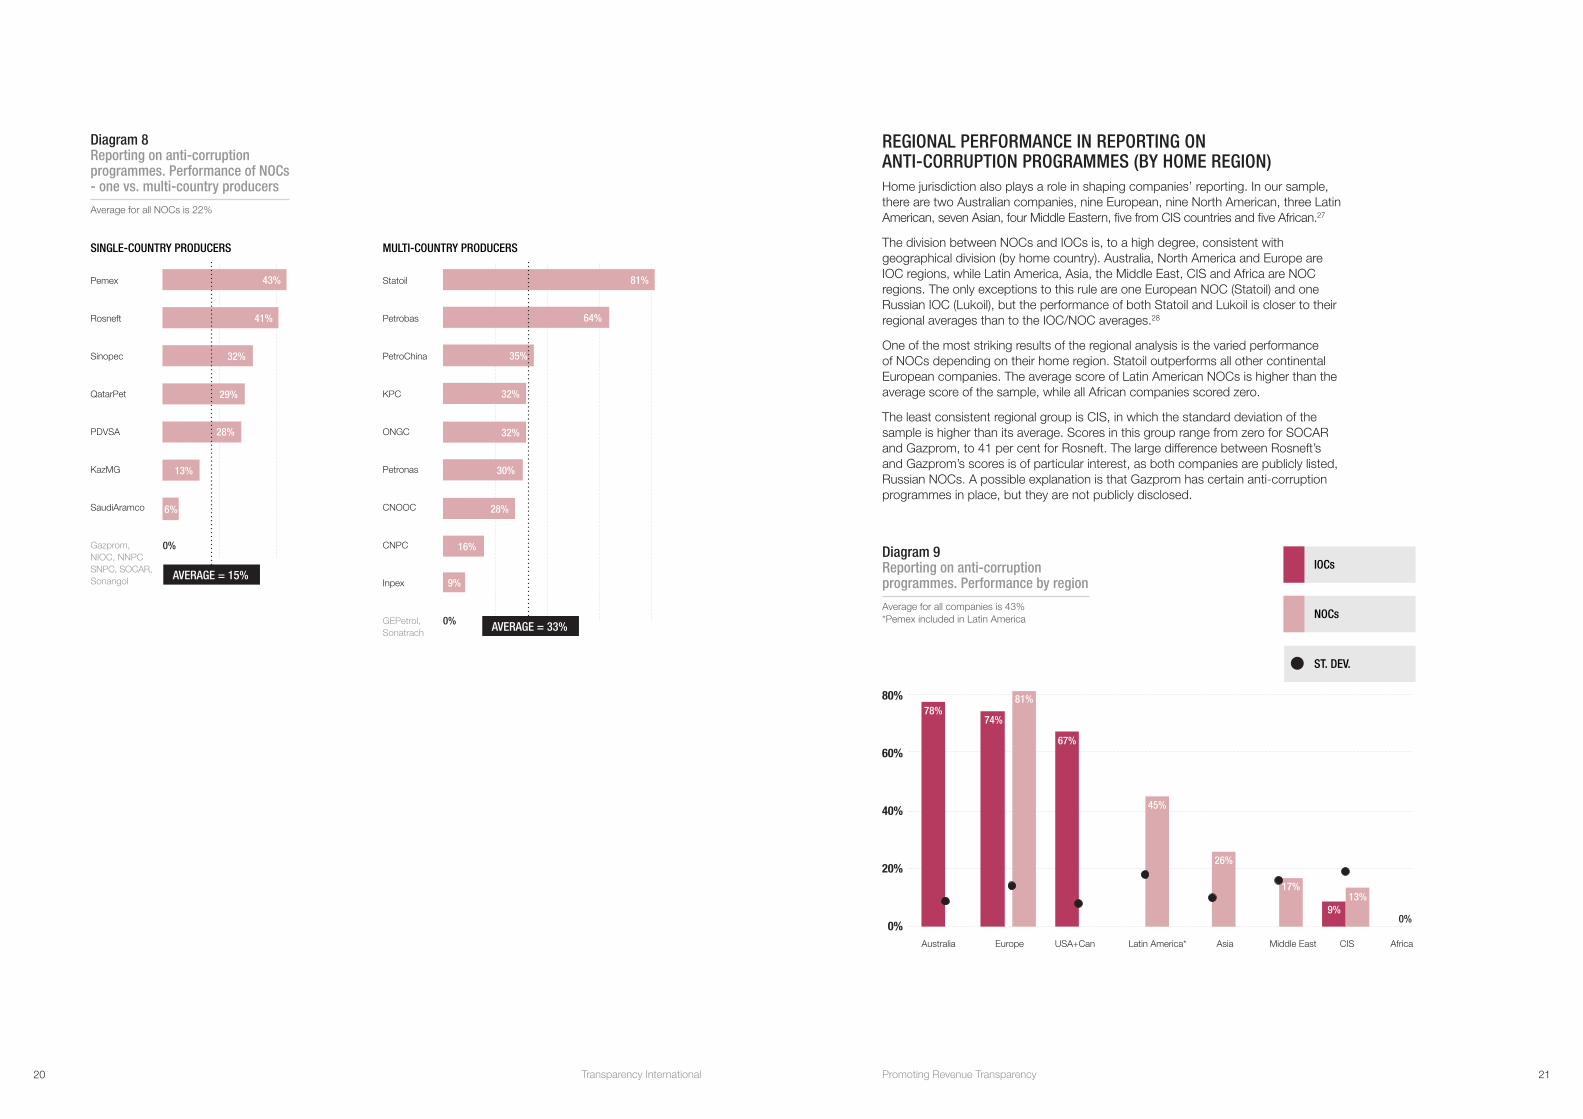
Diagram 8 Reporting on anti-corruption programmes. Performance of NOCs - one vs. multi-country producers
Average for all NOCs is 22%
SINGLE-COUNTRY PRODUCERS MULTI-COUNTRY PRODUCERS
Pemex
Rosneft
Sinopec
QatarPet
PDVSA
KazMG
SaudiAramco
Gazprom, NIOC, NNPC SNPC, SOCAR, Sonangol
Statoil
Petrobas
PetroChina
KPC
ONGC
Petronas
CNOOC
CNPC
Inpex
GEPetrol, Sonatrach
AVERAGE = 15%
AVERAGE = 33%
43%
41%
32%
29%
28%
13%
6%
0%
81%
64%
35%
32%
32%
30%
28%
16%
9%
0%
REGIONAL PERFORMANCE IN REPORTING ON ANTI-CORRUPTION PROGRAMMES (BY HOME REGION)Home jurisdiction also plays a role in shaping companies’ reporting. In our sample, there are two Australian companies, nine European, nine North American, three Latin American, seven Asian, four Middle Eastern, five from CIS countries and five African.27
The division between NOCs and IOCs is, to a high degree, consistent with geographical division (by home country). Australia, North America and Europe are IOC regions, while Latin America, Asia, the Middle East, CIS and Africa are NOC regions. The only exceptions to this rule are one European NOC (Statoil) and one Russian IOC (Lukoil), but the performance of both Statoil and Lukoil is closer to their regional averages than to the IOC/NOC averages.28
One of the most striking results of the regional analysis is the varied performance of NOCs depending on their home region. Statoil outperforms all other continental European companies. The average score of Latin American NOCs is higher than the average score of the sample, while all African companies scored zero.
The least consistent regional group is CIS, in which the standard deviation of the sample is higher than its average. Scores in this group range from zero for SOCAR and Gazprom, to 41 per cent for Rosneft. The large difference between Rosneft’s and Gazprom’s scores is of particular interest, as both companies are publicly listed, Russian NOCs. A possible explanation is that Gazprom has certain anti-corruption programmes in place, but they are not publicly disclosed.
Diagram 9 Reporting on anti-corruption programmes. Performance by region
Average for all companies is 43%*Pemex included in Latin America
80%
60%
40%
20%
0%Australia Europe USA+Can Latin America* Asia Middle East CIS Africa
IOCs
NOCs
ST. DEV.
78%74%
81%
67%
45%
26%
17%
9%13%
0%
20 Transparency International 21Promoting Revenue Transparency

ORGANISATIONAL DISCLOSURE
65%AVERAGE SCORE
100%HIGHEST PERFORMING:
BG, BHP, ONGC
0%WORST PERFORMING:
NNPC
© George Osodi / Panos
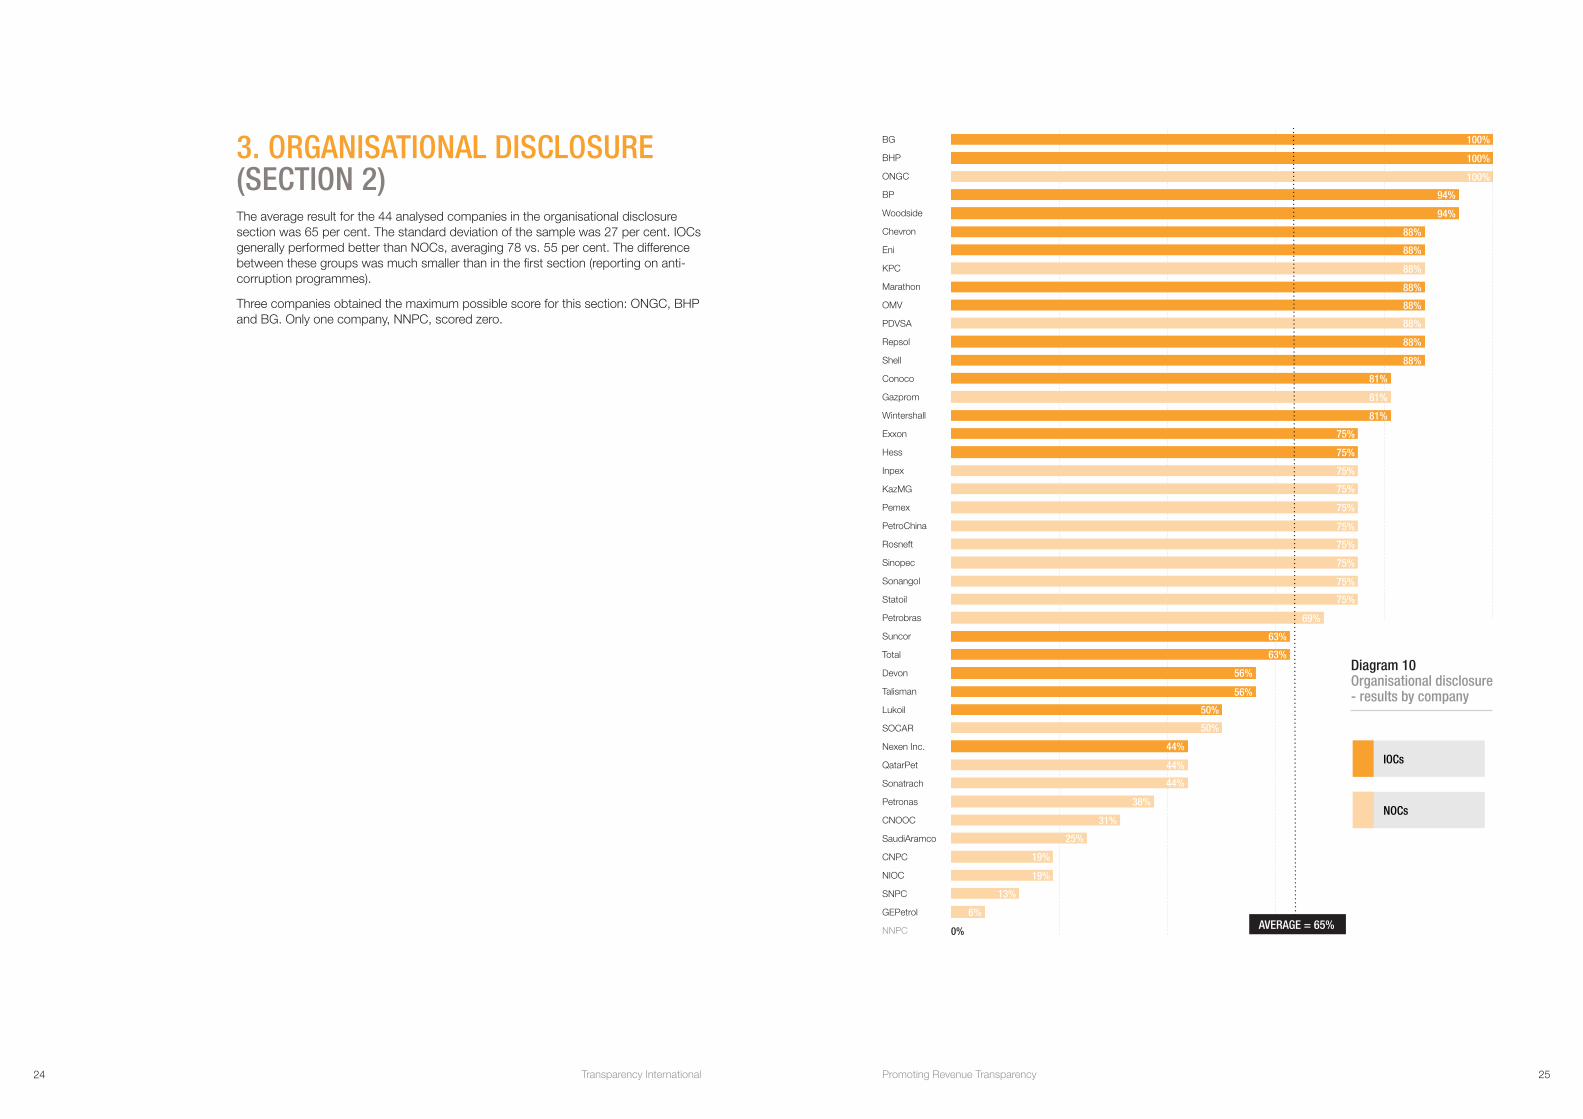
3. ORGANISATIONAL DISCLOSURE (SECTION 2)The average result for the 44 analysed companies in the organisational disclosure section was 65 per cent. The standard deviation of the sample was 27 per cent. IOCs generally performed better than NOCs, averaging 78 vs. 55 per cent. The difference between these groups was much smaller than in the first section (reporting on anti-corruption programmes).
Three companies obtained the maximum possible score for this section: ONGC, BHP and BG. Only one company, NNPC, scored zero.
Diagram 10 Organisational disclosure - results by company
IOCs
NOCs
BG
BHP
ONGC
BP
Woodside
Chevron
Eni
KPC
Marathon
OMV
PDVSA
Repsol
Shell
Conoco
Gazprom
Wintershall
Exxon
Hess
Inpex
KazMG
Pemex
PetroChina
Rosneft
Sinopec
Sonangol
Statoil
Petrobras
Suncor
Total
Devon
Talisman
Lukoil
SOCAR
Nexen Inc.
QatarPet
Sonatrach
Petronas
CNOOC
SaudiAramco
CNPC
NIOC
SNPC
GEPetrol
NNPC AVERAGE = 65%
100%
100%
100%
94%
94%
88%
88%
88%
88%
88%
88%
88%
88%
81%
81%
81%
75%
75%
75%
75%
75%
75%
75%
75%
75%
75%
69%
63%
63%
56%
56%
50%
50%
44%
44%
44%
38%
31%
25%
19%
19%
13%
6%
0%
24 Transparency International 25Promoting Revenue Transparency

ORGANISATIONAL DISCLOSURE AND EITI SUPPORTThe group of 18 EITI supporters scored an average of 80 per cent in the second section of the questionnaire (st. dev. 15 per cent), while the group of non-EITI supporters averaged 55 per cent (st. dev. 29 per cent). Like with the first section, the difference in scores between EITI supporters and non-supporters was very similar to the difference between IOCs and NOCs.
Testing IOCs and NOCs separately for EITI support, it emerges that among IOCs that support the EITI, the average score for the second section is 84 per cent, vs. 64 for non-EITI supporters. Among NOCs, EITI supporters averaged 66 per cent, while non-EITI supporters scored 53. Like with the first section, EITI-supporting NOCs perform comparably to non-EITI supporting IOCs.
Diagram 11 Organisational disclosure EITI-supporters vs. non-supporters
Average for all companies is 43%
IOCs NOCs
EITI SUPPORTERS NON-EITI SUPPORTERS
BG
BHP
BP
Woodside
Chevron
Eni
Marathon
Repsol
Shell
Conoco
Exxon
Hess
Pemex
Statoil
Petrobas
Total
Talisman
QatarPet
ONGC
KPC
OMV
PDVSA
Gazprom
Wintershall
Inpex
KazMG
PetroChina
Rosneft
Sinopec
Sonangol
Suncor
Devon
Lukoil
SOCAR
Nexen Inc.
Sonatrach
Petronas
CNOOC
SaudiAramco
CNPC
NIOC
SNPC
GEPetrol
NNPC
AVERAGE = 80%
AVERAGE = 55%
100%
100%
94%
94%
88%
88%
88%
88%
88%
81%
75%
75%
75%
75%
69%
63%
56%
44%
100%
88%
88%
88%
81%
81%
75%
75%
75%
75%
75%
75%
63%
56%
50%
50%
44%
44%
38%
31%
25%
19%
19%
13%
6%
0%
NOCS’ PERFORMANCE ON ORGANISATIONAL DISCLOSUREWe tested whether there is a relationship between companies’ performance on organisational disclosure and their public listing status on stock exchanges.
Publicly listed companies achieved an average score of 79 per cent, NOCs with listed subsidiaries 48, and non-listed NOCs 44. Public listing of companies is accompanied by a higher level of organisational disclosure, which is primarily related to legal reporting requirements.
We also tested the relationship between the internationality of production (one- vs. multi-country producers) and companies’ performance on organisational disclosure. The test showed there is no considerable difference in performance based on internationality of production, and among NOCs, single-country producers and multi-country producers achieve similar scores.
Diagram 12 Organisational disclosure Performance of NOCs listed vs. non-listed companies
Average for all NOCs is 55%
LISTED NOCs WITH LISTED SUBSIDIARIES NON LISTED
ONGC
Gazprom
Inpex
PetroChina
Rosneft
Statoil
Petrobras
KazMG
Sinopec
Petronas
CNOOC
CNPC
KPC
PDVSA
Pemex
Sonangol
SOCAR
QatarPet
Sonatrach
SaudiAramco
NIOC
SNPC
GEPetrol
NNPC
AVERAGE = 79%
AVERAGE = 48%
AVERAGE = 44%
100%
81%
75%
75%
75%
75%
69%
75%
75%
38%
31%
19%
88%
88%
75%
75%
50%
44%
44%
25%
19%
13%
6%
0%
26 Transparency International 27Promoting Revenue Transparency

RESULTS BY HOME REGION In the section on organisational disclosure, regional differences are smaller than in the section on reporting on anti-corruption programmes. Also, the division between better-performing IOC-dominated regions vs. worse-performing NOC-dominated regions does not hold. Latin American companies and NOCs from the CIS region perform better on average than Northern American companies. In each regional group at least one company scores above the total sample average.
The section on organisational disclosure tested companies on eight questions. Two concerned the reliability of accounts, asking about external audit and applied accounting standards (questions 35 and 36). All companies scoring zero on one or both of these questions were NOCs from NOC-dominated regions (Asia, Africa, Middle East and CIS). Such companies’ accounts, even if publicly available, lack comparability against international standards, and their quality is difficult to judge.29
The remaining six questions concentrated on the disclosure of subsidiaries and upstream operations. Such information should be publicly available for stakeholders to reveal the connections between diverse companies, the division of responsibilities and interests, and consequently the possible routes of financial flows.30 Questions 29, 31 and 33 asked about the disclosure of consolidated subsidiaries, non-consolidated subsidiaries and upstream fields of operations respectively (including names and percentages of ownership/interest). Questions 30 and 32 asked about the disclosure of countries of incorporation of companies' consolidated and non-consolidated subsidiaries, while question 34 asked about partners in upstream fields of operations (including their percentages of interest).
For these six questions we tested regional performance, separately, for each of them. Australia leads on all six questions, while other regions’ performance is more question-dependent. The weak point for European companies is question 34, regarding partners and their interests in upstream fields of operations. North American companies on average revealed little information on their non-consolidated subsidiaries and partners. Latin American companies (which perform very well in the entire category) were the weakest on question 32 regarding non-consolidated subsidiaries’ countries of incorporation. For CIS countries, reporting on countries of incorporation of both consolidated and non-consolidated subsidiaries is very poor. Middle Eastern and Asian companies have relatively good reporting on their subsidiaries, while African companies reveal more information about their partners than, for example, European companies.
Some companies disclose their subsidiaries and countries of incorporation but do not report their percentage of interests in such companies. As a result, some regions score higher on question 30 regarding countries of incorporation of consolidated subsidiaries than on question 29 regarding naming consolidated subsidiaries and disclosing company’s interests in each of them (i.e. Northern American companies, see Diagram 14).
Diagram 13 Organisational disclosure performance by region
Average for all companies is 65%*Pemex included in Latin America
80%
60%
40%
20%
0%Australia Europe Latin America* North America CIS Asia Middle East Africa
IOCs
NOCs
ST. DEV.
Diagram 14 Organisational disclosure results by region/question
*Pemex included in Latin America
97%
86%
75% 77%
69%
50%
70%
59%
44%
28%
QUESTION 29 CONSOLIDATED SUBSIDIARIES
Australia
Europe
Latin America*
Asia
Middle East
North America
CIS
AfricaAVERAGE = 83%
100%
100%
100%
93%
88%
78%
70%
40%
Australia
Europe
Asia
Middle East
CIS
Latin America*
North America
Africa
QUESTION 31 NON-CONSOLIDATED SUBSIDIARIES
AVERAGE = 69%
100%
94%
79%
75%
70%
67%
44%
40%
QUESTION 33 FIELDS OF OPERATION
AVERAGE = 77%
Australia
Latin America*
Europe
North America
CIS
Asia
Middle East
Africa
100%
100%
94%
94%
90%
50%
50%
40%
Australia
Latin America*
Europe
North America
Asia
CIS
Middle East
Africa AVERAGE = 61%
QUESTION 30 - COUNTRIES OF INCORPORATION (CONSOLIDATED SUBSIDIARIES)
100%
100%
89%
89%
43%
40%
25%
0%
Australia
Europe
Asia
Middle East
North America
CIS
Africa
Latin America*
AVERAGE = 38%
QUESTION 32 - COUNTRIES OF INCORPORATION (NON-CONSOLIDATED SUBSIDIARIES)
100%
83%
43%
25%
22%
20%
0%
0%
QUESTION 34 - PARTNERS IN FIELDS OF OPERATION
AVERAGE = 32%
Australia
CIS
Latin America*
Asia
North America
Africa
Europe
Middle East
75%
60%
50%
36%
28%
20%
17%
13%
28 Transparency International 29Promoting Revenue Transparency

COUNTRY-LEVEL DISCLOSURE
16%AVERAGE SCORE
69%HIGHEST PERFORMING:
STATOIL
0%WORST PERFORMING:
CNOOC, GEPETROL, INPEX, PETROCHINA, PETRONAS
© istockphoto.com/ Andrew Penner
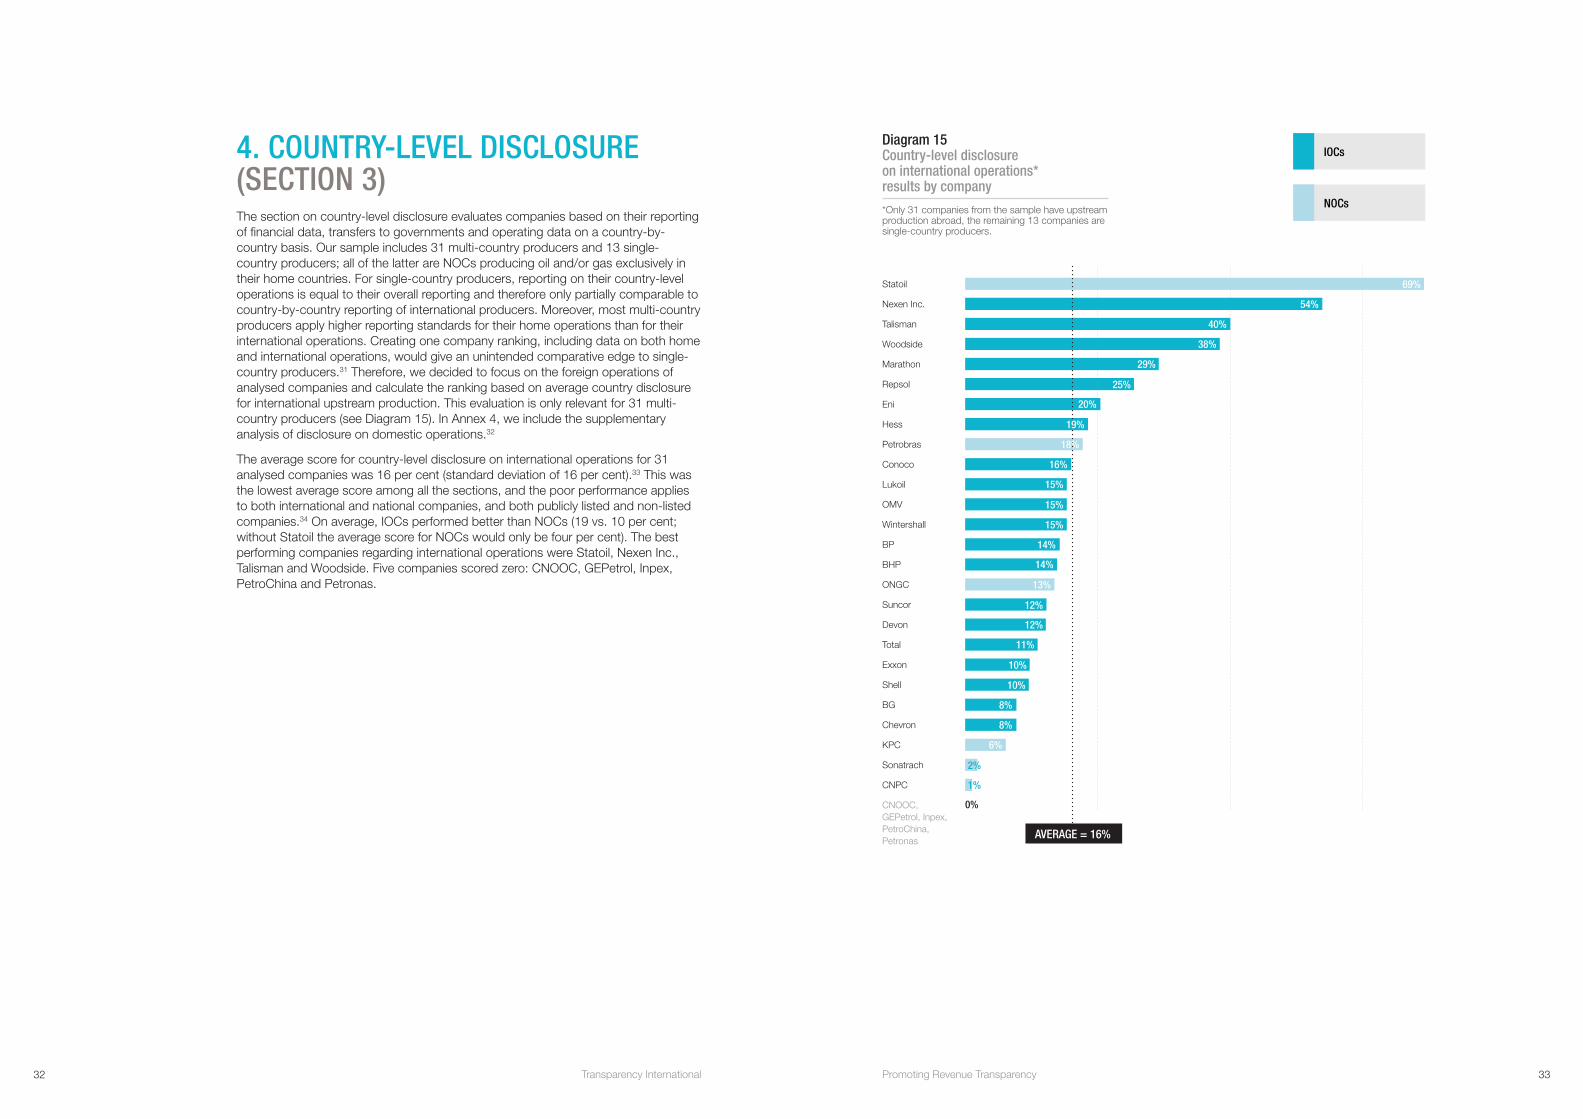
4. COUNTRY-LEVEL DISCLOSURE (SECTION 3)The section on country-level disclosure evaluates companies based on their reporting of financial data, transfers to governments and operating data on a country-by-country basis. Our sample includes 31 multi-country producers and 13 single-country producers; all of the latter are NOCs producing oil and/or gas exclusively in their home countries. For single-country producers, reporting on their country-level operations is equal to their overall reporting and therefore only partially comparable to country-by-country reporting of international producers. Moreover, most multi-country producers apply higher reporting standards for their home operations than for their international operations. Creating one company ranking, including data on both home and international operations, would give an unintended comparative edge to single-country producers.31 Therefore, we decided to focus on the foreign operations of analysed companies and calculate the ranking based on average country disclosure for international upstream production. This evaluation is only relevant for 31 multi-country producers (see Diagram 15). In Annex 4, we include the supplementary analysis of disclosure on domestic operations.32
The average score for country-level disclosure on international operations for 31 analysed companies was 16 per cent (standard deviation of 16 per cent).33 This was the lowest average score among all the sections, and the poor performance applies to both international and national companies, and both publicly listed and non-listed companies.34 On average, IOCs performed better than NOCs (19 vs. 10 per cent; without Statoil the average score for NOCs would only be four per cent). The best performing companies regarding international operations were Statoil, Nexen Inc., Talisman and Woodside. Five companies scored zero: CNOOC, GEPetrol, Inpex, PetroChina and Petronas.
Diagram 15 Country-level disclosure on international operations* results by company
*Only 31 companies from the sample have upstream production abroad, the remaining 13 companies are single-country producers.
IOCs
NOCs
Statoil
Nexen Inc.
Talisman
Woodside
Marathon
Repsol
Eni
Hess
Petrobras
Conoco
Lukoil
OMV
Wintershall
BP
BHP
ONGC
Suncor
Devon
Total
Exxon
Shell
BG
Chevron
KPC
Sonatrach
CNPC
CNOOC, GEPetrol, Inpex, PetroChina, Petronas
AVERAGE = 16%
69%
54%
40%
38%
29%
25%
20%
19%
18%
16%
15%
15%
15%
14%
14%
13%
12%
12%
11%
10%
10%
8%
8%
6%
2%
1%
0%
32 Transparency International 33Promoting Revenue Transparency
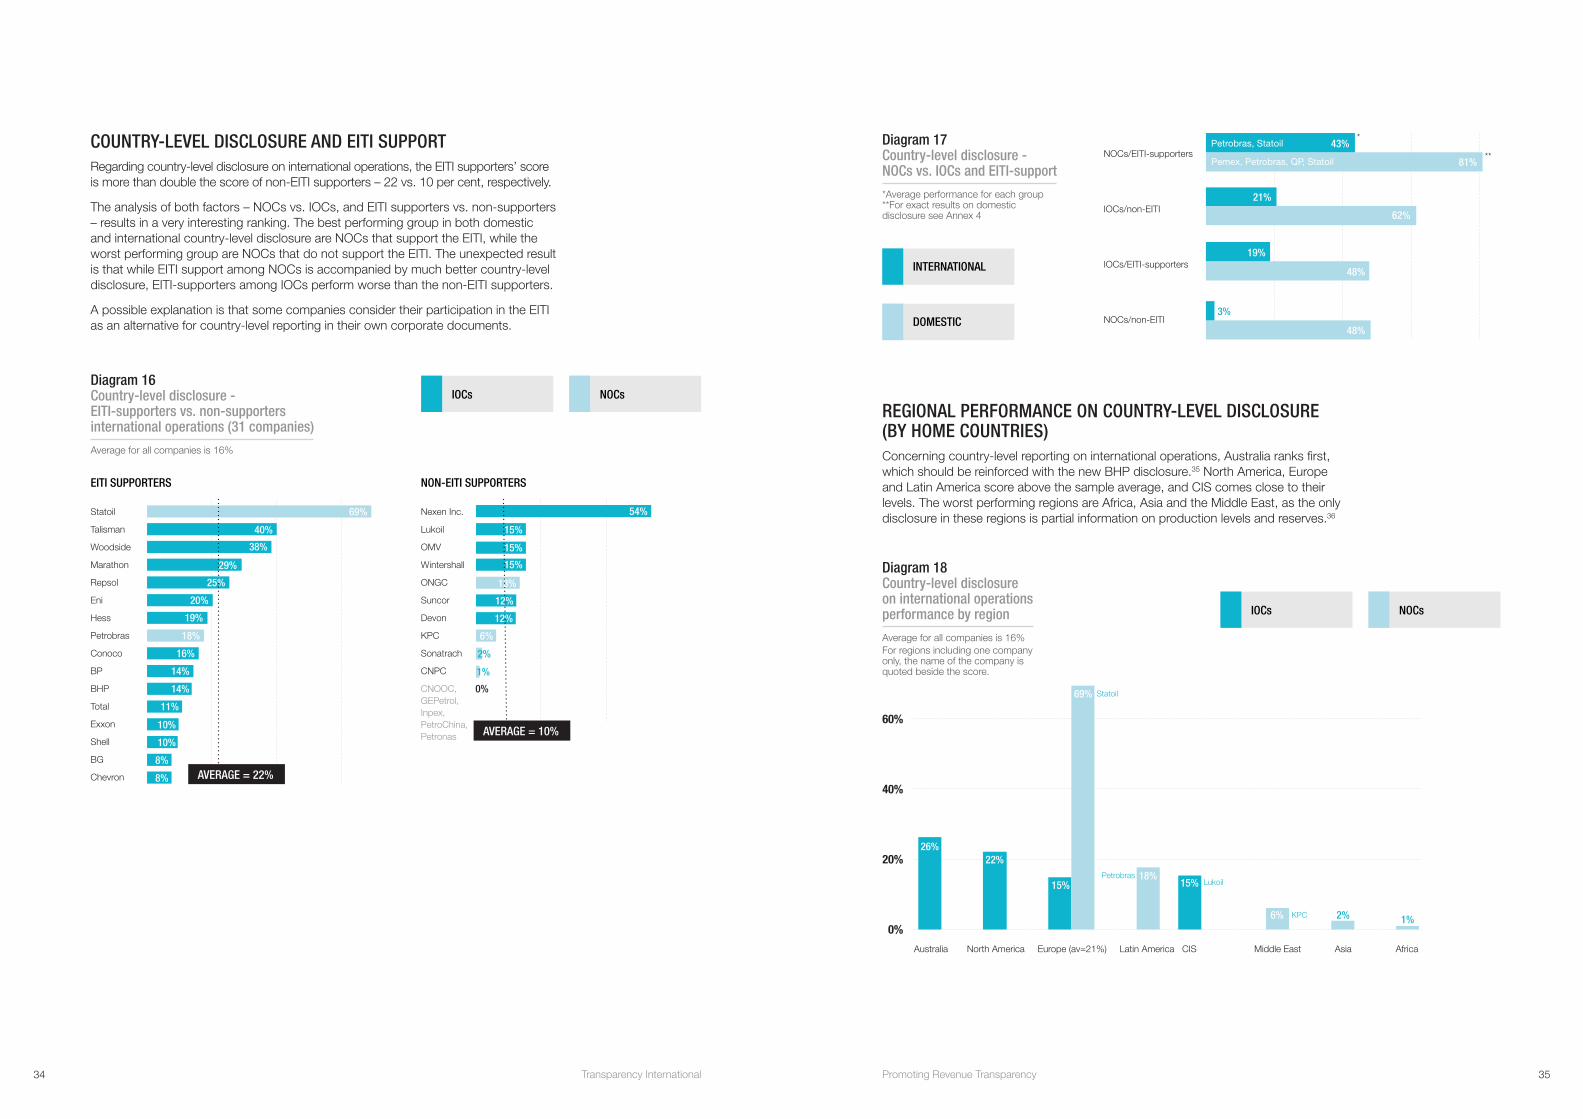
COUNTRY-LEVEL DISCLOSURE AND EITI SUPPORT Regarding country-level disclosure on international operations, the EITI supporters’ score is more than double the score of non-EITI supporters – 22 vs. 10 per cent, respectively.
The analysis of both factors – NOCs vs. IOCs, and EITI supporters vs. non-supporters – results in a very interesting ranking. The best performing group in both domestic and international country-level disclosure are NOCs that support the EITI, while the worst performing group are NOCs that do not support the EITI. The unexpected result is that while EITI support among NOCs is accompanied by much better country-level disclosure, EITI-supporters among IOCs perform worse than the non-EITI supporters.
A possible explanation is that some companies consider their participation in the EITI as an alternative for country-level reporting in their own corporate documents.
Diagram 16 Country-level disclosure - EITI-supporters vs. non-supporters international operations (31 companies)
Average for all companies is 16%
IOCs NOCs
EITI SUPPORTERS NON-EITI SUPPORTERS
Statoil
Talisman
Woodside
Marathon
Repsol
Eni
Hess
Petrobras
Conoco
BP
BHP
Total
Exxon
Shell
BG
Chevron
69%
40%
38%
29%
25%
20%
19%
18%
16%
14%
14%
11%
10%
10%
8%
8% AVERAGE = 22%
Nexen Inc.
Lukoil
OMV
Wintershall
ONGC
Suncor
Devon
KPC
Sonatrach
CNPC
CNOOC, GEPetrol, Inpex, PetroChina, Petronas AVERAGE = 10%
54%
15%
15%
15%
13%
12%
12%
6%
2%
1%
0%
Diagram 17 Country-level disclosure - NOCs vs. IOCs and EITI-support
*Average performance for each group **For exact results on domestic disclosure see Annex 4
INTERNATIONAL
DOMESTIC
NOCs/EITI-supporters
IOCs/non-EITI
IOCs/EITI-supporters
NOCs/non-EITI
Petrobras, Statoil
Pemex, Petrobras, QP, Statoil
43%
81%
21%
62%
19%
48%
48%
3%
*
**
REGIONAL PERFORMANCE ON COUNTRY-LEVEL DISCLOSURE (BY HOME COUNTRIES) Concerning country-level reporting on international operations, Australia ranks first, which should be reinforced with the new BHP disclosure.35 North America, Europe and Latin America score above the sample average, and CIS comes close to their levels. The worst performing regions are Africa, Asia and the Middle East, as the only disclosure in these regions is partial information on production levels and reserves.36
IOCs NOCs
Diagram 18 Country-level disclosure on international operations performance by region
Average for all companies is 16%For regions including one company only, the name of the company is quoted beside the score.
60%
40%
20%
0%
Australia North America Europe (av=21%) Latin America CIS Middle East Asia Africa
26%22%
15%
69%
18%15%
6% 2% 1%
Statoil
PetrobrasLukoil
KPC
34 Transparency International 35Promoting Revenue Transparency
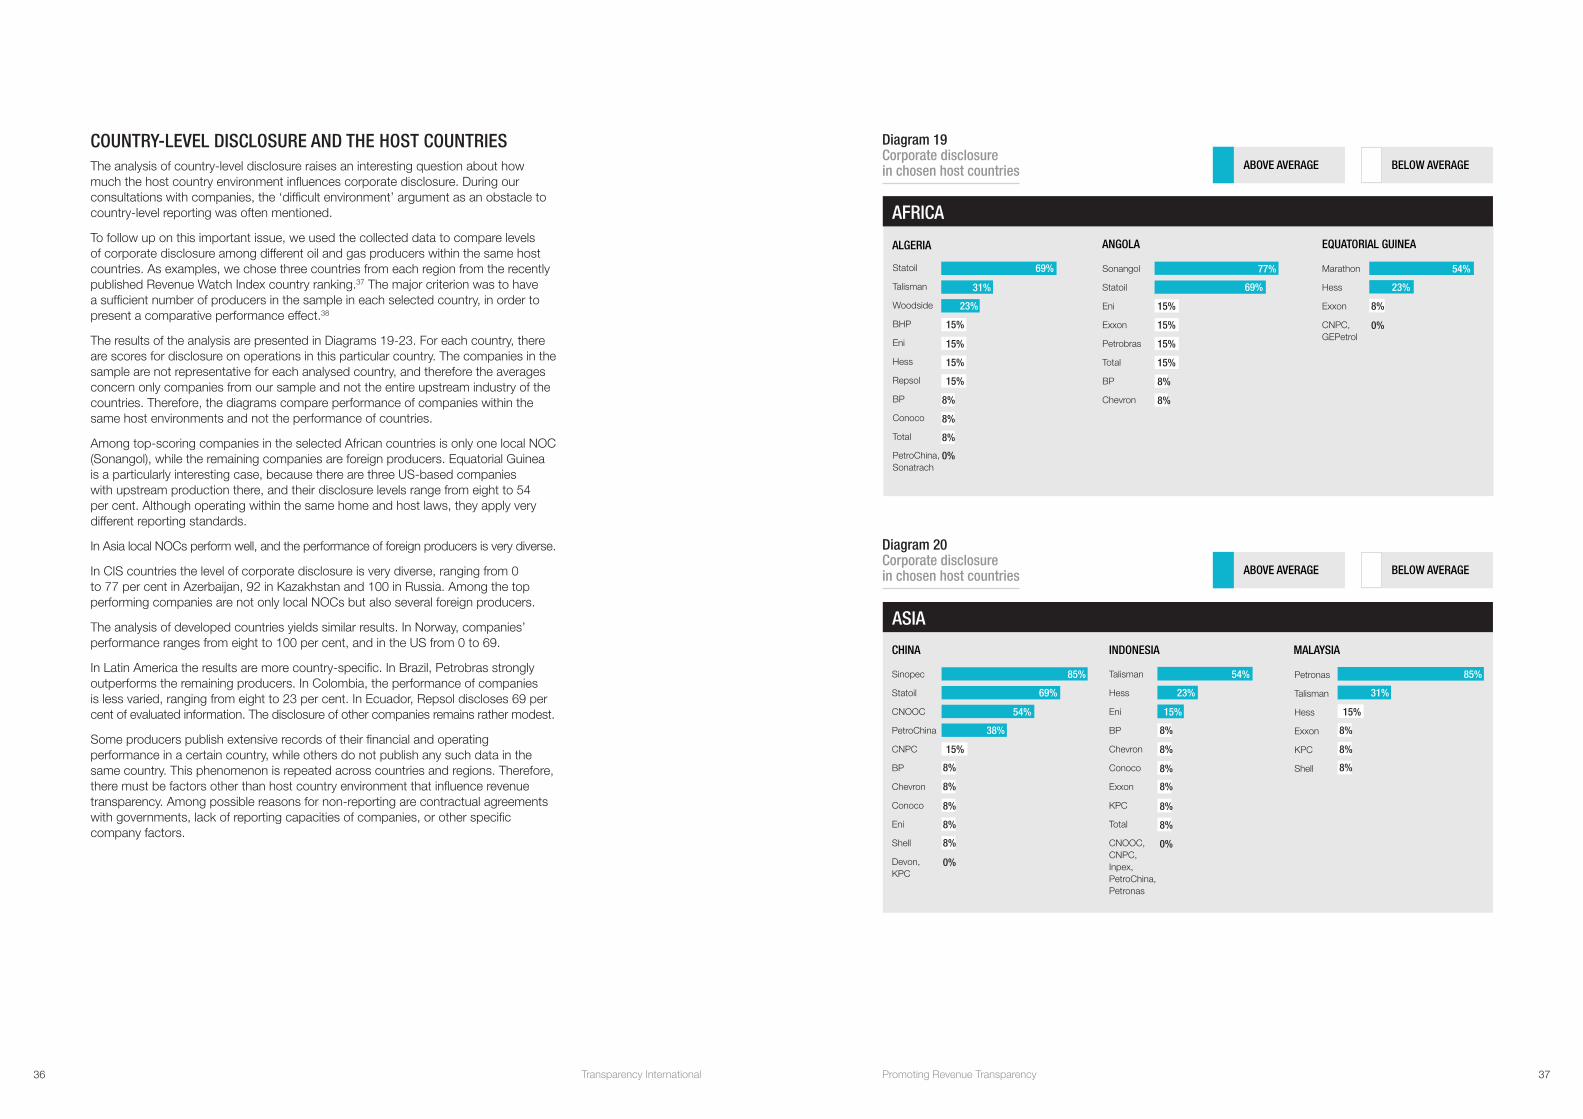
COUNTRY-LEVEL DISCLOSURE AND THE HOST COUNTRIES The analysis of country-level disclosure raises an interesting question about how much the host country environment influences corporate disclosure. During our consultations with companies, the ‘difficult environment’ argument as an obstacle to country-level reporting was often mentioned.
To follow up on this important issue, we used the collected data to compare levels of corporate disclosure among different oil and gas producers within the same host countries. As examples, we chose three countries from each region from the recently published Revenue Watch Index country ranking.37 The major criterion was to have a sufficient number of producers in the sample in each selected country, in order to present a comparative performance effect.38
The results of the analysis are presented in Diagrams 19-23. For each country, there are scores for disclosure on operations in this particular country. The companies in the sample are not representative for each analysed country, and therefore the averages concern only companies from our sample and not the entire upstream industry of the countries. Therefore, the diagrams compare performance of companies within the same host environments and not the performance of countries.
Among top-scoring companies in the selected African countries is only one local NOC (Sonangol), while the remaining companies are foreign producers. Equatorial Guinea is a particularly interesting case, because there are three US-based companies with upstream production there, and their disclosure levels range from eight to 54 per cent. Although operating within the same home and host laws, they apply very different reporting standards.
In Asia local NOCs perform well, and the performance of foreign producers is very diverse.
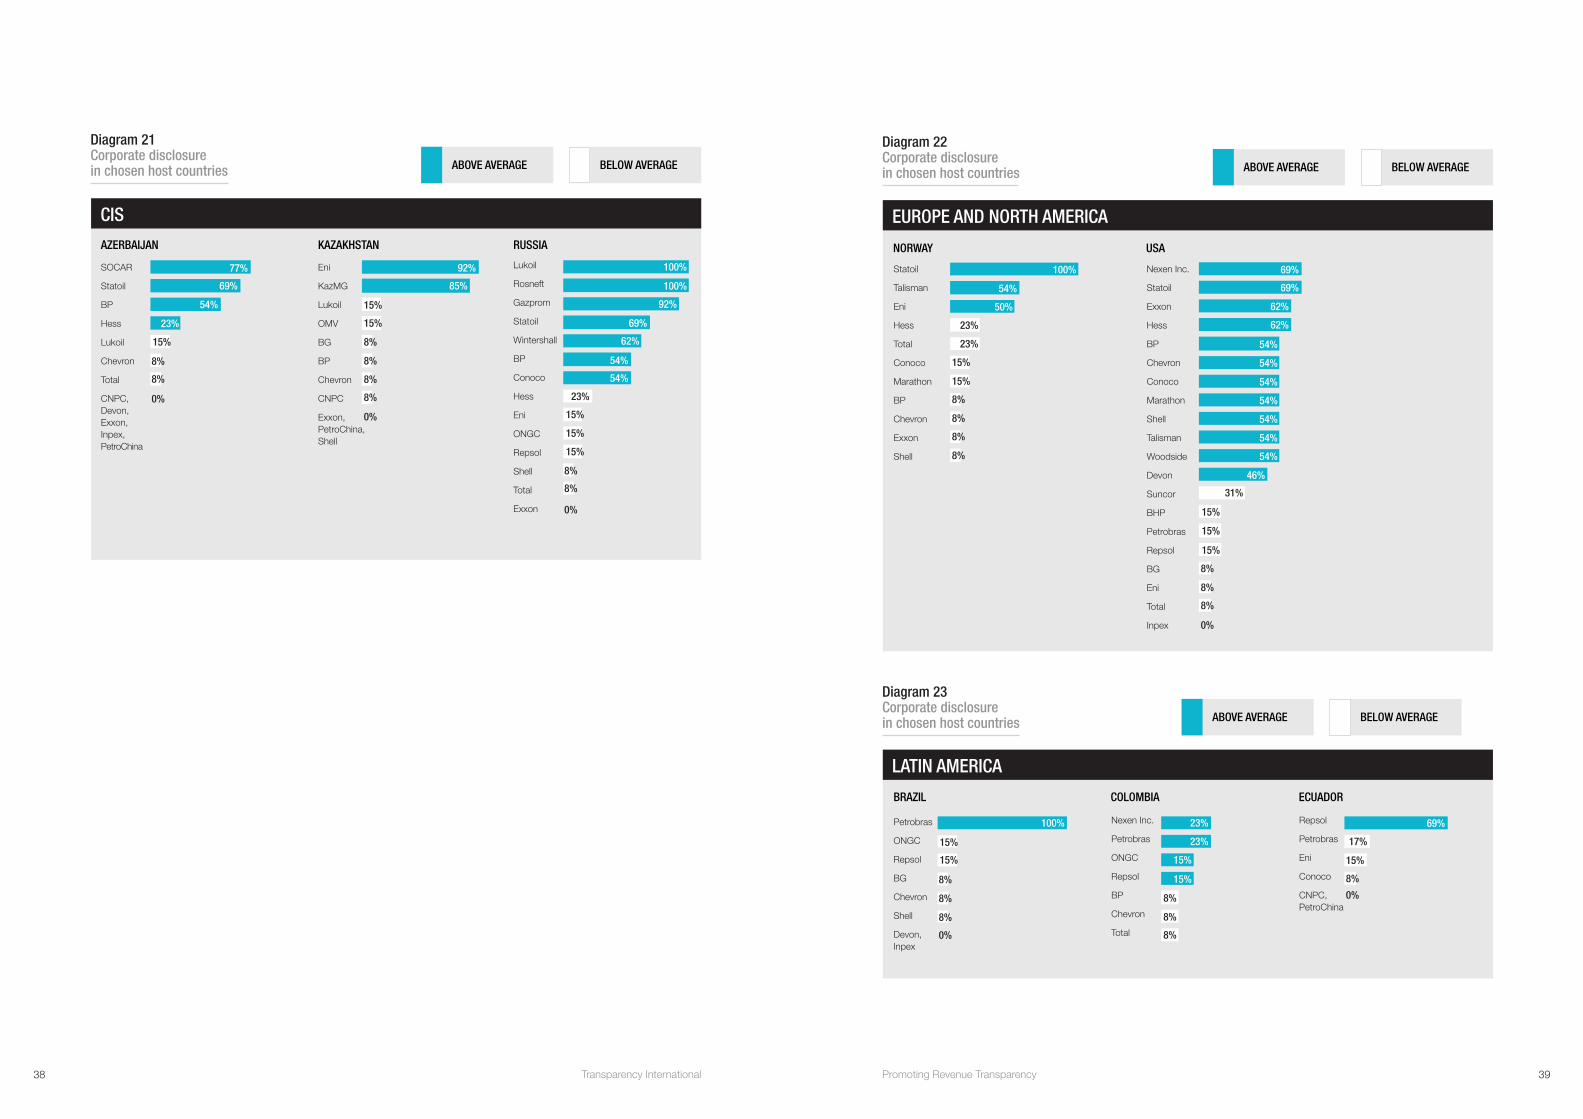
In CIS countries the level of corporate disclosure is very diverse, ranging from 0 to 77 per cent in Azerbaijan, 92 in Kazakhstan and 100 in Russia. Among the top performing companies are not only local NOCs but also several foreign producers.
The analysis of developed countries yields similar results. In Norway, companies’ performance ranges from eight to 100 per cent, and in the US from 0 to 69.
In Latin America the results are more country-specific. In Brazil, Petrobras strongly outperforms the remaining producers. In Colombia, the performance of companies is less varied, ranging from eight to 23 per cent. In Ecuador, Repsol discloses 69 per cent of evaluated information. The disclosure of other companies remains rather modest.
Some producers publish extensive records of their financial and operating performance in a certain country, while others do not publish any such data in the same country. This phenomenon is repeated across countries and regions. Therefore, there must be factors other than host country environment that influence revenue transparency. Among possible reasons for non-reporting are contractual agreements with governments, lack of reporting capacities of companies, or other specific company factors.
Diagram 19 Corporate disclosure in chosen host countries ABOVE AVERAGE BELOW AVERAGE
ALGERIA
Statoil
Talisman
Woodside
BHP
Eni
Hess
Repsol
BP
Conoco
Total
PetroChina, Sonatrach
ANGOLA
Sonangol
Statoil
Eni
Exxon
Petrobras
Total
BP
Chevron
ASIA
Marathon
Hess
Exxon
CNPC, GEPetrol
EQUATORIAL GUINEA
Diagram 20 Corporate disclosure in chosen host countries
CHINA
ABOVE AVERAGE BELOW AVERAGE
INDONESIA MALAYSIA
Sinopec
Statoil
CNOOC
PetroChina
CNPC
BP
Chevron
Conoco
Eni
Shell
Devon, KPC
Talisman
Hess
Eni
BP
Chevron
Conoco
Exxon
KPC
Total
CNOOC, CNPC, Inpex, PetroChina, Petronas
Petronas
Talisman
Hess
Exxon
KPC
Shell
AFRICA
69%
31%
23%
15%
15%
15%
15%
8%
8%
8%
0%
77%
69%
15%
15%
15%
15%
8%
8%
54%
23%
8%
0%
85%
69%
54%
38%
15%
8%
8%
8%
8%
8%
0%
54%
23%
15%
8%
8%
8%
8%
8%
8%
0%
85%
31%
15%
8%
8%
8%
36 Transparency International 37Promoting Revenue Transparency
LATIN AMERICA
EUROPE AND NORTH AMERICACIS
Diagram 23 Corporate disclosure in chosen host countries
BRAZIL
ABOVE AVERAGE BELOW AVERAGE
COLOMBIA ECUADOR
Petrobras
ONGC
Repsol
BG
Chevron
Shell
Devon, Inpex
Nexen Inc.
Petrobras
ONGC
Repsol
BP
Chevron
Total
Repsol
Petrobras
Eni
Conoco
CNPC, PetroChina
Diagram 22 Corporate disclosure in chosen host countries
NORWAY
ABOVE AVERAGE BELOW AVERAGE
USA
Statoil
Talisman
Eni
Hess
Total
Conoco
Marathon
BP
Chevron
Exxon
Shell
Nexen Inc.
Statoil
Exxon
Hess
BP
Chevron
Conoco
Marathon
Shell
Talisman
Woodside
Devon
Suncor
BHP
Petrobras
Repsol
BG
Eni
Total
Inpex
Diagram 21 Corporate disclosure in chosen host countries
AZERBAIJAN
ABOVE AVERAGE BELOW AVERAGE
SOCAR
Statoil
BP
Hess
Lukoil
Chevron
Total
CNPC, Devon, Exxon, Inpex, PetroChina
KAZAKHSTAN
Eni
KazMG
Lukoil
OMV
BG
BP
Chevron
CNPC
Exxon, PetroChina, Shell
Lukoil
Rosneft
Gazprom
Statoil
Wintershall
BP
Conoco
Hess
Eni
ONGC
Repsol
Shell
Total
Exxon
RUSSIA
77%
69%
54%
23%
15%
8%
8%
0%
92%
85%
15%
15%
8%
8%
8%
8%
0%
100%
100%
92%
69%
62%
54%
54%
23%
15%
15%
15%
8%
8%
0%
100%
54%
50%
23%
23%
15%
15%
8%
8%
8%
8%
69%
69%
62%
62%
54%
54%
54%
54%
54%
54%
54%
46%
31%
15%
15%
15%
8%
8%
8%
0%
100%
15%
15%
8%
8%
8%
0%
23%
23%
15%
15%
8%
8%
8%
69%
17%
15%
8%
0%
38 Transparency International 39Promoting Revenue Transparency
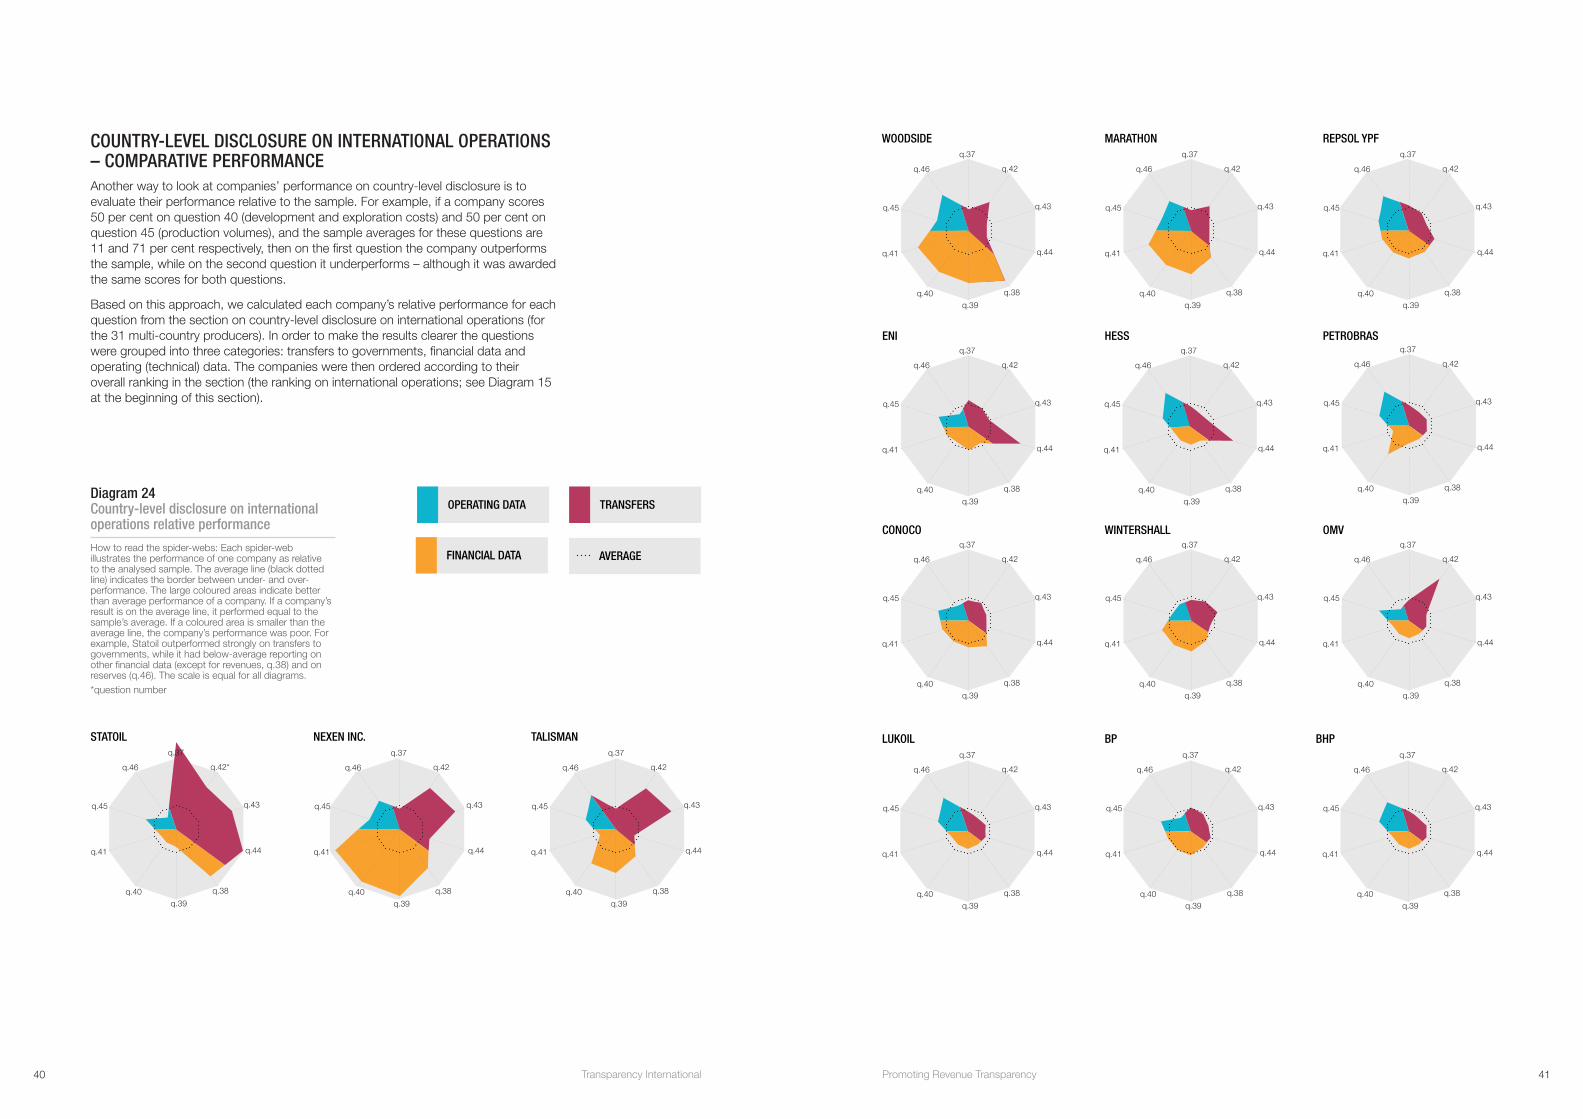
COUNTRY-LEVEL DISCLOSURE ON INTERNATIONAL OPERATIONS – COMPARATIVE PERFORMANCE Another way to look at companies’ performance on country-level disclosure is to evaluate their performance relative to the sample. For example, if a company scores 50 per cent on question 40 (development and exploration costs) and 50 per cent on question 45 (production volumes), and the sample averages for these questions are 11 and 71 per cent respectively, then on the first question the company outperforms the sample, while on the second question it underperforms – although it was awarded the same scores for both questions.
Based on this approach, we calculated each company’s relative performance for each question from the section on country-level disclosure on international operations (for the 31 multi-country producers). In order to make the results clearer the questions were grouped into three categories: transfers to governments, financial data and operating (technical) data. The companies were then ordered according to their overall ranking in the section (the ranking on international operations; see Diagram 15 at the beginning of this section).
q.45
q.46
q.37
q.42
q.43
q.44
q.38
q.39q.40
q.41
q.45
q.46
q.37
q.42
q.43
q.44
q.38
q.39q.40
q.41
q.45
q.46
q.37
q.42*
q.43
q.44
q.38
q.39q.40
q.41
STATOIL
OPERATING DATA TRANSFERS
FINANCIAL DATA AVERAGE
Diagram 24 Country-level disclosure on international operations relative performance
How to read the spider-webs: Each spider-web illustrates the performance of one company as relative to the analysed sample. The average line (black dotted line) indicates the border between under- and over-performance. The large coloured areas indicate better than average performance of a company. If a company’s result is on the average line, it performed equal to the sample’s average. If a coloured area is smaller than the average line, the company’s performance was poor. For example, Statoil outperformed strongly on transfers to governments, while it had below-average reporting on other financial data (except for revenues, q.38) and on reserves (q.46). The scale is equal for all diagrams.*question number
NEXEN INC.
q.45
q.46
q.37
q.42
q.43
q.44
q.38
q.39q.40
q.41
TALISMAN
q.45
q.46
q.37
q.42
q.43
q.44
q.38
q.39q.40
q.41
WOODSIDE
q.45
q.46
q.37
q.42
q.43
q.44
q.38
q.39q.40
q.41
MARATHON
q.45
q.46
q.37
q.42
q.43
q.44
q.38
q.39q.40
q.41
REPSOL YPF
q.45
q.46
q.37
q.42
q.43
q.44
q.38
q.39q.40
q.41
HESSENI
q.45
q.46
q.37
q.42
q.43
q.44
q.38
q.39q.40
q.41
q.45
q.46
q.37
q.42
q.43
q.44
q.38
q.39q.40
q.41
PETROBRAS
WINTERSHALL
q.45
q.46
q.37
q.42
q.43
q.44
q.38
q.39q.40
q.41
CONOCO
q.45
q.46
q.37
q.42
q.43
q.44
q.38
q.39q.40
q.41
OMV
BP
q.45
q.46
q.37
q.42
q.43
q.44
q.38
q.39q.40
q.41
LUKOIL
q.45
q.46
q.37
q.42
q.43
q.44
q.38
q.39q.40
q.41
q.45
q.46
q.37
q.42
q.43
q.44
q.38
q.39q.40
q.41
BHP
40 Transparency International 41Promoting Revenue Transparency
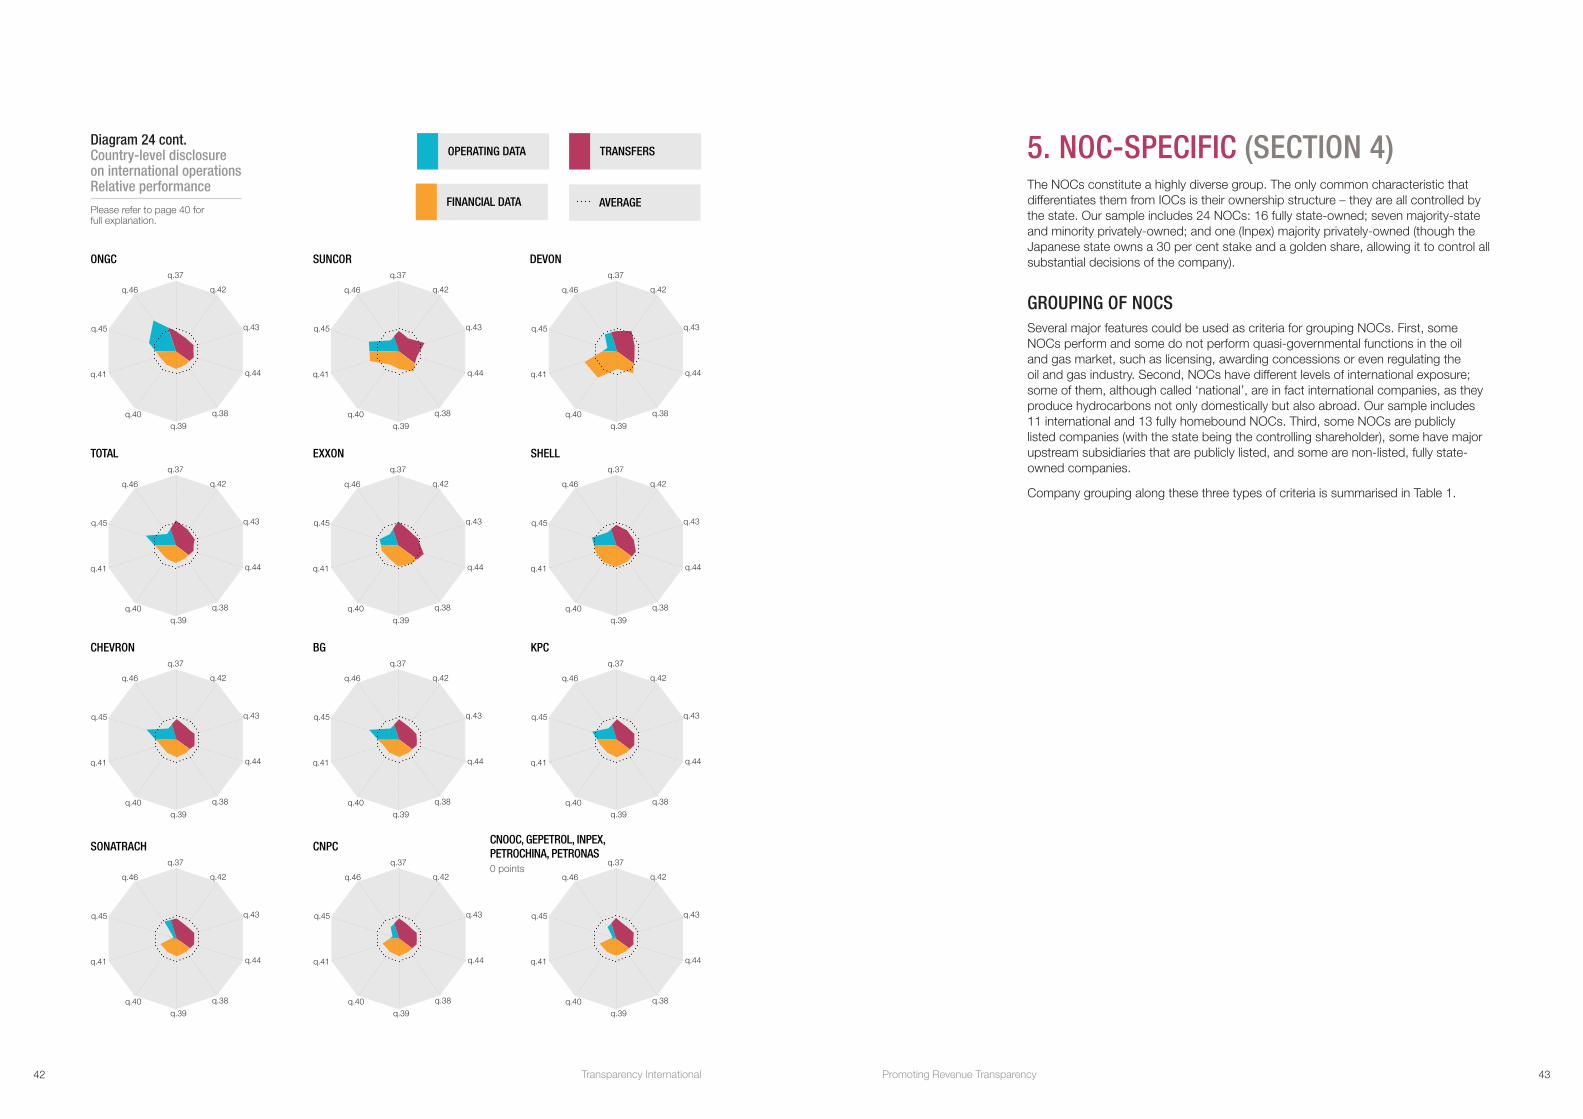
OPERATING DATA TRANSFERS
FINANCIAL DATA AVERAGE
Diagram 24 cont. Country-level disclosure on international operations Relative performance
Please refer to page 40 for full explanation.
SUNCOR
q.45
q.46
q.37
q.42
q.43
q.44
q.38
q.39q.40
q.41
ONGC
q.45
q.46
q.37
q.42
q.43
q.44
q.38
q.39q.40
q.41
q.45
q.46
q.37
q.42
q.43
q.44
q.38
q.39q.40
q.41
DEVON
EXXON
q.45
q.46
q.37
q.42
q.43
q.44
q.38
q.39q.40
q.41
TOTAL
q.45
q.46
q.37
q.42
q.43
q.44
q.38
q.39q.40
q.41
SHELL
q.45
q.46
q.37
q.42
q.43
q.44
q.38
q.39q.40
q.41
BG
q.45
q.46
q.37
q.42
q.43
q.44
q.38
q.39q.40
q.41
CHEVRON
q.45
q.46
q.37
q.42
q.43
q.44
q.38
q.39q.40
q.41
q.45
q.46
q.37
q.42
q.43
q.44
q.38
q.39q.40
q.41
KPC
CNPC
q.45
q.46
q.37
q.42
q.43
q.44
q.38
q.39q.40
q.41
SONATRACH
q.45
q.46
q.37
q.42
q.43
q.44
q.38
q.39q.40
q.41
CNOOC, GEPETROL, INPEX, PETROCHINA, PETRONAS0 points
q.45
q.46
q.37
q.42
q.43
q.44
q.38
q.39q.40
q.41
5. NOC-SPECIFIC (SECTION 4)The NOCs constitute a highly diverse group. The only common characteristic that differentiates them from IOCs is their ownership structure – they are all controlled by the state. Our sample includes 24 NOCs: 16 fully state-owned; seven majority-state and minority privately-owned; and one (Inpex) majority privately-owned (though the Japanese state owns a 30 per cent stake and a golden share, allowing it to control all substantial decisions of the company).
GROUPING OF NOCS Several major features could be used as criteria for grouping NOCs. First, some NOCs perform and some do not perform quasi-governmental functions in the oil and gas market, such as licensing, awarding concessions or even regulating the oil and gas industry. Second, NOCs have different levels of international exposure; some of them, although called ‘national’, are in fact international companies, as they produce hydrocarbons not only domestically but also abroad. Our sample includes 11 international and 13 fully homebound NOCs. Third, some NOCs are publicly listed companies (with the state being the controlling shareholder), some have major upstream subsidiaries that are publicly listed, and some are non-listed, fully state-owned companies.
Company grouping along these three types of criteria is summarised in Table 1.
42 Transparency International 43Promoting Revenue Transparency
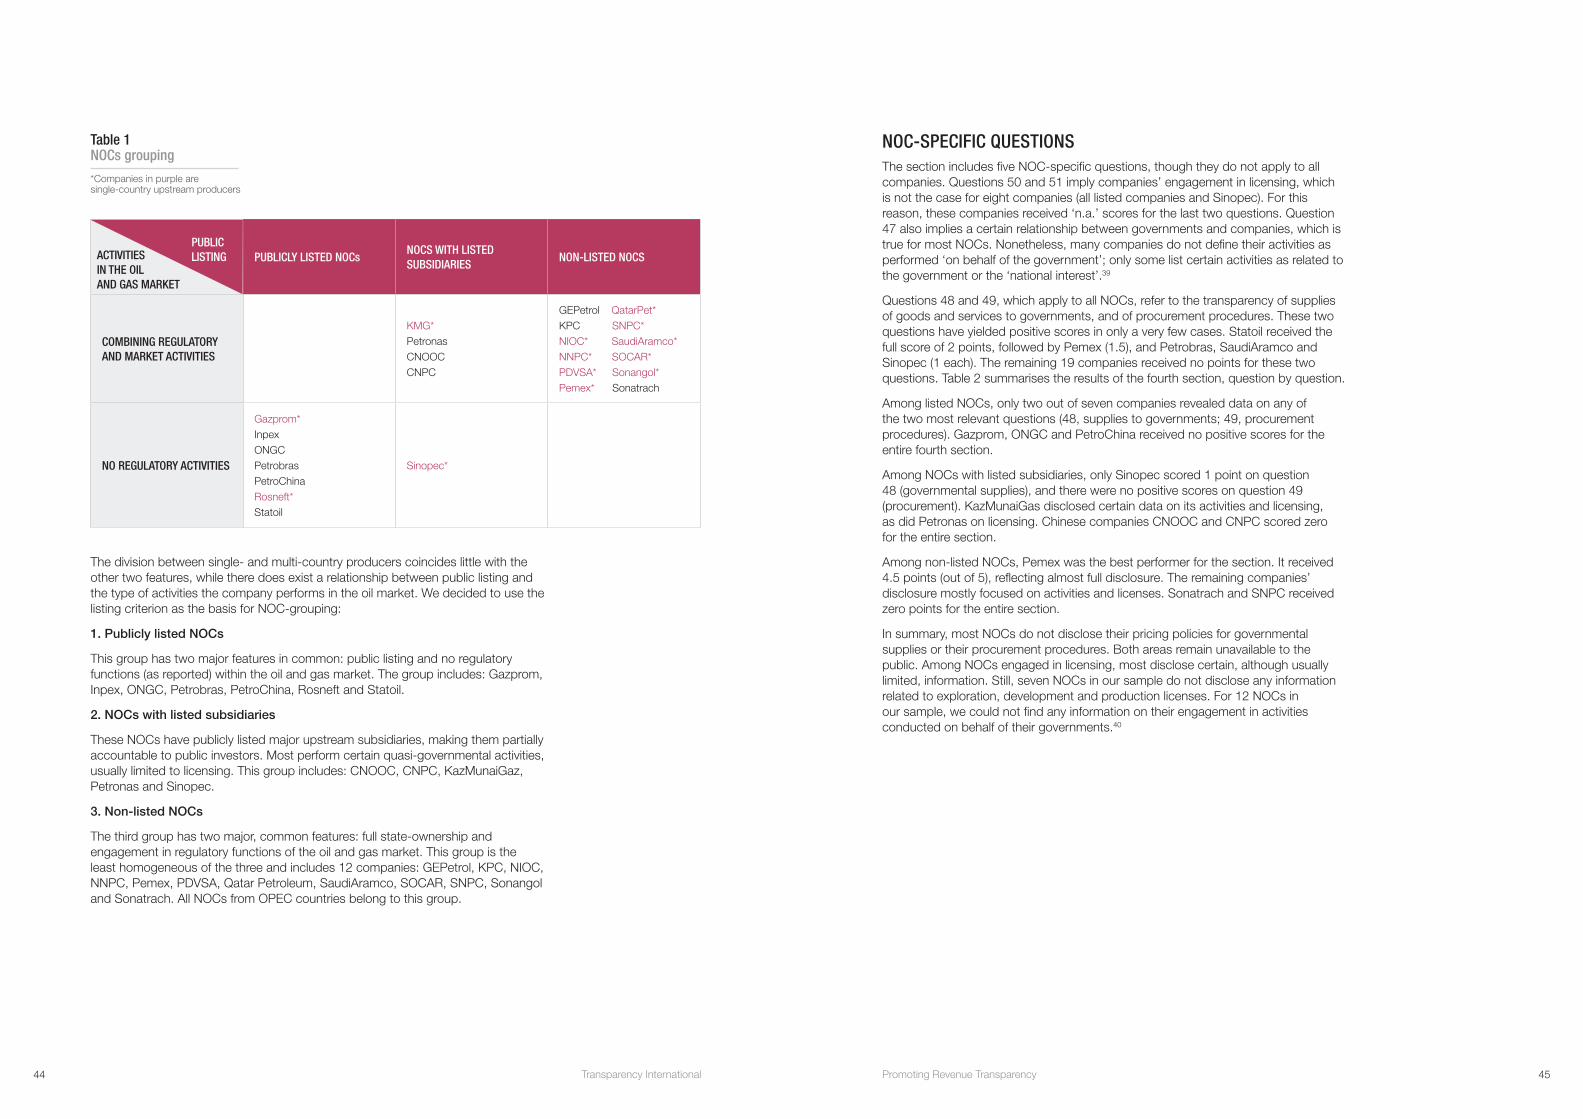
The division between single- and multi-country producers coincides little with the other two features, while there does exist a relationship between public listing and the type of activities the company performs in the oil market. We decided to use the listing criterion as the basis for NOC-grouping:
1. Publicly listed NOCs
This group has two major features in common: public listing and no regulatory functions (as reported) within the oil and gas market. The group includes: Gazprom, Inpex, ONGC, Petrobras, PetroChina, Rosneft and Statoil.
2. NOCs with listed subsidiaries
These NOCs have publicly listed major upstream subsidiaries, making them partially accountable to public investors. Most perform certain quasi-governmental activities, usually limited to licensing. This group includes: CNOOC, CNPC, KazMunaiGaz, Petronas and Sinopec.
3. Non-listed NOCs
The third group has two major, common features: full state-ownership and engagement in regulatory functions of the oil and gas market. This group is the least homogeneous of the three and includes 12 companies: GEPetrol, KPC, NIOC, NNPC, Pemex, PDVSA, Qatar Petroleum, SaudiAramco, SOCAR, SNPC, Sonangol and Sonatrach. All NOCs from OPEC countries belong to this group.
Table 1 NOCs grouping
*Companies in purple are single-country upstream producers
PUBLICLY LISTED NOCsNOCS WITH LISTED SUBSIDIARIES
NON-LISTED NOCS
COMBINING REGULATORY AND MARKET ACTIVITIES
KMG* Petronas CNOOC CNPC
GEPetrol QatarPet* KPC SNPC* NIOC* SaudiAramco* NNPC* SOCAR* PDVSA* Sonangol* Pemex* Sonatrach
NO REGULATORY ACTIVITIES
Gazprom* Inpex ONGC Petrobras PetroChina Rosneft* Statoil
Sinopec*
NOC-SPECIFIC QUESTIONS The section includes five NOC-specific questions, though they do not apply to all companies. Questions 50 and 51 imply companies’ engagement in licensing, which is not the case for eight companies (all listed companies and Sinopec). For this reason, these companies received ‘n.a.’ scores for the last two questions. Question 47 also implies a certain relationship between governments and companies, which is true for most NOCs. Nonetheless, many companies do not define their activities as performed ‘on behalf of the government’; only some list certain activities as related to the government or the ‘national interest’.39
Questions 48 and 49, which apply to all NOCs, refer to the transparency of supplies of goods and services to governments, and of procurement procedures. These two questions have yielded positive scores in only a very few cases. Statoil received the full score of 2 points, followed by Pemex (1.5), and Petrobras, SaudiAramco and Sinopec (1 each). The remaining 19 companies received no points for these two questions. Table 2 summarises the results of the fourth section, question by question.
Among listed NOCs, only two out of seven companies revealed data on any of the two most relevant questions (48, supplies to governments; 49, procurement procedures). Gazprom, ONGC and PetroChina received no positive scores for the entire fourth section.
Among NOCs with listed subsidiaries, only Sinopec scored 1 point on question 48 (governmental supplies), and there were no positive scores on question 49 (procurement). KazMunaiGas disclosed certain data on its activities and licensing, as did Petronas on licensing. Chinese companies CNOOC and CNPC scored zero for the entire section.
Among non-listed NOCs, Pemex was the best performer for the section. It received 4.5 points (out of 5), reflecting almost full disclosure. The remaining companies’ disclosure mostly focused on activities and licenses. Sonatrach and SNPC received zero points for the entire section.
In summary, most NOCs do not disclose their pricing policies for governmental supplies or their procurement procedures. Both areas remain unavailable to the public. Among NOCs engaged in licensing, most disclose certain, although usually limited, information. Still, seven NOCs in our sample do not disclose any information related to exploration, development and production licenses. For 12 NOCs in our sample, we could not find any information on their engagement in activities conducted on behalf of their governments.40
ACTIVITIES IN THE OIL AND GAS MARKET
PUBLIC LISTING
44 Transparency International 45Promoting Revenue Transparency

Table 2 NOC-specific questions
*Listed NOCs**NOCs with listed subsidiaries***non-listed NOCs
NOCs ACTIVITIES SUPPLIES TO GOVERNMENTS
PROCUREMENT LICENSING CRITERIA
LICENSES
Statoil*
Pemex***
Sinopec**
Sonangol***
Petrobras*
Rosneft*
Inpex*
SOCAR***
PDVSA***
NNPC***
PetroChina*
ONGC*
Gazprom*
Petronas**
KazMG**
SaudiAramco***
QatarPet***
NIOC***
KPC***
GEPetrol***
Sonatrach***
SNPC***
CNPC**
CNOOC**
1 POINT N.A 0 POINTSGROUPS OF NOCS – RESULTS BY QUESTIONNAIRE SECTIONThe performance of NOC groups was already partially analysed in the previous sections (see Diagrams 7 and 12). Diagram 25 summarises the comparative performance of each group for Sections 1 to 3 (including reporting on domestic operations).
• Listed NOCs achieved the highest average scores in all sections: 37 per cent on reporting on anti-corruption programmes, 79 on organisational disclosure, 20 on international and 77 on domestic country-level disclosure.
• On average, NOCs with listed subsidiaries scored: 24 per cent on reporting on anti-corruption programmes, 48 on organisational disclosure, 0 on international and 65 on domestic country-level disclosure.
• On average, non-listed NOCs scored: 11 per cent on reporting on anti-corruption programmes, 44 on organisational disclosure, 3 on international and 35 on domestic country-level disclosure.
In summary, listed NOCs outperformed other groups in all sections, which is most likely related to higher reporting standards required for publicly listed companies.
Diagram 25 NOC groups - comparative performance in different sections
Performance is measured as relative to the NOC average (NOC average=1)
LISTED NOCs
NOCs WITH LISTED SUBSIDIARIES
NON-LISTED NOCs
AVERAGE FOR ALL NOCs
organisational disclosure
reporting on anti-corruption programmes
country-level disclosure domestic
country-level disclosure international
0.0
1.0
2.0
46 Transparency International 47Promoting Revenue Transparency
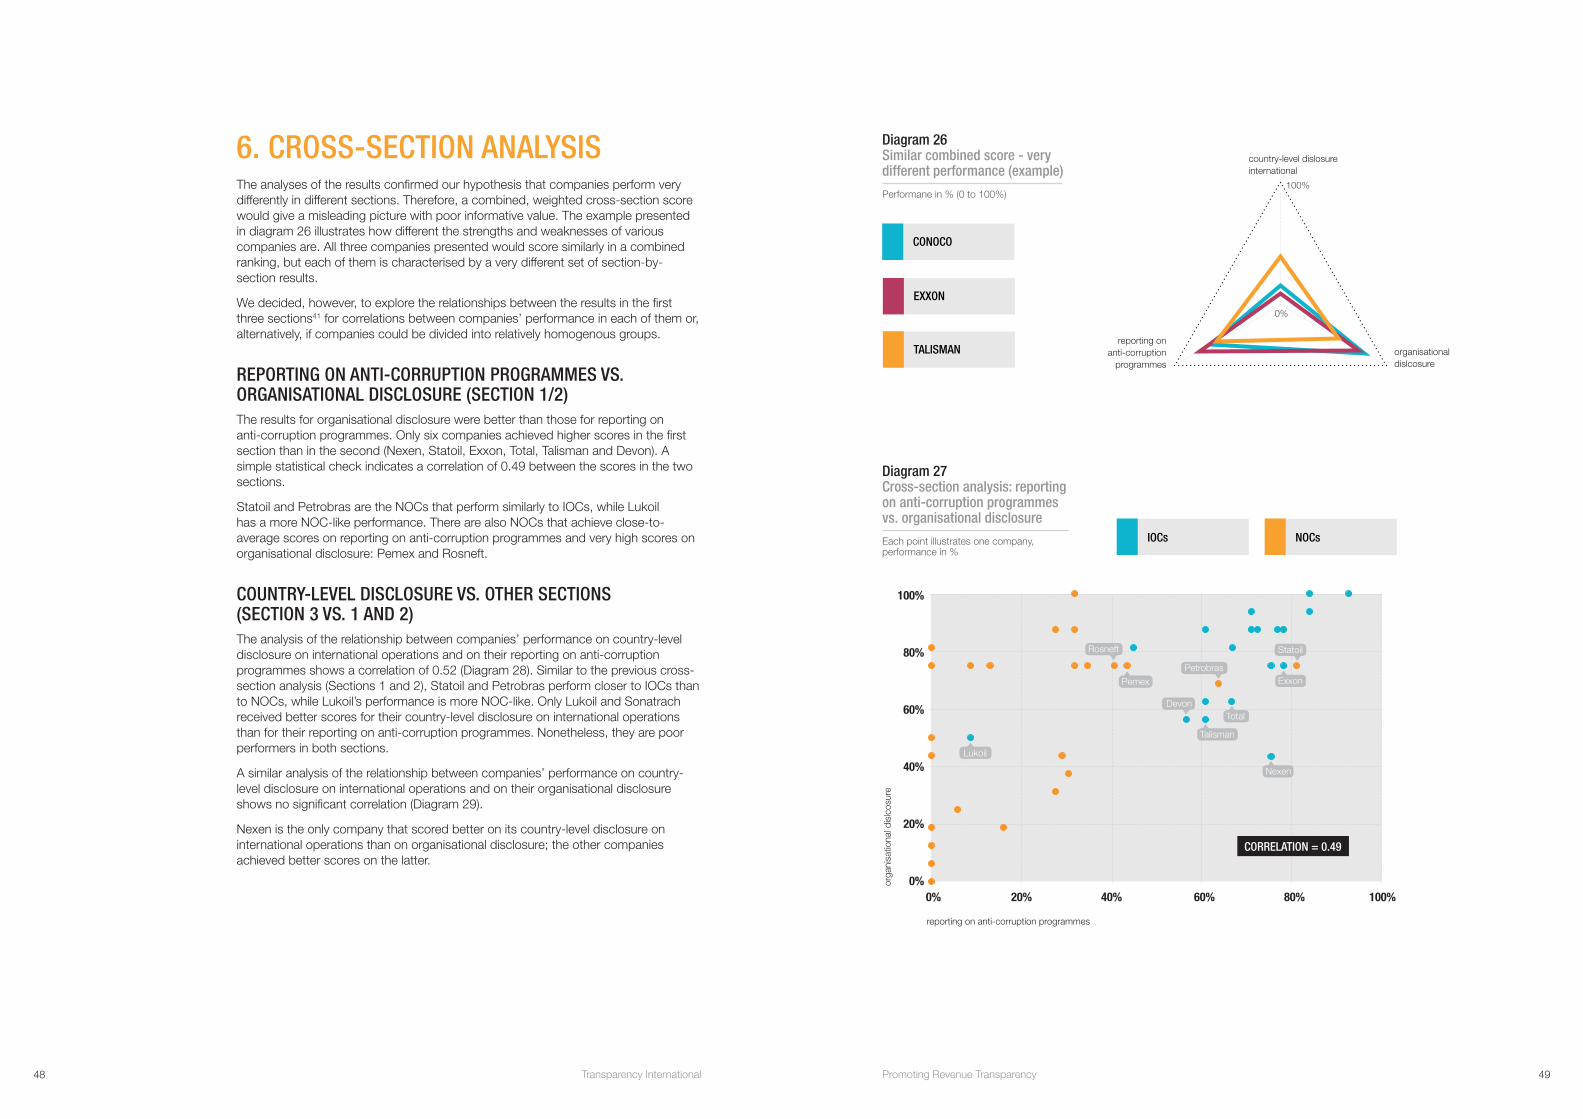
6. CROSS-SECTION ANALYSISThe analyses of the results confirmed our hypothesis that companies perform very differently in different sections. Therefore, a combined, weighted cross-section score would give a misleading picture with poor informative value. The example presented in diagram 26 illustrates how different the strengths and weaknesses of various companies are. All three companies presented would score similarly in a combined ranking, but each of them is characterised by a very different set of section-by-section results.
We decided, however, to explore the relationships between the results in the first three sections41 for correlations between companies’ performance in each of them or, alternatively, if companies could be divided into relatively homogenous groups.
REPORTING ON ANTI-CORRUPTION PROGRAMMES VS. ORGANISATIONAL DISCLOSURE (SECTION 1/2)The results for organisational disclosure were better than those for reporting on anti-corruption programmes. Only six companies achieved higher scores in the first section than in the second (Nexen, Statoil, Exxon, Total, Talisman and Devon). A simple statistical check indicates a correlation of 0.49 between the scores in the two sections.
Statoil and Petrobras are the NOCs that perform similarly to IOCs, while Lukoil has a more NOC-like performance. There are also NOCs that achieve close-to-average scores on reporting on anti-corruption programmes and very high scores on organisational disclosure: Pemex and Rosneft.
COUNTRY-LEVEL DISCLOSURE VS. OTHER SECTIONS (SECTION 3 VS. 1 AND 2)The analysis of the relationship between companies’ performance on country-level disclosure on international operations and on their reporting on anti-corruption programmes shows a correlation of 0.52 (Diagram 28). Similar to the previous cross-section analysis (Sections 1 and 2), Statoil and Petrobras perform closer to IOCs than to NOCs, while Lukoil’s performance is more NOC-like. Only Lukoil and Sonatrach received better scores for their country-level disclosure on international operations than for their reporting on anti-corruption programmes. Nonetheless, they are poor performers in both sections.
A similar analysis of the relationship between companies’ performance on country-level disclosure on international operations and on their organisational disclosure shows no significant correlation (Diagram 29).
Nexen is the only company that scored better on its country-level disclosure on international operations than on organisational disclosure; the other companies achieved better scores on the latter.
Diagram 26 Similar combined score - very different performance (example)
Performane in % (0 to 100%)
CONOCO
EXXON
TALISMAN
country-level dislosure international
organisational dislcosure
reporting on anti-corruption
programmes
0%
100%
Diagram 27 Cross-section analysis: reporting on anti-corruption programmes vs. organisational disclosure
Each point illustrates one company, performance in %
100%
80%
60%
40%
20%
0%0% 20% 40% 60% 80% 100%
IOCs NOCs
orga
nisa
tiona
l dis
lcos
ure
reporting on anti-corruption programmes
CORRELATION = 0.49
Rosneft
Lukoil
Pemex
Devon
Talisman
Nexen
Total
Petrobras
Statoil
Exxon
48 Transparency International 49Promoting Revenue Transparency
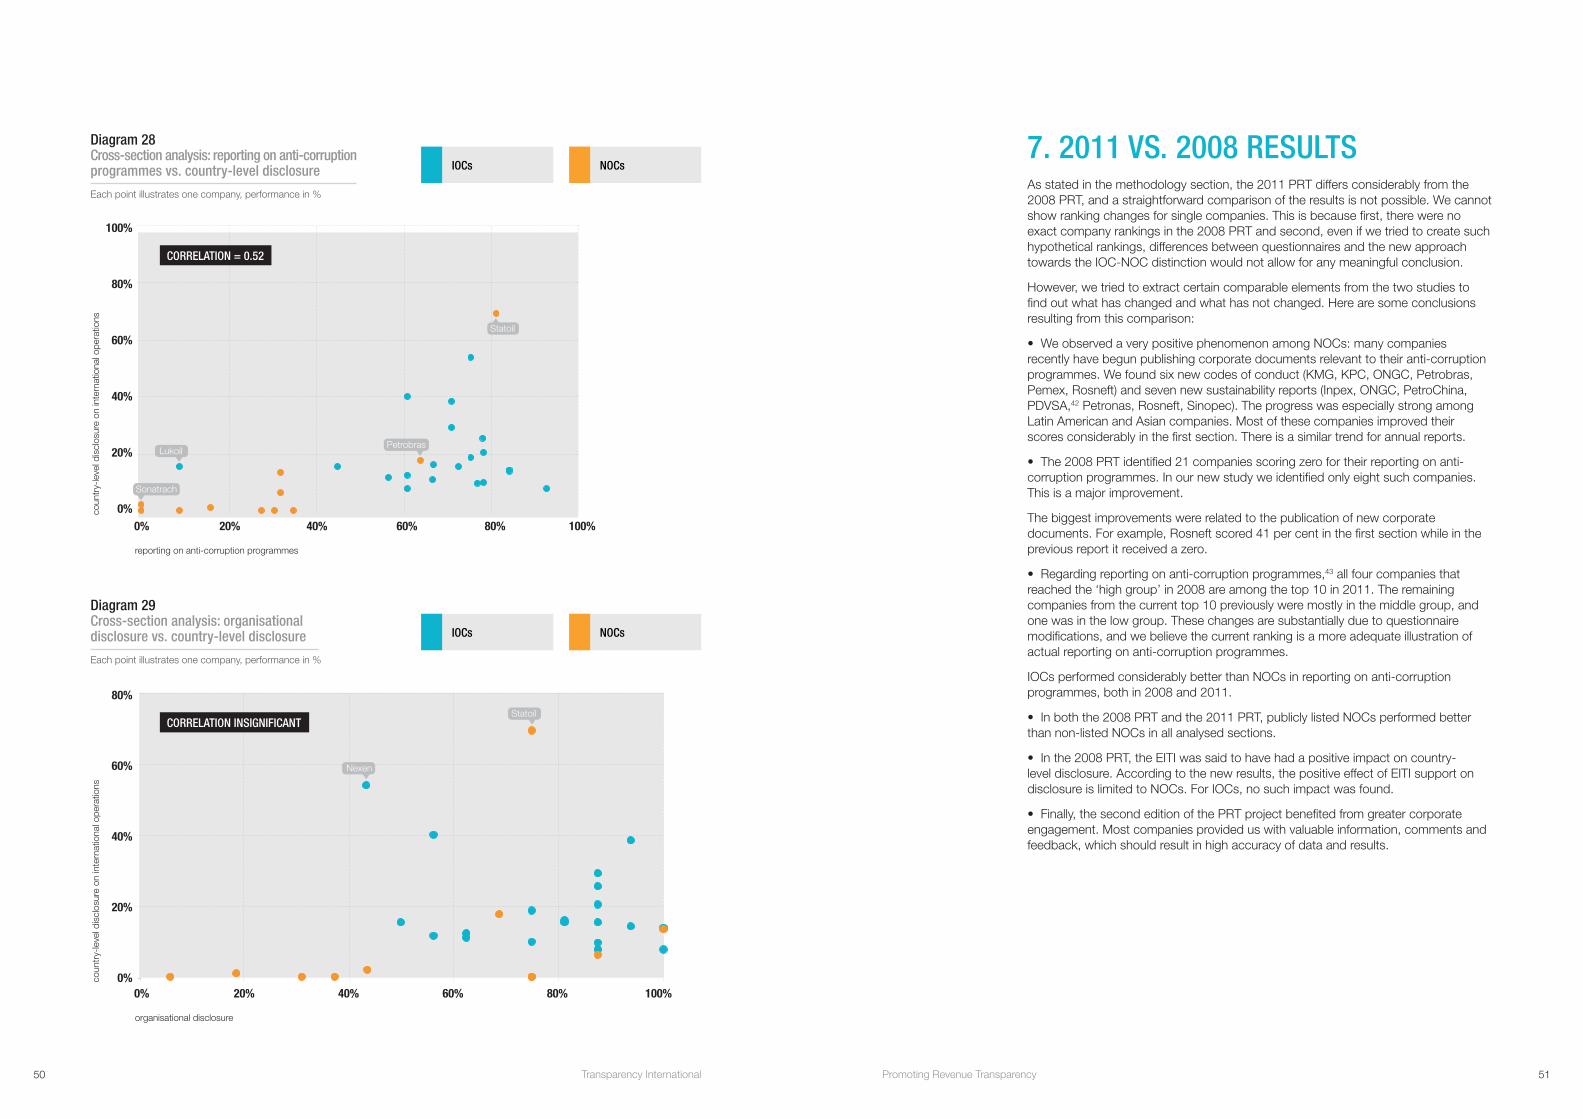
Diagram 28 Cross-section analysis: reporting on anti-corruption programmes vs. country-level disclosure
Each point illustrates one company, performance in %
100%
80%
60%
40%
20%
0%0% 20% 40% 60% 80% 100%
IOCs NOCs
coun
try-
leve
l dis
clos
ure
on in
tern
atio
nal o
pera
tions
reporting on anti-corruption programmes
CORRELATION = 0.52
Diagram 29 Cross-section analysis: organisational disclosure vs. country-level disclosure
Each point illustrates one company, performance in %
80%
60%
40%
20%
0%0% 20% 40% 60% 80% 100%
IOCs NOCs
coun
try-
leve
l dis
clos
ure
on in
tern
atio
nal o
pera
tions
organisational disclosure
CORRELATION INSIGNIFICANT
Statoil
Lukoil
Sonatrach
Petrobras
Nexen
Statoil
7. 2011 VS. 2008 RESULTSAs stated in the methodology section, the 2011 PRT differs considerably from the 2008 PRT, and a straightforward comparison of the results is not possible. We cannot show ranking changes for single companies. This is because first, there were no exact company rankings in the 2008 PRT and second, even if we tried to create such hypothetical rankings, differences between questionnaires and the new approach towards the IOC-NOC distinction would not allow for any meaningful conclusion.
However, we tried to extract certain comparable elements from the two studies to find out what has changed and what has not changed. Here are some conclusions resulting from this comparison:
• We observed a very positive phenomenon among NOCs: many companies recently have begun publishing corporate documents relevant to their anti-corruption programmes. We found six new codes of conduct (KMG, KPC, ONGC, Petrobras, Pemex, Rosneft) and seven new sustainability reports (Inpex, ONGC, PetroChina, PDVSA,42 Petronas, Rosneft, Sinopec). The progress was especially strong among Latin American and Asian companies. Most of these companies improved their scores considerably in the first section. There is a similar trend for annual reports.
• The 2008 PRT identified 21 companies scoring zero for their reporting on anti-corruption programmes. In our new study we identified only eight such companies. This is a major improvement.
The biggest improvements were related to the publication of new corporate documents. For example, Rosneft scored 41 per cent in the first section while in the previous report it received a zero.
• Regarding reporting on anti-corruption programmes,43 all four companies that reached the ‘high group’ in 2008 are among the top 10 in 2011. The remaining companies from the current top 10 previously were mostly in the middle group, and one was in the low group. These changes are substantially due to questionnaire modifications, and we believe the current ranking is a more adequate illustration of actual reporting on anti-corruption programmes.
IOCs performed considerably better than NOCs in reporting on anti-corruption programmes, both in 2008 and 2011.
• In both the 2008 PRT and the 2011 PRT, publicly listed NOCs performed better than non-listed NOCs in all analysed sections.
• In the 2008 PRT, the EITI was said to have had a positive impact on country-level disclosure. According to the new results, the positive effect of EITI support on disclosure is limited to NOCs. For IOCs, no such impact was found.
• Finally, the second edition of the PRT project benefited from greater corporate engagement. Most companies provided us with valuable information, comments and feedback, which should result in high accuracy of data and results.
50 Transparency International 51Promoting Revenue Transparency
CONCLUSIONThere are positive transparency trends in the oil and gas sector, although the overall level of reporting remains unsatisfactory.
• Fewer companies are publishing no information at all on their operations or anti-corruption programmes. A growing number of NOCs are publishing standardised documents, such as codes of conduct or social responsibility reports. However, a group of companies still does not disclose any significant information, and some companies do not even maintain corporate websites.
Most elements of what is considered to be a robust anti-corruption programme have been broadly integrated, insofar as they are being reported on by a large number of companies covered in this report. However, certain policies and procedures are still under-reported in the oil and gas industry, including the prohibition of facilitation payments, organising anti-corruption training for business partners, and reporting on corruption-related incidents.
• The overall level of organisational disclosure among the analysed companies is good. Nonetheless, some critical points require improvement, especially reporting on partners in the fields of upstream operations, and reporting on countries of incorporation of non-consolidated subsidiaries.
• Several companies already disclose a considerable amount of country-level information, and some have declared their intention to do this soon. For domestic operations, some companies already disclose all of the information required by this study. For international operations, there are examples of good levels of disclosure for each type of data – transfers, financials and operating data. Reporting on production levels has become a broadly accepted standard, with an average score of 71 per cent. This positive trend was strengthened recently by new US legislation requiring extractive companies to report governmental transfers at the country level. Nonetheless, the average level of country-by-country reporting is still very low. Many companies only report on their production levels, some reveal only certain data points and some do not report at the country level at all. Such reporting does not allow for much improvement in the management of natural resources. Both legislation and companies’ approaches must evolve toward more transparency.
Uneven reporting on anti-corruption programmes and organisational structure, and poor country-level disclosure remain major concerns. The observed reporting differences on a host country basis limit the validity of ‘the challenging environment’ argument. There is still much room for improvement for fair value-sharing in the oil and gas industry, and we urge companies, their home governments and other influential parties to make a significant effort toward higher transparency, in line with our policy recommendations.
ANNEXES
ANNEX 1 - HISTORY OF THE PROJECTIn 2005, Save the Children UK published the report ‘Beyond the Rhetoric: Measuring revenue transparency – Company performance in the oil and gas industries’. Three years later the initiative was taken over by Transparency International, which published its first edition of the Promoting Revenue Transparency report.
This second edition, released three years after the first, combines the continuation of the basic idea with a modified methodology. The report should be read in conjunction with the recently published Revenue Watch Index 2010, which evaluates governmental disclosure in the oil, gas and mining sectors.
The second edition of the PRT report expands the scope of the study; it evaluates 44 companies and their disclosure in all of their countries of operations. The project has become better known and more accepted within the oil and gas industry. Among the indicators of this positive response is an increased number of companies that have reviewed their data, and increased corporate engagement not only with the project itself, but also with the general issue of transparency.
52 Transparency International 53Promoting Revenue Transparency
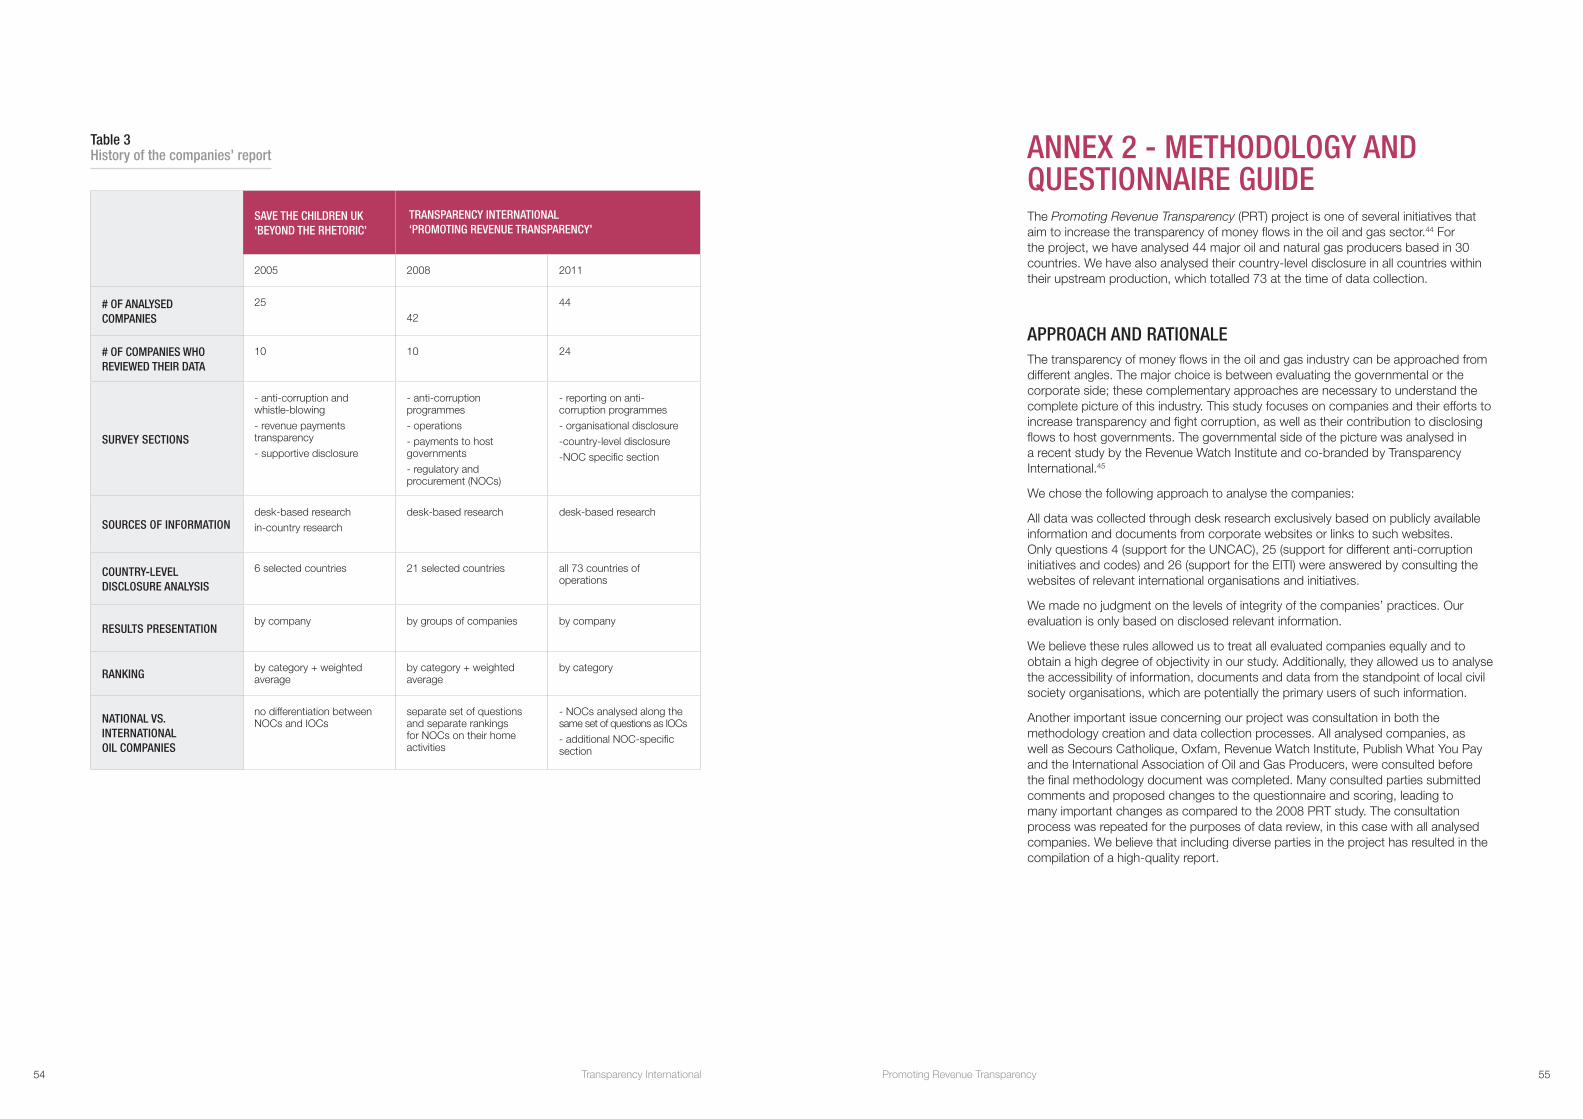
SAVE THE CHILDREN UK ‘BEYOND THE RHETORIC’
2005 2008 2011
# OF ANALYSED COMPANIES
25 42
44
# OF COMPANIES WHO REVIEWED THEIR DATA
10 10 24
SURVEY SECTIONS
- anti-corruption and whistle-blowing
- revenue payments transparency
- supportive disclosure
- anti-corruption programmes
- operations
- payments to host governments
- regulatory and procurement (NOCs)
- reporting on anti-corruption programmes
- organisational disclosure
-country-level disclosure
-NOC specific section
SOURCES OF INFORMATIONdesk-based research in-country research
desk-based research desk-based research
COUNTRY-LEVEL DISCLOSURE ANALYSIS
6 selected countries 21 selected countries all 73 countries of operations
RESULTS PRESENTATIONby company by groups of companies by company
RANKINGby category + weighted average
by category + weighted average
by category
NATIONAL VS. INTERNATIONAL OIL COMPANIES
no differentiation between NOCs and IOCs
separate set of questions and separate rankings for NOCs on their home activities
- NOCs analysed along the same set of questions as IOCs
- additional NOC-specific section
Table 3 History of the companies’ report
TRANSPARENCY INTERNATIONAL ‘PROMOTING REVENUE TRANSPARENCY’
ANNEX 2 - METHODOLOGY AND QUESTIONNAIRE GUIDEThe Promoting Revenue Transparency (PRT) project is one of several initiatives that aim to increase the transparency of money flows in the oil and gas sector.44 For the project, we have analysed 44 major oil and natural gas producers based in 30 countries. We have also analysed their country-level disclosure in all countries within their upstream production, which totalled 73 at the time of data collection.
APPROACH AND RATIONALEThe transparency of money flows in the oil and gas industry can be approached from different angles. The major choice is between evaluating the governmental or the corporate side; these complementary approaches are necessary to understand the complete picture of this industry. This study focuses on companies and their efforts to increase transparency and fight corruption, as well as their contribution to disclosing flows to host governments. The governmental side of the picture was analysed in a recent study by the Revenue Watch Institute and co-branded by Transparency International.45
We chose the following approach to analyse the companies:
All data was collected through desk research exclusively based on publicly available information and documents from corporate websites or links to such websites. Only questions 4 (support for the UNCAC), 25 (support for different anti-corruption initiatives and codes) and 26 (support for the EITI) were answered by consulting the websites of relevant international organisations and initiatives.
We made no judgment on the levels of integrity of the companies’ practices. Our evaluation is only based on disclosed relevant information.
We believe these rules allowed us to treat all evaluated companies equally and to obtain a high degree of objectivity in our study. Additionally, they allowed us to analyse the accessibility of information, documents and data from the standpoint of local civil society organisations, which are potentially the primary users of such information.
Another important issue concerning our project was consultation in both the methodology creation and data collection processes. All analysed companies, as well as Secours Catholique, Oxfam, Revenue Watch Institute, Publish What You Pay and the International Association of Oil and Gas Producers, were consulted before the final methodology document was completed. Many consulted parties submitted comments and proposed changes to the questionnaire and scoring, leading to many important changes as compared to the 2008 PRT study. The consultation process was repeated for the purposes of data review, in this case with all analysed companies. We believe that including diverse parties in the project has resulted in the compilation of a high-quality report.
54 Transparency International 55Promoting Revenue Transparency
COMPARISON TO THE 2008 PRTThe broad consultation process, recent TI-UNGC guidance as well as the emergence of new concerns such as the disclosure of corporate structures led to several major and numerous minor changes to our study. Major changes to the 2010 PRT methodology, as compared to the 2008 PRT report, were:
1. Companies were reviewed across all countries within their upstream operations, and not only across the group of chosen countries.
2. The section on reporting on anti-corruption programmes was reworked to be fully consistent with the TI-UNGC guidance on reporting according to the 10th principle.46
3. Questions on organisational disclosure were added.
4. The same basic questionnaire applied to both IOCs and NOCs. The latter were additionally reviewed against five NOC-specific questions (Section 4).
5. No country weighting was applied for company rankings.
6. Scores were calculated separately for each section; there is no weighted, general ranking.
7. There are exact rankings by company and not by group for each evaluated section.
8. Not only the scores but also the exact sources of each piece of data/information were collected and included in the report’s annex.
Changes in the questionnaire have resulted in limited comparability between the two reports. The new questionnaire includes a modified set of questions and is structured differently – for example, the sections on country-level disclosure and organisational disclosure only evaluate performance. All policy issues, including those related to country-level disclosure (i.e. EITI support), are included in the section on reporting on anti-corruption programmes.47
We believe the new structure gives a clearer picture of the actual level of transparency in the industry.
QUESTIONNAIRE GUIDEThe questionnaire includes four groups of questions (‘sections’). Each question has been scored separately, usually with a maximum score of 1 point. In Section 1, several questions have different maximum scores (from 0.5 to 2 points), which results in their higher or lower relative weighting within the section. In Section 3, the question on disclosure of payments to governments along the EITI revenue streams indicators is scored with 4 points, giving it a higher weighting. Each calculated ranking concerns one section only or a part of this section. There are no cross-section rankings, therefore the sections are not weighted against each other.
SECTION 1: REPORTING ON ANTI-CORRUPTION PROGRAMMESThe questions in this section are organised according to elements of the TI-UNGC Reporting Guidance on the 10th Principle against Corruption.
D1: Publicly stated, formal policy of zero tolerance of corruption1. Does the company have a publicly available global policy of zero tolerance of corruption? 2 points48
The policy can include a statement that the organisation does not tolerate corrupt behaviour and confirmation that the organisation has established binding organisational guidelines requiring all directors, managers and employees worldwide to behave ethically and in conformity with the law and guidelines.
‘Global’ means that the policy applies on an enterprise-wide basis, to all activities of the company regardless of location.
‘Policy’ does not refer to a particular format or type of document, but rather to an explicit organisational commitment prohibiting corruption in writing.
Usual scoring: 2 points. Discounted score: if the statement does not apply to the mother company but only to the major upstream subsidiary.
2. Does the policy and/or company’s code of conduct explicitly apply to all subsidiaries? 1 point
A ‘subsidiary’ is any entity in which the parent company has a majority equity interest or otherwise exercises effective control over operations. ‘The whole group’ is alternative to ‘all subsidiaries’.
B2: Commitment to be in compliance with all relevant laws, including anti-corruption laws3. Does the company commit to be in compliance with all relevant laws, including anti-corruption laws? 1 point
Usual scoring: 1 point. Discounted score: if the policy does not apply to the mother company but only to the major upstream subsidiary.
D2: Statement of support for international and regional legal frameworks, such as the UN Convention against Corruption4. Does the company have a statement of support for the UN Convention against Corruption? 1 point
Positive scores for signatories to the letter of support (UNCAC website).
D3: Carrying out risk assessment of potential areas of corruption5. Does the company describe its corruption-related risk assessment procedures? 2 points
Usual score: 2 points for explicitly mentioning corruption-related risks. Discounted score: for implicit relation to corruption.
D4: Detailed policies for high-risk areas of corruption6. Does the company have a policy to forbid or fully disclose political contributions? 1 point
‘Political contributions’ refers to contributions of cash or in-kind support for a political party, cause or candidacy.
A positive score will be given to companies that prohibit political contributions entirely or, alternatively, that publicly disclose contributions. Usual scoring: 1 point. Discounted score: if the policy does not apply to the mother company but only to the major upstream subsidiary; alternatively, for companies allowing but disclosing contributions, if disclosure concerns their home country only.
7. Does the company’s anti-corruption policy provide against the risk of charitable contributions and sponsorships being used as a subterfuge for bribery? 0.5 point
8. Does the company fully disclose its charitable contributions and sponsorships? 0.5 point
56 Transparency International 57Promoting Revenue Transparency
‘Charitable contributions’ refers to contributions made for charitable, educational, social welfare and similar purposes. The positive score will be awarded if contributions are named either by topic/field/programme or by recipient.
9. Does the company prohibit the offer or receipt of improper gifts, hospitality or expenses? 1 point
10. Does the company provide guidance on the offer or receipt of gifts, hospitality or expenses? 1 point
Gifts, hospitality and travel expenses are improper when they could affect or be perceived to affect the outcome of business transactions, and are not reasonable and bona fide. Any similar wording will be awarded a positive full score.
11. Does the policy forbid facilitation payments? 1.5 point
‘Facilitation payments’ are small, unofficial payments made to secure or expedite the performance of a routine or necessary action to which the company has legal or other entitlement.
1 point is awarded to companies that explicitly forbid facilitation payments without disclosing appropriate procedures and controls to ensure the policy is followed, and 1.5 points are awarded to companies that explicitly forbid facilitation payments and disclose the procedures and controls to enforce policy.
D5: Policy on anti-corruption regarding business partners12. Does the policy apply to agents and other intermediaries? 1 point
‘Agents and other intermediaries’ refer to agents, advisors and others authorised to act for or on behalf of, or to otherwise represent, the company in furtherance of its business interests.
A full positive score will be given to companies that explicitly extend the policy to agents or other intermediaries. A discounted score will be given to companies that extend the policy in the form of the ‘promotion of principles’ but not as an obligation.
13. Does the policy apply to contractors, subcontractors and suppliers? 1 point
‘Contractors, subcontractors and suppliers’ generally refer to non-controlled persons or entities that provide goods or services under contract.
A full positive score will be given to companies that explicitly extend the policy to contractors, subcontractors or suppliers. A discounted score will be given to companies that extend the policy in the form of the ‘promotion of principles’ but not as an obligation.
14. Does the policy apply to other business partnerships? 1 point
‘Other business partnerships’ include joint ventures, consortium partners, teaming agreements and significant joint investments.
A full positive score will be given to companies that explicitly extend the policy to other business partnerships. A discounted score will be given to companies that extend the policy in the form of the ‘promotion of principles’ but not as an obligation.
B4: Support by the organisation’s leadership for anti-corruption15. Does the company publish a statement from the chief executive officer or chair of the board supporting the anti-corruption principles of the company? 1 point
The statement can support the anti-corruption principles, the code of conduct, or the Corporate Responsibility report. It will always be awarded the full score.
16. Are employees provided with detailed and publicly available guidance explaining the company’s anti-corruption policy? 1.5 points
‘Detailed guidance’ refers to any document that details the company’s anti-corruption policy. For some companies it can be an extended part of their codes of conduct. Any such guidance will be awarded the full score.
17. Does the company provide anti-corruption training for all employees? 1.5 points
The provision of such training will be awarded the full score.
D6: Action taken to encourage business partners to implement anti-corruption commitments18. Does the company provide anti-corruption training for its business partners? 1 point
The provision of such training will be awarded the full score.
D8: Human resources procedures supporting the anti-corruption commitment or policy19. Does the policy explicitly apply to all employees? 1 point
Usual scoring: 1 point. Discounted score: if the policy does not apply to the mother company but only to the major upstream subsidiary.
20. Does the policy require employees to report potential violations of the policy? 0 points
During the data-sharing process, we were informed about the irrelevance of this question for certain companies. In some countries such as France, the requirement to report potential violations of the policy would be illegal. It is only possible to encourage employees to do such reporting. In consideration of this, the question remained in the questionnaire only for information purposes. It was not scored and had no influence on the final results or rankings.
The question is answered with yes/no.
21. Does the policy prohibit retaliation for reporting a violation of policy? 2 points
To receive a full positive score for this indicator, the policy must specify that no employee will suffer demotion, penalty or other adverse consequences for reporting a violation of policy.
22. Does the policy include provisions for disciplining employees (including directors and managers) involved in corrupt activities? 2 points
‘Discipline’ means any form of disciplinary action, up to and including employment termination.
1 point will be awarded for policies that explicitly warn of disciplinary action for violations. An additional 1 point will be given for reporting on the number of employees disciplined for corrupt activities.
D9: Communications (whistleblowing) channels and follow-up mechanisms for reporting concerns or seeking advice23. Does the company provide channels through which employees can report potential violations of policy or seek advice (e.g. ‘whistleblowing’) in confidence? 1 point
A full score will be awarded for the provision of such channels in a form that assures full confidence.
24. Does the company disclose the number of complaints received or incidents reported for corrupt activities through communications channels? 1 point
D11: Participation in voluntary anti-corruption initiatives25. Does the company take part in or explicitly support leading voluntary anti-corruption initiatives and codes i.e. UN Global Compact, TI-supported Business Principles for Countering Bribery, ICC Rules of Conduct, PACI Principles for Countering Bribery, APEC Code of Conduct for Business, IPIECA? 2 points
Companies are awarded 2 points for participating in or explicitly supporting one or more recognised global anti-corruption initiatives. This indicator is measured by consulting the lists of UN Global Compact participants, PACI signatories, IPIECA membership and the BPCB steering committee, and also by checking any public statement from the corporation.
26. Does the company support the EITI? 2 points
This indicator is scored by consulting the EITI website, which lists companies that have publicly committed to support the EITI on an international level. ‘Support’ includes submission of an international-level company self-assessment form.
All companies listed on the EITI website receive a positive score (1 point) for this indicator. Additional recognition (1 point) is given for submission of an EITI-compliant self-assessment form. No independent qualitative judgement is made on the content provided in these forms.
B7: Monitoring and improvement processes27. Is the company’s anti-corruption programme periodically reviewed for adequacy and effectiveness? 1 point
‘Programme’ refers to the whole of the company’s anti-corruption efforts, including its code of conduct, detailed policies and procedures, administrative processes, training and guidance, and oversight.
To score positively, the assessment must either be publicly available or publicly acknowledged to exist.
58 Transparency International 59Promoting Revenue Transparency

D15: Use of independent external assurance of anti-corruption programmes28. Does the company undergo external independent audit of its anti-corruption programme? 2 points
The question applies explicitly to an audit of the anti-corruption programme and not to the overall audit of a sustainability report. To score positively, a public statement on such an audit must be available.
SECTION 2: ORGANISATIONAL DISCLOSURE29. Does the company publicly disclose the names of its fully consolidated material subsidiaries, with the percentage of ownership? 1 point
0.5 points are awarded to companies that publicly disclose the names of the subsidiaries, and another 0.5 points are awarded for the percentage of ownership.
30. Does the company publicly disclose the country of incorporation of its fully consolidated material subsidiaries? 1 point
31. Does the company publicly disclose the names of its non-fully consolidated material subsidiaries, including joint ventures, with the percentage of ownership? 1 point
0.5 points are awarded to companies that publicly disclose the names of subsidiaries, and another 0.5 points are awarded for the percentage of ownership.
‘Other affiliates’ include joint ventures, non-controlled subsidiaries, consortium partners, teaming agreements and nominated subcontractors.
32. Does the company publicly disclose the country of incorporation of its non-fully consolidated material subsidiaries? 1 point
33. Does the company publicly identify its material upstream fields of operation, with the percentage of interest? 1 point
‘Publicly identify’ means that the information appears in an annual report, a stock exchange filing or another similar document available on the company’s website.
0.5 points are awarded to companies that publicly disclose the fields, and another 0.5 points are awarded if the percentage of interest is mentioned.
34. Does the company publicly identify other partners in its material upstream fields of operation, with their percentage of interest? 1 point
0.5 points are awarded to companies that publicly disclose their partners, and another 0.5 points are awarded if the percentage of interest is mentioned.
35. Does the company publish accounts in accordance with internationally or generally accepted accounting standards? 1 point
Scoring positively on this indictor requires that the company’s annual report or equivalent document clearly states that it has been prepared in accordance with accounting standards that are accepted either internationally or nationally. The name of the standard (i.e. Japanese GAAP or IFRS) must be named.
36. Are the company’s accounts subject to an independent external audit? 1 point
Scoring positively on this indicator requires a public statement of the external auditor.
SECTION 3: COUNTRY-LEVEL DISCLOSURECountries of operations are the countries of actual upstream producing activities.
37. Does the company disclose payments to government along the EITI revenue streams indicators in country X? 4 points
‘EITI revenue streams indicators’ include all of the following: profit taxes, royalties, dividends, bonuses (such as signature, discovery, production), licence fees, rental fees, entry fees and other considerations for licences and/or concessions, profit oil, other significant benefits to government.
For this point, it is important to note that some EITI countries report their data not only on an aggregate but also on a company basis. Among EITI-compliant countries, this includes Timor-Leste; among candidate countries this includes Norway (some other countries did report their data in this manner, but there are no updated reports or data available). As a result, certain corporate payments to governments along the EITI revenue streams indicators can be found in EITI country reports.
For this study we evaluate direct corporate reporting; therefore, such information was only scored positively when it could be found on corporate websites (linked to or included in company reports).
A full score was awarded for the full disclosure of revenue streams. Partial scores were awarded if some revenue streams were disclosed on top of profit taxes (question 42) and royalties (question 43).
38. Does the company publicly disclose its revenue for its operations in country X? 1 point
Positive score for reporting one of the following: total revenues or segment revenues for exploration and production (E&P) activities.
39. Does the company publicly disclose its production costs for its operations in country X? 1 point
40. Does the company publicly disclose its development and exploration costs for its operations in country X? 1 point
41. Does the company publicly disclose its profit before taxes for its operations in country X? 1 point
Positive score for reporting one of the following: total earnings before taxes (EBT) or segment EBT for E&P activities.
42. Does the company publicly disclose its profit taxes (income tax) for its operations in country X? 1 point
Positive score for reporting one of the following: total profit tax or segment profit tax for E&P activities
43. Does the company publicly disclose its royalties for its operations in country X? 1 point
If taxes and royalties are disclosed on an aggregated basis in country X, the company will be awarded 1.5 points on the total of questions 42 and 43.
44. Does the company publicly disclose for operations in country X expenditures for local community development? 1 point
45. Does the company publicly disclose production volumes for its operations in country X? 1 point
Production volumes may be provided in barrels of oil equivalent per day (boe/d) or cubic feet per day (cf/d).
46. Does the company publicly disclose a measure of reserves for its operations in country X? 1 point
The method of calculation is not tested; all that is required is the disclosure of the figure.
For Mexico the question was scored as ‘n.a.’ for all foreign producers. This is due to specific Mexican legislation that does not authorise companies other than Pemex to report Mexican reserves as their own. According to Mexican law, all reserves as well as produced oil belong to the Mexican state. Foreign producers can be only paid in cash (never in-kind) for their services.
SECTION 4: NOC-SPECIFIC QUESTIONS47. Are the activities of the NOC on behalf of the government (whether commercial or non-commercial) publicly disclosed? 1 point
‘Commercial activities’ refers to upstream (e.g. exploration, development and production) and downstream (e.g. refining) oil and gas activities.
‘Non-commercial activities’ include regulatory functions as well as licensing and concession-granting powers.
A positive score will be awarded for public declaration of such activities. We made no judgement on the accuracy of disclosed information.
48. Is the NOC’s pricing policy for the supply of goods and services to the government and related parties publicly disclosed? 1 point
‘Pricing policy’ refers to the standards and procedures used to price goods and services, including natural resources, supplied to the government and related parties.
In this case, it does not matter whether pricing policy is established by the government or the NOC; all that is required for a positive score is that the policy is publicly disclosed by the NOC.
49. Are the procurement procedures used by the NOC publicly disclosed? 1 point
‘Procurement procedures’ refers to procedures used by the NOC for its procurement of goods and services from other parties. To score positively, the NOC must publicly disclose the procedures it applies.
50. Are the criteria and procedures used by the NOC to award exploration, development and production licenses publicly disclosed? 1 point
If the NOC does not award such licenses, its score is ‘n.a.’
51. Are exploration, development and production licenses awarded by the NOC publicly disclosed? 1 point
60 Transparency International 61Promoting Revenue Transparency

Scoring positively on this indicator requires public disclosure of name(s) of party(ies), identification of the field and duration of license.
If the NOC does not award such licenses, its score is ‘n.a.’
Each question was scored individually, and for each of the first three sections the general scores (expressed as a percentage of maximum available scores) were calculated as follows:
For Section 1: simple sum of scores 1-28,
For Section 2: simple sum of scores 29-36,
For Section 3: sums of questions 37 to 46 for each country, then averaged between countries. Additionally, separate scores were calculated for home-country operations and international operations.
NOC-specific questions (Section 4) were evaluated separately, and there is no general section score. No cross-section score or ranking has been calculated, as we found such results had a low informative value.49
DATA COLLECTION AND SHARINGIn order to collect data for our study, thorough desk research has been conducted. Data sources have been limited by the following rules:
• All data/information must be accessible from company’s website (except for questions 4, UNCAC support; 25, anti-corruption initiatives; 26, EITI support). For questions 4, 25 and 26, information can be accessed from websites of the relevant international organisations and initiatives.
• Data must be accessible either on corporate websites, in documents downloadable from the websites, or on the links provided by the websites.
• All data was collected between 1 February and 30 April 2010. Still, during the data-sharing process, all the companies were given an opportunity to present documents or information published after this period, but no later than the end of the data-review process (mid-July 2010).
We made no differentiation between sources, and the same type of information was scored equally, regardless of the source. When a positive answer to a question was found and positively scored, no further sources were required. If a piece of information was repeated in different sources, it was still scored only once.
Data was evaluated exclusively on the basis of its availability. We made no judgement on the integrity of data and made no external verification of data. If any false information was presented, unfortunately this is not reflected in our study.50 We acknowledge this weakness of the results. However, we found no space for such verification in this report, which is fully focused on disclosure. Nonetheless, we indirectly introduced the issue of data verification to our questionnaire in two points – first, by asking about external audits of company accounts (question 36), and second, by asking about external audits of anti-corruption programmes (question 28).
During data collection, we again opened a consultation process with evaluated companies. Collected preliminary data was shared with the companies; each company received a set of questions and answers with proposed scores and sources of information. Twenty-four out of 44 analysed companies used this opportunity to correct the data and indicate additional sources. Among these 24 companies were 19 IOCs (all except Lukoil) and five NOCs. Company input was very valuable, aiding us in correcting a considerable amount of data points.51 In one case, company input even made us modify the calculation of scores, as we learned about the irrelevance of question 20 for companies incorporated in certain countries.52
COMPANY SELECTIONFor the 2011 PRT project, 44 major oil and gas companies were evaluated. Forty-one were chosen as a continuation of the 2008 PRT report, and three new companies were added: SOCAR, OMV and Wintershall. The final list of evaluated companies is presented in Table 4.
COMPANIES NAME
SHORT FULL HOME COUNTRY
1 BG BG Group UK
2 BHP BHP Billiton Australia
3 BP British Petroleum UK
4 Chevron Chevron Corporation USA
5 CNOOC* China National Offshore Oil Corporation China
6 CNPC* China National Petroleum Corporation China
7 Conoco Conoco Phillips Company USA
8 Devon Devon Energy Corporation USA
9 Eni Eni Italy
10 Exxon ExxonMobil Corporation USA
11 Gazprom* Gazprom, OAO Russia
12 GEP* GEPetrol Equatorial Guinea
13 Hess Hess Corporation USA
14 Inpex* Inpex Corporation Japan
15 KazMG* KazMunaiGaz National Company Kazakhstan
16 KPC* Kuwait Petroleum Corporation Kuwait
17 Lukoil Lukoil Oil Company, OAO Russia
18 Marathon Marathon Oil Corporation USA
19 Nexen Inc. Nexen Inc. Canada
20 NIOC* National Iranian Oil Company Iran
21 NNPC* Nigerian National Petroleum Company Nigeria
22 OMV OMV Group AG Austria
23 ONGC* Oil and Natural Gas Corporation India
24 PDVSA* Petroleos de Venezuela Venezuela
25 Pemex* Petroleos Mexicanos Mexico
26 Petrobras* Petróleo Brasileiro S.A. Brazil
27 PetroChina* PetroChina Company China
28 Petronas* Petroliam Nasional Berhad Malaysia
29 QP* Qatar Petroleum Qatar
30 Repsol Repsol YPF Spain
31 Rosneft* Rosneft Oil Company, OJSC Russia
32 SaudiAramco* SaudiAramco Saudi Arabia
33 Shell Royal Dutch Shell The Netherlands
34 Sinopec* China Petroleum & Chemical Corporation China
35 SNPC* Société Nationale des Pétroles du Congo Congo (Brazzaville)
36 SOCAR* State Oil Company of Azerbaijan Azerbaijan
37 Sonangol* Sonangol Angola
38 Sonatrach*Société Nationale pour la Recherche, la Production, le Transport, la Transformation, et la Commercialisation des Hydrocarbures s.p.
Algeria
39 Statoil* Statoil Norway
40 Suncor Suncor Energy Inc. (incl. former Petro-Canada) Canada
41 Talisman Talisman Energy Inc. Canada
42 Total Total S.A. France
43 Wintershall Wintershall AG Germany
44 Woodside Woodside Petroleum Australia
Table 4 List of companies in the sample
*companies classified as NOCs (national oil companies)
companies that reviewed their data in our data- sharing process
62 Transparency International 63Promoting Revenue Transparency

Company selection was based primarily on selection for the 2008 PRT project; therefore, our major criterion was continuity. The initial choice of companies for the 2008 PRT project was based on a combination of five different criteria:
• Industry materiality – important industry players
• Country materiality – major local players – regionally or nationally relevant companies
• Continuity – comparability to the sample from the report ‘Beyond the Rhetoric’
• Diversity – variety of companies by types, structures and categories
• Consistency – NOCs from all the selected important countries of operations
The 44 analysed companies represent a considerable portion of the global oil and gas industries. Our sample covers about 60 per cent of proved global oil reserves and more than 60 per cent of global oil
production. Concerning natural gas, the analysed companies cover about 55 per cent of proved global reserves and almost 60 per cent of global production.
About 90 per cent of both oil and gas reserves in the sample belong to national oil companies. The selected NOCs also produce twice as many hydrocarbons as the IOCs in the sample. However, this is mostly due to the domination of a very few companies. If Gazprom alone were excluded from the gas sample, there would be a balance between private and national company production.53
Companies selected for the project are incorporated in 30 countries. Table 5 presents the sample structure by country of incorporation, for each such country by ownership status (national companies vs. privately owned), and by internationality of production (single-country vs. multi-country producers).
Among the 44 selected companies, 33 appear on one or both of the recent Fortune Global 500 and Forbes Global 2000 lists. The remaining companies are 11 NOCs, mostly from oil-dependent countries (five African, four Middle Eastern, one Azeri and one Chinese).54 Therefore, the sample includes both globally important, large producers and several locally/regionally important ones.
HOME COUNTRY # OF COMPANIES NOCs IOCs (PRIVATE) SINGLE-COUNTRY MULTI-COUNTRY1. Algeria 1 1 12. Angola 1 1 1 3. Australia 2 2 24. Austria 1 1 15. Azerbaijan 1 1 1 6. Brazil 1 1 17. Canada 3 3 38. China 4 4 1 39. Democratic Republic of the Congo 1 1 1
10. Equatorial Guinea 1 1 111. France 1 1 112. Germany 1 1 113. India 1 1 114. Iran 1 1 1 15. Italy 1 1 116. Japan 1 1 117. Kazakhstan 1 1 1 18. Kuwait 1 1 119. Malaysia 1 1 120. Mexico 1 1 1 21. Nigeria 1 1 1 22. Norway 1 1 123. Qatar 1 1 1 24. Russia 3 2 1 2 125. Saudi Arabia 1 1 1 26. Spain 1 1 127. The Netherlands 1 1 128. UK 2 2 229. US 6 6 630. Venezuela 1 1 1
44 24 20 13 31
BY CONTROL/OWNERSHIP STATUS BY # OF COUNTRIES OF PRODUCTION
Table 5 Sample structure by country, by ownership and by internationality of production
ANNEX 3 - BUILDING A ‘PERFECT SCORE COMPANY’The questionnaire used in our study reviewed very diverse aspects of corporate transparency. The number of positive scores for a single question ranged from 0 to 40. No company received 100 per cent scores in every section. The highest score for Section 1 was 93 per cent; for Section 2, 100 per cent; and for Section 3, 100 per cent for domestic and 69 per cent for international disclosure, respectively. In the NOC-specific section, one company scored 100 per cent on all applicable questions.
To find the critical questions and most sensitive issues raised by our study, we produced a brief question-by-question analysis of each section.
REPORTING ON ANTI-CORRUPTION PROGRAMMES – QUESTION BY QUESTIONThe only question from Section 1 that was awarded no single positive score was question 28. To date, the concept of an independent assurance of anti-corruption programmes is relatively new and rarely applied in the industry. We were informed that such assurances have been conducted in certain companies, but this was not publicly available information and therefore we could not consider it in our scoring.55 Question 11 on facilitation payments was scored positively for eight companies but no single company was awarded the full score of 1.5 points, because of the lack of disclosure on procedures and controls to enforce the relevant policy.
All the remaining questions were awarded at least some full scores, however the results were very diverse. These were the questions that were most often positively scored: compliance with laws (3), CEO’s support statement (15), a policy’s relevance for all employees (19), support for anti-corruption initiatives (25) and zero tolerance for corruption policy (1). The worst performing questions were: external audit (28), anti-corruption training for business partners (18), facilitation payments (11), disclosure of corruption-related complaints (24) and the support statement for UNCAC (4).
For each question we also tested the probability that a corporation scoring positively on that question belongs in the top 10 of the entire first section. This measure indicates how discriminatory a question is.56 The highest score, 100 per cent, was calculated for question 18 (anti-corruption training for business partners), which received only two positive answers, and both positively scoring companies belong to the top 10 of the section. Other questions with high scores were: 11 (facilitation payments), 14 (whether anti-corruption policies apply to business partners), 4 (statement of support for the UNCAC) and 5 (corruption-related risk assessment procedures).
To sum up, Section 1, although very complex and reviewing corporate reporting on anti-corruption programmes in detail, allowed companies to achieve very high, near-maximum scores. Very high ranks were not the result of a few highly discriminatory questions, but rather good performance throughout the entire section.
64 Transparency International 65Promoting Revenue Transparency
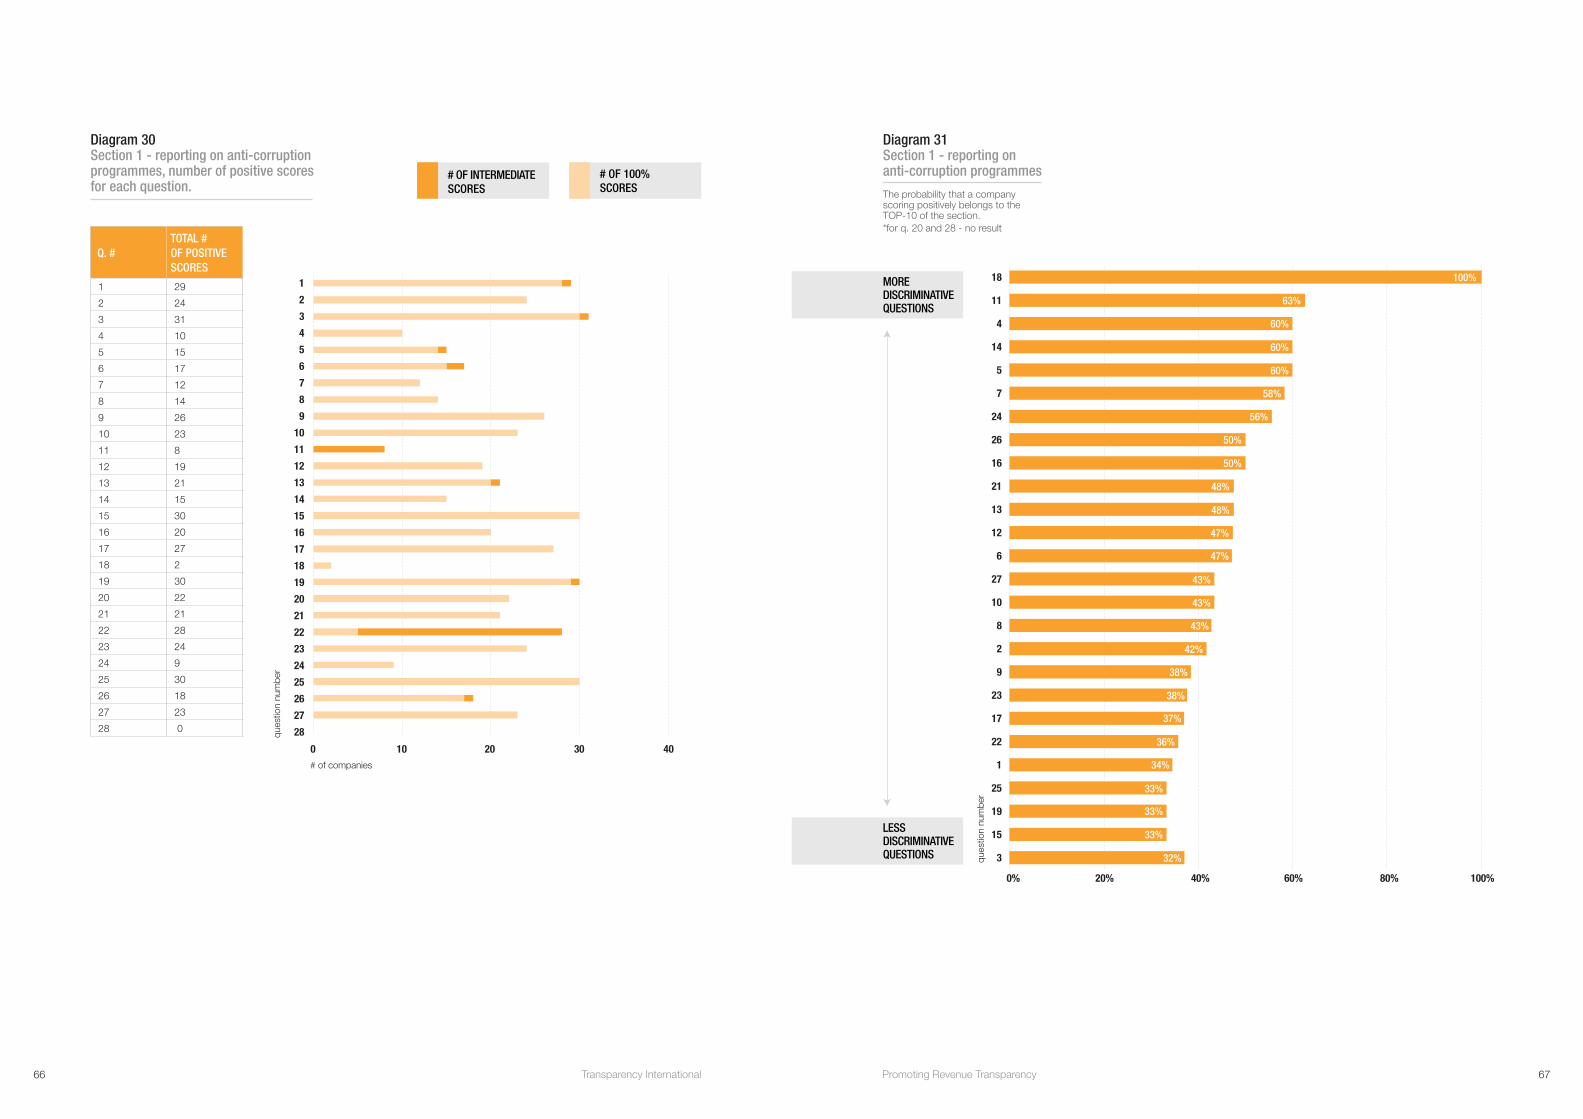
Diagram 30 Section 1 - reporting on anti-corruption programmes, number of positive scores for each question.
# OF INTERMEDIATE SCORES
# OF 100% SCORES
1
2
3
4
5
6
7
8
9
10
11
12
13
14
15
16
17
18
19
20
21
22
23
24
25
26
27
28
0 10 20 30 40
ques
tion
num
ber
# of companies
Q. #TOTAL # OF POSITIVE SCORES
1 29
2 24
3 31
4 10
5 15
6 17
7 12
8 14
9 26
10 23
11 8
12 19
13 21
14 15
15 30
16 20
17 27
18 2
19 30
20 22
21 21
22 28
23 24
24 9
25 30
26 18
27 23
28 0
Diagram 31 Section 1 - reporting on anti-corruption programmes
The probability that a company scoring positively belongs to the TOP-10 of the section.*for q. 20 and 28 - no result
18
11
4
14
5
7
24
26
16
21
13
12
6
27
10
8
2
9
23
17
22
1
25
19
15
3ques
tion
num
ber
0% 20% 40% 60% 80% 100%
MORE DISCRIMINATIVE QUESTIONS
LESS DISCRIMINATIVE QUESTIONS
100%
63%
60%
60%
60%
58%
56%
50%
50%
48%
48%
47%
47%
43%
43%
43%
42%
38%
38%
37%
36%
34%
33%
33%
33%
32%
66 Transparency International 67Promoting Revenue Transparency

ORGANISATIONAL DISCLOSURE – QUESTION BY QUESTIONIn Section 2, each question received at least one positive score. The fewest positive scores were awarded for questions 32 and 34, but 17 companies still received points on each of them. Partial scores were mostly awarded where there was no information on the percentage of ownership or interest.
Three companies – BG, BHP and ONGC – received maximum scores in the second section. This implies that achieving a maximum score was possible both for IOCs and NOCs.
Diagram 32 Section 2 - organisational disclosure number of positive scores for each question
Q. #TOTAL # OF POSITIVE SCORES
29 40
30 27
31 32
32 17
33 39
34 17
35 34
36 37
# OF INTERMEDIATE SCORES
# OF 100% SCORES
29
30
31
32
33
34
35
36
0 10 20 30 40
ques
tion
num
ber
# of companies
COUNTRY-LEVEL DISCLOSURE – QUESTION BY QUESTIONIn Section 3, each question received at least one positive score. Questions 39, 40 and 41 (all exploring P&L accounts) only received partial scores on international operations, meaning that no company disclosed these data points for all of its countries of international upstream operations. Question 37 was answered positively the least often; on domestic operations 14 out of 44 companies disclosed payments to their governments along the EITI revenue streams, while on international upstream operations only Statoil disclosed such data on all its countries of operations. Another five companies disclosed data on some of their countries of operations. The questions that was most often positively answered was question 45 on production volumes.
Diagram 33 Section 3 - country-level disclosure number of positive scores for each question
37
38
39
40
41
42
43
44
45
46
0 10 20 30qu
estio
n nu
mbe
r# of companies
INTERNATIONAL OPERATIONS31 COMPANIES (THE REMAINING 13 ARE SINGLE-COUNTRY PRODUCERS)
37
38
39
40
41
42
43
44
45
46
0 10 20 30 40
ques
tion
num
ber
# of companies
DOMESTIC OPERATIONS44 COMPANIES
INTERMEDIATE SCORES
100% SCORES
14
32
24
27
27
31
21
16
37
31
68 Transparency International 69Promoting Revenue Transparency
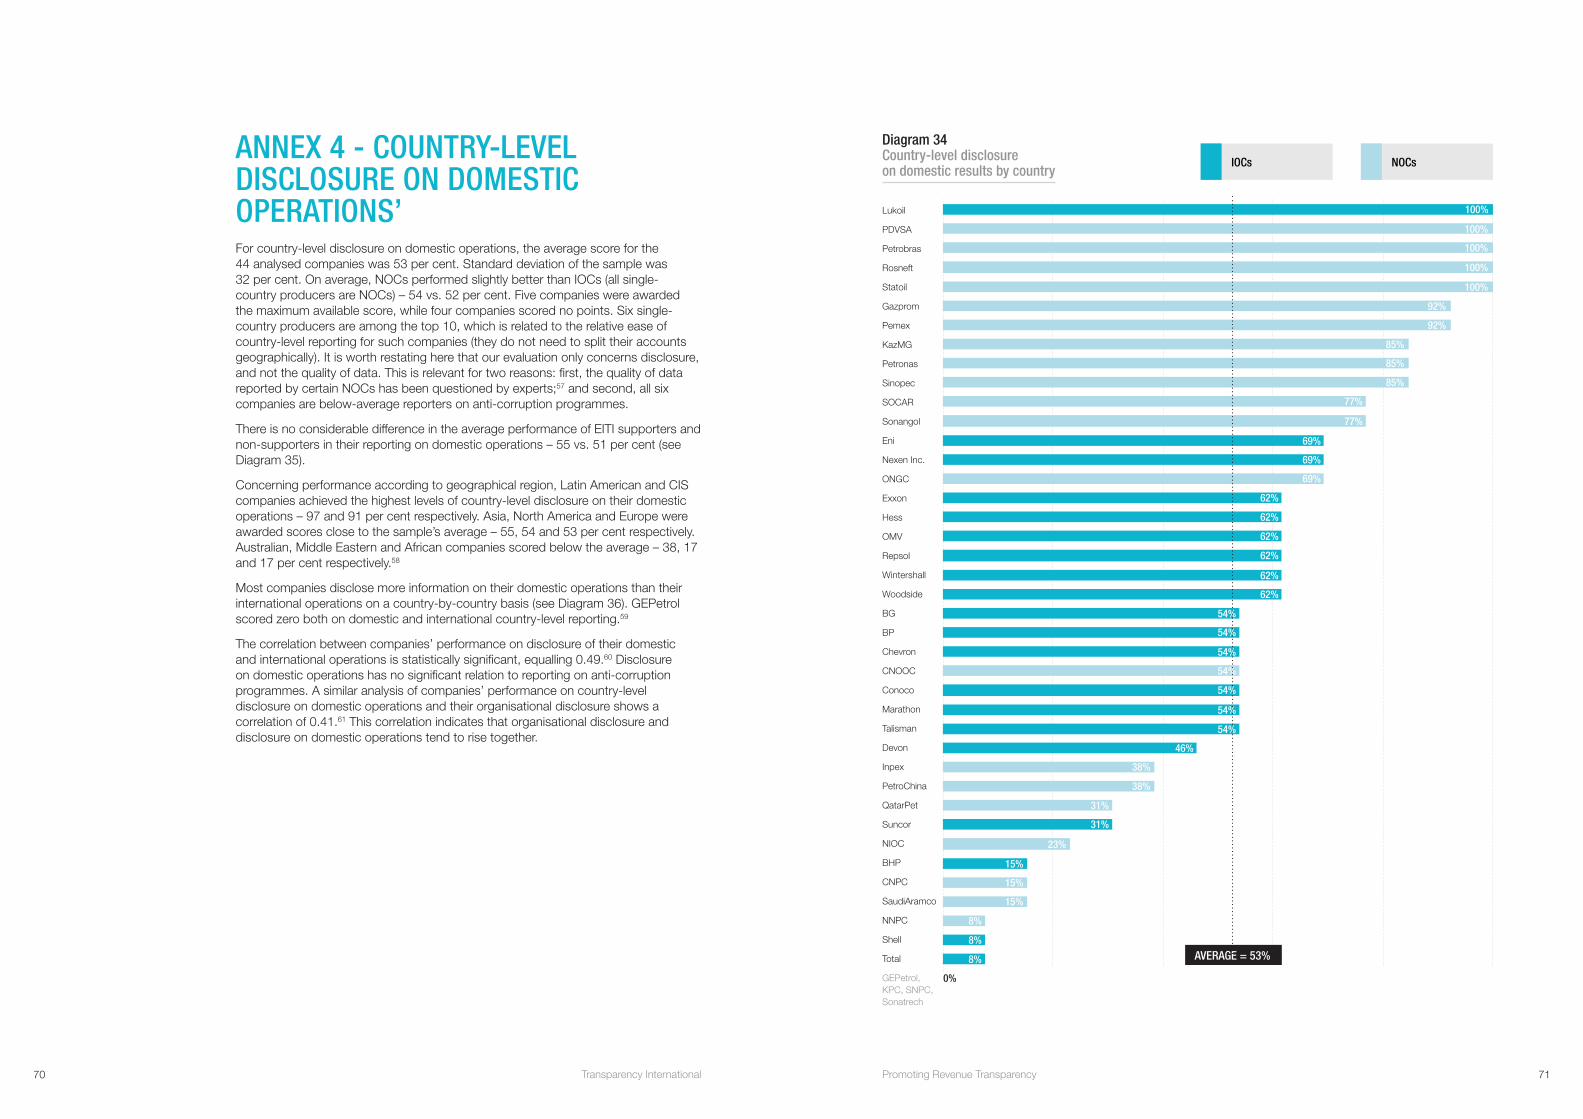
ANNEX 4 - COUNTRY-LEVEL DISCLOSURE ON DOMESTIC OPERATIONS’For country-level disclosure on domestic operations, the average score for the 44 analysed companies was 53 per cent. Standard deviation of the sample was 32 per cent. On average, NOCs performed slightly better than IOCs (all single-country producers are NOCs) – 54 vs. 52 per cent. Five companies were awarded the maximum available score, while four companies scored no points. Six single-country producers are among the top 10, which is related to the relative ease of country-level reporting for such companies (they do not need to split their accounts geographically). It is worth restating here that our evaluation only concerns disclosure, and not the quality of data. This is relevant for two reasons: first, the quality of data reported by certain NOCs has been questioned by experts;57 and second, all six companies are below-average reporters on anti-corruption programmes.
There is no considerable difference in the average performance of EITI supporters and non-supporters in their reporting on domestic operations – 55 vs. 51 per cent (see Diagram 35).
Concerning performance according to geographical region, Latin American and CIS companies achieved the highest levels of country-level disclosure on their domestic operations – 97 and 91 per cent respectively. Asia, North America and Europe were awarded scores close to the sample’s average – 55, 54 and 53 per cent respectively. Australian, Middle Eastern and African companies scored below the average – 38, 17 and 17 per cent respectively.58
Most companies disclose more information on their domestic operations than their international operations on a country-by-country basis (see Diagram 36). GEPetrol scored zero both on domestic and international country-level reporting.59
The correlation between companies’ performance on disclosure of their domestic and international operations is statistically significant, equalling 0.49.60 Disclosure on domestic operations has no significant relation to reporting on anti-corruption programmes. A similar analysis of companies’ performance on country-level disclosure on domestic operations and their organisational disclosure shows a correlation of 0.41.61 This correlation indicates that organisational disclosure and disclosure on domestic operations tend to rise together.
Diagram 34 Country-level disclosure on domestic results by country
IOCs NOCs
AVERAGE = 53%
Lukoil
PDVSA
Petrobras
Rosneft
Statoil
Gazprom
Pemex
KazMG
Petronas
Sinopec
SOCAR
Sonangol
Eni
Nexen Inc.
ONGC
Exxon
Hess
OMV
Repsol
Wintershall
Woodside
BG
BP
Chevron
CNOOC
Conoco
Marathon
Talisman
Devon
Inpex
PetroChina
QatarPet
Suncor
NIOC
BHP
CNPC
SaudiAramco
NNPC
Shell
Total
GEPetrol, KPC, SNPC, Sonatrech
100%
100%
100%
100%
100%
92%
92%
85%
85%
85%
77%
77%
69%
69%
69%
62%
62%
62%
62%
62%
62%
54%
54%
54%
54%
54%
54%
54%
46%
38%
38%
31%
31%
23%
15%
15%
15%
8%
8%
8%
0%
70 Transparency International 71Promoting Revenue Transparency
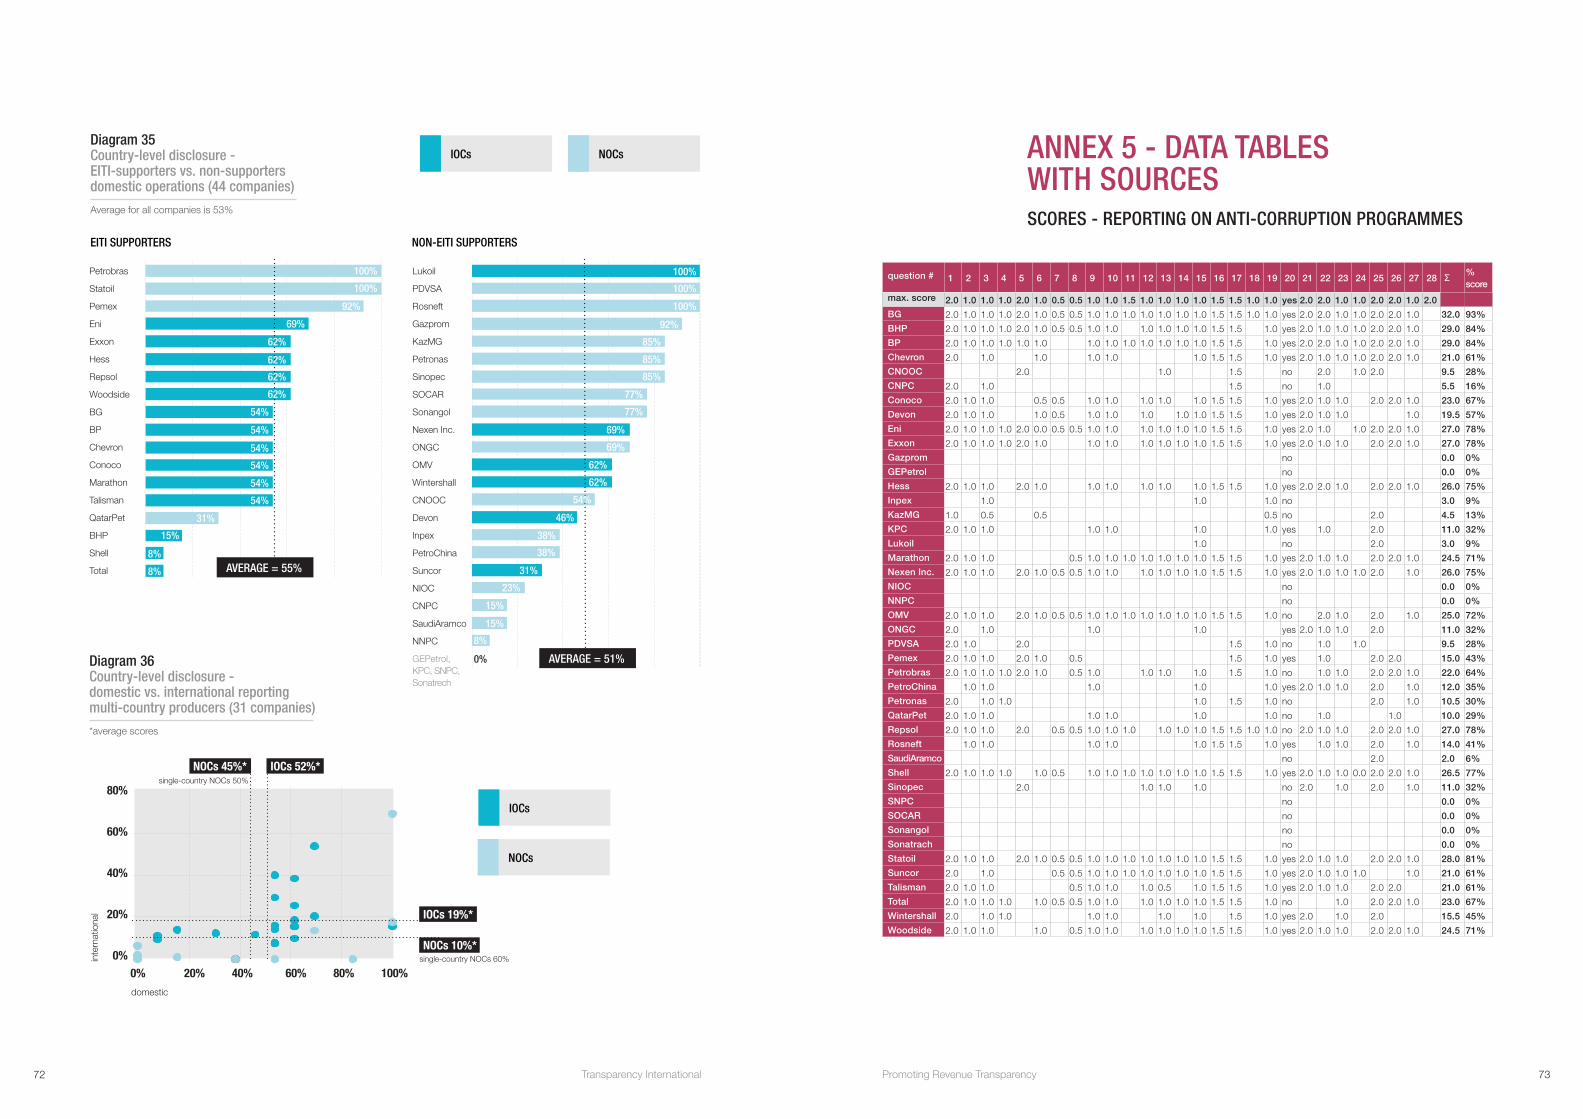
Diagram 35 Country-level disclosure - EITI-supporters vs. non-supporters domestic operations (44 companies)
Average for all companies is 53%
IOCs NOCs
EITI SUPPORTERS NON-EITI SUPPORTERS
Petrobras
Statoil
Pemex
Eni
Exxon
Hess
Repsol
Woodside
BG
BP
Chevron
Conoco
Marathon
Talisman
QatarPet
BHP
Shell
Total AVERAGE = 55%
100%
100%
92%
69%
62%
62%
62%
62%
54%
54%
54%
54%
54%
54%
31%
15%
8%
8%
Lukoil
PDVSA
Rosneft
Gazprom
KazMG
Petronas
Sinopec
SOCAR
Sonangol
Nexen Inc.
ONGC
OMV
Wintershall
CNOOC
Devon
Inpex
PetroChina
Suncor
NIOC
CNPC
SaudiAramco
NNPC
GEPetrol, KPC, SNPC, Sonatrech
AVERAGE = 51%
100%
100%
100%
92%
85%
77%
69%
62%
54%
46%
38%
38%
31%
23%
15%
8%
85%
85%
77%
69%
62%
15%
0%Diagram 36 Country-level disclosure - domestic vs. international reporting multi-country producers (31 companies)
*average scores
IOCs
NOCs
80%
60%
40%
20%
0%0% 20% 40% 60% 80% 100%
inte
rnat
iona
l
domestic
NOCs 45%* IOCs 52%*
IOCs 19%*
NOCs 10%*single-country NOCs 60%
single-country NOCs 50%
ANNEX 5 - DATA TABLES WITH SOURCESSCORES - REPORTING ON ANTI-CORRUPTION PROGRAMMES
question # 1 2 3 4 5 6 7 8 9 10 11 12 13 14 15 16 17 18 19 20 21 22 23 24 25 26 27 28 Σ % score
max. score 2.0 1.0 1.0 1.0 2.0 1.0 0.5 0.5 1.0 1.0 1.5 1.0 1.0 1.0 1.0 1.5 1.5 1.0 1.0 yes 2.0 2.0 1.0 1.0 2.0 2.0 1.0 2.0
BG 2.0 1.0 1.0 1.0 2.0 1.0 0.5 0.5 1.0 1.0 1.0 1.0 1.0 1.0 1.0 1.5 1.5 1.0 1.0 yes 2.0 2.0 1.0 1.0 2.0 2.0 1.0 32.0 93%
BHP 2.0 1.0 1.0 1.0 2.0 1.0 0.5 0.5 1.0 1.0 1.0 1.0 1.0 1.0 1.5 1.5 1.0 yes 2.0 1.0 1.0 1.0 2.0 2.0 1.0 29.0 84%
BP 2.0 1.0 1.0 1.0 1.0 1.0 1.0 1.0 1.0 1.0 1.0 1.0 1.0 1.5 1.5 1.0 yes 2.0 2.0 1.0 1.0 2.0 2.0 1.0 29.0 84%
Chevron 2.0 1.0 1.0 1.0 1.0 1.0 1.5 1.5 1.0 yes 2.0 1.0 1.0 1.0 2.0 2.0 1.0 21.0 61%
CNOOC 2.0 1.0 1.5 no 2.0 1.0 2.0 9.5 28%
CNPC 2.0 1.0 1.5 no 1.0 5.5 16%
Conoco 2.0 1.0 1.0 0.5 0.5 1.0 1.0 1.0 1.0 1.0 1.5 1.5 1.0 yes 2.0 1.0 1.0 2.0 2.0 1.0 23.0 67%
Devon 2.0 1.0 1.0 1.0 0.5 1.0 1.0 1.0 1.0 1.0 1.5 1.5 1.0 yes 2.0 1.0 1.0 1.0 19.5 57%
Eni 2.0 1.0 1.0 1.0 2.0 0.0 0.5 0.5 1.0 1.0 1.0 1.0 1.0 1.0 1.5 1.5 1.0 yes 2.0 1.0 1.0 2.0 2.0 1.0 27.0 78%
Exxon 2.0 1.0 1.0 1.0 2.0 1.0 1.0 1.0 1.0 1.0 1.0 1.0 1.5 1.5 1.0 yes 2.0 1.0 1.0 2.0 2.0 1.0 27.0 78%
Gazprom no 0.0 0%
GEPetrol no 0.0 0%
Hess 2.0 1.0 1.0 2.0 1.0 1.0 1.0 1.0 1.0 1.0 1.5 1.5 1.0 yes 2.0 2.0 1.0 2.0 2.0 1.0 26.0 75%
Inpex 1.0 1.0 1.0 no 3.0 9%
KazMG 1.0 0.5 0.5 0.5 no 2.0 4.5 13%
KPC 2.0 1.0 1.0 1.0 1.0 1.0 1.0 yes 1.0 2.0 11.0 32%
Lukoil 1.0 no 2.0 3.0 9%
Marathon 2.0 1.0 1.0 0.5 1.0 1.0 1.0 1.0 1.0 1.0 1.0 1.5 1.5 1.0 yes 2.0 1.0 1.0 2.0 2.0 1.0 24.5 71%
Nexen Inc. 2.0 1.0 1.0 2.0 1.0 0.5 0.5 1.0 1.0 1.0 1.0 1.0 1.0 1.5 1.5 1.0 yes 2.0 1.0 1.0 1.0 2.0 1.0 26.0 75%
NIOC no 0.0 0%
NNPC no 0.0 0%
OMV 2.0 1.0 1.0 2.0 1.0 0.5 0.5 1.0 1.0 1.0 1.0 1.0 1.0 1.0 1.5 1.5 1.0 no 2.0 1.0 2.0 1.0 25.0 72%
ONGC 2.0 1.0 1.0 1.0 yes 2.0 1.0 1.0 2.0 11.0 32%
PDVSA 2.0 1.0 2.0 1.5 1.0 no 1.0 1.0 9.5 28%
Pemex 2.0 1.0 1.0 2.0 1.0 0.5 1.5 1.0 yes 1.0 2.0 2.0 15.0 43%
Petrobras 2.0 1.0 1.0 1.0 2.0 1.0 0.5 1.0 1.0 1.0 1.0 1.5 1.0 no 1.0 1.0 2.0 2.0 1.0 22.0 64%
PetroChina 1.0 1.0 1.0 1.0 1.0 yes 2.0 1.0 1.0 2.0 1.0 12.0 35%
Petronas 2.0 1.0 1.0 1.0 1.5 1.0 no 2.0 1.0 10.5 30%
QatarPet 2.0 1.0 1.0 1.0 1.0 1.0 1.0 no 1.0 1.0 10.0 29%
Repsol 2.0 1.0 1.0 2.0 0.5 0.5 1.0 1.0 1.0 1.0 1.0 1.0 1.5 1.5 1.0 1.0 no 2.0 1.0 1.0 2.0 2.0 1.0 27.0 78%
Rosneft 1.0 1.0 1.0 1.0 1.0 1.5 1.5 1.0 yes 1.0 1.0 2.0 1.0 14.0 41%
SaudiAramco no 2.0 2.0 6%
Shell 2.0 1.0 1.0 1.0 1.0 0.5 1.0 1.0 1.0 1.0 1.0 1.0 1.0 1.5 1.5 1.0 yes 2.0 1.0 1.0 0.0 2.0 2.0 1.0 26.5 77%
Sinopec 2.0 1.0 1.0 1.0 no 2.0 1.0 2.0 1.0 11.0 32%
SNPC no 0.0 0%
SOCAR no 0.0 0%
Sonangol no 0.0 0%
Sonatrach no 0.0 0%
Statoil 2.0 1.0 1.0 2.0 1.0 0.5 0.5 1.0 1.0 1.0 1.0 1.0 1.0 1.0 1.5 1.5 1.0 yes 2.0 1.0 1.0 2.0 2.0 1.0 28.0 81%
Suncor 2.0 1.0 0.5 0.5 1.0 1.0 1.0 1.0 1.0 1.0 1.0 1.5 1.5 1.0 yes 2.0 1.0 1.0 1.0 1.0 21.0 61%
Talisman 2.0 1.0 1.0 0.5 1.0 1.0 1.0 0.5 1.0 1.5 1.5 1.0 yes 2.0 1.0 1.0 2.0 2.0 21.0 61%
Total 2.0 1.0 1.0 1.0 1.0 0.5 0.5 1.0 1.0 1.0 1.0 1.0 1.0 1.5 1.5 1.0 no 1.0 2.0 2.0 1.0 23.0 67%
Wintershall 2.0 1.0 1.0 1.0 1.0 1.0 1.0 1.5 1.0 yes 2.0 1.0 2.0 15.5 45%
Woodside 2.0 1.0 1.0 1.0 0.5 1.0 1.0 1.0 1.0 1.0 1.0 1.5 1.5 1.0 yes 2.0 1.0 1.0 2.0 2.0 1.0 24.5 71%
72 Transparency International 73Promoting Revenue Transparency
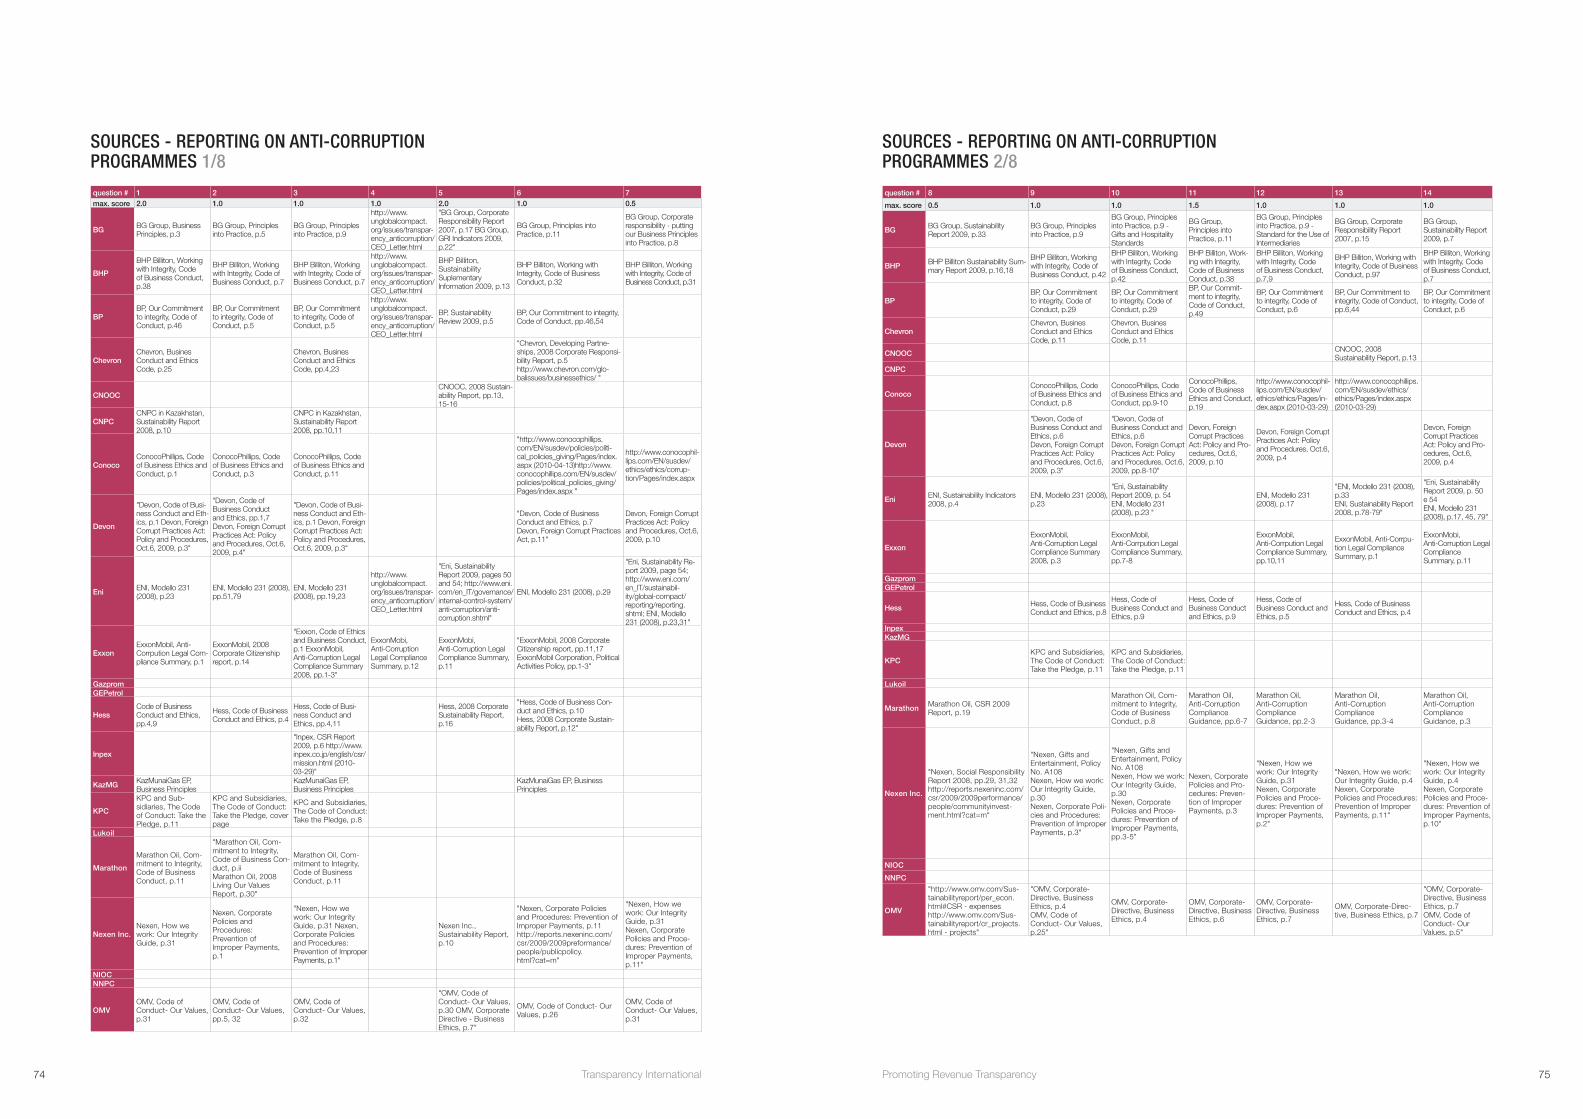
SOURCES - REPORTING ON ANTI-CORRUPTION PROGRAMMES 1/8
question # 1 2 3 4 5 6 7max. score 2.0 1.0 1.0 1.0 2.0 1.0 0.5
BG BG Group, Business Principles, p.3
BG Group, Principles into Practice, p.5
BG Group, Principles into Practice, p.9
http://www.unglobalcompact.org/issues/transpar-ency_anticorruption/CEO_Letter.html
"BG Group, Corporate Responsibility Report 2007, p.17 BG Group, GRI Indicators 2009, p.22"
BG Group, Principles into Practice, p.11
BG Group, Corporate responsibility - putting our Business Principles into Practice, p.8
BHP
BHP Billiton, Working with Integrity, Code of Business Conduct, p.38
BHP Billiton, Working with Integrity, Code of Business Conduct, p.7
BHP Billiton, Working with Integrity, Code of Business Conduct, p.7
http://www.unglobalcompact.org/issues/transpar-ency_anticorruption/CEO_Letter.html
BHP Billiton, Sustainability Suplementary Information 2009, p.13
BHP Billiton, Working with Integrity, Code of Business Conduct, p.32
BHP Billiton, Working with Integrity, Code of Business Conduct, p.31
BP BP, Our Commitment to integrity, Code of Conduct, p.46
BP, Our Commitment to integrity, Code of Conduct, p.5
BP, Our Commitment to integrity, Code of Conduct, p.5
http://www.unglobalcompact.org/issues/transpar-ency_anticorruption/CEO_Letter.html
BP, Sustainability Review 2009, p.5
BP, Our Commitment to integrity, Code of Conduct, pp.46,54
Chevron Chevron, Busines Conduct and Ethics Code, p.25
Chevron, Busines Conduct and Ethics Code, pp.4,23
"Chevron, Developing Partne-ships, 2008 Corporate Responsi-bility Report, p.5 http://www.chevron.com/glo-balissues/businessethics/ "
CNOOCCNOOC, 2008 Sustain-ability Report, pp.13, 15-16
CNPCCNPC in Kazakhstan, Sustainability Report 2008, p.10
CNPC in Kazakhstan, Sustainability Report 2008, pp.10,11
ConocoConocoPhillips, Code of Business Ethics and Conduct, p.1
ConocoPhillips, Code of Business Ethics and Conduct, p.3
ConocoPhillips, Code of Business Ethics and Conduct, p.11
"http://www.conocophillips.com/EN/susdev/policies/politi-cal_policies_giving/Pages/index.aspx (2010-04-13)http://www.conocophillips.com/EN/susdev/policies/political_policies_giving/Pages/index.aspx "
http://www.conocophil-lips.com/EN/susdev/ethics/ethics/corrup-tion/Pages/index.aspx
Devon
"Devon, Code of Busi-ness Conduct and Eth-ics, p.1 Devon, Foreign Corrupt Practices Act: Policy and Procedures, Oct.6, 2009, p.3"
"Devon, Code of Business Conduct and Ethics, pp.1,7 Devon, Foreign Corrupt Practices Act: Policy and Procedures, Oct.6, 2009, p.4"
"Devon, Code of Busi-ness Conduct and Eth-ics, p.1 Devon, Foreign Corrupt Practices Act: Policy and Procedures, Oct.6, 2009, p.3"
"Devon, Code of Business Conduct and Ethics, p.7 Devon, Foreign Corrupt Practices Act, p.11"
Devon, Foreign Corrupt Practices Act: Policy and Procedures, Oct.6, 2009, p.10
Eni ENI, Modello 231 (2008), p.23
ENI, Modello 231 (2008), pp.51,79
ENI, Modello 231 (2008), pp.19,23
http://www.unglobalcompact.org/issues/transpar-ency_anticorruption/CEO_Letter.html
"Eni, Sustainability Report 2009, pages 50 and 54; http://www.eni.com/en_IT/governance/internal-control-system/anti-corruption/anti-corruption.shtml"
ENI, Modello 231 (2008), p.29
"Eni, Sustainability Re-port 2009, page 54; http://www.eni.com/en_IT/sustainabil-ity/global-compact/reporting/reporting.shtml; ENI, Modello 231 (2008), p.23,31"
ExxonExxonMobil, Anti-Corrpution Legal Com-pliance Summary, p.1
ExxonMobil, 2008 Corporate Citizenship report, p.14
"Exxon, Code of Ethics and Business Conduct, p.1 ExxonMobil, Anti-Corruption Legal Compliance Summary 2008, pp.1-3"
ExxonMobi, Anti-Corruption Legal Compliance Summary, p.12
ExxonMobi, Anti-Corruption Legal Compliance Summary, p.11
"ExxonMobil, 2008 Corporate Citizenship report, pp.11,17 ExxonMobil Corporation, Political Activities Policy, pp.1-3"
GazpromGEPetrol
Hess Code of Business Conduct and Ethics, pp.4,9
Hess, Code of Business Conduct and Ethics, p.4
Hess, Code of Busi-ness Conduct and Ethics, pp.4,11
Hess, 2008 Corporate Sustainability Report, p.16
"Hess, Code of Business Con-duct and Ethics, p.10 Hess, 2008 Corporate Sustain-ability Report, p.12"
Inpex
"Inpex, CSR Report 2009, p.6 http://www.inpex.co.jp/english/csr/mission.html (2010-03-29)"
KazMG KazMunaiGas EP, Business Principles
KazMunaiGas EP, Business Principles
KazMunaiGas EP, Business Principles
KPC
KPC and Sub-sidiaries, The Code of Conduct: Take the Pledge, p.11
KPC and Subsidiaries, The Code of Conduct: Take the Pledge, cover page
KPC and Subsidiaries, The Code of Conduct: Take the Pledge, p.8
Lukoil
Marathon
Marathon Oil, Com-mitment to Integrity, Code of Business Conduct, p.11
"Marathon Oil, Com-mitment to Integrity, Code of Business Con-duct, p.ii Marathon Oil, 2008 Living Our Values Report, p.30"
Marathon Oil, Com-mitment to Integrity, Code of Business Conduct, p.11
Nexen Inc.Nexen, How we work: Our Integrity Guide, p.31
Nexen, Corporate Policies and Procedures: Prevention of Improper Payments, p.1
"Nexen, How we work: Our Integrity Guide, p.31 Nexen, Corporate Policies and Procedures: Prevention of Improper Payments, p.1"
Nexen Inc., Sustainability Report, p.10
"Nexen, Corporate Policies and Procedures: Prevention of Improper Payments, p.11 http://reports.nexeninc.com/csr/2009/2009preformance/people/publicpolicy.html?cat=m"
"Nexen, How we work: Our Integrity Guide, p.31 Nexen, Corporate Policies and Proce-dures: Prevention of Improper Payments, p.11"
NIOCNNPC
OMVOMV, Code of Conduct- Our Values, p.31
OMV, Code of Conduct- Our Values, pp.5, 32
OMV, Code of Conduct- Our Values, p.32
"OMV, Code of Conduct- Our Values, p.30 OMV, Corporate Directive - Business Ethics, p.7"
OMV, Code of Conduct- Our Values, p.26
OMV, Code of Conduct- Our Values, p.31
SOURCES - REPORTING ON ANTI-CORRUPTION PROGRAMMES 2/8
question # 8 9 10 11 12 13 14
max. score 0.5 1.0 1.0 1.5 1.0 1.0 1.0
BG BG Group, Sustainability Report 2009, p.33
BG Group, Principles into Practice, p.9
BG Group, Principles into Practice, p.9 - Gifts and Hospitality Standards
BG Group, Principles into Practice, p.11
BG Group, Principles into Practice, p.9 - Standard for the Use of Intermediaries
BG Group, Corporate Responsibility Report 2007, p.15
BG Group, Sustainability Report 2009, p.7
BHP BHP Billiton Sustainability Sum-mary Report 2009, p.16,18
BHP Billiton, Working with Integrity, Code of Business Conduct, p.42
BHP Billiton, Working with Integrity, Code of Business Conduct, p.42
BHP Billiton, Work-ing with Integrity, Code of Business Conduct, p.38
BHP Billiton, Working with Integrity, Code of Business Conduct, p.7,9
BHP Billiton, Working with Integrity, Code of Business Conduct, p.97
BHP Billiton, Working with Integrity, Code of Business Conduct, p.7
BP BP, Our Commitment to integrity, Code of Conduct, p.29
BP, Our Commitment to integrity, Code of Conduct, p.29
BP, Our Commit-ment to integrity, Code of Conduct, p.49
BP, Our Commitment to integrity, Code of Conduct, p.6
BP, Our Commitment to integrity, Code of Conduct, pp.6,44
BP, Our Commitment to integrity, Code of Conduct, p.6
Chevron Chevron, Busines Conduct and Ethics Code, p.11
Chevron, Busines Conduct and Ethics Code, p.11
CNOOC CNOOC, 2008 Sustainability Report, p.13
CNPC
ConocoConocoPhillips, Code of Business Ethics and Conduct, p.8
ConocoPhillips, Code of Business Ethics and Conduct, pp.9-10
ConocoPhillips, Code of Business Ethics and Conduct, p.19
http://www.conocophil-lips.com/EN/susdev/ethics/ethics/Pages/in-dex.aspx (2010-03-29)
http://www.conocophillips.com/EN/susdev/ethics/ethics/Pages/index.aspx (2010-03-29)
Devon
"Devon, Code of Business Conduct and Ethics, p.6 Devon, Foreign Corrupt Practices Act: Policy and Procedures, Oct.6, 2009, p.3"
"Devon, Code of Business Conduct and Ethics, p.6 Devon, Foreign Corrupt Practices Act: Policy and Procedures, Oct.6, 2009, pp.8-10"
Devon, Foreign Corrupt Practices Act: Policy and Pro-cedures, Oct.6, 2009, p.10
Devon, Foreign Corrupt Practices Act: Policy and Procedures, Oct.6, 2009, p.4
Devon, Foreign Corrupt Practices Act: Policy and Pro-cedures, Oct.6, 2009, p.4
Eni ENI, Sustainability Indicators 2008, p.4
ENI, Modello 231 (2008), p.23
"Eni, Sustainability Report 2009, p. 54 ENI, Modello 231 (2008), p.23 "
ENI, Modello 231 (2008), p.17
"ENI, Modello 231 (2008), p.33 ENI, Sustainability Report 2008, p.78-79"
"Eni, Sustainability Report 2009, p. 50 e 54 ENI, Modello 231 (2008), p.17, 45, 79"
Exxon
ExxonMobil, Anti-Corruption Legal Compliance Summary 2008, p.3
ExxonMobil, Anti-Corrpution Legal Compliance Summary, pp.7-8
ExxonMobil, Anti-Corrpution Legal Compliance Summary, pp.10,11
ExxonMobil, Anti-Corrpu-tion Legal Compliance Summary, p.1
ExxonMobi, Anti-Corruption Legal Compliance Summary, p.11
GazpromGEPetrol
Hess Hess, Code of Business Conduct and Ethics, p.8
Hess, Code of Business Conduct and Ethics, p.9
Hess, Code of Business Conduct and Ethics, p.9
Hess, Code of Business Conduct and Ethics, p.5
Hess, Code of Business Conduct and Ethics, p.4
Inpex KazMG
KPCKPC and Subsidiaries, The Code of Conduct: Take the Pledge, p.11
KPC and Subsidiaries, The Code of Conduct: Take the Pledge, p.11
Lukoil
Marathon Marathon Oil, CSR 2009 Report, p.19
Marathon Oil, Com-mitment to Integrity, Code of Business Conduct, p.8
Marathon Oil, Anti-Corruption Compliance Guidance, pp.6-7
Marathon Oil, Anti-Corruption Compliance Guidance, pp.2-3
Marathon Oil, Anti-Corruption Compliance Guidance, pp.3-4
Marathon Oil, Anti-Corruption Compliance Guidance, p.3
Nexen Inc.
"Nexen, Social Responsibility Report 2008, pp.29, 31,32 http://reports.nexeninc.com/csr/2009/2009performance/people/communityinvest-ment.html?cat=m"
"Nexen, Gifts and Entertainment, Policy No. A108 Nexen, How we work: Our Integrity Guide, p.30 Nexen, Corporate Poli-cies and Procedures: Prevention of Improper Payments, p.3"
"Nexen, Gifts and Entertainment, Policy No. A108 Nexen, How we work: Our Integrity Guide, p.30 Nexen, Corporate Policies and Proce-dures: Prevention of Improper Payments, pp.3-5"
Nexen, Corporate Policies and Pro-cedures: Preven-tion of Improper Payments, p.3
"Nexen, How we work: Our Integrity Guide, p.31 Nexen, Corporate Policies and Proce-dures: Prevention of Improper Payments, p.2"
"Nexen, How we work: Our Integrity Guide, p.4 Nexen, Corporate Policies and Procedures: Prevention of Improper Payments, p.11"
"Nexen, How we work: Our Integrity Guide, p.4 Nexen, Corporate Policies and Proce-dures: Prevention of Improper Payments, p.10"
NIOC
NNPC
OMV
"http://www.omv.com/Sus-tainabilityreport/per_econ.html#CSR - expenses http://www.omv.com/Sus-tainabilityreport/cr_projects.html - projects"
"OMV, Corporate-Directive, Business Ethics, p.4 OMV, Code of Conduct- Our Values, p.25"
OMV, Corporate-Directive, Business Ethics, p.4
OMV, Corporate-Directive, Business Ethics, p.6
OMV, Corporate-Directive, Business Ethics, p.7
OMV, Corporate-Direc-tive, Business Ethics, p.7
"OMV, Corporate-Directive, Business Ethics, p.7 OMV, Code of Conduct- Our Values, p.5"
74 Transparency International 75Promoting Revenue Transparency

SOURCES - REPORTING ON ANTI-CORRUPTION PROGRAMMES 3/8
question # 15 16 17 18 19 20 21max. score 1.0 1.5 1.5 1.0 1.0 1.0 2.0
BG
"BG Group, Principles into Practice, p.1 BG Group, Sustainabil-ity Report 2009, p.1"
BG Group, Principles into Practice, p.5
BG Group, Sustainability Report 2009, p.7
BG Group, Sustainability Report 2009, p.7
BG Group, Principles into Practice, p.5
http://www.bg-group.com/sustainability/SpeakUp/Pages/SpeakUpPolicy.aspx (2010-03-26)
http://www.bg-group.com/sustainability /SpeakUp/Pages/Speak UpPolicy.aspx (2010-03-26)
BHP
"BHP Billiton, Working with Integrity, Code of Business Conduct, p.6 BHP Billiton, Sustain-ability Summary Report 2009, pp.2-3"
BHP Billiton, Sustainability Suplementary Information 2009, p.12
BHP Billiton, Sustainability Suplementary Information 2009, p.12
BHP Billiton, Working with Integrity, Code of Business Conduct, p.7
BHP Billiton, Working with Integrity, Code of Business Conduct, p.11
BHP Billiton, Working with Integrity, Code of Business Conduct, p.11
BP BP, Our Commitment to integrity, Code of Conduct, p.1
BP, Our Commitment to integrity, Code of Conduct, p.5
"BP, Our Commitment to integrity, Code of Conduct, p.11 BP, Sustainability Review 2008, p.20"
BP, Our Commitment to integrity, Code of Conduct, pp.4,6,48
BP, Our Commitment to integrity, Code of Conduct, p.7
BP, Our Commitment to integrity, Code of Conduct, p.9
Chevron Chevron, Busines Conduct and Ethics Code, p.25
Chevron, Busines Conduct and Ethics Code, p.5 (intranet links)
http://www.chevron.com/globalissues/businessethics/ (2010-03-26)
Chevron, Busines Conduct and Ethics Code, p.4
Chevron, Busines Conduct and Ethics Code, p.4
Chevron, Busines Conduct and Ethics Code, p.4
CNOOC CNOOC, 2008 Sus-tainability Report, p.14
CNPCCNPC, Corporate Social Responsibility Report 2007, p.7
ConocoConocoPhillips, Code of Business Ethics and Conduct, p.1
"ConocoPhillips, Code of Business Ethics and Conduct, pp.8-21 https://secure.ethicspoint. com/domain/media/en/gui/26697/code.pdf http://www.conocophil-lips.com/EN/susdev/ethics/ethics/corruption/Pages/index.aspx"
http://www.cono-cophillips.com/EN/susdev/ethics/ethics/Pages/index.aspx (2010-03-29)
ConocoPhillips, Code of Business Ethics and Conduct, p.2
ConocoPhillips, Code of Busi-ness Ethics and Conduct, p.2
ConocoPhillips, Code of Business Ethics and Conduct, p.22
Devondevon, 2008/2009 Corporate Responsi-bility Report, pp.2-3
Devon, Foreign Corrupt Practices Act: Policy & Procedures, Oct.6, 2009, pp.3, 5-16 (FPCA Guide)
Devon, Foreign Corrupt Practices Act: Policy and Procedures, Oct.6, 2009, p.4
Devon, Code of Business Conduct and Ethics, p.1
Devon, Code of Business Conduct and Ethics, p.1
Devon, Code of Business Conduct and Ethics, p.2
Eni Eni, Sustainability reprot 2009, p.ii
"Eni, Sustainability Re-port 2009, p. 50 e 54 ENI, Modello 231 (2008), p.55, 77-79; http://www.eni.com/en_IT/governance/internal-control-system/anti-corruption/anti-corruption.shtml"
ENI, Modello 231 (2008), pp.55, 77-79
ENI, Modello 231 (2008), pp.17,21 ENI, Modello 231 (2008), p.53 ENI, Modello 231 (2008),
p.53
ExxonExxonMobil, 2008 Corporate Citizenship report, p.1
"ExxonMobil, Anti-Corruption Legal Compliance Sum-mary 2008, p.4 - http://www.exxonmobil.com/Corporate/about_opera-tions_sbc.aspx (2010-04-14) - http://www.exx-onmobil.com/corporate/about_operations_mgmt.aspx (2010-04-14)"
"ExxonMobil, 2008 Corporate Citizenship report, p.15 ExxonMobil, Anti-Corruption Legal Compliance Summary 2008, p.5"
"Exxon, Code of Ethics and Business Conduct, p.1 - http://www.exxon-mobil.com/Corporate/about_operations_sbc.aspx (2010-04-14)"
"Exxon, Code of Ethics and Business Conduct, p.3 http://www.exxonmobil.com/corporate/about_op-erations_sbc_procedures.aspx (2010--4-14)"
"Exxon, Code of Ethics and Business Conduct, p.4 - http://www.exxonmobil.com/corporate/about_opera-tions_sbc_procedures.aspx (2010-04-14)"
GazpromGEPetrol
Hess Hess, Code of Busi-ness Conduct and Ethics, p.1
Hess, Code of Business Conduct and Ethics, pp. 6-22
Hess, 2008 Corporate Sustainability Report, p.12
Hess, Code of Business Conduct and Ethics, p.4
Hess, Code of Business Conduct and Ethics, p.23
"Hess, Code of Business Conduct and Ethics, p.24 - Hess, 2008 Corporate Sustainability Report, p.12"
Inpex
"Inpex, CSR Report 2009, pp.4-5 - http://www.inpex.co.jp/english/csr/message.html (2010-04-14)"
"Inpex, CSR Report 2009, p.6 - http://www.inpex.co.jp/english/csr/compliance.html (2010-04-14)"
KazMG KazMunaiGas EP, Business Principles
KPCKPC and Subsidiaries, The Code of Conduct: Take the Pledge, p.ii
KPC and Subsidiaries, The Code of Conduct: Take the Pledge, p.iv
KPC and Subsidiaries, The Code of Conduct: Take the Pledge, pp.8,10
LukoilLukoil, 2007-2008 Sustainability Report, pp.2-3
Marathon
"Marathon Oil, Com-mitment to Integrity, Code of Business Conduct, p.iii Marathon Oil, 2008 Living Our Values Report, pp.4-5"
Marathon Oil, Commit-ment to Integrity, Code of Business Conduct, p.14
"Marathon Oil, Com-mitment to Integrity, Code of Business Conduct, p.1 Marathon Oil, 2008 Living Our Values Report, p.28"
Marathon Oil, Com-mitment to Integrity, Code of Business Conduct, p.ii
"Marathon Oil, Commitment to Integrity, Code of Business Conduct, p.3 http://www.marathon.com/About_Marathon/Our_Values/Ethics_and_Integrity/Whistle-blower_Policy/ (2010-03-29)"
"Marathon Oil, Com-mitment to Integrity, Code of Business Con-duct, p.3 - http://www.marathon.com/About_Marathon/Our_Values/Ethics_and_Integrity/Whistleblower_Policy/"
Nexen Inc.Nexen, How we work: Our Integrity Guide, p.1
http://www.nexeninc.com/Governance/CompanyPolicies.aspx (2010-03-30)
"Nexen, Responsible Care: SE & SR requirements 2009, p.64 - Nexen, How we work: Our Integrity Guide, p.4"
"Nexen, How we work: Our Integrity Guide, p.4 - Nexen, Corporate Policies and Procedures: Prevention of Improper Payments, p.2"
"Nexen, Responsible Care: SE & SR requirements 2009, p.64 Nexen, How we work: Our Integrity Guide, p.36"
Nexen, How we work: Our Integrity Guide, pp.4,38
NIOCNNPC
OMVOMV, Code of Con-duct- Our Values, pp.2-3
OMV, Corporate-Directive, Business Ethics, p.7
OMV, Corporate-Directive, Business Ethics, p.1
OMV, Code of Con-duct- Our Values, p.32
SOURCES - REPORTING ON ANTI-CORRUPTION PROGRAMMES 4/8
question # 22 23 24 25 26 27 28max. score 2.0 1.0 1.0 2.0 2.0 1.0 2.0
BG BG Group, Sustain-ability Report 2009, p.8
http://www.bg-group.com/sustainability/ SpeakUp/Pages/SpeakUpPolicy.aspx (2010-03-26)
BG Group, Sustainabil-ity Report 2009, p.8
"BG Group, Corporate Responsibility Report 2007, p.16 http://www.ipieca.org/ipieca_info/co_members.php"
EITI home page BG Group, Sustainability Report 2009, p.8
BHP
BHP Billiton, Working with Integrity, Code of Business Conduct, p.13
BHP Billiton, Working with Integrity, Code of Business Conduct, p.12
BHP Billiton Sustain-ability Summary Report 2009, p.7
"BHP Billiton, Working with Integrity, Code of Business Conduct, p.7 http://www.weforum.org/en/initiatives/paci/Signatories/index.htm"
EITI home page
"BHP Billiton, Working with Integrity, Code of Business Conduct, p.10 BHP Billiton Sustainability Sum-mary Report 2009, p.6"
BP
"BP, Our Commitment to integrity, Code of Conduct, p.4 BP, Sustainability Review 2008, p.6"
"BP, Our Commitment to integrity, Code of Conduct, p.8 BP, Sustainability Review 2008, p.20"
BP, Sustainability Re-view 2008, pp.6, 20
"http://www.bp.com/extend-edsectiongenericarticle.do?categoryId=9028531&contentId=7052007 (2010-04-13) http://www.ipieca.org/ipieca_info/co_members.php http://www.transparency.org/support_us/support"
EITI home page
"BP, Our Commitment to integrity, Code of Conduct, p.11 BP, Sustainability Review 2008, p.20"
Chevron Chevron, Busines Conduct and Ethics Code, pp.3,4
Chevron, Busines Conduct and Ethics Code, p.4
Chevron, Developing Partneships, 2008 Corporate Responsibil-ity Report, p.5
http://www.ipieca.org/ipieca_info/co_members.php EITI home page Chevron, Busines Conduct and
Ethics Code, pp.4,9
CNOOCCNOOC, 2008 Sustainability Report, pp.13,14
"CNOOC, 2008 Sus-tainability Report, p.14 http://www.ipieca.org/ipieca_info/co_mem-bers.php"
CNOOC, 2008 Annual report, p.4 EITI home page
CNPCCNPC, Corporate Social Responsibility Report 2007, p.7
EITI home page
ConocoConocoPhillips, Code of Business Ethics and Conduct, p.1
ConocoPhillips, Code of Business Ethics and Conduct, p.22
http://www.ipieca.org/ipieca_info/co_members.php EITI home page
http://www.conocophillips.com/EN/susdev/ethics/ethics/Pages/index.aspx (2010-03-29)
DevonDevon, Code of Business Conduct and Ethics, p.8
Devon, Code of Business Conduct and Ethics, p.1 EITI home page
"Devon, Code of Business Conduct and Ethics, p.9 Devon, Foreign Corrupt Practices Act: Policy and Procedures, Oct.6, 2009, p.13"
Eni ENI, Modello 231 (2008), pp.57, 85-89
ENI, Modello 231 (2008), p.53
ENI, Sustainability Report 2008, p.31
"ENI, 2009 Sustainability Report, p.18 http://www.unglobalcompact.org/participants/search http://www.ipieca.org/ipieca_info/co_members.php"
EITI home page ENI, Modello 231 (2008), p.57
Exxon
"Exxon, Code of Ethics and Business Conduct, p.4 http://www.exxon-mobil.com/corporate/about_operations_sbc_procedures.aspx (2010-04-14)"
"Exxon, Code of Ethics and Business Conduct, p.3 http://www.exxonmobil.com/corporate/about_op-erations_sbc_procedures.aspx (2010--4-14)"
"http://www.exxonmobil.com/Corporate/about_opera-tions_sbc.aspx (2010-04-14) http://www.exxonmobil.com/corporate/about_operations_mgmt.aspx (2010-04-14) http://www.ipieca.org/ipieca_info/co_members.php"
EITI home page ExxonMobil, 2008 Corporate Citizenship report, p.15
Gazprom EITI home pageGEPetrol EITI home page
Hess
"Hess, Code of Busi-ness Conduct and Ethics, p.23 Hess, 2008 Corporate Sustainability Report, p.12"
"Hess, Code of Business Conduct and Ethics, p.23 http://phx.corporate-ir.net/phoenix.zhtml?c=101801&p=irol-govHighlights (2010-03-29)"
"Hess, 2008 Corporate Sustainability Report, p.3 http://www.ipieca.org/ipieca_info/co_members.php"
EITI home pagehttp://phx.corporate-ir.net/phoenix.zhtml?c=101801&p=irol-govHighlights (2010-03-29)
Inpex EITI home page
KazMG JSC NC KazMunaiGas, 2007 Annual Report, p.150 EITI home page
KPC
KPC and Sub-sidiaries, The Code of Conduct: Take the Pledge, p.iv
"http://www.weforum.org/en/initiatives/paci/Signato-ries/index.htm http://www.ipieca.org/ipieca_info/co_members.php"
EITI home page
Lukoil Lukoil, 2007-2008 Sustain-ability Report, p.3 EITI home page
Marathon
Marathon Oil, Com-mitment to Integrity, Code of Business Conduct, p.3
"Marathon Oil, Commit-ment to Integrity, Code of Business Conduct, pp.3,16 Marathon Oil, 2008 Liv-ing Our Values Report, p.29"
"Marathon Oil, 2008 Living Our Values Report, p.47 http://www.ipieca.org/ipieca_info/co_members.php"
EITI home page
"http://www.marathon.com/About_Marathon/Our_Values/Ethics_and_Integrity/Rais-ing_Awareness/ Marathon Oil, 2008 Living Our Values Report, p.28"
Nexen Inc.
Nexen, Corporate Policies and Proce-dures: Prevention of Improper Payments, p.14
Nexen, How we work: Our Integrity Guide, pp.34-38
Nexen, 2008 Sustainability Report, pp.12-13
"http://www.unglobalcom-pact.org/participants/search - http://www.ipieca.org/ipieca_info/co_mem-bers.php"
EITI home pageNexen, Corporate Policies and Procedures: Prevention of Improper Payments, pp.12,14
NIOC EITI home pageNNPC EITI home page
OMV OMV, 2009 Sustain-ability Report, p.52
OMV, 2009 Sustainability Report, p.52
"OMV, Code of Conduct- Our Values, pp.8-9 OMV, 2009 Sustainability Report, p.3 - http://www.ipieca.org/ipieca_info/co_members.php"
EITI home page OMV, Corporate Directive - Business Ethics, p.1
76 Transparency International 77Promoting Revenue Transparency
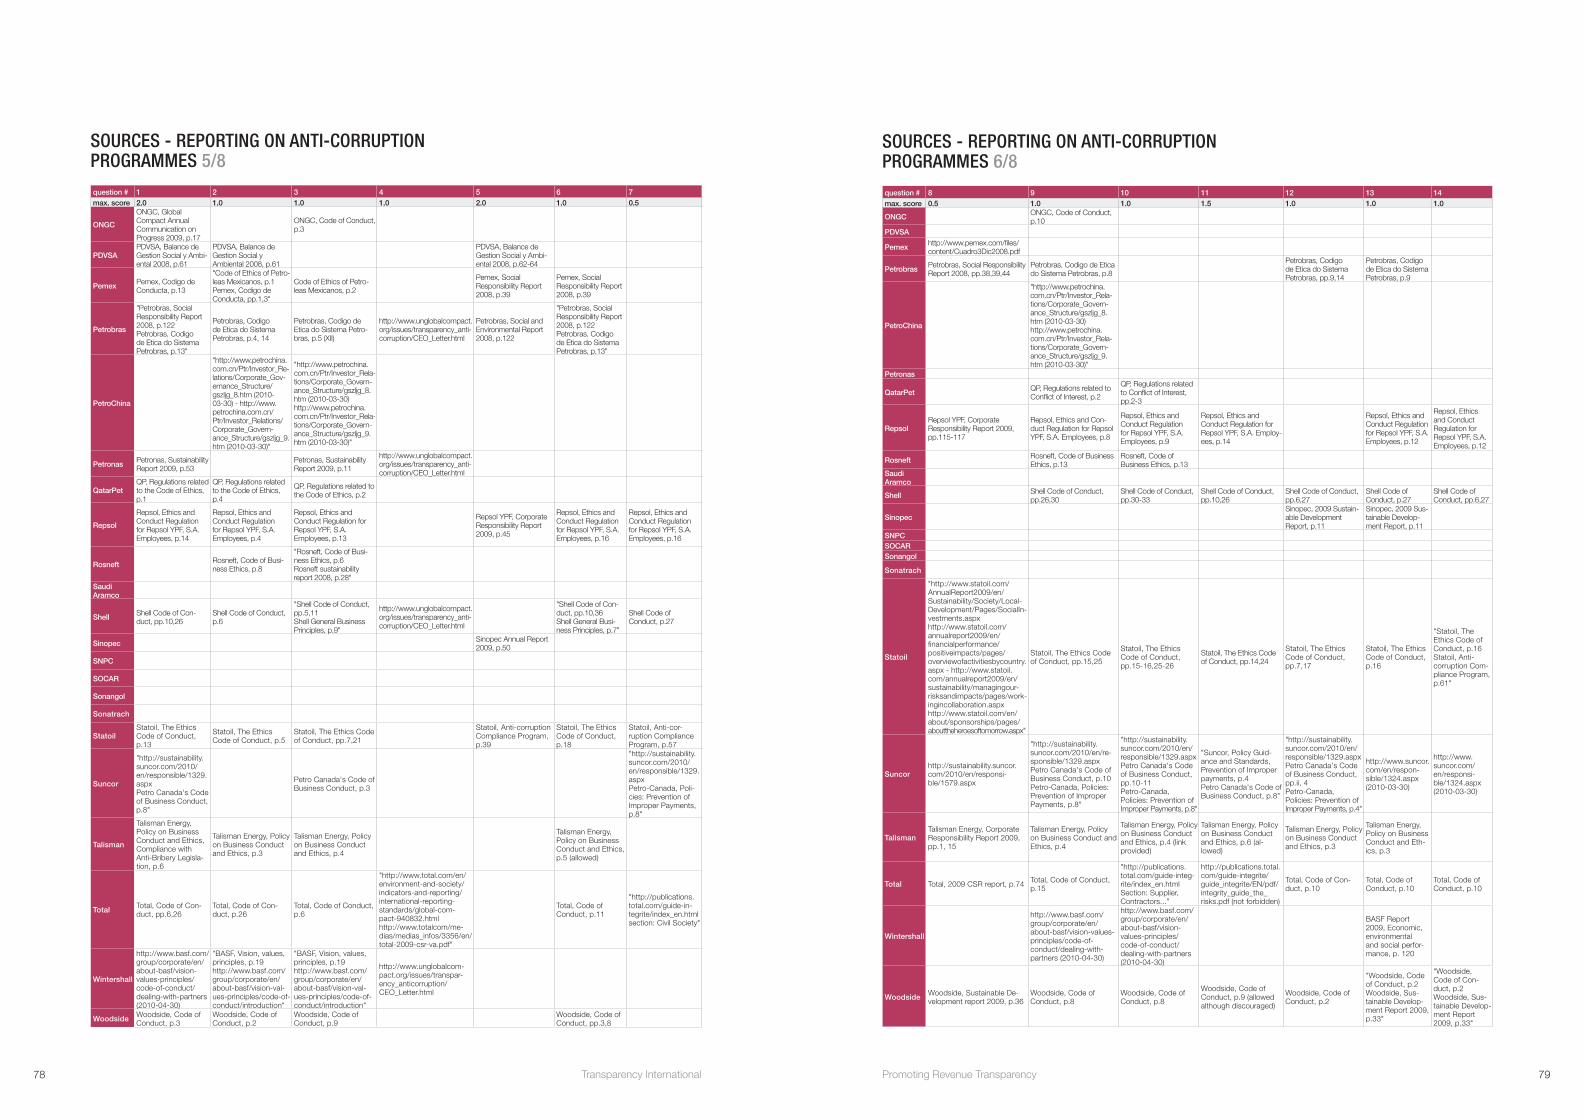
SOURCES - REPORTING ON ANTI-CORRUPTION PROGRAMMES 5/8
question # 1 2 3 4 5 6 7max. score 2.0 1.0 1.0 1.0 2.0 1.0 0.5
ONGC
ONGC, Global Compact Annual Communication on Progress 2009, p.17
ONGC, Code of Conduct, p.3
PDVSAPDVSA, Balance de Gestion Social y Ambi-ental 2008, p.61
PDVSA, Balance de Gestion Social y Ambiental 2008, p.61
PDVSA, Balance de Gestion Social y Ambi-ental 2008, p.62-64
Pemex Pemex, Codigo de Conducta, p.13
"Code of Ethics of Petro-leas Mexicanos, p.1 Pemex, Codigo de Conducta, pp.1,3"
Code of Ethics of Petro-leas Mexicanos, p.2
Pemex, Social Responsibility Report 2008, p.39
Pemex, Social Responsibility Report 2008, p.39
Petrobras
"Petrobras, Social Responsibility Report 2008, p.122 Petrobras, Codigo de Etica do Sistema Petrobras, p.13"
Petrobras, Codigo de Etica do Sistema Petrobras, p.4, 14
Petrobras, Codigo de Etica do Sistema Petro-bras, p.5 (XII)
http://www.unglobalcompact.org/issues/transparency_anti-corruption/CEO_Letter.html
Petrobras, Social and Environmental Report 2008, p.122
"Petrobras, Social Responsibility Report 2008, p.122 Petrobras, Codigo de Etica do Sistema Petrobras, p.13"
PetroChina
"http://www.petrochina.com.cn/Ptr/Investor_Re-lations/Corporate_Gov-ernance_Structure/gszljg_8.htm (2010-03-30) - http://www.petrochina.com.cn/Ptr/Investor_Relations/Corporate_Govern-ance_Structure/gszljg_9.htm (2010-03-30)"
"http://www.petrochina.com.cn/Ptr/Investor_Rela-tions/Corporate_Govern-ance_Structure/gszljg_8.htm (2010-03-30) http://www.petrochina.com.cn/Ptr/Investor_Rela-tions/Corporate_Govern-ance_Structure/gszljg_9.htm (2010-03-30)"
Petronas Petronas, Sustainability Report 2009, p.53
Petronas, Sustainability Report 2009, p.11
http://www.unglobalcompact.org/issues/transparency_anti-corruption/CEO_Letter.html
QatarPetQP, Regulations related to the Code of Ethics, p.1
QP, Regulations related to the Code of Ethics, p.4
QP, Regulations related to the Code of Ethics, p.2
Repsol
Repsol, Ethics and Conduct Regulation for Repsol YPF, S.A. Employees, p.14
Repsol, Ethics and Conduct Regulation for Repsol YPF, S.A. Employees, p.4
Repsol, Ethics and Conduct Regulation for Repsol YPF, S.A. Employees, p.13
Repsol YPF, Corporate Responsibility Report 2009, p.45
Repsol, Ethics and Conduct Regulation for Repsol YPF, S.A. Employees, p.16
Repsol, Ethics and Conduct Regulation for Repsol YPF, S.A. Employees, p.16
Rosneft Rosneft, Code of Busi-ness Ethics, p.8
"Rosneft, Code of Busi-ness Ethics, p.6 Rosneft sustainability report 2008, p.28"
Saudi Aramco
Shell Shell Code of Con-duct, pp.10,26
Shell Code of Conduct, p.6
"Shell Code of Conduct, pp.5,11 Shell General Business Principles, p.9"
http://www.unglobalcompact.org/issues/transparency_anti-corruption/CEO_Letter.html
"Shell Code of Con-duct, pp.10,36 Shell General Busi-ness Principles, p.7"
Shell Code of Conduct, p.27
Sinopec Sinopec Annual Report 2009, p.50
SNPC
SOCAR
Sonangol
Sonatrach
StatoilStatoil, The Ethics Code of Conduct, p.13
Statoil, The Ethics Code of Conduct, p.5
Statoil, The Ethics Code of Conduct, pp.7,21
Statoil, Anti-corruption Compliance Program, p.39
Statoil, The Ethics Code of Conduct, p.18
Statoil, Anti-cor-ruption Compliance Program, p.57
Suncor
"http://sustainability.suncor.com/2010/en/responsible/1329.aspx Petro Canada's Code of Business Conduct, p.8"
Petro Canada's Code of Business Conduct, p.3
"http://sustainability.suncor.com/2010/en/responsible/1329.aspx Petro-Canada, Poli-cies: Prevention of Improper Payments, p.8"
Talisman
Talisman Energy, Policy on Business Conduct and Ethics, Compliance with Anti-Bribery Legisla-tion, p.6
Talisman Energy, Policy on Business Conduct and Ethics, p.3
Talisman Energy, Policy on Business Conduct and Ethics, p.4
Talisman Energy, Policy on Business Conduct and Ethics, p.5 (allowed)
Total Total, Code of Con-duct, pp.6,26
Total, Code of Con-duct, p.26
Total, Code of Conduct, p.6
"http://www.total.com/en/environment-and-society/indicators-and-reporting/international-reporting-standards/global-com-pact-940832.html http://www.totalcom/me-dias/medias_infos/3356/en/total-2009-csr-va.pdf"
Total, Code of Conduct, p.11
"http://publications.total.com/guide-in-tegrite/index_en.html section: Civil Society"
Wintershall
http://www.basf.com/group/corporate/en/about-basf/vision-values-principles/code-of-conduct/dealing-with-partners (2010-04-30)
"BASF, Vision, values, principles, p.19 http://www.basf.com/group/corporate/en/about-basf/vision-val-ues-principles/code-of-conduct/introduction"
"BASF, Vision, values, principles, p.19 http://www.basf.com/group/corporate/en/about-basf/vision-val-ues-principles/code-of-conduct/introduction"
http://www.unglobalcom-pact.org/issues/transpar-ency_anticorruption/CEO_Letter.html
Woodside Woodside, Code of Conduct, p.3
Woodside, Code of Conduct, p.2
Woodside, Code of Conduct, p.9
Woodside, Code of Conduct, pp.3,8
SOURCES - REPORTING ON ANTI-CORRUPTION PROGRAMMES 6/8
question # 8 9 10 11 12 13 14max. score 0.5 1.0 1.0 1.5 1.0 1.0 1.0
ONGC ONGC, Code of Conduct, p.10
PDVSA
Pemex http://www.pemex.com/files/content/Cuadro3Dic2008.pdf
Petrobras Petrobras, Social Responsibility Report 2008, pp.38,39,44
Petrobras, Codigo de Etica do Sistema Petrobras, p.8
Petrobras, Codigo de Etica do Sistema Petrobras, pp.9,14
Petrobras, Codigo de Etica do Sistema Petrobras, p.9
PetroChina
"http://www.petrochina.com.cn/Ptr/Investor_Rela-tions/Corporate_Govern-ance_Structure/gszljg_8.htm (2010-03-30) http://www.petrochina.com.cn/Ptr/Investor_Rela-tions/Corporate_Govern-ance_Structure/gszljg_9.htm (2010-03-30)"
Petronas
QatarPet QP, Regulations related to Conflict of Interest, p.2
QP, Regulations related to Conflict of Interest, pp.2-3
RepsolRepsol YPF, Corporate Responsibility Report 2009, pp.115-117
Repsol, Ethics and Con-duct Regulation for Repsol YPF, S.A. Employees, p.8
Repsol, Ethics and Conduct Regulation for Repsol YPF, S.A. Employees, p.9
Repsol, Ethics and Conduct Regulation for Repsol YPF, S.A. Employ-ees, p.14
Repsol, Ethics and Conduct Regulation for Repsol YPF, S.A. Employees, p.12
Repsol, Ethics and Conduct Regulation for Repsol YPF, S.A. Employees, p.12
Rosneft Rosneft, Code of Business Ethics, p.13
Rosneft, Code of Business Ethics, p.13
Saudi Aramco
Shell Shell Code of Conduct, pp.26,30
Shell Code of Conduct, pp.30-33
Shell Code of Conduct, pp.10,26
Shell Code of Conduct, pp.6,27
Shell Code of Conduct, p.27
Shell Code of Conduct, pp.6,27
SinopecSinopec, 2009 Sustain-able Development Report, p.11
Sinopec, 2009 Sus-tainable Develop-ment Report, p.11
SNPCSOCARSonangol
Sonatrach
Statoil
"http://www.statoil.com/AnnualReport2009/en/Sustainability/Society/Local-Development/Pages/SocialIn-vestments.aspx http://www.statoil.com/annualreport2009/en/financialperformance/positiveimpacts/pages/overviewofactivitiesbycountry.aspx - http://www.statoil.com/annualreport2009/en/sustainability/managingour-risksandimpacts/pages/work-ingincollaboration.aspx http://www.statoil.com/en/about/sponsorships/pages/abouttheheroesoftomorrow.aspx"
Statoil, The Ethics Code of Conduct, pp.15,25
Statoil, The Ethics Code of Conduct, pp.15-16,25-26
Statoil, The Ethics Code of Conduct, pp.14,24
Statoil, The Ethics Code of Conduct, pp.7,17
Statoil, The Ethics Code of Conduct, p.16
"Statoil, The Ethics Code of Conduct, p.16 Statoil, Anti-corruption Com-pliance Program, p.61"
Suncorhttp://sustainability.suncor.com/2010/en/responsi-ble/1579.aspx
"http://sustainability.suncor.com/2010/en/re-sponsible/1329.aspx Petro Canada's Code of Business Conduct, p.10 Petro-Canada, Policies: Prevention of Improper Payments, p.8"
"http://sustainability.suncor.com/2010/en/responsible/1329.aspx Petro Canada's Code of Business Conduct, pp.10-11 Petro-Canada, Policies: Prevention of Improper Payments, p.8"
"Suncor, Policy Guid-ance and Standards, Prevention of Improper payments, p.4 Petro Canada's Code of Business Conduct, p.8"
"http://sustainability.suncor.com/2010/en/responsible/1329.aspx Petro Canada's Code of Business Conduct, pp.ii, 4 Petro-Canada, Policies: Prevention of Improper Payments, p.4"
http://www.suncor.com/en/respon-sible/1324.aspx (2010-03-30)
http://www.suncor.com/en/responsi-ble/1324.aspx (2010-03-30)
TalismanTalisman Energy, Corporate Responsibility Report 2009, pp.1, 15
Talisman Energy, Policy on Business Conduct and Ethics, p.4
Talisman Energy, Policy on Business Conduct and Ethics, p.4 (link provided)
Talisman Energy, Policy on Business Conduct and Ethics, p.6 (al-lowed)
Talisman Energy, Policy on Business Conduct and Ethics, p.3
Talisman Energy, Policy on Business Conduct and Eth-ics, p.3
Total Total, 2009 CSR report, p.74 Total, Code of Conduct, p.15
"http://publications.total.com/guide-integ-rite/index_en.html Section: Supplier, Contractors..."
http://publications.total.com/guide-integrite/guide_integrite/EN/pdf/integrity_guide_the_risks.pdf (not forbidden)
Total, Code of Con-duct, p.10
Total, Code of Conduct, p.10
Total, Code of Conduct, p.10
Wintershall
http://www.basf.com/group/corporate/en/about-basf/vision-values-principles/code-of-conduct/dealing-with-partners (2010-04-30)
http://www.basf.com/group/corporate/en/about-basf/vision-values-principles/code-of-conduct/dealing-with-partners (2010-04-30)
BASF Report 2009, Economic, environmental and social perfor-mance, p. 120
Woodside Woodside, Sustainable De-velopment report 2009, p.36
Woodside, Code of Conduct, p.8
Woodside, Code of Conduct, p.8
Woodside, Code of Conduct, p.9 (allowed although discouraged)
Woodside, Code of Conduct, p.2
"Woodside, Code of Conduct, p.2 Woodside, Sus-tainable Develop-ment Report 2009, p.33"
"Woodside, Code of Con-duct, p.2 Woodside, Sus-tainable Develop-ment Report 2009, p.33"
78 Transparency International 79Promoting Revenue Transparency
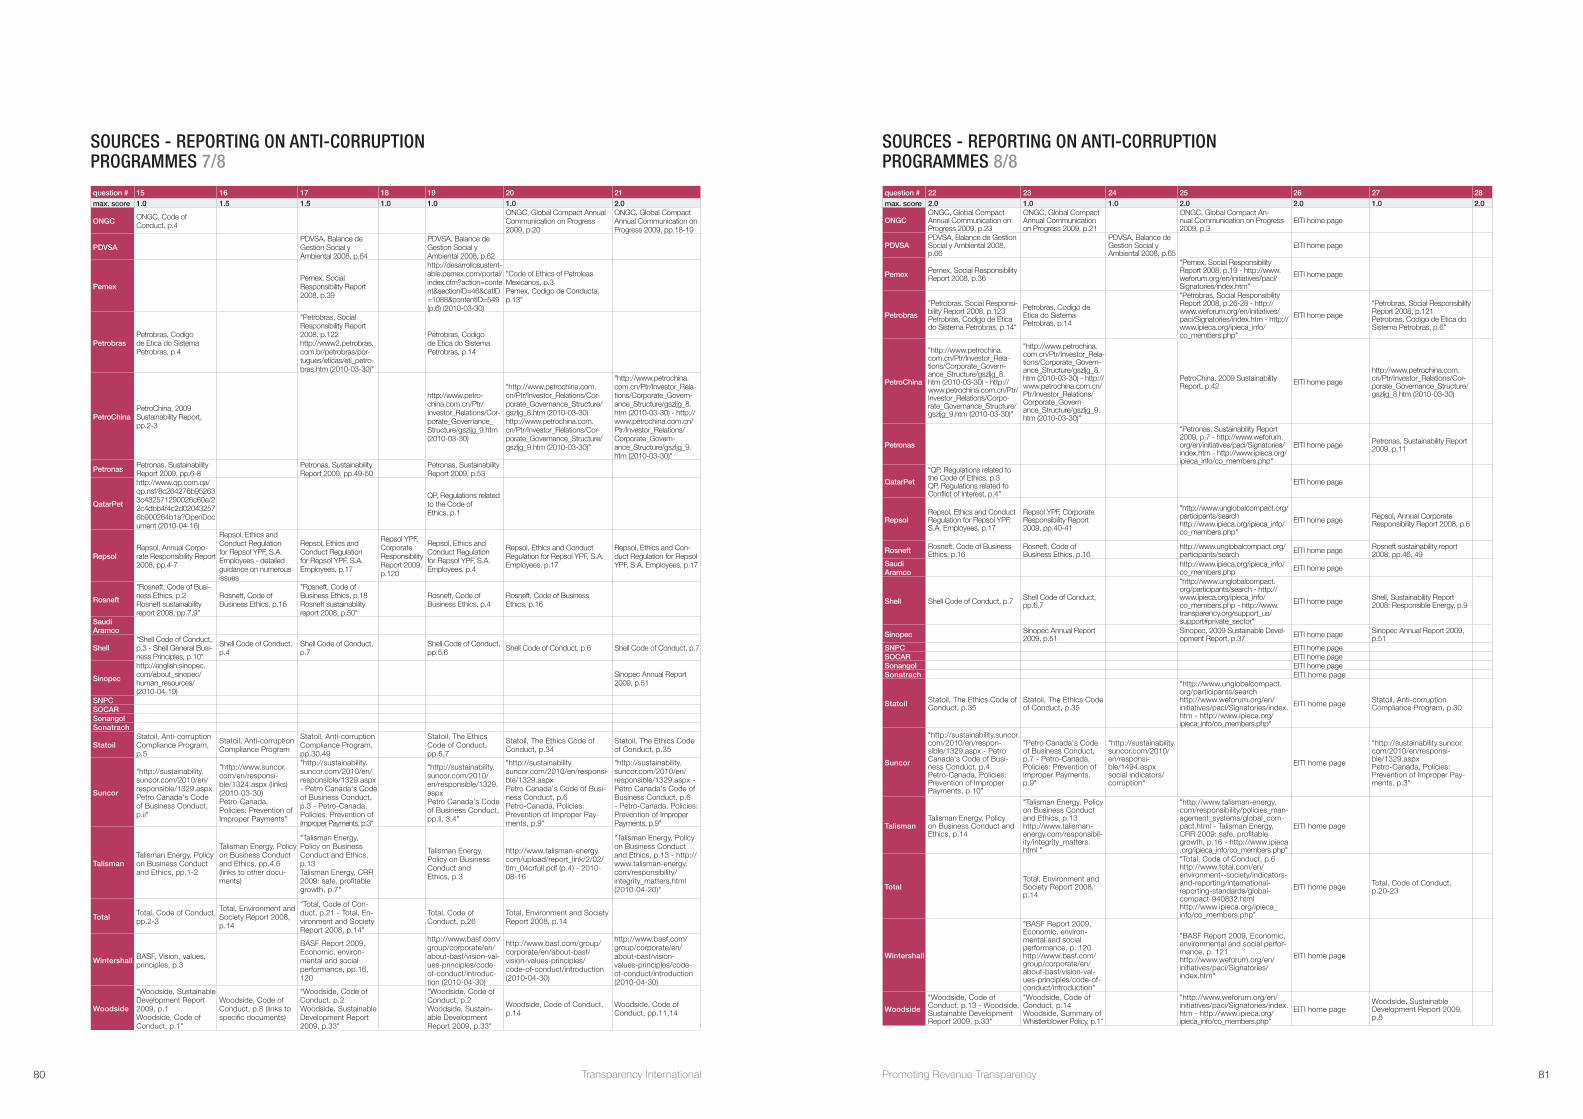
SOURCES - REPORTING ON ANTI-CORRUPTION PROGRAMMES 7/8
question # 15 16 17 18 19 20 21max. score 1.0 1.5 1.5 1.0 1.0 1.0 2.0
ONGC ONGC, Code of Conduct, p.4
ONGC, Global Compact Annual Communication on Progress 2009, p.20
ONGC, Global Compact Annual Communication on Progress 2009, pp.18-19
PDVSAPDVSA, Balance de Gestion Social y Ambiental 2008, p.64
PDVSA, Balance de Gestion Social y Ambiental 2008, p.62
PemexPemex, Social Responsibility Report 2008, p.39
http://desarrollosustent-able.pemex.com/portal/index.cfm?action=content§ionID=46&catID=1088&contentID=549 (p.6) (2010-03-30)
"Code of Ethics of Petroleas Mexicanos, p.3 Pemex, Codigo de Conducta, p.13"
PetrobrasPetrobras, Codigo de Etica do Sistema Petrobras, p.4
"Petrobras, Social Responsibility Report 2008, p.122 http://www2.petrobras.com.br/petrobras/por-tugues/eticas/eti_petro-bras.htm (2010-03-30)"
Petrobras, Codigo de Etica do Sistema Petrobras, p.14
PetroChinaPetroChina, 2009 Sustainability Report, pp.2-3
http://www.petro-china.com.cn/Ptr/Investor_Relations/Cor-porate_Governance_Structure/gszljg_9.htm (2010-03-30)
"http://www.petrochina.com.cn/Ptr/Investor_Relations/Cor-porate_Governance_Structure/gszljg_8.htm (2010-03-30) http://www.petrochina.com.cn/Ptr/Investor_Relations/Cor-porate_Governance_Structure/gszljg_9.htm (2010-03-30)"
"http://www.petrochina.com.cn/Ptr/Investor_Rela-tions/Corporate_Govern-ance_Structure/gszljg_8.htm (2010-03-30) - http://www.petrochina.com.cn/Ptr/Investor_Relations/Corporate_Govern-ance_Structure/gszljg_9.htm (2010-03-30)"
Petronas Petronas, Sustainability Report 2009, pp.6-8
Petronas, Sustainability Report 2009, pp.49-50
Petronas, Sustainability Report 2009, p.53
QatarPet
http://www.qp.com.qa/qp.nsf/8c264276b952633c432571290026c60e/22c4dbb4f4c2d020432576b900264b1a?OpenDocument (2010-04-16)
QP, Regulations related to the Code of Ethics, p.1
RepsolRepsol, Annual Corpo-rate Responsibility Report 2008, pp.4-7
Repsol, Ethics and Conduct Regulation for Repsol YPF, S.A. Employees - detailed guidance on numerous issues
Repsol, Ethics and Conduct Regulation for Repsol YPF, S.A. Employees, p.17
Repsol YPF, Corporate Responsibility Report 2009, p.120
Repsol, Ethics and Conduct Regulation for Repsol YPF, S.A. Employees, p.4
Repsol, Ethics and Conduct Regulation for Repsol YPF, S.A. Employees, p.17
Repsol, Ethics and Con-duct Regulation for Repsol YPF, S.A. Employees, p.17
Rosneft
"Rosneft, Code of Busi-ness Ethics, p.2 Rosneft sustainability report 2008, pp.7,9"
Rosneft, Code of Business Ethics, p.16
"Rosneft, Code of Business Ethics, p.18 Rosneft sustainability report 2008, p.50"
Rosneft, Code of Business Ethics, p.4
Rosneft, Code of Business Ethics, p.16
Saudi Aramco
Shell"Shell Code of Conduct, p.3 - Shell General Busi-ness Principles, p.10"
Shell Code of Conduct, p.4
Shell Code of Conduct, p.7
Shell Code of Conduct, pp.5,6 Shell Code of Conduct, p.6 Shell Code of Conduct, p.7
Sinopec
http://english.sinopec.com/about_sinopec/human_resources/ (2010-04-19)
Sinopec Annual Report 2009, p.51
SNPCSOCARSonangolSonatrach
StatoilStatoil, Anti-corruption Compliance Program, p.5
Statoil, Anti-corruption Compliance Program
Statoil, Anti-corruption Compliance Program, pp.30,49
Statoil, The Ethics Code of Conduct, pp.5,7
Statoil, The Ethics Code of Conduct, p.34
Statoil, The Ethics Code of Conduct, p.35
Suncor
"http://sustainability.suncor.com/2010/en/responsible/1329.aspx Petro Canada's Code of Business Conduct, p.ii"
"http://www.suncor.com/en/responsi-ble/1324.aspx (links) (2010-03-30) Petro-Canada, Policies: Prevention of Improper Payments"
"http://sustainability.suncor.com/2010/en/responsible/1329.aspx - Petro Canada's Code of Business Conduct, p.3 - Petro-Canada, Policies: Prevention of Improper Payments, p.3"
"http://sustainability.suncor.com/2010/en/responsible/1329.aspx Petro Canada's Code of Business Conduct, pp.ii, 3,4"
"http://sustainability.suncor.com/2010/en/responsi-ble/1329.aspx Petro Canada's Code of Busi-ness Conduct, p.6 Petro-Canada, Policies: Prevention of Improper Pay-ments, p.9"
"http://sustainability.suncor.com/2010/en/responsible/1329.aspx - Petro Canada's Code of Business Conduct, p.6 - Petro-Canada, Policies: Prevention of Improper Payments, p.9"
TalismanTalisman Energy, Policy on Business Conduct and Ethics, pp.1-2
Talisman Energy, Policy on Business Conduct and Ethics, pp.4,6 (links to other docu-ments)
"Talisman Energy, Policy on Business Conduct and Ethics, p.13 Talisman Energy, CRR 2009: safe, profitable growth, p.7"
Talisman Energy, Policy on Business Conduct and Ethics, p.3
http://www.talisman-energy.com/upload/report_link/2/02/tlm_04crfull.pdf (p.4) - 2010-08-16
"Talisman Energy, Policy on Business Conduct and Ethics, p.13 - http://www.talisman-energy.com/responsibility/integrity_matters.html (2010-04-20)"
Total Total, Code of Conduct, pp.2-3
Total, Environment and Society Report 2008, p.14
"Total, Code of Con-duct, p.21 - Total, En-vironment and Society Report 2008, p.14"
Total, Code of Conduct, p.26
Total, Environment and Society Report 2008, p.14
Wintershall BASF, Vision, values, principles, p.3
BASF Report 2009, Economic, environ-mental and social performance, pp.16, 120
http://www.basf.com/group/corporate/en/about-basf/vision-val-ues-principles/code-of-conduct/introduc-tion (2010-04-30)
http://www.basf.com/group/corporate/en/about-basf/vision-values-principles/code-of-conduct/introduction (2010-04-30)
http://www.basf.com/group/corporate/en/about-basf/vision-values-principles/code-of-conduct/introduction (2010-04-30)
Woodside
"Woodside, Sustainable Development Report 2009, p.1 Woodside, Code of Conduct, p.1"
Woodside, Code of Conduct, p.8 (links to specific documents)
"Woodside, Code of Conduct, p.2 Woodside, Sustainable Development Report 2009, p.33"
"Woodside, Code of Conduct, p.2 Woodside, Sustain-able Development Report 2009, p.33"
Woodside, Code of Conduct, p.14
Woodside, Code of Conduct, pp.11,14
SOURCES - REPORTING ON ANTI-CORRUPTION PROGRAMMES 8/8
question # 22 23 24 25 26 27 28max. score 2.0 1.0 1.0 2.0 2.0 1.0 2.0
ONGCONGC, Global Compact Annual Communication on Progress 2009, p.23
ONGC, Global Compact Annual Communication on Progress 2009, p.21
ONGC, Global Compact An-nual Communication on Progress 2009, p.3
EITI home page
PDVSAPDVSA, Balance de Gestion Social y Ambiental 2008, p.66
PDVSA, Balance de Gestion Social y Ambiental 2008, p.65
EITI home page
Pemex Pemex, Social Responsibility Report 2008, p.36
"Pemex, Social Responsibility Report 2008, p.19 - http://www.weforum.org/en/initiatives/paci/Signatories/index.htm"
EITI home page
Petrobras
"Petrobras, Social Responsi-bility Report 2008, p.123 Petrobras, Codigo de Etica do Sistema Petrobras, p.14"
Petrobras, Codigo de Etica do Sistema Petrobras, p.14
"Petrobras, Social Responsibility Report 2008, p.26-28 - http://www.weforum.org/en/initiatives/paci/Signatories/index.htm - http://www.ipieca.org/ipieca_info/co_members.php"
EITI home page
"Petrobras, Social Responsibility Report 2008, p.121 Petrobras, Codigo de Etica do Sistema Petrobras, p.6"
PetroChina
"http://www.petrochina.com.cn/Ptr/Investor_Rela-tions/Corporate_Govern-ance_Structure/gszljg_8.htm (2010-03-30) - http://www.petrochina.com.cn/Ptr/Investor_Relations/Corpo-rate_Governance_Structure/gszljg_9.htm (2010-03-30)"
"http://www.petrochina.com.cn/Ptr/Investor_Rela-tions/Corporate_Govern-ance_Structure/gszljg_8.htm (2010-03-30) - http://www.petrochina.com.cn/Ptr/Investor_Relations/Corporate_Govern-ance_Structure/gszljg_9.htm (2010-03-30)"
PetroChina, 2009 Sustainability Report, p.42 EITI home page
http://www.petrochina.com.cn/Ptr/Investor_Relations/Cor-porate_Governance_Structure/gszljg_8.htm (2010-03-30)
Petronas
"Petronas, Sustainability Report 2009, p.7 - http://www.weforum.org/en/initiatives/paci/Signatories/index.htm - http://www.ipieca.org/ipieca_info/co_members.php"
EITI home page Petronas, Sustainability Report 2009, p.11
QatarPet
"QP, Regulations related to the Code of Ethics, p.3 QP, Regulations related to Conflict of Interest, p.4"
EITI home page
RepsolRepsol, Ethics and Conduct Regulation for Repsol YPF, S.A. Employees, p.17
Repsol YPF, Corporate Responsibility Report 2009, pp.40-41
"http://www.unglobalcompact.org/participants/search http://www.ipieca.org/ipieca_info/co_members.php"
EITI home page Repsol, Annual Corporate Responsibility Report 2008, p.6
Rosneft Rosneft, Code of Business Ethics, p.16
Rosneft, Code of Business Ethics, p.16
http://www.unglobalcompact.org/participants/search EITI home page Rosneft sustainability report
2008, pp.46, 49Saudi Aramco
http://www.ipieca.org/ipieca_info/co_members.php EITI home page
Shell Shell Code of Conduct, p.7 Shell Code of Conduct, pp.6,7
"http://www.unglobalcompact.org/participants/search - http://www.ipieca.org/ipieca_info/co_members.php - http://www.transparency.org/support_us/support#private_sector"
EITI home page Shell, Sustainability Report 2008: Responsible Energy, p.9
Sinopec Sinopec Annual Report 2009, p.51
Sinopec, 2009 Sustainable Devel-opment Report, p.37 EITI home page Sinopec Annual Report 2009,
p.51SNPC EITI home pageSOCAR EITI home pageSonangol EITI home pageSonatrach EITI home page
Statoil Statoil, The Ethics Code of Conduct, p.35
Statoil, The Ethics Code of Conduct, p.35
"http://www.unglobalcompact.org/participants/search http://www.weforum.org/en/initiatives/paci/Signatories/index.htm - http://www.ipieca.org/ipieca_info/co_members.php"
EITI home page Statoil, Anti-corruption Compliance Program, p.30
Suncor
"http://sustainability.suncor.com/2010/en/respon-sible/1329.aspx - Petro Canada's Code of Busi-ness Conduct, p.4 Petro-Canada, Policies: Prevention of Improper Payments, p.10"
"Petro Canada's Code of Business Conduct, p.7 - Petro-Canada, Policies: Prevention of Improper Payments, p.9"
"http://sustainability.suncor.com/2010/en/responsi-ble/1494.aspx social indicators/ corruption"
EITI home page
"http://sustainability.suncor.com/2010/en/responsi-ble/1329.aspx Petro-Canada, Policies: Prevention of Improper Pay-ments, p.3"
TalismanTalisman Energy, Policy on Business Conduct and Ethics, p.14
"Talisman Energy, Policy on Business Conduct and Ethics, p.13 http://www.talisman-energy.com/responsibil-ity/integrity_matters.html "
"http://www.talisman-energy.com/responsibility/policies_man-agement_systems/global_com-pact.html - Talisman Energy, CRR 2009: safe, profitable growth, p.16 - http://www.ipieca .org/ipieca_info/co_members.php"
EITI home page
Total Total, Environment and Society Report 2008, p.14
"Total, Code of Conduct, p.6 http://www.total.com/en/environment--society/indicators-and-reporting/international-reporting-standards/global-compact-940832.html http://www.ipieca.org/ipieca_info/co_members.php"
EITI home page Total, Code of Conduct, p.20-23
Wintershall
"BASF Report 2009, Economic, environ-mental and social performance, p. 120 http://www.basf.com/group/corporate/en/about-basf/vision-val-ues-principles/code-of-conduct/introduction"
"BASF Report 2009, Economic, environmental and social perfor-mance, p. 121 http://www.weforum.org/en/initiatives/paci/Signatories/index.htm"
EITI home page
Woodside
"Woodside, Code of Conduct, p.13 - Woodside, Sustainable Development Report 2009, p.33"
"Woodside, Code of Conduct, p.14 Woodside, Summary of Whistlerblower Policy, p.1"
"http://www.weforum.org/en/initiatives/paci/Signatories/index.htm - http://www.ipieca.org/ipieca_info/co_members.php"
EITI home pageWoodside, Sustainable Development Report 2009, p.8
80 Transparency International 81Promoting Revenue Transparency
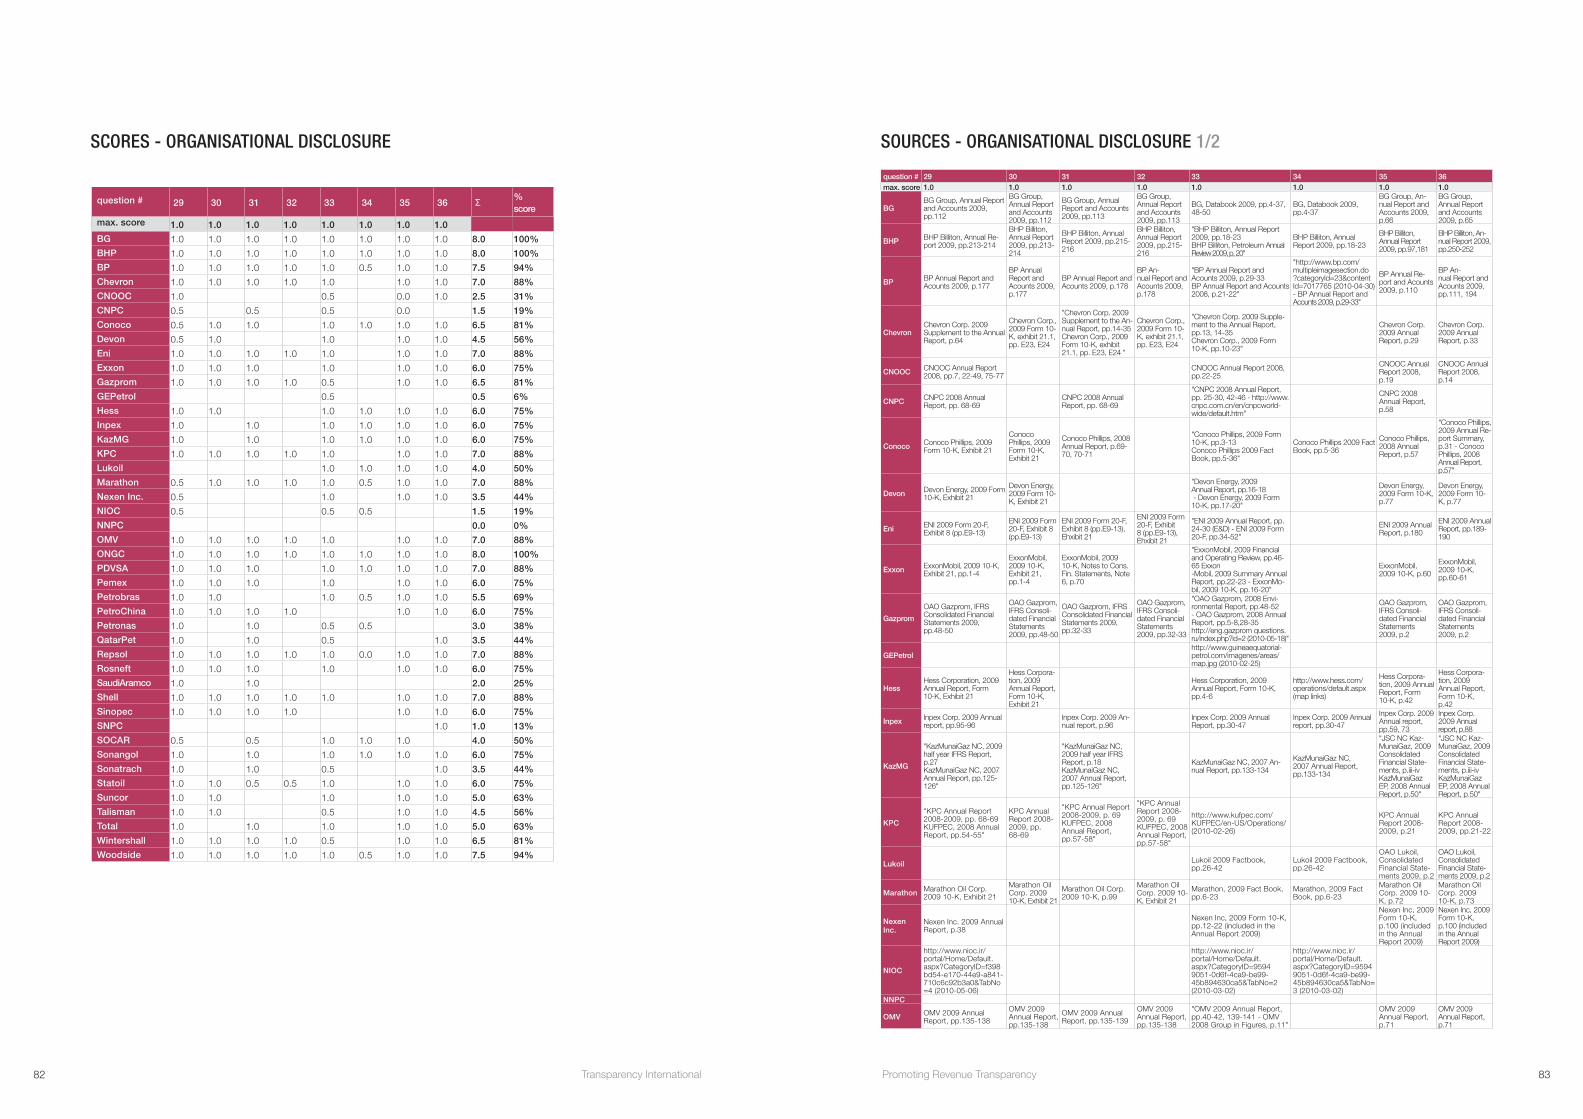
SCORES - ORGANISATIONAL DISCLOSURE
question # 29 30 31 32 33 34 35 36 Σ % score
max. score 1.0 1.0 1.0 1.0 1.0 1.0 1.0 1.0
BG 1.0 1.0 1.0 1.0 1.0 1.0 1.0 1.0 8.0 100%
BHP 1.0 1.0 1.0 1.0 1.0 1.0 1.0 1.0 8.0 100%
BP 1.0 1.0 1.0 1.0 1.0 0.5 1.0 1.0 7.5 94%
Chevron 1.0 1.0 1.0 1.0 1.0 1.0 1.0 7.0 88%
CNOOC 1.0 0.5 0.0 1.0 2.5 31%
CNPC 0.5 0.5 0.5 0.0 1.5 19%
Conoco 0.5 1.0 1.0 1.0 1.0 1.0 1.0 6.5 81%
Devon 0.5 1.0 1.0 1.0 1.0 4.5 56%
Eni 1.0 1.0 1.0 1.0 1.0 1.0 1.0 7.0 88%
Exxon 1.0 1.0 1.0 1.0 1.0 1.0 6.0 75%
Gazprom 1.0 1.0 1.0 1.0 0.5 1.0 1.0 6.5 81%
GEPetrol 0.5 0.5 6%
Hess 1.0 1.0 1.0 1.0 1.0 1.0 6.0 75%
Inpex 1.0 1.0 1.0 1.0 1.0 1.0 6.0 75%
KazMG 1.0 1.0 1.0 1.0 1.0 1.0 6.0 75%
KPC 1.0 1.0 1.0 1.0 1.0 1.0 1.0 7.0 88%
Lukoil 1.0 1.0 1.0 1.0 4.0 50%
Marathon 0.5 1.0 1.0 1.0 1.0 0.5 1.0 1.0 7.0 88%
Nexen Inc. 0.5 1.0 1.0 1.0 3.5 44%
NIOC 0.5 0.5 0.5 1.5 19%
NNPC 0.0 0%
OMV 1.0 1.0 1.0 1.0 1.0 1.0 1.0 7.0 88%
ONGC 1.0 1.0 1.0 1.0 1.0 1.0 1.0 1.0 8.0 100%
PDVSA 1.0 1.0 1.0 1.0 1.0 1.0 1.0 7.0 88%
Pemex 1.0 1.0 1.0 1.0 1.0 1.0 6.0 75%
Petrobras 1.0 1.0 1.0 0.5 1.0 1.0 5.5 69%
PetroChina 1.0 1.0 1.0 1.0 1.0 1.0 6.0 75%
Petronas 1.0 1.0 0.5 0.5 3.0 38%
QatarPet 1.0 1.0 0.5 1.0 3.5 44%
Repsol 1.0 1.0 1.0 1.0 1.0 0.0 1.0 1.0 7.0 88%
Rosneft 1.0 1.0 1.0 1.0 1.0 1.0 6.0 75%
SaudiAramco 1.0 1.0 2.0 25%
Shell 1.0 1.0 1.0 1.0 1.0 1.0 1.0 7.0 88%
Sinopec 1.0 1.0 1.0 1.0 1.0 1.0 6.0 75%
SNPC 1.0 1.0 13%
SOCAR 0.5 0.5 1.0 1.0 1.0 4.0 50%
Sonangol 1.0 1.0 1.0 1.0 1.0 1.0 6.0 75%
Sonatrach 1.0 1.0 0.5 1.0 3.5 44%
Statoil 1.0 1.0 0.5 0.5 1.0 1.0 1.0 6.0 75%
Suncor 1.0 1.0 1.0 1.0 1.0 5.0 63%
Talisman 1.0 1.0 0.5 1.0 1.0 4.5 56%
Total 1.0 1.0 1.0 1.0 1.0 5.0 63%
Wintershall 1.0 1.0 1.0 1.0 0.5 1.0 1.0 6.5 81%
Woodside 1.0 1.0 1.0 1.0 1.0 0.5 1.0 1.0 7.5 94%
SOURCES - ORGANISATIONAL DISCLOSURE 1/2
question # 29 30 31 32 33 34 35 36max. score 1.0 1.0 1.0 1.0 1.0 1.0 1.0 1.0
BGBG Group, Annual Report and Accounts 2009, pp.112
BG Group, Annual Report and Accounts 2009, pp.112
BG Group, Annual Report and Accounts 2009, pp.113
BG Group, Annual Report and Accounts 2009, pp.113
BG, Databook 2009, pp.4-37, 48-50
BG, Databook 2009, pp.4-37
BG Group, An-nual Report and Accounts 2009, p.66
BG Group, Annual Report and Accounts 2009, p.65
BHP BHP Billiton, Annual Re-port 2009, pp.213-214
BHP Billiton, Annual Report 2009, pp.213-214
BHP Billiton, Annual Report 2009, pp.215-216
BHP Billiton, Annual Report 2009, pp.215-216
"BHP Billiton, Annual Report 2009, pp.18-23 BHP Billiton, Petroleum Annual Review 2009, p, 20"
BHP Billiton, Annual Report 2009, pp.18-23
BHP Billiton, Annual Report 2009, pp.97,181
BHP Billiton, An-nual Report 2009, pp.250-252
BP BP Annual Report and Acounts 2009, p.177
BP Annual Report and Acounts 2009, p.177
BP Annual Report and Acounts 2009, p.178
BP An-nual Report and Acounts 2009, p.178
"BP Annual Report and Acounts 2009, p.29-33 BP Annual Report and Acounts 2008, p.21-22"
"http://www.bp.com/multipleimagesection.do?categoryId=23&contentId=7017765 (2010-04-30) - BP Annual Report and Acounts 2009, p.29-33"
BP Annual Re-port and Acounts 2009, p.110
BP An-nual Report and Acounts 2009, pp.111, 194
Chevron Chevron Corp. 2009 Supplement to the Annual Report, p.64
Chevron Corp., 2009 Form 10-K, exhibit 21.1, pp. E23, E24
"Chevron Corp. 2009 Supplement to the An-nual Report, pp.14-35 Chevron Corp., 2009 Form 10-K, exhibit 21.1, pp. E23, E24 "
Chevron Corp., 2009 Form 10-K, exhibit 21.1, pp. E23, E24
"Chevron Corp. 2009 Supple-ment to the Annual Report, pp.13, 14-35 Chevron Corp., 2009 Form 10-K, pp.10-23"
Chevron Corp. 2009 Annual Report, p.29
Chevron Corp. 2009 Annual Report, p.33
CNOOC CNOOC Annual Report 2008, pp.7, 22-49, 75-77
CNOOC Annual Report 2008, pp.22-25
CNOOC Annual Report 2008, p.19
CNOOC Annual Report 2008, p.14
CNPC CNPC 2008 Annual Report, pp. 68-69
CNPC 2008 Annual Report, pp. 68-69
"CNPC 2008 Annual Report, pp. 25-30, 42-46 - http://www.cnpc.com.cn/en/cnpcworld-wide/default.htm"
CNPC 2008 Annual Report, p.58
Conoco Conoco Phillips, 2009 Form 10-K, Exhibit 21
Conoco Phillips, 2009 Form 10-K, Exhibit 21
Conoco Phillips, 2008 Annual Report, p.69-70, 70-71
"Conoco Phillips, 2009 Form 10-K, pp.3-13 Conoco Phillips 2009 Fact Book, pp.5-36"
Conoco Phillips 2009 Fact Book, pp.5-36
Conoco Phillips, 2008 Annual Report, p.57
"Conoco Phillips, 2009 Annual Re-port Summary, p.31 - Conoco Phillips, 2008 Annual Report, p.57"
Devon Devon Energy, 2009 Form 10-K, Exhibit 21
Devon Energy, 2009 Form 10-K, Exhibit 21
"Devon Energy, 2009 Annual Report, pp.16-18 - Devon Energy, 2009 Form 10-K, pp.17-20"
Devon Energy, 2009 Form 10-K, p.77
Devon Energy, 2009 Form 10-K, p.77
Eni ENI 2009 Form 20-F, Exhibit 8 (pp.E9-13)
ENI 2009 Form 20-F, Exhibit 8 (pp.E9-13)
ENI 2009 Form 20-F, Exhibit 8 (pp.E9-13), Ehxibit 21
ENI 2009 Form 20-F, Exhibit 8 (pp.E9-13), Ehxibit 21
"ENI 2009 Annual Report, pp. 24-30 (E&D) - ENI 2009 Form 20-F, pp.34-52"
ENI 2009 Annual Report, p.180
ENI 2009 Annual Report, pp.189-190
Exxon ExxonMobil, 2009 10-K, Exhibit 21, pp.1-4
ExxonMobil, 2009 10-K, Exhibit 21, pp.1-4
ExxonMobil, 2009 10-K, Notes to Cons. Fin. Statements, Note 6, p.70
"ExxonMobil, 2009 Financial and Operating Review, pp.46-65 Exxon -Mobil, 2009 Summary Annual Report, pp.22-23 - ExxonMo-bil, 2009 10-K, pp.16-20"
ExxonMobil, 2009 10-K, p.60
ExxonMobil, 2009 10-K, pp.60-61
Gazprom
OAO Gazprom, IFRS Consolidated Financial Statements 2009, pp.48-50
OAO Gazprom, IFRS Consoli-dated Financial Statements 2009, pp.48-50
OAO Gazprom, IFRS Consolidated Financial Statements 2009, pp.32-33
OAO Gazprom, IFRS Consoli-dated Financial Statements 2009, pp.32-33
"OAO Gazprom, 2008 Envi-ronmental Report, pp.48-52 - OAO Gazprom, 2008 Annual Report, pp.5-8,28-35 http://eng.gazprom questions.ru/index.php?id=2 (2010-05-18)"
OAO Gazprom, IFRS Consoli-dated Financial Statements 2009, p.2
OAO Gazprom, IFRS Consoli-dated Financial Statements 2009, p.2
GEPetrolhttp://www.guineaequatorial-petrol.com/imagenes/areas/map.jpg (2010-02-25)
Hess Hess Corporation, 2009 Annual Report, Form 10-K, Exhibit 21
Hess Corpora-tion, 2009 Annual Report, Form 10-K, Exhibit 21
Hess Corporation, 2009 Annual Report, Form 10-K, pp.4-6
http://www.hess.com/operations/default.aspx (map links)
Hess Corpora-tion, 2009 Annual Report, Form 10-K, p.42
Hess Corpora-tion, 2009 Annual Report, Form 10-K, p.42
Inpex Inpex Corp. 2009 Annual report, pp.95-96
Inpex Corp. 2009 An-nual report, p.96
Inpex Corp. 2009 Annual Report, pp.30-47
Inpex Corp. 2009 Annual report, pp.30-47
Inpex Corp. 2009 Annual report, pp.59, 73
Inpex Corp. 2009 Annual report, p.88
KazMG
"KazMunaiGaz NC, 2009 half year IFRS Report, p.27 KazMunaiGaz NC, 2007 Annual Report, pp.125-126"
"KazMunaiGaz NC, 2009 half year IFRS Report, p.18 KazMunaiGaz NC, 2007 Annual Report, pp.125-126"
KazMunaiGaz NC, 2007 An-nual Report, pp.133-134
KazMunaiGaz NC, 2007 Annual Report, pp.133-134
"JSC NC Kaz-MunaiGaz, 2009 Consolidated Financial State-ments, p.iii-iv KazMunaiGaz EP, 2008 Annual Report, p.50"
"JSC NC Kaz-MunaiGaz, 2009 Consolidated Financial State-ments, p.iii-iv KazMunaiGaz EP, 2008 Annual Report, p.50"
KPC
"KPC Annual Report 2008-2009, pp. 68-69 KUFPEC, 2008 Annual Report, pp.54-55"
KPC Annual Report 2008-2009, pp. 68-69
"KPC Annual Report 2008-2009, p. 69 KUFPEC, 2008 Annual Report, pp.57-58"
"KPC Annual Report 2008-2009, p. 69 KUFPEC, 2008 Annual Report, pp.57-58"
http://www.kufpec.com/KUFPEC/en-US/Operations/ (2010-02-26)
KPC Annual Report 2008-2009, p.21
KPC Annual Report 2008-2009, pp.21-22
Lukoil Lukoil 2009 Factbook, pp.26-42
Lukoil 2009 Factbook, pp.26-42
OAO Lukoil, Consolidated Financial State-ments 2009, p.2
OAO Lukoil, Consolidated Financial State-ments 2009, p.2
Marathon Marathon Oil Corp. 2009 10-K, Exhibit 21
Marathon Oil Corp. 2009 10-K, Exhibit 21
Marathon Oil Corp. 2009 10-K, p.99
Marathon Oil Corp. 2009 10-K, Exhibit 21
Marathon, 2009 Fact Book, pp.6-23
Marathon, 2009 Fact Book, pp.6-23
Marathon Oil Corp. 2009 10-K, p.72
Marathon Oil Corp. 2009 10-K, p.73
Nexen Inc.
Nexen Inc. 2009 Annual Report, p.38
Nexen Inc, 2009 Form 10-K, pp.12-22 (included in the Annual Report 2009)
Nexen Inc, 2009 Form 10-K, p.100 (included in the Annual Report 2009)
Nexen Inc, 2009 Form 10-K, p.100 (included in the Annual Report 2009)
NIOC
http://www.nioc.ir/portal/Home/Default.aspx?CategoryID=f398 bd54-e170-44e9-a841-710c6c92b3a0&TabNo =4 (2010-05-06)
http://www.nioc.ir/portal/Home/Default.aspx?CategoryID=9594 9051-0d6f-4ca9-be99-45b894630ca5&TabNo=2 (2010-03-02)
http://www.nioc.ir/portal/Home/Default.aspx?CategoryID=9594 9051-0d6f-4ca9-be99-45b894630ca5&TabNo= 3 (2010-03-02)
NNPC
OMV OMV 2009 Annual Report, pp.135-138
OMV 2009 Annual Report, pp.135-138
OMV 2009 Annual Report, pp.135-139
OMV 2009 Annual Report, pp.135-138
"OMV 2009 Annual Report, pp.40-42, 139-141 - OMV 2008 Group in Figures, p.11"
OMV 2009 Annual Report, p.71
OMV 2009 Annual Report, p.71
82 Transparency International 83Promoting Revenue Transparency
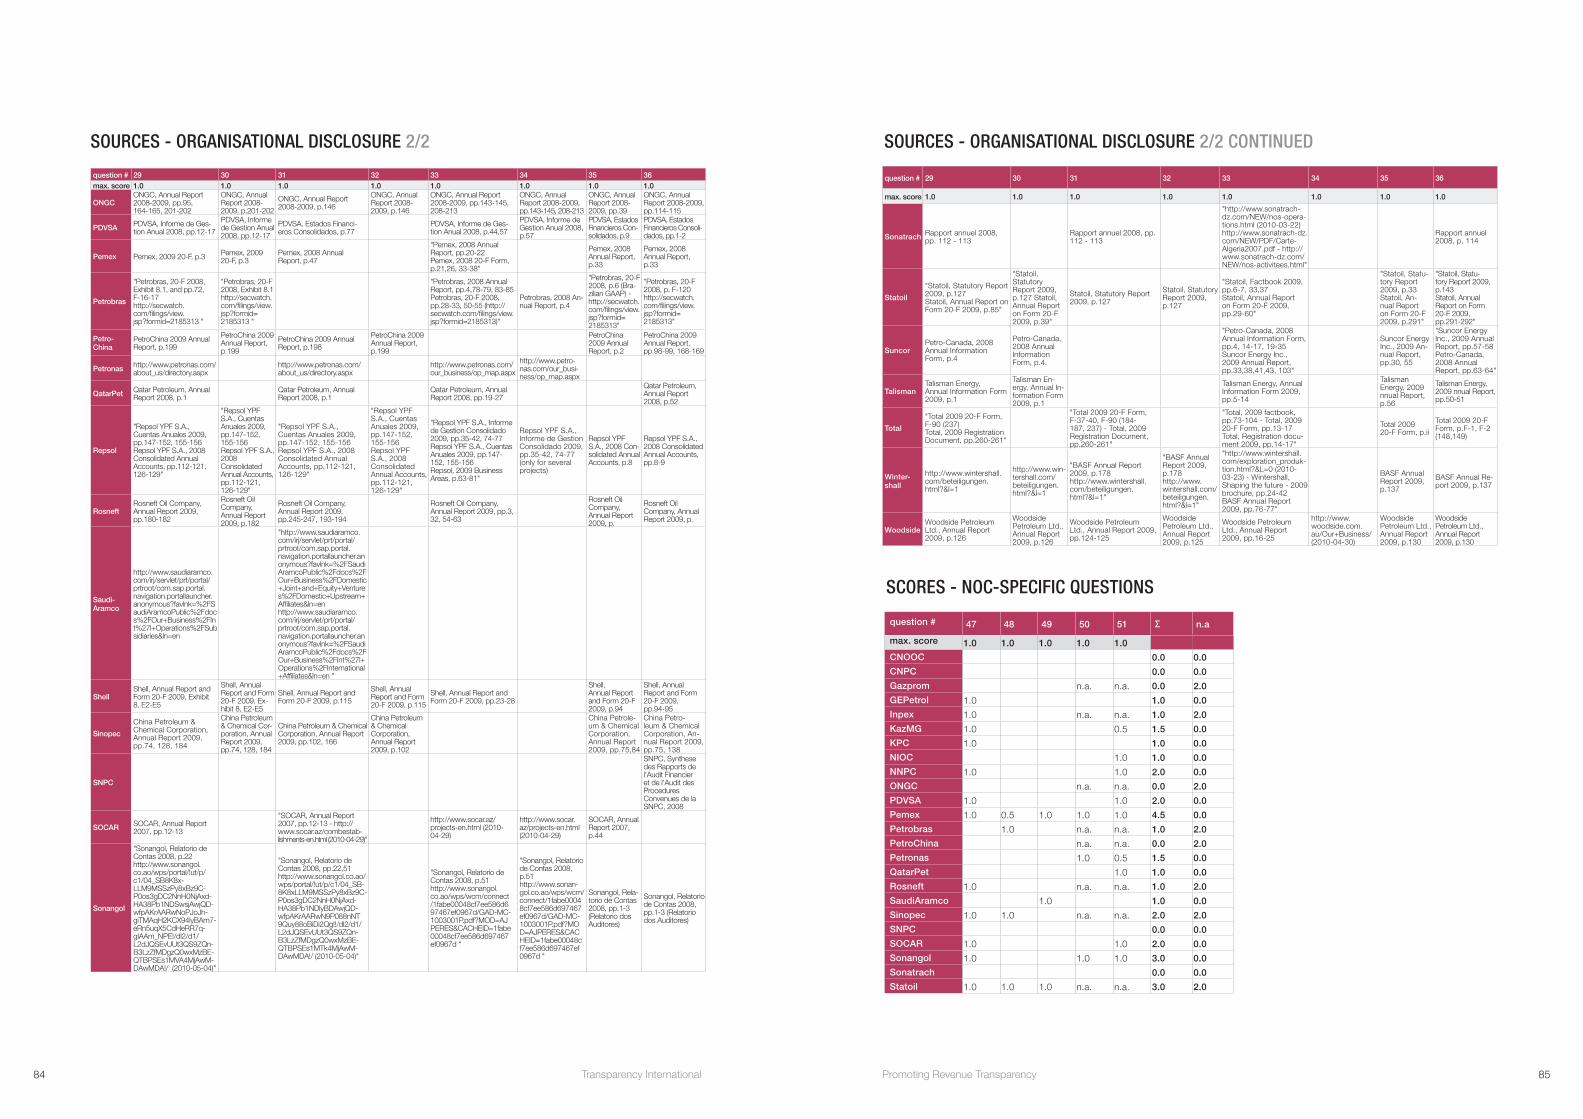
SOURCES - ORGANISATIONAL DISCLOSURE 2/2
question # 29 30 31 32 33 34 35 36max. score 1.0 1.0 1.0 1.0 1.0 1.0 1.0 1.0
ONGCONGC, Annual Report 2008-2009, pp.95, 164-165, 201-202
ONGC, Annual Report 2008-2009, p.201-202
ONGC, Annual Report 2008-2009, p.146
ONGC, Annual Report 2008-2009, p.146
ONGC, Annual Report 2008-2009, pp.143-145, 208-213
ONGC, Annual Report 2008-2009, pp.143-145, 208-213
ONGC, Annual Report 2008-2009, pp.39
ONGC, Annual Report 2008-2009, pp.114-115
PDVSA PDVSA, Informe de Ges-tion Anual 2008, pp.12-17
PDVSA, Informe de Gestion Anual 2008, pp.12-17
PDVSA, Estados Financi-eros Consolidados, p.77
PDVSA, Informe de Ges-tion Anual 2008, p.44,57
PDVSA, Informe de Gestion Anual 2008, p.57
PDVSA, Estados Financieros Con-solidados, p.9
PDVSA, Estados Financieros Consoli-dados, pp.1-2
Pemex Pemex, 2009 20-F, p.3 Pemex, 2009 20-F, p.3
Pemex, 2008 Annual Report, p.47
"Pemex, 2008 Annual Report, pp.20-22 Pemex, 2008 20-F Form, p.21,26, 33-38"
Pemex, 2008 Annual Report, p.33
Pemex, 2008 Annual Report, p.33
Petrobras
"Petrobras, 20-F 2008, Exhibit 8.1, and pp.72, F-16-17 http://secwatch.com/filings/view.jsp?formid=2185313 "
"Petrobras, 20-F 2008, Exhibit 8.1 http://secwatch.com/filings/view.jsp?formid= 2185313 "
"Petrobras, 2008 Annual Report, pp.4,78-79, 83-85 Petrobras, 20-F 2008, pp.28-33, 50-55 (http://secwatch.com/filings/view.jsp?formid=2185313)"
Petrobras, 2008 An-nual Report, p.4
"Petrobras, 20-F 2008, p.6 (Bra-zilian GAAP) - http://secwatch.com/filings/view.jsp?formid= 2185313"
"Petrobras, 20-F 2008, p. F-120 http://secwatch.com/filings/view.jsp?formid= 2185313"
Petro-China
PetroChina 2009 Annual Report, p.199
PetroChina 2009 Annual Report, p.199
PetroChina 2009 Annual Report, p.198
PetroChina 2009 Annual Report, p.199
PetroChina 2009 Annual Report, p.2
PetroChina 2009 Annual Report, pp.98-99, 168-169
Petronas http://www.petronas.com/about_us/directory.aspx
http://www.petronas.com/about_us/directory.aspx
http://www.petronas.com/our_business/op_map.aspx
http://www.petro-nas.com/our_busi-ness/op_map.aspx
QatarPet Qatar Petroleum, Annual Report 2008, p.1
Qatar Petroleum, Annual Report 2008, p.1
Qatar Petroleum, Annual Report 2008, pp.19-27
Qatar Petroleum, Annual Report 2008, p.52
Repsol
"Repsol YPF S.A., Cuentas Anuales 2009, pp.147-152, 155-156 Repsol YPF S.A., 2008 Consolidated Annual Accounts, pp.112-121, 126-129"
"Repsol YPF S.A., Cuentas Anuales 2009, pp.147-152, 155-156 Repsol YPF S.A., 2008 Consolidated Annual Accounts, pp.112-121, 126-129"
"Repsol YPF S.A., Cuentas Anuales 2009, pp.147-152, 155-156 Repsol YPF S.A., 2008 Consolidated Annual Accounts, pp.112-121, 126-129"
"Repsol YPF S.A., Cuentas Anuales 2009, pp.147-152, 155-156 Repsol YPF S.A., 2008 Consolidated Annual Accounts, pp.112-121, 126-129"
"Repsol YPF S.A., Informe de Gestion Consolidado 2009, pp.35-42, 74-77 Repsol YPF S.A., Cuentas Anuales 2009, pp.147-152, 155-156 Repsol, 2009 Business Areas, p.63-81"
Repsol YPF S.A., Informe de Gestion Consolidado 2009, pp.35-42, 74-77 (only for several projects)
Repsol YPF S.A., 2008 Con-solidated Annual Accounts, p.8
Repsol YPF S.A., 2008 Consolidated Annual Accounts, pp.8-9
RosneftRosneft Oil Company, Annual Report 2009, pp.180-182
Rosneft Oil Company, Annual Report 2009, p.182
Rosneft Oil Company, Annual Report 2009, pp.245-247, 193-194
Rosneft Oil Company, Annual Report 2009, pp.3, 32, 54-63
Rosneft Oil Company, Annual Report 2009, p.
Rosneft Oil Company, Annual Report 2009, p.
Saudi-Aramco
http://www.saudiaramco.com/irj/servlet/prt/portal/prtroot/com.sap.portal.navigation.portallauncher.anonymous?favlnk=%2FSaudiAramcoPublic%2Fdocs%2FOur+Business%2FInt%27l+Operations%2FSubsidiaries&ln=en
"http://www.saudiaramco.com/irj/servlet/prt/portal/prtroot/com.sap.portal.navigation.portallauncher.anonymous?favlnk=%2FSaudiAramcoPublic%2Fdocs%2FOur+Business%2FDomestic+Joint+and+Equity+Ventures%2FDomestic+Upstream+Affiliates&ln=en http://www.saudiaramco.com/irj/servlet/prt/portal/prtroot/com.sap.portal.navigation.portallauncher.anonymous?favlnk=%2FSaudiAramcoPublic%2Fdocs%2FOur+Business%2FInt%27l+Operations%2FInternational+Affiliates&ln=en "
ShellShell, Annual Report and Form 20-F 2009, Exhibit 8, E2-E5
Shell, Annual Report and Form 20-F 2009, Ex-hibit 8, E2-E5
Shell, Annual Report and Form 20-F 2009, p.115
Shell, Annual Report and Form 20-F 2009, p.115
Shell, Annual Report and Form 20-F 2009, pp.23-28
Shell, Annual Report and Form 20-F 2009, p.94
Shell, Annual Report and Form 20-F 2009, pp.94-95
Sinopec
China Petroleum & Chemical Corporation, Annual Report 2009, pp.74, 128, 184
China Petroleum & Chemical Cor-poration, Annual Report 2009, pp.74, 128, 184
China Petroleum & Chemical Corporation, Annual Report 2009, pp.102, 166
China Petroleum & Chemical Corporation, Annual Report 2009, p.102
China Petrole-um & Chemical Corporation, Annual Report 2009, pp.75,84
China Petro-leum & Chemical Corporation, An-nual Report 2009, pp.75, 138
SNPC
SNPC, Synthese des Rapports de l'Audit Financier et de l'Audit des Procedures Convenues de la SNPC, 2008
SOCAR SOCAR, Annual Report 2007, pp.12-13
"SOCAR, Annual Report 2007, pp.12-13 - http://www.socar.az/combestab-lishments-en.html (2010-04-29)"
http://www.socar.az/projects-en.html (2010-04-29)
http://www.socar.az/projects-en.html (2010-04-29)
SOCAR, Annual Report 2007, p.44
Sonangol
"Sonangol, Relatorio de Contas 2008, p.22 http://www.sonangol.co.ao/wps/portal/!ut/p/c1/04_SB8K8x-LLM9MSSzPy8xBz9C-P0os3gDC2NnH0NjAxd-HA38Pb1NDSwsjAwjQD-wfpAKrAARwNoPJoJh-giTMAqH2KCX94lyBAm7-eRn5uqX5CdHeRR7q-gIAAm_NPE!/dl2/d1/L2dJQSEvUUt3QS9ZQn-B3LzZfMDgzQ0wxMzBE-QTBPSEs1MVA4MjAwM-DAwMDA!/ (2010-05-04)"
"Sonangol, Relatorio de Contas 2008, pp.22,51 http://www.sonangol.co.ao/wps/portal/!ut/p/c1/04_SB-8K8xLLM9MSSzPy8xBz9C-P0os3gDC2NnH0NjAxd-HA38Pb1NDlyBDAwjQD-wfpAKrAARwN9P088nNT 9Quy88oBiDi2Qg!!/dl2/d1/L2dJQSEvUUt3QS9ZQn-B3LzZfMDgzQ0wxMzBE-QTBPSEs1MTk4MjAwM-DAwMDA!/ (2010-05-04)"
"Sonangol, Relatorio de Contas 2008, p.51 http://www.sonangol.co.ao/wps/wcm/connect/1fabe00048cf7ee586d697467ef0967d/GAD-MC-1003001P.pdf?MOD=AJPERES&CACHEID=1fabe00048cf7ee586d697467ef0967d "
"Sonangol, Relatorio de Contas 2008, p.51 http://www.sonan-gol.co.ao/wps/wcm/connect/1fabe00048cf7ee586d697467ef0967d/GAD-MC-1003001P.pdf?MOD=AJPERES&CACHEID=1fabe00048cf7ee586d697467ef0967d "
Sonangol, Rela-torio de Contas 2008, pp.1-3 (Relatorio dos Auditores)
Sonangol, Relatorio de Contas 2008, pp.1-3 (Relatorio dos Auditores)
question # 29 30 31 32 33 34 35 36
max. score 1.0 1.0 1.0 1.0 1.0 1.0 1.0 1.0
Sonatrach Rapport annuel 2008, pp. 112 - 113
Rapport annuel 2008, pp. 112 - 113
"http://www.sonatrach-dz.com/NEW/nos-opera-tions.html (2010-03-22) http://www.sonatrach-dz.com/NEW/PDF/Carte-Algeria2007.pdf - http://www.sonatrach-dz.com/NEW/nos-activitees.html"
Rapport annuel 2008, p, 114
Statoil
"Statoil, Statutory Report 2009, p.127 Statoil, Annual Report on Form 20-F 2009, p.85"
"Statoil, Statutory Report 2009, p.127 Statoil, Annual Report on Form 20-F 2009, p.39"
Statoil, Statutory Report 2009, p.127
Statoil, Statutory Report 2009, p.127
"Statoil, Factbook 2009, pp.6-7, 33,37 Statoil, Annual Report on Form 20-F 2009, pp.29-60"
"Statoil, Statu-tory Report 2009, p.33 Statoil, An-nual Report on Form 20-F 2009, p.291"
"Statoil, Statu-tory Report 2009, p.143 Statoil, Annual Report on Form 20-F 2009, pp.291-292"
SuncorPetro-Canada, 2008 Annual Information Form, p.4
Petro-Canada, 2008 Annual Information Form, p.4.
"Petro-Canada, 2008 Annual Information Form, pp.4, 14-17, 19-35 Suncor Energy Inc., 2009 Annual Report, pp.33,38,41,43, 103"
Suncor Energy Inc., 2009 An-nual Report, pp.30, 55
"Suncor Energy Inc., 2009 Annual Report, pp.57-58 Petro-Canada, 2008 Annual Report, pp.63-64"
TalismanTalisman Energy, Annual Information Form 2009, p.1
Talisman En-ergy, Annual In-formation Form 2009, p.1
Talisman Energy, Annual Information Form 2009, pp.5-14
Talisman Energy, 2009 nnual Report, p.56
Talisman Energy, 2009 nnual Report, pp.50-51
Total
"Total 2009 20-F Form, F-90 (237) Total, 2009 Registration Document, pp.260-261"
"Total 2009 20-F Form, F-37-40, F-90 (184-187, 237) - Total, 2009 Registration Document, pp.260-261"
"Total, 2009 factbook, pp.73-104 - Total, 2009 20-F Form, pp.13-17 Total, Registration docu-ment 2009, pp.14-17"
Total 2009 20-F Form, p.ii
Total 2009 20-F Form, p.F-1, F-2 (148,149)
Winter-shall
http://www.wintershall.com/beteiligungen.html?&l=1
http://www.win-tershall.com/beteiligungen.html?&l=1
"BASF Annual Report 2009, p.178 http://www.wintershall.com/beteiligungen.html?&l=1"
"BASF Annual Report 2009, p.178 http://www.wintershall.com/beteiligungen.html?&l=1"
"http://www.wintershall.com/exploration_produk-tion.html?&L=0 (2010-03-23) - Wintershall, Shaping the future - 2009 brochure, pp.24-42 BASF Annual Report 2009, pp.76-77"
BASF Annual Report 2009, p.137
BASF Annual Re-port 2009, p.137
Woodside Woodside Petroleum Ltd., Annual Report 2009, p.126
Woodside Petroleum Ltd., Annual Report 2009, p.126
Woodside Petroleum Ltd., Annual Report 2009, pp.124-125
Woodside Petroleum Ltd., Annual Report 2009, p.125
Woodside Petroleum Ltd., Annual Report 2009, pp.16-25
http://www.woodside.com.au/Our+Business/ (2010-04-30)
Woodside Petroleum Ltd., Annual Report 2009, p.130
Woodside Petroleum Ltd., Annual Report 2009, p.130
SOURCES - ORGANISATIONAL DISCLOSURE 2/2 CONTINUED
SCORES - NOC-SPECIFIC QUESTIONS
question # 47 48 49 50 51 Σ n.a
max. score 1.0 1.0 1.0 1.0 1.0
CNOOC 0.0 0.0
CNPC 0.0 0.0
Gazprom n.a. n.a. 0.0 2.0
GEPetrol 1.0 1.0 0.0
Inpex 1.0 n.a. n.a. 1.0 2.0
KazMG 1.0 0.5 1.5 0.0
KPC 1.0 1.0 0.0
NIOC 1.0 1.0 0.0
NNPC 1.0 1.0 2.0 0.0
ONGC n.a. n.a. 0.0 2.0
PDVSA 1.0 1.0 2.0 0.0
Pemex 1.0 0.5 1.0 1.0 1.0 4.5 0.0
Petrobras 1.0 n.a. n.a. 1.0 2.0
PetroChina n.a. n.a. 0.0 2.0
Petronas 1.0 0.5 1.5 0.0
QatarPet 1.0 1.0 0.0
Rosneft 1.0 n.a. n.a. 1.0 2.0
SaudiAramco 1.0 1.0 0.0
Sinopec 1.0 1.0 n.a. n.a. 2.0 2.0
SNPC 0.0 0.0
SOCAR 1.0 1.0 2.0 0.0
Sonangol 1.0 1.0 1.0 3.0 0.0
Sonatrach 0.0 0.0
Statoil 1.0 1.0 1.0 n.a. n.a. 3.0 2.0
84 Transparency International 85Promoting Revenue Transparency
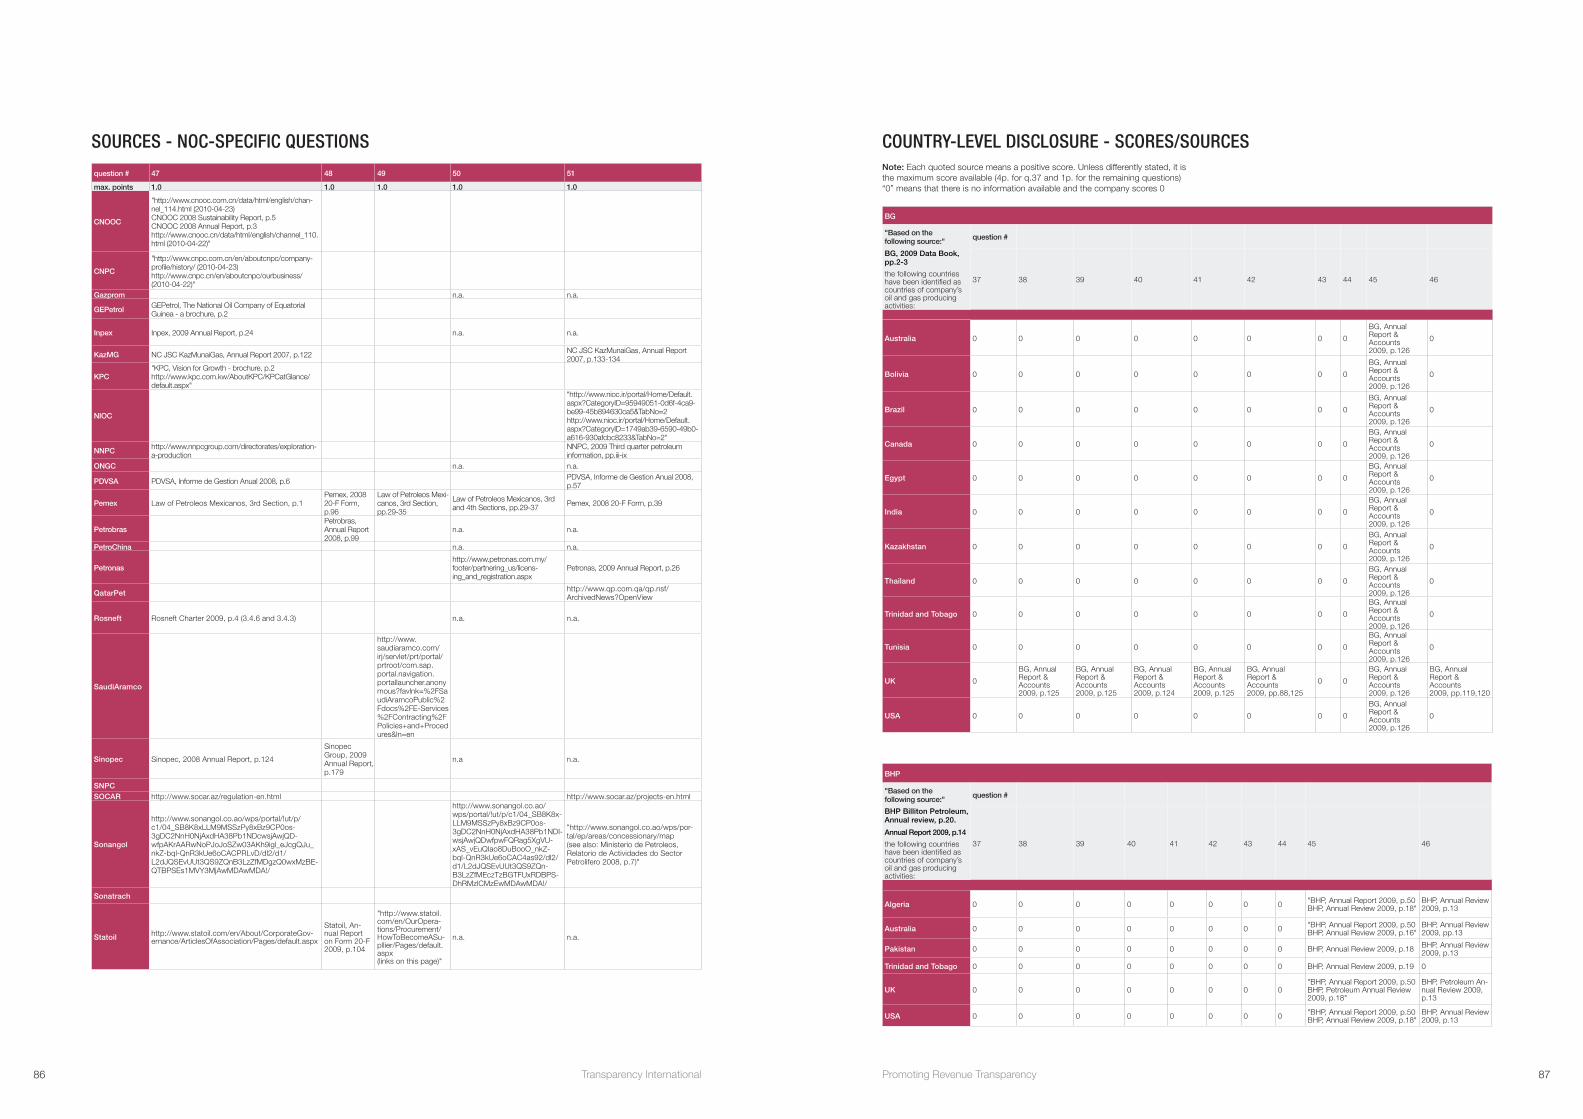
SOURCES - NOC-SPECIFIC QUESTIONS
question # 47 48 49 50 51
max. points 1.0 1.0 1.0 1.0 1.0
CNOOC
"http://www.cnooc.com.cn/data/html/english/chan-nel_114.html (2010-04-23) CNOOC 2008 Sustainability Report, p.5 CNOOC 2008 Annual Report, p.3 http://www.cnooc.cn/data/html/english/channel_110.html (2010-04-22)"
CNPC
"http://www.cnpc.com.cn/en/aboutcnpc/company-profile/history/ (2010-04-23) http://www.cnpc.cn/en/aboutcnpc/ourbusiness/ (2010-04-22)"
Gazprom n.a. n.a.
GEPetrol GEPetrol, The National Oil Company of Equatorial Guinea - a brochure, p.2
Inpex Inpex, 2009 Annual Report, p.24 n.a. n.a.
KazMG NC JSC KazMunaiGas, Annual Report 2007, p.122 NC JSC KazMunaiGas, Annual Report 2007, p.133-134
KPC"KPC, Vision for Growth - brochure, p.2 http://www.kpc.com.kw/AboutKPC/KPCatGlance/default.aspx"
NIOC
"http://www.nioc.ir/portal/Home/Default.aspx?CategoryID=95949051-0d6f-4ca9-be99-45b894630ca5&TabNo=2 http://www.nioc.ir/portal/Home/Default.aspx?CategoryID=1749ab39-6590-49b0-a616-930afcbc8233&TabNo=2"
NNPC http://www.nnpcgroup.com/directorates/exploration-a-production
NNPC, 2009 Third quarter petroleum information, pp.iii-ix
ONGC n.a. n.a.
PDVSA PDVSA, Informe de Gestion Anual 2008, p.6 PDVSA, Informe de Gestion Anual 2008, p.57
Pemex Law of Petroleos Mexicanos, 3rd Section, p.1Pemex, 2008 20-F Form, p.96
Law of Petroleos Mexi-canos, 3rd Section, pp.29-35
Law of Petroleos Mexicanos, 3rd and 4th Sections, pp.29-37 Pemex, 2008 20-F Form, p.39
PetrobrasPetrobras, Annual Report 2008, p.99
n.a. n.a.
PetroChina n.a. n.a.
Petronashttp://www.petronas.com.my/footer/partnering_us/licens-ing_and_registration.aspx
Petronas, 2009 Annual Report, p.26
QatarPet http://www.qp.com.qa/qp.nsf/ArchivedNews?OpenView
Rosneft Rosneft Charter 2009, p.4 (3.4.6 and 3.4.3) n.a. n.a.
SaudiAramco
http://www.saudiaramco.com/irj/servlet/prt/portal/prtroot/com.sap.portal.navigation.portallauncher.anonymous?favlnk=%2FSaudiAramcoPublic%2Fdocs%2FE-Services%2FContracting%2FPolicies+and+Procedures&ln=en
Sinopec Sinopec, 2008 Annual Report, p.124
Sinopec Group, 2009 Annual Report, p.179
n.a n.a.
SNPCSOCAR http://www.socar.az/regulation-en.html http://www.socar.az/projects-en.html
Sonangol
http://www.sonangol.co.ao/wps/portal/!ut/p/c1/04_SB8K8xLLM9MSSzPy8xBz9CP0os-3gDC2NnH0NjAxdHA38Pb1NDcwsjAwjQD-wfpAKrAARwNoPJoJoSZw03AKh9igl_eJcgQJu_nkZ-bql-QnR3kUe6oCACPRLvD/dl2/d1/L2dJQSEvUUt3QS9ZQnB3LzZfMDgzQ0wxMzBE-QTBPSEs1MVY3MjAwMDAwMDA!/
http://www.sonangol.co.ao/wps/portal/!ut/p/c1/04_SB8K8x-LLM9MSSzPy8xBz9CP0os-3gDC2NnH0NjAxdHA38Pb1NDI-wsjAwjQDwfpwFQRag5XgVU-xAS_vEuQIao8DuBooO_nkZ-bql-QnR3kUe6oCAC4as92/dl2/d1/L2dJQSEvUUt3QS9ZQn-B3LzZfMEczTzBGTFUxRDBPS-DhRMzlCMzEwMDAwMDA!/
"http://www.sonangol.co.ao/wps/por-tal/ep/areas/concessionary/map (see also: Ministerio de Petroleos, Relatorio de Actividades do Sector Petrolifero 2008, p.7)"
Sonatrach
Statoil http://www.statoil.com/en/About/CorporateGov-ernance/ArticlesOfAssociation/Pages/default.aspx
Statoil, An-nual Report on Form 20-F 2009, p.104
"http://www.statoil.com/en/OurOpera-tions/Procurement/HowToBecomeASu-pllier/Pages/default.aspx (links on this page)"
n.a. n.a.
BG
"Based on the following source:" question #
BG, 2009 Data Book, pp.2-3
the following countries have been identified as countries of company’s oil and gas producing activities:
37 38 39 40 41 42 43 44 45 46
Australia 0 0 0 0 0 0 0 0
BG, Annual Report & Accounts 2009, p.126
0
Bolivia 0 0 0 0 0 0 0 0
BG, Annual Report & Accounts 2009, p.126
0
Brazil 0 0 0 0 0 0 0 0
BG, Annual Report & Accounts 2009, p.126
0
Canada 0 0 0 0 0 0 0 0
BG, Annual Report & Accounts 2009, p.126
0
Egypt 0 0 0 0 0 0 0 0
BG, Annual Report & Accounts 2009, p.126
0
India 0 0 0 0 0 0 0 0
BG, Annual Report & Accounts 2009, p.126
0
Kazakhstan 0 0 0 0 0 0 0 0
BG, Annual Report & Accounts 2009, p.126
0
Thailand 0 0 0 0 0 0 0 0
BG, Annual Report & Accounts 2009, p.126
0
Trinidad and Tobago 0 0 0 0 0 0 0 0
BG, Annual Report & Accounts 2009, p.126
0
Tunisia 0 0 0 0 0 0 0 0
BG, Annual Report & Accounts 2009, p.126
0
UK 0
BG, Annual Report & Accounts 2009, p.125
BG, Annual Report & Accounts 2009, p.125
BG, Annual Report & Accounts 2009, p.124
BG, Annual Report & Accounts 2009, p.125
BG, Annual Report & Accounts 2009, pp.88,125
0 0
BG, Annual Report & Accounts 2009, p.126
BG, Annual Report & Accounts 2009, pp.119,120
USA 0 0 0 0 0 0 0 0
BG, Annual Report & Accounts 2009, p.126
0
COUNTRY-LEVEL DISCLOSURE - SCORES/SOURCES
BHP
"Based on the following source:" question #
BHP Billiton Petroleum, Annual review, p.20.
Annual Report 2009, p.14
the following countries have been identified as countries of company’s oil and gas producing activities:
37 38 39 40 41 42 43 44 45 46
Algeria 0 0 0 0 0 0 0 0 "BHP, Annual Report 2009, p.50 BHP, Annual Review 2009, p.18"
BHP, Annual Review 2009, p.13
Australia 0 0 0 0 0 0 0 0 "BHP, Annual Report 2009, p.50 BHP, Annual Review 2009, p.16"
BHP, Annual Review 2009, pp.13
Pakistan 0 0 0 0 0 0 0 0 BHP, Annual Review 2009, p.18 BHP, Annual Review 2009, p.13
Trinidad and Tobago 0 0 0 0 0 0 0 0 BHP, Annual Review 2009, p.19 0
UK 0 0 0 0 0 0 0 0"BHP, Annual Report 2009, p.50 BHP, Petroleum Annual Review 2009, p.18"
BHP, Petroleum An-nual Review 2009, p.13
USA 0 0 0 0 0 0 0 0 "BHP, Annual Report 2009, p.50 BHP, Annual Review 2009, p.18"
BHP, Annual Review 2009, p.13
Note: Each quoted source means a positive score. Unless differently stated, it is the maximum score available (4p. for q.37 and 1p. for the remaining questions) “0” means that there is no information available and the company scores 0
86 Transparency International 87Promoting Revenue Transparency
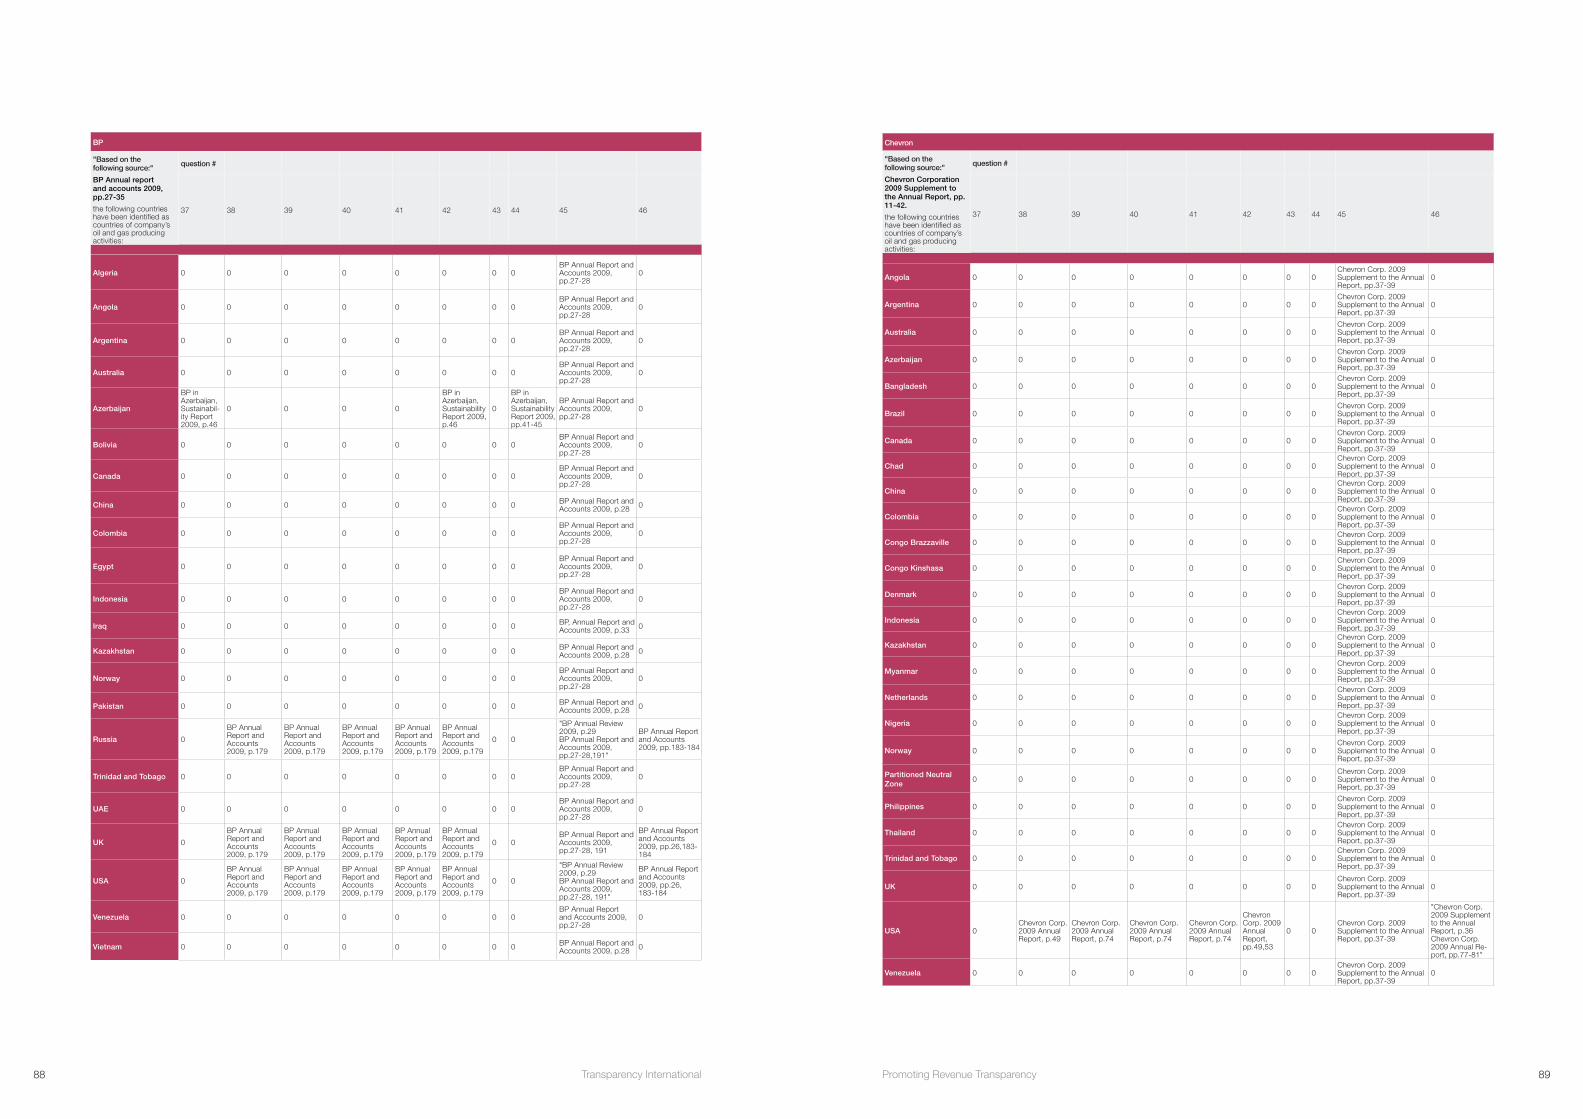
BP
"Based on the following source:" question #
BP Annual report and accounts 2009, pp.27-35
the following countries have been identified as countries of company’s oil and gas producing activities:
37 38 39 40 41 42 43 44 45 46
Algeria 0 0 0 0 0 0 0 0BP Annual Report and Accounts 2009, pp.27-28
0
Angola 0 0 0 0 0 0 0 0BP Annual Report and Accounts 2009, pp.27-28
0
Argentina 0 0 0 0 0 0 0 0BP Annual Report and Accounts 2009, pp.27-28
0
Australia 0 0 0 0 0 0 0 0BP Annual Report and Accounts 2009, pp.27-28
0
Azerbaijan
BP in Azerbaijan, Sustainabil-ity Report 2009, p.46
0 0 0 0
BP in Azerbaijan, Sustainability Report 2009, p.46
0
BP in Azerbaijan, Sustainability Report 2009, pp.41-45
BP Annual Report and Accounts 2009, pp.27-28
0
Bolivia 0 0 0 0 0 0 0 0BP Annual Report and Accounts 2009, pp.27-28
0
Canada 0 0 0 0 0 0 0 0BP Annual Report and Accounts 2009, pp.27-28
0
China 0 0 0 0 0 0 0 0 BP Annual Report and Accounts 2009, p.28 0
Colombia 0 0 0 0 0 0 0 0BP Annual Report and Accounts 2009, pp.27-28
0
Egypt 0 0 0 0 0 0 0 0BP Annual Report and Accounts 2009, pp.27-28
0
Indonesia 0 0 0 0 0 0 0 0BP Annual Report and Accounts 2009, pp.27-28
0
Iraq 0 0 0 0 0 0 0 0 BP, Annual Report and Accounts 2009, p.33 0
Kazakhstan 0 0 0 0 0 0 0 0 BP Annual Report and Accounts 2009, p.28 0
Norway 0 0 0 0 0 0 0 0BP Annual Report and Accounts 2009, pp.27-28
0
Pakistan 0 0 0 0 0 0 0 0 BP Annual Report and Accounts 2009, p.28 0
Russia 0
BP Annual Report and Accounts 2009, p.179
BP Annual Report and Accounts 2009, p.179
BP Annual Report and Accounts 2009, p.179
BP Annual Report and Accounts 2009, p.179
BP Annual Report and Accounts 2009, p.179
0 0
"BP Annual Review 2009, p.29 BP Annual Report and Accounts 2009, pp.27-28,191"
BP Annual Report and Accounts 2009, pp.183-184
Trinidad and Tobago 0 0 0 0 0 0 0 0BP Annual Report and Accounts 2009, pp.27-28
0
UAE 0 0 0 0 0 0 0 0BP Annual Report and Accounts 2009, pp.27-28
0
UK 0
BP Annual Report and Accounts 2009, p.179
BP Annual Report and Accounts 2009, p.179
BP Annual Report and Accounts 2009, p.179
BP Annual Report and Accounts 2009, p.179
BP Annual Report and Accounts 2009, p.179
0 0BP Annual Report and Accounts 2009, pp.27-28, 191
BP Annual Report and Accounts 2009, pp.26,183-184
USA 0
BP Annual Report and Accounts 2009, p.179
BP Annual Report and Accounts 2009, p.179
BP Annual Report and Accounts 2009, p.179
BP Annual Report and Accounts 2009, p.179
BP Annual Report and Accounts 2009, p.179
0 0
"BP Annual Review 2009, p.29 BP Annual Report and Accounts 2009, pp.27-28, 191"
BP Annual Report and Accounts 2009, pp.26, 183-184
Venezuela 0 0 0 0 0 0 0 0BP Annual Report and Accounts 2009, pp.27-28
0
Vietnam 0 0 0 0 0 0 0 0 BP Annual Report and Accounts 2009, p.28 0
Chevron
"Based on the following source:" question #
Chevron Corporation 2009 Supplement to the Annual Report, pp. 11-42.
the following countries have been identified as countries of company’s oil and gas producing activities:
37 38 39 40 41 42 43 44 45 46
Angola 0 0 0 0 0 0 0 0Chevron Corp. 2009 Supplement to the Annual Report, pp.37-39
0
Argentina 0 0 0 0 0 0 0 0Chevron Corp. 2009 Supplement to the Annual Report, pp.37-39
0
Australia 0 0 0 0 0 0 0 0Chevron Corp. 2009 Supplement to the Annual Report, pp.37-39
0
Azerbaijan 0 0 0 0 0 0 0 0Chevron Corp. 2009 Supplement to the Annual Report, pp.37-39
0
Bangladesh 0 0 0 0 0 0 0 0Chevron Corp. 2009 Supplement to the Annual Report, pp.37-39
0
Brazil 0 0 0 0 0 0 0 0Chevron Corp. 2009 Supplement to the Annual Report, pp.37-39
0
Canada 0 0 0 0 0 0 0 0Chevron Corp. 2009 Supplement to the Annual Report, pp.37-39
0
Chad 0 0 0 0 0 0 0 0Chevron Corp. 2009 Supplement to the Annual Report, pp.37-39
0
China 0 0 0 0 0 0 0 0Chevron Corp. 2009 Supplement to the Annual Report, pp.37-39
0
Colombia 0 0 0 0 0 0 0 0Chevron Corp. 2009 Supplement to the Annual Report, pp.37-39
0
Congo Brazzaville 0 0 0 0 0 0 0 0Chevron Corp. 2009 Supplement to the Annual Report, pp.37-39
0
Congo Kinshasa 0 0 0 0 0 0 0 0Chevron Corp. 2009 Supplement to the Annual Report, pp.37-39
0
Denmark 0 0 0 0 0 0 0 0Chevron Corp. 2009 Supplement to the Annual Report, pp.37-39
0
Indonesia 0 0 0 0 0 0 0 0Chevron Corp. 2009 Supplement to the Annual Report, pp.37-39
0
Kazakhstan 0 0 0 0 0 0 0 0Chevron Corp. 2009 Supplement to the Annual Report, pp.37-39
0
Myanmar 0 0 0 0 0 0 0 0Chevron Corp. 2009 Supplement to the Annual Report, pp.37-39
0
Netherlands 0 0 0 0 0 0 0 0Chevron Corp. 2009 Supplement to the Annual Report, pp.37-39
0
Nigeria 0 0 0 0 0 0 0 0Chevron Corp. 2009 Supplement to the Annual Report, pp.37-39
0
Norway 0 0 0 0 0 0 0 0Chevron Corp. 2009 Supplement to the Annual Report, pp.37-39
0
Partitioned Neutral Zone
0 0 0 0 0 0 0 0Chevron Corp. 2009 Supplement to the Annual Report, pp.37-39
0
Philippines 0 0 0 0 0 0 0 0Chevron Corp. 2009 Supplement to the Annual Report, pp.37-39
0
Thailand 0 0 0 0 0 0 0 0Chevron Corp. 2009 Supplement to the Annual Report, pp.37-39
0
Trinidad and Tobago 0 0 0 0 0 0 0 0Chevron Corp. 2009 Supplement to the Annual Report, pp.37-39
0
UK 0 0 0 0 0 0 0 0Chevron Corp. 2009 Supplement to the Annual Report, pp.37-39
0
USA 0Chevron Corp. 2009 Annual Report, p.49
Chevron Corp. 2009 Annual Report, p.74
Chevron Corp. 2009 Annual Report, p.74
Chevron Corp. 2009 Annual Report, p.74
Chevron Corp. 2009 Annual Report, pp.49,53
0 0Chevron Corp. 2009 Supplement to the Annual Report, pp.37-39
"Chevron Corp. 2009 Supplement to the Annual Report, p.36 Chevron Corp. 2009 Annual Re-port, pp.77-81"
Venezuela 0 0 0 0 0 0 0 0Chevron Corp. 2009 Supplement to the Annual Report, pp.37-39
0
88 Transparency International 89Promoting Revenue Transparency

CNOOC
"Based on the following source:" question #
“CNOOC 2008 Annual Report, p.22 http://www.cnooc.com.cn/data/html/english/channel_118.html “
the following countries have been identified as countries of company’s oil and gas producing activities:
37 38 39 40 41 42 43 44 45 46
Australia 0 0 0 0 0 0 0 0 0 0
China CNOOC, Annual Report 2008, p.13 0 0 0 0 CNOOC, Annual
Report 2008, p.13CNOOC, Annual Report 2008, p.13 0 CNOOC, Annual Report
2008, p.11 0
Indonesia 0 0 0 0 0 0 0 0 0 0
Nigeria 0 0 0 0 0 0 0 0 0 0
CNPC
"Based on the following source:" question #
CNPC 2008 Annual Report, pp.41-46
the following countries have been identified as countries of company’s oil and gas producing activities:
37 38 39 40 41 42 43 44 45 46
Azerbaijan 0 0 0 0 0 0 0 0 0 0
Canada 0 0 0 0 0 0 0 0 0 0
Central African Republic 0 0 0 0 0 0 0 0 0 0
Chad 0 0 0 0 0 0 0 0 CNPC, 2008 Annual Report, p.42 0
China 0 0 0 0 0 0 0 0 CNPC, 2008 Annual Report, pp.26-27
CNPC, 2008 Annual Report, p.25
Cuba 0 0 0 0 0 0 0 0 0 0
Ecuador 0 0 0 0 0 0 0 0 0 0
Equatorial Guinea 0 0 0 0 0 0 0 0 0 0
Indonesia 0 0 0 0 0 0 0 0 0 0
Iraq 0 0 0 0 0 0 0 0 0 0
Kazakhstan 0 0 0 0 0 0 0 0 CNPC, 2008 Annual Report, p.43 0
Libya 0 0 0 0 0 0 0 0 0 0
Mauritania 0 0 0 0 0 0 0 0 0 0
Mongolia 0 0 0 0 0 0 0 0 0 0
Myanmar 0 0 0 0 0 0 0 0 0 0
Nigeria 0 0 0 0 0 0 0 0 0 0
Oman 0 0 0 0 0 0 0 0 CNPC, 2008 Annual Report, p.45 0
Peru 0 0 0 0 0 0 0 0 0 0
Sudan 0 0 0 0 0 0 0 0 0 0
Thailand 0 0 0 0 0 0 0 0 0 0
Tunisia 0 0 0 0 0 0 0 0 0 0
Uzbekistan 0 0 0 0 0 0 0 0 0 0
Venezuela 0 0 0 0 0 0 0 0 0 0
Conoco
"Based on the following source:" question #
“ConocoPhillips 2009 Annual Report, pp.8-9”
the following countries have been identified as countries of company’s oil and gas producing activities:
37 38 39 40 41 42 43 44 45 46
Algeria 0 0 0 0 0 0 0 0 Conoco, 2008 10-K, p.12 0
Australia 0 Conoco, Annual Report 2008, p.95 0 0 0 0 0 0 Conoco, 2008 10-K,
pp.9-10 0
Canada 0Conoco, Annual Report 2008, pp.95,101
Conoco, Annual Report 2008, p.101
Conoco, Annual Report 2008, pp.101,105
Conoco, Annual Report 2008, p.101
Conoco, Annual Report 2008, p.101
0 0
"Conoco, Annual Report review 2009, pp.16,37 Conoco, Annual Report 2008, p.103"
"Conoco, Annual Re-port review 2009, p.35 Conoco, Annual Report 2008, pp.98-100"
China 0 0 0 0 0 0 0 0 Conoco, 2008 10-K, p.11 0
Ecuador 0 0 0 0 0 0 0 0 Conoco, 2008 10-K, p.6 0
Indonesia 0 0 0 0 0 0 0 0 Conoco, 2008 10-K, p.10 0
Libya 0 0 0 0 0 0 0 0 Conoco, 2008 10-K, p.12 0
Nigeria 0 0 0 0 0 0 0 0 Conoco, 2008 10-K, p.12 0
Norway 0 Conoco, Annual Report 2008, p.95 0 0 0 0 0 0 Conoco, 2008 10-K,
p.5 0
Qatar 0 0 0 0 0 0 0 0 Conoco Phillips, 2009 Fact Book, p.28 0
Russia 0Conoco, An-nual Report 2008, p.95
ConocoPhillips, 10-K 2009, p.148
ConocoPhillips, 10-K 2009, p.149
ConocoPhillips, 10-K 2009, p.150
Conoco-Phillips, 10-K 2009, p.151
0 0
"Conoco Annual Report 2008, p.18 Conoco, 2008 10-K, p.12"
Conoco, Annual Report review 2009, pp.16,35
Timor-Leste 0 0 0 0 0 0 0 0Conoco Phillips, 2009 fact Book, p.35 (JPDA - Bayu-Undan project)
0
UK 0 Conoco, Annual Report 2008, p.95 0 0 0 0 0 0 Conoco, 2008 10-K,
p.6 0
USA 0
"Conoco, Annual Report review 2009, p.36 Conoco, Annual Report 2008, p.95"
Conoco, Annual Report 2008, pp.33, 101
Conoco, Annual Report 2008, pp.101, 105
Conoco, Annual Report 2008, p.101
Conoco, Annual Report 2008, pp.94,101
0 0
"Conoco, Annual Report review 2009, pp.16,37 Conoco, Annual Report 2008, p.103"
"Conoco, Annual Report review 2009, pp.16,35 Conoco, Annual Report 2008, pp.98-100"
Vietnam 0 0 0 0 0 0 0 0 Conoco, 2008 10-K, p.11 0
Devon
"Based on the following source:" question #
Devon Energy, Fact sheet 2009, p.3
the following countries have been identified as countries of company’s oil and gas producing activities:
37 38 39 40 41 42 43 44 45 46
Azerbaijan 0 0 0 0 0 0 0 0 0 0
Brazil 0 0 0 0 0 0 0 0 0 0
Canada 0Devon Energy Corp. 10-K 2009, pp.123,129
0Devon Energy Corp. 10-K 2009, p.128
Devon Energy Corp. 10-K 2009, pp.116,123
Devon Energy Corp. 10-K 2009, pp.116,123,129
0 0 Devon, Factsheet 2009, p.4
"Devon, Factsheet 2009, p.4 Devon Energy Corp. 10-K 2009, p.130"
China 0 0 0 0 0 0 0 0 0 0
USA 0Devon Energy Corp. 10-K 2009, pp.123,129
0Devon Energy Corp. 10-K 2009, p.128
Devon Energy Corp. 10-K 2009, pp.116,123
Devon Energy Corp. 10-K 2009, pp.116,123,129
0 0 Devon, Factsheet 2009, p.4
"Devon, Factsheet 2009, p.4 Devon Energy Corp. 10-K 2009, p.130"
90 Transparency International 91Promoting Revenue Transparency
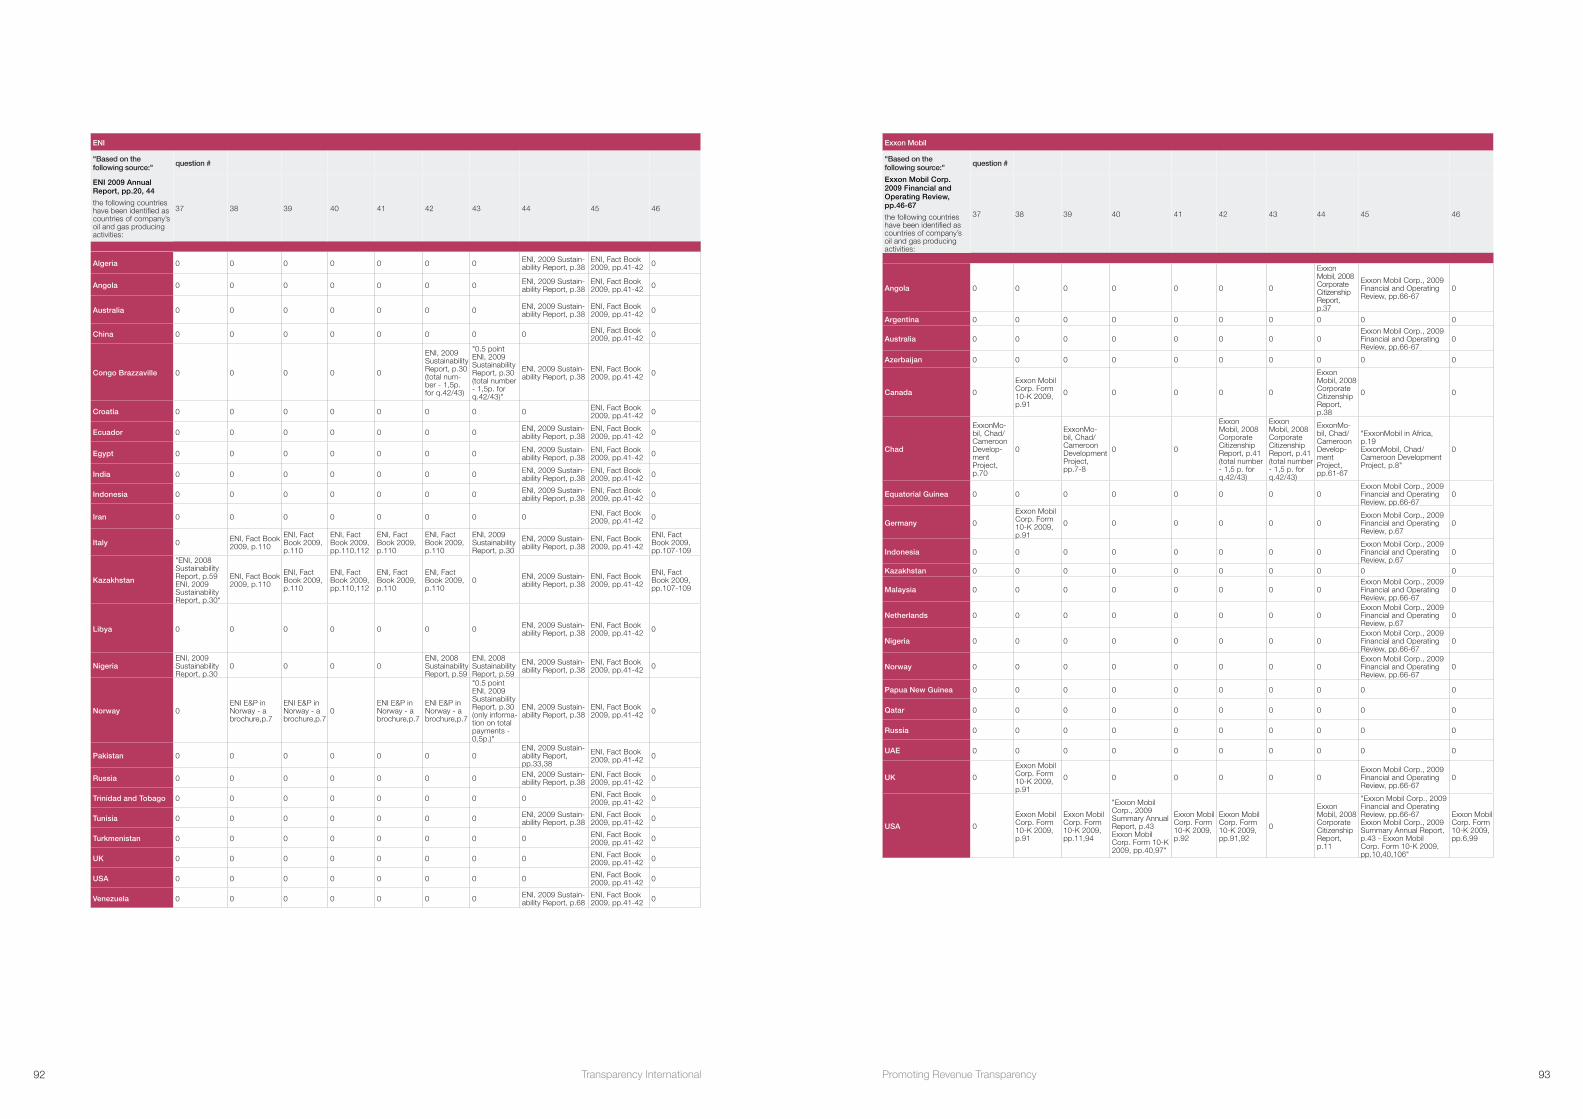
ENI
"Based on the following source:" question #
ENI 2009 Annual Report, pp.20, 44
the following countries have been identified as countries of company’s oil and gas producing activities:
37 38 39 40 41 42 43 44 45 46
Algeria 0 0 0 0 0 0 0 ENI, 2009 Sustain-ability Report, p.38
ENI, Fact Book 2009, pp.41-42 0
Angola 0 0 0 0 0 0 0 ENI, 2009 Sustain-ability Report, p.38
ENI, Fact Book 2009, pp.41-42 0
Australia 0 0 0 0 0 0 0 ENI, 2009 Sustain-ability Report, p.38
ENI, Fact Book 2009, pp.41-42 0
China 0 0 0 0 0 0 0 0 ENI, Fact Book 2009, pp.41-42 0
Congo Brazzaville 0 0 0 0 0
ENI, 2009 Sustainability Report, p.30 (total num-ber - 1,5p. for q.42/43)
"0.5 point ENI, 2009 Sustainability Report, p.30 (total number - 1,5p. for q.42/43)"
ENI, 2009 Sustain-ability Report, p.38
ENI, Fact Book 2009, pp.41-42 0
Croatia 0 0 0 0 0 0 0 0 ENI, Fact Book 2009, pp.41-42 0
Ecuador 0 0 0 0 0 0 0 ENI, 2009 Sustain-ability Report, p.38
ENI, Fact Book 2009, pp.41-42 0
Egypt 0 0 0 0 0 0 0 ENI, 2009 Sustain-ability Report, p.38
ENI, Fact Book 2009, pp.41-42 0
India 0 0 0 0 0 0 0 ENI, 2009 Sustain-ability Report, p.38
ENI, Fact Book 2009, pp.41-42 0
Indonesia 0 0 0 0 0 0 0 ENI, 2009 Sustain-ability Report, p.38
ENI, Fact Book 2009, pp.41-42 0
Iran 0 0 0 0 0 0 0 0 ENI, Fact Book 2009, pp.41-42 0
Italy 0 ENI, Fact Book 2009, p.110
ENI, Fact Book 2009, p.110
ENI, Fact Book 2009, pp.110,112
ENI, Fact Book 2009, p.110
ENI, Fact Book 2009, p.110
ENI, 2009 Sustainability Report, p.30
ENI, 2009 Sustain-ability Report, p.38
ENI, Fact Book 2009, pp.41-42
ENI, Fact Book 2009, pp.107-109
Kazakhstan
"ENI, 2008 Sustainability Report, p.59 ENI, 2009 Sustainability Report, p.30"
ENI, Fact Book 2009, p.110
ENI, Fact Book 2009, p.110
ENI, Fact Book 2009, pp.110,112
ENI, Fact Book 2009, p.110
ENI, Fact Book 2009, p.110
0 ENI, 2009 Sustain-ability Report, p.38
ENI, Fact Book 2009, pp.41-42
ENI, Fact Book 2009, pp.107-109
Libya 0 0 0 0 0 0 0 ENI, 2009 Sustain-ability Report, p.38
ENI, Fact Book 2009, pp.41-42 0
NigeriaENI, 2009 Sustainability Report, p.30
0 0 0 0ENI, 2008 Sustainability Report, p.59
ENI, 2008 Sustainability Report, p.59
ENI, 2009 Sustain-ability Report, p.38
ENI, Fact Book 2009, pp.41-42 0
Norway 0ENI E&P in Norway - a brochure,p.7
ENI E&P in Norway - a brochure,p.7
0ENI E&P in Norway - a brochure,p.7
ENI E&P in Norway - a brochure,p.7
"0.5 point ENI, 2009 Sustainability Report, p.30 (only informa-tion on total payments - 0,5p.)"
ENI, 2009 Sustain-ability Report, p.38
ENI, Fact Book 2009, pp.41-42 0
Pakistan 0 0 0 0 0 0 0ENI, 2009 Sustain-ability Report, pp.33,38
ENI, Fact Book 2009, pp.41-42 0
Russia 0 0 0 0 0 0 0 ENI, 2009 Sustain-ability Report, p.38
ENI, Fact Book 2009, pp.41-42 0
Trinidad and Tobago 0 0 0 0 0 0 0 0 ENI, Fact Book 2009, pp.41-42 0
Tunisia 0 0 0 0 0 0 0 ENI, 2009 Sustain-ability Report, p.38
ENI, Fact Book 2009, pp.41-42 0
Turkmenistan 0 0 0 0 0 0 0 0 ENI, Fact Book 2009, pp.41-42 0
UK 0 0 0 0 0 0 0 0 ENI, Fact Book 2009, pp.41-42 0
USA 0 0 0 0 0 0 0 0 ENI, Fact Book 2009, pp.41-42 0
Venezuela 0 0 0 0 0 0 0 ENI, 2009 Sustain-ability Report, p.68
ENI, Fact Book 2009, pp.41-42 0
Exxon Mobil
"Based on the following source:" question #
Exxon Mobil Corp. 2009 Financial and Operating Review, pp.46-67
the following countries have been identified as countries of company’s oil and gas producing activities:
37 38 39 40 41 42 43 44 45 46
Angola 0 0 0 0 0 0 0
Exxon Mobil, 2008 Corporate Citizenship Report, p.37
Exxon Mobil Corp., 2009 Financial and Operating Review, pp.66-67
0
Argentina 0 0 0 0 0 0 0 0 0 0
Australia 0 0 0 0 0 0 0 0Exxon Mobil Corp., 2009 Financial and Operating Review, pp.66-67
0
Azerbaijan 0 0 0 0 0 0 0 0 0 0
Canada 0
Exxon Mobil Corp. Form 10-K 2009, p.91
0 0 0 0 0
Exxon Mobil, 2008 Corporate Citizenship Report, p.38
0 0
Chad
ExxonMo-bil, Chad/Cameroon Develop-ment Project, p.70
0
ExxonMo-bil, Chad/Cameroon Development Project, pp.7-8
0 0
Exxon Mobil, 2008 Corporate Citizenship Report, p.41 (total number - 1,5 p. for q.42/43)
Exxon Mobil, 2008 Corporate Citizenship Report, p.41 (total number - 1,5 p. for q.42/43)
ExxonMo-bil, Chad/Cameroon Develop-ment Project, pp.61-67
"ExxonMobil in Africa, p.19 ExxonMobil, Chad/Cameroon Development Project, p.8"
0
Equatorial Guinea 0 0 0 0 0 0 0 0Exxon Mobil Corp., 2009 Financial and Operating Review, pp.66-67
0
Germany 0
Exxon Mobil Corp. Form 10-K 2009, p.91
0 0 0 0 0 0Exxon Mobil Corp., 2009 Financial and Operating Review, p.67
0
Indonesia 0 0 0 0 0 0 0 0Exxon Mobil Corp., 2009 Financial and Operating Review, p.67
0
Kazakhstan 0 0 0 0 0 0 0 0 0 0
Malaysia 0 0 0 0 0 0 0 0Exxon Mobil Corp., 2009 Financial and Operating Review, pp.66-67
0
Netherlands 0 0 0 0 0 0 0 0Exxon Mobil Corp., 2009 Financial and Operating Review, p.67
0
Nigeria 0 0 0 0 0 0 0 0Exxon Mobil Corp., 2009 Financial and Operating Review, pp.66-67
0
Norway 0 0 0 0 0 0 0 0Exxon Mobil Corp., 2009 Financial and Operating Review, pp.66-67
0
Papua New Guinea 0 0 0 0 0 0 0 0 0 0
Qatar 0 0 0 0 0 0 0 0 0 0
Russia 0 0 0 0 0 0 0 0 0 0
UAE 0 0 0 0 0 0 0 0 0 0
UK 0
Exxon Mobil Corp. Form 10-K 2009, p.91
0 0 0 0 0 0Exxon Mobil Corp., 2009 Financial and Operating Review, pp.66-67
0
USA 0
Exxon Mobil Corp. Form 10-K 2009, p.91
Exxon Mobil Corp. Form 10-K 2009, pp.11,94
"Exxon Mobil Corp., 2009 Summary Annual Report, p.43 Exxon Mobil Corp. Form 10-K 2009, pp.40,97"
Exxon Mobil Corp. Form 10-K 2009, p.92
Exxon Mobil Corp. Form 10-K 2009, pp.91,92
0
Exxon Mobil, 2008 Corporate Citizenship Report, p.11
"Exxon Mobil Corp., 2009 Financial and Operating Review, pp.66-67 Exxon Mobil Corp., 2009 Summary Annual Report, p.43 - Exxon Mobil Corp. Form 10-K 2009, pp.10,40,106"
Exxon Mobil Corp. Form 10-K 2009, pp.6,99
92 Transparency International 93Promoting Revenue Transparency
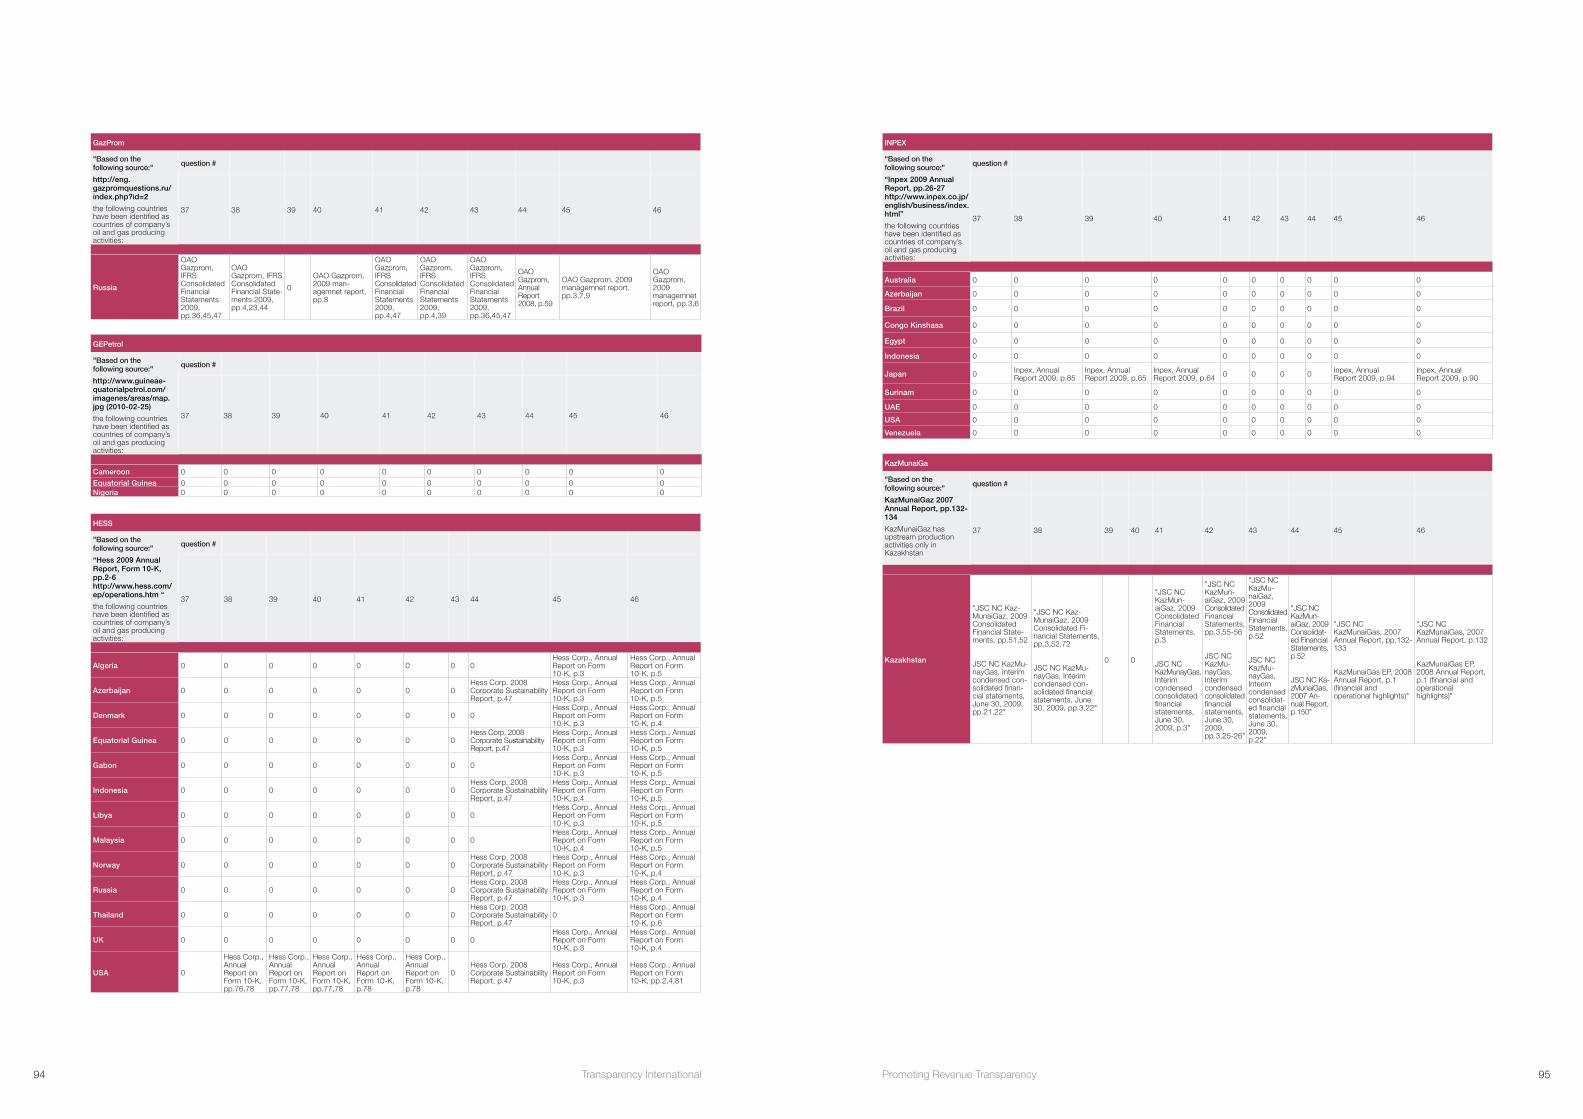
GazProm
"Based on the following source:" question #
http://eng.gazpromquestions.ru/index.php?id=2
the following countries have been identified as countries of company’s oil and gas producing activities:
37 38 39 40 41 42 43 44 45 46
Russia
OAO Gazprom, IFRS Consolidated Financial Statements 2009, pp.36,45,47
OAO Gazprom, IFRS Consolidated Financial State-ments 2009, pp.4,23,44
0
OAO Gazprom, 2009 man-agemnet report, pp.8
OAO Gazprom, IFRS Consolidated Financial Statements 2009, pp.4,47
OAO Gazprom, IFRS Consolidated Financial Statements 2009, pp.4,39
OAO Gazprom, IFRS Consolidated Financial Statements 2009, pp.36,45,47
OAO Gazprom, Annual Report 2008, p.59
OAO Gazprom, 2009 managemnet report, pp.3,7,9
OAO Gazprom, 2009 managemnet report, pp.3,6
GEPetrol
"Based on the following source:" question #
http://www.guineae-quatorialpetrol.com/imagenes/areas/map.jpg (2010-02-25)
the following countries have been identified as countries of company’s oil and gas producing activities:
37 38 39 40 41 42 43 44 45 46
Cameroon 0 0 0 0 0 0 0 0 0 0
Equatorial Guinea 0 0 0 0 0 0 0 0 0 0Nigeria 0 0 0 0 0 0 0 0 0 0
HESS
"Based on the following source:" question #
“Hess 2009 Annual Report, Form 10-K, pp.2-6 http://www.hess.com/ep/operations.htm “
the following countries have been identified as countries of company’s oil and gas producing activities:
37 38 39 40 41 42 43 44 45 46
Algeria 0 0 0 0 0 0 0 0Hess Corp., Annual Report on Form 10-K, p.3
Hess Corp., Annual Report on Form 10-K, p.5
Azerbaijan 0 0 0 0 0 0 0Hess Corp. 2008 Corporate Sustainability Report, p.47
Hess Corp., Annual Report on Form 10-K, p.3
Hess Corp., Annual Report on Form 10-K, p.5
Denmark 0 0 0 0 0 0 0 0Hess Corp., Annual Report on Form 10-K, p.3
Hess Corp., Annual Report on Form 10-K, p.4
Equatorial Guinea 0 0 0 0 0 0 0Hess Corp. 2008 Corporate Sustainability Report, p.47
Hess Corp., Annual Report on Form 10-K, p.3
Hess Corp., Annual Report on Form 10-K, p.5
Gabon 0 0 0 0 0 0 0 0Hess Corp., Annual Report on Form 10-K, p.3
Hess Corp., Annual Report on Form 10-K, p.5
Indonesia 0 0 0 0 0 0 0Hess Corp. 2008 Corporate Sustainability Report, p.47
Hess Corp., Annual Report on Form 10-K, p.4
Hess Corp., Annual Report on Form 10-K, p.5
Libya 0 0 0 0 0 0 0 0Hess Corp., Annual Report on Form 10-K, p.3
Hess Corp., Annual Report on Form 10-K, p.5
Malaysia 0 0 0 0 0 0 0 0Hess Corp., Annual Report on Form 10-K, p.4
Hess Corp., Annual Report on Form 10-K, p.5
Norway 0 0 0 0 0 0 0Hess Corp. 2008 Corporate Sustainability Report, p.47
Hess Corp., Annual Report on Form 10-K, p.3
Hess Corp., Annual Report on Form 10-K, p.4
Russia 0 0 0 0 0 0 0Hess Corp. 2008 Corporate Sustainability Report, p.47
Hess Corp., Annual Report on Form 10-K, p.3
Hess Corp., Annual Report on Form 10-K, p.4
Thailand 0 0 0 0 0 0 0Hess Corp. 2008 Corporate Sustainability Report, p.47
0Hess Corp., Annual Report on Form 10-K, p.6
UK 0 0 0 0 0 0 0 0Hess Corp., Annual Report on Form 10-K, p.3
Hess Corp., Annual Report on Form 10-K, p.4
USA 0
Hess Corp., Annual Report on Form 10-K, pp.76,78
Hess Corp., Annual Report on Form 10-K, pp.77,78
Hess Corp., Annual Report on Form 10-K, pp.77,78
Hess Corp., Annual Report on Form 10-K, p.78
Hess Corp., Annual Report on Form 10-K, p.78
0Hess Corp. 2008 Corporate Sustainability Report, p.47
Hess Corp., Annual Report on Form 10-K, p.3
Hess Corp., Annual Report on Form 10-K, pp.2,4,81
INPEX
"Based on the following source:" question #
“Inpex 2009 Annual Report, pp.26-27 http://www.inpex.co.jp/english/business/index.html”
the following countries have been identified as countries of company’s oil and gas producing activities:
37 38 39 40 41 42 43 44 45 46
Australia 0 0 0 0 0 0 0 0 0 0
Azerbaijan 0 0 0 0 0 0 0 0 0 0
Brazil 0 0 0 0 0 0 0 0 0 0
Congo Kinshasa 0 0 0 0 0 0 0 0 0 0
Egypt 0 0 0 0 0 0 0 0 0 0
Indonesia 0 0 0 0 0 0 0 0 0 0
Japan 0 Inpex, Annual Report 2009, p.85
Inpex, Annual Report 2009, p.65
Inpex, Annual Report 2009, p.64 0 0 0 0 Inpex, Annual
Report 2009, p.94Inpex, Annual Report 2009, p.90
Surinam 0 0 0 0 0 0 0 0 0 0
UAE 0 0 0 0 0 0 0 0 0 0
USA 0 0 0 0 0 0 0 0 0 0
Venezuela 0 0 0 0 0 0 0 0 0 0
KazMunaiGa
"Based on the following source:" question #
KazMunaiGaz 2007 Annual Report, pp.132-134
KazMunaiGaz has upstream production activities only in Kazakhstan
37 38 39 40 41 42 43 44 45 46
Kazakhstan
"JSC NC Kaz-MunaiGaz, 2009 Consolidated Financial State-ments, pp.51,52 JSC NC KazMu-nayGas, Interim condensed con-solidated finan-cial statements, June 30, 2009, pp.21,22"
"JSC NC Kaz-MunaiGaz, 2009 Consolidated Fi-nancial Statements, pp.3,52,72 JSC NC KazMu-nayGas, Interim condensed con-solidated financial statements, June 30, 2009, pp.3,22"
0 0
"JSC NC KazMun-aiGaz, 2009 Consolidated Financial Statements, p.3 JSC NC KazMunayGas, Interim condensed consolidated financial statements, June 30, 2009, p.3"
"JSC NC KazMun-aiGaz, 2009 Consolidated Financial Statements, pp.3,55-56 JSC NC KazMu-nayGas, Interim condensed consolidated financial statements, June 30, 2009, pp.3,25-26"
"JSC NC KazMu-naiGaz, 2009 Consolidated Financial Statements, p.52 JSC NC KazMu-nayGas, Interim condensed consolidat-ed financial statements, June 30, 2009, p.22"
"JSC NC KazMun-aiGaz, 2009 Consolidat-ed Financial Statements, p.52 JSC NC Ka-zMunaiGas, 2007 An-nual Report, p.150"
"JSC NC KazMunaiGas, 2007 Annual Report, pp.132-133 KazMunaiGas EP, 2008 Annual Report, p.1 (financial and operational highlights)"
"JSC NC KazMunaiGas, 2007 Annual Report, p.132 KazMunaiGas EP, 2008 Annual Report, p.1 (financial and operational highlights)"
94 Transparency International 95Promoting Revenue Transparency
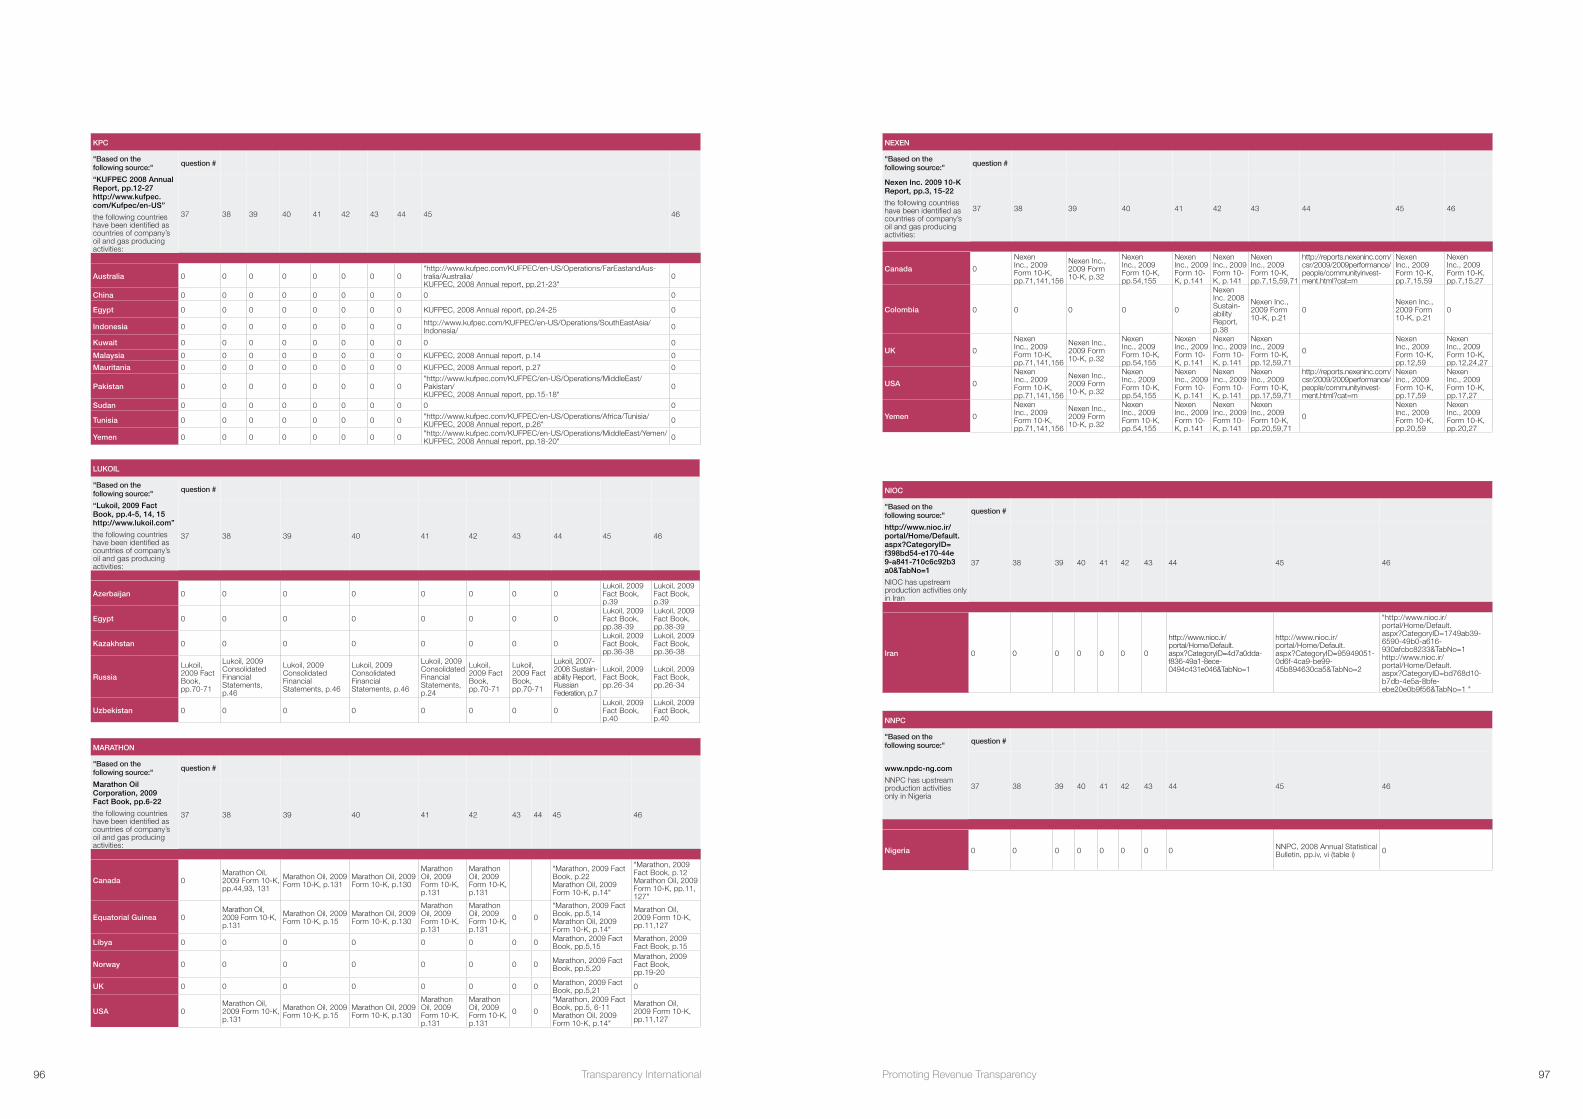
KPC
"Based on the following source:" question #
“KUFPEC 2008 Annual Report, pp.12-27 http://www.kufpec.com/Kufpec/en-US”
the following countries have been identified as countries of company’s oil and gas producing activities:
37 38 39 40 41 42 43 44 45 46
Australia 0 0 0 0 0 0 0 0"http://www.kufpec.com/KUFPEC/en-US/Operations/FarEastandAus-tralia/Australia/ KUFPEC, 2008 Annual report, pp.21-23"
0
China 0 0 0 0 0 0 0 0 0 0
Egypt 0 0 0 0 0 0 0 0 KUFPEC, 2008 Annual report, pp.24-25 0
Indonesia 0 0 0 0 0 0 0 0 http://www.kufpec.com/KUFPEC/en-US/Operations/SouthEastAsia/Indonesia/ 0
Kuwait 0 0 0 0 0 0 0 0 0 0
Malaysia 0 0 0 0 0 0 0 0 KUFPEC, 2008 Annual report, p.14 0
Mauritania 0 0 0 0 0 0 0 0 KUFPEC, 2008 Annual report, p.27 0
Pakistan 0 0 0 0 0 0 0 0"http://www.kufpec.com/KUFPEC/en-US/Operations/MiddleEast/Pakistan/ KUFPEC, 2008 Annual report, pp.15-18"
0
Sudan 0 0 0 0 0 0 0 0 0 0
Tunisia 0 0 0 0 0 0 0 0 "http://www.kufpec.com/KUFPEC/en-US/Operations/Africa/Tunisia/ KUFPEC, 2008 Annual report, p.26" 0
Yemen 0 0 0 0 0 0 0 0 "http://www.kufpec.com/KUFPEC/en-US/Operations/MiddleEast/Yemen/ KUFPEC, 2008 Annual report, pp.18-20" 0
LUKOIL
"Based on the following source:" question #
“Lukoil, 2009 Fact Book, pp.4-5, 14, 15 http://www.lukoil.com”
the following countries have been identified as countries of company’s oil and gas producing activities:
37 38 39 40 41 42 43 44 45 46
Azerbaijan 0 0 0 0 0 0 0 0Lukoil, 2009 Fact Book, p.39
Lukoil, 2009 Fact Book, p.39
Egypt 0 0 0 0 0 0 0 0Lukoil, 2009 Fact Book, pp.38-39
Lukoil, 2009 Fact Book, pp.38-39
Kazakhstan 0 0 0 0 0 0 0 0Lukoil, 2009 Fact Book, pp.36-38
Lukoil, 2009 Fact Book, pp.36-38
Russia
Lukoil, 2009 Fact Book, pp.70-71
Lukoil, 2009 Consolidated Financial Statements, p.46
Lukoil, 2009 Consolidated Financial Statements, p.46
Lukoil, 2009 Consolidated Financial Statements, p.46
Lukoil, 2009 Consolidated Financial Statements, p.24
Lukoil, 2009 Fact Book, pp.70-71
Lukoil, 2009 Fact Book, pp.70-71
Lukoil, 2007-2008 Sustain-ability Report, Russian Federation, p.7
Lukoil, 2009 Fact Book, pp.26-34
Lukoil, 2009 Fact Book, pp.26-34
Uzbekistan 0 0 0 0 0 0 0 0Lukoil, 2009 Fact Book, p.40
Lukoil, 2009 Fact Book, p.40
MARATHON
"Based on the following source:" question #
Marathon Oil Corporation, 2009 Fact Book, pp.6-22
the following countries have been identified as countries of company’s oil and gas producing activities:
37 38 39 40 41 42 43 44 45 46
Canada 0Marathon Oil, 2009 Form 10-K, pp.44,93, 131
Marathon Oil, 2009 Form 10-K, p.131
Marathon Oil, 2009 Form 10-K, p.130
Marathon Oil, 2009 Form 10-K, p.131
Marathon Oil, 2009 Form 10-K, p.131
"Marathon, 2009 Fact Book, p.22 Marathon Oil, 2009 Form 10-K, p.14"
"Marathon, 2009 Fact Book, p.12 Marathon Oil, 2009 Form 10-K, pp.11, 127"
Equatorial Guinea 0Marathon Oil, 2009 Form 10-K, p.131
Marathon Oil, 2009 Form 10-K, p.15
Marathon Oil, 2009 Form 10-K, p.130
Marathon Oil, 2009 Form 10-K, p.131
Marathon Oil, 2009 Form 10-K, p.131
0 0
"Marathon, 2009 Fact Book, pp.5,14 Marathon Oil, 2009 Form 10-K, p.14"
Marathon Oil, 2009 Form 10-K, pp.11,127
Libya 0 0 0 0 0 0 0 0 Marathon, 2009 Fact Book, pp.5,15
Marathon, 2009 Fact Book, p.15
Norway 0 0 0 0 0 0 0 0 Marathon, 2009 Fact Book, pp.5,20
Marathon, 2009 Fact Book, pp.19-20
UK 0 0 0 0 0 0 0 0 Marathon, 2009 Fact Book, pp.5,21 0
USA 0Marathon Oil, 2009 Form 10-K, p.131
Marathon Oil, 2009 Form 10-K, p.15
Marathon Oil, 2009 Form 10-K, p.130
Marathon Oil, 2009 Form 10-K, p.131
Marathon Oil, 2009 Form 10-K, p.131
0 0
"Marathon, 2009 Fact Book, pp.5, 6-11 Marathon Oil, 2009 Form 10-K, p.14"
Marathon Oil, 2009 Form 10-K, pp.11,127
NEXEN
"Based on the following source:" question #
Nexen Inc. 2009 10-K Report, pp.3, 15-22
the following countries have been identified as countries of company’s oil and gas producing activities:
37 38 39 40 41 42 43 44 45 46
Canada 0
Nexen Inc., 2009 Form 10-K, pp.71,141,156
Nexen Inc., 2009 Form 10-K, p.32
Nexen Inc., 2009 Form 10-K, pp.54,155
Nexen Inc., 2009 Form 10-K, p.141
Nexen Inc., 2009 Form 10-K, p.141
Nexen Inc., 2009 Form 10-K, pp.7,15,59,71
http://reports.nexeninc.com/csr/2009/2009performance/people/communityinvest-ment.html?cat=m
Nexen Inc., 2009 Form 10-K, pp.7,15,59
Nexen Inc., 2009 Form 10-K, pp.7,15,27
Colombia 0 0 0 0 0
Nexen Inc. 2008 Sustain-ability Report, p.38
Nexen Inc., 2009 Form 10-K, p.21
0Nexen Inc., 2009 Form 10-K, p.21
0
UK 0
Nexen Inc., 2009 Form 10-K, pp.71,141,156
Nexen Inc., 2009 Form 10-K, p.32
Nexen Inc., 2009 Form 10-K, pp.54,155
Nexen Inc., 2009 Form 10-K, p.141
Nexen Inc., 2009 Form 10-K, p.141
Nexen Inc., 2009 Form 10-K, pp.12,59,71
0
Nexen Inc., 2009 Form 10-K, pp.12,59
Nexen Inc., 2009 Form 10-K, pp.12,24,27
USA 0
Nexen Inc., 2009 Form 10-K, pp.71,141,156
Nexen Inc., 2009 Form 10-K, p.32
Nexen Inc., 2009 Form 10-K, pp.54,155
Nexen Inc., 2009 Form 10-K, p.141
Nexen Inc., 2009 Form 10-K, p.141
Nexen Inc., 2009 Form 10-K, pp.17,59,71
http://reports.nexeninc.com/csr/2009/2009performance/people/communityinvest-ment.html?cat=m
Nexen Inc., 2009 Form 10-K, pp.17,59
Nexen Inc., 2009 Form 10-K, pp.17,27
Yemen 0
Nexen Inc., 2009 Form 10-K, pp.71,141,156
Nexen Inc., 2009 Form 10-K, p.32
Nexen Inc., 2009 Form 10-K, pp.54,155
Nexen Inc., 2009 Form 10-K, p.141
Nexen Inc., 2009 Form 10-K, p.141
Nexen Inc., 2009 Form 10-K, pp.20,59,71
0
Nexen Inc., 2009 Form 10-K, pp.20,59
Nexen Inc., 2009 Form 10-K, pp.20,27
NIOC
"Based on the following source:" question #
http://www.nioc.ir/portal/Home/Default.aspx?CategoryID= f398bd54-e170-44e 9-a841-710c6c92b3 a0&TabNo=1
NIOC has upstream production activities only in Iran
37 38 39 40 41 42 43 44 45 46
Iran 0 0 0 0 0 0 0
http://www.nioc.ir/portal/Home/Default.aspx?CategoryID=4d7a0dda-f836-49a1-8ece-0494c431e046&TabNo=1
http://www.nioc.ir/portal/Home/Default.aspx?CategoryID=95949051-0d6f-4ca9-be99-45b894630ca5&TabNo=2
"http://www.nioc.ir/portal/Home/Default.aspx?CategoryID=1749ab39-6590-49b0-a616-930afcbc8233&TabNo=1 http://www.nioc.ir/portal/Home/Default.aspx?CategoryID=bd768d10-b7db-4e5a-8bfe-ebe20e0b9f56&TabNo=1 "
NNPC
"Based on the following source:" question #
www.npdc-ng.com
NNPC has upstream production activities only in Nigeria
37 38 39 40 41 42 43 44 45 46
Nigeria 0 0 0 0 0 0 0 0 NNPC, 2008 Annual Statistical Bulletin, pp.iv, vi (table i) 0
96 Transparency International 97Promoting Revenue Transparency
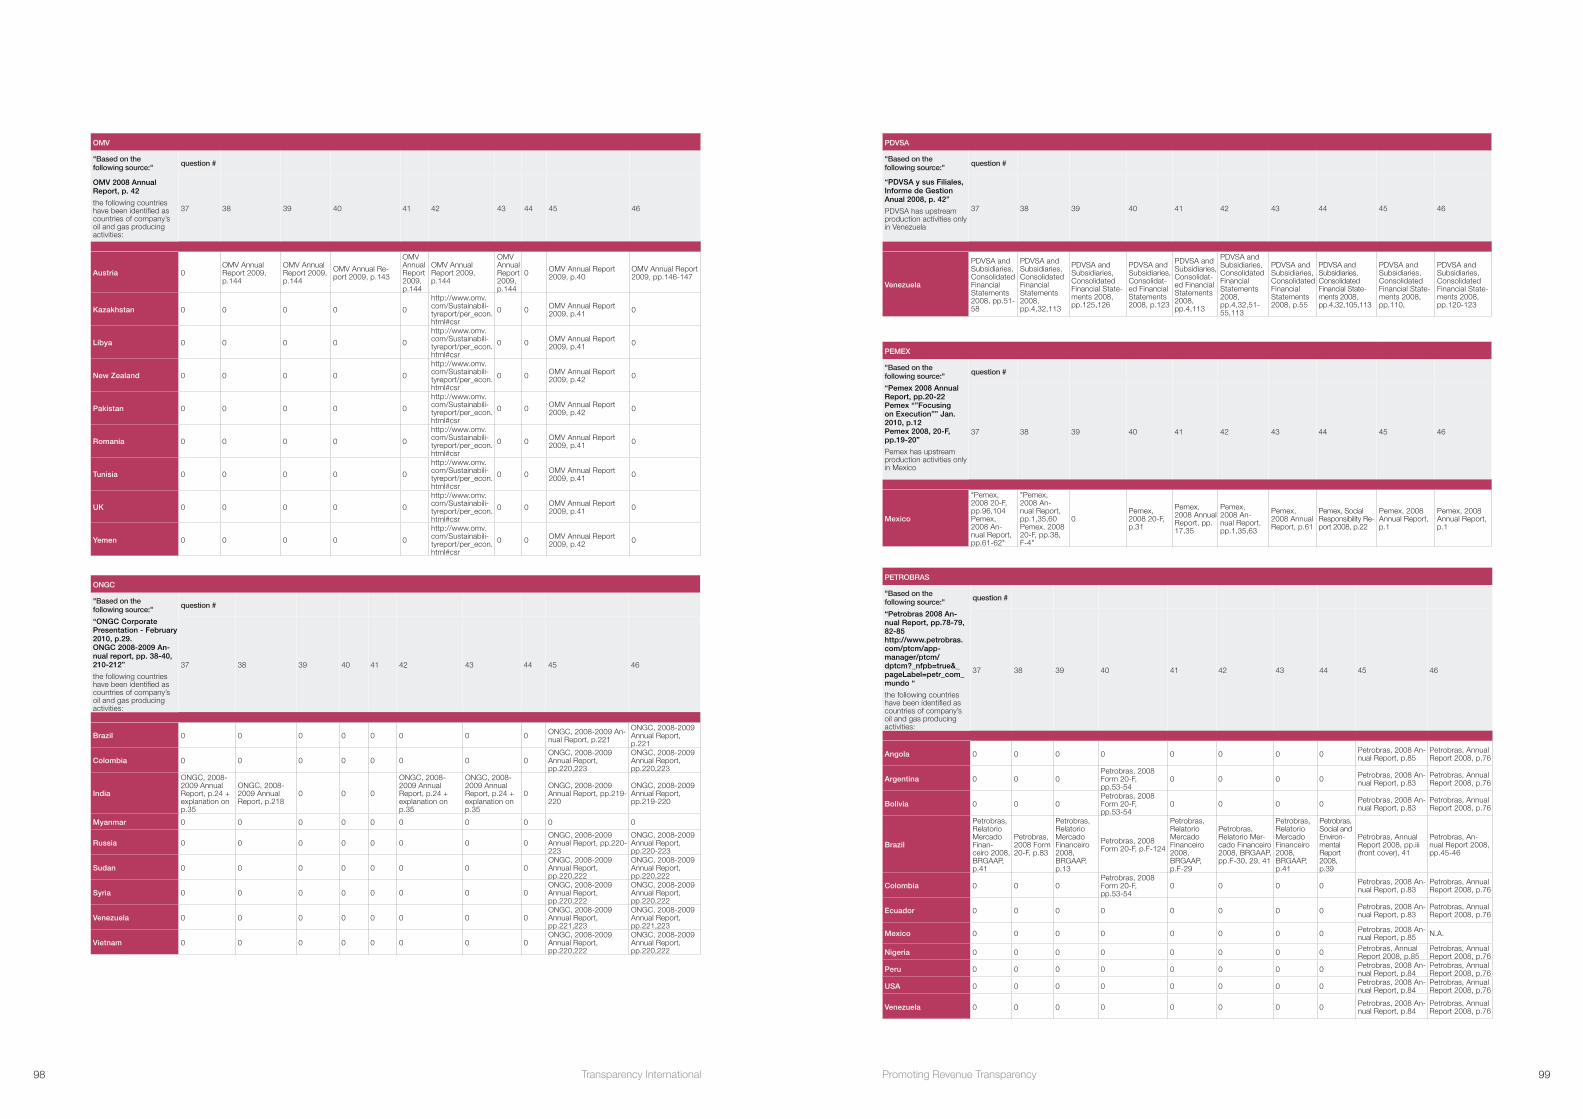
OMV
"Based on the following source:" question #
OMV 2008 Annual Report, p. 42
the following countries have been identified as countries of company’s oil and gas producing activities:
37 38 39 40 41 42 43 44 45 46
Austria 0OMV Annual Report 2009, p.144
OMV Annual Report 2009, p.144
OMV Annual Re-port 2009, p.143
OMV Annual Report 2009, p.144
OMV Annual Report 2009, p.144
OMV Annual Report 2009, p.144
0 OMV Annual Report 2009, p.40
OMV Annual Report 2009, pp.146-147
Kazakhstan 0 0 0 0 0
http://www.omv.com/Sustainabili-tyreport/per_econ.html#csr
0 0 OMV Annual Report 2009, p.41 0
Libya 0 0 0 0 0
http://www.omv.com/Sustainabili-tyreport/per_econ.html#csr
0 0 OMV Annual Report 2009, p.41 0
New Zealand 0 0 0 0 0
http://www.omv.com/Sustainabili-tyreport/per_econ.html#csr
0 0 OMV Annual Report 2009, p.42 0
Pakistan 0 0 0 0 0
http://www.omv.com/Sustainabili-tyreport/per_econ.html#csr
0 0 OMV Annual Report 2009, p.42 0
Romania 0 0 0 0 0
http://www.omv.com/Sustainabili-tyreport/per_econ.html#csr
0 0 OMV Annual Report 2009, p.41 0
Tunisia 0 0 0 0 0
http://www.omv.com/Sustainabili-tyreport/per_econ.html#csr
0 0 OMV Annual Report 2009, p.41 0
UK 0 0 0 0 0
http://www.omv.com/Sustainabili-tyreport/per_econ.html#csr
0 0 OMV Annual Report 2009, p.41 0
Yemen 0 0 0 0 0
http://www.omv.com/Sustainabili-tyreport/per_econ.html#csr
0 0 OMV Annual Report 2009, p.42 0
ONGC
"Based on the following source:" question #
“ONGC Corporate Presentation - February 2010, p.29. ONGC 2008-2009 An-nual report, pp. 38-40, 210-212”
the following countries have been identified as countries of company’s oil and gas producing activities:
37 38 39 40 41 42 43 44 45 46
Brazil 0 0 0 0 0 0 0 0 ONGC, 2008-2009 An-nual Report, p.221
ONGC, 2008-2009 Annual Report, p.221
Colombia 0 0 0 0 0 0 0 0ONGC, 2008-2009 Annual Report, pp.220,223
ONGC, 2008-2009 Annual Report, pp.220,223
India
ONGC, 2008-2009 Annual Report, p.24 + explanation on p.35
ONGC, 2008-2009 Annual Report, p.218
0 0 0
ONGC, 2008-2009 Annual Report, p.24 + explanation on p.35
ONGC, 2008-2009 Annual Report, p.24 + explanation on p.35
0ONGC, 2008-2009 Annual Report, pp.219-220
ONGC, 2008-2009 Annual Report, pp.219-220
Myanmar 0 0 0 0 0 0 0 0 0 0
Russia 0 0 0 0 0 0 0 0ONGC, 2008-2009 Annual Report, pp.220-223
ONGC, 2008-2009 Annual Report, pp.220-223
Sudan 0 0 0 0 0 0 0 0ONGC, 2008-2009 Annual Report, pp.220,222
ONGC, 2008-2009 Annual Report, pp.220,222
Syria 0 0 0 0 0 0 0 0ONGC, 2008-2009 Annual Report, pp.220,222
ONGC, 2008-2009 Annual Report, pp.220,222
Venezuela 0 0 0 0 0 0 0 0ONGC, 2008-2009 Annual Report, pp.221,223
ONGC, 2008-2009 Annual Report, pp.221,223
Vietnam 0 0 0 0 0 0 0 0ONGC, 2008-2009 Annual Report, pp.220,222
ONGC, 2008-2009 Annual Report, pp.220,222
PDVSA
"Based on the following source:" question #
“PDVSA y sus Filiales, Informe de Gestion Anual 2008, p. 42”
PDVSA has upstream production activities only in Venezuela
37 38 39 40 41 42 43 44 45 46
Venezuela
PDVSA and Subsidiaries, Consolidated Financial Statements 2008, pp.51-58
PDVSA and Subsidiaries, Consolidated Financial Statements 2008, pp.4,32,113
PDVSA and Subsidiaries, Consolidated Financial State-ments 2008, pp.125,126
PDVSA and Subsidiaries, Consolidat-ed Financial Statements 2008, p.123
PDVSA and Subsidiaries, Consolidat-ed Financial Statements 2008, pp.4,113
PDVSA and Subsidiaries, Consolidated Financial Statements 2008, pp.4,32,51-55,113
PDVSA and Subsidiaries, Consolidated Financial Statements 2008, p.55
PDVSA and Subsidiaries, Consolidated Financial State-ments 2008, pp.4,32,105,113
PDVSA and Subsidiaries, Consolidated Financial State-ments 2008, pp.110,
PDVSA and Subsidiaries, Consolidated Financial State-ments 2008, pp.120-123
PEMEX
"Based on the following source:" question #
“Pemex 2008 Annual Report, pp.20-22 Pemex “”Focusing on Execution”” Jan. 2010, p.12 Pemex 2008, 20-F, pp.19-20”
Pemex has upstream production activities only in Mexico
37 38 39 40 41 42 43 44 45 46
Mexico
"Pemex, 2008 20-F, pp.96,104 Pemex, 2008 An-nual Report, pp.61-62"
"Pemex, 2008 An-nual Report, pp.1,35,60 Pemex, 2008 20-F, pp.38, F-4"
0Pemex, 2008 20-F, p.31
Pemex, 2008 Annual Report, pp. 17,35
Pemex, 2008 An-nual Report, pp.1,35,63
Pemex, 2008 Annual Report, p.61
Pemex, Social Responsibility Re-port 2008, p.22
Pemex, 2008 Annual Report, p.1
Pemex, 2008 Annual Report, p.1
PETROBRAS
"Based on the following source:" question #
“Petrobras 2008 An-nual Report, pp.78-79, 82-85 http://www.petrobras.com/ptcm/app-manager/ptcm/dptcm?_nfpb=true&_pageLabel=petr_com_mundo “
the following countries have been identified as countries of company’s oil and gas producing activities:
37 38 39 40 41 42 43 44 45 46
Angola 0 0 0 0 0 0 0 0 Petrobras, 2008 An-nual Report, p.85
Petrobras, Annual Report 2008, p.76
Argentina 0 0 0Petrobras, 2008 Form 20-F, pp.53-54
0 0 0 0 Petrobras, 2008 An-nual Report, p.83
Petrobras, Annual Report 2008, p.76
Bolivia 0 0 0Petrobras, 2008 Form 20-F, pp.53-54
0 0 0 0 Petrobras, 2008 An-nual Report, p.83
Petrobras, Annual Report 2008, p.76
Brazil
Petrobras, Relatorio Mercado Finan-ceiro 2008, BRGAAP, p.41
Petrobras, 2008 Form 20-F, p.83
Petrobras, Relatorio Mercado Financeiro 2008, BRGAAP, p.13
Petrobras, 2008 Form 20-F, p.F-124
Petrobras, Relatorio Mercado Financeiro 2008, BRGAAP, p.F-29
Petrobras, Relatorio Mer-cado Financeiro 2008, BRGAAP, pp.F-30, 29, 41
Petrobras, Relatorio Mercado Financeiro 2008, BRGAAP, p.41
Petrobras, Social and Environ-mental Report 2008, p.39
Petrobras, Annual Report 2008, pp.iii (front cover), 41
Petrobras, An-nual Report 2008, pp.45-46
Colombia 0 0 0Petrobras, 2008 Form 20-F, pp.53-54
0 0 0 0 Petrobras, 2008 An-nual Report, p.83
Petrobras, Annual Report 2008, p.76
Ecuador 0 0 0 0 0 0 0 0 Petrobras, 2008 An-nual Report, p.83
Petrobras, Annual Report 2008, p.76
Mexico 0 0 0 0 0 0 0 0 Petrobras, 2008 An-nual Report, p.85 N.A.
Nigeria 0 0 0 0 0 0 0 0 Petrobras, Annual Report 2008, p.85
Petrobras, Annual Report 2008, p.76
Peru 0 0 0 0 0 0 0 0 Petrobras, 2008 An-nual Report, p.84
Petrobras, Annual Report 2008, p.76
USA 0 0 0 0 0 0 0 0 Petrobras, 2008 An-nual Report, p.84
Petrobras, Annual Report 2008, p.76
Venezuela 0 0 0 0 0 0 0 0 Petrobras, 2008 An-nual Report, p.84
Petrobras, Annual Report 2008, p.76
98 Transparency International 99Promoting Revenue Transparency
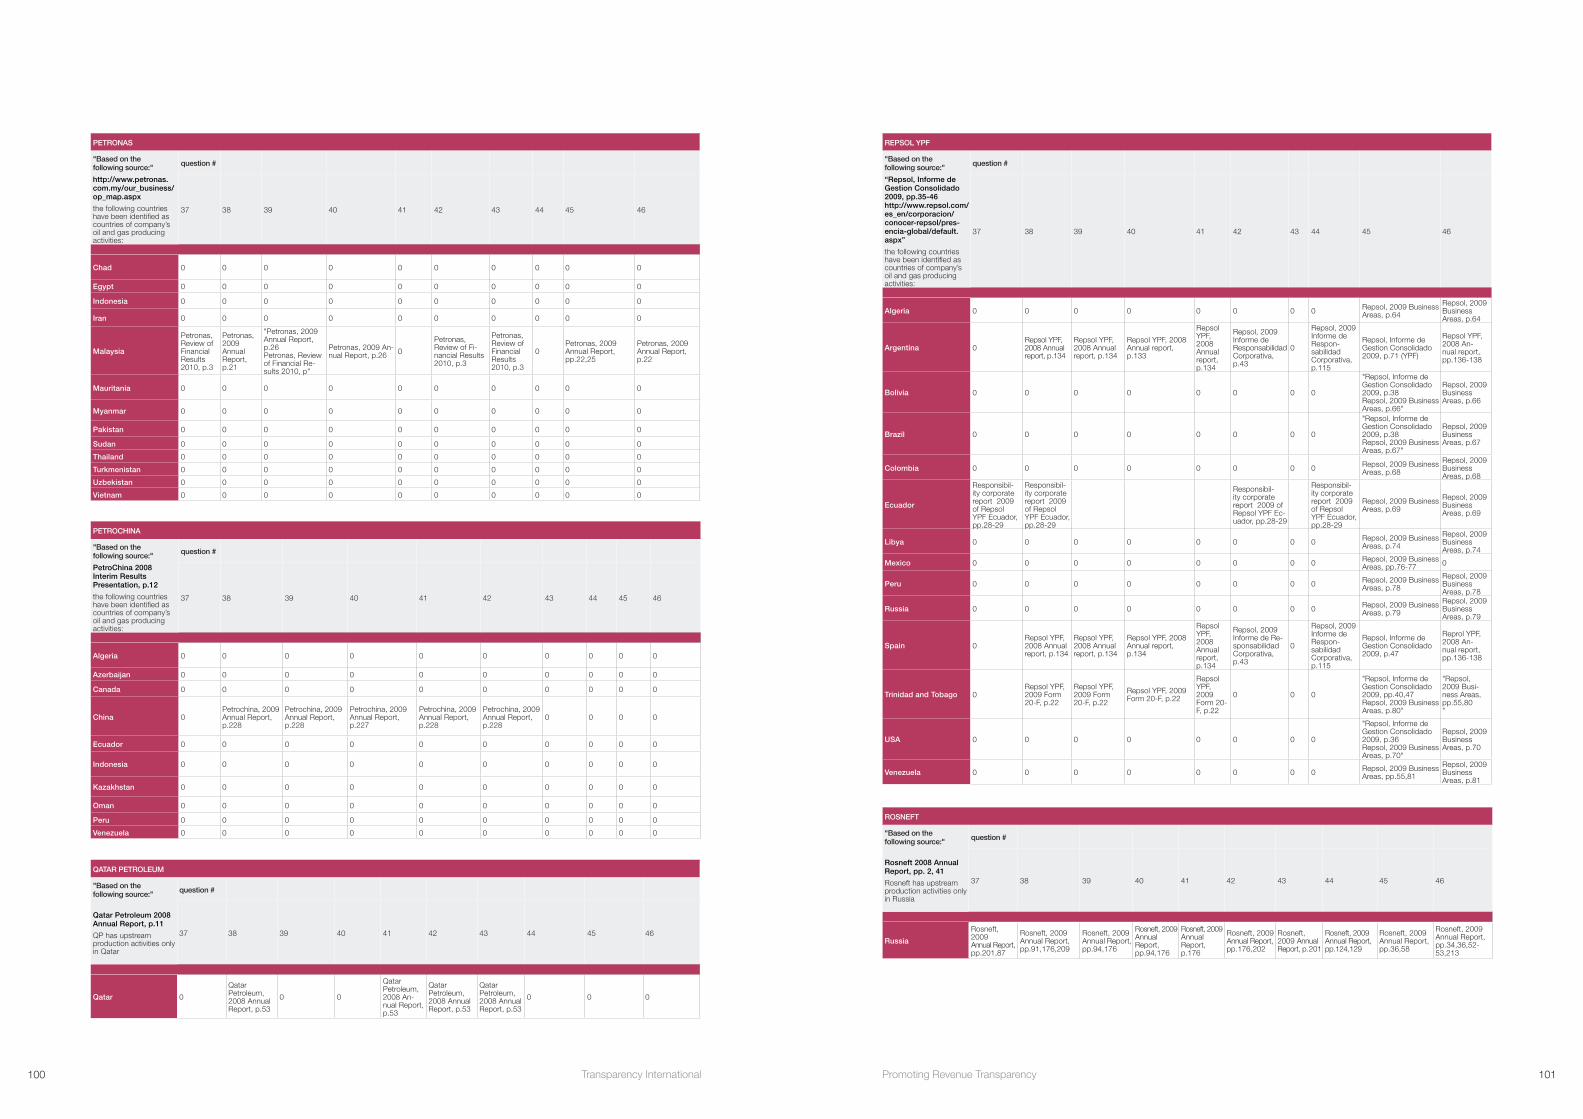
PETRONAS
"Based on the following source:" question #
http://www.petronas.com.my/our_business/op_map.aspx
the following countries have been identified as countries of company’s oil and gas producing activities:
37 38 39 40 41 42 43 44 45 46
Chad 0 0 0 0 0 0 0 0 0 0
Egypt 0 0 0 0 0 0 0 0 0 0
Indonesia 0 0 0 0 0 0 0 0 0 0
Iran 0 0 0 0 0 0 0 0 0 0
Malaysia
Petronas, Review of Financial Results 2010, p.3
Petronas, 2009 Annual Report, p.21
"Petronas, 2009 Annual Report, p.26 Petronas, Review of Financial Re-sults 2010, p"
Petronas, 2009 An-nual Report, p.26 0
Petronas, Review of Fi-nancial Results 2010, p.3
Petronas, Review of Financial Results 2010, p.3
0Petronas, 2009 Annual Report, pp.22,25
Petronas, 2009 Annual Report, p.22
Mauritania 0 0 0 0 0 0 0 0 0 0
Myanmar 0 0 0 0 0 0 0 0 0 0
Pakistan 0 0 0 0 0 0 0 0 0 0
Sudan 0 0 0 0 0 0 0 0 0 0
Thailand 0 0 0 0 0 0 0 0 0 0
Turkmenistan 0 0 0 0 0 0 0 0 0 0
Uzbekistan 0 0 0 0 0 0 0 0 0 0
Vietnam 0 0 0 0 0 0 0 0 0 0
QATAR PETROLEUM
"Based on the following source:" question #
Qatar Petroleum 2008 Annual Report, p.11
QP has upstream production activities only in Qatar
37 38 39 40 41 42 43 44 45 46
Qatar 0
Qatar Petroleum, 2008 Annual Report, p.53
0 0
Qatar Petroleum, 2008 An-nual Report, p.53
Qatar Petroleum, 2008 Annual Report, p.53
Qatar Petroleum, 2008 Annual Report, p.53
0 0 0
PETROCHINA
"Based on the following source:" question #
PetroChina 2008 Interim Results Presentation, p.12
the following countries have been identified as countries of company’s oil and gas producing activities:
37 38 39 40 41 42 43 44 45 46
Algeria 0 0 0 0 0 0 0 0 0 0
Azerbaijan 0 0 0 0 0 0 0 0 0 0
Canada 0 0 0 0 0 0 0 0 0 0
China 0Petrochina, 2009 Annual Report, p.228
Petrochina, 2009 Annual Report, p.228
Petrochina, 2009 Annual Report, p.227
Petrochina, 2009 Annual Report, p.228
Petrochina, 2009 Annual Report, p.228
0 0 0 0
Ecuador 0 0 0 0 0 0 0 0 0 0
Indonesia 0 0 0 0 0 0 0 0 0 0
Kazakhstan 0 0 0 0 0 0 0 0 0 0
Oman 0 0 0 0 0 0 0 0 0 0
Peru 0 0 0 0 0 0 0 0 0 0
Venezuela 0 0 0 0 0 0 0 0 0 0
REPSOL YPF
"Based on the following source:" question #
“Repsol, Informe de Gestion Consolidado 2009, pp.35-46 http://www.repsol.com/es_en/corporacion/conocer-repsol/pres-encia-global/default.aspx”
the following countries have been identified as countries of company’s oil and gas producing activities:
37 38 39 40 41 42 43 44 45 46
Algeria 0 0 0 0 0 0 0 0 Repsol, 2009 Business Areas, p.64
Repsol, 2009 Business Areas, p.64
Argentina 0Repsol YPF, 2008 Annual report, p.134
Repsol YPF, 2008 Annual report, p.134
Repsol YPF, 2008 Annual report, p.133
Repsol YPF, 2008 Annual report, p.134
Repsol, 2009 Informe de Responsabilidad Corporativa, p.43
0
Repsol, 2009 Informe de Respon-sabilidad Corporativa, p.115
Repsol, Informe de Gestion Consolidado 2009, p.71 (YPF)
Repsol YPF, 2008 An-nual report, pp.136-138
Bolivia 0 0 0 0 0 0 0 0
"Repsol, Informe de Gestion Consolidado 2009, p.38 Repsol, 2009 Business Areas, p.66"
Repsol, 2009 Business Areas, p.66
Brazil 0 0 0 0 0 0 0 0
"Repsol, Informe de Gestion Consolidado 2009, p.38 Repsol, 2009 Business Areas, p.67"
Repsol, 2009 Business Areas, p.67
Colombia 0 0 0 0 0 0 0 0 Repsol, 2009 Business Areas, p.68
Repsol, 2009 Business Areas, p.68
Ecuador
Responsibil-ity corporate report 2009 of Repsol YPF Ecuador, pp.28-29
Responsibil-ity corporate report 2009 of Repsol YPF Ecuador, pp.28-29
Responsibil-ity corporate report 2009 of Repsol YPF Ec-uador, pp.28-29
Responsibil-ity corporate report 2009 of Repsol YPF Ecuador, pp.28-29
Repsol, 2009 Business Areas, p.69
Repsol, 2009 Business Areas, p.69
Libya 0 0 0 0 0 0 0 0 Repsol, 2009 Business Areas, p.74
Repsol, 2009 Business Areas, p.74
Mexico 0 0 0 0 0 0 0 0 Repsol, 2009 Business Areas, pp.76-77 0
Peru 0 0 0 0 0 0 0 0 Repsol, 2009 Business Areas, p.78
Repsol, 2009 Business Areas, p.78
Russia 0 0 0 0 0 0 0 0 Repsol, 2009 Business Areas, p.79
Repsol, 2009 Business Areas, p.79
Spain 0Repsol YPF, 2008 Annual report, p.134
Repsol YPF, 2008 Annual report, p.134
Repsol YPF, 2008 Annual report, p.134
Repsol YPF, 2008 Annual report, p.134
Repsol, 2009 Informe de Re-sponsabilidad Corporativa, p.43
0
Repsol, 2009 Informe de Respon-sabilidad Corporativa, p.115
Repsol, Informe de Gestion Consolidado 2009, p.47
Reprol YPF, 2008 An-nual report, pp.136-138
Trinidad and Tobago 0Repsol YPF, 2009 Form 20-F, p.22
Repsol YPF, 2009 Form 20-F, p.22
Repsol YPF, 2009 Form 20-F, p.22
Repsol YPF, 2009 Form 20-F, p.22
0 0 0
"Repsol, Informe de Gestion Consolidado 2009, pp.40,47 Repsol, 2009 Business Areas, p.80"
"Repsol, 2009 Busi-ness Areas, pp.55,80 "
USA 0 0 0 0 0 0 0 0
"Repsol, Informe de Gestion Consolidado 2009, p.36 Repsol, 2009 Business Areas, p.70"
Repsol, 2009 Business Areas, p.70
Venezuela 0 0 0 0 0 0 0 0 Repsol, 2009 Business Areas, pp.55,81
Repsol, 2009 Business Areas, p.81
ROSNEFT
"Based on the following source:" question #
Rosneft 2008 Annual Report, pp. 2, 41
Rosneft has upstream production activities only in Russia
37 38 39 40 41 42 43 44 45 46
Russia
Rosneft, 2009 Annual Report, pp.201,87
Rosneft, 2009 Annual Report, pp.91,176,209
Rosneft, 2009 Annual Report, pp.94,176
Rosneft, 2009 Annual Report, pp.94,176
Rosneft, 2009 Annual Report, p.176
Rosneft, 2009 Annual Report, pp.176,202
Rosneft, 2009 Annual Report, p.201
Rosneft, 2009 Annual Report, pp.124,129
Rosneft, 2009 Annual Report, pp.36,58
Rosneft, 2009 Annual Report, pp.34,36,52-53,213
100 Transparency International 101Promoting Revenue Transparency

SHELL
"Based on the following source:" question #
Shell 2009 Annual Report, p.30
the following countries have been identified as countries of company’s oil and gas producing activities:
37 38 39 40 41 42 43 44 45 46
Argentina 0 0 0 0 0 0 0 0 0 0
Australia 0 0 0 0 0 0 0 0Shell Annual Report and Form 20-F 2009, pp.33-34
0
Brazil 0 0 0 0 0 0 0 0Shell Annual Report and Form 20-F 2009, pp.33-34
0
Brunei 0 0 0 0 0 0 0 0Shell Annual Report and Form 20-F 2009, pp.33-34
0
Cameroon 0 0 0 0 0 0 0 0Shell Annual Report and Form 20-F 2009, pp.33-34
0
Canada 0
Shell Annual Report and Form 20-F 2009, pp.155-156
Shell Annual Report and Form 20-F 2009, pp.32,155-156
Shell Annual Report and Form 20-F 2009, p.153
Shell Annual Report and Form 20-F 2009, pp.155-156
Shell Annual Report and Form 20-F 2009, pp.155-156
0 0Shell Annual Report and Form 20-F 2009, pp.33-34
Shell Annual Report and Form 20-F 2009, pp.29,142,147
China 0 0 0 0 0 0 0 0Shell Annual Report and Form 20-F 2009, pp.33-34
0
Denmark 0 0 0 0 0 0 0 0Shell Annual Report and Form 20-F 2009, pp.33-34
0
Egypt 0 0 0 0 0 0 0 0Shell Annual Report and Form 20-F 2009, pp.33-34
0
Gabon 0 0 0 0 0 0 0 0Shell Annual Report and Form 20-F 2009, pp.33-34
0
Germany 0 0 0 0 0 0 0 0Shell Annual Report and Form 20-F 2009, pp.33-34
0
Iran 0 0 0 0 0 0 0 0Shell Annual Report and Form 20-F 2009, pp.33-34
0
Ireland 0 0 0 0 0 0 0 0 0 0
Italy 0 0 0 0 0 0 0 0Shell Annual Report and Form 20-F 2009, pp.33-34
0
Kazakhstan 0 0 0 0 0 0 0 0 0 0
Malaysia 0 0 0 0 0 0 0 0Shell Annual Report and Form 20-F 2009, pp.33-34
0
Netherlands 0 0 0 0 0 0 0 0Shell Annual Report and Form 20-F 2009, pp.33-34
0
New Zealand 0 0 0 0 0 0 0 0Shell Annual Report and Form 20-F 2009, pp.33-34
0
Nigeria 0 0 0 0 0 0 0
Shell, 2009 Sustainabil-ity Report, p.22
Shell Annual Report and Form 20-F 2009, pp.33-34
0
Norway 0 0 0 0 0 0 0 0Shell Annual Report and Form 20-F 2009, pp.33-34
0
Oman 0 0 0 0 0 0 0 0Shell Annual Report and Form 20-F 2009, pp.33-34
0
Pakistan 0 0 0 0 0 0 0 0 0 0
Philippines 0 0 0 0 0 0 0 0Shell Annual Report and Form 20-F 2009, pp.33-34
0
Qatar 0 0 0 0 0 0 0 0 0 0
Russia 0 0 0 0 0 0 0 0Shell Annual Report and Form 20-F 2009, pp.33-34
0
Syria 0 0 0 0 0 0 0 0Shell Annual Report and Form 20-F 2009, pp.33-34
0
UAE 0 0 0 0 0 0 0 0Shell Annual Report and Form 20-F 2009, pp.33-34
0
UK 0 0 0 0 0 0 0 0Shell Annual Report and Form 20-F 2009, pp.33-34
0
USA 0
Shell An-nual Report and Form 20-F 2009, pp.12,155-156
Shell An-nual Report and Form 20-F 2009, pp.32,155-156
Shell Annual Report and Form 20-F 2009, p.153
Shell Annual Report and Form 20-F 2009, pp.155-156
Shell An-nual Report and Form 20-F 2009, pp.155-156
0 0Shell Annual Report and Form 20-F 2009, pp.33-34
Shell Annual Report and Form 20-F 2009, pp.29,142,147
Venezuela 0 0 0 0 0 0 0 0 0 0
SAUDI ARAMCO
"Based on the following source:" question #
http://www.saudiara-mco.com/irj/servlet/prt/portal/prtroot/com.sap.portal.navigation.portallauncher.anonymous?favlnk=%2FSaudiAramcoPublic%2Fdocs%2FOur+Business%2FOil+Operations&ln=en
SaudiAramco has upstream production activities only in Saudi Arabia
37 38 39 40 41 42 43 44 45 46
Saudi Aramco 0 0 0 0 0 0 0 0
"Saudi-Aramco, 2008 Annual Review, pp.4,46 SaudiAra-mco, Facts and Figures 2008, p.2"
"SaudiAramco, 2008 Annual Review, pp.4,46 SaudiAramco, Facts and Fig-ures 2008, p.2"
SINOPEC
"Based on the following source:" question #
Sinopec 2008 Annual Report, p.146
Sinopec has upstream production activities only in China
37 38 39 40 41 42 43 44 45 46
China
Sinopec, 2009 Annual Report, pp.113,119 (explanation Note 5)
Sinopec, 2009 Annual Report, pp.5,22,24
0
Sinopec, 2009 Annual Report, pp.22,78
Sinopec, 2009 Annual Report, pp.3,5,22,78
Sinopec, 2009 Annual Report, pp.22,78,121
Sinopec, 2009 Annual Report, pp.113,119 (explanation Note 5)
0Sinopec, 2009 Annual Report, p.15
Sinopec, 2009 Annual Report, p.15
SNPC
"Based on the following source:" question #
http://www.con-gopetrole.fr/index.php?idPage=2 9
SNPC has upstream production activities only in Congo Brazzaville
37 38 39 40 41 42 43 44 45 46
Congo Brazzaville 0 0 0 0 0 0 0 0 0 0
SOCAR
"Based on the following source:" question #
http://www.socar.az/about-en.html
SOCAR has upstream production activities only in Azerbaijan
37 38 39 40 41 42 43 44 45 46
AzerbaijanSOCAR, An-nual Report 2007, p.41
SOCAR, Annual Report 2007, p.42
SOCAR, Annual Re-port 2007, p.37
0 0SOCAR, Annual Report 2007, p.41
SOCAR, Annual Report 2007, pp.35,36,41
SOCAR, Annual Report 2007, p.40
SOCAR, Annual Report 2007, pp.21-26
0
102 Transparency International 103Promoting Revenue Transparency
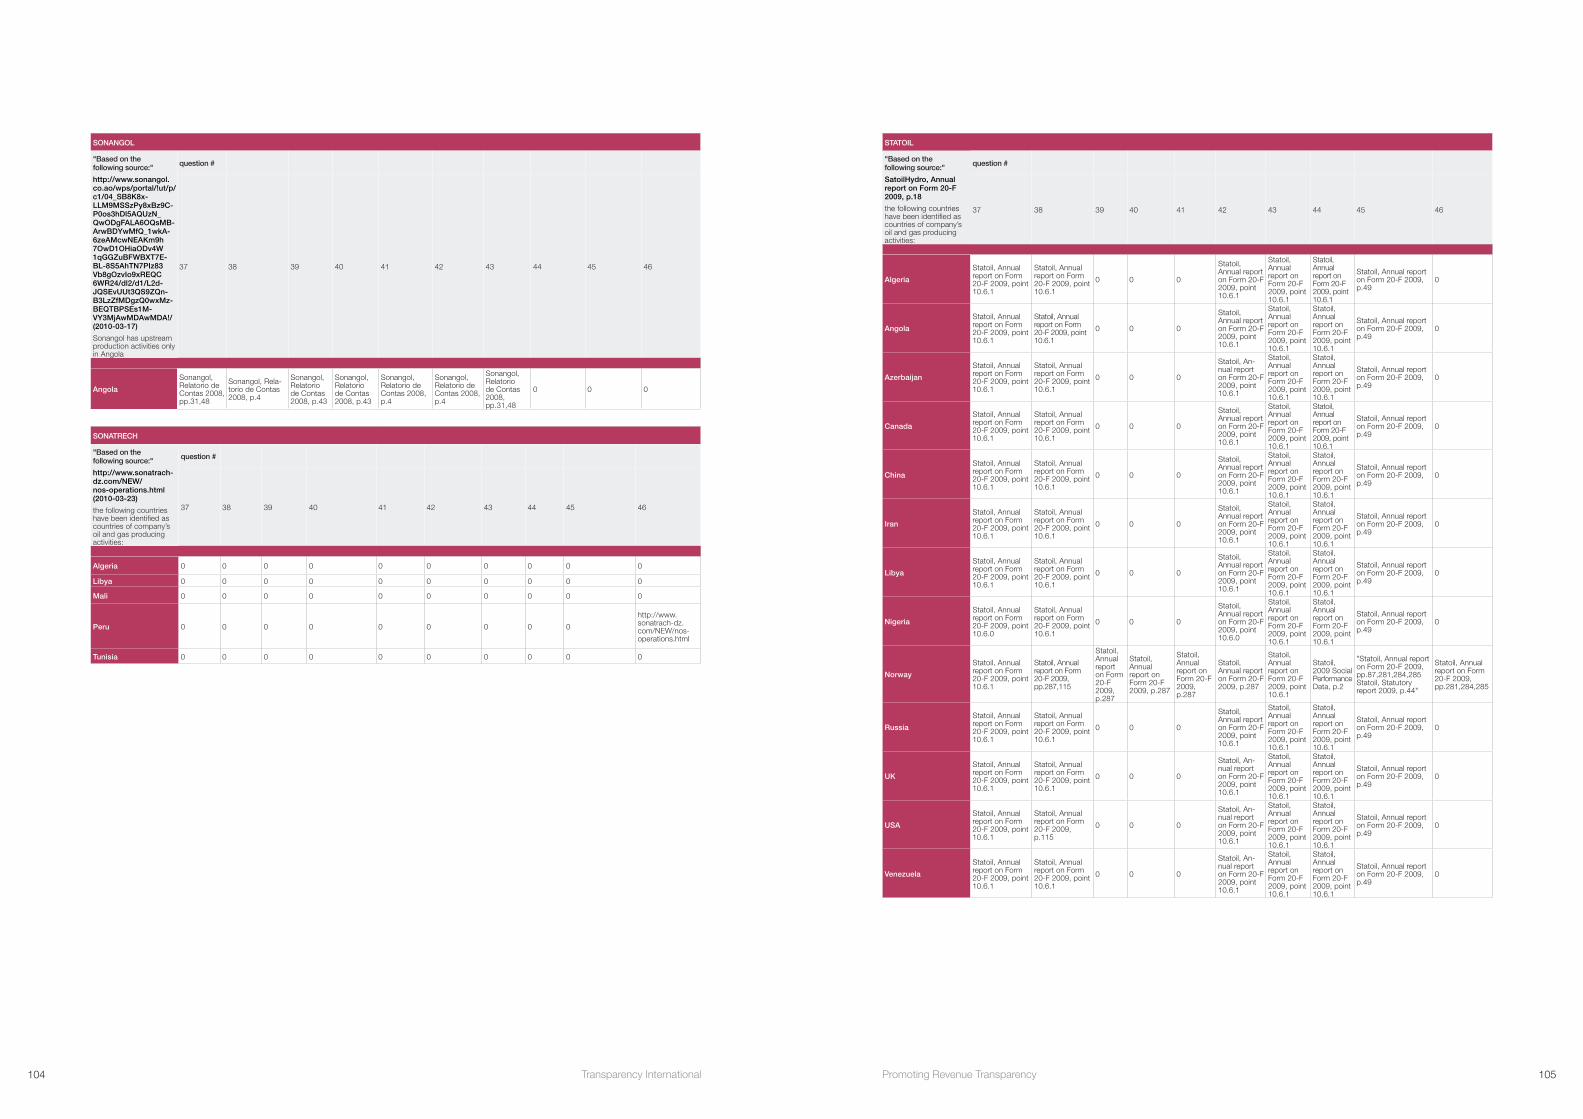
SONANGOL
"Based on the following source:" question #
http://www.sonangol.co.ao/wps/portal/!ut/p/c1/04_SB8K8x-LLM9MSSzPy8xBz9C-P0os3hDl5AQUzN_QwODgFALA6OQsMB-ArwBDYwMfQ_1wkA-6zeAMcwNEAKm9h7OwD1OHiaODv4W1qGGZuBFWBXT7E-BL-8S5AhTN7PIz83Vb8gOzvIo9xREQC6WR24/dl2/d1/L2d-JQSEvUUt3QS9ZQn-B3LzZfMDgzQ0wxMz-BEQTBPSEs1M-VY3MjAwMDAwMDA!/ (2010-03-17)
Sonangol has upstream production activities only in Angola
37 38 39 40 41 42 43 44 45 46
Angola
Sonangol, Relatorio de Contas 2008, pp.31,48
Sonangol, Rela-torio de Contas 2008, p.4
Sonangol, Relatorio de Contas 2008, p.43
Sonangol, Relatorio de Contas 2008, p.43
Sonangol, Relatorio de Contas 2008, p.4
Sonangol, Relatorio de Contas 2008, p.4
Sonangol, Relatorio de Contas 2008, pp.31,48
0 0 0
SONATRECH
"Based on the following source:" question #
http://www.sonatrach-dz.com/NEW/nos-operations.html (2010-03-23)
the following countries have been identified as countries of company’s oil and gas producing activities:
37 38 39 40 41 42 43 44 45 46
Algeria 0 0 0 0 0 0 0 0 0 0
Libya 0 0 0 0 0 0 0 0 0 0
Mali 0 0 0 0 0 0 0 0 0 0
Peru 0 0 0 0 0 0 0 0 0
http://www.sonatrach-dz.com/NEW/nos-operations.html
Tunisia 0 0 0 0 0 0 0 0 0 0
STATOIL
"Based on the following source:" question #
SatoilHydro, Annual report on Form 20-F 2009, p.18
the following countries have been identified as countries of company’s oil and gas producing activities:
37 38 39 40 41 42 43 44 45 46
Algeria
Statoil, Annual report on Form 20-F 2009, point 10.6.1
Statoil, Annual report on Form 20-F 2009, point 10.6.1
0 0 0
Statoil, Annual report on Form 20-F 2009, point 10.6.1
Statoil, Annual report on Form 20-F 2009, point 10.6.1
Statoil, Annual report on Form 20-F 2009, point 10.6.1
Statoil, Annual report on Form 20-F 2009, p.49
0
Angola
Statoil, Annual report on Form 20-F 2009, point 10.6.1
Statoil, Annual report on Form 20-F 2009, point 10.6.1
0 0 0
Statoil, Annual report on Form 20-F 2009, point 10.6.1
Statoil, Annual report on Form 20-F 2009, point 10.6.1
Statoil, Annual report on Form 20-F 2009, point 10.6.1
Statoil, Annual report on Form 20-F 2009, p.49
0
Azerbaijan
Statoil, Annual report on Form 20-F 2009, point 10.6.1
Statoil, Annual report on Form 20-F 2009, point 10.6.1
0 0 0
Statoil, An-nual report on Form 20-F 2009, point 10.6.1
Statoil, Annual report on Form 20-F 2009, point 10.6.1
Statoil, Annual report on Form 20-F 2009, point 10.6.1
Statoil, Annual report on Form 20-F 2009, p.49
0
Canada
Statoil, Annual report on Form 20-F 2009, point 10.6.1
Statoil, Annual report on Form 20-F 2009, point 10.6.1
0 0 0
Statoil, Annual report on Form 20-F 2009, point 10.6.1
Statoil, Annual report on Form 20-F 2009, point 10.6.1
Statoil, Annual report on Form 20-F 2009, point 10.6.1
Statoil, Annual report on Form 20-F 2009, p.49
0
China
Statoil, Annual report on Form 20-F 2009, point 10.6.1
Statoil, Annual report on Form 20-F 2009, point 10.6.1
0 0 0
Statoil, Annual report on Form 20-F 2009, point 10.6.1
Statoil, Annual report on Form 20-F 2009, point 10.6.1
Statoil, Annual report on Form 20-F 2009, point 10.6.1
Statoil, Annual report on Form 20-F 2009, p.49
0
Iran
Statoil, Annual report on Form 20-F 2009, point 10.6.1
Statoil, Annual report on Form 20-F 2009, point 10.6.1
0 0 0
Statoil, Annual report on Form 20-F 2009, point 10.6.1
Statoil, Annual report on Form 20-F 2009, point 10.6.1
Statoil, Annual report on Form 20-F 2009, point 10.6.1
Statoil, Annual report on Form 20-F 2009, p.49
0
Libya
Statoil, Annual report on Form 20-F 2009, point 10.6.1
Statoil, Annual report on Form 20-F 2009, point 10.6.1
0 0 0
Statoil, Annual report on Form 20-F 2009, point 10.6.1
Statoil, Annual report on Form 20-F 2009, point 10.6.1
Statoil, Annual report on Form 20-F 2009, point 10.6.1
Statoil, Annual report on Form 20-F 2009, p.49
0
Nigeria
Statoil, Annual report on Form 20-F 2009, point 10.6.0
Statoil, Annual report on Form 20-F 2009, point 10.6.1
0 0 0
Statoil, Annual report on Form 20-F 2009, point 10.6.0
Statoil, Annual report on Form 20-F 2009, point 10.6.1
Statoil, Annual report on Form 20-F 2009, point 10.6.1
Statoil, Annual report on Form 20-F 2009, p.49
0
Norway
Statoil, Annual report on Form 20-F 2009, point 10.6.1
Statoil, Annual report on Form 20-F 2009, pp.287,115
Statoil, Annual report on Form 20-F 2009, p.287
Statoil, Annual report on Form 20-F 2009, p.287
Statoil, Annual report on Form 20-F 2009, p.287
Statoil, Annual report on Form 20-F 2009, p.287
Statoil, Annual report on Form 20-F 2009, point 10.6.1
Statoil, 2009 Social Performance Data, p.2
"Statoil, Annual report on Form 20-F 2009, pp.87,281,284,285 Statoil, Statutory report 2009, p.44"
Statoil, Annual report on Form 20-F 2009, pp.281,284,285
Russia
Statoil, Annual report on Form 20-F 2009, point 10.6.1
Statoil, Annual report on Form 20-F 2009, point 10.6.1
0 0 0
Statoil, Annual report on Form 20-F 2009, point 10.6.1
Statoil, Annual report on Form 20-F 2009, point 10.6.1
Statoil, Annual report on Form 20-F 2009, point 10.6.1
Statoil, Annual report on Form 20-F 2009, p.49
0
UK
Statoil, Annual report on Form 20-F 2009, point 10.6.1
Statoil, Annual report on Form 20-F 2009, point 10.6.1
0 0 0
Statoil, An-nual report on Form 20-F 2009, point 10.6.1
Statoil, Annual report on Form 20-F 2009, point 10.6.1
Statoil, Annual report on Form 20-F 2009, point 10.6.1
Statoil, Annual report on Form 20-F 2009, p.49
0
USA
Statoil, Annual report on Form 20-F 2009, point 10.6.1
Statoil, Annual report on Form 20-F 2009, p.115
0 0 0
Statoil, An-nual report on Form 20-F 2009, point 10.6.1
Statoil, Annual report on Form 20-F 2009, point 10.6.1
Statoil, Annual report on Form 20-F 2009, point 10.6.1
Statoil, Annual report on Form 20-F 2009, p.49
0
Venezuela
Statoil, Annual report on Form 20-F 2009, point 10.6.1
Statoil, Annual report on Form 20-F 2009, point 10.6.1
0 0 0
Statoil, An-nual report on Form 20-F 2009, point 10.6.1
Statoil, Annual report on Form 20-F 2009, point 10.6.1
Statoil, Annual report on Form 20-F 2009, point 10.6.1
Statoil, Annual report on Form 20-F 2009, p.49
0
104 Transparency International 105Promoting Revenue Transparency

SUNCOR
"Based on the following source:" question #
“Petro-Canada 2008 Annual Report, pp.41-45 http://www.suncor.com/en/about/919.aspx”
the following countries have been identified as countries of company’s oil and gas producing activities:
37 38 39 40 41 42 43 44 45 46
Canada 0
Suncor Energy Inc. 2009 Annual Report, pp.33,38,41,97
0 0
Suncor Energy Inc. 2009 Annual Report, pp.105-106
0
Suncor Energy Inc. 2009 An-nual Report, pp.105-106
0Suncor Energy Inc. 2009 Annual Report, pp.33,38,41,103
0
Libya 0 0 0 0 0 0 0 0Suncor Energy Inc. 2009 Annual Report, pp.44,103
0
Netherlands 0 0 0 0 0 0 0 0Suncor Energy Inc. 2009 Annual Report, pp.44,103
0
Trinidad and Tobago 0 0 0 0 0 0 0 0Suncor Energy Inc. 2009 Annual Report, pp.44,103
0
UK 0 0 0 0 0 0 0 0Suncor Energy Inc. 2009 Annual Report, pp.44, 103
0
USA 0Suncor Energy Inc. 2009 Annual Report, pp.38,97
0 0
Suncor Energy Inc. 2009 Annual Report, p.105
0
Suncor Energy Inc. 2009 An-nual Report, p.105
0Suncor Energy Inc. 2009 Annual Report, pp.38,103
0
TALISMAN
"Based on the following source:" question #
Talisman Energy An-nual information form for the year ended Dec 31, 2009, pp.5-14
the following countries have been identified as countries of company’s oil and gas producing activities:
37 38 39 40 41 42 43 44 45 46
Algeria 0 0 0 0 0
http://www.talisman-energy.com/responsibility/transparency/pay-ment_to_host_gov-ernments
http://www.talisman-energy.com/responsibility/transparency/pay-ment_to_host_gov-ernments
0Talisman Energy, Annual Information Form 2009, p.17
Talisman Energy, Annual Information Form 2009, p.25
Australia 0 0 0 0 0
http://www.talisman-energy.com/responsibility/transparency/pay-ment_to_host_gov-ernments
http://www.talisman-energy.com/responsibility/transparency/pay-ment_to_host_gov-ernments
0Talisman Energy, Annual Information Form 2009, pp.10,17
Talisman Energy, Annual Information Form 2009, p.25
Canada 0
Talisman Energy, Annual Information Form 2009, p.34
Talisman Energy, Annual Infor-mation Form 2009, p.34
Talisman Energy, Annual Infor-mation Form 2009, p.36
0
http://www.talisman-energy.com/responsibility/transparency/pay-ment_to_host_gov-ernments
http://www.talisman-energy.com/responsibility/transparency/pay-ment_to_host_gov-ernments
0Talisman Energy, Annual Information Form 2009, pp.6,17
Talisman Energy, Annual Information Form 2009, p.25
Indonesia 0
Talisman Energy, Annual Informa-tion Form 2009, p.34
Talisman Energy, Annual Infor-mation Form 2009, p.34
Talisman Energy, Annual Infor-mation Form 2009, p.36
0
http://www.talisman-energy.com/responsibility/transparency/pay-ment_to_host_gov-ernments
http://www.talisman-energy.com/responsibility/transparency/pay-ment_to_host_gov-ernments
0Talisman Energy, Annual Information Form 2009, pp.9,17
Talisman Energy, Annual Information Form 2009, p.25
Malaysia 0 0 0 0 0
http://www.talisman-energy.com/responsibility/transparency/pay-ment_to_host_gov-ernments
http://www.talisman-energy.com/responsibility/transparency/pay-ment_to_host_gov-ernments
0Talisman Energy, Annual Information Form 2009, pp.10,17
Talisman Energy, Annual Information Form 2009, p.25
Norway 0
Talisman Energy, Annual Informa-tion Form 2009, p.34
Talisman Energy, Annual Infor-mation Form 2009, p.34
Talisman Energy, Annual Infor-mation Form 2009, p.36
0
http://www.talisman-energy.com/responsibility/transparency/pay-ment_to_host_gov-ernments
http://www.talisman-energy.com/responsibility/transparency/pay-ment_to_host_gov-ernments
0Talisman Energy, Annual Information Form 2009, pp.8,17
Talisman Energy, Annual Information Form 2009, p.25
Trinidad and Tobago 0 0 0 0 0
http://www.talisman-energy.com/responsibility/transparency/pay-ment_to_host_gov-ernments
http://www.talisman-energy.com/responsibility/transparency/pay-ment_to_host_gov-ernments
0Talisman Energy, Annual Information Form 2009, p.17
"fully divested reserves=0"
Tunisia 0 0 0 0 0
http://www.talisman-energy.com/responsibility/transparency/pay-ment_to_host_gov-ernments
http://www.talisman-energy.com/responsibility/transparency/pay-ment_to_host_gov-ernments
0Talisman Energy, Annual Information Form 2009, p.17
Talisman Energy, Annual Information Form 2009, p.25
UK 0
Talisman Energy, Annual Informa-tion Form 2009, p.34
Talisman Energy, Annual Infor-mation Form 2009, p.34
Talisman Energy, Annual Infor-mation Form 2009, p.36
0
http://www.talisman-energy.com/responsibility/transparency/pay-ment_to_host_gov-ernments
http://www.talisman-energy.com/responsibility/transparency/pay-ment_to_host_gov-ernments
0Talisman Energy, Annual Information Form 2009, pp.7,17
Talisman Energy, Annual Information Form 2009, p.25
USA 0
Talisman Energy, Annual Informa-tion Form 2009, p.34
Talisman Energy, Annual Infor-mation Form 2009, p.34
Talisman Energy, Annual Infor-mation Form 2009, p.36
0
http://www.talisman-energy.com/responsibility/transparency/pay-ment_to_host_gov-ernments
http://www.talisman-energy.com/responsibility/transparency/pay-ment_to_host_gov-ernments
0Talisman Energy, Annual Information Form 2009, pp.5,17
Talisman Energy, Annual Information Form 2009, p.25
Vietnam 0 0 0 0 0
http://www.talisman-energy.com/responsibility/transparency/pay-ment_to_host_gov-ernments
http://www.talisman-energy.com/responsibility/transparency/pay-ment_to_host_gov-ernments
0Talisman Energy, Annual Information Form 2009, pp.10,17
Talisman Energy, Annual Information Form 2009, p.25
106 Transparency International 107Promoting Revenue Transparency

TOTAL
"Based on the following source:" question #
“Total, Factbook 2009, pp.73-104 Total, Form 20-F 2009, pp.12-29”
the following countries have been identified as countries of company’s oil and gas producing activities:
37 38 39 40 41 42 43 44 45 46
Algeria 0 0 0 0 0 0 0 0 "Total S.A., Form 20-F for 2009, p.12 Total, Factbook 2009, pp.43-45" 0
Angola
"1 point Financial Transparency: The Example of Total in Angola, July 2009 - a brochure, p.4"
0 0 0 0 0 0 0 "Total S.A., Form 20-F for 2009, p.12 Total, Factbook 2009, pp.43-45" 0
Argentina 0 0 0 0 0 0 0 0 "Total S.A., Form 20-F for 2009, p.12 Total, Factbook 2009, pp.43-45" 0
Azerbaijan 0 0 0 0 0 0 0 0 "Total S.A., Form 20-F for 2009, p.12 Total, Factbook 2009, pp.43-45" 0
Bolivia 0 0 0 0 0 0 0 0 "Total S.A., Form 20-F for 2009, p.12 Total, Factbook 2009, pp.43-45" 0
Brunei 0 0 0 0 0 0 0 0 "Total S.A., Form 20-F for 2009, p.12 Total, Factbook 2009, pp.43-45" 0
Cameroon 0 0 0 0 0
Financial Transparency: the Example of Total in Cameroon - July 2009, p.4
0 0 "Total S.A., Form 20-F for 2009, p.12 Total, Factbook 2009, pp.43-45" 0
Canada 0 0 0 0 0 0 0 0 "Total S.A., Form 20-F for 2009, p.12 Total, Factbook 2009, pp.43-45" 0
Colombia 0 0 0 0 0 0 0 0 "Total S.A., Form 20-F for 2009, p.12 Total, Factbook 2009, pp.43-45" 0
Congo Brazzaville 0 0 0 0 0 0 0 0 "Total S.A., Form 20-F for 2009, p.12 Total, Factbook 2009, pp.43-45" 0
France 0 0 0 0 0 0 0 0 "Total S.A., Form 20-F for 2009, p.12 Total, Factbook 2009, pp.43-45" 0
Gabon
"2 points Financial Transparency: the Example of Total in Gabon - Nov. 2009 - a brochure, p.4"
0 0 0 0 0 0 0 "Total S.A., Form 20-F for 2009, p.12 Total, Factbook 2009, pp.43-45" 0
Indonesia 0 0 0 0 0 0 0 0 "Total S.A., Form 20-F for 2009, p.12 Total, Factbook 2009, pp.43-45" 0
Iran 0 0 0 0 0 0 0 0 "Total S.A., Form 20-F for 2009, p.12 Total, Factbook 2009, pp.43-45" 0
Libya 0 0 0 0 0 0 0 0 "Total S.A., Form 20-F for 2009, p.12 Total, Factbook 2009, pp.43-45" 0
Myanmar 0 0 0 0 0 0 0 0 "Total S.A., Form 20-F for 2009, p.12 Total, Factbook 2009, pp.43-45" 0
Netherlands 0 0 0 0 0 0 0 0 "Total S.A., Form 20-F for 2009, p.12 Total, Factbook 2009, pp.43-45" 0
Nigeria
Financial Transparency: the Example of Total in Nigeria - Sept. 2009 - a brochure, p.5
Financial Transparency: the Example of Total in Nigeria - Sept. 2009 - a brochure, p.5
Financial Transparency: the Example of Total in Nigeria - Sept. 2009 - a brochure, p.5
0 "Total S.A., Form 20-F for 2009, p.12 Total, Factbook 2009, pp.43-45" 0
Norway
"1 point Financial Transparency: the Example of Total in Norway - Oct. 2009, p.4"
Financial Transparency: the Example of Total in Norway - Oct. 2009, p.4
0 0 "Total S.A., Form 20-F for 2009, p.12 Total, Factbook 2009, pp.43-45" 0
Oman 0 0 0 0 0 0 0 0 Total S.A., Form 20-F for 2009, p.29 0
Qatar 0 0 0 0 0 0 0 0 "Total S.A., Form 20-F for 2009, p.12 Total, Factbook 2009, pp.43-45" 0
Russia 0 0 0 0 0 0 0 0 "Total S.A., Form 20-F for 2009, p.12 Total, Factbook 2009, pp.43-45" 0
Syria 0 0 0 0 0 0 0 0 "Total S.A., Form 20-F for 2009, p.12 Total, Factbook 2009, pp.43-45" 0
Thailand 0 0 0 0 0 0 0 0 "Total S.A., Form 20-F for 2009, p.12 Total, Factbook 2009, pp.43-45" 0
Trinidad and Tobago 0 0 0 0 0 0 0 0 "Total S.A., Form 20-F for 2009, p.12 Total, Factbook 2009, pp.43-45" 0
UAE 0 0 0 0 0 0 0 0 "Total S.A., Form 20-F for 2009, p.12 Total, Factbook 2009, pp.43-45" 0
UK 0 0 0 0 0 0 0 0 "Total S.A., Form 20-F for 2009, p.12 Total, Factbook 2009, pp.43-45" 0
USA 0 0 0 0 0 0 0 0 "Total S.A., Form 20-F for 2009, p.12 Total, Factbook 2009, pp.43-45" 0
Venezuela 0 0 0 0 0 0 0 0 "Total S.A., Form 20-F for 2009, p.12 Total, Factbook 2009, pp.43-45" 0
Yemen 0 0 0 0 0 0 0 0 "Total S.A., Form 20-F for 2009, p.12 Total, Factbook 2009, pp.43-45" 0
WINTERSHALL
"Based on the following source:" question #
“BASF 2009 Report, Supplementary Infor-mation on Oil and Gas Producing Activities, p.198 http://www.wintershall.com/exploration_produktion.html?&L=0”
the following countries have been identified as countries of company’s oil and gas producing activities:
37 38 39 40 41 42 43 44 45 46
Argentina 0 0 0 0 0 0 0 0
Wintershall, 2009 Shaping the Future, pp.35,36
0
Germany 0
BASF 2009 Report, Supplementary Information on Oil and Gas Produc-ing Activities, p.201
BASF 2009 Report, Supplementary Information on Oil and Gas Producing Activities, p.201
BASF 2009 Report, Supple-mentary Information on Oil and Gas Produc-ing Activities, p.202
BASF 2009 Report, Supple-mentary Informa-tion on Oil and Gas Producing Activities, p.201
BASF 2009 Report, Supplementary Information on Oil and Gas Producing Activities, p.201
BASF 2009 Report, Supplementary Information on Oil and Gas Producing Activities, p.201
0Wintershall, 2009 Shaping the Future, p.25
BASF 2009 Report, Supplementary Information on Oil and Gas Producing Activities, p.199
Libya 0 0 0 0 0 0 0 0 0 0
Netherlands 0 0 0 0 0 0 0 0
http://www.wintershall.com/848.html?&L=0
0
Romania 0 0 0 0 0 0 0 0 0 0
Russia 0
BASF 2009 Report, Supple-mentary Informa-tion on Oil and Gas Producing Activities, p.201
BASF 2009 Report, Sup-plementary Information on Oil and Gas Producing Activities, p.201
BASF 2009 Report, Sup-plementary Information on Oil and Gas Produc-ing Activities, p.202
BASF 2009 Report, Supple-mentary Informa-tion on Oil and Gas Producing Activities, p.201
BASF 2009 Report, Supplementary Information on Oil and Gas Producing Activities, p.201
BASF 2009 Report, Supplementary Information on Oil and Gas Producing Activities, p.201
0Wintershall, 2009 Shaping the Future, p.40
"Wintershall, 2009 Shaping the Future, p.39 BASF, 2009 Annual Report, p.78"
WOODSIDE
"Based on the following source:" question #
Woodside 2009 Annual report, pp.24-25
the following countries have been identified as countries of company’s oil and gas producing activities:
37 38 39 40 41 42 43 44 45 46
Algeria 0Woodside 2009 Annual Report, pp.25,83,137
0 0 0 0 0 0Woodside 2009 Annual Report, pp.25,137
Woodside 2009 Annual Report, pp.11,25
Australia 0Woodside 2009 Annual Report, pp.16,18,82,83,137
Woodside 2009 Annual Report, p.81
Woodside 2009 Annual Report, p.81
Woodside 2009 An-nual Report, p.81
Woodside 2009 Annual Report, p.81
0
Woodside, 2009 Sustainability Report, p.36
Woodside 2009 Annual Report, pp.16,18,137
Woodside 2009 Annual Report, pp.11,16,18
USA 0Woodside 2009 Annual Report, pp.24,82,83,137
Woodside 2009 Annual Report, p.81
Woodside 2009 Annual Report, p.81
Woodside 2009 An-nual Report, p.81
Woodside 2009 Annual Report, p.81
0 0Woodside 2009 Annual Report, pp.24,137
Woodside 2009 Annual Report, pp.11,24
108 Transparency International 109Promoting Revenue Transparency
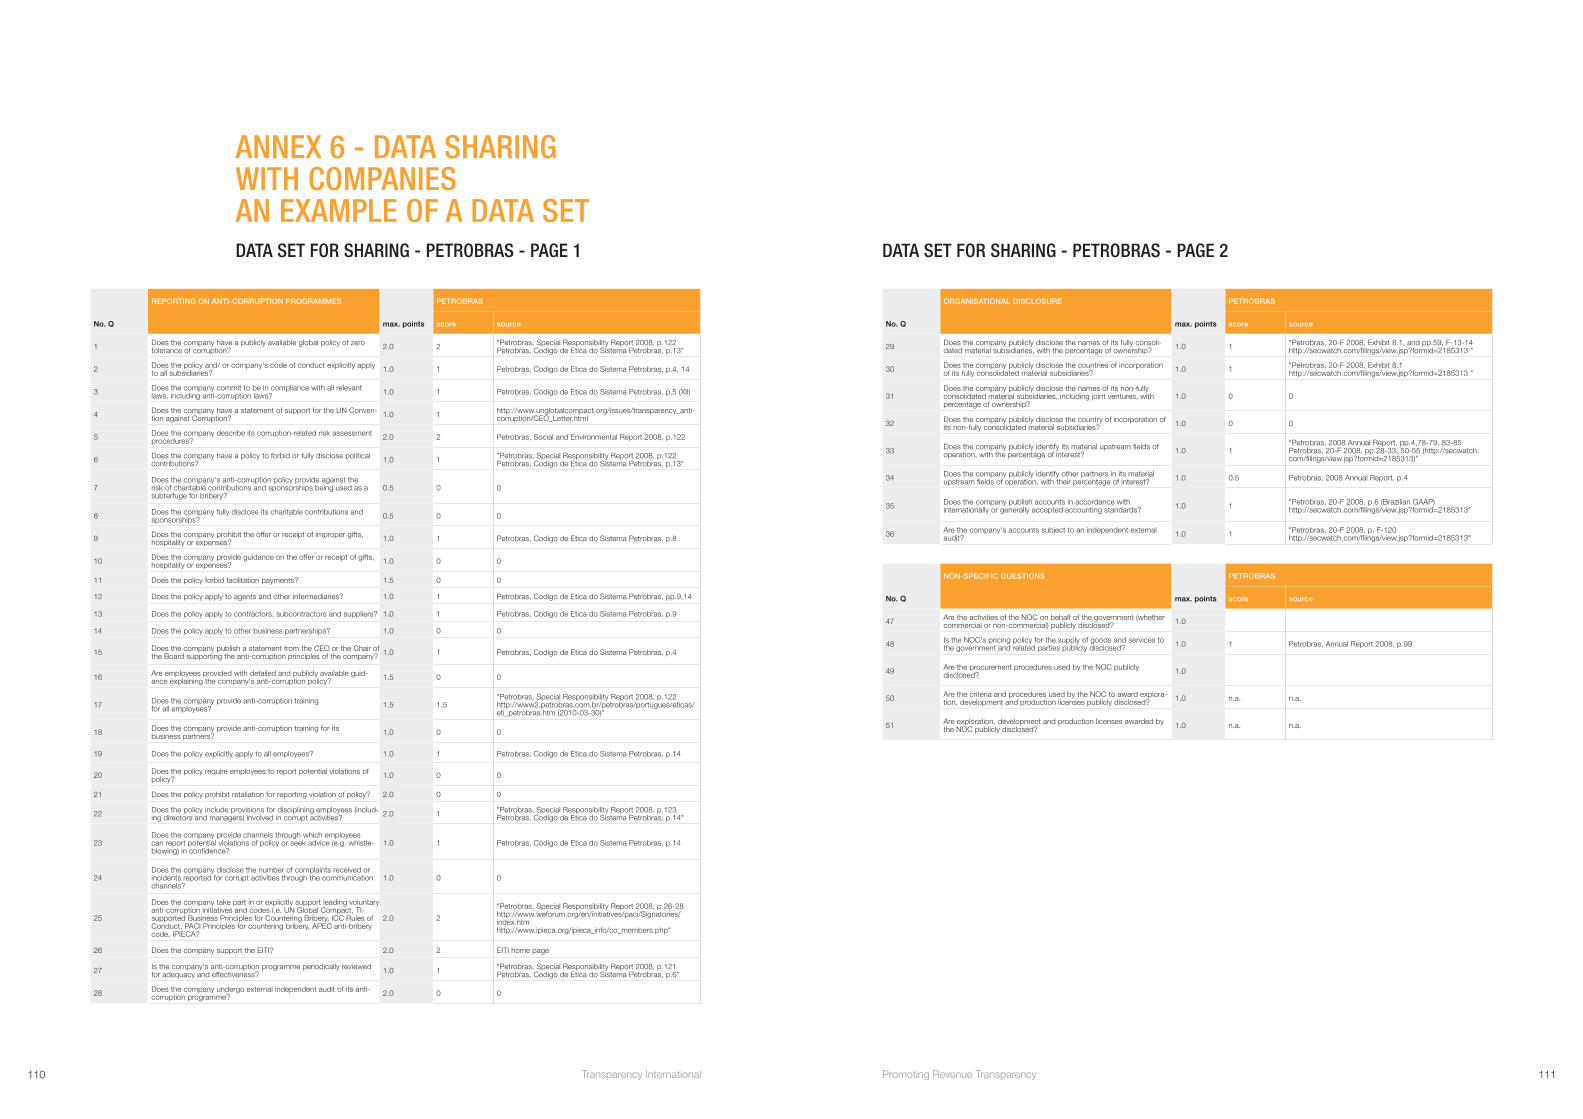
ANNEX 6 - DATA SHARING WITH COMPANIES AN EXAMPLE OF A DATA SETDATA SET FOR SHARING - PETROBRAS - PAGE 1
REPORTING ON ANTI-CORRUPTION PROGRAMMES PETROBRAS
No. Q max. points score source
1 Does the company have a publicly available global policy of zero tolerance of corruption? 2.0 2 "Petrobras, Special Responsibility Report 2008, p.122
Petrobras, Codigo de Etica do Sistema Petrobras, p.13"
2 Does the policy and/ or company's code of conduct explicitly apply to all subsidiaries? 1.0 1 Petrobras, Codigo de Etica do Sistema Petrobras, p.4, 14
3 Does the company commit to be in compliance with all relevant laws, including anti-corruption laws? 1.0 1 Petrobras, Codigo de Etica do Sistema Petrobras, p.5 (XII)
4 Does the company have a statement of support for the UN Conven-tion against Corruption? 1.0 1 http://www.unglobalcompact.org/issues/transparency_anti-
corruption/CEO_Letter.html
5 Does the company describe its corruption-related risk assessment procedures? 2.0 2 Petrobras, Social and Environmental Report 2008, p.122
6 Does the company have a policy to forbid or fully disclose political contributions? 1.0 1 "Petrobras, Special Responsibility Report 2008, p.122
Petrobras, Codigo de Etica do Sistema Petrobras, p.13"
7Does the company's anti-corruption policy provide against the risk of charitable contributions and sponsorships being used as a subterfuge for bribery?
0.5 0 0
8 Does the company fully disclose its charitable contributions and sponsorships? 0.5 0 0
9 Does the company prohibit the offer or receipt of improper gifts, hospitality or expenses? 1.0 1 Petrobras, Codigo de Etica do Sistema Petrobras, p.8
10 Does the company provide guidance on the offer or receipt of gifts, hospitality or expenses? 1.0 0 0
11 Does the policy forbid facilitation payments? 1.5 0 0
12 Does the policy apply to agents and other intermediaries? 1.0 1 Petrobras, Codigo de Etica do Sistema Petrobras, pp.9,14
13 Does the policy apply to contractors, subcontractors and suppliers? 1.0 1 Petrobras, Codigo de Etica do Sistema Petrobras, p.9
14 Does the policy apply to other business partnerships? 1.0 0 0
15 Does the company publish a statement from the CEO or the Chair of the Board supporting the anti-corruption principles of the company? 1.0 1 Petrobras, Codigo de Etica do Sistema Petrobras, p.4
16 Are employees provided with detailed and publicly available guid-ance explaining the company's anti-corruption policy? 1.5 0 0
17 Does the company provide anti-corruption training for all employees? 1.5 1.5
"Petrobras, Special Responsibility Report 2008, p.122 http://www2.petrobras.com.br/petrobras/portugues/eticas/eti_petrobras.htm (2010-03-30)"
18 Does the company provide anti-corruption training for its business partners? 1.0 0 0
19 Does the policy explicitly apply to all employees? 1.0 1 Petrobras, Codigo de Etica do Sistema Petrobras, p.14
20 Does the policy require employees to report potential violations of policy? 1.0 0 0
21 Does the policy prohibit retaliation for reporting violation of policy? 2.0 0 0
22 Does the policy include provisions for disciplining employees (includ-ing directors and managers) involved in corrupt activities? 2.0 1 "Petrobras, Special Responsibility Report 2008, p.123
Petrobras, Codigo de Etica do Sistema Petrobras, p.14"
23Does the company provide channels through which employees can report potential violations of policy or seek advice (e.g. whistle-blowing) in confidence?
1.0 1 Petrobras, Codigo de Etica do Sistema Petrobras, p.14
24Does the company disclose the number of complaints received or incidents reported for corrupt activities through the communication channels?
1.0 0 0
25
Does the company take part in or explicitly support leading voluntary anti-corruption initiatives and codes i.e. UN Global Compact, TI-supported Business Principles for Countering Bribery, ICC Rules of Conduct, PACI Principles for countering bribery, APEC anti-bribery code, IPIECA?
2.0 2
"Petrobras, Special Responsibility Report 2008, p.26-28 http://www.weforum.org/en/initiatives/paci/Signatories/index.htm http://www.ipieca.org/ipieca_info/co_members.php"
26 Does the company support the EITI? 2.0 2 EITI home page
27 Is the company's anti-corruption programme periodically reviewed for adequacy and effectiveness? 1.0 1 "Petrobras, Special Responsibility Report 2008, p.121
Petrobras, Codigo de Etica do Sistema Petrobras, p.6"
28 Does the company undergo external independent audit of its anti-corruption programme? 2.0 0 0
DATA SET FOR SHARING - PETROBRAS - PAGE 2
ORGANISATIONAL DISCLOSURE PETROBRAS
No. Q max. points score source
29 Does the company publicly disclose the names of its fully consoli-dated material subsidiaries, with the percentage of ownership? 1.0 1 "Petrobras, 20-F 2008, Exhibit 8.1, and pp.59, F-13-14
http://secwatch.com/filings/view.jsp?formid=2185313 "
30 Does the company publicly disclose the countries of incorporation of its fully consolidated material subsidiaries? 1.0 1 "Petrobras, 20-F 2008, Exhibit 8.1
http://secwatch.com/filings/view.jsp?formid=2185313 "
31Does the company publicly disclose the names of its non-fully consolidated material subsidiaries, including joint ventures, with percentage of ownership?
1.0 0 0
32 Does the company publicly disclose the country of incorporation of its non-fully consolidated material subsidiaries? 1.0 0 0
33 Does the company publicly identify its material upstream fields of operation, with the percentage of interest? 1.0 1
"Petrobras, 2008 Annual Report, pp.4,78-79, 83-85 Petrobras, 20-F 2008, pp.28-33, 50-55 (http://secwatch.com/filings/view.jsp?formid=2185313)"
34 Does the company publicly identify other partners in its material upstream fields of operation, with their percentage of interest? 1.0 0.5 Petrobras, 2008 Annual Report, p.4
35 Does the company publish accounts in accordance with internationally or generally accepted accounting standards? 1.0 1 "Petrobras, 20-F 2008, p.6 (Brazilian GAAP)
http://secwatch.com/filings/view.jsp?formid=2185313"
36 Are the company's accounts subject to an independent external audit? 1.0 1 "Petrobras, 20-F 2008, p. F-120
http://secwatch.com/filings/view.jsp?formid=2185313"
NON-SPECIFIC QUESTIONS PETROBRAS
No. Q max. points score source
47 Are the activities of the NOC on behalf of the government (whether commercial or non-commercial) publicly disclosed? 1.0
48 Is the NOC's pricing policy for the supply of goods and services to the government and related parties publicly disclosed? 1.0 1 Petrobras, Annual Report 2008, p.99
49 Are the procurement procedures used by the NOC publicly disclosed? 1.0
50 Are the criteria and procedures used by the NOC to award explora-tion, development and production licenses publicly disclosed? 1.0 n.a. n.a.
51 Are exploration, development and production licenses awarded by the NOC publicly disclosed? 1.0 n.a. n.a.
110 Transparency International 111Promoting Revenue Transparency

DATA SET FOR SHARING - PETROBRAS - PAGE 3
PETROBRAS
"Based on the following source:" question #
“Petrobras 2008 An-nual Report, pp.78-79, 82-85 http://www.petrobras.com/ptcm/app-manager/ptcm/dptcm?_nfpb=true&_pageLabel=petr_com_mundo “
37 38 39 40 41 42 43 44 45 46
The following countries have been identified as countries of company’s oil and gas producing activities:
Does the company disclose payments to government along the EITI revenue streams indicators in country X?
Does the company publicly disclose its revenue for its operations in country X?
Does the company publicly disclose its production costs for its operations in country X?
Does the company publicly disclose its development and explora-tion costs for its operations in country X?
Does the com-pany publicly disclose its profit before taxes for its operations in country X?
Does the company publicly disclose its profit taxes for its operations in country X?
Does the company publicly disclose its royalties for its operations in country X?
Does the company publicly disclose for its operations in country X expenditures for local community development?
Does the company publicly disclose production volumes for its operations in country X?
Does the company pulicly disclose a measure of reserves for its operations in country X?
Angola 0 0 0 0 0 0 0 0Petrobras, 2008 Annual Report, p.85
Petrobras, Annual Report 2008, p.76
Argentina 0 0 0 0 0 0 0 0Petrobras, 2008 Annual Report, p.83
Petrobras, Annual Report 2008, p.76
Bolivia 0 0 0 0 0 0 0 0Petrobras, 2008 Annual Report, p.83
Petrobras, Annual Report 2008, p.76
Brazil 0 0 0 0 0 0 0
Petrobras, Social and Environmental Report 2008, p.39
Petrobras, Annual Report 2008, pp.iii (front cover), 41
Petrobras, Annual Report 2008, pp.45-46
Colombia 0 0 0 0 0 0 0 0Petrobras, 2008 Annual Report, p.83
Petrobras, Annual Report 2008, p.76
Ecuador 0 0 0 0 0 0 0 0Petrobras, 2008 Annual Report, p.83
Petrobras, Annual Report 2008, p.76
Mexico 0 0 0 0 0 0 0 0Petrobras, 2008 Annual Report, p.85
N.A.
Nigeria 0 0 0 0 0 0 0 0Petrobras, Annual Report 2008, p.85
Petrobras, Annual Report 2008, p.76
Peru 0 0 0 0 0 0 0 0Petrobras, 2008 Annual Report, p.84
Petrobras, Annual Report 2008, p.76
USA 0 0 0 0 0 0 0 0Petrobras, 2008 Annual Report, p.84
Petrobras, Annual Report 2008, p.76
Venezuela 0 0 0 0 0 0 0 0Petrobras, 2008 Annual Report, p.84
Petrobras, Annual Report 2008, p.76
Note: In all cells where sources of information are quoted, the company gets positive scores. “0” means that no source of such information for a given country is available and the score is zero.
ANNEX 7 - OIL AND GAS INDUSTRY BACKGROUND RELEVANT TO THE PRT REPORTOil is the most important source of energy in the world; gas ranks third. The two fuels collectively serve 59 per cent of global energy consumption.62
Though oil and gas have been freely traded commodities for several decades, their prices are still strongly influenced by political decisions and events (for example, the embargo during the 1970s, the Iran-Iraq war in the 1980s, Iraq’s invasion of Kuwait in the 1990s, and the Iraq war and Venezuela’s ‘revolution’ during the past decade). This reflects the strong political interests in this industry and tight relations between oil companies and political leaders.
RESERVESIn the section on country-level disclosure, we refer to companies’ reserves as one of the technical indicators of their productive potential. Reserves reflect the potential value that will have to be shared between companies and the populations represented by their governments.
Proved oil and gas reserves are still commonly used as a measure of geographical oil and gas distribution in the world, but they are not a straightforward indicator of a country’s productive capacity.63
Regionally, the largest share of proved oil reserves is in the Middle East (754 billion barrels, constituting 51 per cent of global reserves including oil sands and 57 per cent excluding them). North American reserves, mostly driven by Canadian oil sands, amount to 15 per cent of global reserves. Middle Eastern countries possess about 40 per cent of natural gas reserves, followed by Europe and Eurasia with 34 per cent (including Russia, which alone accounts for 24 per cent of world reserves).
Nationally, the highest proved oil reserves are in Saudi Arabia (18 per cent of global reserves), Canada (12 per cent, mostly oil sands), Venezuela (12), Iran (9), Iraq (8), Kuwait, UAE (7 each) and Russia (5). Proved gas reserves are dominated by three countries: Russia (24 per cent), Iran (16) and Qatar (14).
OPEC member states currently possess 70 per cent of global oil reserves (77 if Canadian oil sands are excluded) and 49 per cent of global natural gas reserves.
112 Transparency International 113Promoting Revenue Transparency
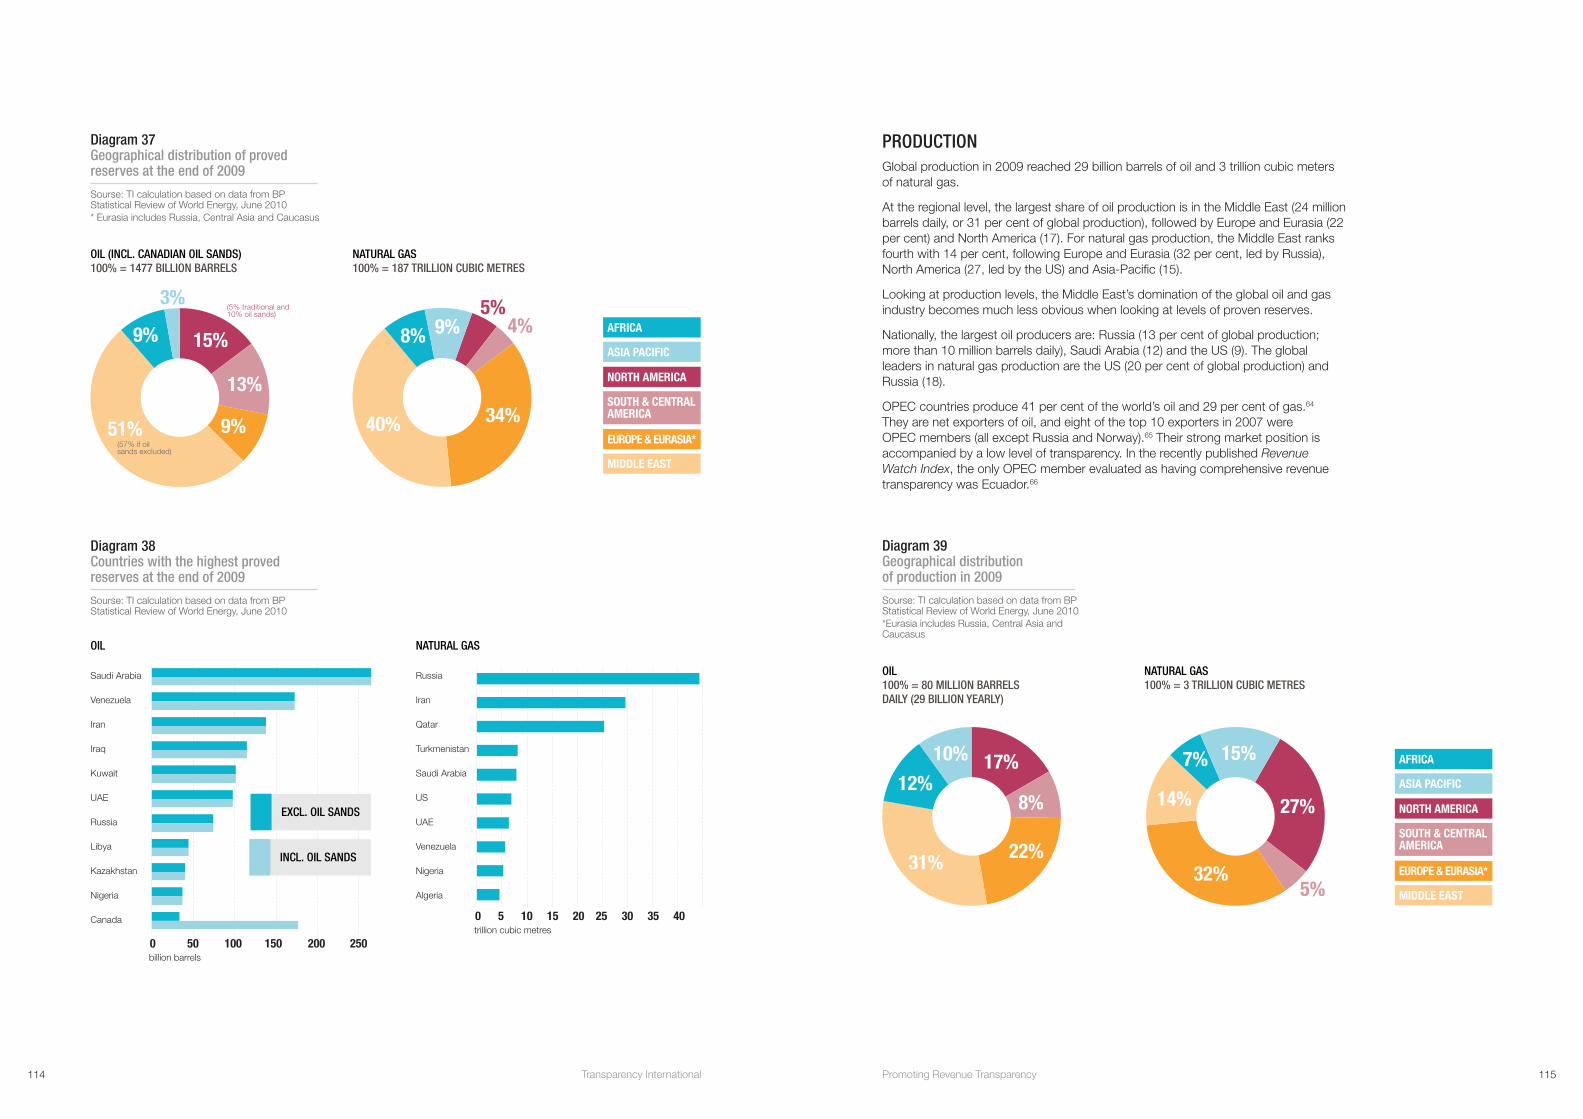
Diagram 37 Geographical distribution of proved reserves at the end of 2009
Sourse: TI calculation based on data from BP Statistical Review of World Energy, June 2010* Eurasia includes Russia, Central Asia and Caucasus
OIL (INCL. CANADIAN OIL SANDS)100% = 1477 BILLION BARRELS
AFRICA
NATURAL GAS100% = 187 TRILLION CUBIC METRES
ASIA PACIFIC
NORTH AMERICA
SOUTH & CENTRAL AMERICA
EUROPE & EURASIA*
MIDDLE EAST
51%
15%
13%
9%
9%
3%
40% 34%
9%8%5%
4%
(57% if oil sands excluded)
(5% traditional and 10% oil sands)
Diagram 38 Countries with the highest proved reserves at the end of 2009
Sourse: TI calculation based on data from BP Statistical Review of World Energy, June 2010
EXCL. OIL SANDS
INCL. OIL SANDS
OIL
Saudi Arabia
Venezuela
Iran
Iraq
Kuwait
UAE
Russia
Libya
Kazakhstan
Nigeria
Canada
0 50 100 150 200 250billion barrels
NATURAL GAS
Russia
Iran
Qatar
Turkmenistan
Saudi Arabia
US
UAE
Venezuela
Nigeria
Algeria
0 5 10 15 20 25 30 35 40trillion cubic metres
PRODUCTIONGlobal production in 2009 reached 29 billion barrels of oil and 3 trillion cubic meters of natural gas.
At the regional level, the largest share of oil production is in the Middle East (24 million barrels daily, or 31 per cent of global production), followed by Europe and Eurasia (22 per cent) and North America (17). For natural gas production, the Middle East ranks fourth with 14 per cent, following Europe and Eurasia (32 per cent, led by Russia), North America (27, led by the US) and Asia-Pacific (15).
Looking at production levels, the Middle East’s domination of the global oil and gas industry becomes much less obvious when looking at levels of proven reserves.
Nationally, the largest oil producers are: Russia (13 per cent of global production; more than 10 million barrels daily), Saudi Arabia (12) and the US (9). The global leaders in natural gas production are the US (20 per cent of global production) and Russia (18).
OPEC countries produce 41 per cent of the world’s oil and 29 per cent of gas.64 They are net exporters of oil, and eight of the top 10 exporters in 2007 were OPEC members (all except Russia and Norway).65 Their strong market position is accompanied by a low level of transparency. In the recently published Revenue Watch Index, the only OPEC member evaluated as having comprehensive revenue transparency was Ecuador.66
Diagram 39 Geographical distribution of production in 2009
Sourse: TI calculation based on data from BP Statistical Review of World Energy, June 2010*Eurasia includes Russia, Central Asia and Caucasus
OIL 100% = 80 MILLION BARRELS DAILY (29 BILLION YEARLY)
AFRICA
NATURAL GAS100% = 3 TRILLION CUBIC METRES
ASIA PACIFIC
NORTH AMERICA
SOUTH & CENTRAL AMERICA
EUROPE & EURASIA*
MIDDLE EAST
31% 22%
8%
17%10%
12%
32%
14%
7% 15%
27%
5%
114 Transparency International 115Promoting Revenue Transparency

Diagram 40 10 biggest producers in 2009
Sourse: TI calculation based on data from BP Statistical Review of World Energy, June 2010
OIL NATURAL GAS
Russia
Saudi Arabia
US
Iran
China
Canada
Mexico
UAE
Iraq
Kuwait
2 4 6 8 10 12thousand barrels daily
US
Russia
Canada
Iran
Norway
Qatar
China
Algeria
Saudi Arabia
Indonesia
0 100 200 300 400 500 600billion cubic metres
13%
12%
9%
5%
5%
4%
4%
3%
3%
3%
20%
18%
5%
4%
3%
3%
3%
3%
3%
2%
OIL DEPENDENCYIn a 2007 Guide on Resource Revenue Transparency, the International Monetary Fund selected 33 hydrocarbon-rich countries based on the importance of the extractive sector for their fiscal revenues, exports and GDP. The sample included:
• Middle East: Bahrain, Iran, Iraq, Kuwait, Oman, Qatar, Saudi Arabia, Syria, UAE, Yemen
• Africa: Algeria, Angola, Cameroon, Democratic Republic of the Congo, Equatorial Guinea, Gabon, Libya, Nigeria, Sudan
• Former Soviet Union: Azerbaijan, Kazakhstan, Russia, Turkmenistan, Uzbekistan
• Latin America: Colombia, Ecuador, Mexico, Trinidad and Tobago, Venezuela
• Asia: Brunei, Indonesia, Vietnam
• Europe: Norway67
The structure of the sample indicates that hydrocarbon dependency is mostly a problem of poorer regions.
It is worth mentioning that oil and gas dependence is also prevalent in countries that are major hydrocarbon consumers and importers; hence the political importance of oil and gas markets for them. The largest oil importers are the US, Japan and China; the largest natural gas importers are Japan, the US, Germany and Italy.68 These are also the home countries for many large global oil and gas companies.
CORRUPTION RISKSIn Transparency International’s 2008 Bribe Payers Index, the oil and gas industry was ranked as highly vulnerable to two analysed forms of corruption: bribery of public officials and state capture (undue influence on the legislative process and government polices).69 This vulnerability was confirmed by a recent IMF Working Paper, which examined the relationship between oil rents and corruption. The results of empirical research confirmed that higher increases in oil rents significantly increase corruption. Moreover, they also significantly erode political rights.70
Another cross-country study (Open Budget Survey 2008 by International Budget Partnership) confirmed that oil- and gas-dependent countries tend to be less transparent. One of the major reasons is likely the intrinsic nature of oil and gas exploration and production, in which resources are publicly owned but often privately produced. This requires a complex system of licenses and fees, and drives corruption incentives.
116 Transparency International 117Promoting Revenue Transparency

LIST OF TABLES AND DIAGRAMS
TABLES
1 NOCs - grouping
2 NOC-specific questions
3 History of the report
4 List of companies in the sample
5 Sample structure by country, by ownership and by internationality of production
DIAGRAMS
1 Company rankings - 3 sections
2 General results in section 1, 2 and 3
3 Relative performance - IOCs and NOCs groups
4 Performance - NOCs vs. IOCs and EITI-support vs. non-support
5 Reporting on anti-corruption programmes - results by company
6 Reporting on anti-corruption programmes - EITI supporters vs. non-supporters
7 Reporting on anti-corruption programmes - performance of NOCs - listed vs. non-listed companies
8 Reporting on anti-corruption programmes - performance of NOCs - one vs. multi-country producers
9 Reporting on anti-corruption programmes - performance by region
10 Organisational Disclosure - results by company
11 Organisational Disclosure - EITI supporters vs. non-supporters
12 Organisational Disclosure - performance of NOCs - listed vs. non-listed companies
13 Organisational Disclosure - performance by region
14 Organisational Disclosure - results by region/ question
15 Country-level disclosure on international operations - results by company
16 Country-level disclosure - EITI supporters vs. non-supporters - international operations
17 Country-level disclosure - NOCs vs. IOCs and EITI support
18 Country-level disclosure - performance by region
19 Corporate disclosure in the chosen host countries - CIS
20 Corporate disclosure in the chosen host countries - Africa
21 Corporate disclosure in the chosen host countries - Latin America
22 Corporate disclosure in the chosen host countries - Asia
23 Corporate disclosure in the chosen host countries - Europe and North America
24a Country-level disclosure on international operations - relative performance
24b Country-level disclosure on international operations - relative performance
25 NOC groups - comparative performance in different sections
26 Out-performance in different sections - an example
27 Cross-section analysis reporting on anti-corruption programmes vs. organisational disclosure
28 Cross-section analysis reporting on anti-corruption programmes vs. country-level disclosure
29 Cross-section analysis organisational disclosure vs. country-level disclosure
30 Section 1 - reporting on anti-corruption programmes - number of positive scores for each question
31 Section 1 - reporting on anti-corruption programmes - the probability that a company scoring positively belongs to the top 10 of the section
32 Section 2 - organisational disclosure number of positive scores for each question
33 Section 3 - country-level disclosure - number of positive scores for each question
34 Country-level reporting on domestic operations - results by company
35 Country-level disclosure - EITI supporters vs. non-supporters - domestic operations
36 Country-level disclosure - domestic vs. International reporting - multi-country producers
37 Geographical distribution of proved reserves at the end of 2009
38 Countries with the highest proved reserves at the end of 2009
39 Geographical distribution of oil and gas production in 2009
40 10 biggest oil and gas producers in 2009
BIBLIOGRAPHY
1 R. Arezki and M. Brueckner, ‘Oil Rents, Corruption and State Stability: Evidence from Panel Data Regression’, IMF Working Paper 09/267, December 2009.
2 BP, Statistical Review of World Energy, June 2010.
3 Forbes Global 2010; www.forbes.com/2010/04/21/global-2000-leading-world-business-global-2000-10_land.html
4 Fortune Global 500; money.cnn.com/magazines/fortune/global500/2010/full_list/index.html
5 www.unglobalcompact.org/docs/issues_doc/Anti-Corruption/UNGC_AntiCorruptionReporting.pdf
6 International Energy Agency, Key World Statistics, 2009.
7 International Monetary Fund, Guide on Resource Revenue Transparency, 2007.
8 Oxfam, ‘US Congress Passes Law to End Secrecy in Oil, Gas, and Mining Industry’, 15 July 2010.
9 Revenue Watch Institute, Revenue Watch Index, 2010.
10 Transparency International, ‘Report on Revenue Transparency of Oil and Gas Companies’, 2008.
11 Transparency International, Bribe Payers Index, 2008.
12 USB Investment Research, ‘Global oil and gas: Introduction to the oil industry’, May 2008.
Corporate websites of 44 evaluated companies
Corporate documents; details listed in Annex 5: Data tables with sources
118 Transparency International 119Promoting Revenue Transparency
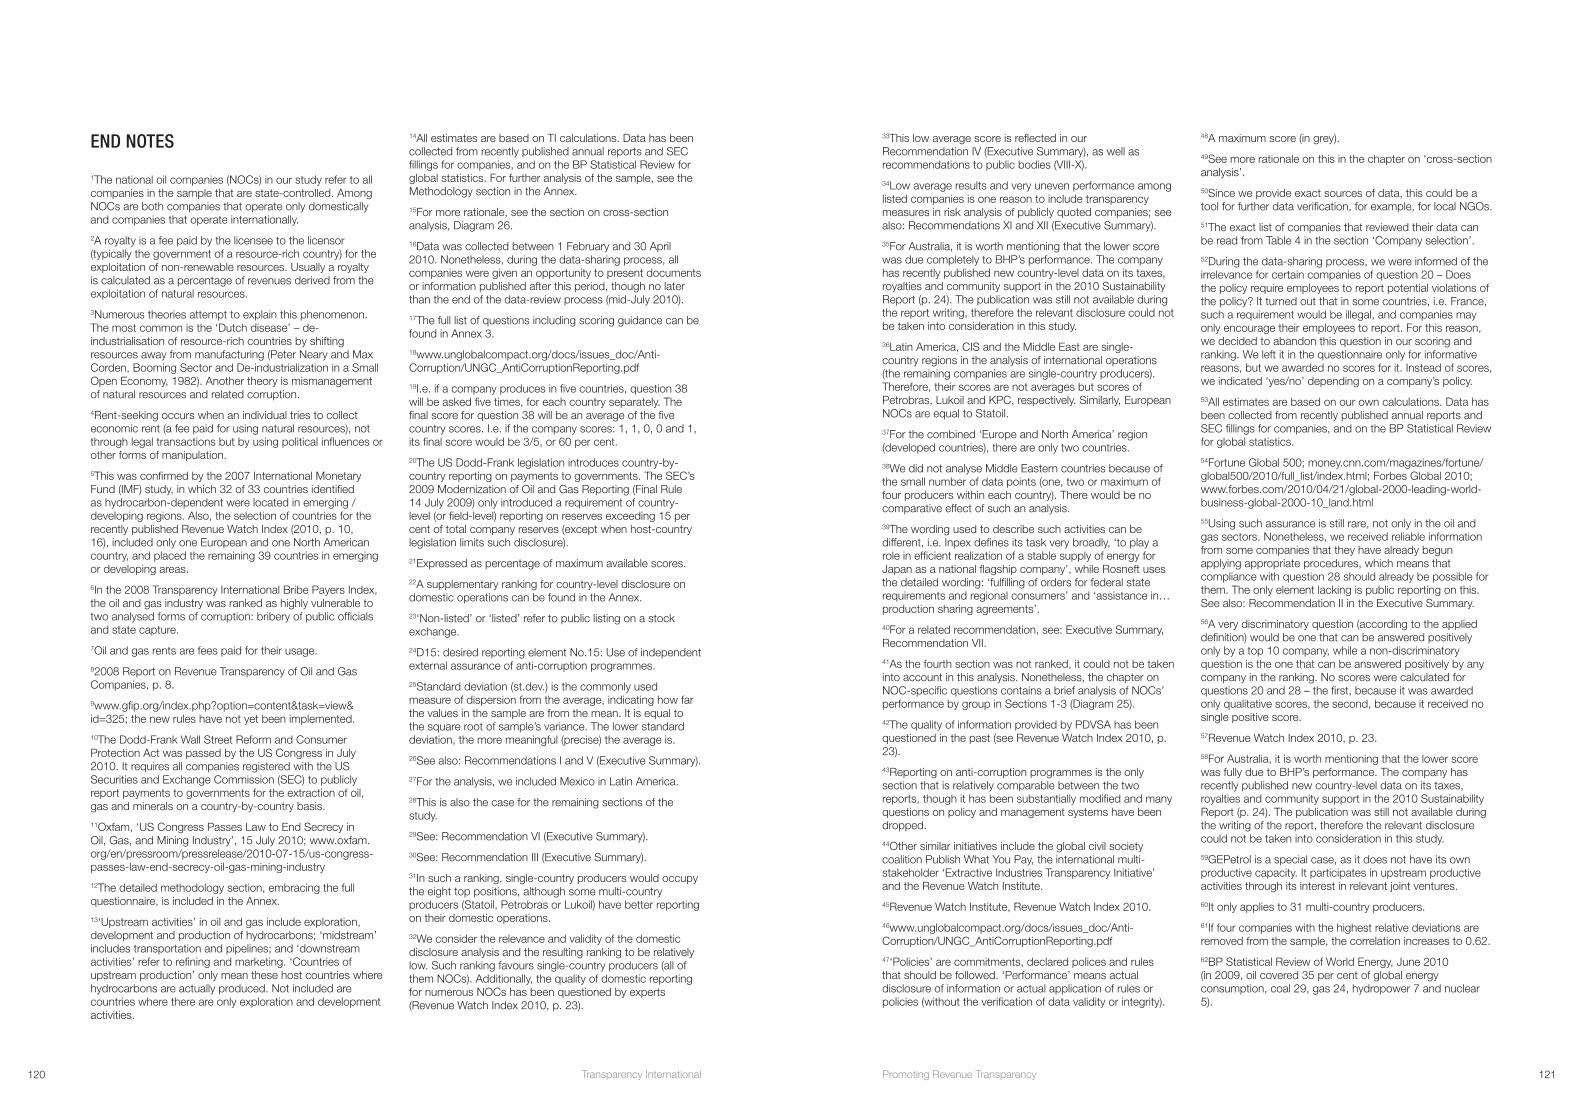
END NOTES
1The national oil companies (NOCs) in our study refer to all companies in the sample that are state-controlled. Among NOCs are both companies that operate only domestically and companies that operate internationally.
2A royalty is a fee paid by the licensee to the licensor (typically the government of a resource-rich country) for the exploitation of non-renewable resources. Usually a royalty is calculated as a percentage of revenues derived from the exploitation of natural resources.
3Numerous theories attempt to explain this phenomenon. The most common is the ‘Dutch disease’ – de-industrialisation of resource-rich countries by shifting resources away from manufacturing (Peter Neary and Max Corden, Booming Sector and De-industrialization in a Small Open Economy, 1982). Another theory is mismanagement of natural resources and related corruption.
4Rent-seeking occurs when an individual tries to collect economic rent (a fee paid for using natural resources), not through legal transactions but by using political influences or other forms of manipulation.
5This was confirmed by the 2007 International Monetary Fund (IMF) study, in which 32 of 33 countries identified as hydrocarbon-dependent were located in emerging /developing regions. Also, the selection of countries for the recently published Revenue Watch Index (2010, p. 10, 16), included only one European and one North American country, and placed the remaining 39 countries in emerging or developing areas.
6In the 2008 Transparency International Bribe Payers Index, the oil and gas industry was ranked as highly vulnerable to two analysed forms of corruption: bribery of public officials and state capture.
7Oil and gas rents are fees paid for their usage.
82008 Report on Revenue Transparency of Oil and Gas Companies, p. 8.
9www.gfip.org/index.php?option=content&task=view&id=325; the new rules have not yet been implemented.
10The Dodd-Frank Wall Street Reform and Consumer Protection Act was passed by the US Congress in July 2010. It requires all companies registered with the US Securities and Exchange Commission (SEC) to publicly report payments to governments for the extraction of oil, gas and minerals on a country-by-country basis.
11Oxfam, ‘US Congress Passes Law to End Secrecy in Oil, Gas, and Mining Industry’, 15 July 2010; www.oxfam.org/en/pressroom/pressrelease/2010-07-15/us-congress-passes-law-end-secrecy-oil-gas-mining-industry
12The detailed methodology section, embracing the full questionnaire, is included in the Annex.
13‘Upstream activities’ in oil and gas include exploration, development and production of hydrocarbons; ‘midstream’ includes transportation and pipelines; and ‘downstream activities’ refer to refining and marketing. ‘Countries of upstream production’ only mean these host countries where hydrocarbons are actually produced. Not included are countries where there are only exploration and development activities.
14All estimates are based on TI calculations. Data has been collected from recently published annual reports and SEC fillings for companies, and on the BP Statistical Review for global statistics. For further analysis of the sample, see the Methodology section in the Annex.
15For more rationale, see the section on cross-section analysis, Diagram 26.
16Data was collected between 1 February and 30 April 2010. Nonetheless, during the data-sharing process, all companies were given an opportunity to present documents or information published after this period, though no later than the end of the data-review process (mid-July 2010).
17The full list of questions including scoring guidance can be found in Annex 3.
18www.unglobalcompact.org/docs/issues_doc/Anti-Corruption/UNGC_AntiCorruptionReporting.pdf
19I.e. if a company produces in five countries, question 38 will be asked five times, for each country separately. The final score for question 38 will be an average of the five country scores. I.e. if the company scores: 1, 1, 0, 0 and 1, its final score would be 3/5, or 60 per cent.
20The US Dodd-Frank legislation introduces country-by-country reporting on payments to governments. The SEC’s 2009 Modernization of Oil and Gas Reporting (Final Rule 14 July 2009) only introduced a requirement of country-level (or field-level) reporting on reserves exceeding 15 per cent of total company reserves (except when host-country legislation limits such disclosure).
21Expressed as percentage of maximum available scores.
22A supplementary ranking for country-level disclosure on domestic operations can be found in the Annex.
23‘Non-listed’ or ‘listed’ refer to public listing on a stock exchange.
24D15: desired reporting element No.15: Use of independent external assurance of anti-corruption programmes.
25Standard deviation (st.dev.) is the commonly used measure of dispersion from the average, indicating how far the values in the sample are from the mean. It is equal to the square root of sample’s variance. The lower standard deviation, the more meaningful (precise) the average is.
26See also: Recommendations I and V (Executive Summary).
27For the analysis, we included Mexico in Latin America.
28This is also the case for the remaining sections of the study.
29See: Recommendation VI (Executive Summary).
30See: Recommendation III (Executive Summary).
31In such a ranking, single-country producers would occupy the eight top positions, although some multi-country producers (Statoil, Petrobras or Lukoil) have better reporting on their domestic operations.
32We consider the relevance and validity of the domestic disclosure analysis and the resulting ranking to be relatively low. Such ranking favours single-country producers (all of them NOCs). Additionally, the quality of domestic reporting for numerous NOCs has been questioned by experts (Revenue Watch Index 2010, p. 23).
33This low average score is reflected in our Recommendation IV (Executive Summary), as well as recommendations to public bodies (VIII-X).
34Low average results and very uneven performance among listed companies is one reason to include transparency measures in risk analysis of publicly quoted companies; see also: Recommendations XI and XII (Executive Summary).
35For Australia, it is worth mentioning that the lower score was due completely to BHP’s performance. The company has recently published new country-level data on its taxes, royalties and community support in the 2010 Sustainability Report (p. 24). The publication was still not available during the report writing, therefore the relevant disclosure could not be taken into consideration in this study.
36Latin America, CIS and the Middle East are single-country regions in the analysis of international operations (the remaining companies are single-country producers). Therefore, their scores are not averages but scores of Petrobras, Lukoil and KPC, respectively. Similarly, European NOCs are equal to Statoil.
37For the combined ‘Europe and North America’ region (developed countries), there are only two countries.
38We did not analyse Middle Eastern countries because of the small number of data points (one, two or maximum of four producers within each country). There would be no comparative effect of such an analysis.
39The wording used to describe such activities can be different, i.e. Inpex defines its task very broadly, ‘to play a role in efficient realization of a stable supply of energy for Japan as a national flagship company’, while Rosneft uses the detailed wording: ‘fulfilling of orders for federal state requirements and regional consumers’ and ‘assistance in…production sharing agreements’.
40For a related recommendation, see: Executive Summary, Recommendation VII.
41As the fourth section was not ranked, it could not be taken into account in this analysis. Nonetheless, the chapter on NOC-specific questions contains a brief analysis of NOCs’ performance by group in Sections 1-3 (Diagram 25).
42The quality of information provided by PDVSA has been questioned in the past (see Revenue Watch Index 2010, p. 23).
43Reporting on anti-corruption programmes is the only section that is relatively comparable between the two reports, though it has been substantially modified and many questions on policy and management systems have been dropped.
44Other similar initiatives include the global civil society coalition Publish What You Pay, the international multi-stakeholder ‘Extractive Industries Transparency Initiative’ and the Revenue Watch Institute.
45Revenue Watch Institute, Revenue Watch Index 2010.
46www.unglobalcompact.org/docs/issues_doc/Anti-Corruption/UNGC_AntiCorruptionReporting.pdf
47‘Policies’ are commitments, declared polices and rules that should be followed. ‘Performance’ means actual disclosure of information or actual application of rules or policies (without the verification of data validity or integrity).
48A maximum score (in grey).
49See more rationale on this in the chapter on ‘cross-section analysis’.
50Since we provide exact sources of data, this could be a tool for further data verification, for example, for local NGOs.
51The exact list of companies that reviewed their data can be read from Table 4 in the section ‘Company selection’.
52During the data-sharing process, we were informed of the irrelevance for certain companies of question 20 – Does the policy require employees to report potential violations of the policy? It turned out that in some countries, i.e. France, such a requirement would be illegal, and companies may only encourage their employees to report. For this reason, we decided to abandon this question in our scoring and ranking. We left it in the questionnaire only for informative reasons, but we awarded no scores for it. Instead of scores, we indicated ‘yes/no’ depending on a company’s policy.
53All estimates are based on our own calculations. Data has been collected from recently published annual reports and SEC fillings for companies, and on the BP Statistical Review for global statistics.
54Fortune Global 500; money.cnn.com/magazines/fortune/global500/2010/full_list/index.html; Forbes Global 2010; www.forbes.com/2010/04/21/global-2000-leading-world-business-global-2000-10_land.html
55Using such assurance is still rare, not only in the oil and gas sectors. Nonetheless, we received reliable information from some companies that they have already begun applying appropriate procedures, which means that compliance with question 28 should already be possible for them. The only element lacking is public reporting on this. See also: Recommendation II in the Executive Summary.
56A very discriminatory question (according to the applied definition) would be one that can be answered positively only by a top 10 company, while a non-discriminatory question is the one that can be answered positively by any company in the ranking. No scores were calculated for questions 20 and 28 – the first, because it was awarded only qualitative scores, the second, because it received no single positive score.
57Revenue Watch Index 2010, p. 23.
58For Australia, it is worth mentioning that the lower score was fully due to BHP’s performance. The company has recently published new country-level data on its taxes, royalties and community support in the 2010 Sustainability Report (p. 24). The publication was still not available during the writing of the report, therefore the relevant disclosure could not be taken into consideration in this study.
59GEPetrol is a special case, as it does not have its own productive capacity. It participates in upstream productive activities through its interest in relevant joint ventures.
60It only applies to 31 multi-country producers.
61If four companies with the highest relative deviations are removed from the sample, the correlation increases to 0.62.
62BP Statistical Review of World Energy, June 2010 (in 2009, oil covered 35 per cent of global energy consumption, coal 29, gas 24, hydropower 7 and nuclear 5).
120 Transparency International 121Promoting Revenue Transparency
63‘Proved reserves’ are only so classified when there is a high probability they are recoverable. On average, the propensity to prove oil and gas reserves is much higher in countries where political considerations come before economic ones. This is because such a process is costly and economically justifiable only to a certain level. Therefore, on average the commonly used R/P indicator (the relation between proven reserves and yearly production) varies widely between countries and regions (USB Investment Research, ‘Global oil and gas: Introduction to the oil industry’, May 2008, p. 12).; i.e. in 2009 the R/P indicator reached 85 for OPEC countries, 25 for former Soviet Union countries and just 15 for the remaining producers (BP Statistical Review of World Energy, June 2010, p. 6).
64TI calculation, based on BP Statistical Review of World Energy, June 2010. The large difference between OPEC’s share in global reserves and its share in global production is due to its members’ high propensity to prove reserves.
65USB 2008, p. 30
66Revenue Watch Index 2010, p. 2.
67IMF, Guide on Resource Revenue Transparency, 2007, p. 62.
68IEA, 2009 Key World Statistics, p. 11 (in order from largest to smallest).
69Transparency International, 2008 Bribe Payers Index, p. 10-11.
70R. Arezki and M. Brueckner, ‘Oil Rents, Corruption and State Stability: Evidence from Panel Data Regression’, IMF Working Paper 09/267, December 2009, p. 4.
122 Transparency International

Transparency InternationalInternational SecretariatAlt-Moabit 9610559 BerlinGermany
Phone: +49 - 30 - 34 38 200Fax: +49 - 30 - 34 70 39 12
Revenue Watch Institute1700 Broadway, 17th FloorNew York, NY 10019USA
Phone: +1 646 929 9750