Promise and Problems of Learning Progression-guided ...
35
1 Promise and Problems of Learning Progression-guided Interventions Hui Jin, The Ohio State University Hoy Jeong Shin, University of California, Berkeley Michele Johnson, University of California, Santa Barbara Jinho Kim, University of California, Berkeley Charles W. Anderson, Michigan State University Abstract This study aims to examine the promise and problems of learning progression-guided interventions of an important science topic: using the knowledge of photosynthesis and cellular respiration to explain plant growth. In particular, a Learning Progression Framework (LPF) was developed to describe the conceptual change from force-dynamic reasoning that frames phenomena in terms of plants using enablers (e.g., water, air, and soil) to achieve their goals, toward scientific model-based reasoning that traces matter, traces energy, and connects scales in specialized ways. This LPF served as a framework for the development of a coordinated set of resources, including student assessments, teacher assessments, a teaching unit, and professional development programs. Teachers and students across four research sites participated in two cycles of professional development and teaching interventions. The results suggest both promise and problems related to student outcomes, teacher knowledge, and teachers’ impact on student outcomes. First, students across research sites demonstrated significant learning gains. Most students progressed from force-dynamic reasoning to transitional reasoning about organic molecules and forms of energy. Second, we developed LPF-based measures of teacher knowledge. The results suggest positive associations between teacher knowledge, including content knowledge and pedagogical content knowledge, and student outcomes. The results also indicate two challenges confronting teachers: adaptively applying conservation laws and understanding students’ intuitive ideas. Finally, teacher knowledge and the coverage of curriculum by teachers are two important factors affecting student outcomes. Implications and limitations of the study are also discussed. Key Words: learning progressions, intervention, conceptual change
Transcript of Promise and Problems of Learning Progression-guided ...
1
Promise and Problems of Learning Progression-guided Interventions
Hui Jin, The Ohio State University Hoy Jeong Shin, University of California, Berkeley
Michele Johnson, University of California, Santa Barbara Jinho Kim, University of California, Berkeley
Charles W. Anderson, Michigan State University
Abstract
This study aims to examine the promise and problems of learning progression-guided interventions of an important science topic: using the knowledge of photosynthesis and cellular respiration to explain plant growth. In particular, a Learning Progression Framework (LPF) was developed to describe the conceptual change from force-dynamic reasoning that frames phenomena in terms of plants using enablers (e.g., water, air, and soil) to achieve their goals, toward scientific model-based reasoning that traces matter, traces energy, and connects scales in specialized ways. This LPF served as a framework for the development of a coordinated set of resources, including student assessments, teacher assessments, a teaching unit, and professional development programs. Teachers and students across four research sites participated in two cycles of professional development and teaching interventions. The results suggest both promise and problems related to student outcomes, teacher knowledge, and teachers’ impact on student outcomes. First, students across research sites demonstrated significant learning gains. Most students progressed from force-dynamic reasoning to transitional reasoning about organic molecules and forms of energy. Second, we developed LPF-based measures of teacher knowledge. The results suggest positive associations between teacher knowledge, including content knowledge and pedagogical content knowledge, and student outcomes. The results also indicate two challenges confronting teachers: adaptively applying conservation laws and understanding students’ intuitive ideas. Finally, teacher knowledge and the coverage of curriculum by teachers are two important factors affecting student outcomes. Implications and limitations of the study are also discussed.
Key Words: learning progressions, intervention, conceptual change
2
Learning progressions are “descriptions of the successively more sophisticated ways of thinking about a topic that can follow one another as children learn about and investigate a topic over a broad span of time (National Research Council [NRC], 2007).” The recently released NRC framework and NGSS (Next Generation Science Standards) highlight the key role that learning progressions play in advancing science teaching at K-12 schools (National Research Council [NRC], 2012; NGSS Consortium of Lead States, 2013). In particular, learning progressions promote science teachers “to consider how topics are presented at each grade level so that they build on prior understanding and can support increasingly sophisticated learning (NRC, 2012; p. 41).” During the past several years, researchers have developed many learning progressions to describe student development in scientific practices (Berland & McNeill, 2010; Schwarz, et al., 2009) and conceptual understanding of science content (Alonzo & Steedle, 2008; Duncan, Rogat, & Yarden, 2009; Gunckel, Covitt, Salinas, & Anderson, 2012; Jin & Anderson, 2012a; Liu & Lesniak, 2006; Mohan, Chen, & Anderson, 2009; Neumann, Viering, Boone, & Fischer, 2013). How can these learning progressions be used to promote classroom teaching?
In this paper we report on the results of several cycles of iterative design research (Cobb, Confrey, diSessa, Lehrer, & Schauble, 2003) focused on developing a coordinated program that includes curriculum, assessments, and professional development. We designed a Learning Progression Framework (LPF) describing the development of students’ practices in tracing matter and energy through processes involved in plant growth and functioning, including photosynthesis, biosynthesis, and cellular respiration. This LPF served as a framework to guide the design of a coordinated set of resources:
• assessments of students’ explanatory practices, • assessments of teachers’ content knowledge (CK) and pedagogical content
knowledge (PCK), • a teaching unit for middle and high school students: “Plant Growth and Gas
Exchange” (Schramm, Keeling, Figueroa, Mohan, Johnson, & Anderson, 2013, http://www.pathwaysproject.kbs.msu.edu/?page_id=51)
• professional development programs and resources (http://www.pathwaysproject.kbs.msu.edu/?page_id=59)
Our goal is to identify and examine the promise and problems of learning progression-guided interventions (i.e., the professional development and the teaching experiment) through examining student outcomes, teacher knowledge, and teachers’ impacts on student outcomes. The results of this study will be used to further revise the learning progression, which will finally lead to efficacy and effectiveness research that determines to what extent the revised intervention produces a beneficial impact on student outcomes. Accordingly, our research questions are: • Student Outcomes: What are students’ learning outcomes in an intervention guided by
conceptual change-oriented LPF? What learning difficulties do students have? • Teacher Knowledge: How do we develop LPF-based measures of teachers’ CK and PCK?
What is teachers’ achievement in the CK and PCK assessment? • Teachers’ Impact on Student Outcomes: Is teachers’ CK and PCK linked to student
outcomes? How? What are other possible factors affecting student outcomes? Literature Review
3
Our study explores student outcomes and teacher knowledge in learning progression-guided interventions. Therefore, two strands of research contribute to the design of the study: learning progression research and PCK assessment research. Learning Progression Research
Recently, researchers have called for using learning progressions as an organizing framework to align curriculum, instruction, and assessment (Duncan & Hmelo-Silver, 2009; Gotwals & Alonzo, 2012). Toward this effort, many learning progression studies have been carried out. The majority of these studies focus on developing learning progressions for student learning, while a few studies explored how teachers use learning progressions to teach and how the learning progression approach can be used to assess teacher learning.
Learning Progression Research Focusing on Student Learning. Multiple methods have been used to develop learning progressions for student learning. In the past, researchers proposed hypothetical pathways that students may follow based on literature of disciplinary ideas and literature of student learning (Catley, Lehrer, & Reiser, 2005; Duncan, et al., 2009; Smith, Wiser, Anderson, & Krajcik, 2006). More recently, researchers stress that learning progressions must describe pathways that are validated by assessment data from real students (Anderson, 2008; Shea & Duncan, 2013). In this direction, empirically validated learning progressions have been developed in assessment studies (Alonzo & Steedle, 2008; Gunckel, et al., 2012; Jin & Anderson, 2012; Johnson & Tymms, 2011; Neumann, et al., 2013; Rivet & Kastens, 2012). The NRC framework takes this a step further, by suggesting that learning progressions describe “both how students’ understanding of the idea matures over time and the instructional supports and experiences that are needed for them to make progress (p. 26).” To this end, researchers have designed curriculum and developed instruction-assisted learning progressions through teaching experiments (Schwarz, et al., 2009; Songer, Kelcey, & Gotwals, 2009). Instruction-assisted learning progressions describe productive pathways that students follow in supportive instructional contexts; they systematically align curriculum, instruction, and assessments, and therefore present the ultimate goal of learning progression research. This is also the goal of our study. In learning progression literature, the term learning progressions is used to refer to the pathways that students follow (e.g., Alonzo & Steedle, 2008), or the pathways and assessments (e.g., Gunckel, Covitt, Salinas, & Anderson, 2012), or the pathways and associated instructional supports (e.g., NRC framework). In order to maintain consistency throughout the article, we use LPF to refer to the pathway, and learning progression to refer to the combination of the LPF, associated assessments, and associated curriculum. We also argue that a learning progression must include a LPF and associated assessments at a minimum, because the pathway described by the LPF is developed based on the data from the specific assessments.
Learning progressions differ in terms of the nature of learning described by the LPFs. Different learning progressions provide different guidance for teaching and instruction. Duschl and his colleagues identified two types of learning progressions (Duschl, Maeng, & Sezen, 2011). Validation progressions describe sequences of content standards and misconceptions related to the standards; they guide curriculum developers and teachers to “fix” students’ misconceptions appearing at each level of the progression. Evolutionary progressions describe a pathway from students’ existing ideas towards thorough understanding of scientific ideas; they guide curriculum developers and teachers to use students’ prior knowledge as foundations and resources for learning. Duschl and his colleagues call for more efforts devoted to developing and using evolutionary learning progressions to promote science teaching and learning in schools.
4
We argue that there can be different types of evolutionary learning progressions, depending on “different conditions of prior knowledge (Chi, 2009).” When prior knowledge is missing or incomplete, an evolutionary learning progression describes a process of “knowledge enrichment (Carey, 1991).” When prior knowledge is in conflict with the to-be-learned knowledge, an evolutionary learning progression must describe the process of conceptual change. Hence, whether a learning progression is aimed at enrichment or conceptual change depends on the specific science topic the learning progression is about. For example, Rivet and Kastens (2012) developed an enrichment kind of learning progression in an assessment study. Their LPF describes how students develop increasingly sophisticated analogical reasoning from a specific way of reasoning that is familiar to ordinary students, i.e., identifying the correspondence and non-correspondence between the entities of the model and those of the Earth System. Based on relevant literature, Furtak (2012) developed a LPF that describes the conceptual change from “transformationist” to natural selection. We study students’ understanding of photosynthesis and cellular respiration of plants. An extensive literature suggests that students hold many robust alternative conceptions about this topic (Barker & Carr, 1989; Barak, Gorodetsky, & Chipman, 1997; Bishop, Roth, & Anderson, 1985; Canal, 1999; Carlsson, 2002; Haslam & Treagust, 1987; Leach, Driver, Scott, & Wood-Robinson, 1996; Lin & Hu, 2003; Roth, Smith, & Anderson, 1983). Therefore, our goal is to develop a conceptual change-oriented learning progression.
Learning Progression Research Focusing on Teachers and Teaching. Very few learning progression studies explore teachers’ knowledge and their teaching practice. Windschitl and his colleagues develop a LPF for teaching practice. They used the LPF to guide novice teachers in assessing their own teaching practice and realizing the ideal goal practice (Furtak, Thompson, Braaten, & Windschitl, 2012). Furtak (2012) explored how teachers use LPFs to teach. She studied how a conceptual change oriented LPF could be used to help high school biology teachers develop formative assessments. She found that although the teachers were able to use the LPF to organize units and to identify students’ misconceptions, they seldom consider how students’ ideas at the lower levels of the LPF can be used as resources to develop scientific ideas. As the ultimate goal of learning progression research is to help teachers better teach their students, there is an urgent need for more studies in this strand. Indeed, teachers are agents who enact curriculum with their students rather than simply deliver it. They play a key role in learning progression-guided interventions.
In summary, researchers use a variety of learning progression approaches to promote teaching and learning in science classrooms. The present study builds upon existing research in two important ways. First, we developed a conceptual change-oriented, instruction-assisted, and empirically validated learning progression. That is, the conceptual change described in the LPF is assisted by instruction and curriculum, and measured by assessments. Second, we examined the role that teachers play in enacting learning progression-based curriculum. More specifically, we developed LPF-based measures of teachers’ PCK, which enabled us to evaluate teachers’ understanding of the scientific and intuitive ideas described by the LPF.
Assessing Teachers’ PCK The goal of teacher education and professional development shifted from teacher training
to teacher learning in the early 1980s (Cochran-Smith & Fries, 2005). Since then, many studies have been conducted to investigate how to promote teacher learning. One fundamental research strand, inspired by the seminal work of Shulman (Shulman, 1986) and Grossman (Grossman,
5
1990), investigates teachers’ PCK. PCK is a complex construct, and a good understanding of the PCK construct is established based on examining three aspects: what teachers know, the translation of teacher knowledge into classroom practice, and teachers’ decision making (Baxter & Lederman, 1999). This study focuses on the first aspect, and the findings of this study will contribute to future research on the other two aspects.
PCK can be conceptualized in two ways: defining PCK as the transformation of subject matter knowledge for the purpose of teaching, and identifying key components of the PCK construct (Park & Oliver, 2008). Both ways of conceptualization provide profound implications for designing PCK assessment. The definition of PCK emphasizes that the PCK construct is connected to, yet differentiated from, both science content knowledge and general pedagogy knowledge. In line with this idea, Kagan (1990) highlights the ecological validity of PCK assessments. That is, the measurement of PCK must be relevant to teachers’ classroom teaching practice and student outcomes. Kromrey and Renfrow (1991) contrast PCK items with general pedagogical items and content items. They emphasize that items that are content-general or are about the non-instructional practice of the discipline do not measure teachers’ PCK. They suggest that the PCK assessment items provide scenarios or contexts of teaching for teachers to analyze. Baxter and Lederman (1999) urge caution in using oversimplified scenarios that do not capture the aspects of teaching that teachers deal with in real classrooms. Therefore, we design assessment items that require teachers to analyze students’ typical explanations of plant growth, and make instructional decisions based on their analyses. The typical explanations were about intuitive ideas described in the LPF; they were identified from student assessment data. The PCK items therefore ask teachers to react to contexts that they commonly encounter when teaching photosynthesis and cellular respiration. In this sense, the items are content-specific, and they assess instructional practice.
The identification of PCK components provides practical guidance for developing PCK items. Researchers in science education have identified a set of important components of PCK for science teachers, including orientation toward science teaching, knowledge of science curriculum, knowledge of instructional strategies, knowledge of student learning, and knowledge of assessment in science (Anderson & Smith, 1987; Magnusson & Krajcik, 1999). We focus on two PCK components: knowledge of student learning and knowledge of instructional strategies. Researchers have found that these two components play pivotal roles in teaching practice. For example, Heller et al. (Heller, Daehler, Wong, Shinohara, & Miratrix, 2012) compared three professional development models and found that projects incorporating content knowledge and these two PCK components tend to produce better student outcomes. Lee et al. assessed beginning teachers’ PCK with the focus on these two components (Lee, Brown, Luft, & Roehrig, 2007). They interviewed participant teachers who taught different science topics. They asked domain-general questions, based on which they developed a rubric that has three proficiency levels: limited, basic, and proficient. If we take Kromrey and Renfrow’s perspective, their interview questions and rubric are not content-specific, and therefore do not really assess PCK. In our study, the teachers taught the same unit, which enabled us to use content-specific PCK items to assess the two PCK components.
Development Process
Based on findings of previous research, we developed a LPF; it serves as a framework for the design of a set of coordinated resources, including assessments, curriculum, and professional development programs. We implemented curriculum in four research cycles: 2009-10, 2010-11,

6
2011-12, and 2012-13. Each cycle contained 1) professional development activities that helped teachers understand and implement the curriculum; 2) teaching experiments, in which teachers implemented the curriculum and administered assessments to their students before and after the teaching intervention; and 3) revision and validation of the learning progression based on the assessment data collected in the teaching experiment. Based on the results of the first two research cycles (see Jin, Zhan, & Anderson, 2013), we significantly revised the LPF, the curriculum, and professional development materials in cycle 3. In cycle 4, only minor revisions were involved. This article reports on the research conducted in cycle 3 and cycle 4, in which more effective curriculum and instructional approaches were used to support student learning. The LPF
There are two important phenomena associated with plant growth: plants gaining weight and gas exchange. We expect students to identify and connect these two phenomena, and relate plant growth with other events in socio-ecological systems such as burning fossil fuels and people eating food. To achieve this learning goal, students need to develop three competences: tracing matter, tracing energy, and connecting scales. Therefore, we used these three competences as three progress variables of the LPF. Each variable has four achievement levels. They collectively provide a fine-grained depiction of a conceptual change from force-dynamic reasoning that produces explanations about how an actor uses its enablers to grow and move, toward scientific model-based reasoning that explains phenomena in ways that follow the conversation of matter and energy.
Level 1. Force-dynamic reasoning. Responses at level 1 are based on force-dynamic reasoning (Pinker, 2007). They frame events and phenomena in terms of actors using enablers to achieve their goals such as growth. • Tracing matter and tracing energy: Students do not use matter or energy to explain
phenomena. Instead, they tell stories about actors (i.e., plants) and enablers (i.e., water, soil, air, etc.).
• Connecting scales: Students’ force-dynamic explanations reflect reasoning at a macroscopic scale. In particular, students describe observations or sequences of events (e.g., plants grow and then people eat the plants).
Level 2. Hidden-mechanism Reasoning. Responses at level 2 are about hidden mechanisms. Students identify and differentiate two important phenomena associated with plant growth, weight gain and gas exchange. They explain hidden mechanisms beneath these two phenomena. • Tracing matter: Students explain weight gain as a process only involving solids and liquids.
For example, students often explain that the plant mixes solids and liquids (i.e., water and soil) together to make food. They also explain gas exchange as a process only involving gases: the plant converts CO2 into O2.
• Tracing energy: Students often treat energy as a type of vital power that powers hidden processes such as making food, generating more cells, or converting CO2 into O2.
• Connecting scales: Students begin to develop the ability to zoom in and zoom out. Regarding zooming in, they indentify processes (e.g., carbon dioxide and oxygen conversion, cell multiplication, etc.) and structures (i.e., cells, particles, etc.) at a microscopic scale. Regarding zooming out, they recognize two types of relationships. First, they recognize that plants and animals are related because solid/liquid materials are passing on in food chains or
7
food webs. Second, they also think that plants and animals are related in a “gas cycle:” plants take in carbon dioxide and convert it into oxygen, whereas animals do the opposite.
Level 3. Tracing matter unsuccessfully & tracing energy unsuccessfully. Responses at level 3 begin to connect weight gain and gas exchange, using ideas about matter and energy. However, they do not consistently trace matter or energy within or across processes. These responses indicate that students begin to assimilate the information of matter and energy learned in science classes into their existing knowledge structure that is primarily force-dynamic in nature. As a result, students usually modify scientific concepts and principles; they describe changes in atoms, molecules, and energy in ways that do not follow the conservation of matter and energy.
• Tracing matter: Students know that plants gain weight through photosynthesis, and that carbon dioxide is involved in photosynthesis, but they do not recognize carbon dioxide’s contribution to weight gain. They also recognize that plants are made of organic molecules such as glucose and cellulose and associate organic molecules with energy, but they often state that organic molecules are energy.
• Tracing energy: Students recognize that light energy is involved in photosynthesis, but they tend to think that light energy turns into organic molecules. Likewise, they often explain cellular respiration as a process in which organic molecules become energy. These responses suggest that students modify and combine the conservation of matter and the conservation of energy into one statement: matter and energy cannot be created or destroyed, but they can be converted into each other in chemical reactions.
• Connecting scales: At level 3, students are more capable of zooming in and zooming out. Regarding zooming in, they identify familiar organic molecules but not the unique structure of these molecules (i.e., C-C and C-H bonds); they associate energy with organic molecules, but do not differentiate between them. Regarding zooming out, students often describe the carbon cycle as the carbon atoms moving in food chains/webs without any chemical reactions happening; they also describe an energy cycle, which does not involve heat dissipation.
Level 4. Matter transformation & energy transformation. Responses at level 4 connect weight gain and gas exchange in terms of matter transformation and energy transformation in photosynthesis and cellular respiration. They indicate that students use model-based reasoning to construct explanations. This model-based reasoning is elaborated by four “core ideas.”
• Tracing matter (Core Idea 1): Students understand photosynthesis and cellular respiration as processes of atom re-arrangement. Therefore, they are able to explain carbon dioxide’s contribution to weight gain (photosynthesis) and weight loss (cellular respiration).
• Tracing energy (Core Idea 2): Students understand energy transformation in photosynthesis and cellular respiration. Therefore, they are able to explain how plants harness light energy through generating organic molecules in photosynthesis and release energy through oxidizing organic molecules in cellular respiration.
• Connecting scales o Core Idea 3: Students develop the ability to zoom in and zoom out. When zooming
in, they are able to locate carbon in ecosystems and recognize that organic molecules provide energy due to C-C and C-H bonds. When zooming out, they are able to identify photosynthesis and cellular respiration in the global carbon cycle; they understand the carbon cycle as carbon transforming between the organic form
8
(glucose and cellulose) and inorganic form (carbon dioxide) in food chains/webs; they also understand energy flow as energy being passed on in food chains/webs with heat dissipation.
o Core Idea 4: Understanding of Core Idea 3 enables students to understand that human impact on the carbon cycle has resulted in an imbalance in biochemical processes in ecosystems locally, regionally, and globally.
Assessment of Students’ Explanatory Practices The LPF serves as a framework for assessment development. In previous research, we
developed and implemented an assessment item pool for carbon-transforming processes. The items have been continuously revised and refined in cycles of learning progression research. In the present study, we select twelve items that require students to explain two phenomena associated with plant growth, weight gain and gas exchange. These items are categorized into three groups, with each group targeting one progress variable of the LPF (i.e., tracing matter, tracing energy, and connecting scales).
Assessment of Teacher Knowledge We developed LPF-based measures of teacher knowledge. To assess teachers’ CK, we
selected items from the student assessment. The LPF was used to guide the design of these items. The PCK assessment focuses on two components that are crucial for the success of professional development programs: knowledge of student thinking and knowledge of teaching strategies. As elaborated above, PCK items should be content-specific and about instructional practice. Therefore, we provide scenarios of student learning and ask teachers to analyze the scenarios and make instructional decisions. The scenarios are about students’ ideas appearing at different levels of the LPF. A PCK rubric was also developed to evaluate teachers’ responses. The rubric, as will be elaborated later, contains proficiency levels of PCK that are linked to the levels of the LPF.
Teaching Unit The NRC framework and NGSS realize a vision for science education “that students,
over multiple years of school, actively engage in science and engineering practices and apply crosscutting concepts to deepen their understanding of the core ideas in these fields (NRC, 2012, p. 2).” The Plant Unit is designed to achieve two specific aims that are aligned with this vision. First, we aim to promote students’ conceptual change from force-dynamic reasoning to scientific model-based reasoning. That is, we expect students to make the transition from their existing levels (i.e., Level 1, Level 2, or Level 3) to Level 4. As elaborated above, the model-based reasoning at Level 4 contains four disciplinary core ideas that are associated with three crosscutting concepts (i.e., tracing matter, tracing energy, and connecting scales). The Plant Unit was designed to help students develop in-depth understanding of Core Ideas 1, 2, and 3, and familiarize them with Core Idea 4. We expect students to use model-based reasoning to connect weight gain and gas exchange, and to relate plant growth to other events in socio-ecological systems.
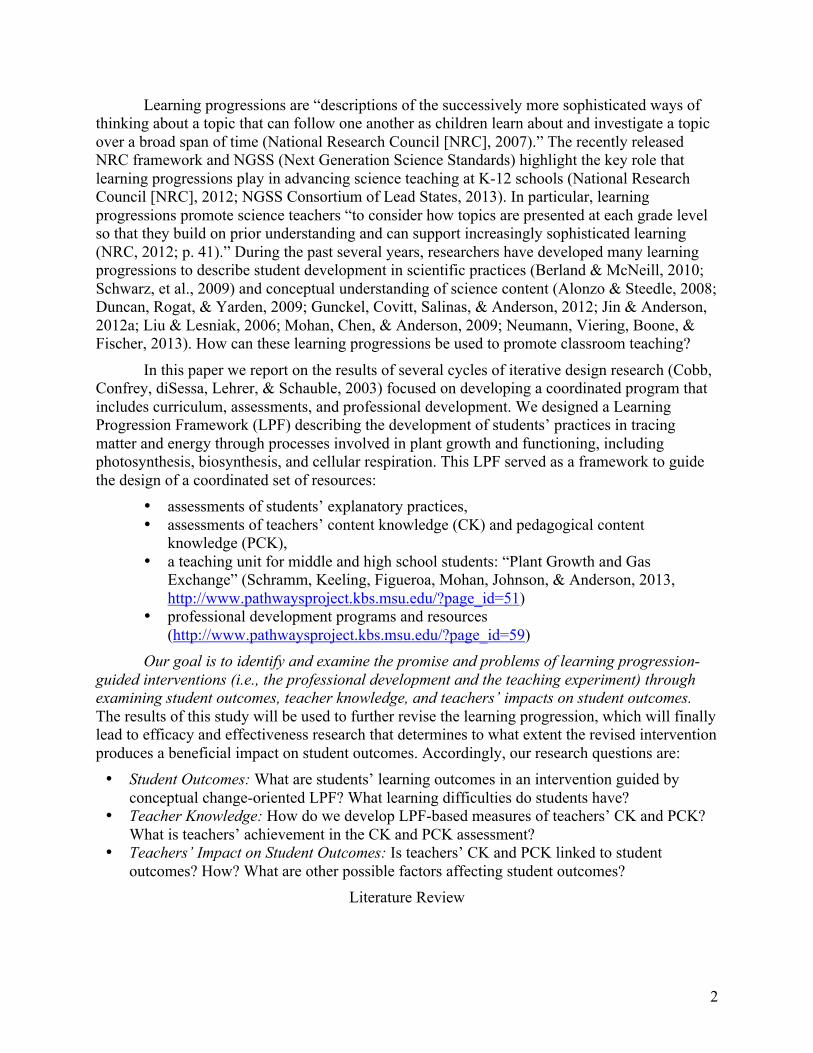
Second, we aim to promote students’ conceptual change by engaging them in two scientific practices: investigation and application (Figure 1). In investigation activities, students employ inductive reasoning. They collect observation data (e.g., measuring mass), identify patterns from the data, and construct evidence-based arguments about the patterns. Through these investigation activities, students construct knowledge, with scaffolding from their teachers.
9
In application activities, students apply deductive reasoning. They use the core ideas constructed in the investigation activities to develop explanations and make predictions about weight gain and gas exchange.
Figure 1. Investigation and Explanation Practices (TM: Tracing Matter; TE: Tracing Energy; CS: Connecting Scales)
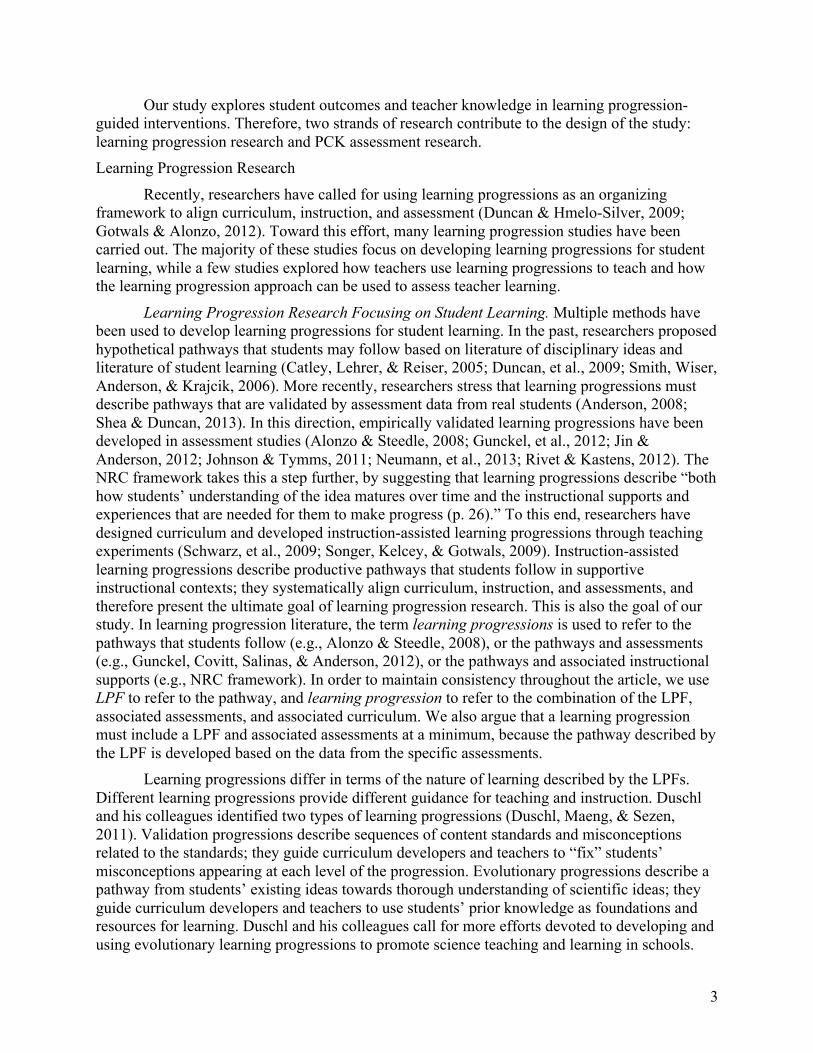
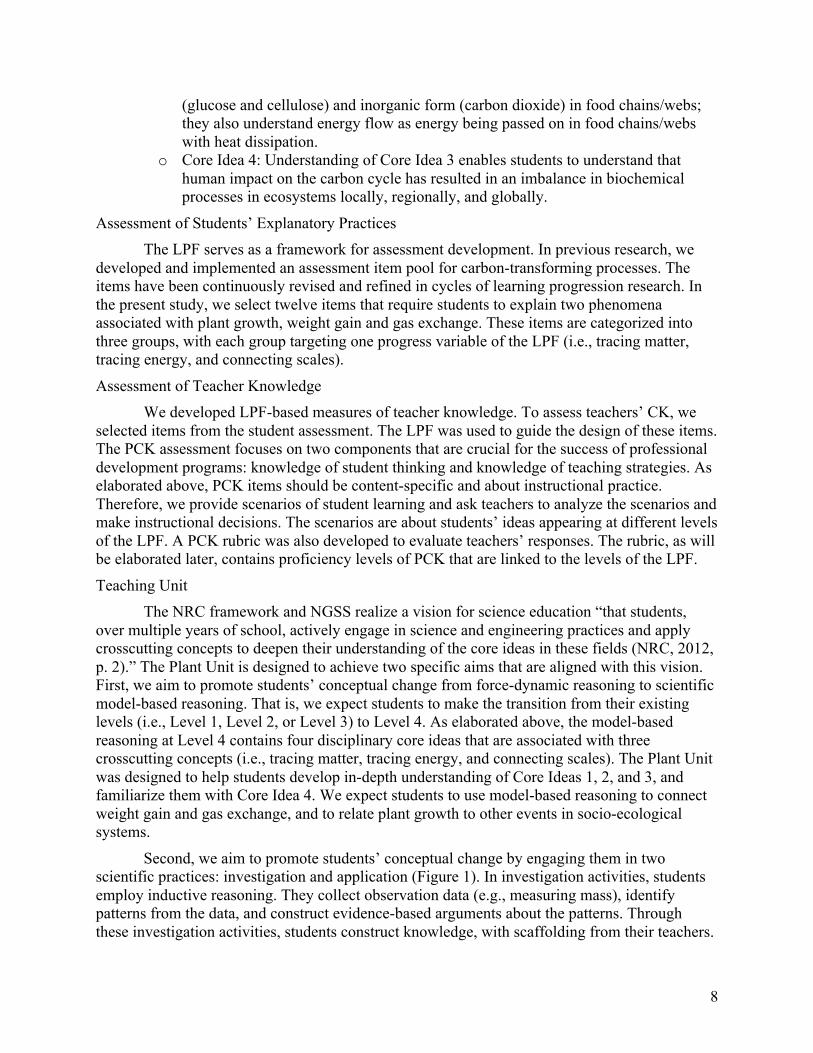
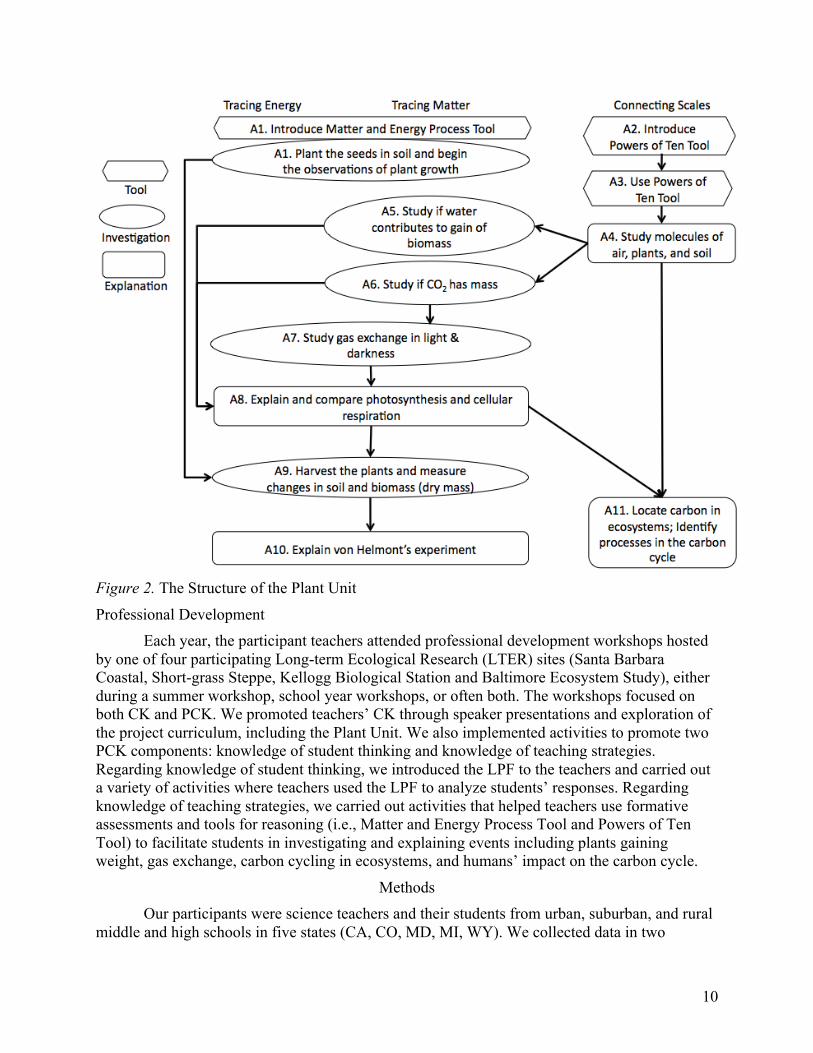
The structure of the Plant Unit is presented in Figure 2. The unit contains 11 activities. Seven activities focus on tracing matter and tracing energy, and four activities focus on connecting scales. The unit introduces two tools for reasoning from the beginning. The Matter and Energy Process Tool helps students trace matter and trace energy in biochemical processes. The Powers of Ten Tool helps students connect four benchmark-scales: the atomic-molecular scale, the microscopic scale, the macroscopic scale, and the global scale. Students use these tools throughout all investigation and application activities. The activities in the unit are coherently organized; they collectively facilitate students to make the transitions from force-dynamic reasoning to model-based reasoning. The tools are presented in Appendix 1. Descriptions of the activities are presented in Appendix 2.
10
Figure 2. The Structure of the Plant Unit
Professional Development Each year, the participant teachers attended professional development workshops hosted
by one of four participating Long-term Ecological Research (LTER) sites (Santa Barbara Coastal, Short-grass Steppe, Kellogg Biological Station and Baltimore Ecosystem Study), either during a summer workshop, school year workshops, or often both. The workshops focused on both CK and PCK. We promoted teachers’ CK through speaker presentations and exploration of the project curriculum, including the Plant Unit. We also implemented activities to promote two PCK components: knowledge of student thinking and knowledge of teaching strategies. Regarding knowledge of student thinking, we introduced the LPF to the teachers and carried out a variety of activities where teachers used the LPF to analyze students’ responses. Regarding knowledge of teaching strategies, we carried out activities that helped teachers use formative assessments and tools for reasoning (i.e., Matter and Energy Process Tool and Powers of Ten Tool) to facilitate students in investigating and explaining events including plants gaining weight, gas exchange, carbon cycling in ecosystems, and humans’ impact on the carbon cycle.
Methods Our participants were science teachers and their students from urban, suburban, and rural
middle and high schools in five states (CA, CO, MD, MI, WY). We collected data in two
11
academic years: 2011-12 and 2012-13. Each year, teachers participated in workshops in the summer and/or school year and took a teacher assessment at the end of the school year. Some of these teachers taught the Plant Unit and completed a teacher feedback form to report how they used the curriculum in their classroom. The students of these teachers took a student assessment before and after the intervention. In this section, we describe the data collection and analyses for each of the three research components: student outcomes, teacher knowledge, and teachers’ impact on student outcomes. Student Outcomes
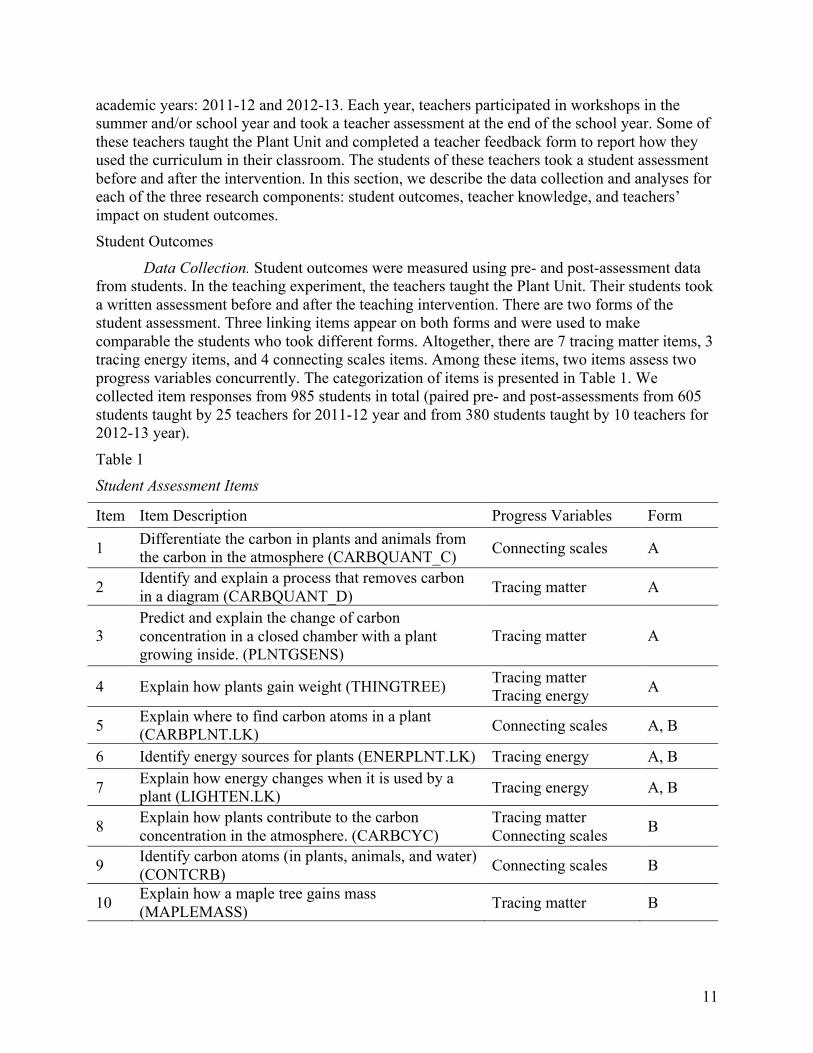
Data Collection. Student outcomes were measured using pre- and post-assessment data from students. In the teaching experiment, the teachers taught the Plant Unit. Their students took a written assessment before and after the teaching intervention. There are two forms of the student assessment. Three linking items appear on both forms and were used to make comparable the students who took different forms. Altogether, there are 7 tracing matter items, 3 tracing energy items, and 4 connecting scales items. Among these items, two items assess two progress variables concurrently. The categorization of items is presented in Table 1. We collected item responses from 985 students in total (paired pre- and post-assessments from 605 students taught by 25 teachers for 2011-12 year and from 380 students taught by 10 teachers for 2012-13 year).
Table 1 Student Assessment Items
Item Item Description Progress Variables Form
1 Differentiate the carbon in plants and animals from the carbon in the atmosphere (CARBQUANT_C) Connecting scales A
2 Identify and explain a process that removes carbon in a diagram (CARBQUANT_D) Tracing matter A
3 Predict and explain the change of carbon concentration in a closed chamber with a plant growing inside. (PLNTGSENS)
Tracing matter A
4 Explain how plants gain weight (THINGTREE) Tracing matter Tracing energy A
5 Explain where to find carbon atoms in a plant (CARBPLNT.LK) Connecting scales A, B
6 Identify energy sources for plants (ENERPLNT.LK) Tracing energy A, B
7 Explain how energy changes when it is used by a plant (LIGHTEN.LK) Tracing energy A, B
8 Explain how plants contribute to the carbon concentration in the atmosphere. (CARBCYC)
Tracing matter Connecting scales B
9 Identify carbon atoms (in plants, animals, and water) (CONTCRB) Connecting scales B
10 Explain how a maple tree gains mass (MAPLEMASS) Tracing matter B
12
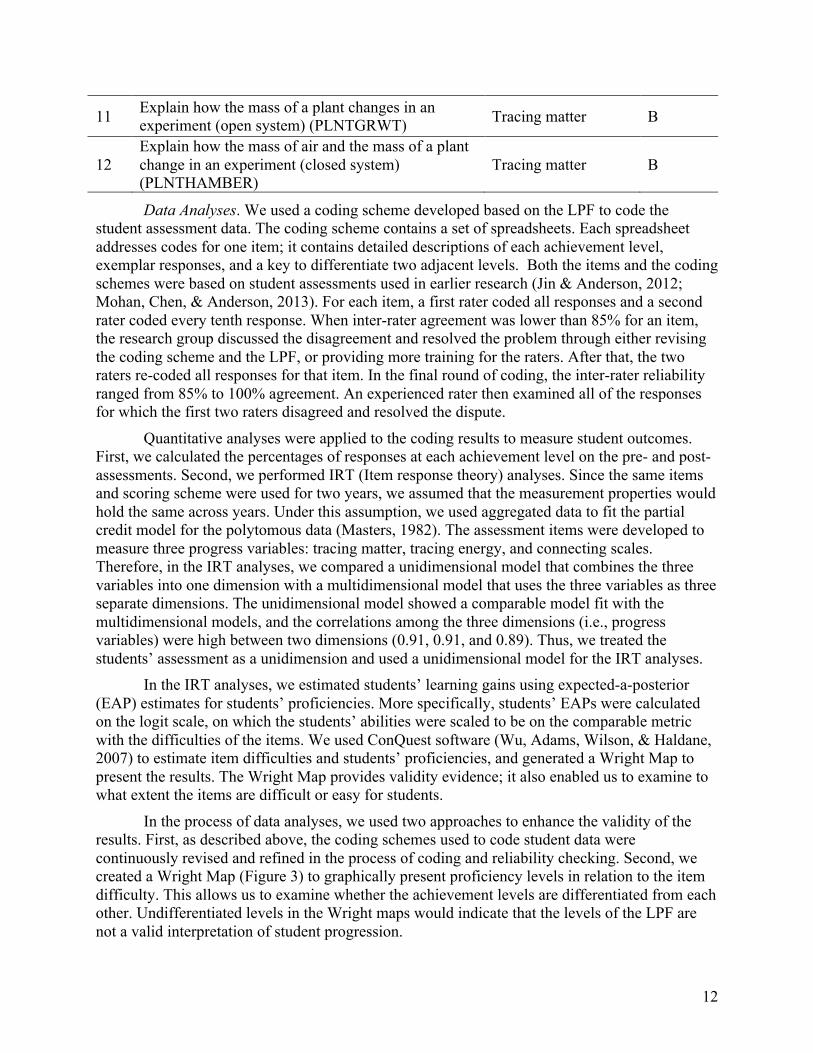
11 Explain how the mass of a plant changes in an experiment (open system) (PLNTGRWT) Tracing matter B
12 Explain how the mass of air and the mass of a plant change in an experiment (closed system) (PLNTHAMBER)
Tracing matter B
Data Analyses. We used a coding scheme developed based on the LPF to code the student assessment data. The coding scheme contains a set of spreadsheets. Each spreadsheet addresses codes for one item; it contains detailed descriptions of each achievement level, exemplar responses, and a key to differentiate two adjacent levels. Both the items and the coding schemes were based on student assessments used in earlier research (Jin & Anderson, 2012; Mohan, Chen, & Anderson, 2013). For each item, a first rater coded all responses and a second rater coded every tenth response. When inter-rater agreement was lower than 85% for an item, the research group discussed the disagreement and resolved the problem through either revising the coding scheme and the LPF, or providing more training for the raters. After that, the two raters re-coded all responses for that item. In the final round of coding, the inter-rater reliability ranged from 85% to 100% agreement. An experienced rater then examined all of the responses for which the first two raters disagreed and resolved the dispute.
Quantitative analyses were applied to the coding results to measure student outcomes. First, we calculated the percentages of responses at each achievement level on the pre- and post-assessments. Second, we performed IRT (Item response theory) analyses. Since the same items and scoring scheme were used for two years, we assumed that the measurement properties would hold the same across years. Under this assumption, we used aggregated data to fit the partial credit model for the polytomous data (Masters, 1982). The assessment items were developed to measure three progress variables: tracing matter, tracing energy, and connecting scales. Therefore, in the IRT analyses, we compared a unidimensional model that combines the three variables into one dimension with a multidimensional model that uses the three variables as three separate dimensions. The unidimensional model showed a comparable model fit with the multidimensional models, and the correlations among the three dimensions (i.e., progress variables) were high between two dimensions (0.91, 0.91, and 0.89). Thus, we treated the students’ assessment as a unidimension and used a unidimensional model for the IRT analyses.
In the IRT analyses, we estimated students’ learning gains using expected-a-posterior (EAP) estimates for students’ proficiencies. More specifically, students’ EAPs were calculated on the logit scale, on which the students’ abilities were scaled to be on the comparable metric with the difficulties of the items. We used ConQuest software (Wu, Adams, Wilson, & Haldane, 2007) to estimate item difficulties and students’ proficiencies, and generated a Wright Map to present the results. The Wright Map provides validity evidence; it also enabled us to examine to what extent the items are difficult or easy for students.
In the process of data analyses, we used two approaches to enhance the validity of the results. First, as described above, the coding schemes used to code student data were continuously revised and refined in the process of coding and reliability checking. Second, we created a Wright Map (Figure 3) to graphically present proficiency levels in relation to the item difficulty. This allows us to examine whether the achievement levels are differentiated from each other. Undifferentiated levels in the Wright maps would indicate that the levels of the LPF are not a valid interpretation of student progression.
13
Teacher Knowledge Data Collection. At the end of each academic year, most of the teachers who participated
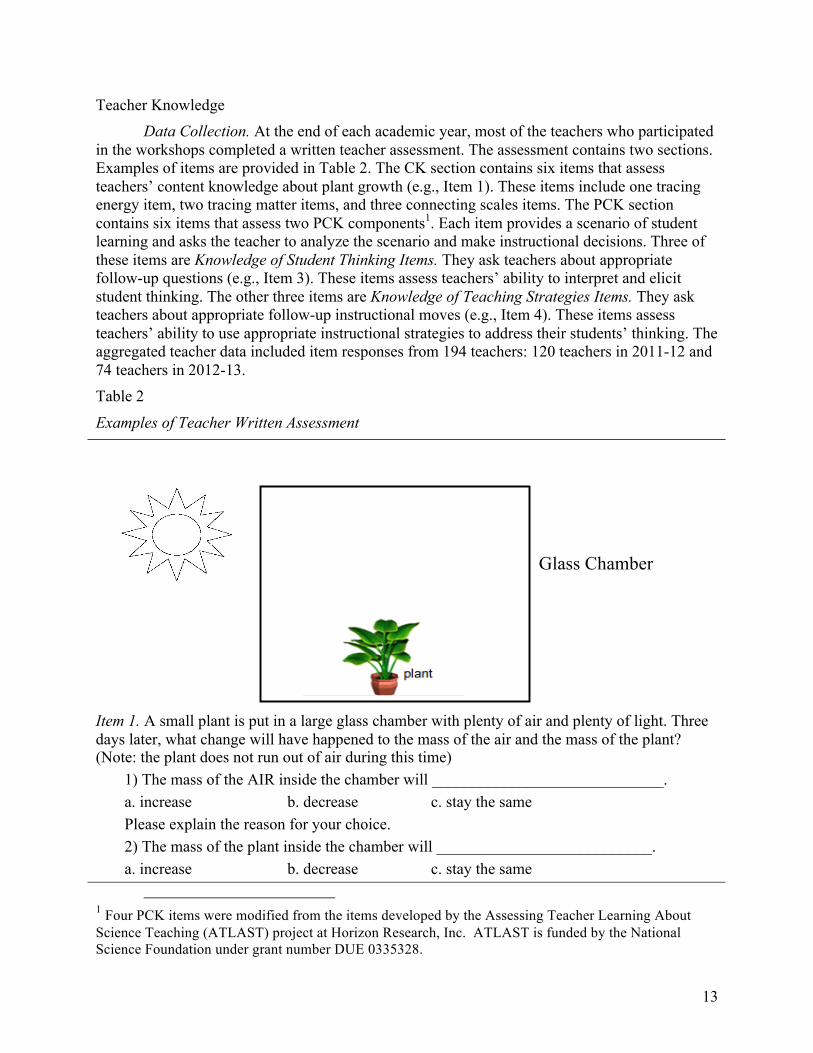
in the workshops completed a written teacher assessment. The assessment contains two sections. Examples of items are provided in Table 2. The CK section contains six items that assess teachers’ content knowledge about plant growth (e.g., Item 1). These items include one tracing energy item, two tracing matter items, and three connecting scales items. The PCK section contains six items that assess two PCK components1. Each item provides a scenario of student learning and asks the teacher to analyze the scenario and make instructional decisions. Three of these items are Knowledge of Student Thinking Items. They ask teachers about appropriate follow-up questions (e.g., Item 3). These items assess teachers’ ability to interpret and elicit student thinking. The other three items are Knowledge of Teaching Strategies Items. They ask teachers about appropriate follow-up instructional moves (e.g., Item 4). These items assess teachers’ ability to use appropriate instructional strategies to address their students’ thinking. The aggregated teacher data included item responses from 194 teachers: 120 teachers in 2011-12 and 74 teachers in 2012-13. Table 2
Examples of Teacher Written Assessment
Item 1. A small plant is put in a large glass chamber with plenty of air and plenty of light. Three days later, what change will have happened to the mass of the air and the mass of the plant? (Note: the plant does not run out of air during this time)
1) The mass of the AIR inside the chamber will _____________________________. a. increase b. decrease c. stay the same Please explain the reason for your choice. 2) The mass of the plant inside the chamber will ___________________________. a. increase b. decrease c. stay the same
1 Four PCK items were modified from the items developed by the Assessing Teacher Learning About Science Teaching (ATLAST) project at Horizon Research, Inc. ATLAST is funded by the National Science Foundation under grant number DUE 0335328.
Glass Chamber
14
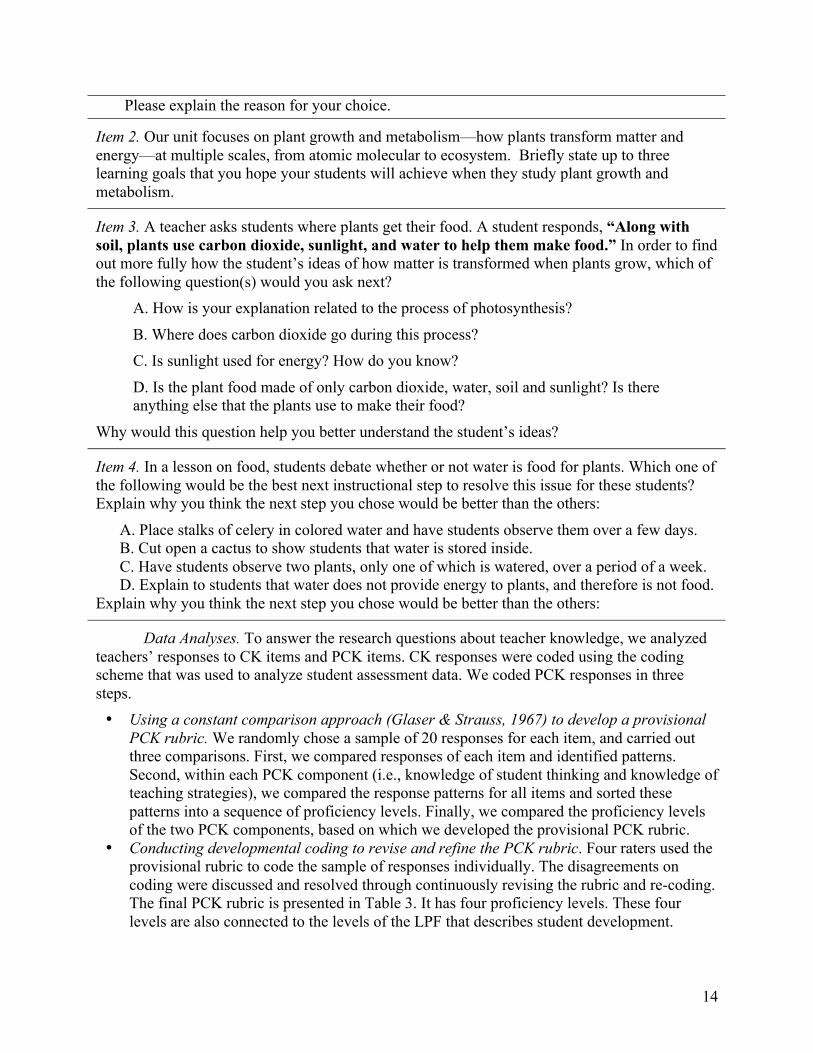
Please explain the reason for your choice.
Item 2. Our unit focuses on plant growth and metabolism—how plants transform matter and energy—at multiple scales, from atomic molecular to ecosystem. Briefly state up to three learning goals that you hope your students will achieve when they study plant growth and metabolism.
Item 3. A teacher asks students where plants get their food. A student responds, “Along with soil, plants use carbon dioxide, sunlight, and water to help them make food.” In order to find out more fully how the student’s ideas of how matter is transformed when plants grow, which of the following question(s) would you ask next?
A. How is your explanation related to the process of photosynthesis?
B. Where does carbon dioxide go during this process? C. Is sunlight used for energy? How do you know?
D. Is the plant food made of only carbon dioxide, water, soil and sunlight? Is there anything else that the plants use to make their food?
Why would this question help you better understand the student’s ideas?
Item 4. In a lesson on food, students debate whether or not water is food for plants. Which one of the following would be the best next instructional step to resolve this issue for these students? Explain why you think the next step you chose would be better than the others:
A. Place stalks of celery in colored water and have students observe them over a few days. B. Cut open a cactus to show students that water is stored inside. C. Have students observe two plants, only one of which is watered, over a period of a week. D. Explain to students that water does not provide energy to plants, and therefore is not food.
Explain why you think the next step you chose would be better than the others:
Data Analyses. To answer the research questions about teacher knowledge, we analyzed teachers’ responses to CK items and PCK items. CK responses were coded using the coding scheme that was used to analyze student assessment data. We coded PCK responses in three steps. • Using a constant comparison approach (Glaser & Strauss, 1967) to develop a provisional
PCK rubric. We randomly chose a sample of 20 responses for each item, and carried out three comparisons. First, we compared responses of each item and identified patterns. Second, within each PCK component (i.e., knowledge of student thinking and knowledge of teaching strategies), we compared the response patterns for all items and sorted these patterns into a sequence of proficiency levels. Finally, we compared the proficiency levels of the two PCK components, based on which we developed the provisional PCK rubric.
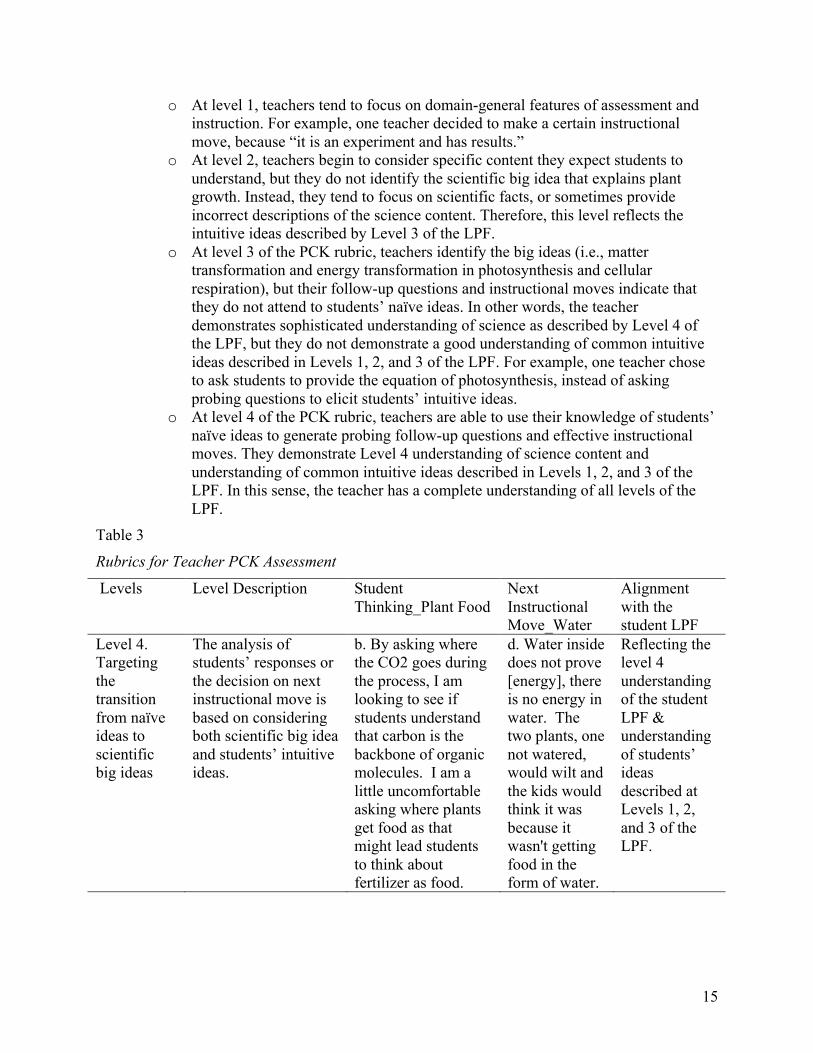
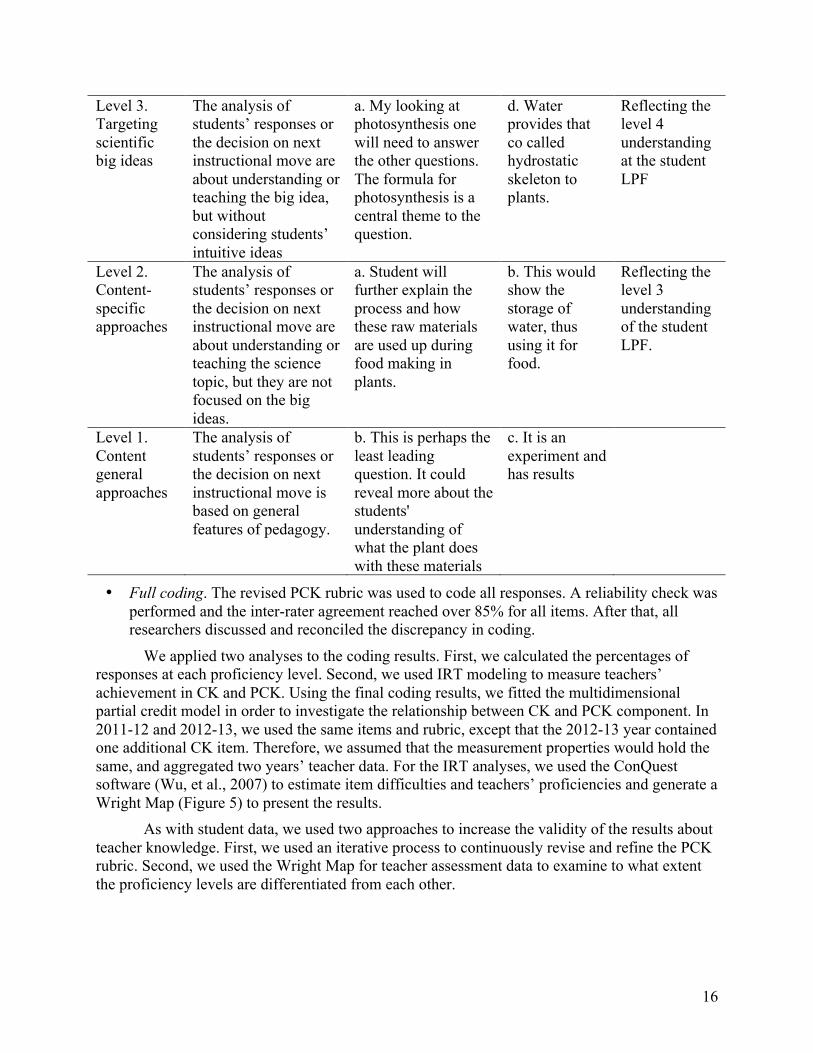
• Conducting developmental coding to revise and refine the PCK rubric. Four raters used the provisional rubric to code the sample of responses individually. The disagreements on coding were discussed and resolved through continuously revising the rubric and re-coding. The final PCK rubric is presented in Table 3. It has four proficiency levels. These four levels are also connected to the levels of the LPF that describes student development.
15
o At level 1, teachers tend to focus on domain-general features of assessment and instruction. For example, one teacher decided to make a certain instructional move, because “it is an experiment and has results.”
o At level 2, teachers begin to consider specific content they expect students to understand, but they do not identify the scientific big idea that explains plant growth. Instead, they tend to focus on scientific facts, or sometimes provide incorrect descriptions of the science content. Therefore, this level reflects the intuitive ideas described by Level 3 of the LPF.
o At level 3 of the PCK rubric, teachers identify the big ideas (i.e., matter transformation and energy transformation in photosynthesis and cellular respiration), but their follow-up questions and instructional moves indicate that they do not attend to students’ naïve ideas. In other words, the teacher demonstrates sophisticated understanding of science as described by Level 4 of the LPF, but they do not demonstrate a good understanding of common intuitive ideas described in Levels 1, 2, and 3 of the LPF. For example, one teacher chose to ask students to provide the equation of photosynthesis, instead of asking probing questions to elicit students’ intuitive ideas.
o At level 4 of the PCK rubric, teachers are able to use their knowledge of students’ naïve ideas to generate probing follow-up questions and effective instructional moves. They demonstrate Level 4 understanding of science content and understanding of common intuitive ideas described in Levels 1, 2, and 3 of the LPF. In this sense, the teacher has a complete understanding of all levels of the LPF.
Table 3
Rubrics for Teacher PCK Assessment
Levels Level Description Student Thinking_Plant Food
Next Instructional Move_Water
Alignment with the student LPF
Level 4. Targeting the transition from naïve ideas to scientific big ideas
The analysis of students’ responses or the decision on next instructional move is based on considering both scientific big idea and students’ intuitive ideas.
b. By asking where the CO2 goes during the process, I am looking to see if students understand that carbon is the backbone of organic molecules. I am a little uncomfortable asking where plants get food as that might lead students to think about fertilizer as food.
d. Water inside does not prove [energy], there is no energy in water. The two plants, one not watered, would wilt and the kids would think it was because it wasn't getting food in the form of water.
Reflecting the level 4 understanding of the student LPF & understanding of students’ ideas described at Levels 1, 2, and 3 of the LPF.
16
Level 3. Targeting scientific big ideas
The analysis of students’ responses or the decision on next instructional move are about understanding or teaching the big idea, but without considering students’ intuitive ideas
a. My looking at photosynthesis one will need to answer the other questions. The formula for photosynthesis is a central theme to the question.
d. Water provides that co called hydrostatic skeleton to plants.
Reflecting the level 4 understanding at the student LPF
Level 2. Content-specific approaches
The analysis of students’ responses or the decision on next instructional move are about understanding or teaching the science topic, but they are not focused on the big ideas.
a. Student will further explain the process and how these raw materials are used up during food making in plants.
b. This would show the storage of water, thus using it for food.
Reflecting the level 3 understanding of the student LPF.
Level 1. Content general approaches
The analysis of students’ responses or the decision on next instructional move is based on general features of pedagogy.
b. This is perhaps the least leading question. It could reveal more about the students' understanding of what the plant does with these materials
c. It is an experiment and has results
• Full coding. The revised PCK rubric was used to code all responses. A reliability check was performed and the inter-rater agreement reached over 85% for all items. After that, all researchers discussed and reconciled the discrepancy in coding.
We applied two analyses to the coding results. First, we calculated the percentages of responses at each proficiency level. Second, we used IRT modeling to measure teachers’ achievement in CK and PCK. Using the final coding results, we fitted the multidimensional partial credit model in order to investigate the relationship between CK and PCK component. In 2011-12 and 2012-13, we used the same items and rubric, except that the 2012-13 year contained one additional CK item. Therefore, we assumed that the measurement properties would hold the same, and aggregated two years’ teacher data. For the IRT analyses, we used the ConQuest software (Wu, et al., 2007) to estimate item difficulties and teachers’ proficiencies and generate a Wright Map (Figure 5) to present the results.
As with student data, we used two approaches to increase the validity of the results about teacher knowledge. First, we used an iterative process to continuously revise and refine the PCK rubric. Second, we used the Wright Map for teacher assessment data to examine to what extent the proficiency levels are differentiated from each other.
17
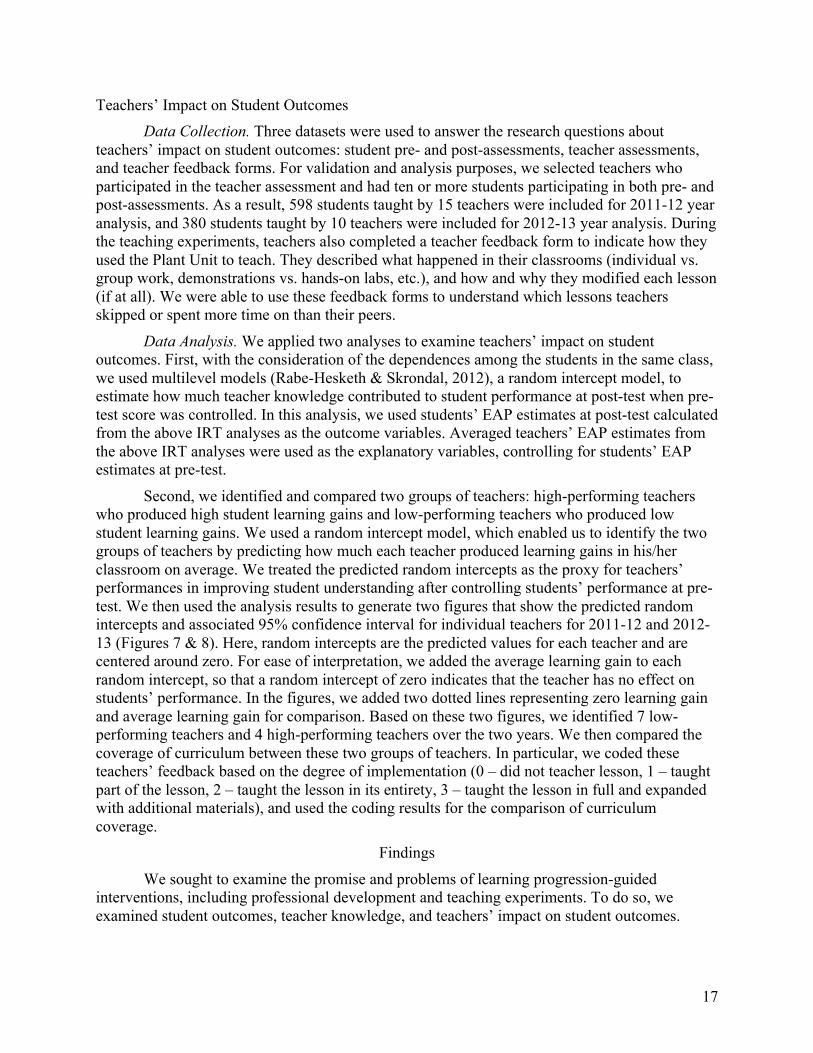
Teachers’ Impact on Student Outcomes Data Collection. Three datasets were used to answer the research questions about
teachers’ impact on student outcomes: student pre- and post-assessments, teacher assessments, and teacher feedback forms. For validation and analysis purposes, we selected teachers who participated in the teacher assessment and had ten or more students participating in both pre- and post-assessments. As a result, 598 students taught by 15 teachers were included for 2011-12 year analysis, and 380 students taught by 10 teachers were included for 2012-13 year analysis. During the teaching experiments, teachers also completed a teacher feedback form to indicate how they used the Plant Unit to teach. They described what happened in their classrooms (individual vs. group work, demonstrations vs. hands-on labs, etc.), and how and why they modified each lesson (if at all). We were able to use these feedback forms to understand which lessons teachers skipped or spent more time on than their peers.
Data Analysis. We applied two analyses to examine teachers’ impact on student outcomes. First, with the consideration of the dependences among the students in the same class, we used multilevel models (Rabe-Hesketh & Skrondal, 2012), a random intercept model, to estimate how much teacher knowledge contributed to student performance at post-test when pre-test score was controlled. In this analysis, we used students’ EAP estimates at post-test calculated from the above IRT analyses as the outcome variables. Averaged teachers’ EAP estimates from the above IRT analyses were used as the explanatory variables, controlling for students’ EAP estimates at pre-test.
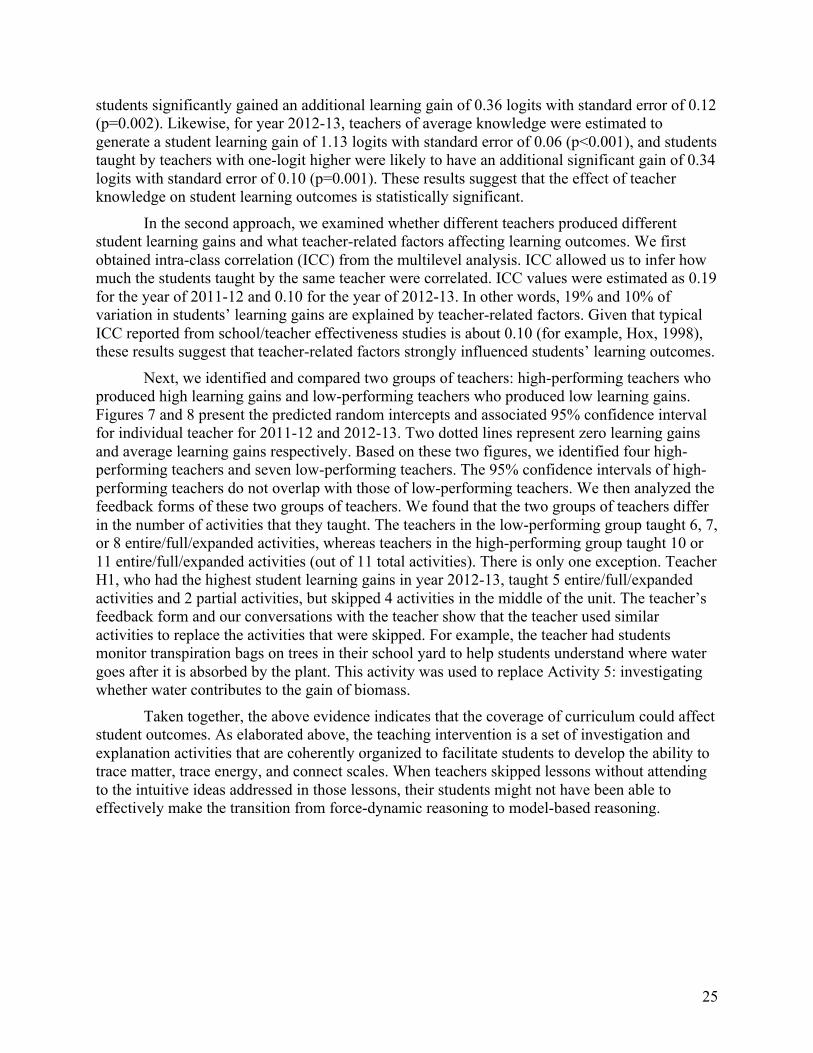
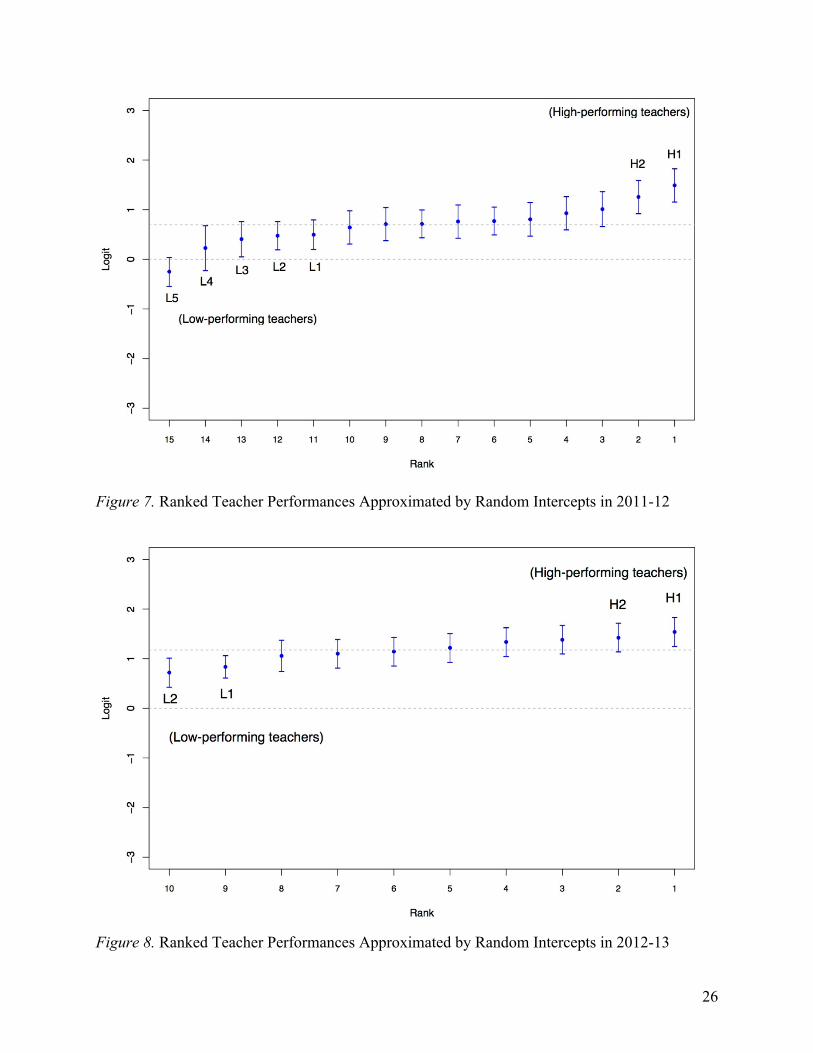
Second, we identified and compared two groups of teachers: high-performing teachers who produced high student learning gains and low-performing teachers who produced low student learning gains. We used a random intercept model, which enabled us to identify the two groups of teachers by predicting how much each teacher produced learning gains in his/her classroom on average. We treated the predicted random intercepts as the proxy for teachers’ performances in improving student understanding after controlling students’ performance at pre-test. We then used the analysis results to generate two figures that show the predicted random intercepts and associated 95% confidence interval for individual teachers for 2011-12 and 2012-13 (Figures 7 & 8). Here, random intercepts are the predicted values for each teacher and are centered around zero. For ease of interpretation, we added the average learning gain to each random intercept, so that a random intercept of zero indicates that the teacher has no effect on students’ performance. In the figures, we added two dotted lines representing zero learning gain and average learning gain for comparison. Based on these two figures, we identified 7 low-performing teachers and 4 high-performing teachers over the two years. We then compared the coverage of curriculum between these two groups of teachers. In particular, we coded these teachers’ feedback based on the degree of implementation (0 – did not teacher lesson, 1 – taught part of the lesson, 2 – taught the lesson in its entirety, 3 – taught the lesson in full and expanded with additional materials), and used the coding results for the comparison of curriculum coverage.
Findings
We sought to examine the promise and problems of learning progression-guided interventions, including professional development and teaching experiments. To do so, we examined student outcomes, teacher knowledge, and teachers’ impact on student outcomes.
18
Student Outcomes We examine to what extent the LPF-based intervention produced positive learning
outcomes and investigate some specific problems that require further investigation. We report the following results about student outcomes: validity evidence, learning gains, and learning difficulties.
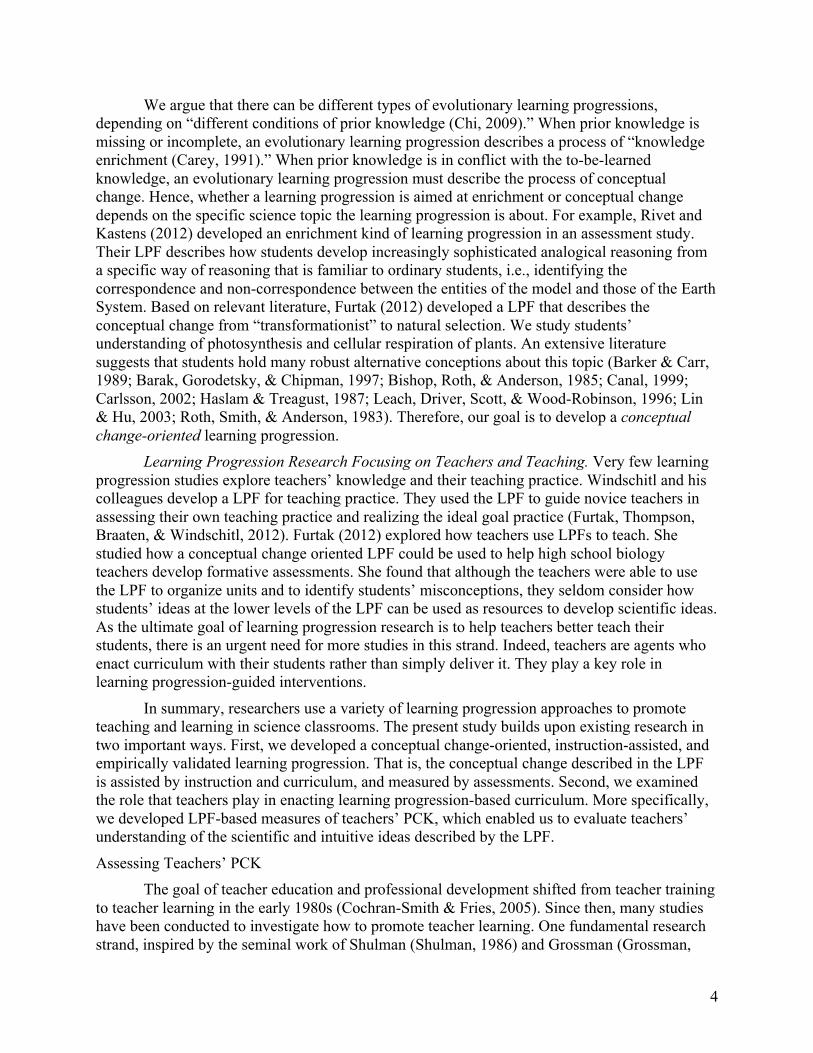
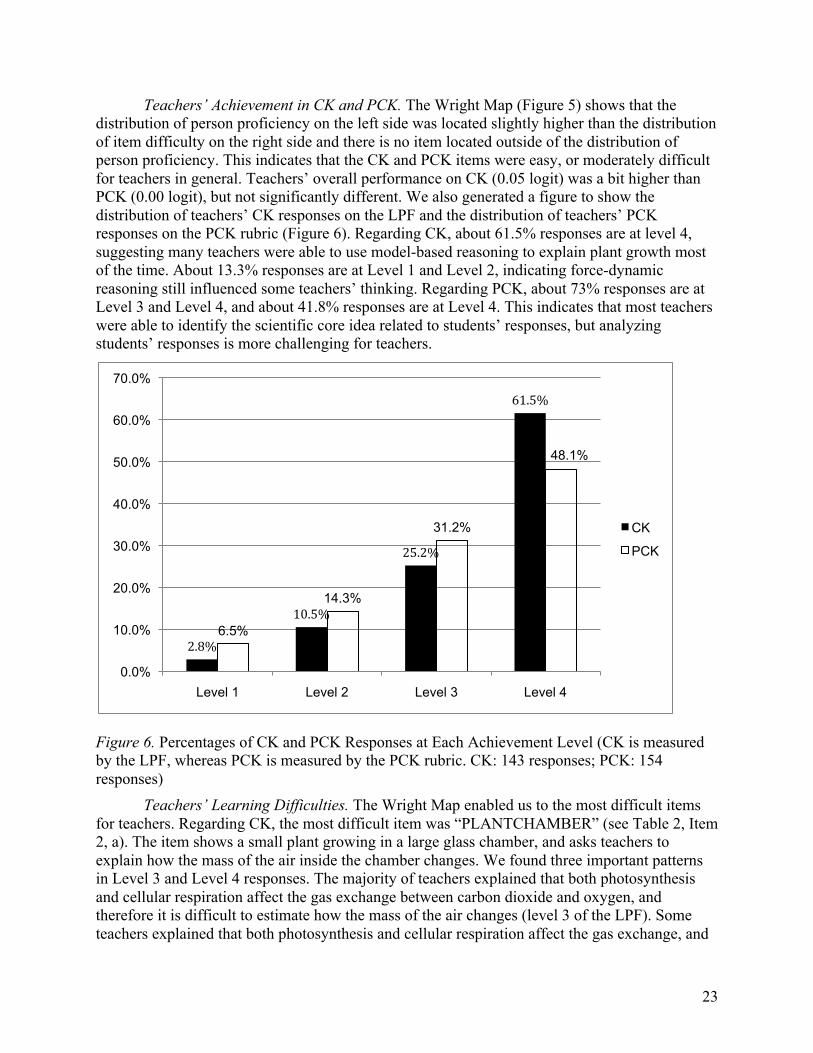
Validity Evidence. We generated a Wright Map for two years’ of students’ assessment data, using a unidimensional model (Figure 3). The left side of the Wright map displays the distribution of students (with each X representing 10 students), while the right side represents the distribution of items. Each item has three threshold values, 1, 2, and 3, representing the transitions between Level 1 and Level 2, Level 2 and Level 3, and Level 3 and Level 4 respectively. For example, the location of CARBPLNT.2 in the Wright Map (i.e., the threshold) represents the logits that a student must obtain in order to have a 50% chance of scoring at Level 3 or above for the CARBPLNT item. The Wright Map shows that the levels on the LPF are distinguishable, providing a source of validity evidence.

19
-------------------------------------------------------------------------------- | |CONTCRB.3 | | | 4 |CARBPLNT.3 |PLNTCHAMBER.3 CARBCYC.2 |ENERPLNT.3 PLNTGSENS.3 THINGTREE.3 LIGHTEN.3 CARBQUANT_C.3 | |PLNTGRWT.3 | 3 | X|MAPLEMASS.3 CONTCRB.2 X| X|CARBQUANT_D.3 X| X|CARBPLNT.2 2 XX|PLNTCHAMBER.2 CARBQUANT_C.2 XX| XXX|PLNTGRWT.2 THINGTREE.2 XXXX|MAPLEMASS.2 PLNTGSENS.2 XXXX|ENERPLNT.2 XXXXXXX| 1 XXXXX|CARBQUANT_D.2 XXXXX|LIGHTEN.2 CARBCYC.1 XXXXXX| XXXXXXX|PLNTGRWT.1 PLNTCHAMBER.1 XXXXXXXX| XXXXXXXXXX|CARBQUANT_D.1 CARBQUANT_C.1 CONTCRB.1 XXXXXXXX| 0 XXXXXXXX|MAPLEMASS.1 XXXXXXXX| XXXXXXXX| XXXXXXXXX| XXXXXXXX|CARBPLNT.1 XXXXXXX|ENERPLNT.1 -1 XXXXXX|PLNTGSENS.1 XXXX|THINGTREE.1 LIGHTEN.1 XXXX| XXXX| XXX| XX| -2 XX| X| X| X| X| X| -3 | | | | | | -4 | | | | | | ================================================================================ Figure 3. Wright Map for Student Assessment (Left side: Latent ability distributions; Right side: Item thresholds)
Student Learning Gains. We carried out two analyses to measure students’ learning gains in the teaching experiments. First, the IRT analyses show that students achieved significant
20
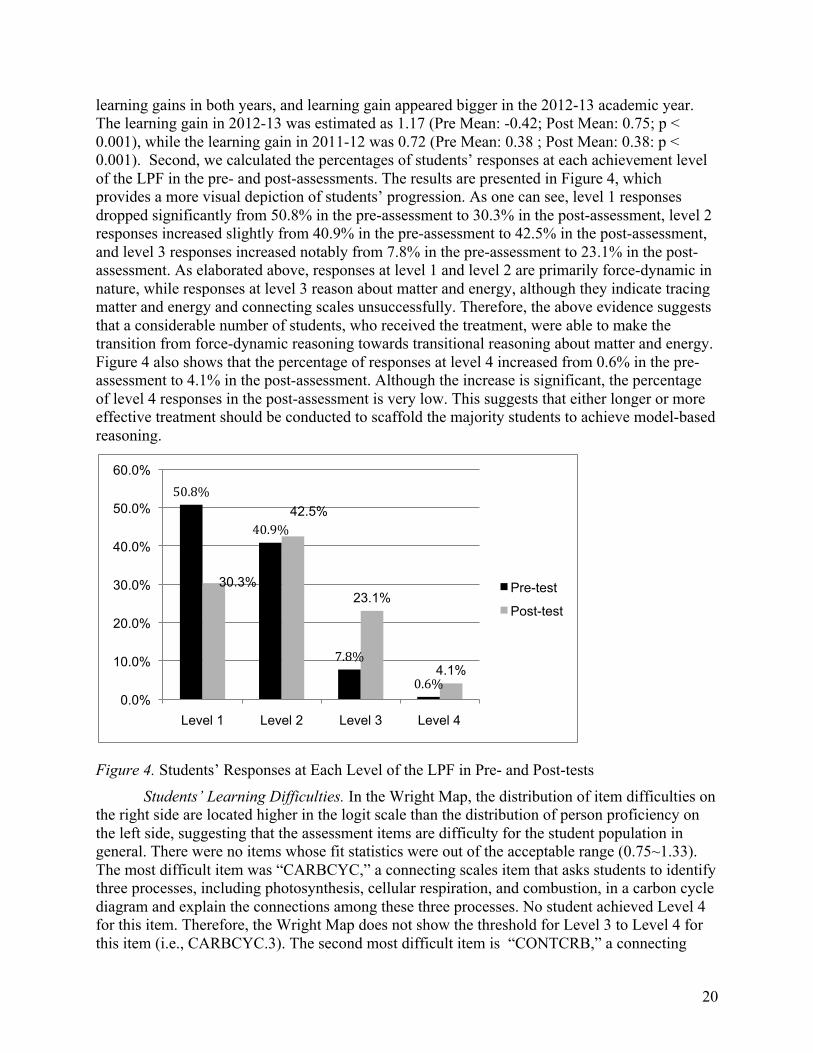
learning gains in both years, and learning gain appeared bigger in the 2012-13 academic year. The learning gain in 2012-13 was estimated as 1.17 (Pre Mean: -0.42; Post Mean: 0.75; p < 0.001), while the learning gain in 2011-12 was 0.72 (Pre Mean: 0.38 ; Post Mean: 0.38: p < 0.001). Second, we calculated the percentages of students’ responses at each achievement level of the LPF in the pre- and post-assessments. The results are presented in Figure 4, which provides a more visual depiction of students’ progression. As one can see, level 1 responses dropped significantly from 50.8% in the pre-assessment to 30.3% in the post-assessment, level 2 responses increased slightly from 40.9% in the pre-assessment to 42.5% in the post-assessment, and level 3 responses increased notably from 7.8% in the pre-assessment to 23.1% in the post-assessment. As elaborated above, responses at level 1 and level 2 are primarily force-dynamic in nature, while responses at level 3 reason about matter and energy, although they indicate tracing matter and energy and connecting scales unsuccessfully. Therefore, the above evidence suggests that a considerable number of students, who received the treatment, were able to make the transition from force-dynamic reasoning towards transitional reasoning about matter and energy. Figure 4 also shows that the percentage of responses at level 4 increased from 0.6% in the pre-assessment to 4.1% in the post-assessment. Although the increase is significant, the percentage of level 4 responses in the post-assessment is very low. This suggests that either longer or more effective treatment should be conducted to scaffold the majority students to achieve model-based reasoning.
Figure 4. Students’ Responses at Each Level of the LPF in Pre- and Post-tests
Students’ Learning Difficulties. In the Wright Map, the distribution of item difficulties on the right side are located higher in the logit scale than the distribution of person proficiency on the left side, suggesting that the assessment items are difficulty for the student population in general. There were no items whose fit statistics were out of the acceptable range (0.75~1.33). The most difficult item was “CARBCYC,” a connecting scales item that asks students to identify three processes, including photosynthesis, cellular respiration, and combustion, in a carbon cycle diagram and explain the connections among these three processes. No student achieved Level 4 for this item. Therefore, the Wright Map does not show the threshold for Level 3 to Level 4 for this item (i.e., CARBCYC.3). The second most difficult item is “CONTCRB,” a connecting
50.8%
40.9%
7.8%
0.6%
30.3%
42.5%
23.1%
4.1%
0.0%
10.0%
20.0%
30.0%
40.0%
50.0%
60.0%
Level 1 Level 2 Level 3 Level 4
Pre-test
Post-test
21
scales item that asks students whether carbon could be found in several material objects (e.g., water, plant, egg, sea, etc.) and where the carbon was before it went to the object. The easiest item was “CARBQUANT_D,” a connecting scales item asking students to identify the process of photosynthesis in a carbon cycle diagram and explain if/how humans could impact the process. The two most difficult items and the easiest item are all about connecting scales, indicating that different competences (i.e., tracing matter, tracing energy, and connecting scales) may not be the factors that hinder student learning. Instead, the two most difficult items require students to locate carbon in a variety of places and to identify multiple processes, whereas the easiest item is about identifying a single process. This suggests that reasoning across multiple locations and processes is a learning difficulty for students.
In summary, the results of the student assessment indicate that the LPF-guided intervention helped many students make the transition from force-dynamic reasoning towards transitional reasoning about matter and energy. The results also suggest two problems that require future research. First, either longer or more effective treatment is needed to scaffold students to achieve scientific model-based reasoning. Second, students in particular need scaffolding in reasoning across locations and processes.
Teacher Knowledge We developed LPF-based measures of teacher knowledge. In this section, we report the
following results: validity evidence, teacher achievement in CK and PCK assessments, and teachers’ learning difficulties.
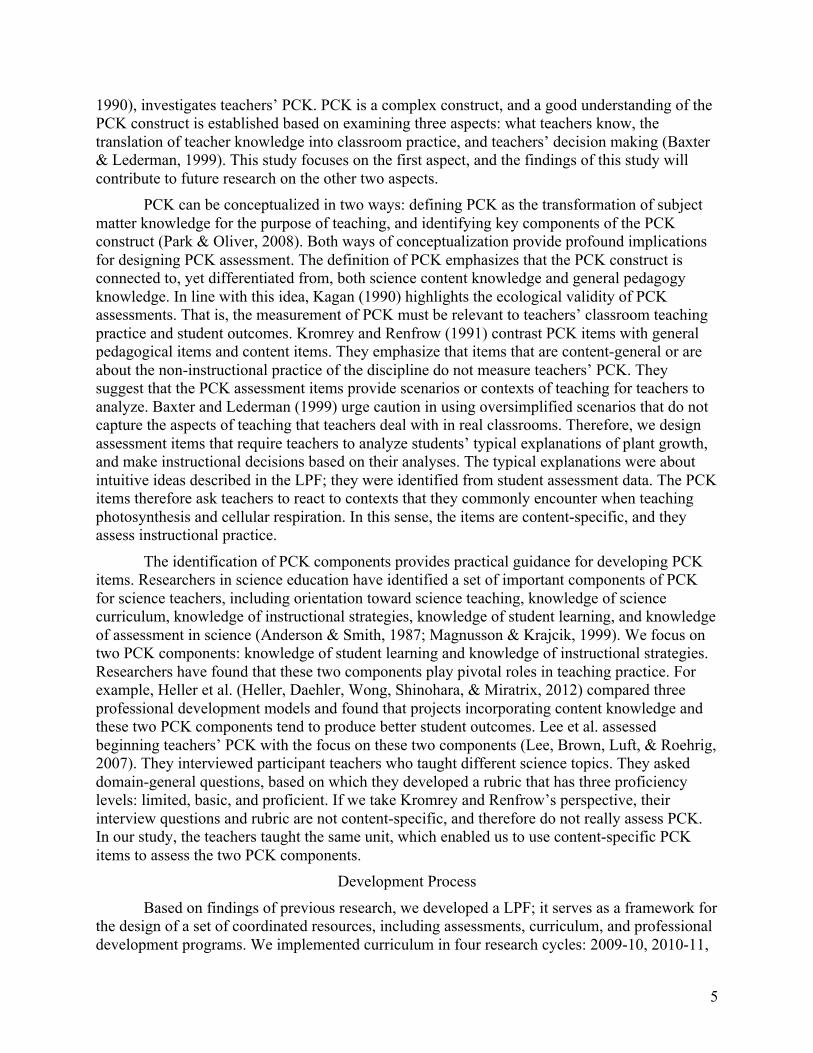
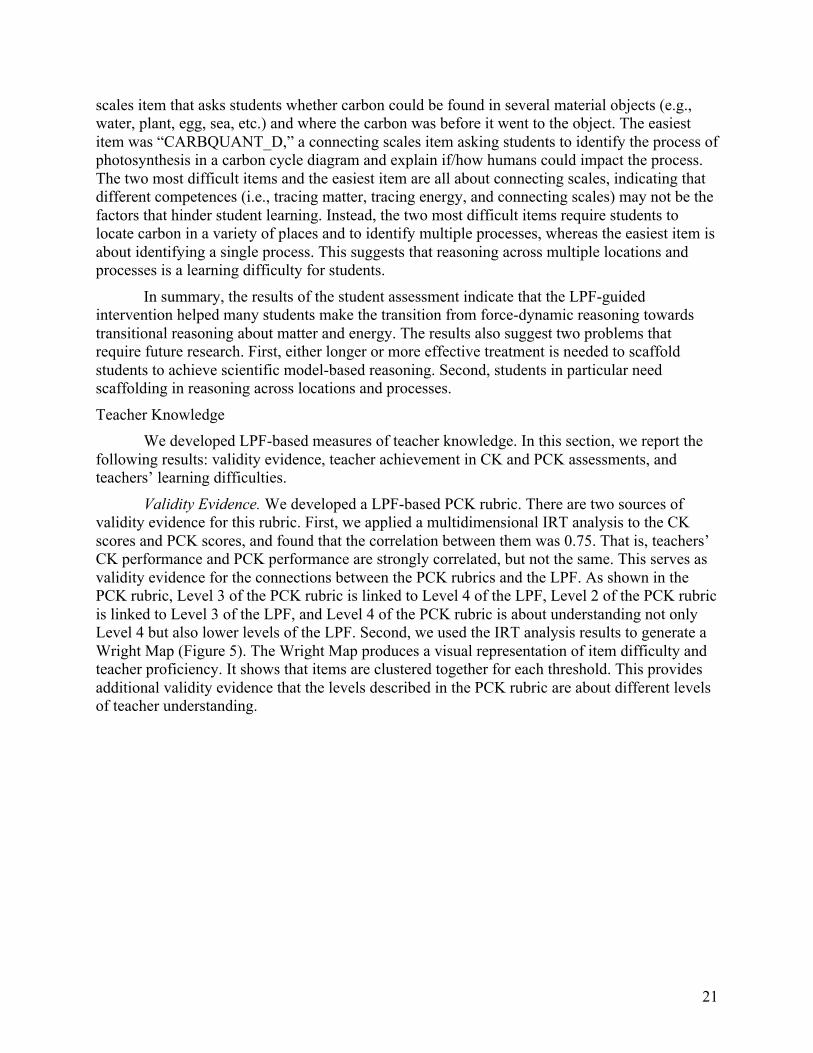
Validity Evidence. We developed a LPF-based PCK rubric. There are two sources of validity evidence for this rubric. First, we applied a multidimensional IRT analysis to the CK scores and PCK scores, and found that the correlation between them was 0.75. That is, teachers’ CK performance and PCK performance are strongly correlated, but not the same. This serves as validity evidence for the connections between the PCK rubrics and the LPF. As shown in the PCK rubric, Level 3 of the PCK rubric is linked to Level 4 of the LPF, Level 2 of the PCK rubric is linked to Level 3 of the LPF, and Level 4 of the PCK rubric is about understanding not only Level 4 but also lower levels of the LPF. Second, we used the IRT analysis results to generate a Wright Map (Figure 5). The Wright Map produces a visual representation of item difficulty and teacher proficiency. It shows that items are clustered together for each threshold. This provides additional validity evidence that the levels described in the PCK rubric are about different levels of teacher understanding.
22
================================================================================ Dimension Generalized-Item Thresholds -------------------- CK PCK -------------------------------------------------------------------------------- | | | | | | | | | | 3 | | | | | | | | | | | | | | X| | 2 | | X| | | X| X| | X| X| XXXX| X|PLNTCHAMBER_Q1.3 XXXX| X| XXX| X| 1 XXX| XX|StudentThinking_PlantFood.3 XXXXX| XX|StudentThinking_OakTreeQ2Q3.3 XXXXX| XXX| XXXX| XXXXXXX| XXXXX| XXXXXXX|InstructionalMove_Water.3 InstructionalMove_Sunlight.3 XXXX|XXXXXXXXX|LIGHTEN.3 StudentThinking_Energy.3 XXXXXXXX| XXXXXXX| XXXXXX| XXXXXXXX|PLNTCHAMBER_Q1.2 PLANTCHAMBER_Q2.3 StudentThinking_OakTreeQ1.3 XXXXXXXXXXXXXXXXXX|ENERPLNT.3 StudentThinking_PlantFood.2 0 XXXXXXXXXXXXXXX|KeelingCurve_Q2.3 XXXXXXXXXXXXXXXXXX|InstructionalMove_Water.2 XXXXXXXXXXXXXXXXXXX|InstructionalMove_Sunlight.2 StudentThinking_OakTreeQ2Q3.2 XXXXXXXXXXXXXXXX|PLANTCHAMBER_Q2.2 XXXXXXXX| XXXXXXX|KeelingCurve_Q1.3 XXXX| XXXXXX|StudentThinking_Energy.2 XXXXX| XXXXXX|StudentThinking_OakTreeQ1.2 XXX| XXX|ENERPLNT.2 KeelingCurve_Q1.2 InstructionalMove_Sunlight.1 -1 XXXXX| XXXX|KeelingCurve_Q2.2 XXXX| X| XX| XX|PLANTCHAMBER_Q2.1 X| X| XX| X|StudentThinking_OakTreeQ2Q3.1 X| |LIGHTEN.2 KeelingCurve_Q2.1 StudentThinking_PlantFood.1 X| |StudentThinking_OakTreeQ1.1 X| |PLNTCHAMBER_Q1.1 | |InstructionalMove_Water.1 -2 | |KeelingCurve_Q1.1 X| | | |StudentThinking_Energy.1 | | | | | | X| | | | -3 | | | | | | | | | |LIGHTEN.1 ================================================================================ Figure 5. Wright Map for Teacher Knowledge (Left side: Latent ability distributions; Right side: Item thresholds)
23
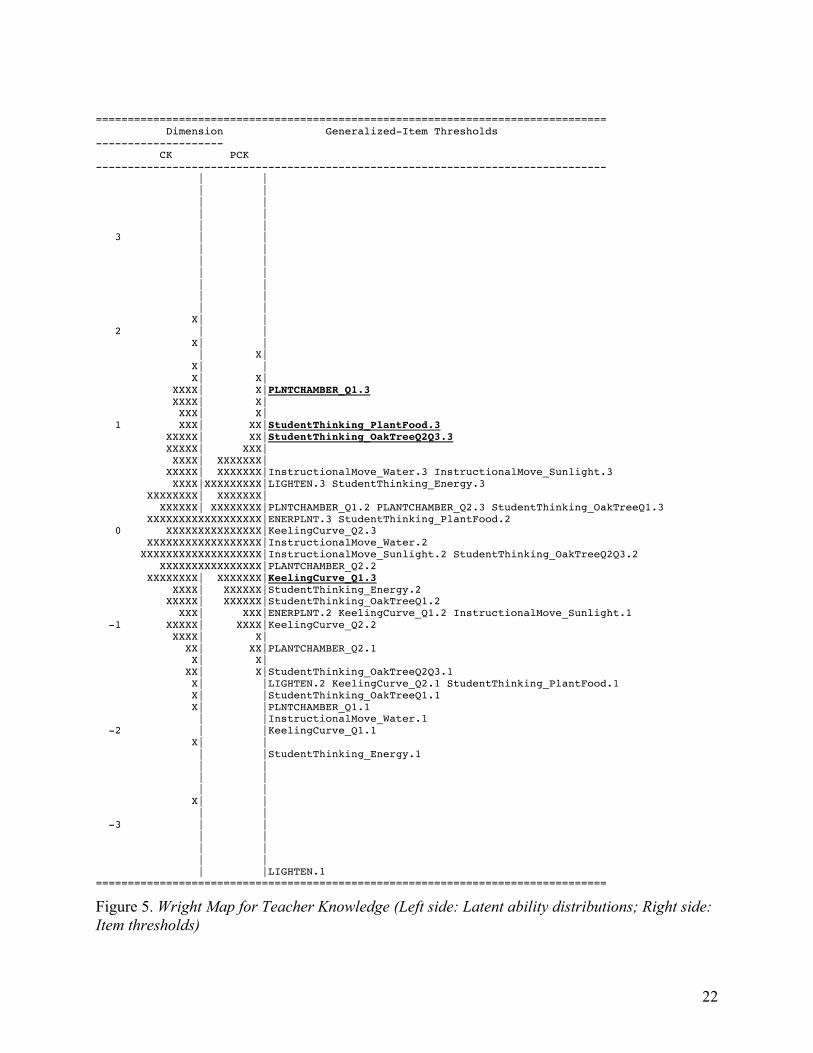
Teachers’ Achievement in CK and PCK. The Wright Map (Figure 5) shows that the distribution of person proficiency on the left side was located slightly higher than the distribution of item difficulty on the right side and there is no item located outside of the distribution of person proficiency. This indicates that the CK and PCK items were easy, or moderately difficult for teachers in general. Teachers’ overall performance on CK (0.05 logit) was a bit higher than PCK (0.00 logit), but not significantly different. We also generated a figure to show the distribution of teachers’ CK responses on the LPF and the distribution of teachers’ PCK responses on the PCK rubric (Figure 6). Regarding CK, about 61.5% responses are at level 4, suggesting many teachers were able to use model-based reasoning to explain plant growth most of the time. About 13.3% responses are at Level 1 and Level 2, indicating force-dynamic reasoning still influenced some teachers’ thinking. Regarding PCK, about 73% responses are at Level 3 and Level 4, and about 41.8% responses are at Level 4. This indicates that most teachers were able to identify the scientific core idea related to students’ responses, but analyzing students’ responses is more challenging for teachers.
Figure 6. Percentages of CK and PCK Responses at Each Achievement Level (CK is measured by the LPF, whereas PCK is measured by the PCK rubric. CK: 143 responses; PCK: 154 responses)
Teachers’ Learning Difficulties. The Wright Map enabled us to the most difficult items for teachers. Regarding CK, the most difficult item was “PLANTCHAMBER” (see Table 2, Item 2, a). The item shows a small plant growing in a large glass chamber, and asks teachers to explain how the mass of the air inside the chamber changes. We found three important patterns in Level 3 and Level 4 responses. The majority of teachers explained that both photosynthesis and cellular respiration affect the gas exchange between carbon dioxide and oxygen, and therefore it is difficult to estimate how the mass of the air changes (level 3 of the LPF). Some teachers explained that both photosynthesis and cellular respiration affect the gas exchange, and
2.8%
10.5%
25.2%
61.5%
6.5%
14.3%
31.2%
48.1%
0.0%
10.0%
20.0%
30.0%
40.0%
50.0%
60.0%
70.0%
Level 1 Level 2 Level 3 Level 4
CK
PCK
24
photosynthesis happens at a higher rate than cellular respiration, therefore the mass of the air would decrease (level 4 of the LPF). These two groups of teachers applied the conservation law to the processes. A few teachers provided the best answer; they explained that the total mass of the closed system is conserved and the mass of the plant increased due to plant growth, so the mass of the air decreases (level 4 of the LPF). These teachers applied the conservation law to the closed system that includes both air and the plant. This item is difficult probably because the curriculum uses conservation laws to reason about mass changes in plants but not about mass changes in air. Therefore, it is important for professional development to support teachers in knowledge transfer, especially in applying conservation laws adaptively to new contexts.
Regarding PCK, two items were particularly challenging for teachers: StudentThinking_Food (See Table 2, Item 3) and StudentThinking_OakTreeQ2Q3. These two items require teachers to understand not only the science content, but also students’ common naïve ideas. StudentThinking_Food assess teachers’ knowledge about students’ ideas of weight gain. It requires the teacher to understand that there are two meanings for the word food. In biology textbooks, food refers to organic substances (e.g., glucose, carbohydrates) that provide energy for plants; it is the product of photosynthesis. In everyday life, food often refers to everything people and plants take in. For students who think this way, water, air, and nutrients in soil are foods for plants. StudentThinking_OakTreeQ2Q3 also assesses teachers’ understanding of students’ ideas about weight gain. It provides six student responses that are grouped into three groups: the best responses, the second best responses, and the third best responses; teachers are asked to compare the three groups of responses. To achieve Level 4 of the PCK rubric, teachers need to correctly differentiate responses that are at Level 2 with those at Level 3 of the LPF. As one can see, these two most difficult items require teachers to understand students’ intuitive ideas. The easiest PCK item is StudentThinking_Energy; it asks teachers to identify the incorrect description of content in a student’s response2: “I know animals break down food to get energy, but I don’t think plants break down food for energy because they get light energy from the Sun.” Most teachers pointed out that this response was wrong, because plants do break down food for energy, illustrating that for most teachers, identifying incorrect content in students’ responses is much easier than identifying intuitive ideas that lead to students’ responses.
In summary, the participant teachers in general demonstrated model-based reasoning in CK. However, when transferring the knowledge to new contexts, most teachers did not apply conservation laws with flexibility. Regarding PCK, teachers are very good at identifying incorrect content in students’ responses, but they struggled with identifying intuitive ideas beneath students’ responses. Therefore, it is important for professional development programs to support teachers in developing adaptive expertise and understanding students’ intuitive ideas. Indeed, a well-designed curriculum alone cannot produce desirable student outcomes. Teachers are agents who enact the curriculum in class, so they need to be able to identify students’ force-dynamic type ideas and make appropriate next instructional moves in class.
Teachers’ Impacts on Student Outcomes We used two approaches to examine teachers’ impacts on student outcomes. In the first
approach, we explored to what extent teacher knowledge is linked to students’ learning gains. For 2011-12, teachers with average knowledge produced a learning gain of 0.59 logits with standard error of 0.06 (p<0.001). When a teacher had one-logit higher in knowledge, their
2 This PCK item is modified from an item designed by ATLAST.
25
students significantly gained an additional learning gain of 0.36 logits with standard error of 0.12 (p=0.002). Likewise, for year 2012-13, teachers of average knowledge were estimated to generate a student learning gain of 1.13 logits with standard error of 0.06 (p<0.001), and students taught by teachers with one-logit higher were likely to have an additional significant gain of 0.34 logits with standard error of 0.10 (p=0.001). These results suggest that the effect of teacher knowledge on student learning outcomes is statistically significant.
In the second approach, we examined whether different teachers produced different student learning gains and what teacher-related factors affecting learning outcomes. We first obtained intra-class correlation (ICC) from the multilevel analysis. ICC allowed us to infer how much the students taught by the same teacher were correlated. ICC values were estimated as 0.19 for the year of 2011-12 and 0.10 for the year of 2012-13. In other words, 19% and 10% of variation in students’ learning gains are explained by teacher-related factors. Given that typical ICC reported from school/teacher effectiveness studies is about 0.10 (for example, Hox, 1998), these results suggest that teacher-related factors strongly influenced students’ learning outcomes.
Next, we identified and compared two groups of teachers: high-performing teachers who produced high learning gains and low-performing teachers who produced low learning gains. Figures 7 and 8 present the predicted random intercepts and associated 95% confidence interval for individual teacher for 2011-12 and 2012-13. Two dotted lines represent zero learning gains and average learning gains respectively. Based on these two figures, we identified four high-performing teachers and seven low-performing teachers. The 95% confidence intervals of high-performing teachers do not overlap with those of low-performing teachers. We then analyzed the feedback forms of these two groups of teachers. We found that the two groups of teachers differ in the number of activities that they taught. The teachers in the low-performing group taught 6, 7, or 8 entire/full/expanded activities, whereas teachers in the high-performing group taught 10 or 11 entire/full/expanded activities (out of 11 total activities). There is only one exception. Teacher H1, who had the highest student learning gains in year 2012-13, taught 5 entire/full/expanded activities and 2 partial activities, but skipped 4 activities in the middle of the unit. The teacher’s feedback form and our conversations with the teacher show that the teacher used similar activities to replace the activities that were skipped. For example, the teacher had students monitor transpiration bags on trees in their school yard to help students understand where water goes after it is absorbed by the plant. This activity was used to replace Activity 5: investigating whether water contributes to the gain of biomass.
Taken together, the above evidence indicates that the coverage of curriculum could affect student outcomes. As elaborated above, the teaching intervention is a set of investigation and explanation activities that are coherently organized to facilitate students to develop the ability to trace matter, trace energy, and connect scales. When teachers skipped lessons without attending to the intuitive ideas addressed in those lessons, their students might not have been able to effectively make the transition from force-dynamic reasoning to model-based reasoning.
26
Figure 7. Ranked Teacher Performances Approximated by Random Intercepts in 2011-12
Figure 8. Ranked Teacher Performances Approximated by Random Intercepts in 2012-13
27
In summary, the results indicate that teacher knowledge and the coverage of lessons by teachers are two important factors affecting students’ learning. As teachers are agents who enact the curriculum materials in class, their knowledge is crucial for a successful implementation of the curriculum. In addition, teaching the complete unit is important, because the curriculum contains activities that are coherently organized, and activities appearing earlier in the curriculum provides a knowledge foundation for students to conduct later activities.
Discussion In the present study, we set out to investigate the promise and problems of learning
progression guided interventions. In this section, we discuss the contributions and limitations of the study.
Contributions The present study makes three important contributions to the learning progression
research. First, the conceptual change-oriented LPF was the basis for developing an intervention that enabled students to learn significant knowledge and practices in an important domain. Duschl and his colleagues (2011) called for researchers to examine the role of prior knowledge in progressions. To contribute to this effort, we developed a LPF that describes the conceptual change that students must go through in order to develop model-based reasoning about plant growth. Using the LPF as a guiding framework, we developed a curriculum, which uses two tools of reasoning to facilitate students to make the transition from force-dynamic reasoning to tracing matter and energy in ways that follow the conservation laws, and from reasoning at the macroscopic scale to reasoning across scales. Teachers used the curriculum to teach. The results from the teaching experiments suggest that students across research sites achieved significant learning gains. In particular, most students progressed from primarily relying on force-dynamic reasoning towards beginning to reason in terms of matter, energy, and scales. Students were able to explain weight gain and gas exchange in terms of changes in organic molecules and forms of energy, and identify patterns of the movement of matter and energy at a large scale.
However, the teaching experiments also uncover an important problem with student learning. In the post-assessments, there was a significant increase in Level 3 and Level 4 responses, but less than 5% of all responses were scored at Level 4. This suggests that many students “assimilate” the scientific knowledge about matter, energy, and scale into their existing force-dynamic reasoning framework. In other words, many students progressed from a force-dynamic reasoning framework to a hybrid framework that has characteristics of both force-dynamic reasoning and model-based reasoning. Why did this happen? Is a more productive progression possible? Literature on knowledge transfer suggests that the investment of time is critical for the development of expert understanding, and that knowledge taught in a single context is less likely to support flexible transfer than knowledge taught in multiple contexts (NRC, 2000). In our research, the upper anchor presents a sophisticated understanding of complex scientific concepts and principles. However, the teaching intervention was short-term (2 to 3 weeks) and about one context—plant growth. In addition, only 1 teacher out of 35 reported teaching all 11 activities (about 3 weeks) without any cuts. We expect that interventions with longer duration and across multiple contexts (e.g., burning fossil fuels, decaying, etc.) would help students successfully achieve the model-based reasoning described in Level 4. Work focusing on these longer interventions is now in progress (Dauer, Miller, & Anderson, in press; Rice, Doherty, & Anderson, 2014).
28
Second, we developed LPF-based measures of teachers’ CK and PCK. As teachers are agents, who enact curriculum in classrooms, it is important for learning progression studies to examine how teacher knowledge and teaching practice are linked to students’ learning outcomes. Very few studies have investigated this topic (e.g., Furtak, 2012; Furtak, et al., 2012). In this study, we used the LPF and the associated assessment to measure teachers’ CK; we also developed a written PCK assessment and an associated PCK rubric to measure teachers’ understanding of the scientific and intuitive ideas described in the LPF. The results show that a higher level of CK and PCK produced significantly higher students’ learning gains, suggesting teachers’ CK and PCK both contributed to learning outcomes. Other researchers can use similar approaches to develop the LPF-based measures of teacher knowledge on other science topics.
In addition, the results of teacher knowledge uncover two important problems with teacher knowledge in learning progression-guided interventions. First, although teachers in general had sound understanding of science content, they found difficulty in solving CK problems that required adaptive application of the mass conservation law. Hatano (1982) suggests several conditions that facilitate adaptive expertise: having a goal of understanding, requiring modifying procedures, and requiring justifying solutions. These conditions could be incorporated into professional development programs to support teachers in adaptively applying scientific principles. Second, although teachers in general were able to identify incorrect content in students’ responses, they struggled with interpreting students’ intuitive conceptions. We therefore suggest professional development programs provide sufficient support for teachers to analyze and interpret their students’ thinking.
Finally, the results indicate that teachers’ classroom practices also made a difference, at least in terms of the coverage of curriculum. We found that teachers who taught almost all activities (10 or 11) of the unit had better student learning gains. A more in-depth explanation of this topic should come from research on teachers’ classroom teaching practice. To achieve this goal, we are currently studying teachers’ classroom teaching videos.
Limitations This study has two major limitations. The first limitation is that the results do not provide
enough information about the mechanisms by which the interventions produce student outcomes. Based on the assessment data collected from teachers and students, we found that teacher knowledge and the coverage of the curriculum are two important factors affecting student outcomes. However, we did not collect classroom teaching data or teacher interview data. Therefore, we cannot explain the translation from teacher knowledge to classroom teaching practice. Nor can we report on how teachers make instructional decisions in class or how teachers use the same materials in different ways. In another study using data from a smaller group of teachers from this project, we are analyzing teachers’ teaching videos and teacher interviews in order to generate a more in-depth interpretation of how teachers use learning progression-guided teaching materials in classroom teaching and how PCK is translated into classroom teaching practice (Bianchini, Yestness, Nilsen, Hammond, Kim, Parker, & Berkowitz, 2014)
The second limitation has to do with the quantitative methods we applied. In the analysis process, we made the assumption that the responses at pre- and at post-assessment from the same student can be considered independent. Based on this assumption, we computed students’ learning gains on the same logit scale. This assumption may be considered unrealistic, because
29
the intervention (two to three weeks) is only short-term, so students’ pretest and posttest performances are highly correlated.
Conclusion We set out to examine the promise and problems of learning progression-guided
interventions. To do so, we investigated three research questions focusing on student outcomes, teacher knowledge, and teachers’ impact on student outcomes. The results demonstrated the promise in using a conceptual change-oriented LPF to guide the curriculum and instruction. In particular, the professional development and teaching intervention resulted in significant student learning gains; teachers who taught more activities of the curriculum and had significantly higher student learning gains.
The results also suggest several problems to be solved in order for the learning progression-guided intervention to be more successful. First, although the teachers in general had a sound understanding of CK and PCK, very few teachers demonstrated the ability to adaptively apply scientific principles and effectively analyze students’ intuitive conceptions. Future research is needed to examine approaches to promote teachers’ adaptive expertise and understanding of student thinking. Second, although students achieved significant learning gains, very few students achieved the upper anchor in the post-assessments. Therefore, future research should examine teaching interventions that are longer in duration and involve using the same principles across content topics should be carried out to facilitate more successful conceptual change in students. Finally, studies using more robust measures of teachers’ classroom performance will help us to understand specific teaching strategies that support students’ conceptual change learning.
References Alonzo, A., & Steedle, J. T. (2008). Developing and Assessing a Force and Motion Learning
Progression. Science Education, 93, 389-421. Anderson, C. W. (2008). Conceptual and empirical validation of learning progressions.
Michigan State University, East Lansing, MI. retrived from on http://www.cpre.org/ccii/images/stories/ccii_pdfs/learning%20progressions%20anderson.pdf on March 25, 2014.
Anderson, C. W., & Smith, E. L. (1987). Teaching science. In V. Richardson-Koehler (Ed.), Educators' handbook: A research perspective (pp. 84-111). New York, NY: Longman.
Baxter, J. A., & Lederman, N. G. (1999). Assessment and measurement of pedagogical content knowledge. In J. Gess-Newsome & N. G. Lederman (Eds.), PCK and science education (pp. 147-161). Netherlands: Kluwer Academic Publishers.
Berland, L. K., & McNeill, K. L. (2010). A learning progression for scientific argumentation: Understanding student work and designing supportive instructional contexts. Science Education, 94(5), 765-793.
Bianchini, J. A., Yestness, N. Nilsen, K. J., Hammond, L. M., Kim, J., Parker, S. D., and Berkowitz, A. M. (2014, April) Learning Progression-Based Teaching Strategies in Environmental Science: Teachers' Successes and Struggles in Implementation. Paper presented at the annual meeting of the National Association for Research In Science Teaching, Pittsburgh.
30
Brown, A. L. (1992). Design experiment: theoretical and methodological challenges in creating complex interventions in classroom settings. The Journal of the Learning Sciences, 2(2), 141-178.
Carey, S. (1986). Cognitive science and science education. American Psychologist, 41(10), 1123-1130.
Carey, S. (1991). Knowledge acquisition: enrichment or conceptual change? . In S. Carey & R. Gelman (Eds.), The Epigenesis of Mind: Essays on Biology and Cognition. Hillsdale, New Jersey: Lawrence Erlbaum Associates.
Catley, K., Lehrer, R., & Reiser, B. (2005). Tracing a prospective learning progression for developing understanding of evolution: Paper commissioned by the Committee on Test Design for K-12 Science Achievement, Board on Testing and Assessment, Center for Education, National Research Council, Washington, DC. .
Chi, M. T. H. (2009). Three types of conceptual change: Belief revision, mental model transformation, and categorical shift. In S. Vosniadou (Ed.), International handbook of research on conceptual change (pp. 61-101). New York, NY: Routledge.
Cochran-Smith, M., & Fries, K. (2005). Researching teacher education in changing times: politics and paradigms. In M. Cochran-Smith & K. M. Zeichner (Eds.), Studying teacher education: The report of the AERA Panel on Research and Teacher Education. Mahwah, NJ: Lawrence Erlbaum.
Collins, A., Joseph, D., & Bielaczyc, K. (2004). Design Research: Theoretical and Methodological Issues. The Journal of the Learning Sciences, 13(1), 15-42.
Dauer, J., Miller, H., and Anderson, C. W. (in press, 2014). Conservation of energy: An analytical tool for student accounts of carbon-transforming processes. In R. Chen, A. Eisenkraft, D. Fortus, J. Krajcik, K. Neumann & A. Scheff (Eds.), Teaching and Learning of Energy in K-12 Education. New York: Springer.
Davis, E. A., Beyer, C., Forbes, C. T., & Stevens, S. (2011). Understanding pedagogical design capacity through teachers' narratives. Teaching and Teacher Education, 27(4), 797-810.
Davis, E. A., & Krajcik, J. (2005). Designing educative curriculum materials to promote teacher learning. Educational Researcher, 34(3), 3-14.
Duncan, R. G., & Hmelo-Silver, C. (2009). Learning progressions: Aligning curriculum, instruction, and assessment. Journal of Research in Science Teaching, 46(6), 606-609.
Duncan, R. G., Rogat, A. D., & Yarden, A. (2009). A learning progression for deepening students' understanding of modern genetics across the 5th-10th grades. Journal of Research in Science Teaching, 46(6), 655-674.
Duschl, R. A., Maeng, S., & Sezen, A. (2011). Learning progressions and teaching sequences: A review and analysis. Studies in Science Education, 47(2), 123-182.
Furtak, E. M. (2012). Linking a learning progression for natural selection to teachers' enactment of formative assessment. Journal of Research in Science Teaching, 49(9), 1181-1210.
Furtak, E. M., Thompson, J., Braaten, M., & Windschitl, M. (2012). Learning progressions to support ambitious teaching practices. In A. Alonzo & A. W. Gotwals (Eds.), Learning
31
progressions in science: Current challenges and future directions (pp. 461-472). Rotterdam, The Netherlands: Sense Publishers.
Glaser, B. G., & Strauss, A. L. (1967). The discovery of grounded theory: Strategies for qualitative research. New York: Aldine Transaction.
Gotwals, A. W., & Alonzo, A. C. (2012). Introduction: Leaping into learning progressions in science. In A. Alonzo & A. W. Gotwals (Eds.), Learning progressions in science: Current challenges and future directions (pp. 3-12). The Netherlands: Sense Publishers.
Grossman, P. (1990). The making of a teacher: Teacher knowledge and teacher education. New York, NY: Teachers College Press.
Gunckel, K., Covitt, B., Salinas, I., & Anderson, C. W. (2012). A learning progression for water in socio-ecological systems. Journal of Research in Science Teaching, 49(7), 843-868.
Heller, J. I., Daehler, K. R., Wong, N., Shinohara, M., & Miratrix, L. W. (2012). Differential effects of three professional development models on teacher knowledge and student achievement in elementary science. Journal of Research in Science Teaching, 49(3), 333-362.
Hox, J. (1998). Multilevel modeling: When and why. In Classification, data analysis, and data highways (pp. 147–154). Springer.
Jin, H., & Anderson, C. W. (2012a). A learning progression for energy in socio-ecological systems. Journal of Research in Science Teaching, 49(9), 1149-1180.
Jin, H., & Anderson, C. W. (2012b). Development of assessments for a learning progression on carbon cycling in socio-ecological systems. In A. Alonzo & A. W. Gotwals (Eds.), Learning progressions in science: Current challenges and future directions (pp. 151-182). Rotterdam, The Netherlands: Sense Publishers.
Jin, H., & Wei, X. (2014). Using ideas from the history of science and linguistics to develop a learning progression for energy in socio-ecological systems. In R. F. Chen, A. Eisenkraft, F. Fortus, J. Krajcik, K. Neumann, J. C. Nordine & A. Scheff (Eds.), Teaching and learning of energy in K-12 Education. New York: Springer.
Jin, H., Zhan, L., & Anderson, C. W. (2013). Developing a fine-grained learning progression framework for carbon-transforming processes. International Journal of Science Education, 35(10), 1663-1697.
Johnson, P., & Tymms, P. (2011). The emergence of a learning progression in middle school chemistry. Journal of Research in Science Teaching, 48(8), 849-877.
Kagan, D. M. (1990). Ways of evaluating teacher cognition: Inferences concerning the Goldilocks Principle. Review of Educational Research, 60(3), 419-469.
Kromrey, J. D., & Renfrow, D. D. (1991). Using multiple choice examination items to measure teachers' content-specific pedagogical knowledge. Paper presented at the the annual meeting of the Eastern Educational Research Association, Boston, MA.
Lee, E., Brown, M. N., Luft, J. A., & Roehrig, G. H. (2007). Assessing beginning secondary science teachers' PCK: Pilot year results. School Science and Mathematics, 107(2), 52-60.
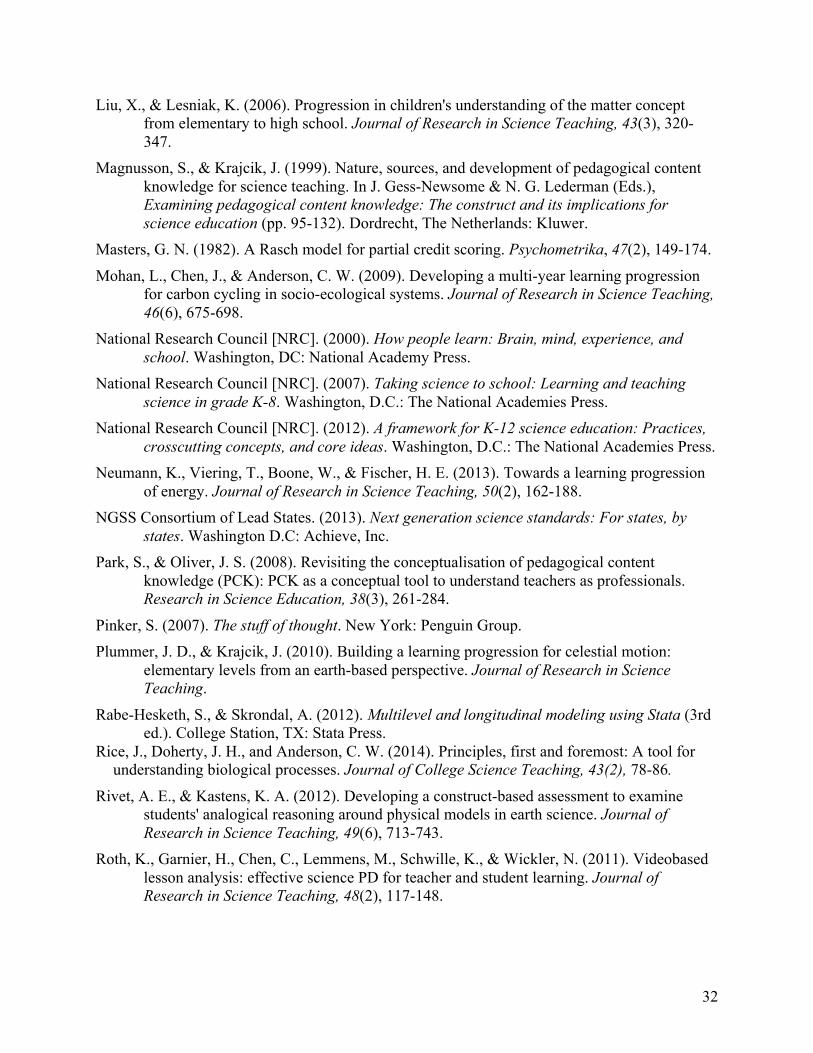
32
Liu, X., & Lesniak, K. (2006). Progression in children's understanding of the matter concept from elementary to high school. Journal of Research in Science Teaching, 43(3), 320-347.
Magnusson, S., & Krajcik, J. (1999). Nature, sources, and development of pedagogical content knowledge for science teaching. In J. Gess-Newsome & N. G. Lederman (Eds.), Examining pedagogical content knowledge: The construct and its implications for science education (pp. 95-132). Dordrecht, The Netherlands: Kluwer.
Masters, G. N. (1982). A Rasch model for partial credit scoring. Psychometrika, 47(2), 149-174.
Mohan, L., Chen, J., & Anderson, C. W. (2009). Developing a multi-year learning progression for carbon cycling in socio-ecological systems. Journal of Research in Science Teaching, 46(6), 675-698.
National Research Council [NRC]. (2000). How people learn: Brain, mind, experience, and school. Washington, DC: National Academy Press.
National Research Council [NRC]. (2007). Taking science to school: Learning and teaching science in grade K-8. Washington, D.C.: The National Academies Press.
National Research Council [NRC]. (2012). A framework for K-12 science education: Practices, crosscutting concepts, and core ideas. Washington, D.C.: The National Academies Press.
Neumann, K., Viering, T., Boone, W., & Fischer, H. E. (2013). Towards a learning progression of energy. Journal of Research in Science Teaching, 50(2), 162-188.
NGSS Consortium of Lead States. (2013). Next generation science standards: For states, by states. Washington D.C: Achieve, Inc.
Park, S., & Oliver, J. S. (2008). Revisiting the conceptualisation of pedagogical content knowledge (PCK): PCK as a conceptual tool to understand teachers as professionals. Research in Science Education, 38(3), 261-284.
Pinker, S. (2007). The stuff of thought. New York: Penguin Group. Plummer, J. D., & Krajcik, J. (2010). Building a learning progression for celestial motion:
elementary levels from an earth-based perspective. Journal of Research in Science Teaching.
Rabe-Hesketh, S., & Skrondal, A. (2012). Multilevel and longitudinal modeling using Stata (3rd ed.). College Station, TX: Stata Press.
Rice, J., Doherty, J. H., and Anderson, C. W. (2014). Principles, first and foremost: A tool for understanding biological processes. Journal of College Science Teaching, 43(2), 78-86.
Rivet, A. E., & Kastens, K. A. (2012). Developing a construct-based assessment to examine students' analogical reasoning around physical models in earth science. Journal of Research in Science Teaching, 49(6), 713-743.
Roth, K., Garnier, H., Chen, C., Lemmens, M., Schwille, K., & Wickler, N. (2011). Videobased lesson analysis: effective science PD for teacher and student learning. Journal of Research in Science Teaching, 48(2), 117-148.
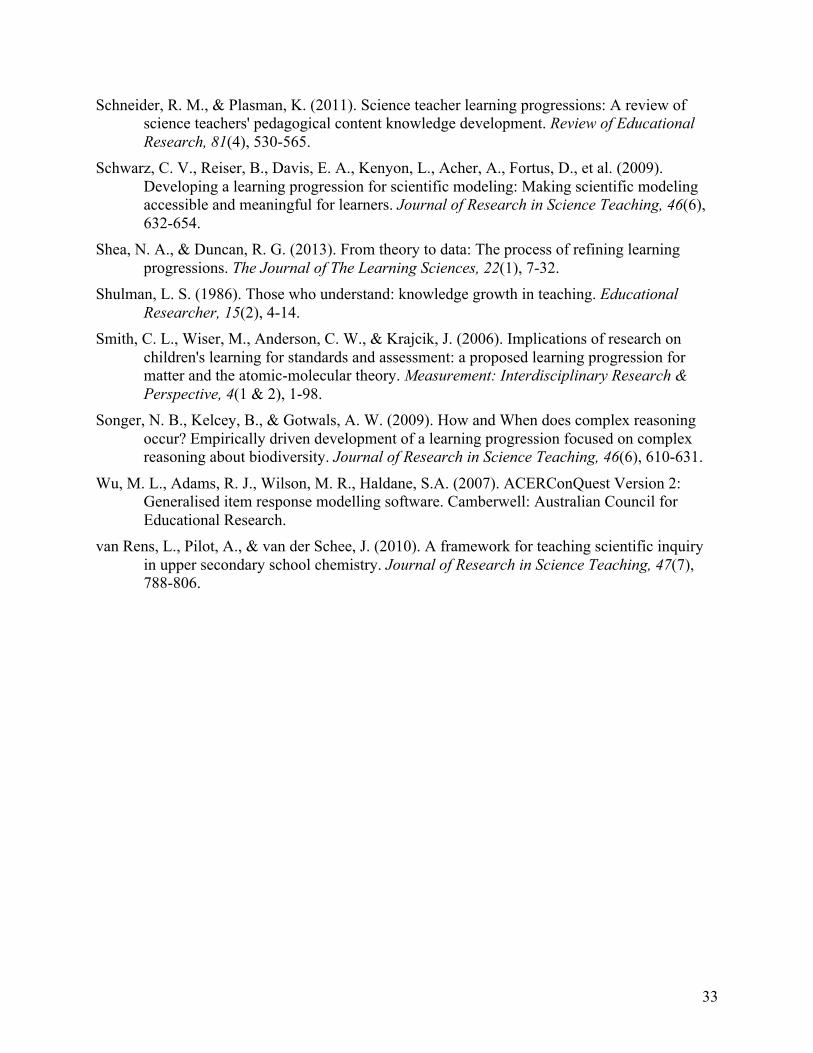
33
Schneider, R. M., & Plasman, K. (2011). Science teacher learning progressions: A review of science teachers' pedagogical content knowledge development. Review of Educational Research, 81(4), 530-565.
Schwarz, C. V., Reiser, B., Davis, E. A., Kenyon, L., Acher, A., Fortus, D., et al. (2009). Developing a learning progression for scientific modeling: Making scientific modeling accessible and meaningful for learners. Journal of Research in Science Teaching, 46(6), 632-654.
Shea, N. A., & Duncan, R. G. (2013). From theory to data: The process of refining learning progressions. The Journal of The Learning Sciences, 22(1), 7-32.
Shulman, L. S. (1986). Those who understand: knowledge growth in teaching. Educational Researcher, 15(2), 4-14.
Smith, C. L., Wiser, M., Anderson, C. W., & Krajcik, J. (2006). Implications of research on children's learning for standards and assessment: a proposed learning progression for matter and the atomic-molecular theory. Measurement: Interdisciplinary Research & Perspective, 4(1 & 2), 1-98.
Songer, N. B., Kelcey, B., & Gotwals, A. W. (2009). How and When does complex reasoning occur? Empirically driven development of a learning progression focused on complex reasoning about biodiversity. Journal of Research in Science Teaching, 46(6), 610-631.
Wu, M. L., Adams, R. J., Wilson, M. R., Haldane, S.A. (2007). ACERConQuest Version 2: Generalised item response modelling software. Camberwell: Australian Council for Educational Research.
van Rens, L., Pilot, A., & van der Schee, J. (2010). A framework for teaching scientific inquiry in upper secondary school chemistry. Journal of Research in Science Teaching, 47(7), 788-806.
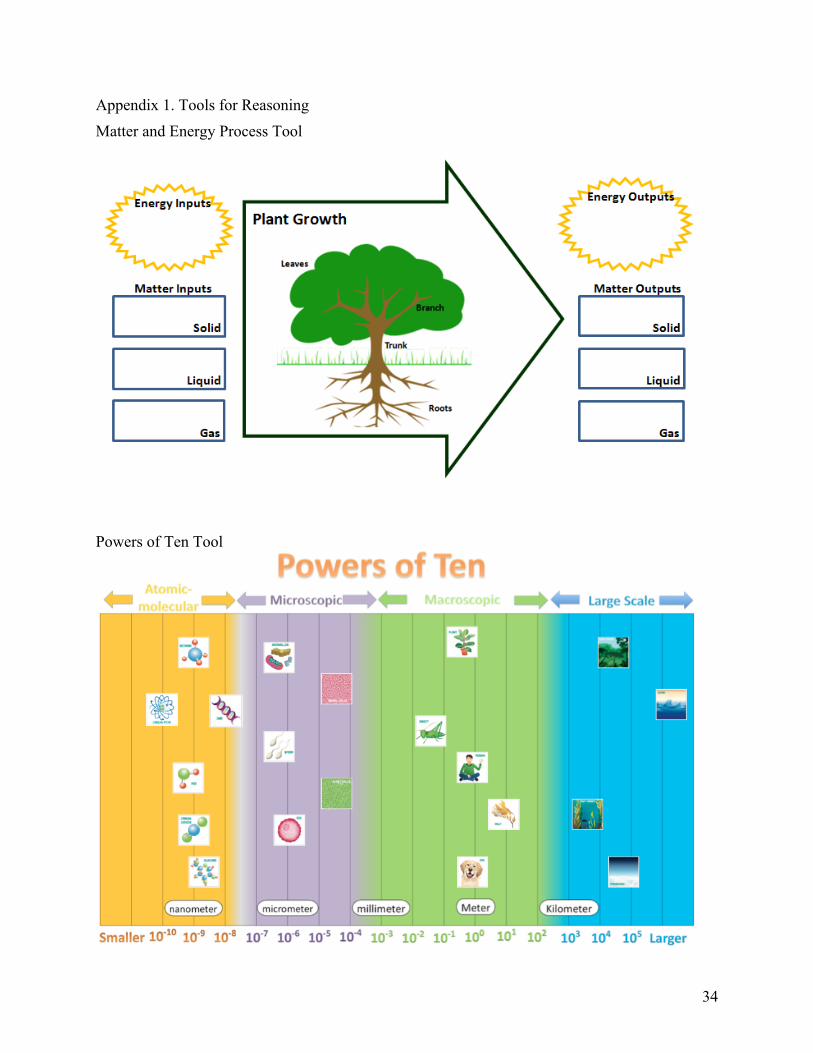
34
Appendix 1. Tools for Reasoning Matter and Energy Process Tool
Powers of Ten Tool
35
Appendix 2. Detailed description of activities The first seven activities help students construct core ideas through engaging them in
investigations. Activity 1 is an introductory activity. It elicits students’ prior ideas about plant growth. In this activity, students plant seeds. They continue making observations and measuring mass of the plants, while working on Activity 2 through 8. The Matter and Energy Process Tool is also introduced to students in this activity. Next, in three connecting scales activities, Activities 2, 3, and 4, students learn about the structure of molecules involved in photosynthesis and cellular respiration. More specifically, Activities 2 and 3 introduce the Powers of Ten Tool, which helps students make connections among the four benchmark-scales. In Activity 4, students use the Powers of Ten Tool to “zoom” from the macroscopic scale into the atomic-molecular scale. They identify organic molecules in terms of chemical identity (i.e., organic molecules all contain C-C and C-H bonds) and energy (i.e., organic molecules provide energy in chemical reactions). These activities help students construct Core Idea 3, which is the knowledge foundation for students to conduct Activity 5 and Activity 6. In Activity 5, students investigate whether water intake affects the permanent structural growth of the plant. The ideas of water evaporation and transpiration are also introduced to help students understand how water leaves the system/plant. In Activity 6, students investigate whether CO2 has mass in physical and chemical contexts. They investigate changes in mass and CO2 concentration in three experiments, including a cup of soda bubbling, a candle burning inside a closed chamber, and baking powder in water. Activity 6 provides a knowledge foundation for students to further explore gas exchange in biological contexts. In Activity 7, students examine gas exchange of plants in two conditions: light and dark. They measure carbon dioxide concentration and construct arguments about how and why the carbon concentration changes in different conditions. They consider the relationship between the pattern of CO2 moving in and out of plants with the pattern of mass loss when CO2 leaves a system (a pattern observed in Activity 6).
Activity 8 is a key activity, in which students synthesize previously learned content. In particular, students use the processes of photosynthesis and cellular respiration to explain more fully the results that they observed in Activity 7. To do so, they need to use the knowledge learned in Activity 5 (water does not contribute to structural mass gain), Activity 6 (CO2 has mass), and Activity 7 (plants can change CO2 concentration while they grow in the light and in the dark; both photosynthesis and cellular respiration happens in the light condition, whereas only cellular respiration happens in the dark condition). After completing Activity 8, students should be able to develop a conceptual understanding of Core Idea 1 (matter transformation in biochemical processes), Core Idea 2 (energy transformation in biochemical processes), and Core Idea 3 (biological processes occur in four benchmark scales).
Next, students apply the core ideas in four application activities. In Activity 9, students examine the data that they have been collecting since Activity 1, and use Core Idea 1 and Core Idea 2 to construct arguments about plants gaining biomass. In Activity 10, students read about the von Helmont experiment and apply Core Idea 1 and Core Idea 2 to explain the results of the experiment. Activity 11 is designed to help students better understand Core Idea 3 and become familiar with Core Idea 4 (human’s impact on the carbon cycle). Students make connections across scales. They zoom in to identify and locate carbon in organisms, cells, and organic molecules, and zoom out to identify photosynthesis and cellular respiration in carbon cycle diagrams. They also learn about carbon dioxide as a greenhouse gas and the imbalance between biochemical processes caused by human activities.