
Profiling - University of Texas at Austin
77
Transcript of Profiling - University of Texas at Austin

Outline
• Introduc;on
• Basic Tools – Command line ;mers – Code ;mers – gprof – IPM
• Intermediate tools – Perfexpert
• Advanced Tools – HPCToolkit – Vtune – Tau

Op;miza;on Process
Profile Code
Iden;fy Hotspots
Modify Code Hotspots Areas
Enough Perform. Gain?
(re-‐evaluate)
yes no
• Itera;ve process
• Applica;on dependent
• Different levels - Compiler Op;ons - Performance Libraries - Code Op;miza;ons
TIME CONSTRAINED
TIME CONSTRAINED

Performance Analysis Basics • Controlled measurements are essen;al • Repeat
– No single measurement is reliable • Document
– Save all these together: code version(s), compilers & flags, user inputs, system environment, ;mers & counters, code output
– Record Details: important rou;nes should track work done and ;me taken • Automate
– Don’t try to remember how you did something – script it! • Control
– Don’t let the O/S decide process & memory affinity – control it!

Disclaimer: coun;ng flops • The latest Intel processors base floa;ng point opera;on counts on issued instruc;ons.
• This can lead to severe miscounts, since an instruc;on may be reissued mul;ple ;mes before it can be re;red (executed)
• This applies to Sandy Bridge, Ivy Bridge and Haswell CPUs
• The Intel Xeon Phi co-‐processor does not have any means of measuring floa;ng point opera;ons directly

Timers: Command Line • The command !me is available in most Unix systems. • It is simple to use (no code instrumenta;on required). • Gives total execu;on ;me of a process and all its children in seconds. % /usr/bin/time -p ./exeFile real 9.95 user 9.86 sys 0.06 Leave out the -‐p op;on to get addi;onal informa;on: % time ./exeFile % 9.860u 0.060s 0:09.95 99.9% 0+0k 0+0io 0pf+0w
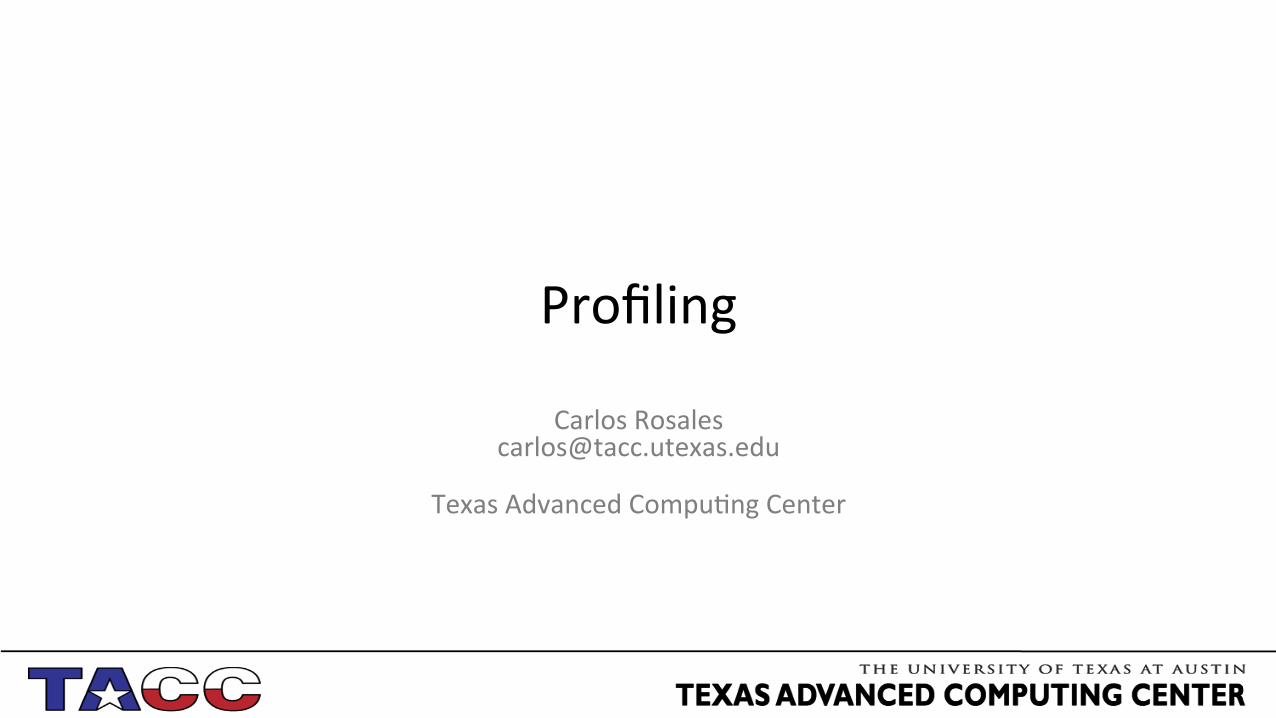
Timers: Code Sec;on INTEGER :: rate, start, stop REAL :: time
CALL SYSTEM_CLOCK(COUNT_RATE = rate) CALL SYSTEM_CLOCK(COUNT = start) ! Code to time here CALL SYSTEM_CLOCK(COUNT = stop) time = REAL( ( stop - start )/ rate )
#include <time.h> double start, stop, time; start = (double)clock()/CLOCKS_PER_SEC; /* Code to time here */ stop = (double)clock()/CLOCKS_PER_SEC; time = stop - start;

About GPROF GPROF is the GNU Project PROFiler. gnu.org/sobware/binu;ls/ • Requires recompila;on of the code.
• Compiler op;ons and libraries provide wrappers for each rou;ne call and periodic sampling of the program.
• Provides three types of profiles – Flat profile – Call graph – Annotated source

Types of Profiles • Flat Profile
– CPU ;me spend in each func;on (self and cumula;ve) – Number of ;mes a func;on is called – Useful to iden;fy most expensive rou;nes
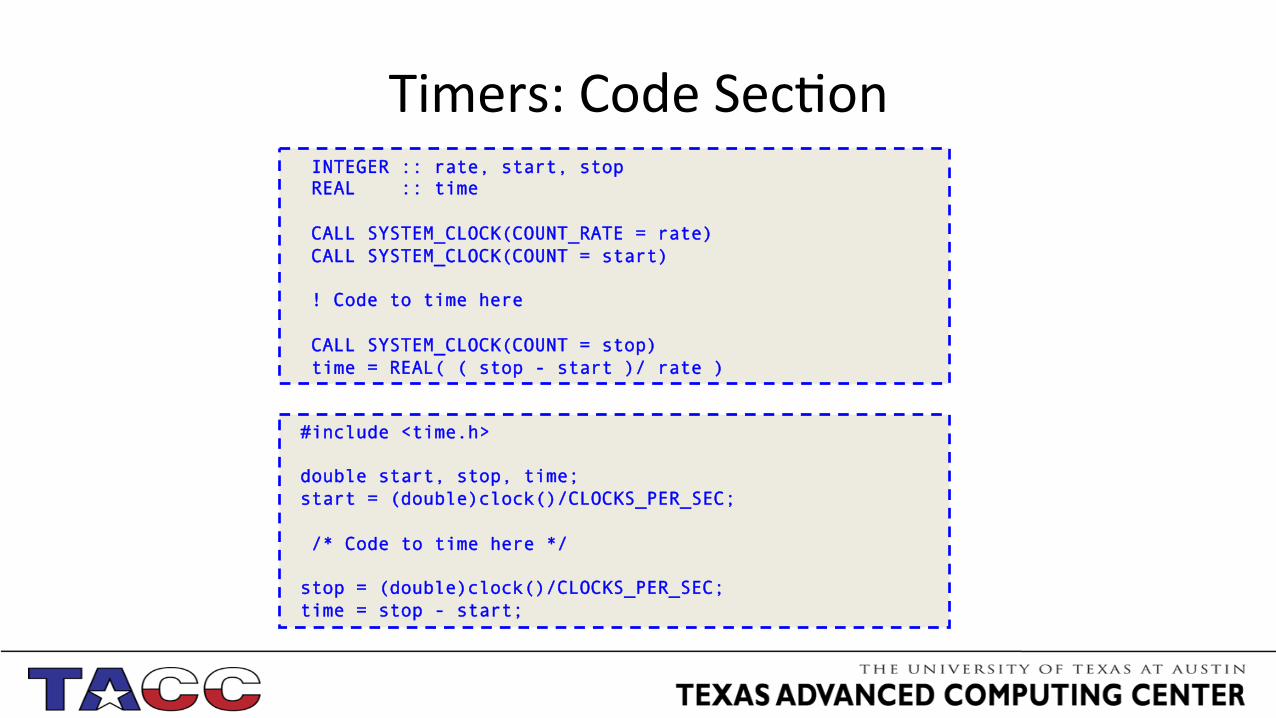
• Call Graph – Number of ;mes a func;on was called by other func;ons – Number of ;mes a func;on called other func;ons – Useful to iden;fy func;on rela;ons – Suggests places where func;on calls could be eliminated
• Annotated Source – Indicates number of ;mes a line was executed

Profiling with gprof Use the -‐pg flag during compila;on: % gcc -g -pg ./srcFile.c % icc -g -p ./srcFile.c Run the executable. An output file gmon.out will be generated with the profiling informa;on. Execute gprof and redirect the output to a file: % gprof ./exeFile gmon.out > profile.txt % gprof -l ./exeFile gmon.out > profile_line.txt % gprof -A ./exeFile gmon.out > profile_anotated.txt

Flat profile In the flat profile we can iden;fy the most expensive parts of the code (in this case, the calls to matSqrt, matCube, and sysCube). % cumulative self self total time seconds seconds calls s/call s/call name 50.00 2.47 2.47 2 1.24 1.24 matSqrt 24.70 3.69 1.22 1 1.22 1.22 matCube 24.70 4.91 1.22 1 1.22 1.22 sysCube 0.61 4.94 0.03 1 0.03 4.94 main 0.00 4.94 0.00 2 0.00 0.00 vecSqrt 0.00 4.94 0.00 1 0.00 1.24 sysSqrt 0.00 4.94 0.00 1 0.00 0.00 vecCube

Call Graph Profile index % time self children called name 0.00 0.00 1/1 <hicore> (8) [1] 100.0 0.03 4.91 1 main [1] 0.00 1.24 1/1 sysSqrt [3] 1.24 0.00 1/2 matSqrt [2] 1.22 0.00 1/1 sysCube [5] 1.22 0.00 1/1 matCube [4] 0.00 0.00 1/2 vecSqrt [6] 0.00 0.00 1/1 vecCube [7] ----------------------------------------------- 1.24 0.00 1/2 main [1] 1.24 0.00 1/2 sysSqrt [3] [2] 50.0 2.47 0.00 2 matSqrt [2] ----------------------------------------------- 0.00 1.24 1/1 main [1] [3] 25.0 0.00 1.24 1 sysSqrt [3] 1.24 0.00 1/2 matSqrt [2] 0.00 0.00 1/2 vecSqrt [6] -----------------------------------------------
Visual Call Graph
main
matSqrt vecSqrt matCube vecCube sysSqrt sysCube

Call Graph Profile index % time self children called name 0.00 0.00 1/1 <hicore> (8) [1] 100.0 0.03 4.91 1 main [1] 0.00 1.24 1/1 sysSqrt [3] 1.24 0.00 1/2 matSqrt [2] 1.22 0.00 1/1 sysCube [5] 1.22 0.00 1/1 matCube [4] 0.00 0.00 1/2 vecSqrt [6] 0.00 0.00 1/1 vecCube [7] ----------------------------------------------- 1.24 0.00 1/2 main [1] 1.24 0.00 1/2 sysSqrt [3] [2] 50.0 2.47 0.00 2 matSqrt [2] ----------------------------------------------- 0.00 1.24 1/1 main [1] [3] 25.0 0.00 1.24 1 sysSqrt [3] 1.24 0.00 1/2 matSqrt [2] 0.00 0.00 1/2 vecSqrt [6] -----------------------------------------------

Visual Call Graph
main
matSqrt
vecSqrt matCube vecCube sysSqrt sysCube

Call Graph Profile index % time self children called name 0.00 0.00 1/1 <hicore> (8) [1] 100.0 0.03 4.91 1 main [1] 0.00 1.24 1/1 sysSqrt [3] 1.24 0.00 1/2 matSqrt [2] 1.22 0.00 1/1 sysCube [5] 1.22 0.00 1/1 matCube [4] 0.00 0.00 1/2 vecSqrt [6] 0.00 0.00 1/1 vecCube [7] ----------------------------------------------- 1.24 0.00 1/2 main [1] 1.24 0.00 1/2 sysSqrt [3] [2] 50.0 2.47 0.00 2 matSqrt [2] ----------------------------------------------- 0.00 1.24 1/1 main [1] [3] 25.0 0.00 1.24 1 sysSqrt [3] 1.24 0.00 1/2 matSqrt [2] 0.00 0.00 1/2 vecSqrt [6] -----------------------------------------------

Visual Call Graph
main
matSqrt
vecSqrt
matCube vecCube sysSqrt sysCube

PERFEXPERT

Perfexpert
• Brand new tool, locally developed at UT • Easy to use and understand • Great for quick profiling and for beginners • Provides recommenda;on on “what to fix” in a subrou;ne • Collects informa;on from PAPI using HPCToolkit • No MPI specific profiling, no 3D visualiza;on, no elaborate metrics • Combines ease of use with useful interpreta;on of gathered performance
data • Op;miza;on sugges;ons!!!

Profiling with Perfexpert: Compila;on
• Load the papi, hpctoolkit and perfexpert modules: module load papi hpctoolkit perfexpert
• Compile the code with full op;miza;on and with the -‐g flag: mpicc -‐g -‐O3 source.c mpif90 -‐g -‐O3 source.f90
• In your job submission script: perfexpert 0.1 ./<executable> <executable args>

Perfexpert Output !Loop in function collision in collision.F90:68 (37.66% of the total runtime)!===============================================================================!ratio to total instrns % 0..........25..........50..........75..........100! - floating point 100.0 **************************************************! - data accesses 31.7 ****************!* GFLOPS (% max) 19.8 **********! - packed 7.3 ****! - scalar 12.5 ******!-------------------------------------------------------------------------------!performance assessment LCPI good.......okay........fair........poor........bad!* overall 4.51 >>>>>>>>>>>>>>>>>>>>>>>>>>>>>>>>>>>>>>>>>>>>>>>>>+!* data accesses 12.28 >>>>>>>>>>>>>>>>>>>>>>>>>>>>>>>>>>>>>>>>>>>>>>>>>+! - L1d hits 1.11 >>>>>>>>>>>>>>>>>>>>>>! - L2d hits 1.05 >>>>>>>>>>>>>>>>>>>>>! - L3d hits 0.01 ! - LLC misses 10.11 >>>>>>>>>>>>>>>>>>>>>>>>>>>>>>>>>>>>>>>>>>>>>>>>>+!* instruction accesses 0.13 >>>! - L1i hits 0.00 ! - L2i hits 0.01 ! - L2i misses 0.12 >>!* data TLB 0.02 !* instruction TLB 0.00 !* branch instructions 0.00 ! - correctly predicted 0.00 ! - mispredicted 0.00 !* floating-point instr 8.01 >>>>>>>>>>>>>>>>>>>>>>>>>>>>>>>>>>>>>>>>>>>>>>>>>+! - slow FP instr 0.16 >>>! - fast FP instr 7.85 >>>>>>>>>>>>>>>>>>>>>>>>>>>>>>>>>>>>>>>>>>>>>>>>>+!===============================================================================!
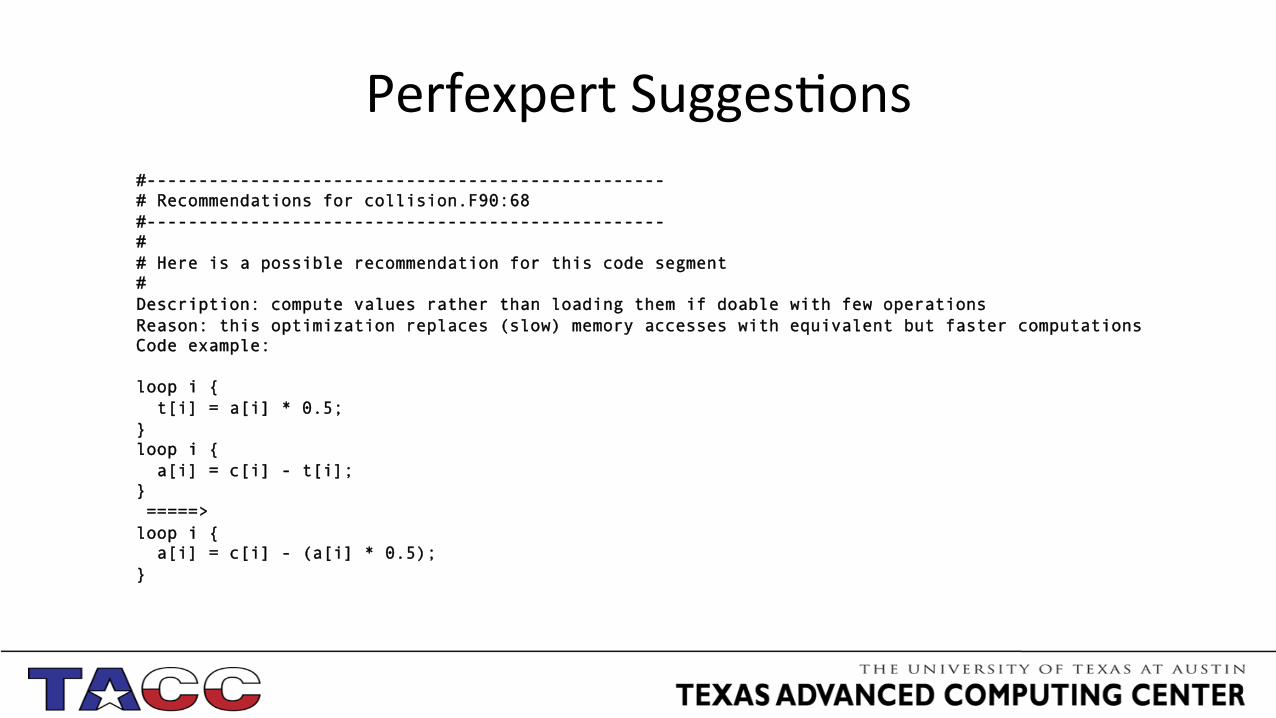
Perfexpert Sugges;ons #-------------------------------------------------- # Recommendations for collision.F90:68 #-------------------------------------------------- # # Here is a possible recommendation for this code segment # Description: compute values rather than loading them if doable with few operations Reason: this optimization replaces (slow) memory accesses with equivalent but faster computations Code example: loop i { t[i] = a[i] * 0.5; } loop i { a[i] = c[i] - t[i]; } =====> loop i { a[i] = c[i] - (a[i] * 0.5); }

Advanced Perfexpert Use • If you select the -‐m or -‐s op;ons, PerfExpert will try to
– Automa;cally op;mize your code – Show the performance analysis report – Show the list of sugges;on for bokleneck remedia;on when no automa;c op;miza;on is possible.
• Get the code and documenta;on from:
www.tacc.utexas.edu/research-‐development/tacc-‐projects/perfexpert github.com/TACC/perfexpert

IPM: INTEGRATED PERFORMANCE MONITORING

IPM: Integrated Performance Monitoring
• “IPM is a portable profiling infrastructure for parallel codes. It provides a low-‐overhead performance summary of the computa;on and communica;on in a parallel program”
• IPM is a quick, easy and concise profiling tool • The level of detail it reports is smaller than TAU, PAPI or HPCToolkit

IPM: Integrated Performance Monitoring • IPM features:
– easy to use – has low overhead – is scalable
• Requires no source code modifica;on, just adding the “-‐g” op;on to the compila;on
• Produces XML output that is parsed by scripts to generate browser-‐readable html pages
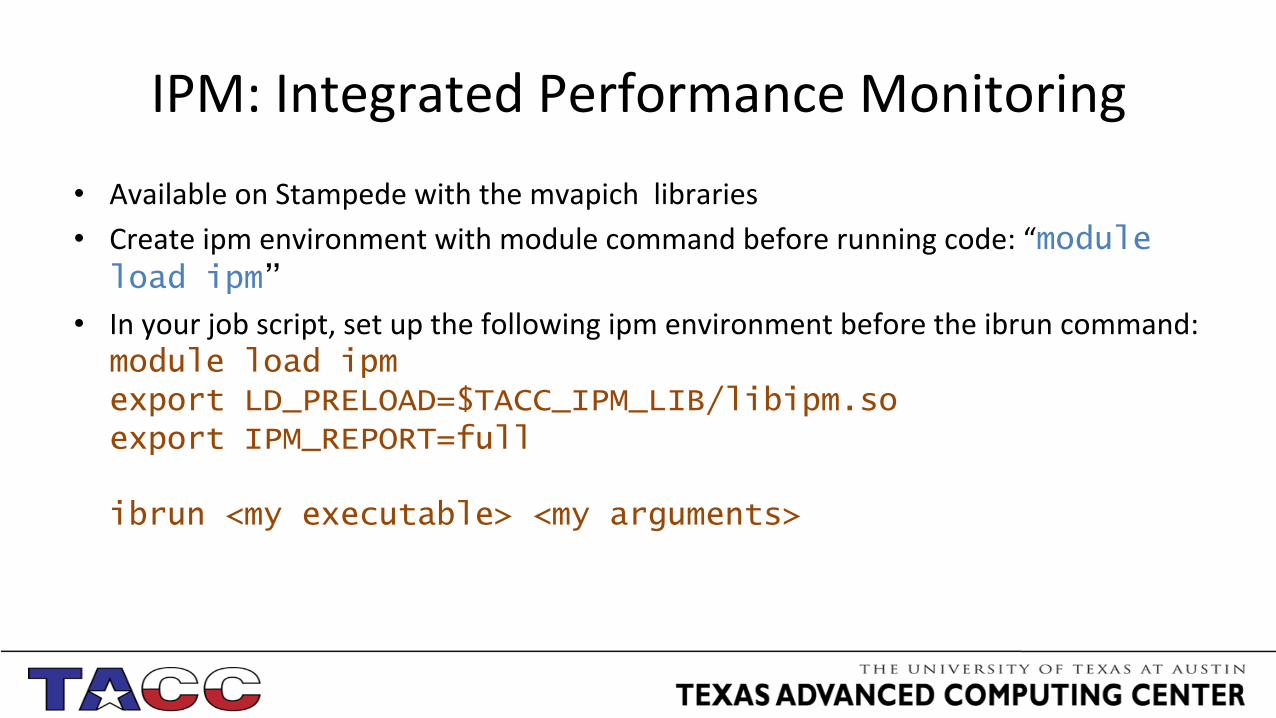
IPM: Integrated Performance Monitoring • Available on Stampede with the mvapich libraries • Create ipm environment with module command before running code: “module load ipm”
• In your job script, set up the following ipm environment before the ibrun command: module load ipm export LD_PRELOAD=$TACC_IPM_LIB/libipm.so export IPM_REPORT=full ibrun <my executable> <my arguments>

IPM: Integrated Performance Monitoring • Preload the ipm library:
export LD_PRELOAD=$TACC_IPM_LIB/libipm.so!• Define the type of collec;on:
export IPM_REPORT=full (full, terse, none)!
• Define collec;on threshold (op;onal) export IPM_MPI_THRESHOLD=0.3!(Reports only rou;nes using this percentage or more of MPI ;me)
• Genera;ng HTML output: ipm_parse -html <collected data dir>!

IPM: Text Output ##IPMv0.983####################################################################!# !# command : /home1/01157/carlos/TEST/profiling/mm (completed)!# host : c404-504/x86_64_Linux mpi_tasks : 16 on 1 nodes!# start : 11/11/14/16:25:04 wallclock : 0.836220 sec!# stop : 11/11/14/16:25:05 %comm : 20.49 !# gbytes : 5.25372e+00 total gflop/sec : NA !#!##############################################################################!# region : * [ntasks] = 16!#!# [total] <avg> min max !# entries 16 1 1 1!# wallclock 13.3793 0.836207 0.836197 0.83622!# user 18.5732 1.16082 1.05884 1.18082!# system 1.48777 0.0929854 0.074988 0.197969!# mpi 2.74098 0.171311 0.133593 0.650309!# %comm 20.4864 15.9759 77.7683!# gbytes 5.25372 0.328358 0.328205 0.330112!#!# [time] [calls] <%mpi> <%wall>!# MPI_Bcast 1.6727 32000 61.03 12.50!# MPI_Recv 0.725848 4015 26.48 5.43!# MPI_Send 0.320127 4015 11.68 2.39!# MPI_Barrier 0.0223054 16 0.81 0.17!# MPI_Comm_rank 2.97837e-06 16 0.00 0.00!# MPI_Comm_size 1.43796e-06 16 0.00 0.00!###############################################################################!
IPM: Integrated Performance Monitoring
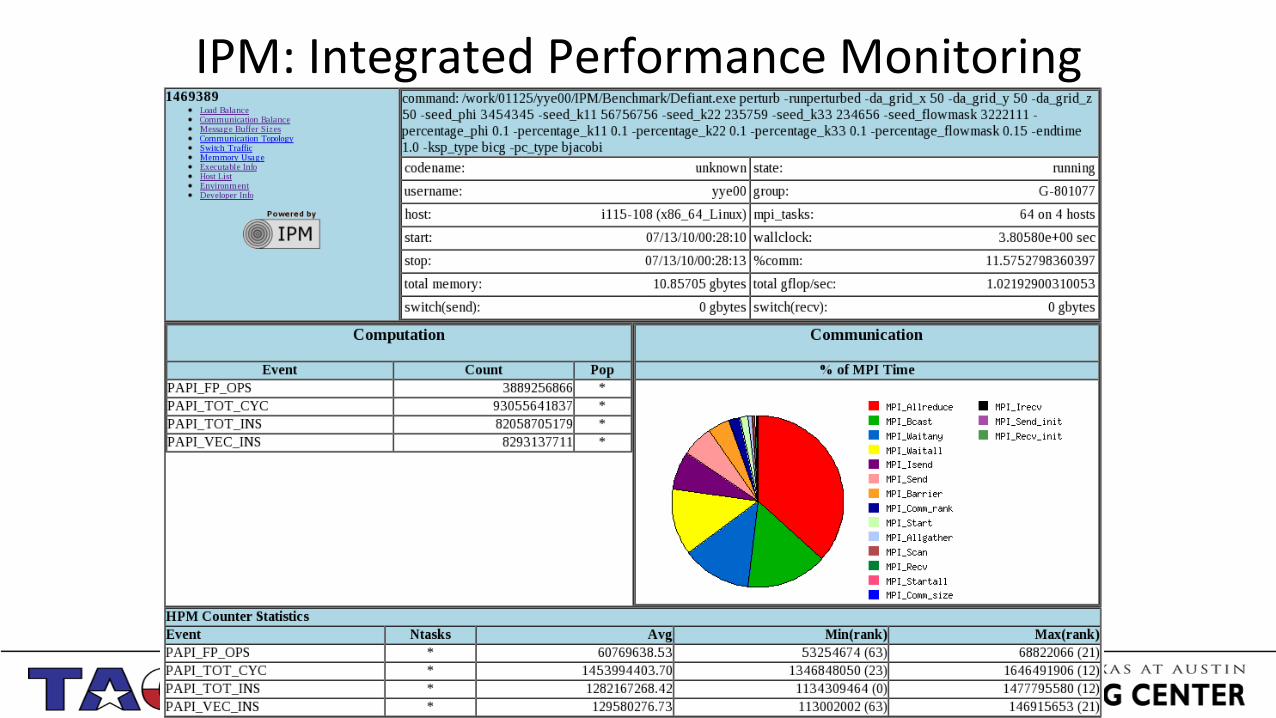
IPM: Event Sta;s;cs

IPM: Load Balance

IPM Buffer Size Distribu;on: % of Comm Time

Buffer Size Distribu;on: Ncalls

Communica;on Topology

IPM: Integrated Performance Monitoring
• When to use IPM? – To quickly find out where your code is spending most of its ;me (in both computa;on and communica;on)
– For performing scaling studies (both strong and weak) – When you suspect you have load imbalance and want to verify it quickly
– For a quick look at the communica;on pakern – To find out how much memory you are using per task – To find the rela;ve communica;on & compute ;me

IPM: Integrated Performance Monitoring
• When IPM is NOT the answer – When you already know where the performance issues are – When you need detailed performance informa;on on exact lines of code
– When want to find specific informa;on such as cache misses

MPI STATS USING INTEL MPI

MPI Profiling with IMPI
• Use the following: export I_MPI_STATS=ipm!export I_MPI_STATS_FILE=mystats.dat!
• This generates an IPM style report • More advanced configura;ons are possible, check the Intel MPI Reference Manual

Advanced Profiling Tools : the next level
Advanced Profiling Tools • Can be in;mida;ng:
– Difficult to install – Many dependences – Require kernel patches
• Useful for serial and parallel programs
• Extensive profiling and scalability informa;on
• Analyze code using: – Timers – Hardware registers (PAPI) – Func;on wrappers
Not your problem!!

PAPI PAPI is a Performance Applica;on Programming Interface icl.cs.utk.edu/papi • API to use hardware counters • Behind Tau, HPCToolkit • Mul;planorm:
– Most Intel & AMD chips – IBM POWER 4/5/6 – Cray X/XD/XT – Sun UltraSparc I/II/III – MIPS – SiCortex – Cell
• Available as a module on Lonestar and Stampede (mind the hardware counters issue with sandybridge xeons).

HPCTOOLKIT

HPCToolkit hpctoolkit.org • Binary-‐level measurement and analysis – no recompila;on!
• Uses sample-‐based measurements – Controlled overhead – Good scalability for large scale parallelism analysis
• Good analysis tools – Ability to compare mul;ple runs at different scales – Scalable interface for trace viewer – Good derived metrics support

HPCToolkit: Overview

HPCToolkit: Overview • Compile with symbols and op;miza;on:
icc -g -O3 mysource -o myexe!!
• Collect profiling informa;on: (Serial / OMP) hpcrun myexe!(MPI parallel) ibrun hpcrun myexe!!
• Perform sta;c binary analysis of the executable: hpcstruct myexe!!
• Interpret profile and correlate it with source code: hpcprof -‐S myexe.hpcstruct hpctoolkit-‐myexe-‐measurement-‐dir
• View the results hpcviewer hpctoolkit-database!

HPCToolkit: HW Counters
• Specify what events must be measured during the collec;on: hpcrun –e event[@period] myexe
• Mul;ple events can be specified (no mul;plexing) hpcrun –e PAPI_L2_TCM -e PAPI_L2_DCA –e PAPI_TOT_CYC myexe!!
• WALLCLOCK event cannot be used with other events hpcrun –e WALLCLOCK myexe
• Find all available events and a brief descrip;on using: hpcrun --list-events!
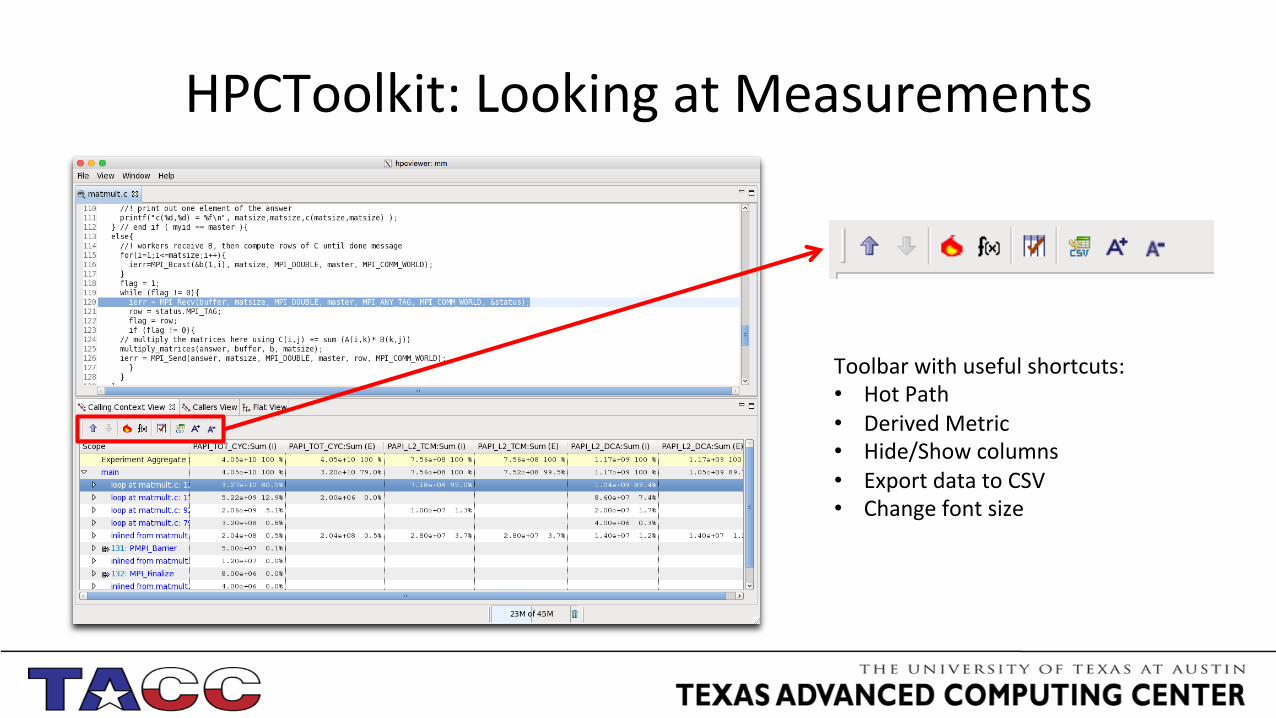
HPCToolkit: Looking at Measurements
Toolbar with useful shortcuts: • Hot Path • Derived Metric • Hide/Show columns • Export data to CSV • Change font size

HPCToolkit: Hot Path
• Probably the first thing you want to look at
• Iden;fies most expensive execu;on path
• Allows you to focus on analyzing those part of the code that take the longest

HPCToolkit: Derived Metric
• Oben absolute numbers do not provide ac;onable informa;on
• Derived metrics (like hit to miss ra;o) are typically more useful
• Very flexible interface
• Derived metrics can also be saved for later analysis

HPCToolkit: Genera;ng and Viewing Traces icc -g -O3 mysource -o myexe!!
• Collect profiling and trace informa;on using the -‐t op;on: (Serial / OMP) hpcrun -t myexe!(MPI parallel) ibrun hpcrun -t myexe!!
• Perform sta;c binary analysis of the executable: hpcstruct myexe!!
• Interpret profile and correlate it with source code: hpcprof -‐S myexe.hpcstruct hpctoolkit-‐myexe-‐measurement-‐dir
• View the results hpctraceviewer hpctoolkit-database!
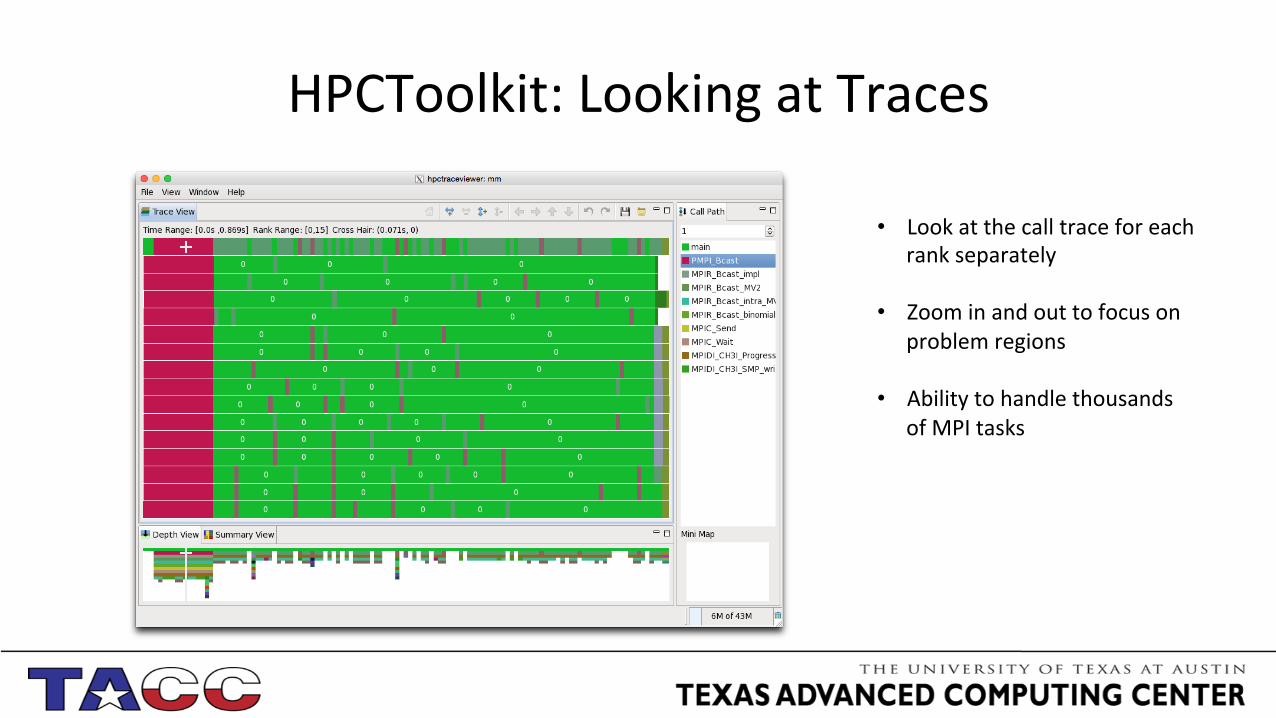
HPCToolkit: Looking at Traces
• Look at the call trace for each rank separately
• Zoom in and out to focus on problem regions
• Ability to handle thousands of MPI tasks

HPCToolkit: Filtering Ranks
• Some;mes you need to reduce the complexity of the displayed data
• Filtering by ranks is a great way to do this

VTUNE AMPLIFIER

VTune
• This is an Intel product sobware.intel.com/en-‐us/intel-‐vtune-‐amplifier-‐xe
• Available on stampede: module load vtune!• Supports profiling on the host CPU and the Xeon Phi for Stampede • Two part interface: command line and gui • MPI rou;nes are like any other rou;nes (i.e. knows about threading and openmp, not MPI) but it does understand MPI ranks (for per-‐rank profile result output)

VTune: Collec;ng Performance Data
• Three step process: – Compile your code with -g and full op;miza;on – Run with amplxe-‐cl to collect performance data – Visualize performance data with amplxe-‐gui
• Same behavior for host CPU and Phi coprocessor • Simple collec;on with amplxe-‐cl:
!(Serial / OMP) ! amplxe-cl -collect hotspots ./myexe!!(MPI Parallel) ibrun amplxe-cl -collect hotspots ./myexe!
!

VTune: What to Collect
• To see what analysis types are available, and op;ons for their collec;on: amplxe-cl –help collect!amplxe-cl –help collect < insert analysis type >!!
• General purpose, 1st pass analysis type: hotspots
• 2nd pass: concurrency to check for sync overhead, iden;fy poten;al candidates for paralleliza;on

Analysis Types on Stampede
Sandy Bridge Host • concurrency • bandwidth • hotspots • advanced-‐hotspots • locksandwaits • General-‐explora;on • snb-‐access-‐conten;on • snb-‐branch-‐analysis • snb-‐client • snb-‐core-‐port-‐satura;on • snb-‐cycles-‐uops • snb-‐memory-‐access • snb-‐port-‐satura;on
Xeon Phi (Knights Corner – knc) • knc-‐bandwidth • knc-‐general-‐explora;on • knc-‐hotspots
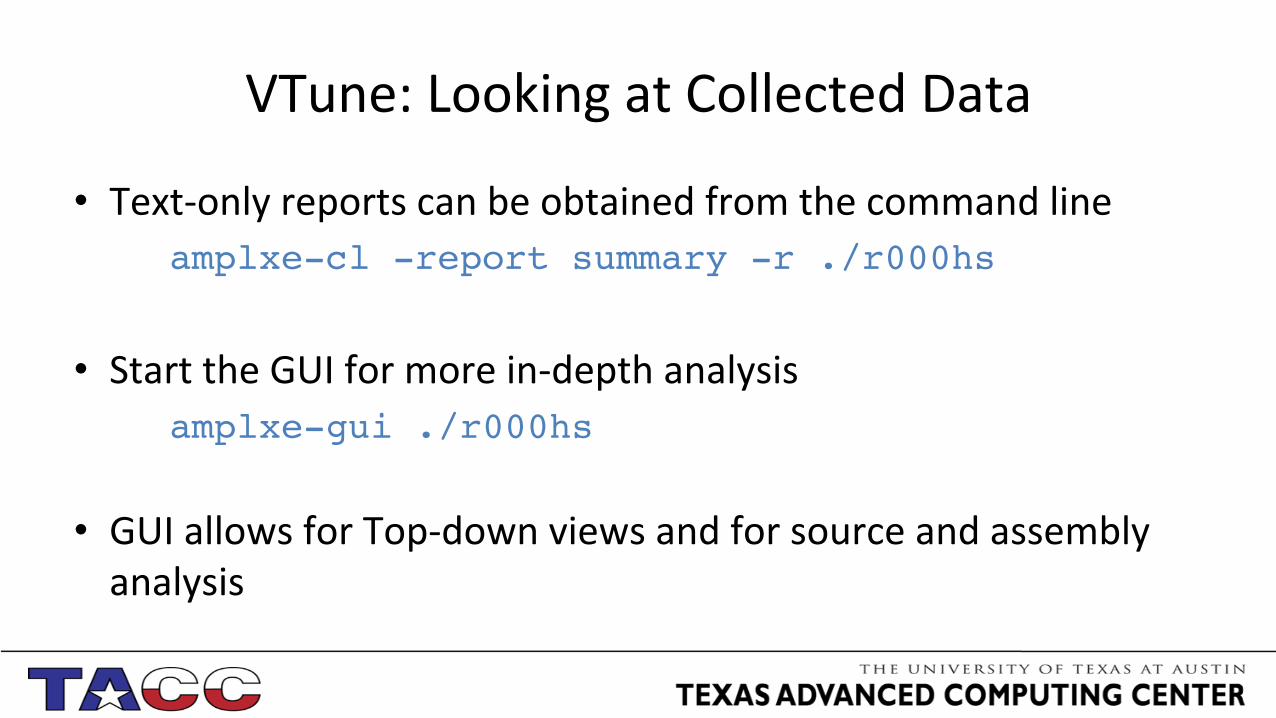
VTune: Looking at Collected Data
• Text-‐only reports can be obtained from the command line !amplxe-cl -report summary -r ./r000hs!
• Start the GUI for more in-‐depth analysis !amplxe-gui ./r000hs!
• GUI allows for Top-‐down views and for source and assembly analysis
!

VTune: Sample Summary Collection and Platform Info!----------------------------!Parameter hotspots.0 !------------------------ -----------------------------------------------------!
Application Command Line ./mm !Operating System 2.6.32-431.17.1.el6.x86_64 CentOS release 6.5 (Final)!
MPI Process Rank 0 !Computer Name c401-604.stampede.tacc.utexas.edu !Result Size 2012293 !
Collection start time 04:01:56 12/11/2014 UTC !Collection stop time 04:01:58 12/11/2014 UTC !
!CPU!---!
Parameter hotspots.0 !----------------- -----------------------------!Name Intel(R) Xeon(R) E5 processor!
Frequency 2699995693 !Logical CPU Count 16 !
!Summary!-------!
Elapsed Time: 1.160!CPU Time: 0.860!
Average CPU Usage: 0.714!

Example hotspots summary

• Top-‐Down view is familiar to the programmer
• Interface bokom shows CPU usage for each thread
• Right-‐click to look at the source code

• Ability to look at the assembly generated for a par;cular line of code is very powerful
• Some;mes this is too much informa;on
• But it can help determine why unexpected boklenecks appear in the code

TAU

Tau TAU is a suite of Tuning and Analysis U;li;es www.cs.uoregon.edu/research/tau • 12+ year project involving
– University of Oregon Performance Research Lab – LANL Advanced Compu;ng Laboratory – Research Centre Julich at ZAM, Germany
• Integrated toolkit – Performance instrumenta;on – Measurement – Analysis – Visualiza;on

Tau: Measurements
• Parallel profiling – Function-level, block (loop)-level, statement-level – Supports user-defined events – TAU parallel profile data stored during execution – Hardware counter values (multiple counters) – Support for callgraph and callpath profiling
• Tracing – All profile-level events – Inter-process communication events – Trace merging and format conversion
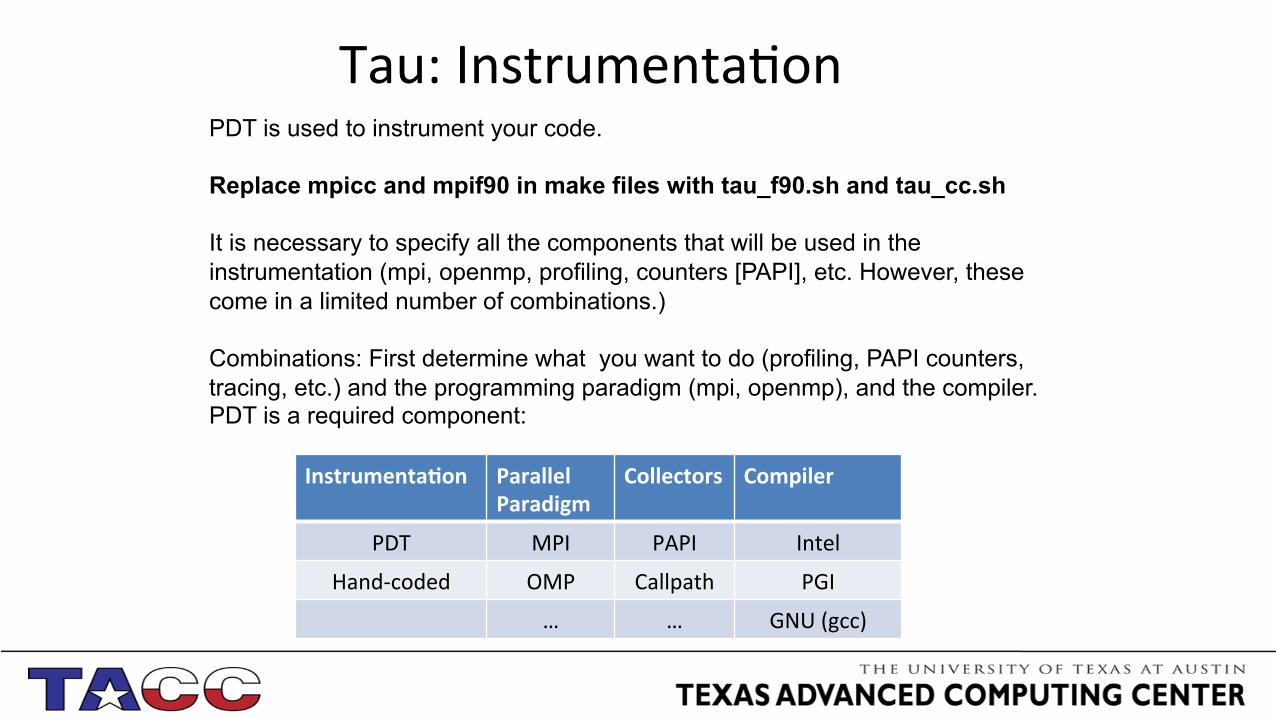
PDT is used to instrument your code. Replace mpicc and mpif90 in make files with tau_f90.sh and tau_cc.sh It is necessary to specify all the components that will be used in the instrumentation (mpi, openmp, profiling, counters [PAPI], etc. However, these come in a limited number of combinations.) Combinations: First determine what you want to do (profiling, PAPI counters, tracing, etc.) and the programming paradigm (mpi, openmp), and the compiler. PDT is a required component:
Tau: Instrumenta;on
Instrumenta!on Parallel Paradigm
Collectors Compiler
PDT MPI PAPI Intel
Hand-‐coded OMP Callpath PGI
… … GNU (gcc)

Tau: Instrumentation You can view the available combinations: ls -C1 $TAU | grep Makefile
Your selected combination is made known to the compiler wrapper through the TAU_MAKEFILE environment variable. For example, the PDT instrumention (pdt) for the Intel compiler (icpc) with MPI (mpi) is set with this command:
export TAU_MAKEFILE=$TAU/Makefile.tau-icpc-papi-mpi-pdt
Hardware counter options are setup using TAU_METRICS:
export TAU_METRICS=LINUXTIMERS:PAPI_L2_TCM:PAPI_L2_DCA
Other run-time and instrumentation options are set through TAU_OPTIONS. For verbose:
export TAU_OPTIONS=‘-optVerbose’

Tau: Results
• You can also enable tracing by using: export TAU_TRACE=1
• Run code normally: ibrun myexe
• Then look at the results using paraprof: paraprof /path/to/results

Tau: Paraprof Manager Window
• Provides Machine Details
• Organizes Runs as • Applications • Experiments • Trials.

Tau: Rou;ne Time Experiment
• Each Event collected is viewed separately
• Statistics provided across MPI tasks
• Click on a given color to see more detail (new window)

Tau: Func;on Data Window and 3D Plots

Tau: Call Path
Call Graph Paths (Must select through “thread” menu.)

Tau: Call Path
TAU_MAKEFILE = …Makefile.tau-callpath-icpc-mpi-pdt
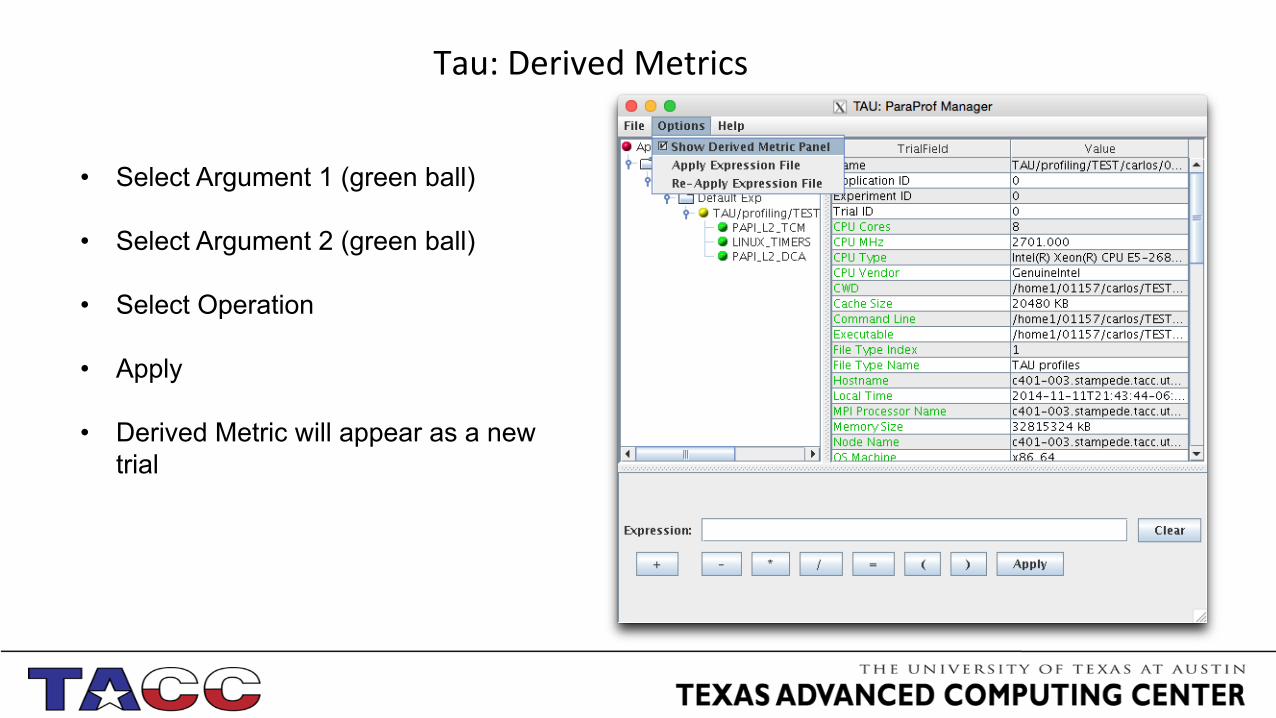
Tau: Derived Metrics
• Select Argument 1 (green ball)
• Select Argument 2 (green ball)
• Select Operation
• Apply
• Derived Metric will appear as a new trial

Profiling dos and don’ts
DO
• Test every change you make • Profile typical cases • Compile with op;miza;on flags • Test for scalability
DO NOT
• Assume a change will be an improvement
• Profile atypical cases • Profile ad infinitum
– Set yourself a goal or – Set yourself a ;me limit

Other tools • Valgrind* valgrind.org
– Powerful instrumenta;on framework, oben used for debugging memory problems
• MPIP mpip.sourceforge.net – Lightweight, scalable MPI profiling tool
• Scalasca www.fz-‐juelich.de/jsc/scalasca – Similar to Tau, complete suit of tuning and analysis tools.