Aswath Damodaran1 The Value of Intangibles Aswath Damodaran.

PROJECT WORKBOOK THE INDONESIA 2015 EDITION
“Talk is cheap. Time for acEon”
1

2
Your data…
¨ Data Packet ¤ Page 1: HDS (Bloomberg) – Top 17 stockholders ¤ Page 2: Beta (Bloomberg) – 2 year weekly return beta ¤ Pages 3-‐7: DES (Bloomberg) – 5 page descripEon of your company ¤ Page 8: FA -‐ Summary financial informaEon for your company ¤ Page 9: CRPR – Bond RaEng or Bloomberg Default Risk Assessement ¤ Page 10 : DDIS: Debt due table (with maturiEes)
¨ Checklist before you start ¤ What country is your company incorporated in? ¤ What currency are the financial statements in? (Not necessarily in the
local currency) ¤ What currency is your market capitalizaEon and stock price stated in?
(May not match the currency of the financial statements) ¤ What was the most recent fiscal year? (For most of your companies, it will
be a year ending December… but some may have other year ends)
2

Percent of outstanding shares in company
Source for data: Will vary across markets. 13F is SEC filing for US mutual/pension funds
3
4
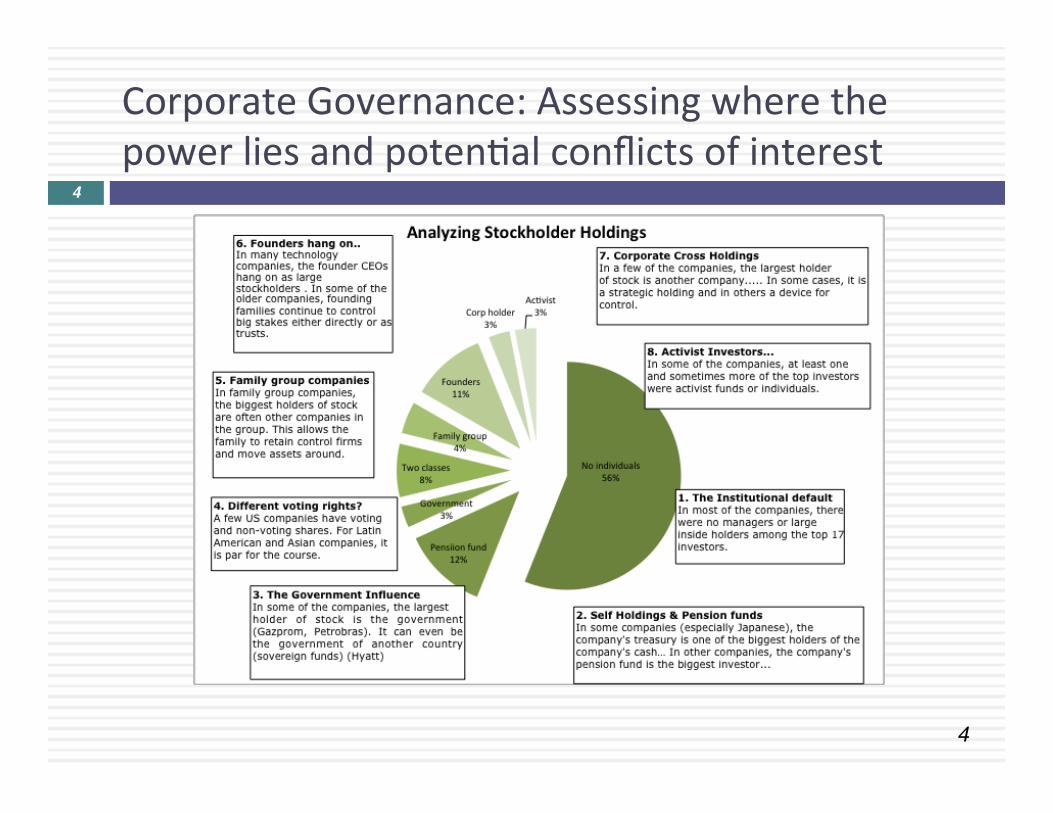
Corporate Governance: Assessing where the power lies and potenEal conflicts of interest
4

5
The Indonesian Sample 5
Company Biggest Holder Holding Other comments
Krakatau Steel Republic of Indonesia 80.00%
Bumi Resources Long Haul Holdings 23.15% 5 FII on list
Lippo Karawacki Pacific Asia Holdings 17.88% Blackrock, Vanguard etc.
Gudang Garam Sutyaduta Investama 69.29% Blackrock
Perushann Gas Republic of Indonesia 56.97% Blackrock again
Semen Indonesia Republic of Indonesia 51.01% Blackrock, Vanguard
United Tractors PT Astra 59.50% Blackrock and other FII
Media Nusantra Global Mediacom 65.32% Blackrock and FII
Indosat Coredoo Asia 65.00% 4 FII

6
Local Currency Government Bond Rates – July 2015
Aswath Damodaran6
Currency Govt Bond Rate (6/30/15) Currency Govt Bond Rate (6/30/15) Australian $ 3.07% Malyasian Ringgit 4.03% Brazilian Reai 12.58% Mexican Peso 6.12% BriEsh Pound 2.18% Nigerian Naira 14.15% Bulgarian Lev 3.15% Norwegian Krone 1.92% Canadian $ 1.86% NZ $ 3.38% Chilean Peso 4.63% Pakistani Rupee 10.05% Chinese Yuan 3.62% Peruvian Sol 6.38% Colombian Peso 7.22% Phillipine Peso 4.38% CroaEan Kuna 3.26% Polish Zloty 3.24% Czech Koruna 0.92% Romanian Leu 4.00% Danish Krone 1.15% Russian Ruble 11.14% Euro 0.92% Singapore $ 2.72% HK $ 1.85% South African Rand 8.30% Hungarian Forint 3.93% Swedish Krona 1.03% Iceland Krona 7.10% Swiss Franc 0.16% Indonesian Rupee 7.85% Taiwanese $ 1.51% Indonesian Rupiah 8.31% Thai Baht 2.97% Israeli Shekel 2.39% Turkish Lira 9.14% Japanese Yen 0.45% US $ 2.47% Kenyan Shilling 13.02% Venezuelan Bolivar 12.25% Korean Won 2.48% Vietnamese Dong 6.79%

7
Approach 1: Default spread from Government Bonds
The Brazil Default SpreadBrazil 2021 Bond: 4.05%US 2021 T.Bond: 1.75%Spread: 2.30%
The Indonesia Default SpreadIndonesia does not have dollar or Euro denominated bonds outstanding.

8
Approach 2: CDS Spreads – July 2015
Aswath Damodaran8
Country Moody's ra.ng CDS Spread CDS Spread
adj for US Country Moody's ra.ng CDS Spread CDS Spread
adj for US Country Moody's ra.ng CDS Spread CDS Spread
adj for US
Abu Dhabi Aa2 0.97% 0.56% India Baa3 2.37% 1.96% Portugal Ba1 2.71% 2.30% Australia Aaa 0.61% 0.20% Indonesia Baa3 2.60% 2.19% Qatar Aa2 1.01% 0.60% Austria Aaa 0.57% 0.16% Ireland Baa1 1.13% 0.72% Romania Baa3 1.73% 1.32% Bahrain Baa3 3.21% 2.80% Israel A1 1.06% 0.65% Russia BA1 3.59% 3.18% Belgium Aa3 0.85% 0.44% Italy Baa2 2.03% 1.62% Saudi Arabia Aa3 0.93% 0.52% Brazil Baa2 3.32% 2.91% Japan A1 0.84% 0.43% Slovakia A2 0.99% 0.58% Bulgaria Baa2 2.26% 1.85% Kazakhstan Baa2 2.88% 2.47% Slovenia Baa3 1.78% 1.37% Chile Aa3 1.04% 0.63% Korea Aa3 0.84% 0.43% South Africa Baa2 2.73% 2.32% China Aa3 1.52% 1.11% Latvia A3 1.43% 1.02% Spain Baa2 1.73% 1.32% Colombia Baa2 2.32% 1.91% Lebanon B2 4.03% 3.62% Sweden Aaa 0.36% 0.00% Costa Rica Ba1 3.78% 3.37% Lithuania A3 1.39% 0.98% Switzerland Aaa 0.31% 0.00% CroaEa Ba1 3.25% 2.84% Malaysia A3 2.01% 1.60% Thailand Baa1 1.64% 1.23% Cyprus B3 5.15% 4.74% Mexico A3 1.93% 1.52% Tunisia Ba3 3.33% 2.92% Czech Republic A1 0.94% 0.53% Morocco Ba1 2.29% 1.88% Turkey Baa3 2.81% 2.40% Denmark Aaa 0.44% 0.03% Netherlands Aaa 0.41% 0.00% United Kingdom Aa1 0.41% 0.00% Egypt B3 3.70% 3.29% New Zealand Aaa 0.65% 0.24% United States of America Aaa 0.41% 0.00% Estonia A1 0.88% 0.47% Norway Aaa 0.31% 0.00% Vietnam B1 2.90% 2.49% Finland Aaa 0.53% 0.12% Pakistan B3 4.95% 4.54% France Aa1 0.76% 0.35% Panama Baa2 1.98% 1.57% Germany Aaa 0.41% 0.00% Peru A3 2.01% 1.60% Hong Kong Aa1 0.70% 0.29% Philippines Baa2 1.55% 1.14% Hungary Ba1 2.16% 1.75% Poland A2 1.30% 0.89%

9
Approach 3: Typical Default Spreads: July 2015
Aswath Damodaran9
Sovereign Rating
Default Spread over riskfree
Aaa 0.00% Aa1 0.40% Aa2 0.50% Aa3 0.60% A1 0.70% A2 0.85% A3 1.20% Baa1 1.60% Baa2 1.90% Baa3 2.20% Ba1 2.50% Ba2 3.00% Ba3 3.60% B1 4.50% B2 5.50% B3 6.50% Caa1 7.50% Caa2 9.00% Caa3 10.00%
IndonesiaRating = Baa3Spread = 2.2%
BrazilRating = Baa2Spread = 1.9%

10
Gemng to a risk free rate in a currency: Examples
¨ The Brazilian government bond rate in nominal reais in July 2015 was 12.58%. ¨ Approach 1: Government Bond spread
¤ The 2021 Brazil bond, denominated in US dollars, has a spread of 2.30% over the US treasury bond rate. ¤ Riskfree rate in $R = 12.58% -‐ 2.30% = 10.28%
¨ Approach 2: The CDS Spread ¤ CDS spread for Brazil, adjusted for the US CDS, on July 1, 2015 was 2.91%. ¤ Riskfree rate in $R = 12.58% -‐ 2.91% = 9.67%
¨ Approach 3: The RaEng based spread ¤ Brazil has a Baa2 local currency raEng, with a default spread of 1.90%. ¤ Riskfree rate in $R = 12.58% -‐ 1.90% = 10.68%
¨ The Indonesian government bond rate in rupiah in July 2015 was 8.31% ¤ Approach 2: The CDS Spread
¤ CDS spread for India, adjusted for the US CDS, on July 1, 2015 was 2.19%. ¤ Riskfree rate in Rupiah = 8.31% -‐ 2.19% = 6.12%
¨ Approach 3: The RaEng based spread ¤ Indonesia has a Baa3 local currency raEng, with a default spread of 2.20%. ¤ Riskfree rate in Rupiah = 8.31% -‐ 2.20% = 6.11%
Aswath Damodaran10

11
Risk free Rates: By Currency – July 2015 11 Governments with no default risk Governments with default risk
Currency Risk free Rate Currency Risk free Rate Australian $ 3.07% Brazilian Reai 10.68% Canadian $ 1.86% BriEsh Pound 1.78% Danish Krone 1.15% Bulgarian Lev 1.25% Euro 0.92% Chilean Peso 4.03% Norwegian Krone 1.92% Chinese Yuan 3.02% NZ $ 3.38% Colombian Peso 5.32% Singapore $ 2.72% CroaEan Kuna 0.76% Swedish Krona 1.03% Czech Koruna 0.22% Swiss Franc 0.16% HK $ 1.45% US $ 2.47% Hungarian Forint 1.43%
Iceland Krona 4.90% Indonesian Rupee 5.65% Indonesian Rupiah 6.11% Israeli Shekel 1.69% Japanese Yen -‐0.25% Kenyan Shilling 8.52% Korean Won 1.88% Malyasian Ringgit 2.83% Mexican Peso 4.92% Nigerian Naira 10.55% Pakistani Rupee 2.55% Peruvian Sol 5.18% Phillipine Peso 2.48% Polish Zloty 2.39% Romanian Leu 1.80% Russian Ruble 9.24% South African Rand 6.40% Taiwanese $ 0.91% Thai Baht 1.37% Turkish Lira 6.94% Venezuelan Bolivar 4.75% Vietnamese Dong 2.29%

12
Risk free Rate: DesperaEon Time?
¨ It is enErely possible that you may be unable to find a government bond issued in the local currency (that is traded) or that you do not trust the government bond rate as a fair market interest rate. There are two ways you can get to a risk free rate, in this case.
1. Build up approach: The risk free rate in any currency can be wripen as the sum of two variables:
Risk free rate = Expected InflaEon in currency + Expected real interest rate The expected real interest rate can be computed in one of two ways: from the US TIPs rate or set equal to real growth in the economy. Thus, if the expected inflaEon rate in a country is expected to be 15% and the TIPs rate is 1%, the risk free rate is 16%.
2. US $ rate & DifferenEal InflaEon: AlternaEvely, you can scale up the US $ risk free rate by the differenEal inflaEon between the US $ and the currency in quesEon:
Risk free rateCurrency= Thus, if the US $ risk free rate is 3.04%, the inflaEon rate in the foreign currency is 15% and the inflaEon rate in US $ is 2%, the foreign currency risk free rate is as follows: Risk free rate = 1.0304 !.!"
!.!" − 1!=!16.17%!
12

Black #: Total ERPRed #: Country risk premiumAVG: GDP weighted average
ERP
: Jul
y 20
15
Country ERP CRP Angola 10.31% 4.50% Botswana 7.09% 1.28% Burkina Faso 15.56% 9.75% Cameroon 14.06% 8.25% Cape Verde 14.06% 8.25% Congo (DR) 15.56% 9.75% Congo (Republic of) 11.21% 5.40% C™te d'Ivoire 12.56% 6.75% Egypt 15.56% 9.75% Ethiopia 12.56% 6.75% Gabon 11.21% 5.40% Ghana 15.56% 9.75% Kenya 12.56% 6.75% Morocco 9.56% 3.75% Mozambique 12.56% 6.75% Namibia 9.11% 3.30% Nigeria 11.21% 5.40% Rwanda 14.06% 8.25% Senegal 12.56% 6.75% South Africa 8.66% 2.85% Tunisia 11.21% 5.40% Uganda 12.56% 6.75% Zambia 12.56% 6.75% Africa 11.61% 5.80%
Bangladesh 11.21% 5.40% MauriEus 8.21% 2.40% Cambodia 14.06% 8.25% Mongolia 14.06% 8.25% China 6.71% 0.90% Pakistan 15.56% 9.75% Fiji 12.56% 6.75% Papua NG 12.56% 6.75% Hong Kong 6.41% 0.60% Philippines 8.66% 2.85% India 9.11% 3.30% Singapore 5.81% 0.00% Indonesia 9.11% 3.30% Sri Lanka 12.56% 6.75% Japan 6.86% 1.05% Taiwan 6.71% 0.90% Korea 6.71% 0.90% Thailand 8.21% 2.40% Macao 6.56% 0.75% Vietnam 12.56% 6.75% Malaysia 7.61% 1.80% Asia 7.31% 1.50%
Australia 5.81% 0.00% Cook Islands 12.56% 6.75% New Zealand 5.81% 0.00% Australia & NZ 5.81% 0.00%
ArgenEna 17.06% 11.25% Belize 19.31% 13.50% Bolivia 11.21% 5.40% Brazil 8.66% 2.85% Chile 6.71% 0.90% Colombia 8.66% 2.85% Costa Rica 9.56% 3.75% Ecuador 15.56% 9.75% El Salvador 11.21% 5.40% Guatemala 9.56% 3.75% Honduras 15.56% 9.75% Mexico 7.61% 1.80% Nicaragua 15.56% 9.75% Panama 8.66% 2.85% Paraguay 9.56% 3.75% Peru 7.61% 1.80% Suriname 11.21% 5.40% Uruguay 8.66% 2.85% Venezuela 20.81% 15.00% La.n America 10.29% 4.48%
Albania 12.56% 6.75% Lithuania 7.61% 1.80% Armenia 11.21% 5.40% Macedonia 11.21% 5.40% Azerbaijan 9.11% 3.30% Moldova 15.56% 9.75% Belarus 17.06% 11.25% Montenegro 11.21% 5.40% Bosnia 15.56% 9.75% Poland 7.09% 1.28% Bulgaria 8.66% 2.85% Romania 9.11% 3.30% CroaEa 9.56% 3.75% Russia 9.56% 3.75% Czech Republic 6.86% 1.05% Serbia 12.56% 6.75% Estonia 6.86% 1.05% Slovakia 7.09% 1.28% Georgia 11.21% 5.40% Slovenia 9.11% 3.30% Hungary 9.56% 3.75% Ukraine 23.81% 18.0% Kazakhstan 8.66% 2.85% E. Europe 9.71% 3.90% Latvia 7.61% 1.80%
Abu Dhabi 6.56% 0.75% Bahrain 9.11% 3.30% Israel 6.86% 1.05% Jordan 12.56% 6.75% Kuwait 6.56% 0.75% Lebanon 14.06% 8.25% Oman 6.86% 1.05% Qatar 6.56% 0.75% Ras Al Khaimah 7.09% 1.28% Saudi Arabia 6.71% 0.90% Sharjah 7.61% 1.80% UAE 6.56% 0.75% Middle East 6.91% 1.10%
Canada 5.81% 0.00% United States 5.81% 0.00% North America 5.81% 0.00%
Andorra 8.21% 2.40% Guernsey 6.41% 0.60% Netherlands 5.81% 0.00% Austria 5.81% 0.00% Iceland 9.11% 3.30% Norway 5.81% 0.00% Belgium 6.71% 0.90% Ireland 8.21% 2.40% Portugal 9.56% 3.75% Cyprus 15.56% 9.75% Isle of Man 6.41% 0.60% Spain 8.66% 2.85% Denmark 5.81% 0.00% Italy 8.66% 2.85% Sweden 5.81% 0.00% Finland 5.81% 0.00% Jersey 6.41% 0.60% Switzerland 5.81% 0.00% France 6.41% 0.60% Liechtenstein 5.81% 0.00% Turkey 9.11% 3.30% Germany 5.81% 0.00% Luxembourg 5.81% 0.00% UK 6.41% 0.60% Greece 19.31% 13.50% Malta 7.61% 1.80% W. Europe 6.97% 1.16%

14
Company Exposure Revenues ProporHon ERP Weighted ERP Krakatau Indonesia 1889 100.00% 9.11% 9.11% Bumi Resources Indonesia 2800 39.47% 9.11%
7.9% Rest of Asia 3547 50.00% 7.23% Europe 704 9.92% 6.97% United States 43 0.61% 5.81% Lippo Karawacki Indonesia 12028 100.00% 9.11% 9.11% Gudang Garam Indonesia 62273 95.53% 9.11% 9.03% Rest of the World 2912 4.47% 7.24% Perushaan Gas Indonesia 3408 100.00% 9.11% 9.11% Semen Indonesia Indonesia 25610 94.90% 9.11%
9.01% Rest of Asia 1351 5.01% 7.23% Europe 25 0.09% 6.97% United Tractor Indonesia 51012 100.00% 9.11% 9.11% Media Nusantra Indonesia 24405 100% 9.11% 9.11% Indosat Indonesia 24085 100% 9.11% 9.11%

Regression beta is 0.422
Intercept in % 0.057%
Adj Beta = (2/3)(0.422) + (1/3) (1) = 0.614
R squared (decimals) = 21.5%
Std error of beta = 0.08 67% confidence: 0.34 (=0.42-‐0.08) to 0.50 (=0.42+0.08) 95% confidence: 0.26 (=0.42-‐2*0.08) to 0.58 (=0.42+2*0.08)
If annualized riskfree rate during period was 1.5%, Jensen’s alpha = 0.057% -‐ (1.5%/52)*(1-‐0.422) = 0.0403%
Using a 6% ERP for mature markets and a current riskfree rate of 1.87%, Expected Return = Riskfree rate + Raw Beta (ERP)
= 1.87% + 0.422 (6%) = 4.40% 15
Based on weekly returns

16
Indonesian Companies: Beta Regression 16
Company Intercept Beta R-‐squared Rf (1-‐Beta) Jensen's alpha (monthy) Jensen's alpha (annual) Std Error of Beta Beta (low) Beta (high) Krakatau Steel -‐0.22% 0.99 21.10% 0.00% -‐0.22% -‐10.87% 0.19 0.61 1.37 Bumi Resources -‐1.68% 1.19 9.30% -‐0.02% -‐1.66% -‐58.16% 0.37 0.45 1.93 Lippo Karawacki -‐0.22% 2.00 46.90% -‐0.10% -‐0.12% -‐6.24% 0.21 1.58 2.42 Gudang Garam -‐0.08% 0.95 24.30% 0.00% -‐0.08% -‐4.32% 0.17 0.61 1.29 Perushann Gas -‐0.22% 1.00 35.80% 0.00% -‐0.22% -‐10.82% 0.13 0.74 1.26 Semen Indonesia -‐0.25% 1.30 44.00% -‐0.03% -‐0.22% -‐10.87% 0.15 1 1.6 United Tractors 0.26% 0.81 19.30% 0.02% 0.24% 13.38% 0.17 0.47 1.15 Media Nusantra -‐0.41% 1.29 32.30% -‐0.03% -‐0.38% -‐18.05% 0.19 0.91 1.67 Indosat -‐0.27% 0.71 15.20% 0.03% -‐0.30% -‐14.37% 0.17 0.37 1.05

17
The best R-‐squared ever? 17

18
What sector is your firm in? Bloomberg sector category
Read the descripEon and make your own judgment
18

19

20

21
Indonesian Companies: Bopom up Betas 21
Marginal tax rate = 25% Company Business Unlevered Beta Total Debt Market Cap D/E RaEo Levered Beta Krakatau Steel Steel 0.7189 IDR 1,529 IDR 408 374.75% 2.74 Bumi Resources Coal & Related Energy 0.9147 IDR 4,228 IDR 216 1957.41% 14.34
Lippo Karawacki Real Estate (General/Diversified) 0.6464 IDR 10,787 IDR 30,001 35.96% 0.82
Gudang Garam Tobacco 0.6725 IDR 15,170 IDR 90,624 16.74% 0.76 Perushann Gas Oil/Gas DistribuEon 0.8332 IDR 2,145 IDR 7,881 27.22% 1.00 Semen Indonesia ConstrucEon Supplies 0.8219 IDR 3,970 IDR 79,779 4.98% 0.85 United Tractors Machinery 0.9581 IDR 2,620 IDR 75,271 3.48% 0.98 Media Nusantra Entertainment 0.8967 IDR 3,376 IDR 29,409 11.48% 0.97 Indosat Telecom. Services 0.6581 IDR 27,279 IDR 20,323 134.23% 1.32

22
Interest coverage raEos
Interest coverage raEo = OperaEng profit/ Interest expense = 17,741/1,441 = 12.10
22
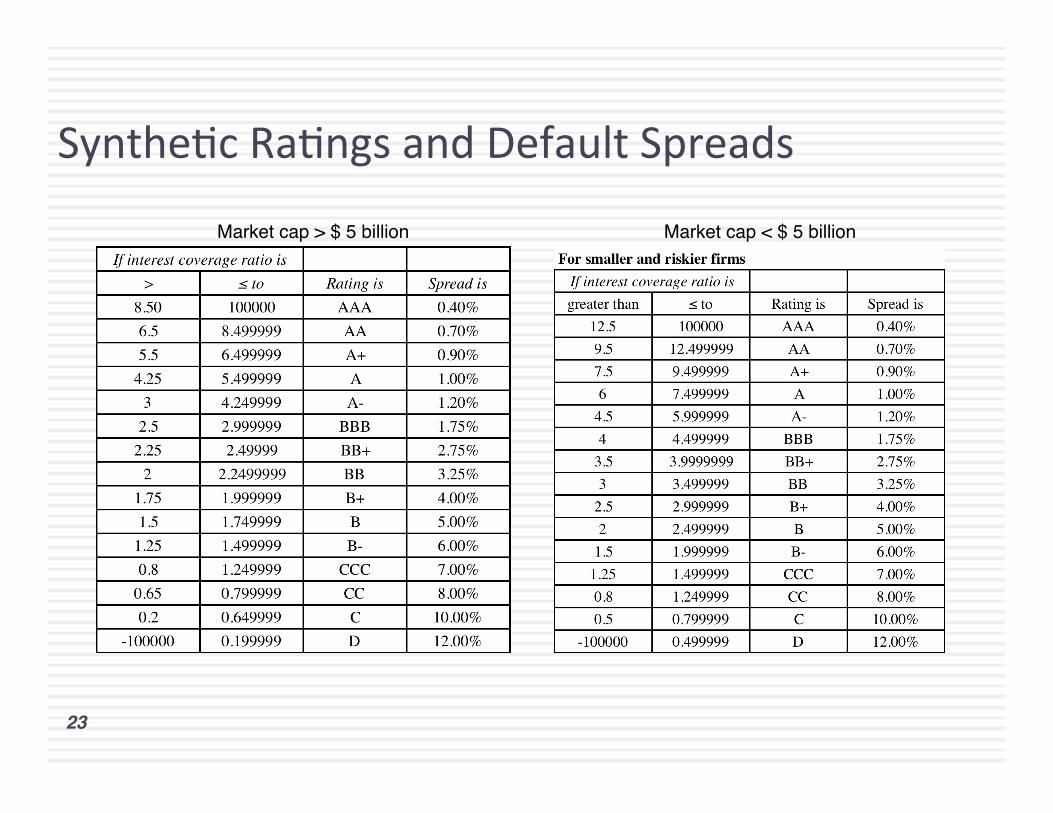
SyntheEc RaEngs and Default Spreads
Market cap > $ 5 billion Market cap < $ 5 billion
23

24
Indonesian Companies: Cost of Debt 24
Indonesian Rupiah Risk free rate 6.11% Default Spread for Indonesia = 2.20% Marginal tax rate = 25.00% Company EBIT Interest Expense Interest coverage raHo Bond RaHng Pre-‐tax cost of debt ASer-‐tax cost of debt Krakatau Steel -‐IDR 115.00 IDR 67.00 -‐1.72 D 20.31% 15.23% Bumi Resources IDR 87.00 IDR 723.00 0.12 D 20.31% 15.23% Lippo Karawacki IDR 3,295.00 IDR 1,356.00 2.43 B 13.31% 9.98% Gudang Garam IDR 8,506.00 IDR 1,488.00 5.72 A-‐ 9.51% 7.13% Perushann Gas IDR 721.00 IDR 90.00 8.01 A+ 9.21% 6.91% Semen Indonesia IDR 6,878.00 IDR 843.00 8.16 A+ 9.21% 6.91% United Tractors IDR 8,595.00 IDR 92.00 93.42 AAA 8.71% 6.53% Media Nusantra IDR 2,611.00 IDR 82.00 31.84 AAA 8.71% 6.53% Indosat IDR 348.00 IDR 2,398.00 0.15 D 20.31% 15.23%

Market value of equity = 66,452.45 M BV of debt = Total Debt = $28,360 M
With a pre-‐tax cost of debt of 3% MV of debt = 1,441 (PV of annuity, 3 years, 3%) + 28,360/ (1.03)3 = $ 30,029 M
PV of operaHng leases at 3% 767/1.03 +519/1.032 +382/1.033 +300/1.034 +202/1.035 +259.5/1.036 +259.5/1.037 = 2,187
25

26
Indonesian Companies: Cost of Capital 26
Company Levered Beta ERP Cost of Equity ASer-‐tax cost of debt Debt/Capital Cost of Capital (Rupiah) Krakatau Steel 2.74 9.11% 31.07% 15.23% 78.94% 18.57% Bumi Resources 14.34 7.94% 119.95% 15.23% 95.14% 20.32% Lippo Karawacki 0.82 9.11% 13.59% 9.98% 26.45% 12.63% Gudang Garam 0.76 9.03% 12.94% 7.13% 14.34% 12.11% Perushann Gas 1.00 9.11% 15.25% 6.91% 21.39% 13.47% Semen Indonesia 0.85 9.01% 13.80% 6.91% 4.74% 13.47% United Tractors 0.98 9.11% 15.07% 6.53% 3.36% 14.78% Media Nusantra 0.97 9.11% 14.98% 6.53% 10.30% 14.11% Indosat 1.32 9.11% 18.14% 15.23% 57.31% 16.47%

27

28

29

Pre-‐tax Return on capital = OperaEng Income/ (BV of Debt last year + BV of Equity last year –Cash last year) = 17741/(22,623+ 55,734-‐6,361) = 24.64% Azer-‐tax Return on capital = Pre-‐tax Return on capital (1-‐ tax rate) = 24.64% (1-‐.4603) = .1330 or 13.30% Tax rate used: EffecEve tax rate (from this page) 30

31
Indonesian companies: ROIC & Return Spreads 31
Company EBIT EffecHve Tax Rate Total Debt Book Equity Cash Invested Capital ROIC Cost of Capital Krakatau Steel -‐IDR 115 0.00% IDR 1,006 IDR 835 IDR 193 IDR 1,648 -‐6.98% 18.57% Bumi Resources IDR 87 25.00% IDR 4,252 -‐IDR 321 IDR 21 IDR 3,910 1.67% 20.32% Lippo Karawacki IDR 3,295 6.34% IDR 9,997 IDR 17,646 IDR 11,640 IDR 16,003 19.28% 12.63% Gudang Garam IDR 8,506 25.01% IDR 18,147 IDR 33,229 IDR 1,588 IDR 49,788 12.81% 12.11% Perushann Gas IDR 721 27.11% IDR 1,892 IDR 2,963 IDR 1,309 IDR 3,546 14.82% 13.47% Semen Indonesia IDR 6,878 20.45% IDR 4,083 IDR 21,804 IDR 4,175 IDR 21,712 25.20% 13.47% United Tractors IDR 8,595 26.10% IDR 2,597 IDR 36,576 IDR 10,610 IDR 28,563 22.24% 14.78% Media Nusantra IDR 2,611 30.56% IDR 3,182 IDR 9,393 IDR 1,132 IDR 11,443 15.84% 14.11% Indosat IDR 348 0.00% IDR 27,872 IDR 14,210 IDR 3,480 IDR 38,602 0.90% 16.47%

32

33

34
Return Spreads Globally in January 2015 34
0.00%
5.00%
10.00%
15.00%
20.00%
25.00%
30.00%
35.00%
40.00%
45.00%
Australia, NZ and Canada
Developed Europe Emerging Markets Japan United States Global
Excess Return (ROC minus Cost of Capital) for firms with market capitalizaHon> $50 million: Global in 2014
<-‐5%
-‐5% -‐ 0%
0 -‐5%
5 -‐10%
>10%

35

36

37

38
Indonesian Companies: OpEmal Debt RaEos 38
Company EBITDA/EV Market Debt to
Capital OpHmal Debt RaHo Change in Value
Krakatau Steel -‐2.75% 78.94% 0.00% 55.19%
Bumi Resources 13.14% 95.14% 0.00% 61.57%
Lippo Karawacki 10.20% 26.45% 10.00% 10.28%
Gudang Garam 9.68% 14.34% 10.00% -‐0.01%
Perushann Gas 11.24% 21.39% 20.00% -‐0.14%
Semen Indonesia 10.31% 4.74% 10.00% 0.44%
United Tractors 19.17% 3.36% 20.00% 1.70%
Media Nusantra 8.87% 10.30% 20.00% 0.91%
Indosat 19.61% 57.31% 0.00% 75.18%

39
Indonesian Companies: Debt RaEos 39
Company EBITDA Debt/EBITDA Market Debt to Capital Industry for comparison Industry Average Debt to Capital (Market) Krakatau Steel IDR 48.00 -‐31.85 78.94% Steel 47.34% Bumi Resources IDR 581.00 7.28 95.14% Coal & Related Energy 35.06%
Lippo Karawacki IDR 2,974.00 3.63 26.45% Real Estate (General/
Diversified) 44.11% Gudang Garam IDR 10,088.00 1.50 14.34% Tobacco 14.43% Perushann Gas IDR 980.00 2.19 21.39% Oil/Gas DistribuEon 34.58% Semen Indonesia IDR 8,204.00 0.48 4.74% ConstrucEon Supplies 32.34% United Tractors IDR 12,900.00 0.20 3.36% Machinery 17.38% Media Nusantra IDR 2,809.00 1.20 10.30% Entertainment 21.67% Indosat IDR 8,654.00 3.15 57.31% Telecom. Services 38.63%

40
Dividend yield and payout 40

41

42

43
Indonesian Companies: Dividend StaEsEcs 43
Company Dividends Net Income Market Cap Dividend Yield Dividend Payout Industry Industry Dividend Yield Industry Dividend Payout Krakatau Steel IDR 0 -‐IDR 146 IDR 408 0.00% NA Steel 3.39% 519.88% Bumi Resources IDR 0 -‐IDR 218 IDR 216 0.00% NA Coal & Related Energy 3.47% 117.15%
Lippo Karawacki IDR 320 IDR 2,653 IDR 30,001 1.07% 12.06% Real Estate (General/
Diversified) 2.03% 26.94% Gudang Garam IDR 1,539 IDR 5,233 IDR 90,624 1.70% 29.41% Tobacco 3.83% 70.95% Perushann Gas IDR 454 IDR 655 IDR 7,881 5.76% 69.31% Oil/Gas DistribuEon 3.50% 138.99% Semen Indonesia IDR 2,427 IDR 5,453 IDR 79,779 3.04% 44.51% ConstrucEon Supplies 2.43% 54.25% United Tractors IDR 1,995 IDR 5,430 IDR 75,271 2.65% 36.74% Machinery 1.74% 36.57% Media Nusantra IDR 263 IDR 1,658 IDR 29,409 0.89% 15.86% Entertainment 1.13% 25.94% Indosat IDR 0 -‐IDR 3,243 IDR 20,323 0.00% NA Telecom. Services 4.05% 61.31%

Net Income 12,345 + Deprecn & Amortzn + 7,742 + Chg in non-‐cash WC + 1,748 + Cap Ex -‐ 14,642 + Inc (Dec) in ST Debt + 0 + Increase in LT Debt + 5,794 -‐ Decrease in LT Debt -‐ 0 = FCFE = 9,491 M Dividends Paid -‐ 3,531 Decrease capital stock -‐11,623 Dividends + Buybacks -‐15,154
EBITDA – OperaEng Income = DepreciaEon & AmorEzaEon 25,443 – 17,741 = 7,742 M
OperaEng Income 17,741 -‐ Taxes = 17741*.4603 = -‐ 8,166 + Deprecn & Amortzn + 7,742 + Chg in non-‐cash WC + 1,748 + Cap Ex -‐ 14,642 = FCFF = 4,423 M
44

45
Post-‐class Analysis
¨ Now that you have the numbers for your company, you should be in a posiEon to make an assessment of where your company stands right now, what it does well, what it does badly and what you would change about it.
¨ Here are some key quesEons to address: I. Stockholder Analysis: Who has the power and what are the potenEal conflicts of interest? II. Risk and Return: How risky is your firm and what are its hurdle rates? III. Investments: How good are exisEng investments and what is the potenEal for the future? IV. Capital Structure Choices: What are the current financing choices? V. OpEmal Financing: What is the opEmal mix of debt and equity for the firm? VI. Financing Changes: Should firm move to opEmal and what type of debt should it use? VII. Dividend Policy: How much and how does the firm return cash to stockholders? VIII. Dividend Assessment: Should the firm return more or less cash to stockholders? IX: ValuaEon (opEonal): What value would you apach to the firm and its equity?
45