Projections of wine grape production and winery...
94
Projections of wine grape production and winery intake to 1994-95
Transcript of Projections of wine grape production and winery...

Projections of
wine grape
production and
winery intake
to 1994-95

Projections of
wine grape
production and
winery intake
Ali Abdalla Peter Connell James Kelly Brian Phillips Wendy Proctor
ABARE RESEARCH REPORT 92.1 7 E ABARE

O Commonwealth of Australia 1992
This work is copyright. The Copyright Act 1968 permits fair dealing for study, research, news reporting, criticism or review. Selected passages, tables or diagrams may be reproduced for such purposes provided acknowledgment of the source is included. Major extracts or the entire document may not be reproduced by any process without the written permission of the Executive Director, ABARE.
ISSN 1037-8286 ISBN 0 642 18477 1
Australian Bureau of Agricultural and Resource Economics GPO Box 1563 Canberra 2601
Telephone (06) 272 2000 Facsimile (06) 272 2001
ABARE is a professionally independent research organisation attached to the Department of Primary Industries and Energy.

Fore word
The Grape and Wine Research Council approached ABARE in 1988 to undertake a three year project preparing annual projections of the production of the principal wine grape varieties in the main producing regions of Australia. Reports on projections of wine grape production were published in 1989, 1990 and 1991. In 1990 the Council asked ABARE to undertake a complementary project which examined the intake by wineries of the principal wine grape varieties. The results of that project were published in August 199 1.
Given the success of these projects in 1991, the Grape and Wine Research and Development Corporation approved a joint project to provide both production and intake projections for wine grapes. Accordingly, this report contains the results of two studies covering projections of wine grape production and winery intake for the years 1992-93 to 1994-95.
BRIAN FISHER Executive Director, ABARE
October 1992

Acknowledgments
The assistance of wineries which took part in the survey of expected intake of wine grapes and which provided details of their plantings and reworkings of grape vines in 1991 is gratefully acknowledged. The assistance of the Winegrape Growers' Council of Australia and the Winemakers' Federation of Australia in providing useful comment on a draft of the report is also acknowledged.
The production projections were prepared by Ali Abdalla and James Kelly, while the winery intake projections were undertaken by Wendy Proctor and Brian Phillips. This study was carried out under the supervision of Peter Connell, manager of the Crops Economics Section.
Research on this project was supported by a grant from the Grape and Wine Research and Development Corporation.

Contents
Summary 1
1 Introduction 10
2 Production projections to 1994-95 Production projections
Projections, by variety Projections, by region Production in Queensland and Tasmania
Reconciling projections with production Plantings
3 Winery intake projections to 1994-95 Background Winery survey Results
Trends in major wine grape varieties Trends in minor wine grape varieties Preferred grape crush in 199 1-92 Winery owned vineyards
4 Conclusions 42
Appendixes A Data for the production projections 48 B Production projections method 5 1 C Production and winery intake of multipurpose grapes 56 D Production of wine grape varieties, by district 58 E Winery intake of wine grapes, by variety and source 74
References 82

Maps 1 Grape producing regions of South Australia 2 Grape producing regions of Victoria 3 Grape producing regions of New South Wales 4 Grape producing regions of Western Australia
Figures A Grape bearing areas in Australia, by category 15 B Grape bearing areas in South Australia, by category 16 C Grape bearing areas in Victoria, by category 16 D Grape bearing areas in New South Wales, by category 17 E Grape bearing areas in Western Australia, by category 17
Tables 1 Changes in grape production over the projection period,
by category 2 2 Grape production in Australia, by region 4 3 Winery grape intake projections, by broad groupings 6 4 Percentages of wine grapes sourced from winery owned
vineyards, by broad groupings 7 5 Changes in grape production, by category 15 6 Grape production in Australia, by variety 18 7 Grape production in Australia, by region 23 8 A comparison of wine grape production projections 26 9 Total grape vine cuttings planted or reworked in 1989,
1990 and 1991, by variety and state 28 10 Grape vine rootstocks of selected non-Vitis vin$era
varieties planted in 1989, 1990 and 19991, by state 29 1 1 Australian domestic wine sales and imports, by product 32 12 Australian wine exports, by type and destination 33 13 Winery grape intake projections, by broad groupings 35 14 Wine grape intake projections for major varieties 36 15 Comparison of 1991 and 1992 winery grape intake surveys 38 16 Winery grape intake projections for minor varieties 39

17 Wine grapes sourced from winery owned vineyards, by broad groupings 4 1
18 Changes in projected production and winery grape intake between 1991-92 and 1994-95, by selected grape variety 45
19 Percentage use of multipurpose grapes for wine making, by region 57
20 Grape production in the Barossa district of South Australia 58 2 1 Grape production in the Central district of South Australia 59 22 Grape production in the Northern district of South Australia 60 23 Grape production in the South-East district of South
Australia 6 1 24 Grape production in the North Murray district of South
Australia 62 25 Grape production in the South Murray district of South
Australia 63 26 Grape production in the Waikerie-Lower Murray district of
South Australia 64 27 Grape production in the Kerang-Swan Hill district of
Victoria 65 28 Grape production in the Sunraysia district of Victoria 66 29 Grape production in the rest of Victoria 67 30 Grape production in the Hunter Valley district of New
South Wales 68 3 1 Grape production in the Murrumbidgee Irrigation Area of
New South Wales 69 32 Grape production in the Sunraysia district of New
South Wales 70 33 Grape production in the rest of New South Wales 71 34 Grape production in the Swan Shire of Western Australia 72 35 Grape production in the rest of Western Australia 73 36 Winery grape intake, by source of grapes and variety,
major varieties, 1991 -92 74 37 Winery grape intake, by source of grapes and variety,
major varieties, 1992-93 75
- - -
vii

-
38 Winery grape intake, by source of grapes and variety, major varieties, 1993-94 76
39 Winery grape intake, by source of grapes and variety, major varieties, 1994-95 77
40 Winery grape intake, by source of grapes and variety, minor varieties, 199 1-92 78
41 Winery grape intake, by source of grapes and variety, minor varieties, 1992-93 79
42 Winery grape intake, by source of grapes and variety, minor varieties, 1993-94 80
43 Winery grape intake, by source of grapes and variety, minor varieties, 1994-95 81
viii
Summary
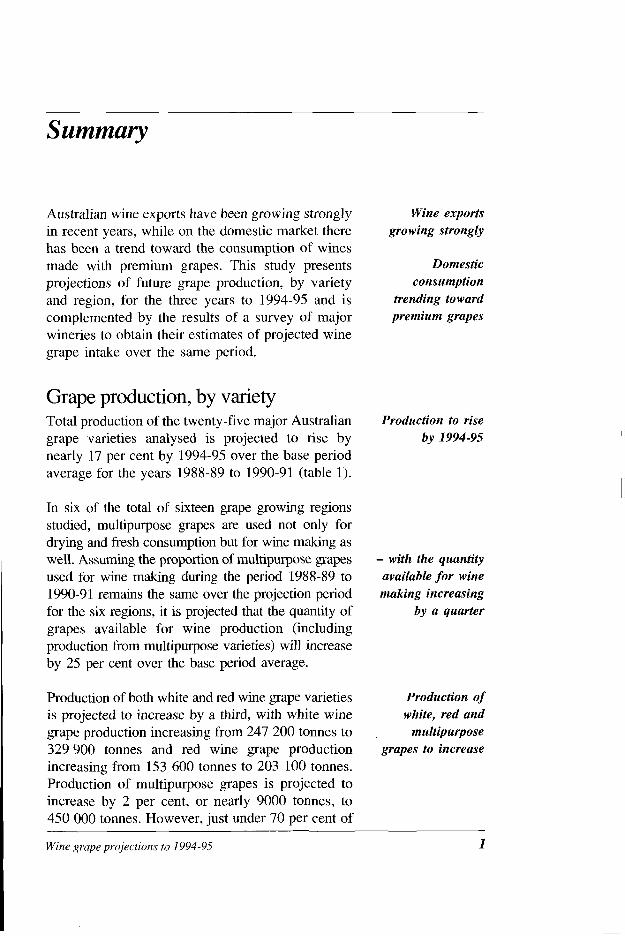
Australian wine exports have been growing strongly Wine exports in recent years, while on the domestic market there growing strongly has been a trend toward the consumption of wines made with premium grapes. This study presents Domestic projections of future grape production, by variety consumption and region, for the three years to 1994-95 and is trending toward complemented by the results of a survey of major premium grapes wineries to obtain their estimates of projected wine grape intake over the same period.
Grape production, by variety Total production of the twenty-five major Australian Production to rise grape varieties analysed is projected to rise by by 1994-95 nearly 17 per cent by 1994-95 over the base period average for the years 1988-89 to 1990-91 (table 1).
In six of the total of sixteen grape growing regions studied, multipurpose grapes are used not only for drying and fresh consumption but for wine making as well. Assuming the proportion of multipurpose grapes - with the quantity used for wine making during the period 1988-89 to available for wine 1990-91 remains the same over the projection period making increasing for the six regions, it is projected that the quantity of by a quarter grapes available for wine production (including production from multipurpose varieties) will increase by 25 per cent over the base period average.
Production of both white and red wine grape varieties Production of is projected to increase by a third, with white wine white, red and grape production increasing from 247 200 tonnes to multipurpose 329 900 tonnes and red wine grape production grapes to increase increasing from 153 600 tonnes to 203 100 tonnes. Production of multipurpose grapes is projected to increase by 2 per cent, or nearly 9000 tonnes, to 450 000 tonnes. However, just under 70 per cent of
Wine grape projections to 1994-95 1

the production of multipurpose grapes is likely to be channelled to the dried vine fruit and table grape markets.
Production of non- While production of non-premium white and red premium varieties wine grape varieties in 1994-95 is projected to fall to fall (by nearly 12 per cent and 10 per cent respectively),
production of premium varieties is projected to increase by around 50 per cent over base period averages. In tonnage terms, production increases of 92 400 and 53 900 tonnes are projected for premium white and red grapes respectively.
1 Changes in grape production over the projection period, by category
White wine grapes
Premium a Non-premium b Total
Red wine grape
Premium c Non-premium d Total
Multipurpose grapes e for winemaking
Total grapes for winemaking
Multipurpose grapes e for drying and table
Total
Average 1988-89
to 1990-91 Projected
1994-95 Change in production
t %
a Chardonnay, chenin blanc, colombard, rhine riesling, sauvignon blanc, semillon, traminer and verdelho. b Crouchen, doradillo, muscadelle, muscat blanc, palomino and trebbiano. c Cabemet sanvignon, merlot, malhec, pinot noir and shiraz. d Grenache and mataro. e Muscat gordo blanco, muscat hamburgh, sultana and waltham cross. Note: For a detailed description of this classification see Abdalla, Kelly and Proctor (1991).
2 ABARE research report 92.1 7
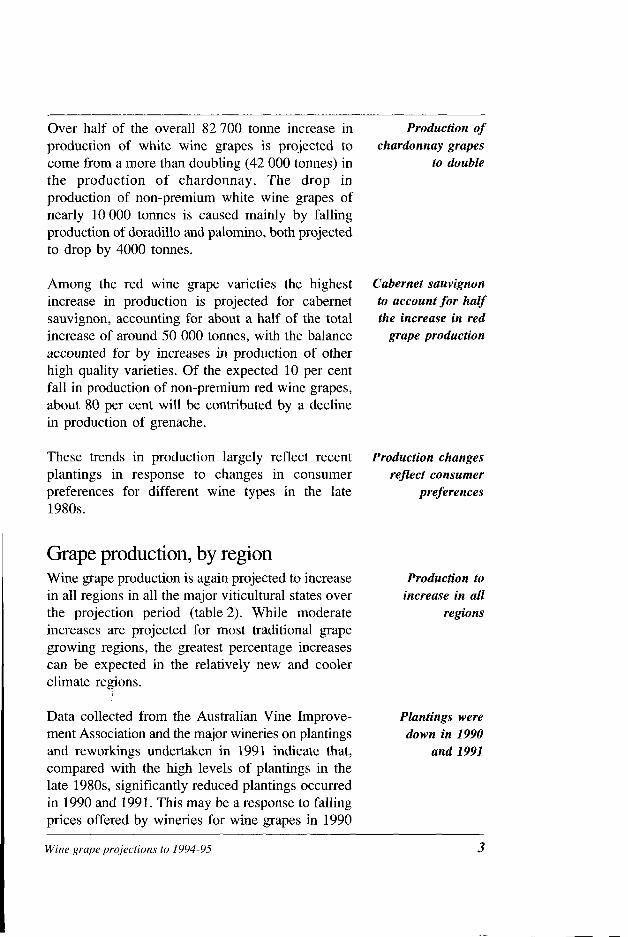
Over half of the overall 82 700 tonne increase in Production of production of white wine grapes is projected to chardonnay grapes come from a more than doubling (42 000 tonnes) in to double the production of chardonnay. The drop in production of non-premium white wine grapes of nearly 10 000 tonnes is caused mainly by falling production of doradillo and palomino, both projected to drop by 4000 tonnes.
Among the red wine grape varieties the highest Cabernet sauvignon increase in production is projected for cabernet to account for half sauvignon, accounting for about a half of the total the increase in red increase of around 50 000 tonnes, with the balance grape production accounted for by increases in production of other high quality varieties. Of the expected 10 per cent fall in production of non-premium red wine grapes, about 80 per cent will be contributed by a decline in production of grenache.
These trends in production largely reflect recent Production changes plantings in response to changes in consumer reflect consumer preferences for different wine types in the late preferences 1980s.
Grape production, by region Wine grape production is again projected to increase Production to in all regions in all the major viticultural states over increase in all the projection period (table 2). While moderate regions increases are projected for most traditional grape growing regions, the greatest percentage increases can be expected in the relatively new and cooler climate regions.
Data collected from the Australian Vine Improve- Plantings were ment Association and the major wineries on plantings down in 1990 and reworkings undertaken in 1991 indicate that, and 1991 compared with the high levels of plantings in the late 1980s, significantly reduced plantings occurred in 1990 and 199 1. This may be a response to falling prices offered by wineries for wine grapes in 1990
Wine grape projections to 1994-95 3

2 Grape production in Australia, by region
Wine grapes South Australia Barossa Central Northern South East North Murray South Murray Waikerie-Lower Murray
Average 1988-89
to 1990-91
Total 316 443
Victoria Kerang-Swan Hill 22 847 Sunraysia 49 676 Rest of Victoria 17 199
Total 89 722
New South Wales Hunter Valley 19 807 Murrumbidgee Irrigation Area 81 908 Sunraysia 15 839 Rest of New South Wales 10 174
Total 127 728
Western Australia Swan Shire 3 085 Rest of Western Australia 6 719
Total 9 804
Total grapes for wine 543 697
Drying and table
South Australia North Murray 12 965 South Murray 3 426 Waikerie-Lower Murray 1 302
Total 17 693
Change in Projected 1994-95
from base 1992-93 1993-94 1994-95 average
t t t %
(Continued on next page) - - -
ABARE research report 92.1 7

Victoria Kerang-Swan Hill Sunraysia
Total
New South Wales Sunraysia
Total drying and table
Total
Average 1988-89
to 1990-91
Change in Projected 1994-95
from base 1992-93 1993-94 1994-95 average
and the buildup in stocks held by wineries. If this trend of reduced plantings continued over the next few years, there would be successively lower rates of production growth in the second half of the 1990s.
Winery intake In order to compare the production projections with Major wineries anticipated intake of wine grapes, a survey of the surveyed major wineries, which at present produce over 85 per cent of Australia's wine, was undertaken. Wineries were asked to provide details on a varietal basis of their 1991-92 season's grape intake, what they would have preferred to have crushed in that season, and estimates of what they think they will be crushing over the three seasons to 1994-95.
Total wine grape intake by these major Australian Intake to rise by wineries in 1994-95 is projected to be 10 per cent 10 per cent (54 300 tonnes) higher than in 1991-92 (table 3). Unlike the production projections, it was not possible to present these projections on a regional basis.
Wine grape projections to 1994-95 5

Many wineries, particularly the larger winery groups, source their grapes and even grape juice, from a variety of regions depending on seasonal conditions and availabilities.
Trend to premium The trend evident in recent years in both domestic varieties expected and export wine consumption toward wines made to continue from premium grape varieties is projected to
continue. The use of varieties in the premium red wine grape category (notably shiraz and cabernet sauvignon) is projected by the wineries to increase by 28 per cent (29 800 tonnes) between 1991-92 and 1994-95. For the premium white category, use is projected to increase by 25 per cent (39 900 tonnes), with most of this growth expected to come from increased demand for chardonnay.
3 Winery grape intake projections, by broad groupings a
Projected Actualpreferred
1991-92 1991-92 1992-93 1993-94 1994-95 t t t t t
White wine grapes Premium white b 159 062 179 900 179 114 189 332 198 915 Non-premium white c 65 203 61 255 59 589 57 521 55 965 Minor white 9 787 6 658 8 964 8 636 8 582 Total 234 052 247 813 247 667 255 489 263 462
Red wine grapes Premium red d 106 486 108 894 117 282 126 971 136 297 Non-premium red e 38 126 37 609 40 148 41 039 40 804 Minor red 12 497 11 133 12 213 13 320 14 347 Total 157 109 157 636 169 643 181 330 191 448
Multipurpose f 145 022 137 716 135 693 137 393 135 583
Total 536 183 543 166 553 003 574 212 590 493
Change in 1994-95 from
1991-92 actual %
a For the purpose of this table, these varietal groupings have been made consistent with those in the production projections. b Chardonnay, chenin blanc, colombard, rhine riesling, sauvignon blanc, semillon, trarniner and verdelho. c Crouchen, doradillo, muscadelle, muscat blanc, palomino, pedro and trebbiano. d Cabernet sauvignon, merlot, malbec, pinot noir and shiraz. e Grenache and mataro. f Muscat gordo blanco, muscat hamburgh, sultana and waltham cross. Note: Projections are based on planned grape intake by the wineries surveyed.
6 ABARE research report 92.1 7

Intake of non-premium white and multipurpose Intake of non- grapes are expected to decline by 14 per cent and premium varieties 7 per cent respectively, while intake of non-premium to fall red varieties is expected to increase by 7 per cent. Discussions with wine makers pointed to the expected growth in the export market as the main factor underlying projections of growth in the use of specific wine grape varieties.
Winery owned vineyards From the survey results, it is estimated that Wineries source 22 approximately 22 per cent of grapes crushed in per cent of intake 199 1-92 were sourced from winery owned vineyards from their own (table 4) . Wineries source a much higher proportion vineyards (over 30 per cent) of their premium grape require- ments from their own vineyards. The proportions are much lower for the multipurpose (5 per cent), non-premium white (around 16 per cent) and non- premium red (around 11 per cent) grape categories.
Over the projection period the proportion of premium Sourcing white grape production coming from winery owned proportions to vineyards is expected to decline from 34 per cent in remain fairly static 1991-92 to 31 per cent in the projection years. The to 1994-95
4 Percentages of wine grapes sourced from winery owned vineyards, by broad groupings a
1991-92 1992-93 1993-94 1994-95 % % % %
Premium white b Premium red c Multipurpose d Non-premium white e Non-premium red f
Total 22 22 22 22
a These varietal groupings have been made consistent with those in the production projections. b Chardonnay, chenin blanc, colombard, rhine riesling, sauvignon blanc, semillon, trarniner and verdelho. c Cabemet sauvignon, malbec, merlot, pinot noir and shiraz. d Muscat gordo blanco, sultana and waltham cross. e Crouchen, doradillo, muscadelle, muscat blanc, palomino, pedro and trebbiano. f Grenache, mataro and muscat hamburgh.
Wine grape projections to 1994-95 7

winery owned proportion of premium red grapes is expected to remain steady at 32 per cent over the period 199 1-92 to 1994-95. Wineries expect grape production from their own vineyards to increase sufficiently over the next three years for the proportion of non-premium and multipurpose grapes sourced externally to remain relatively constant over the period to 1994-95.
Comparisons with earlier survey of wineries 1991-92 grape A comparison of the grape intake estimates made crush bigger than by the wineries which were surveyed in both 1991 expected in 1991 and 1992 was undertaken. For those wineries
surveyed in 1991, the total grape crush was projected to be 432 000 tonnes in 1991-92. Those wineries now indicate that their 1991-92 grape crush was 456 000 tonnes. The improvement in domestic sales and expansion in exports over the year, which has resulted in a reduction in the large stocks that wineries reported in the 1991 survey, appear to have changed wineries' perceptions of the market outlook.
Comparing production and intake projections
Projections indicate While direct comparisons of the production and differences between winery intake projections are not possible, production and modification of the production projections were planned intake undertaken to arrive at projections for 199 1-92.
Projections of the availability of grapes for wine making indicate a significant increase (nearly 17 per cent) in the total production of grapes available for wine making over the period 1991-92 to 1994- 95. Over the same period the planned grape intake by wineries is expected to increase by around 10 per cent. Thus, on this broad basis it would appear that differences between availabilities and currently planned intake by the wineries are likely over the projection period. However, a closer look at the
8 ABARE research report 92.17
variety groupings shows that these differences arise largely in the non-premium white and the multipurpose grape categories.
A projected 28 per cent increase in production of premium white grape varieties will be matched by a 25 per cent increase in intake by wineries; a 28 per cent increase in intake for premium red wine grapes should be met from a projected 30 per cent increase in production of premium red grapes. However, the surplus premium red grape production could be used to meet a potential shortfall in projected requirements for non-premium red grapes.
While production of non-premium white grapes is projected to decline by 3 per cent, intake by wineries is projected to decline by 14 per cent. Similarly, while production of multipurpose grapes is forecast to remain largely unchanged, intake by wineries is projected to decline by 7 per cent. Given market competition between grape buyers and sellers, this would indicate that grape prices for the non-premium and multipurpose grape categories will be under downward pressure over the projection period.
- mainly for non- premium varieties
Premium grape production and
intake projections are closer
Falling intakes of non-premium and
multipurpose grapes indicate
downward pressure on prices
Wine grape projections to 1994-95

There has been a major turnabout in the outlook for the Australian wine industry. After declining in recent years, domestic sales of Australian wines increased in 1991-92. In the 1991-92 financial year, domestic sales reached 315 million litres, an increase of over 6 per cent on sales in 1990- 91. As well, wine exports have continued to expand, increasing by 36 per cent in 1991-92.
In the light of this increase in sales of wine, it is important for growers to have information available on both the varieties and quantities of grapes that wineries will require in future years so that they can better plan their annual decisions on plantings, and reworking and grubbings or removal of existing vines. Similarly, wine makers require information about the likely future wine grape production so that they can better plan their future vintages.
ABARE has been producing wine grape projections for over three years under previous arrangements with the Grape and Wine Research Council and now the Grape and Wine Research and Development Corporation. Wine grape production projections were released by ABARE in 1989, 1990 and 1991. In 1991, a separate wine grape intake projections report was released for the first time.
In this report, detailed production and intake projections are presented for grapes available for wine production for the three years 1992-93, 1993-94 and 1994-95. The production projections are based on the detailed area and production statistics collected each year from growers by the Australian Bureau of Statistics as part of their annual census of the viticulture industry. Future wine grape production has been estimated on the basis of past plantings of grape vines, assumptions of when vines reach a commercial bearing age and what the future pattern of grubbings of diseased, dead or unwanted vines will be in order to determine bearing areas of grapes over the projection period.
An econometric analysis was undertaken to estimate future yields for each variety on a regional basis. Projections of production were then estimated by multiplying the area estimates by the yield estimates. The production
-
10 ABARE research report 92.1 7

projections are based on assumptions of a continuation of current industry policies and normal seasonal conditions, and represent estimates of future grape supplies that will be available to wine makers.
To provide some indication of production beyond the projection period, information was collected from the Australian Vine Improvement Association (AVIA) on sales of cuttings and rootstocks made to growers and wineries in 1991. As the major wineries also undertake their own vine propagation programs, ABARE surveyed these wineries separately to obtain details of their plantings and reworkings not included in the AVIA data.
Projections of future winery grape intake are made from a survey of the major wineries, which at present produce over 85 per cent of Australia's wine. Wineries were asked to provide details on a varietal basis of their 1991-92 season's grape intake, what they would have preferred to have crushed this season, and estimates of what they think they will be crushing over the three seasons to 1994-95. They were also asked to indicate whether the grapes crushed would be sourced from their own vineyards or purchased from other vineyards.
Detailed production and winery intake projections, including regional production projections, by variety, are presented in the following two chapters of this report. Because of the different methods used in the two projection exercises, it is not possible to compare the results of the two exercises directly. However, a reconciliation of the two studies has been attempted and implications for the wine grape and wine industries are presented.
Wine grape projections to 1994-95 11

Production projections to 1994-95
The objective of ABARE's wine grape production projections has been to provide information to grape growers to help them make their annual decisions on planting and grubbings and to assist wine makers to plan their future vintages. The current exercise provides initial projections for 1994-95 and revised projections for 1992-93 and 1993-94 for the 25 major varieties in sixteen grape growing regions (see appendix A). These regions account for more than 95 per cent of the grape production available in Australia for wine making in recent years.
Each year, ABARE has attempted to refine and improve the analysis wherever possible, drawing on the comments received on previous publications and providing more information where possible. With the increased incidence of grafting cuttings onto rootstock, the age at which grapes begin to bear harvestable quantities of fruit appears to be decreasing. Therefore, in this study, an average bearing age of four years is assumed, compared with a bearing age of six years used in the previous analyses. The lower assumption for bearing age has no significant implications for the projections obtained in last year's study (see appendix B).
This year, an attempt has been made to allocate the projected production of multipurpose grape varieties between wine making and other end uses (drying and table) on the basis of the proportions in which multipurpose grapes were used in the six relevant regions in the three years to 1990-91 (see appendix C).
Again in this year's study, data on the propagation of cuttings and rootstock, by variety, undertaken during the previous year are presented. This information provides the industry with additional information on longer term trends in grape production beyond the projection period, as any vines planted in 1991 will not reach commercial bearing age until after 1994-95. The results of a survey undertaken of vine improvement societies and major wineries have been included.
The Australian Vine Improvement Association (AVIA) provided details of sales of cuttings and rootstocks from vine improvement societies to growers and wineries in South Australia, Victoria and New South Wales
12 ABARE research report 92.1 7

during 1991. Many major wineries, however, undertake their own vine propagation programs, and so ABARE surveyed these wineries separately to obtain details of the plantings and reworkings of cuttings and rootstocks carried out by the wineries which were not included in the AVIA data. The wineries included in the survey contribute over 85 per cent of total Australian wine production.
Production projections Production projections for wine grapes are obtained using the method developed in previous studies. First, future bearing areas of grapes during the projection period are estimated. These estimates are based largely on plantings in previous years and the assumption that the rates of grubbing undertaken over the past three seasons will prevail during the projection period. This assumption on the rate of grubbing implicity implies that growers are not reacting to any wine grape price signals provided by wineries over the projection period. Second, future yields of each variety in each of the sixteen regions examined are estimated using a separate econometric equation for individual varieties in each region. (As data for merlot and malbec varieties are not available for a sufficient length of time to enable the application of this technique, their annual average yield over the period of available data was used). Third, bearing area and yield are multiplied together to produce production projections.
The analysis in this study is based on data collected and published each year in Viticulture, Australia, by the Australian Bureau of Statistics. Discussion of the data used in the study is provided in appendix A, while a description of the forecasting method used is given in appendix B. Appendix D contains detailed regional production projections for the major grape varieties.
In projecting future yields, average seasonal conditions are assumed to prevail for the duration of the projection period. Also, the grape tonnages provided are defined as those grapes available to wine makers and therefore include production from the four multipurpose grape varieties, muscat gordo blanco, muscat hamburgh, sultana and waltham cross. In six of the regions studied, multipurpose grapes are also used for both drying and table grape purposes. It is unrealistic to assume that all of multipurpose grape production will be available for wine making. Therefore an attempt was made to allocate a proportion of multipurpose grape production to wine making purposes.
-
Wine grape projections to 1994-95

For the six regions where multipurpose grapes are also used for both drying and table grape purposes, the average proportion of multipurpose grapes used for wine making over the three years 1988-89 to 1990-91 is assumed to be maintained throughout the projection period. For all other regions, it is assumed that all multipurpose grapes will be used for wine making (see appendix C for more details). However, it should be noted that future allocations of grapes will be determined mainly by the relative returns from the available markets during the year. In 1990-91, wine makers used about 83 per cent of the total production of muscat gordo blanco, 12 per cent of sultana and 18 per cent of waltham cross grapes.
Projections, by variety It would have been preferable to have been able to compare the production and winery intake projections from the same base period, which in the winery intake projections was from 1991-92 to 1994-95. However, ABS data, on which the production projections are based, will not be available for 1991-92 until later in 1992. Rather than use the most recent year for which statistics are available (1990-91), which may have been influenced by seasonal factors, average actual production in the three most recent years (1988-89 to 1990-91) was used throughout this report as the base for comparison between current and projected levels of production.
Australian grape production in 1994-95 is projected to rise by 140 900 tonnes, or nearly 17 per cent, from the annual average level of production for the period 1988-89 to 1990-91 (table 5). Grapes available for wine making in 1994-95 are forecast to increase by nearly 135 500 tonnes (or 25 per cent) over the base period.
Over ,the past decade, signals of shifts in the consumption of different types of wine in favour of wines produced from premium grape varieties (as described in Barnes 1990) have filtered back to growers and have been reflected in grape prices offered to growers. Growers' responses to these signals are reflected in changes in the pattern of bearing areas of different grape categories over the past ten years (figure A for Australia, and figures B to E for individual states).
As a group, the premium white wine grapes have shown the largest and most consistent increase in bearing areas of vines since the early 1980s. Bearing areas of premium red wine grapes declined gradually until around 1987-88 but have since increased.
14 ABARE research report 92.1 7

A Bearing area, by grape category, Australia
I
I Projected \ I i ABARE
20 Multipurpose
5 Changes in grape production, by category
Average 1988-89 Projected Changes in
to 1990-91 1994-95 production
White wine grapes Premium a 163 200 255 600 92 400 56.6 Non-premium b 84 000 74 300 -9 700 -1 1.5 Total 247 200 329 900 82 700 33.5
Red wine grape Premium c Non-premium d
Total
Multipurpose grapes e for winemaking 143 000 146 300 3 300 2.3
Grapes for winemaking
Multipurpose grapes e for drying and table grapes 298 600 304 000 5 400 1.8
Total 842 400 983 300 140 900 16.7
a Chardonnay, chenin blanc, colombard, rhine riesling, sauvignon blanc, semillon, traminer and verdelho. b Crouchen, doradillo, muscadelle, muscat blanc, palomino, and trebbiano. c Cabemet sauvignon, merlot, malbec, pinot noir and shiraz. d Grenache and mataro. e Muscat gordo blanco, muscat hamburgh, sultana, waltham cross. Note: For a detailed description of this classification see Abdalla, Kelly and Proctor (1991).
Wine grape projections to 1994-95 15

Over the same period, the bearing areas of both the red and white non- premium grape categories and multipurpose grapes declined. The effects of a government supported vine pull scheme, which contributed to reductions in bearing areas in the mid-1980s, were detailed in Kaine and Gow (1991) and briefly described in Abdalla, Kelly and Proctor (1991).
These trends in bearing areas are forecast to continue for the various categories of wine grapes defined here. By the end of the projection period, production of white wine grapes is projected to increase by 82 700 tonnes from the average level over the period 1988-89 to 1990-91. As a result, white wine grapes will comprise around a third of total grape production, compared with an average of 29 per cent in the base period, and will comprise nearly half the grapes available for wine making.
B Bearing area, by grape category, South Australia
I Projected I
rCPsearing area, by grape category, Victoria
I
Multipurpose I Projected I
E ABARE
12 - / __r
I I I
16 ABARE research report 92.1 7

Projections of production, by variety, are given in table 6. Significant increases are projected in chardonnay production (up 42 100 tonnes by 1994-95 from the base period average), semillon (up 13 150 tonnes), colombard (up 10 100 tonnes), chenin blanc (up 8700 tonnes), sauvignon blanc (up 8400 tonnes) and rhine riesling (up 8300 tonnes).
Production of most of the lower quality varieties of white wine grapes is projected to fall. These include doradillo and palomino (each down 4000 tonnes), trebbiano (down 1400 tonnes) and crouchen (down 800 tonnes).
Over the same period total production of red wine grapes is projected to rise by nearly 50 000 tonnes. Red grape varieties should account for around 30 per cent of wine grape availabilities by 1994-95 compared with
I D Bearing area, by grape category, New South Wales
Bearing area, by grape category, Western Australia l 2
I
I Projected 1 .o E ABARE
I /
0.2 -Nan-premium white MulfiPur~ose - - - _ _ _ NO*-premium red - - - - _ - - - - - I - - - - - - - - -
'000 ha - - - - - - - - - - - -'- - - - - 4 -1: - - - - - - - I I I I 1 1
1982 1984 1986 1988 1990 1992 1994 -83 -85 -87 -89 -9 1 -93 -85
Wine grape projections to 1994-95 17

6 Grape production in Australia, by variety a
Average 1988-89
to 1990-91
Projected Change in 1994-95 from base average
Wine grapes Cabemet sauvignon Chardonnay Chenin blanc Colombard Crouchen Doradillo Grenache Malbec Mataro Merlot Muscadelle Muscat blanc Muscat gordo blanco Muscat hamburgh Palomino Pinot noir Rhine riesling Sauvignon blanc Semillon Shiraz Sultana Traminer Trebbiano Verdelho Waltham cross
Total wine grapes
Drying and table Muscat gordo blanco Muscat hamburgh Sultana Waltham cross
Total drying and table
Total
a Excludes Tasmania and Queensland.
18 ABARE research report 92.1 7

the base years average of 28 per cent. Significant increases in some of the premium red wine grape varieties are projected by 1994-95.
Estimated future increases in bearing areas of premium red grape varieties evident in figures A-E underline a resurgence in the production of these varieties during the projection period. Large increases in production of both cabernet sauvignon (up 25 800 tonnes) and shiraz (up 15 600 tonnes) are projected for the period to 1994-95. The big increase in production projected for cabernet sauvignon reflects the large increase in area planted since 1988. These new areas are likely to have started to come into commercial production in 1991-92.
A significant increase in pinot noir production, of 8000 tonnes, is also forecast. Production of merlot is projected to more than double by 1994- 95; however, with small production bases, tonnage increases for both merlot and malbec will be small (4200 tonnes and 400 tonnes respectively). The increase in production of these varieties is probably a reflection of recent trends in consumer demand in Australia towards 'ready to drink' red wines, as the addition of merlot or malbec grapes to some of the 'heavier' wine grape varieties softens the flavour of the wine and reduces the extent of cellaring required, consequently reducing costs incurred by wineries in holding stocks.
Production of the lower quality red wine grape varieties is projected to fall by 4400 tonnes or about 10 per cent. A fall of 11 per cent, or 3700 tonnes, is projected for grenache and 6 per cent, or 600 tonnes, is projected for mataro.
The total production of multipurpose grape varieties - muscat gordo blanco, sultana, waltham cross and muscat hamburgh - is projected to increase by only 8700 tonnes to 450 000 tonnes. It is assumed that a third of the projected increase will go into wine making. The share of total grape production held by multipurpose grapes is projected to decline from an average of 52 per cent over the period 1988-89 to 1990-91 to about 46 per cent by the end of the projection period. This result mainly reflects the relatively modest increase in the main variety, sultana, of 3 per cent to 352 100 tonnes and the projected fall in the production of waltham cross and muscat gordo blanco of 9 per cent and 1 per cent respectively to 11 000 tonnes and 86 000 tonnes. Based on the assumption that the proportion of multipurpose grape production used for wine making remains the same as the average over the period 1988-89 to 1990-91, the share of
- - - - -
Wine grape projections to 1994-95 19
multipurpose grapes used in wine making is projected to decline from 26 per cent to 22 per cent.
Projections, by region Wine grapes are grown in all states of Australia. South Australia is the main producing state, with 92 per cent of its total production in 1990-91 used for wine making. Although Victoria has about the same quantity of grapes available for wine making as South Australia, a much higher proportion of these are used in the drying market (about 70 per cent in 1990-91). In the same season, 67 per cent of total grape production in New South Wales was used for wine making.
Among the states, the highest percentage increase in total grape production is forecast for Western Australia (91 per cent). The percentage increases in the other states are lower - New South Wales (22 per cent), South Australia (20 per cent) and Victoria (12 per cent) (table 7). Parallel percentage increases in production of grapes for wine production in the latter three states are projected at 30 per cent, 21 per cent and 24 per cent respectively. In absolute terms, the major wine producing states of South Australia and New South Wales are expected to increase wine grape production by 67 500 tonnes and 38 600 tonnes respectively, accounting for over three quarters of the total projected production increase.
Maps of the major wine producing regions covered in this study appear on the following pages. Increased grape production is projected to 1994- 95 for all regions of Australia. The largest percentage increases are expected to be in what is termed the 'rest' of Western Australia (1 16 per cent), the Hunter Valley of New South Wales (71 per cent), the 'rest' of New South Wales (67 per cent), the 'rest' of Victoria (60 per cent) and the Northern and Central districts of South Australia (47 per cent and 46 per cent respectively).
Consistent with the trends in bearing areas of different types of wine grapes discussed above, it can be seen from the tables presented in appendix D that the regions showing the largest projected increases in grape production are those growing the premium varieties of grapes. The main grape varieties grown in the 'rest' of Western Australia are cabernet sauvignon, chardonnay and rhine riesling, while the main grapes produced in the Hunter Valley are chardonnay and semillon.
20 ABARE research report 92.1 7

Map 1: Grape producing regions of South Australia
1 Map 2: Grape producing regions of Victoria I
1 Victorian Sunraysia 2 Kerang-Swan Hill
3 Rest of Victoria
/ Glenrowan
Wine grape projections to 1994-95 21

/ Map 3: Grape producing regions of New South Wales
Upper Hunter ' Scone ' Singleton Mudgee & 1 A
L
Q Kyalite yon 1
I Corowa
1 Hunter Valley 2 Murrumbidgee Irrigation Area
3 New South Wales Sunraysia
4 Rest of New South Wales \
1 Map 4: Grape producing regions of Western Australia
22 ABARE research report 92.1 7

7 Grape production in Australia, by region
Average Projected Change in 1988-89 1994-95 from
to 1990-91 1992-93 1993-94 1994-95 base average
Wine grapes South Australia Barossa 52 348 58 000 61 200 64 200 23 Central 30 167 37 300 41 000 44 000 46 Northern 14134 18100 19700 20800 47 South East 44 336 52 800 56 300 60 500 37 North Murray 86 330 89 400 91 200 93 700 9 South Murray 34 783 37 000 37 500 37 500 8 Waikerie-Lower Murray 54 345 58 000 60 300 62 600 15
Total 316 443 350 600 367 200 383 300 2 1
Victoria Kerang-Swan Hill 22 847 25 700 26 200 26 400 16 Sunraysia 49 676 56 300 56 600 57 600 16 Rest 17 199 23 400 25 300 27 600 60
Total 89722 105400 108100 111600 24
New South Wales Hunter Valley 19 807 29 800 31 200 33 900 7 1 Munumbidgee Irrigation Area 81 908 89 800 93 400 98 100 20 Sunraysia 15839 16100 16400 16700 5 Rest 10174 13400 15400 17000 67
Total 127 728 149 100 156 400 165 700 30
Western Australia Swan Shire 3 085 4 000 4 200 4 200 36 Rest 6 719 12 700 14 000 14 500 116
Total 9804 16700 18200 18700 91
Total grapes for wine 543 697 621 800 649 900 679 300 28
Drying and table South Australia North Murray 12965 13400 13400 13400 4 South Murray 3 426 3 700 3 700 3 700 8 Waikerie-Lower Murray 1 302 1 200 1 200 1 200 -8
Total 17693 18300 18300 18300 3
(Continued on next page)
Wine grape projections to 1994-95 23

Victoria Kerang-Swan Hill Sunraysia
Total
New South Wales Sunray sia
Total drying and table
Total
Average 1988-89
to 1990-91
Projected
1992-93 1993-91 1994-95
Change in 1994-95 from base average
Increases in bearing areas are more pronounced in the relatively new regions, termed 'rest' of state, in Victoria, New South Wales and Western Australia and the cool climate areas of New South Wales and the Northern and the Central regions of South Australia. In the traditional grape growing regions, where bearing areas remain more or less stable, there does appear to have been a shift in emphasis away from the non-premium varieties with these being grubbed and replaced or reworked with the premium varieties.
The Sunraysia regions in both New South Wales and Victoria are projected to register the lowest percentage increases in grape production by 1994-95 (up by 2 per cent and 4 per cent respectively), followed by the Kerang-Swan Hill region of Victoria where production is projected to rise by 10 per cent, but most grapes produced in these regions are used for dried vine fruit production. Projections of the quantities of production to be used for wine making and for drying and table grape purposes are given in table 7.
Over the period, production is projected to rise by 20 per cent in the Munumbidgee Irrigation Area. Production in the Riverland of South Australia (North Murray, South Murray and Waikerie-Lower Murray) is projected to increase by 10 per cent, while the remaining regions of South Australia - Barossa, Central, Northern and South East districts - are projected to realise an average increase in production of 34 per cent.
24 ABARE research report 92.17

Production in Queensland and Tasmania
Sufficiently long time series were not available to project grape production in Tasmania and Queensland. The Australian Bureau of Statistics did not publish data on areas and production of grapes, by variety, for these two states prior to 1984-85 and 1985-86 respectively. However, the contribution of the two states to national grape production is very small and their combined production in 1990-91 was only 0.5 per cent of total Australian grape production.
Grapes grown for wine making continue to play a minor role in Queensland, constituting only 10 per cent of total state production, with the balance going to the table market. According to data published by the Australian Bureau of Statistics, no grapes are grown in Queensland for the drying market. Production of wine grapes in 1990-91 declined by 13 per cent on the previous year to 360 tonnes. Grape production for wine making in Queensland is unlikely to increase significantly in the immediate future. Almost half of the 70 hectares of non-bearing grape area in Queensland in 1990-91 was planted or grafted during 1989-90; however, only 2 hectares of this has been planted to varieties predominantly used for wine making.
In contrast to the grape growing industry in Queensland, official statistics indicate that the Tasmanian grape industry is solely devoted to wine making. The wine industry in this state, although still only relatively small, is growing rapidly, with total grape production of 766 tonnes in 1990-91 being 11 per cent above the previous year's level. Production is split evenly between red and white wine grape varieties, with chardonnay and pinot noir being the predominant varieties grown (accounting for over 60 per cent of production in 1990-91). In addition, most of the 62 non- bearing hectares in 1990-91 are under these two varieties (37 per cent of total each), indicating continued rapid expansion in the future. Next in importance are cabernet sauvignon and rhine riesling, which together contributed about 30 per cent to total state production in 1990-91.
Reconciling projections with production ABARE has been undertaking production projections over the past four years, and so it is possible to compare projected production for 1989-90 and 1990-91 with actual production in those years to provide some idea about the appropriateness of the projection method. In table 8, the
Wine grape projections to 1994-95 25

8 A comparison of wine grape production projections
Actual 1989 production projections
kt kt
779 863 815 823 850 844
854
1990 1991 1992 projections projections projections
kt kt kt
Australia-wide production projections derived over the past four years are compared with actual production figures for the four years for which production figures are available, 1987-88 to 1990-91. The seasonal influences on actual grape production (for both wine making and drying and table grape purposes) are evident over this period. The increase in grape production over the projection period can be attributed largely to the increase in areas planted to grapes in the late 1980s. Many of these plantings will be reaching their full bearing potential during the period.
Plantings ABARE collected data on numbers of grape vine cuttings and rootstock planted in 1991. As in previous years, most of the data on numbers of cuttings/rootlings used for planting or reworking of old rootstock by propagation type in 1991 were provided by the Australian Vine Improvement Association (AVIA). Nearly all grape vine cuttings disposed of by AVIA are distributed in South Australia, Victoria and New South Wales, with a balance of 1-2 per cent taken in Western Australia and Queensland (Hamilton 1992). Data presented in this report cover plantings in the three major states.
Some of the major wineries undertake their own vine propagation programs. Therefore, to supplement the information provided by the AVIA, ABARE carried out a survey of major wineries to collect data on varieties propagated within these programs. Wineries were asked to provide details of plantings carried out after the 1991 harvest using material propagated in their own vineyards. The combined data from AVIA and the surveyed
26 ABARE research report 92.17

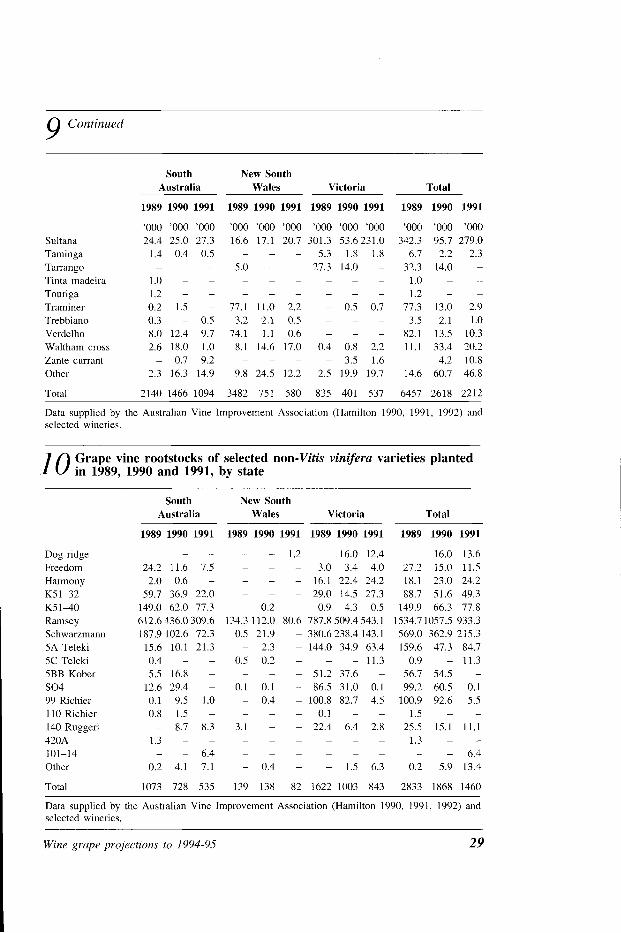
wineries are presented in tables 9 and 10. Figures for South Australia, New South Wales and Victoria on the number of cuttings planted or reworked in 1989, 1990 and 1991 are shown in table 9, while use of rootstocks, by variety and state, in those years is shown in table 10.
The falls in demand for grape vine cuttings which were recorded in 1990 continued in 1991. A total of 2.21 million cuttings were used in 1991, a fall of 16 per cent from 1990. Except for multipurpose grape varieties and chardonnay, there has been a decrease in cuttings used of all major varieties.
Use of cuttings of the top four red varieties - shiraz, cabernet sauvignon, merlot and pinot noir - decreased in 1991, by 39 per cent, 30 per cent, 21 per cent and 43 per cent respectively from 1990 levels. While demand for cuttings for both shiraz and cabernet sauvignon decreased in all three states, demand for pinot noir cuttings in South Australia and of merlot in Victoria increased.
Chardonnay, semillon and rhine riesling cuttings continued to be the white varieties in greatest demand in 1991. Over 80 per cent of cuttings of white wine grapes is contributed by these varieties. Following dramatic declines in demand for chardonnay cuttings in 1990, there was, on average, an increase in demand for chardonnay cuttings in the three states of 36 per cent on 1990 levels. The bulk of this increase was in New South Wales where use trebled, more than offsetting a 7 per cent decline in South Australia.
Total plantings in Victoria increased by 3 per cent, although most of this came from increases in sultana plantings. Total use of semillon and rhine riesling cuttings in 1991 decreased by 53 per cent and 56 per cent respectively. With the exception of rhine riesling in New South Wales, decreases were experienced for both varieties in all states.
Demand for multipurpose grape cuttings increased significantly in 1991 in comparison with the previous year. State aggregate increases of 192 per cent for sultana and 73 per cent for muscat gordo blanco were realised. The main increases were in sultana plantings in Victoria and muscat gordo blanco in South Australia, both increasing around fourfold from 1990 levels.
Wine grape projections to 1994-95 2 7
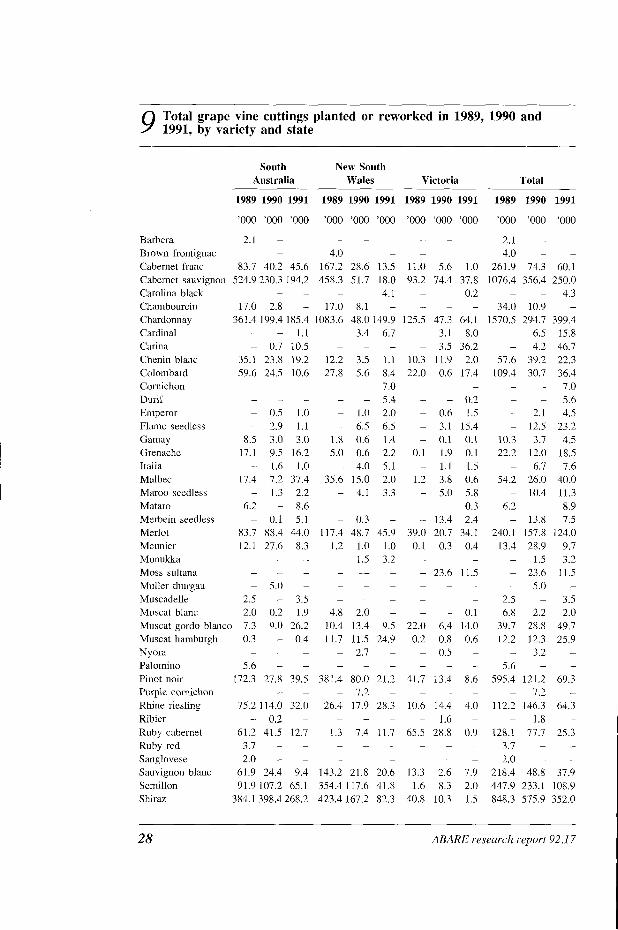
9 Total grape vine cuttings planted or reworked in 1989, 1991, by variety and state
Barbera Brown frontignac Cabernet franc Cabemet sauvignon Carolina black Chambourcin Chardonnay Cardinal Carina Chenin blanc Colombard Comichon Durif Emperor Flame seedless Gamay Grenache Italia Malbec Maroo seedless Mataro Merbein seedless Merlot Meunier Monukka Moss sultana Muller thurgau Muscadelle Muscat blanc Muscat gordo blancc Muscat hamburgh Nyora Paloinino Pinot noir Purple comichon Rhine riesling Ribier Ruby cabernet Ruby red Sanglovcse Sauvignon blanc Semillon Shiraz
South New South Australia Wales
1989 1990 1991 1989 1990 1991
'000 '000 '000 '000 '000 '000
2.1 - - -
- - 4.0 - -
83.7 40.2 45.6 167.2 28.6 13.5 524.9 230.3 194.2 458.3 51.7 18.0
- - - - - 4.1 17.0 2.8 - 17.0 8.1 -
361.4 199.4 185.4 1083.6 48.0 149.9 - - 1.1 - 3.4 6.7 - 0.7 10.5 - - -
35.1 23.8 19.2 12.2 3.5 1.1 59.6 24.5 10.6 27.8 5.6 8.4
- - - - - 7.0
- - - - - 5.4 - 0.5 1.0 - 1.0 2.0 - 2.9 1.1 - 6.5 6.5
8.5 3.0 3.0 1.8 0.6 1.4 17.1 9.5 16.2 5.0 0.6 2.2 - 1.6 1.0 - 4.0 5.1
17.4 7.2 37.4 35.6 15.0 2.0 - 1.3 2.2 - 4.1 3.3
6.2 - 8.6 - - -
- 0.1 5.1 - 0.3 -
83.7 88.4 44.0 117.4 48.7 45.9 12.1 27.6 8.3 1.2 1.0 1.0 - - - - 1.5 3.2 - - - - - -
- 5.0 - - - -
2.5 - 3.5 - - -
2.0 0.2 1.9 4.8 2.0 -
7.3 9.0 26.2 10.4 13.4 9.5 0.3 - 0.4 11.7 11.5 24.9 - - - - 2.7 -
5.6 - - - - -
172.3 27.8 39.5 381.4 80.0 21.2 - - - - 7.2 -
75.2 114.0 32.0 26.4 17.9 28.3 - 0.2 - - - -
61.2 41.5 12.7 1.3 7.4 11.7 3.7 - - - - -
2.0 - - - - -
61.9 24.4 9.4 143.2 21.8 20.6 91.9 107.2 65.1 354.4 117.6 41.8
384.1 398.4 268.2 423.4 167.2 82.3
Victoria
1990 and
Total
28 ABARE research report 92.1 7
Sultana Taminga Tarrango Tinta madeira Touriga Traminer Trebbiano Verdelho Waltham cross Zante currant Other
Total
South New South Australia Wales Victoria Total
1989 1990 1991 1989 1990 1991 1989 1990 1991 1989 1990 1991
Data supplied by the Australian Vine Improvement Association (Hamilton 1990, 1991, 1992) and selected wineries.
10 Grape vine rootstocks of selected non-Vitis vinifera varieties planted in 1989, 1990 and 1991, by state
Dog ridge Freedom Harmony K5 1-32 K5 1 4 0 Ramsey Schwarzmann 5A Teleki 5C Teleki 5BB Kober SO4 99 Richier 110 Richier 140 Ruggeri 420A 101-14 Other
Total
South New South Australia Wales Victoria Total
1989 1990 1991 1989 1990 1991 1989 1990 1991 1989 1990 1991
Data supplied by the Australian Vine Improvement Association (Hamilton 1990, 1991, 1992) and selected wineries.
Wine grape projections to 1994-95 29

Generally, vines are grafted onto rootstocks (new or existing) to increase yields and to cut down on pest and disease problems. Such rootstocks are bred for their resistance to soilborne diseases such as phylloxera and nematodes (Sholefield 1992), rather than their yield potential. Demand for rootstock cuttings also continued to fall in 1991, to 1.46 million, a 22 per cent decline from the number used in 1990. The decrease in the use of new rootstocks occurred in all states, with New South Wales' use decreasing by 41 per cent, South Australia's by 27 per cent and Victoria's by 16 per cent.
Although use of the ramsey variety as a rootstock decreased slightly, from 1.06 million in 1990 to 0.93 million in 1991, its share in total plantings increased from 57 per cent to 64 per cent between the two periods. Plantings of the other major rootstock variety, schwarzmann, declined by 42 per cent from 0.36 million in 1990 to 0.22 million in 1991, with its share in total use falling from 19 per cent to 15 per cent over the period.
The continued low level of new grape vine plantings and use, in comparison with levels attained toward the end of the 1980s, reinforces the conclusion drawn in the last year's study (Abdalla, Kelly and Proctor 1991) that the production increases experienced in the recent years are likely to slow down or be arrested toward the end of the decade.
30 ABARE research report 92.1 7

Winery intake projections to 1994-95
Extensive changes continued in the wine industry in Australia in 1991-92. The concentration of winery ownership increased further, the downward trend in domestic wine consumption appeared to have been curtailed and wine exports continued to increase. In this study, the likelihood of further change within the industry over the next three years is assessed through an analysis of projected wine grape intake.
ABARE first undertook a study of projected intake of grapes by wineries in Australia in 1991 (Proctor and Phillips 1991). As with the initial study, the objective in this year's study is to analyse trends in expected grape intake by wineries for all the major wine grape varieties in Australia. The emphasis is to provide a national perspective on intended wine grape intake. A regional breakup is not provided because, in any one season, grapes, grape juice and bulk wine can be traded between grape growing regions. The intake analysis was designed, as much as possible, to be used in conjunction with the wine grape production projections.
Background The wine industry in Australia has undergone increasing concentration over the past decade to the extent that, of the 600 or so wineries in Australia, eight companies now contribute almost 90 per cent of the total value of wine sales. In early 1990, twelve companies were responsible for the same proportion of total wine sales (Mychasuk 1991).
After increasing throughout most of the 1980s, total wine sales in Australia fell over the period 1987-88 to 1990-91 (table 11). However, for 1991-92, the Australian Bureau of Statistics (1992a) has recorded a 6 per cent increase in total wine sales to 314.8 million litres, as against 296.3 million litres in 1990-91.
Significant increases in some wine categories were recorded over the period 1984-85 to 1990-91. Sales of bottle-fermented sparkling wine increased by 44 per cent and those of dry red table wines by 37 per cent. Major declines in sales have been recorded in sweet table wines, bulk sparkling wine, 'other fortified' wines and sherry categories. Dry table
Wine grape projections to 1994-95 31

wine sales in 1991-92 returned to their 1986-87 level after declining in the late 1980s. The decline in dry white and sweet table wines reflected a decline in bulk wine sales, such as in wine casks. Sales of bottled dry white and sweet wines actually increased in this period. Wine imports fell by 27 per cent over the period and currently make up less than 3 per cent of total wine sales in Australia. A discussion of some of the factors influencing wine demand is provided in Proctor and Phillips (1991).
11 Australian domestic wine sales and imports, by product n
Domestic sales of Australian wine
Unfortified wine Table wine 253 045
Dry red 37 188 Dry white 171 780 Sweet 36 936 Rose 7 140
Sparkling wine 28 931 Bottle-fermented 17 673 Bulk 11 258
Carbonated wine 1 482 Total 283 458
Fortified wine Sherry 17 886 16 791 15 567 14 475 13 908 13 046 12 392 Port 16 357 16 918 17 198 16 709 17 140 15982 15 933 Other 2576 2536 2292 2102 2048 1716 1566 Total 36 819 36 246 35 056 33 286 33 096 30 744 29 891
Other wine inc. vermouth 4 907 5 378 5 631 na 4 534 4346 4 331
Total 325 183 329 819 330 545 309 129 300 609 296 272 314 830
Wine imports b Table 8 546 5 106 5 302 6 086 6 595 5 604 4 966 Sparkling 3 044 1 967 2 031 2 264 2 736 2 285 2 272 Fortified 333 205 178 311 184 191 151 Other 436 389 635 1076 937 919 932
Total 12359 7667 8146 9737 10453 8999 8325
a Wine produced by wine makers with sales of 250 000 litres or more in the previous financial year. b Imports for 1991-92 are July to May only. na Not available. Sourcc,: Australian Bureau of Statistics (1992a).
32 ABARE research report 92.17

The total volume of wine exported from Australia increased over sevenfold between 1985-86 and 1991-92 (table 12). Over the same period, the value of this wine increased elevenfold in Australian dollars (eightfold when measured in constant dollars). The largest category of exports is table wine, which accounts for over 90 per cent of wine exports. In proportional terms, the largest growth in volume was in the champagne category, which is now the second largest export category, accounting for over 4 per cent of exports. Australia's major export markets at present are the United Kingdom, Sweden, the United States and New Zealand. Sweden and the United Kingdom have been the largest growth markets in recent years.
At a recent meeting of the United Nations Food and Agriculture Organisation Intergovernmental Group on Wine and Vine Products, trends in world wine consumption were discussed (US Department of Agriculture 1992). Delegates agreed that, worldwide, demand for lower quality and lower priced wines was falling while that for premium wines was increasing. At this meeting, a report from the French Center for External Trade was presented, and it was predicted that demand will increase for:
wines bearing an appellation of origin, quality sparkling wines, certain low alcohol wines and well known regional wines.
12 Australian wine exports, by type and destination
Type Champagne Sparkling wine Sherry Dessert wine Table wine Other wine Total
Major destination United Kingdom 1 363 2 320 6 652 7 344 8 698 Sweden 1 787 5 223 8 203 10 594 9 035 United States 1 111 2 913 5 643 3 449 4 754 New Zealand 865 1 414 3 530 4 442 5 039 Canada 1 158 2 019 3 172 3 178 3 808 Japan 805 1 833 2 578 4 314 2 859
Source: Australian Wine and Brandy Corporation (1992).
Wine grape projections to 1994-95 33

Increased demand was also predicted for the wine grape varieties:
cabernet sauvignon, pinot noir, chardonnay, gamay, syrah (shiraz), merlot, sauvignon blanc, rhine riesling, chenin blanc and semillon.
Wine consumption was predicted to grow in:
the United Kingdom, Denmark, Japan, Belgium, the Netherlands, Switzerland, Germany and Canada.
Winery survey To ensure adequate coverage of the industry, all of the major wineries were initially contacted to enlist their participation in the survey. A questionnaire was forwarded to each of the cooperating wineries seeking information, by grape variety, on tonnages of grapes crushed during the 1991-92 vintage (that is, grapes harvested in February-March 1992), and projected grape crush for the next three seasons, 1992-93, 1993-94 and 1994-95. A larger response rate was achieved this year than last year and data were obtained from 27 of the major wineries and winery groups in Australia, covering over 85 per cent of total wine production. Most respondents were also visited by ABARE researchers to discuss the data for their particular wineries and past and future trends in grape intake.
Data were also obtained on whether grapes of a given variety were, or were expected to be, obtained from winery owned or other vineyards. The information obtained should provide a good indication of likely trends in the proportion of each grape variety that will be purchased from independent vineyards over the next three years. In relation to the 1992 harvest, wineries were also asked the amount of each grape variety they would have preferred to have crushed, as well as the amount actually used. This is to provide a standardised base on which to evaluate future intentions for grape intake.
Results Australian wineries plan to increase total wine grape intake by 10 per cent over the projection period compared with the actual intake in 1991-92. Intake of red wine grape varieties is projected to increase by 22 per cent (34 000 tonnes), and that of white wine grape varieties, including multipurpose grape varieties, by 5 per cent (20 000 tonnes) (table 13).
34 ABARE research report 92.1 7

13 Wine grape intake projections, by broad groupings a
Projected Change in Actual Preferred 1994-95 from
1991-92 1991-92 1992-93 1993-94 1994-95 1991-92 actual t t t t t %
White wine grapes Premium white b 159 062 179 900 179 114 189 332 198 915 25 Non-premium white c 65 203 61 255 59 589 57 521 55 965 -14 Minor white 9 787 6 658 8 964 8 636 8 582 -12
Red wine grapes Premium red d 106 486 108 894 117 282 126 971 136 297 28 Non-premium red e 38 126 37 609 40 148 41 039 40 804 7 Minor red 12497 11133 12213 13320 14347 15
Multipurpose f 145 022 137 716 135 693 137 393 135 583 -7
Total 536 183 543 166 553 003 574 212 590 493 10
a For the purpose of this table, these varietal groupings have been made consistent with those in the production projections. b Chardonnay, chenin blanc, colombard, rhine riesling, sauvignon blanc, semillon, traminer and verdelho. c Crouchen, doradillo, n~uscadelle, muscat hlanc, palomino, pedro and trebbiano. d Cabernet sauvignon, merlot, malbec, pinot noir and shiraz. e Grenache and mataro. f Muscat gordo blanco, muscat hamburgh, sultana and waltham cross. Note: Projections arc based on planned grape intake by wineries surveyed.
Trends in major wine grape varieties Of the major wine grape varieties (namely, the 25 varieties listed by the Australian Bureau of Statistics 1992b), the largest relative increases in planned intake are for verdehlo (56 per cent increase), malbec (50 per cent), chardonnay (44 per cent), shiraz (41 per cent), colombard (37 per cent) and semillon (36 per cent) (table 14). In terms of quantity demanded, the largest planned quantity increases are for shiraz (21 500 tonnes), chardonnay (19 500 tonnes) and semillon (12 500 tonnes).
The results largely reflect the continued trend in wine demand toward the premium varieties. Grape varieties can be classified into premium, non- premium and multipurpose categories (see table 13). Demand for premium red wine grapes (notably shiraz and cabernet sauvignon) is projected to increase by 28 per cent over the period to 1994-95. Demand for premium white wine grapes is projected to increase by 25 per cent, mainly in the form of increased chardonnay intake. Part of the increased demand for premium grapes is expected to come from a further switching in demand away from non-premium white and multipurpose grapes.
Wine grape projections to 1994-95 35

14 Winery grape intake projections for major varieties
Projected Change in Actual Preferred 1994-95 from 1991-92 1991-92 1992-93 1993-94 1994-95 1991-92 actual
t t t t t % Major white varieties Chardonnay 44 055 48 914 52 181 58 303 63 564 44 Chenin blanc 10110 12024 10502 11200 11781 17 Colombard 18 530 24 003 22 582 24 290 25 420 37 Crouchen 4 661 3 629 3 928 3 445 3 289 -29 Doradillo 16 838 13 695 13 425 12 986 11 730 -30 Muscadelle 3 888 3 842 4 041 4 156 4 211 8 Muscat blanclfrontignac 4 980 4 667 4 882 4 942 5 072 2 Muscat gordo blanco 80 697 77 594 79 763 81 263 81 363 1 Palomino/pedro 14 038 13 249 12 799 11 595 11 370 -19 Rhine riesling 34 565 32 755 33 315 32 277 31 859 -8 Sauvignon blanc 9609 10953 9725 10203 10838 13 Semillon 34 198 41 878 42 166 44 138 46 649 36 Sultana 62 561 58 549 54 180 54 380 52 470 -16 Traminer 6 676 7 304 6 739 6 883 6 748 1 Trebbiano 20 797 22 174 20 514 20 397 20 293 -2 Verdelho 1 319 2 068 1 904 2 038 2 056 56 Waltham cross 1 764 1 573 1 750 1 750 1 750 -1
Minor white varieties a 9 787 6 658 8 964 8 636 8 582 -12
Total white 379 074 385 529 383 360 392 882 399 045 5
Major red varieties Cabernet sauvignon Grenache Malbec Mataro Merlot Muscat hamburgh Pinot noir Shiraz
Minor red varieties a 12 497 11 133 12 213 13 320 14 347 15
Total red 157 108 157 637 169 643 181 330 191 448 22
Total red and white 536 183 543 166 553 003 574 212 590 493 10
a Includes minor varieties (see table 16) and intakes described as 'mixed'. Note: Projections are based on planned grape intake by wineries surveyed.
36 '4BARE research report 92.1 7

Intake of non-premium white wine grapes as a whole is projected to undergo a fairly uniform decline over the forecast period of 14 per cent in total. Most of this projected decline is in the use of grapes for fortified wines, such as palomino, pedro and muscadelle, or distillation, such as doradillo (see Abdalla, Kelly and Proctor 1991, appendix D, for an account of grape variety end uses). This decline reflects an expectation of a continuation of the decline in domestic consumer demand for Australian fortified wines and brandy. In comparison to the demand for non-premium white wine grapes, demand for non-premium red wine grapes is expected to increase by 7 per cent between 1991-92 and 1994-95.
The intake of multipurpose grapes for wine making is projected to decrease by 7 per cent from 1991-92 to 1994-95. This decline probably reflects the recent declines in cask and bulk wine sales and the increased use of better quality grapes replacing multipurpose grapes in the production of cask wine, particularly the two-litre cask varieties, and sparkling wines produced for the lower priced segment of the market. The increased demand for semillon grapes may reflect the increased preference for and availability of better quality grapes for cask wines.
Interviews with winery operators this year revealed a much more optimistic attitude toward future wine demand than their outlook last year. This can be attributed largely to stronger growth in the export market in 1991-92 than previously expected, the turnaround in domestic wine sales and to a more cautious general attitude to future wine demand held last year because of the changing structure of market share in the wine industry.
An indication of the wineries' more optimistic outlook can be gauged by comparing what wineries projected they would crush in 1991-92 with what they actually crushed in 1991-92. For those wineries who were surveyed in both 1991 and 1992, in 1991 their total preferred grape crush for the following 1991-92 season was projected to be about 432 200 tonnes. These wineries in 1992 indicated that their 1991-92 grape crush was 456 400 tonnes (table 15). In the 1991 study, the increase in wine demand to 1993-94 was predicted from a much lower base than could be classed as 'usual' and therefore the 14 per cent increase in grape crush from 1990-91 to 1993-94 was, in effect, overstated. The increase projected from a more 'normal' year in 1991-92 to 1993-94 was only 5 per cent. This year, the increase in grape intake for the comparable period from 1991-92 to 1993-94 is closer to 6 per cent while for the entire projection period the anticipated increase is 10 per cent.
-
Wine grape projections to 1994-95 3 7

1.5 Comparison of 1991 and 1992 winery grape intake surveys
1991-92 1992-93 1993-94 1994-95 t t t t
199 1 projections 432 152 z 444 120z 455 738 z na
1992 projections 456 446 e 472 759 z 489 609 z 501 858 z
e Estimated. z Projected. na Not available.
Winery operators also reported strong demand - mainly for exported varietal wines and both domestic and export sparkling wines - for chardonnay and to a slightly lesser extent for shiraz. The United Kingdom has been a strong growth market for Australian wines in recent months and this is expected to continue throughout the projection period. Also, some winery operators noted a strong potential for increasing wine exports to the Asian region.
Trends in minor wine grape varieties A significant revelation from the survey is the great variety of wine grapes being grown and crushed in Australia at present. Minor wine grape varieties not listed separately by the Australian Bureau of Statistics (1992b), and classed as 'minor' in table 14, accounted for fourteen separately listed white varieties and twenty-five red varieties, and around 4 per cent of the total estimated crush in 1991-92. Data on intake of these varieties are shown in table 16 (in which some varieties have been aggregated for confidentiality reasons).
Total intake of the 'minor white' varieties is expected to decline by 12 per cent over the projection period. In contrast with the minor white varieties, demand for the 'minor red' varieties shows a steady rise in intake of about 15 per cent over the projection period, although in terms of quantities involved, the increased amount demanded is less than 2000 tonnes. Of the minor red varieties, brown frontinac, fronti red and ruby cabernet show significant expected increases.
Preferred grape crush in 1991-92 The preferred intake of grapes for crushing is included in the analysis to provide a consistent base with which to compare the projection figures. Projections of grape intake are made under the assumption of normal
38 ABARE research report 92.1 7

16 Winery grape intake projections for minor varieties
Actual Preferred 1991-92 1991-92
t t Minor white varieties Bianconelwhite grenache 929 795 Canada muscat 769 850 Emerald riesling 75 1 619 Sy lvaner 2 023 1 805 Taminga 984 540 Other white varieties 4 329 2 049
Projected Change in
1994-95 from 1991-92
1994-95 actual t %
Total 9 787 6 658 8 964 8 636 8 582 -12
Minor red varieties Brown frontignac Cabernet franc Carignane Fronti red Ruby cabernet Rubi red Tarrango Touriga Other red varieties
Total 12 497 11 133 12 213 13 320 14 347 15
Total white and red 22 284 17 792 21 177 21 956 22 929 3
Note: Projections are based on planned grape intake by wineries surveyed.
seasons. Unlike the findings from the 1991 demand projections exercise, the actual crush in 1991-92 was less than wineries would have preferred to have crushed, possibly reflecting the improving sales position for Australian wines, both domestically and on the export market, the rundown in stocks over the previous year and reduced yields of certain varieties in some regions. In total, wineries would have preferred to have crushed just over 1 per cent more grapes or 7000 tonnes (table 14).
Of the major white wine varieties, wineries would have preferred to have crushed much larger quantities of chardonnay (1 1 per cent more), chenin blanc (19 per cent), colombard (30 per cent) and semillon (22 per cent), but smaller quantities of the non-premium white varieties such as crouchen (22 per cent less), doradillo (19 per cent) and palominolpedro (6 per cent)
Wine grape projections to 1994-95 39

and all of the multipurpose varieties (5 per cent). These differences in preferred and actual intake of non-premium white and multipurpose grape may reflect existing contractual obligations between wineries and grape suppliers or shortages of particular varieties in some regions. Generally the 1991-92 season was average to slightly above average as far as grape yields were concerned in a majority of regions.
Of the major red varieties, wineries would have preferred to have crushed much larger quantities of shiraz (11 per cent), malbec (12 per cent) and mataro (12 per cent), but surprisingly would have preferred to have crushed smaller quantities of cabernet sauvignon (6 per cent) and pinot noir (12 per cent). However, wineries saw an increased demand for both of these varieties over the next three years. These differences may have been caused by a large carryover of wine stocks by wineries from previous seasons and, once again, existing contractual obligations between wineries and grape suppliers.
Winery owned vineyards An apparent trend toward winery ownership of vineyards has been of significant interest in recent years, especially in the light of the increasing concentration of ownership of the wineries themselves. From the survey results, it is estimated that approximately 22 per cent of total grape production in 1991-92 was sourced from winery owned vineyards (table 17). In the projection period, wineries are expecting production from their own vineyards to increase sufficiently over the next three years so that overall they will still source the same proportion of their grape requirements from their own vineyards over the period to 1994-95. This does not hold for individual varieties, however.
In particular, it is interesting to note the differences in the breakup between winery and non-winery owned vineyards for the premium, non- premium and multipurpose grape varieties. Wineries source a much higher proportion of their premium grape requirements from their own vineyards, sourcing over 30 per cent of their premium red and white variety needs from their own vineyards. The proportions are much lower for the multipurpose (5 per cent), non-premium white (around 16 per cent) and non-premium red (around 11 per cent) grape categories.
Over the projection period, the proportion of premium white grape production coming from winery owned vineyards declines from 34 per
40 ABARE research report 92.1 7

17 Wine grapes sourced from winery owned vineyards, by broad groupings a
Premium white b 34 Non-premium white c 16 Premium red d 32 Non-premium red e 11 Multipurpose f 4
Total 22
a For the purpose of this table, these varietal groupings have been made consistent with those in the production projections. b Chardonnay, chenin blanc, colombard, rhine riesling, sauvignon blanc, semillon, traminer and verdelho. c Crouchen, doradillo, muscadelle, muscat blanc, palomino, pedro and trebbiano. d Cahemet sauvignon, malbec, merlot, pinot noir and shiraz. e Grenache and mataro. f Muscat gordo blanco, muscat hamburgh, sultana and waltham cross.
cent in 1991-92 to 31 per cent. The winery owned proportion of premium red grapes remains at 32 per cent over the period 1991-92 to 1994-95. The proportions for non-premium and multipurpose grape varieties remain relatively unchanged.
The proportion of grapes sourced from winery owned vineyards is also high for the minor varieties (see detailed tables in appendix E), perhaps reflecting that wineries themselves are experimenting with newer varieties. Around 30 per cent of the intake of minor white grape varieties and 35 per cent of the minor red grape varieties are expected to be sourced from winery owned vineyards during the projection period. These proportions differ somewhat from the 1991 projections exercise, although the relativities are still the same. It should also be remembered that the tonnages involved are very small.
Wine grape projections to 1994-95 41

Conclusions
Grape production is forecast to rise by around 17 per cent or 140 900 tonnes by 1994-95 over the average level for the three years to 1990-91. About 135 500 tonnes of the increase is projected to be available for wine making, with the remaining 5400 tonnes expected to go to drying and table grape uses. The increase reflects the substantial rise in plantings of grape vines since the mid-1980s, and gradual improvements in grape yields, especially for the premium grape varieties. The production of non- premium wine grape varieties is forecast to fall and the overall increase in production is forecast to come from the premium varieties.
Almost a third of the rise in grape production is expected to come from increased chardonnay production. Increases in chardonnay plantings were widespread throughout most wine growing regions in the late 1980s. Production from the four other high quality white wine grape varieties - rhine riesling, sauvignon blanc, colombard and semillon - is forecast to contribute over a quarter of the increase. Overall, white wine grape production is forecast to increase by 82 700 tonnes, contributing 59 per cent of the projected increase in total grape production.
Production of red wine grapes is forecast to increase by 49 500 tonnes, and will contribute 35 per cent of the projected increase in total grape production, with the main contributors to this forecast being increases in production of the premium varieties, cabernet sauvignon, shiraz and pinot noir. Only 6 per cent or 8700 tonnes of the increase in total grape production is projected to come from the main multipurpose grape variety, sultana. Only about 3300 tonnes of the projected increase in production of multipurpose grapes is expected to be used for wine making.
Although grape production is forecast to increase in all viticultural regions of Australia, rates of growth among different regions may vary significantly. In the newer grape growing regions - the 'rest' of state regions of New South Wales, Victoria and Western Australia - production is expected to rise on average by 73 per cent, albeit from small bases. Substantial increases are also expected in the South East, Northern and Central regions of South Australia and the Hunter region of New South Wales.
42 ABARE reseurch report 92.17

Modest increases are expected in the Riverland and Barossa regions of South Australia, the Murrumbidgee Irrigation Area of New South Wales and the Kerang-Swan Hill region of Victoria, while the lowest increases are projected for the Sunraysia regions of Victoria and New South Wales. Thus, the trend toward less regional concentration in grape growing revealed in the previous years' projections is continuing.
Over the longer term, a slowdown in production increases is likely to occur. Based on sales of planting materials by the Australian Vine Improvement Association and plantings and reworkings undertaken by the major wineries, if current declines in the rate of plantings recorded over the past two years continue in the coming few years, increases in production should taper off toward the end of the decade. However, corresponding to changing trends in consumption of different wine types, the trend toward higher quality wine grape production will be maintained, while production of the lower quality grape varieties will decline.
The projections of wine grape intake to 1994-95 reported in this study indicate a consistent increase in wine grape intake of around 10 per cent over the estimated intake of 1991-92. The results indicate much stronger future demand for wine grapes than was anticipated by wineries in the 1991 study. The major growth areas, in terms of varieties, still reflect a continued trend in consumer demand toward consumption of wines made from premium wine grapes.
Much of the projected growth in winery intake appears to be derived from expected further increases in wine exports, although there are now signs that domestic demand for Australian wine is also strengthening. Consumer preferences in Australia's major wine export markets will continue to have a significant influence on the growth in intake by wineries for individual wine grape varieties to 1994-95 at least.
There appears to be no intended change in the overall proportion of grapes that wineries source from their own vineyards rather than from non- winery owned vineyards. The percentage of premium grape varieties obtained from winery owned operations is expected to continue to be greater than that of the non-premium varieties.
There are some difficulties in undertaking a direct comparison of the two sets of projections. These problems are mainly related to differences in collection and coverage of the two data sets. The production projections
Wine grape projections to 1994-95 43

are based on data supplied by grape growers to the Australian Bureau of Statistics, and it is estimated that they are based on an industry coverage of around 95 per cent. The projections for intake of grapes by wineries are based on data supplied by wineries to ABARE, and it is estimated that these wineries take in over 85 per cent of the annual grape crush.
The production projections are based on the 25 major varieties produced, while the winery intake projections cover all grapes used by wineries. Also, the base period for the winery intake projections is 1991-92. However, corresponding 1991-92 data which could be used in the production projections will not be available from the Australian Bureau of Statistics until later in 1992.
To allow some comparisons of the two sets of projections, estimates have been made of wine grape production in 1991-92. The method used to produce the production projections for 1992-93 to 1994-95 was used to produce estimates of grape availabilities for wine making for the 1991-92 harvest.
Changes in estimated grape availabilities between 1991-92 and 1994-95 are given in table 18. The current anticipated intake by wineries of the 25 grape varieties covered in the production projections is also presented in table 18. Estimates of what wine makers crushed in 1991 -92 are compared with what they currently expect to crush in 1994-95.
Projections on the availability of grapes for wine making indicate a significant increase (approximately 16 per cent) in the total production of grapes available for wine making over the period 1991-92 to 1994-95. Over the same period the planned grape intake by wineries is expected to increase by around 10 per cent. Thus, on this broad basis it would appear that differences between availabilities and currently planned intake by the wineries are likely over the projection period. However, a closer look at the variety groupings shows that these differences arise largely in the non- premium white and the multipurpose grape categories.
A projected 28 per cent increase in production of premium white grape varieties will be matched by a 25 per cent increase in intake by wineries. A 28 per increase in intake for premium red wine grapes should be met from a projected 30 per cent increase in production of premium red grapes. However, the surplus premium red grape production could be used to meet a potential shortfall in projected requirements for non-premium
44 ABARE research report 92.1 7 1

Changes in projected production and winery grape intake between 18 1991-92 and 1994-95, by selected grape variety
Change in production Change in wine grape intake from 1991-92 to 1994-95 from 1991-92 to 1994-95
Premium white Chardonnay Chenin blanc Colombard Rhine riesling Sauvignon blanc Semillon Traminer Verdelho Total
Non-premium white Crouchen 0.3 4 -1.4 Doradillo -1.6 -8 -5.1 Muscadelle 0.2 4 0.3 Muscat blanclfrontignac 0.1 1 0.1 Palomino/pedro -0.6 -3 -2.7 Trebbiano 4 . 6 -3 -0.5 Total -2.3 -3 -9.3
Premium red Cabernet sauvignon 17.5 40 Malbec 0.4 16 Merlot 2.8 66 Pinot noir 5.1 47 Shiraz 12.4 19 Total 38.2 30
Non-premium red Grenache -1 .O -3 Mataro 0 20 Total -I .0 2
Multipurpose Muscat gordo blanco 0.1 0 0.7 1 Muscat hamburgh -0.1 6 -0.1 -17 Sultana 0.4 0 -10.1 -17 Waltham cross -0.1 -2 0 0 Total 0.3 0 -9.5 -7
Total 91.8 16 54.3 10
Wine grape projections to 1994-95 45

red grapes. While production of non-premium white grapes is projected to decline by 3 per cent, intake by wineries is projected to decline by 14 per cent. Similarly, while production of multipurpose grapes is forecast to remain largely unchanged, intake by wineries is projected to decline by 7 per cent. Given market competition between grape buyers and sellers, this would indicate that grape prices for the non-premium and multipurpose grape categories will be under downward pressure over the projection period.
For the reasons outlined earlier, comparisons of production and intake on a varietal basis should be made with caution. This is particularly important at a disaggregated level because of the problem of non-responses in the demand survey in some regions where particular varieties are prominent, thus possibly biasing the results. Neveutheless, some broad comparisons can be made.
The 1992 projections exercise reveals that the increase in availability for many varieties is much more evenly matched with the expected increase in winery intake than was the case with the 1991 exercise. In particular, the large excess of chardonnay availability which was predicted in 1991 to occur by 1993-94 appears to be almost nonexistent now, with a large increase in use predicted by wineries in 1992 for this variety. However, growth in availabilities of other premium white varieties, chenin blanc, rhine riesling and sauvignon blanc, appear to be well in excess of what wineries are expecting they will require by 1994-95. This forecast scenario was becoming evident in the 1991 projections exercise to 1993-94.
On the other hand. planned winery intake for semillon appears to be well in excess of the projected growth in availabilities of this variety. Maybe the planned increased intake of semillon reflects a desire of wineries to reduce some of their purchases of non-premium white wine varieties, crouchen, doradillo and palomino/pedro, and multipurpose grapes, particularly sultanas, and replace their purchases of these grapes with semillon.
For the premium red grape varieties, the rapid expansion in plantings of cabernet sauvignon and pinot noir which took place in the late 1980s appears likely to result in a relative over abundance of these varieties by the mid-1990s. However, there may well be a relative shortage of shiraz grapes by that time.
46 ABARE research report 92.1 7

A comparison of the grape intake projections supplied by wineries in 1991 and 1992 indicates that wineries are now more optimistic about their future grape requirements. Should the export market continue to expand, the grape intake projections supplied by wineries in 1992 may well prove to be conservative, and the intake of grapes by wineries over the projection period, particularly for premium quality grapes, may be higher than indicated by the projections.
Wine grape projections to 1994-95 47

Appendix Data for the production projections
Sets of data for variables that affect future grape production were established for the period 1979-80 to 1990-91. The data sets included annual data on bearing and non-bearing areas of vines, plantings. grubbings and grape production, by variety and region.
Most of the data used were compiled from the Australian Bureau of Statistics publication Viticulture, Australia (cat. no. 7310.0). In 1986-87 the ABS varied the eligibility criteria for farms in its Agricultural Census by increasing the minimum estimated value of agricultural operations (EVAO) to $20 000. All data for the years 1986-87 to 1990-91 therefore had to be re-estimated to the lower EVAO of $5000, so that data for the later years would be comparable with earlier years. This was carried out by using separate bridging factors for each state supplied by the ABS.
There were 255 regression blocks constructed from the variety and region conlbinations identified for analysis. Data for the same variety grown in regions with similar production environments were grouped together to generate series with sufficient data points to enable reliable estimation of yields. These combinations were constructed from 25 wine grape varieties and sixteen grape growing regions (not all varieties are represented in every region) and cover all principal wine grape varieties in the major grape producing regions of Australia. In total. the selected varieties account for more than 95 per cent of grape production used for wine in Australia.
No continuous series detailing annual plantings is available. In 1990 and 1991 the ABS dropped from their collection data on grubbings (removals) of vines but included data on plantings. As plantings are assumed to come into bearing in four years time, ABS data on plantings in 1989-90 and 1990-91 constituted the bases for calculating the bearing areas in 1993-94 and 1994-95.
Continuous series detailing total bearing and non-bearing areas were available, which enabled a planting area to be derived for 1988-89 and uscd for calculating the bearing area in 1992-93. Disaggregated data were not available for Tasmania prior to 1984-85 or for Queensland prior to
48 ABARE research report 92.1 7

1985-86; hence, it would not be feasible, with any degree of statistical reliability, to project supplies in these two states. This is not a serious problem as their combined current production is under 1 per cent of national grape production.
Regions The regions used in this study are the same as those defined in the ABS Viticulture, Australia publication and are shown in the maps in chapter 2. They are as follows.
South Australia The seven regions adopted in South Australia correspond to the Phylloxera Board's districts, which are:
Barossa Central Northern South East North Murray South Murray Waikerie and Lower Murray
Victoria Kerang-Swan Hill - comprising the local government areas of the cities of Kerang and Swan Hill and the Shires of Kerang and Swan Hill.
Sunraysia - comprising the local government areas of the City of Mildura and the Shire of Mildura.
Rest of Victoria.
New South Wales Hunter Valley - comprising the local government areas of Cessnock Greater, Muswellbrook, Scone and Singleton.
Murrumbidgee Irrigation Area (MIA) - comprising the local government areas of Leeton and Griffith.
Sunraysia - comprising the local government areas of Wakool, Balranald and Wentworth.
Rest of New South Wales.
I Wine grape projections to 1994-95 49 I

Western Australia
Swan - comprising the local government area of the Shire of Swan.
Rest of Western Australia.
Queensland
Tasmania
Varieties The wine grape varieties covered by the study are:
White Red
Chardonnay Chenin blanc Colombard Crouchen Doradillo Muscadelle Shiraz Muscat blanc Palomi110 Rhine riesling Sauvignon blanc Sernillon Traminer Trebbiano Verdelho
Cabernet sauvignon Grenache Malbec Mataro Merlot Muscat hamburg Pinot noir
Multipurpose
Muscat gordo blanco Sultana Waltham cross

Appendix Production projections method
The analysis is undertaken following the method identified by Duffus and Millham (1989).
Production The identity for projecting grape production is specified as:
where Q is grape production (tonnes), BA is the calculated bearing area (hectares), Y is the estimated yield (tonneshectare) and t is the year.
To project grape production it was necessary to derive methods for calculating future bearing area and yield for the principal wine grape varieties in the main wine producing areas of Australia.
Bearing area Being aware of differences in bearing age among different grape varieties grown in one region, and within the same variety grown in different regions. ABARE adopted in its previous projections the assumption that it takes six years between the time a vine is planted and reaches a commercial bearing age as a reasonable average for commercial bearing age for all varieties in all regions, relying on views expressed by grape and wine industry representatives.
In a paper on wine grapes, contributed to the National Agricultural Outlook Conference, Hesketh (1982) said, '. . . a vineyard takes up to seven years and a large investment to develop'. At the following year's Outlook Conference, Barr (1983) spoke of the '. . . problem of a new vineyard not generating any substantial income over expenditure for five to six years'. Therefore, in previous years' projection exercises, it was assumed that grape vines would not start producing harvestable quantities of grapes until six years after they were planted.
1 Wine grape projections to 1994-95 51

However, feedback from the industry on ABARE production projections suggests an increasing incidence of grafting in the grape growing industry, which will have lowered the average initial bearing age in recent years. The Wine Grape Growers' Council of Australia said that some grapes can bear small quantities of grapes in the first or second year after grafting, but advised that a lag of four years would be the appropriate average period before grape vines reach a commercial bearing age.
Changes in forecast bearing areas for grapes using a lag of four years from planting to bearing against six-year lag for the years 1991-92, 1992-93 and 1993-94 were analysed. Using the four-year assumption, the annual average bearing area of the premium varieties for the three years was 3.1 per cent above the average bearing area under the six-year assumption. For non-premium grape varieties, the average bearing area under the four- year assumption was 3.1 per cent below that obtained by using the six- year assumption.
Although the premium varieties contribute about three quarters to the combined production of the two grape categories, their yields are generally lower than those of the non-premium varieties. The combined average production of the two grape types was found to be 1.5 per cent higher under the four-year assumption than that under the six-year assumption.
Differences in aggregate bearing areas (and hence production) between the two assumptions of bearing age are less significant. National bearing area changes by -0.3 per cent, 0.9 per cent and -1.5 per cent in 1991-92, 1992-93 and 1993-94, respectively, when using the four-year assumption in comparison with the six-year assumption.
In this analysis, and in the light of the feedback from the wine grape industry, ABARE has applied a four-year time lag from the time of planting to the time of bearing, instead of the six-year lag used in the previous reports.
The identity used to calculate bearing area was
where G is grubbings (hectares) and P is plantings (hectares).
52 ABARE research report 92.17

Data on bearing and non-bearing areas and areas grubbed are published annually by the Australian Bureau of Statistics and are available up to the 1990-91 season for bearing areas and up to 1988-89 for grubbings. Data on plantings were collected in the last two years - 1989-90 and 1990-91 - and these plantings are assumed to come into bearing in 1993-94 and 1994-95 respectively. To enable the calculation of future bearing area, some judgments had to be made on how to estimate the level of grubbings likely to occur in the three years to 1994-95. The determination of data on grubbings in these years and on plantings in 1988-89 is described below.
Plantings To estimate bearing areas for 1992-93, it was necessary to estimate the level of plantings which occurred in 1988-89. ABS data on bearing and non-bearing areas in relevant years were used to derive estimates of the level of plantings that occurred in 1988-89. The following identity was adopted to calculate plantings:
where NB is non-bearing area (hectares).
Grubbings As data on grubbings are not available after 1988-89, an approximation had to be made of the level of grubbings that would occur in 1992-93, 1993-94 and 1994-95 in order to estimate what the bearing area would be in each of those years. It was assumed that the proportion of bearing area grubbed in future years (g) would be the same as the proportion of total grubbings (G) in 1987-88 and 1988-89 to total bearing area (BA) in those years. The average proportion grubbed in the two most recently available years is taken to represent future grubbings because grubbing decisions in the years immediately prior to 1987-88 were influenced by a government supported Vine Pull Scheme.
Thus, having derived the planting series and estimated the proportion of bearing area grubbed as
I Wine grape projections to 1994-95 53

- - - -
it was then possible to forecast the bearing area series as:
Yield Yield varies considerably as vines mature. After reaching a commercial bearing age, most vines increase in yield for a further three to five years until a peak yield is reached. The yield is then maintained for around thirty years for specialist wine grapes and longer for multipurpose grape varieties. At greater ages, yields begin to decline.
For each grape variety in each region, yields were estimated using regression analysis to allow for changes in factors influencing yields. Explanatory variables used in these regressions were time trends, bearing area and dummy variables for different regions.
A time variable was used to reflect gradual improvements in yields taking place with the introduction of higher yielding planting and rootstock material and improved management techniques. In most instances, the time trend was found to be a significant explanator of yield.
Bearing area was included as an explanatory variable in some of the yield equations because of the abovementioned variation of yield as vines mature. Vines just coming into bearing have less than maximum yields. Thus, an increase in bearing area, as more vines come into bearing, will lower the overall average yield. The same argument applies to lower yielding older vines. Higher rates of removal of these vines will result in lower bearing area but higher average yield and vice versa. Hence, a larger bearing area, as a result of new vines coming into bearing or lower rates of removal of old vines, or both, would be expected to result in a reduction in average yield.
Bearing area was found to be a significant explanatory variable in the regression estimations for the majority of grape varieties grown in different regions. This is particularly true for premium wine grape varieties, where there has been a considerable expansion in plantings during the 1980s. On the other hand, there has been little change in the bearing area of some of
54 ABARE research report 92 .I 7

the traditional grape varieties, particularly those used in the lower quality, bulk wine producing sector. Changes in bearing areas do not relate strongly to changes in yields for these varieties; therefore, bearing area was not used in the yield estimation for these varieties.
To obtain sufficient observations to conduct the regression analyses, cross-sectional data for the same variety in different regions of similar characteristics (that is, premium producing, irrigated and so on) were pooled over time to provide data sets with 25 or more observations. Dummy variables were used to represent each of the individual regions in the pooled data. Although the regions pooled were similar in basic characteristics, yields varied between them because of climate, soil types and other factors unique to the particular producing area. To remove the influence of these exogenous variables, the data set for each region for yield and bearing area was normalised (Johnston 1984). This process involved the observations for each region being divided by the mean of the data set for each variety, in that region. Initially, the yield was specified as:
where Y is yield, Yav is mean yield, BA is bearing area, BA,, is mean bearing area, T is a time trend, a is a constant and b and c are coefficients.
Because the data have been normalised it is necessary to multiply the estimated, normalised yield by the mean yield (Yav) to obtain the projected yield. This projected yield is then used in identity 1 to forecast grape production. This procedure was adopted for all possible variety and region combinations. Thus, a unique yield forecasting equation was estimated for each variety in every region where that variety is grown. Statistically insignificant variables were not included in the estimating equations.
The analysis allows for confidence bounds to be calculated for future grape production estimates. The confidence interval is derived by multiplying the standard error of the projections (expressed as a percentage of production shown in the tables in appendix D) by the production estimates themselves and adding to and subtracting from the mean estimates of production to give the upper and lower bound respectively. The bounds provided indicate that there are two chances in three that the
I actual output will be within the range of the projected interval. I 1 Wine grape projections to 1994-95 55

Appendix Production and winery intake of multipurpose grapes
In six of the grape growing regions examined, significant quantities of multipurpose grapes (defined as muscat gordo blanco, muscat hamburgh, sultana and waltham cross) are used for drying and, to a much smaller extent, for table grape use. In the other nineteen regions, multipurpose grape production is relatively minor, and it is assumed for this study that all of this production in these regions is available for wine making over the production period.
Regions producing the bulk of multipurpose grapes for dried fruit production are the two Sunraysia regions in Victoria and New South Wales and the Kerang-Swan Hill region of Victoria. Together these regions contribute almost 80 per cent of total multipurpose grape production. The balance of multipurpose grape production used for dried fruit production comes from the Waikerie-Lower Murray, South Murray and North Murray regions of South Australia.
Data are available from ABS Viticulture statistics which detail the end use of multipurpose grape production. For the purposes of this study, it was assumed that the percentage of multipurpose grape production used for wine making over the three seasons to 1990-91 in these six regions would continue over the projection period.
There is evidence that growers tend to specialise in one particular end use, and it is difficult for growers to change the direction of their fruit growing except in the longer term (Campbell 1992). Each end use requires different pruning practices, trellising requirements and harvesting methods for the efficient production of fruit to meet a particular end use. For example, increasing use is being made of mechanical harvesting of grapes for wine making, which requires pruning systems and trellising that are not required for dried fruit production.
In table 19, the percentages of multipurpose grape production used for wine making are given, by variety, for each region. These percentage figures have been used in deriving future grape availabilities for wine making, which are presented in the regional production projection tables presented in appendix D.
56 ABARE research report 92.17

Percentage use of multipurpose grapes for wine making, by region 19 Average 1988-89 to 1990-91
Muscat gordo blanco
Sunraysia, New South Wales 64 Sunraysia, Victoria 68 Kerang-Swan Hill 87 North Murray 96 South Murray 97 Waikerie-Lower Murray 98
Muscat hamburgh Sultana
Waltham cross
Wine grape projections to 1994-95 57

Appendix
Production of wine grape varieties, by district
- 20 Grape production in the Barossa district of South Australia
Cabemet sauvignon Chardonnay Chenin blanc Colombard Crouchen Doradillo Grenache Malbec Mataro Merlot Muscadelle Muscat blanc Muscat gordo blanco Muscat hamburgh Palomino Pinot noir Rhine riesling Sauvignon blanc Semillon Shiraz Sultana Traminer Trebbiano Verdelho Waltham cross
Average Projected 1988-89
to 1990-91 1992-93 1993-94 1994-95
- - - -
1 767 1 400 (8) 1 300 (9) 1 300 (9) 258 100 (6) I00 (7) I00 (7)
7 361 6 300 (8) 6 200 (9) 6 200 (11) 129 100 (na) 100 (na) 100 (na) 705 700 (7) 700 (8) 700 (8) 219 300 (na) 300 (na) 300 (na)
2 468 2 700 (9) 2 700 (10) 2 700 (11) 1 459 1 400 (6) 1 400 (7) 1 400 (7)
104 200 (6) 100 (7) I00 (7) - - - -
4 591 4 100 (3) 4 000 (4) 3 800 (4) 990 1 900 (11) 2 300 (12) 2 500 (12)
9091 1 0 2 0 0 ( 4 ) 1 0 7 0 0 ( 4 ) 1 1 1 0 0 ( 4 ) 787 1 100 (7) 1 300 (7) 1 400 (8)
6 241 7 800 (8) 8 400 (9) 8 900 (9) 8177 8 5 0 0 ( 8 ) 9000(10) 9700(12)
- - - -
699 700 (5) 700 (5) 700 (5) 455 300 (6) 300 (6) 300 (6)
Total 52 348 58 000 61 200 64 200
- Insignificant production of that variety. na Not applicable (average yields assumed). Note: The numbers in parentheses are the standard errors of forecasts, expressed as percentages of mean production estimates.
58 ABARE research report 92.1 7
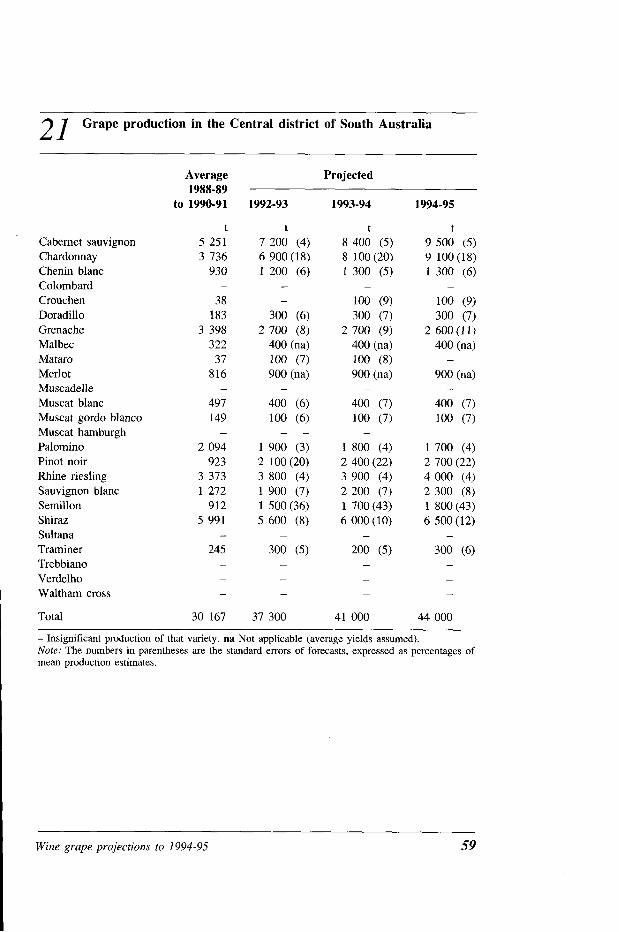
2 1 Grape production in the Central district of South Australia
Cabernet sauvignon Chardonnay Chenin blanc Colombard Crouchen Doradillo Grenache Malbec Mataro Merlot Muscadelle Muscat blanc Muscat gordo blanco Muscat hamburgh Palomino Pinot noir Rhine riesling Sauvignon blanc Semillon Shiraz Sultana Traminer Trebbiano Verdelho Waltham cross
Average Projected 1988-89
to 1990-91 1992-93 1993-94 1994-95
300 (6) 2 700 (8)
400 (na) 100 (7) 900 (na)
t 8 400 (5) 8 100 (20) 1 300 (5)
-
100 (9) 300 (7)
2 700 (9) 400 (na) 100 (8) 900 (na)
t 9 500 (5) 9 100 (18) 1 300 (6)
-
100 (9) 300 (7)
2 600 (1 1) 400 (na) -
900 (na) -
400 (7) 100 (7)
Total 30 167 37 300 41 000 44 000
- Insignificant production of that variety. na Not applicable (average yields assumed). Note: The numbers in parentheses are the standard errors of forecasts, expressed as percentages of mean production estimates.
Wine grape projections to 1994-95 59

- -
7 7 Grape production in the Northern district of South Australia
Cabemet sauvignon Chardonnay Chenin blanc Colombard Crouchen Doradillo Grenache Malbec Mataro Merlot Muscadelle Muscat blanc Muscat gordo blanco Muscat hamburgh Palomino Pinot noir Rhine riesling Sauvignon blanc Semillon Shiraz Sultana Tra~niner Trebbiano Verdelho Waltham cross
Average Projected 1988-89
to 1990-91 1992-93 1993-94 1994-95
900 (8) 100 (na) -
200 (na) -
900 (9) 200 (na) -
300 (na) -
900 (1 1) 200 (na) -
300 (na)
Total 14 134 18 100 19 700 20 800
- Insignificant production of that variety. na Not applicable (average yields assumed). Note: The numbers in parentheses are the standard errors of forecasts, expressed as percentages of mean production estimates.
60 ABARE research report 92.1 7 I

23 Grape production in the South East district of South Australia
Average 1988-89
to 1990-91
Projected
Cabernet sauvignon Chardonnay Chenin blanc Colombard Crouchen Doradillo Grenache Malbec Mataro Merlot Muscadelle Muscat blanc Muscat gordo blanco Muscat hamburgh Palomino Pinot noir Rhine riesling Sauvignon blanc Semillon Shiraz Sultana Traminer Trebbiano Verdelho Waltharn cross
Total
-
1 000 (5) 600 (na)
-
1 000 (5) 600 (na)
1 000 (5) 700 (na)
-
900 (na) 300 (9) 200 (7)
900 (na) 300 (9) 300 (6)
1 100 (na) 300 (12) 200 (8)
- Insignificant production of that variety. na Not applicable (average yields assumed). Note: The numbers in parentheses are the standard errors of forecasts, expressed as percentages of mean production estimates.
Wine grape projections to 1994-95 61

24 Grape production in the North Murray district of South Australia
Average 1988-89
to 1990-91
Projected
Wine grapes Cabernet sauvignon Chardonnay Chenin blanc Colombard Crouchen Doradillo Grenache Malbec Mataro Merlot Muscadelle Muscat blanc Muscat gordo blanco Muscat hamburgh Palomino Pinot noir Rhine riesling Sauvignon blanc Semillon Shiraz Sultana Traminer Trebbiano Verdelho Waltham cross Grapes for wine
t t 2 900 (9) 3 300 (10) 1 900 (1 1) 2 200 (15) 2 800 (5) 3 200 (6) 2 600 (6) 2 700 (6) 1 400 (6) 1 400 (6) 9300 (4) 9300 (4) 7 400 (5) 7 300 (5) 1 000 (na) 1 100 (na) 4 400 (7) 4 400 (8)
100 (na) 100 (na) 200 (9) 200 (1 1) 600 (6) 600 (7)
17 300 (5) 17 200 (6)
t 3 700 (13) 2 500 (20) 3 600 (6) 3 200 (7) 1 400 (7) 9 200 (4) 7 200 (5) 1 100 (na) 4 500 (9)
200 (na) 200 (12) 600 (8)
17 100 (6)
Drying and table Muscat gordo blanco Muscat hamburgh Sultana Waltham cross
Total drying and table
Total grapes
- Insignificant production of that variety. na Not applicable (average yields assumed). Note: The numbers in parentheses are the standard errors of forecasts, expressed as percentages of mean production estimates.
62 ABARE research report 92.17

25 Grape production in the South Murray district of South Australia
Wine grapes Cabemet sauvignon Chardonnay Chenin blanc Colombard Crouchen Doradillo Grenache Malbec Mataro Merlot Muscadelle Muscat blanc Muscat gordo blanco Muscat hamburgh Palomino Pinot noir Rhine riesling Sauvignon blanc Semillon Shiraz Sultana Traminer Trebbiano Verdelho Waltham cross Total wine grapes
Average Projected 1988-89
to 1990-91 1992-93 1993-94 1994-95
t 800 (14) 400 (1 3)
1 700 (5) 1 500 (6)
700 (6) 1 900 (5) 3 800 (5)
300 (na) 1 600 (7)
t t 800 (15) 900 (1 6) 500 (14) 700 (14)
2 000 (6) 2 200 (6) 700 (6) 700 (7)
1 400 (6) 1 400 (7) 1 800 (5) 1 700 (6) 3 700 (5) 3 600 (5)
300 (na) 300 (na) 1 600 (8) 1 600 (9)
Multipurpose grapes Muscat gordo blanco 296 300 (5) 300 (6) 300 (6) Muscat hamburgh - - - -
Sultana 2 940 3 200 (7) 3 200 (8) 3 200 (8) Waltham cross 190 200 (10) 200 (1 1) 200 (12)
Total drying and table 3 426 3 700 3 700 3 700
Total grapes 38 209 40 700 41 200 41 200
- Insignificant production of that variety. na Not applicable (average yields assumed). Note: The numbers in parentheses are the standard errors of forecasts, expressed as percentages of mean production estimates.
Wine grape projections to 1994-95 63

26 Grape production in the Wakerie-Lower Murray district of South Australia
Wine grapes Cabernet sauvignon Chardonnay Chenin blanc Colombard Crouchen Doradillo Grenache Malbec Mataro Merlot Muscadelle Muscat blanc Muscat gordo blanco Muscat harnburgh Palomino Pinot Noir Rhine riesling Sauvignon blanc Semillon S hiraz Sultana Traminer Trebbiano Verdelho Waltham cross
Average Projected 1988-89
to 1990-91 1992-93 1993-94 1994-95
t 4 000 (7) 4 300 (17) 1 400 (5) 4 100 (6)
700 (6) 3 900 (4) 5 200 (5)
100 (na) 600 (7) 300 (na) 600 (9)
1 000 (6) 13 700 (5)
t 4 600 (9) 4 800 (20) 1 700 (5) 4 500 (6)
700 (6) 3 900 (4) 5 200 (5)
100 (na) 600 (8) 300 (na) 600 (10)
1 100 (7) 13 700 (6)
t 4 800 (9) 5 400 (20) 2 400 (6) 4 900 (7)
600 (7) 3 800 (4) 5 100 (5)
100 (na) 600 (9) 300 (na) 600 (12)
1 100 (8) 13 800 (6)
Total wine grapes 54 430 58 000 60 300 62 600
Multipurpose grapes Muscat gordo blanco 289 300 (5) 300 (6) 300 (6) Muscat harnburgh - - - -
Sultana 958 900 (7) 900 (7) 900 (8) Waltham cross 55 - - -
Total drying and table 1 302 1 200 1 200 1 200
Total grapes 55 732 59 200 61 500 63 800 -
- Insignificant production of that variety. na Not applicable (average yields assumed). Note: The numbers in parentheses are the standard errors of forecasts, expressed as percentages of mean production estimates.
64 ABARE research report 92.1 7

2 7 Grape production in the Kerang-Swan Hill district of Victoria
Wine grapes Cabernet sauvignon Chardonnay Chenin blanc Colombard Crouchen Doradillo Grenache Malbec Mataro Merlot Muscadelle Muscat blanc Muscat gordo blanco Muscat hamburgh Palomino Pinot noir Rhine riesling Sauvignon blanc Semillon Shiraz Sultana Traminer Trebbiano
1 Verdelho 1 Waltham cross
Average Projected 1988-89
to 1990-91 1992-93 1993-94 1994-95
t t 600 (8) 600 (9) 600 (6) 800 (7)
I 400 (7) 1 600 (7) I 500 (6) 1 600 (6)
500 (9) 500 (9) - -
500 (8) 500 (9) - -
500 (7) 400 (8) - -
- -
- I00 (18) 9 800 (3) 9 700 (4)
300 (9) 300 (10) - -
- -
700 (13) 700 (1 3) - - - -
1 100 (4) 1 200 (5) 7 600 (na) 7 600 (na)
- -
- -
- -
600 (7) 600 (8)
t 600 (10) 800 (7)
1 800 (7) 1 700 (6)
500 (9) -
500 (1 1) -
300 (8) - -
100 (19) 9 700 (4)
300 (12) -
-
700 (1 3) -
-
1 200 (5) 7 600 (na)
- -
-
700 (8)
Total wine grapes 22 847 25 700 26 200 26 500
Multipurpose grapes Muscat gordo blanco I 371 1 500 (3) 1 500 (4) 1 400 (4) Muscat hamburgh 337 300 (9) 300 (10) 300 (12) Sultana 34 244 37 000 (na) 37 100 (na) 37 200 (na) Waltham cross 3 203 3 000 (7) 3 000 (8) 3 000 (8)
I Total drying and table 39155 41800 41 900 41 900
Total grapes 62 002 67 500 68 100 68 400
- Insignificant production of that variety. na Not applicable (average yields assumed). Note: The numbers in parentheses are the standard errors of forecasts, expressed as percentages of mean production estimates.
Wine grape projections to 1994-95 65

- 28 Grape production in the Sunraysia district of Victoria
Average Projected 1988-89
to 1990-91 1992-93 1993-94 1994-95
Wine grapes Cabernet sauvignon Chardonnay Chenin blanc Colombard Crouchen Doradillo Grenache Mataro Merlot Muscadelle Muscat Blanc Muscat gordo blanco Muscat hamburgh Palomino Pinot noir Rhine riesling Sauvignon blanc Semillon Shiraz Sultana Traminer Trebbiano Verdelho Waltham cross
Total wine grapes
- -
288 300 (4) - -
2161 2100(na) 519 1 000(10) - -
69 1 500 (9) 22 769 23 000 (na)
-
300 (5) -
2 100 (na) 1 100 (10)
-
600 (10) 23 000 (na)
-
2 200 (na) 1 200 (10)
-
500 (1 1) 23 000 (na)
-
Multipurpose grapes Muscat gordo blanco 4 869 4 500 (3) 4 400 (4) 4 600 (4) Muscat hamburgh - - - -
Sultana 184 222 185 800 (na) 186 400 (na) 186 400 (na) Waltham cross 3 909 3 600 (6) 3 500 (6) 3 400 (7)
Total drying and table 193 000 193 900 194 300 194 400
Total grapes 242 884 249 500 250 600 252 000
- Insignificant production of that variety. na Not applicable (average yields assumed). Note: The numbers in parentheses are the standard errors of forecasts, expressed as percentages of mean production estimates.
66 ABARE research report 92.1 7

29 Grape production in the rest of Victoria
Cabernet sauvignon Chardonnay Chenin blanc Colombard Crouchen Doradillo Grenache Mataro Merlot Muscadelle Muscat blanc Muscat gordo blanco Muscat hamburgh Palomino Pinot noir Rhine riesling Sauvignon blanc Semillon Shiraz Sultana Traminer Trebbiano Verdelho Waltham cross
Average Projected 1988-89
to 1990-91 1992-93 1993-94 1994-95
t t 2 7 1 0 4 5 0 0 ( 4 ) 3 128 4 700 (8)
624 700 (7) 126 200 (na)
- -
126 100 (9) 41 1 600 (na) - - -
298 700 (6)
t 5 100 (5) 5 300 (10)
700 (7) 200 (na)
-
100 (9) 700 (na) -
700 (7)
t 5 800 (5) 6 000 (8)
700 (7) 200 (na)
-
100 (9) 900 (na)
Total 17199 23400 25 300 27 600
- Insignificant production of that variety. na Not applicable (average yields assumed). Note: The numbers in parentheses are the standard errors of forecasts, expressed as percentages of mean production estimates.
I Wine grape projections to 1994-95
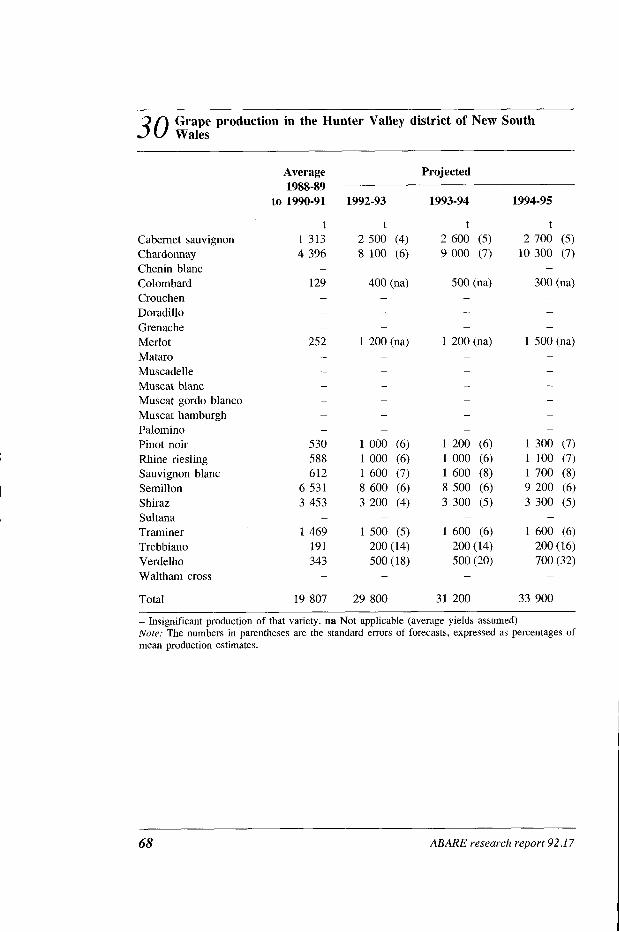
Grape production in the Hunter Valley district of New South 30 wales
Cabemet sauvignon Chardonnay Chenin blanc Colombard Crouchen Doradillo Grenache Merlot Mataro Muscadelle Muscat blanc Muscat gordo blanco Muscat hamburgh Palomino Pinot noir Rhine riesling Sauvignon blanc Semillon Shiraz Sultana Traminer Trebbiano Verdelho Waltham cross
Average Projected 1988-89
to 1990-91 1992-93 1993-94 1994-95
t t 1 3 1 3 2 5 0 0 ( 4 ) 4 396 8 100 (6)
- -
129 400 (na)
- -
252 1 200 (na)
500 (na)
-
1 200 (na)
300 (na)
-
1 500 (na)
Total 19 807 29 800 31 200 33 900
- Insignificant production of that variety. na Not applicable (average yields assumed). Note: The numbers in parentheses are the standard errors of forecasts, expressed as percentages of mean production estimates.
ABARE research report 92.1 7 1

31 Grape production in the Murrumbidgee Irrigation Area of New South Wales
Cabemet sauvignon Chardonnay Chenin blanc Colombard Crouchen Doradillo Grenache Merlot Mataro Muscadelle Muscat blanc Muscat gordo blanco Muscat harnburgh Palomino Pinot noir Rhine riesling Sauvignon blanc Semillon Shiraz Sultana Traminer Trebbiano Verdelho Waltham cross
Average Projected 1988-89
to 1990-91 1992-93 1993-94 1994-95
1 900 (5) 1 400 (1 1)
700 (na) 1 600 (7)
-
1 300 (19) 8 900 (na)
400 (8) 1 300 (4) 1 000 (24) 1 600(13) 2 500 (8)
25 300 (7) 14 800 (9)
1 900 (6) 1 400(11)
800 (na) 1 600 (7)
-
1 300 (20) 8 900 (na)
400 (9) 1 200 (5) 1 100 (25) 1 700(13) 2 700 (8)
26 400 (7) 15 300(10)
I 800 (8) 1 400 (1 1) 1 100 (na) 1 600 (7)
-
1 300 (21) 9 000 (na)
400 (10) 1 200 (5) 1 200 (42) 1 700 (1 3) 3 200 (9)
27 700 (7) 16 500 (1 1)
Total 81 90869 89 800 93 40000 98 000
- Insignificant production of that variety. na Not applicable (average yields assumed). Note: The numbers in parentheses are the standard errors of forecasts, expressed as percentages of mean production estimates.
Wine grape projections to 1994-95

~ 32 Grape production in the Sunraysia district of New South Wales
Average Projected 1988-89
to 1990-91 1992-93 1993-94 1994-95
Wine grapes Cabernet sauvignon Chardonnay Chenin blanc Colombard Crouchen Doradillo Grenache Mataro Merlot Muscadelle Muscat blanc Muscat gordo blanco Muscat hamburgh Palomino Pinot noir Rhine riesling Sauvignon blanc Semillon Shiraz Sultana Traminer Trebbiano Verdelho Waltham cross
800 (5) 200 (1 8) 100 (7) 100 (na)
700 (6) 200 (23) 100 (8) 100 (na)
600 (8) zoo (1 1) 100 (9) 100 (na)
-
100 (4) -
300 (na)
-
300 (na)
-
300 (na)
-
300 (10) 6 100 (na)
-
400 (1 1) 6 200 (na)
300 (9) 6 100 (na)
Total wine grapes 15 888 16 300 16 300 16 600
Multipurpose grapes Muscat gordo blanco 3 206 3 100 (4) 3 100 (4) 3 100 (4) Muscat hamburgh 2 - - -
Sultana 44 480 44 700 (na) 45 100 (na) 45 400 (na) Waltham cross 1 100 1 000 (6) 1 000 (6) 900 (7)
Total drying and table 48 788 48 800 49 200 49 400
Total grapes - -
- Insignificant production of that variety. na Not applicable (average yields assumed). Note: The numbers in parentheses are the standard errors of forecasts, expressed as percentages of mean production estimates.
70 ABARE research report 92.1 7

33 Grape production in the rest of New South Wales
Cabemet sauvignon Chardonnay Chenin blanc Colombard Crouchen Doradillo Grenache Mataro Merlot Muscadelle Muscat blanc Muscat gordo blanco Muscat hamburgh Palomino Pinot noir Rhine riesling Sauvignon blanc Semillon Shiraz Sultana Traminer Trebbiano Verdelho Waltham cross
Total
Average 1988-89
to 1990-91
Projected
-
100 (na)
-
400 (na) -
400 (na)
- Insignificant production of that variety. na Not applicable (average yields assumed). Note: The numbers in parentheses are the standard errors of forecasts, expressed as percentages of mean production estimates.
Wine grape projections to 1994-95 71
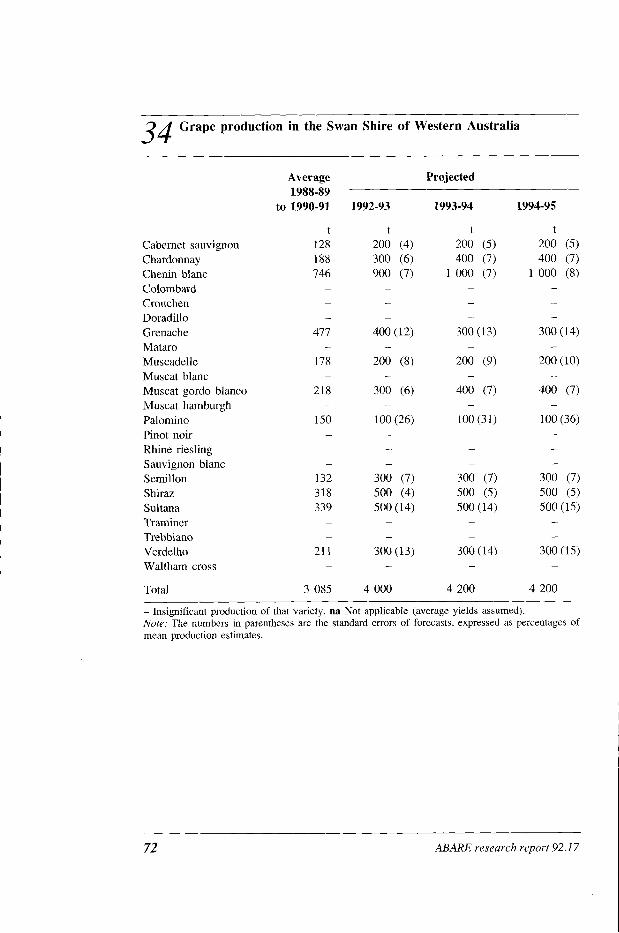
34 Grape production in the Swan Shire of Western Australia
Cabernet sauvignon Chardonnay Chenin blanc Colombard Crouchen Doradillo Grenache Mataro Muscadelle Muscat blanc Muscat gordo blanco Muscat hamburgh Palomino Pinot noir Rhine riesling Sauvignon blanc Semillon Shiraz Sultana Traminer Trebbiano Verdelho Waltham cross
Total
Average 1988-89
to 1990-91
Projected
- Insignificant production of that variety. na Not applicable (average yields assumed). Note: The numbers in parentheses are the standard errors of forecasts, expressed as percentages of mean production estimates.
72 ABARE research report 92.1 7

35 Grape production in the rest of Western Australia
Cabemet sauvignon Chardonnay Chenin blanc Colombard Crouchen Doradillo Grenache Mataro Muscadelle Muscat blanc Muscat gordo blanco Muscat harnburgh Palomino Pinot Noir Rhine riesling Sauvignon blanc Semillon Shiraz Sultana Traminer Trebbiano Verdelho Waltham cross
Average 1988-89
to 1990-91
Projected
Total 6 719 12 700 14 000 14 500
- Insignificant production of that variety. na Not applicable (average yields assumed). Note: The numbers in parentheses are the standard errors of forecasts, expressed as percentages of mean production estimates.
Wine grape projections to 1994-95

Appendix Winery intake of wine grapes, by variety and source
36 Winery grape intake, by source of grapes and variety, major varieties, 1991-92
Winery Grower owned owned Total
vineyards vineyards crush
t t t Major white varieties Chardonnay 18 198 25 857 44 055 Chenin blanc 2 151 7 959 10 110 Colombard 1 934 16 596 18 530 Crouchen 572 4 089 4 661 Doradillo 3 299 13 540 16 838 Muscadelle 99 1 2 897 3 888 Muscat blanclfrontignac 1 599 3 381 4 980 Muscat gordo blanco 6 170 74 527 80 697 Palomino/pedro 1 936 12 021 14 038 Rhine riesling 18 269 16 295 34 565 Sauvignon blanc 4 438 5 170 9 609 Semillon 4 761 29 437 34 198 Sultana 228 62 333 62 561 Traminer 3 758 2 918 6 676 Trebbiano 1 996 18 801 20 797 Verdelho 97 1 347 1 319 Waltharn cross 0 1 764 1 764
Total 71 272 298 013 369 287
Minor white varieties a 2 773 7 014 9 787
Total white 74 045 305 027 379 074
Major red varieties Cabemet sauvignon 15 307 23 855 39 161 Grenache 4 016 24 967 28 982 Malbec 1 106 1 345 2 451 Mataro 306 8 407 8 713 Merlot 1 227 2 340 3 568 Muscat hamburgh 0 430 430 Pinot noir 3 513 6 071 9 584 Shiraz 13 387 38 334 51 722
Total 38 862 105 749 144 611
Minor red varieties a 4 175 8 412 12 497
Total red 43 037 114 161 157 108
Total white and red 117 082 419 188 536 183
a See table 40. Note: Projections are based on planned grape intake by wineries surveyed.
Percentage from winery
vineyards
74 ABARE research report 92. I7

37 Winery grape intake, by source of grapes and variety, major varieties, 1992-93
Winery Grower owned owned Total
vineyards vineyards crush
t t t Major white varieties Chardonnay 20 289 31 892 52 181 Chenin blanc 2 210 8 292 10 502 Colombard 1 905 20 677 22582 Crouchen 653 3 275 3 928 Doradillo 3 040 10 385 13 425 Muscadelle 1 105 2 936 4 041 Muscat blanc/frontignac 1 500 3 382 4 882 Muscat gordo blanco 6 618 73 145 79 763 Palomino/pedro 1 808 10 991 12 799 Rhine riesling 17 250 16 065 33 315 Sauvignon blanc 4 131 5 594 9 725 Semillon 5 952 36 214 42 166 Sultana 210 53 970 54 180 Trarniner 3 608 3 131 6 739 Trebbiano 2 061 18 453 20 514 Verdelho 1 000 904 1 904 Waltham cross 0 1 750 1 750
Total 73 340 301 056 374 396
Minor white varieties a 2 606 6 358 8 964
Total white 75 946 307 414 383 360
Major red varieties Cabernet sauvignon 15 903 22 820 38 723 Grenache 4 318 26 439 30 757 Malbec 1 372 1 731 3 103 Mataro 420 8 614 9 034 Merlot 1 248 2 709 3 957 Muscat hamburgh 0 357 357 Pinot noir 3 631 6 093 9 724 Shiraz 15 545 46 230 61 775
Total 42 437 114 993 157 430
Minor red varieties a 4 173 8 040 12 213
Total red , 46 610 123 033 169 643
Total white and red 122 556 430 447 553 003
a See table 41. Note: Projections are based on planned grape intake by wineries surveyed.
Percentage from winery
vineyards
%
Wine grape projections to 1994-95 75

38 Winery grape intake, by source of grapes and variety, major varieties, 1993-94
Winery Grower Percentage owned owned Total from winery
vineyards vineyards crush vineyards
t t t % Major white varieties Chardonnay 22 031 36 272 58 303 38 Chenin blanc 2 210 8 990 11 200 20 Colombard 2 005 22 285 24 290 8 Crouchen 453 2 992 3 445 13 Doradillo 2 640 10 346 12 986 20 Muscadelle 1 062 3 094 4 156 26 Muscat blanclfrontignac 1 500 3 442 4 942 30 Muscat gordo blanco 7 233 74 030 81 263 9 Palomino/pedro 1 708 9 887 11 595 15 Rhine riesling 16 570 15 707 32 277 5 1 Sauvignon blanc 4 353 5 850 10 203 43 Semillon 6 782 37 356 44 138 15 Sultana 210 54 170 54 380 0 Traminer 3 608 3 275 6 883 52 Trebbiano 2 061 18 336 20 397 10 Verdelho 1 100 938 2 038 54 Waltham cross 0 1 750 1 750 0
Total 75 526 308 720 384 246 20
Minor white varieties a 2 718 5 918 8 636 3 1
Total white 78 244 314 638 392 882 20
Major red varieties Cabernet sauvignon 16 864 24 435 41 299 41 Grenache 4 129 27 226 31 355 13 Malbec 1 503 1 871 3 374 45 Mataro 420 8 907 9 327 5 Merlot 1 437 3 018 4 455 32 Muscat hamburgh 0 357 357 0 Pinot noir 3 766 6 758 10 524 36 Shiraz 17 428 49 891 67 319 26
Total 45 547 122 463 168 010 27
Minor red varieties a 4 724 8 596 13 320 35
Total red 50 271 131 059 181 330 28
Total white and red 128 515 445 697 574 212 22
a See table 42. Note: Projections are based on planned grape intake by wineries surveyed.
76 ABARE research report 92.1 7
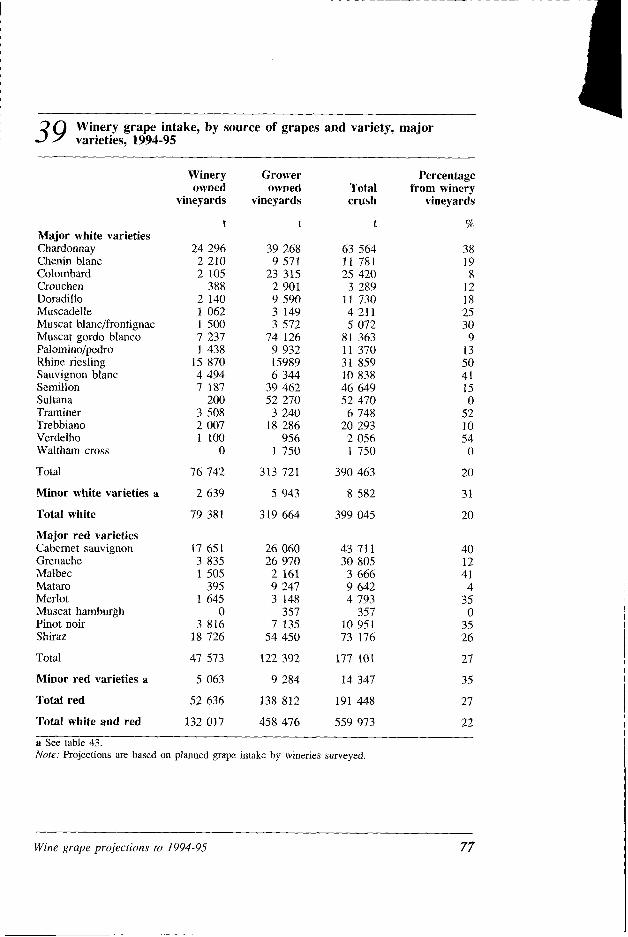
39 Winery grape intake, by source of grapes and variety, major varieties, 1994-95
Winery Grower Percentage owned owned Total from winery
vineyards vineyards crush vineyards
t t t % Major white varieties Chardonnay 24 296 39 268 63 564 38 Chenin blanc 2 210 9 571 11 781 19 Colombard 2 105 23 315 25 420 8 Crouchen 388 2 901 3 289 12 Doradillo 2 140 9 590 11 730 18 Muscadelle 1 062 3 149 4 211 25 Muscat blancJfrontignac 1 500 3 572 5 072 30 Muscat gordo blanco 7 237 74 126 81 363 9 Palomino/pedro 1 438 9 932 11 370 13 Rhine riesling 15 870 15989 31 859 50 Sauvignon blanc 4 494 6 344 10 838 4 1 Semillon 7 187 39 462 46 649 15 Sultana 200 52 270 52 470 0 Traminer 3 508 3 240 6 748 52 Trebbiano 2 007 18 286 20 293 10 Verdelho 1 100 956 2 056 54 Waltham cross 0 1 750 1 750 0
Total 76 742 313 721 390 463 20
Minor white varieties a 2 639 5 943 8 582 31
Total white 79 381 319 664 399 045 20
Major red varieties Cabernet sauvignon 17 651 26 060 43 711 40 Grenache 3 835 26 970 30 805 12 Malbec 1 505 2 161 3 666 41 Mataro 395 9 247 9 642 4 Merlot 1 645 3 148 4 793 35 Muscat hamburgh 0 357 357 0 Pinot noir 3 816 7 135 10 951 35 Shiraz 18 726 54 450 73 176 26
Total 47 573 122 392 177 101 27
Minor red varieties a 5 063 9 284 14 347 35
Total red 52 636 138 812 191 448 27
Total white and red 132 017 458 476 559 973 22
a See table 43. Note: Projections are based on planned grape intake by wineries surveyed.
Wine grape projections to 1994-95 77

40 Winery grape intake, by source of grapes and variety, minor varieties, 1991-92
Winery Grower Percentage owned owned Total from winery
vineyards vineyards crush vineyards
t t t % Minor white varieties Bianconelwhite grenache 2 927 929 0 Canada muscat 669 100 769 87 Emerald riesling 0 751 75 1 0 Sylvaner 1 138 885 2 023 56 Taminga 77 907 984 8 Other white varieties 886 3 443 4 329 20
Total 2 773 7 014 9 787 28
Minor red varieties Brown frontignac 275 413 688 40 Cabernet franc 1 450 1 816 3 266 44 Carignan 382 121 503 76 Fronti red 0 534 534 0 Ruby cabemet 718 2 549 3 267 22 Rubired 381 265 646 59 Tarrango 262 1123 1 385 19 Touriga 149 49 1 640 23 Other red varieties 557 1101 1 569 36
Total 4 175 8 412 12 497 3 3
Total white and red 6 948 15 426 22 284 3 1
Note: Projections are based on planned grape intake by wineries surveyed.
78 ABARE research report 92.1 7

Winery grape intake, by source of grapes and variety, minor 4 1 varieties, 1992-93
Winery Grower Percentage owned owned Total from winery
vineyards vineyards crush vineyards
t t t % Minor white varieties Bianconejwhite grenache 2 796 798 0 Canada muscat 67 5 200 875 77 Emerald riesling 0 600 600 0 Sylvaner 1 087 1 262 2 349 46 Taminga 85 660 745 I I Other white varieties 757 2 840 3 597 2 1
Total 2 606 6 358 8 964 29
Minor red varieties Brown frontignac 842 485 1 327 63 Cabemet franc 1 341 1 101 2 442 55 Carignan 350 105 455 77 Fronti red 0 820 820 0 Ruby cabernet 864 2 872 3 736 23 Rubired 392 264 656 60 Tarrango 296 1 138 1 434 21 Touriga 174 37 1 545 32 Other red varieties 464 949 1 413 33
Total 4 173 8 040 12 213 34
Total white and red 6 779 14 398 21 177 32
Note: Projections are based on planned grape intake by wineries surveyed.

Winery grape intake, by source of grapes and variety, minor 42 varieties, 1993-94
Winery Grower owned owned Total
vineyards vineyards crush
t t t Minor white varieties Bianconelwhite grenache 2 796 798 Canada muscat 67 5 250 925 Emerald riesling 0 600 600 Sylvaner 1 237 762 1 999 Taminga 85 660 745 Other white varieties 719 2 850 3 569
Total 2 718 5 918 8 636
Minor red varieties Brown frontignac 997 450 1 447 Cabernet franc 1 522 1 110 2 632 Carignan 350 105 455 Fronti red 0 870 870 Ruby cabernet 1 123 3 203 4 326 Rubired 377 264 64 1 Tarrango 305 1 168 1 473 Touriga 178 37 1 549 Other red varieties 5 67 1 055 1 622
Total 4 724 8 596 13 320
Total white and red 7 442 14 514 21 956
Note: Projections are based on planned grape intake by wineries surveyed.
Percentage from winery
vineyards
ABARE research report 92.17

Winery grape intake, by source of grapes and variety, minor 43 varieties, 1994-95
Winery Grower Percentage owned owned Total from winery
vineyards vineyards crush vineyards
t t t % Minor white varieties Biancone/white grenache 0 796 796 0 Canada muscat 675 300 975 69 Emerald riesling 0 600 600 0 Sylvaner 1 137 747 1 884 60 Taminga 85 660 745 1 I Other white varieties 742 2 840 3 582 21
Total 2 639 5 943 8 582 3 1
Minor red varieties Brown frontignac 1 057 470 1 527 69 Cabemet franc 1 597 1 165 2 762 58 Carignan 350 105 465 77 Fronti red 0 870 870 0 Ruby cabernet 1 256 3 690 4 946 25 Rubired 377 264 64 1 59 Tarrango 325 1 168 1 493 22 Touriga 180 37 1 55 1 33 Other red varieties 66 1 1 181 1 842 36
Total 5 063 9 284 14 347 35
Total white and red 7 702 15 227 22 929 34
Note: Projections are based on planned grape intake by wineries surveyed.
Wine grape projections to 1994-95 81

References
Abdalla, A., Kelly, J. and Proctor, W. 1991, Wine Grapes: Supply Projections to 1993-94, ABARE, Canbena.
Australian Bureau of Statistics 1992a, Sales of Australian Wine and Brandy by Winemakers, cat. no. 8504.0, Canbena, June (and previous issues).
- 1992b, Viticulture Australia, 1990-91, cat. no. 7310.0, Canberra.
Australian Wine and Brandy Corporation 1990, Future Export Directions for the Australian Wine Industry, Adelaide.
- 1992, Approved Wine Shipments Year Ending June 1992, Adelaide (and previous issues).
Barnes, P. 1990, 'The Australian wine industry: structural change and challenges for the 907s', Australian Grapegrower and Winemaker, Adelaide, February.
Barr, E.W. 1983, Grapes, Paper presented at the National Agricultural Outlook Conference, Canberra, 25-27 January.
Campbell, M. 1992, Wine Grape Industry in the Murray Valley: Supply I
Changes and Price Negotiation, Paper prepared for the Victorian Department of Food and Agriculture, Mildura, April.
Duffus, G. and Milham, N. 1989, Supply Projections for Winegrapes, ABARE, Canberra.
Hamilton, R.P. 1990, 'Australian grapevine cuttings for 1989, data on cuttings distributed through the Australian Vine Improvement Association', Australian Grapegrower and Winemaker, no. 316, Adelaide.
- 1991, 'Australian grapevine cuttings 1990, collated data on cuttings distributed through the Australian Vine Improvement Association', Australian Grapegrower and Winernaker, no. 328, Adelaide.
82 ABARE research report 92.1 7

- 1992, Australian grapevine cuttings for 1991; collected data on cuttings distributed through the Australian Vine Improvement Association, South Australian Department of Agriculture, Adelaide (unpublished).
Hesketh, R.W. 1982, Wine grapes, Paper presented at the National Agricultural Outlook Conference, Canberra, 26-28 January.
Johnston, J. 1984, Econometric Methods, McGraw-Hill, Tokyo.
Kaine, G. and Gow, J. 1991, Agricultural policy: the case of Vine Pull Scheme, Paper presented at the 35th Annual Conference of the Australian Agricultural Economics Society, Armidale, February.
Mychasuk, E. 1991, 'Price increases buoy wine sector', Sydney Morning Herald, 5 March.
Proctor, W. and Phillips, B. 1991, Wine Grapes: Demand Projections to 1993-94, ABARE, Canberra.
Sholefield, P. 1992, 'Rootstocks: when are they needed', Successful Horticulture (Melbourne), vol. 3, no. 5, p. 23.
US Department of Agriculture 1992, 'The world wine situation', Horticultural Products Review, July, FHORT 7-92, Washington DC.
Wine grape projections to 1994-95

Recent ABARE horticulture publications
Simmons, P., Poulter, D. and Hall, N. 1991, Management of Irrigation Water in the Murray-Darling Basin, ABARE Discussion Paper 91.6, AGPS, Canberra. $13
Proctor, W., Kelly, J., Phillips, B., Abdalla, A. and Mallawaarachchi, T. 1992, Future Directions for Horticulture, ABARE Research Report 92.4, Canberra. $16
Proctor, W., Phillips, B., Kelly, J. and Van Hilst, R. 1992, Competitiveness of the US and Australian Citrus Industries, ABARE Research Report 92.14, Canberra. $15
(This report, ABARE Research Report 92.17, is priced at $17)
To order publications, contact Denise Flamia on (06) 272 221 1 or write to: Publications Officer, ABARE, GPO Box 1563, Canberra 2601.
84 ABARE research report 92.1 7

ABARE projections of the availability of grapes for wine making indicate an increase of 16 per cent in the total production of grapes available for wine making over the period 199 1-92 to 1994-95. Over the same
period planned grape intake by wineries is expected to increase by around 10 per cent.
A prolected 28 per cent increase in produclion of premium w h ~ l e grape varieties is expected to be matched by a 25 per cent ~ncrease In intake by
wlnenes, a 28 per increase In m a k e of premlum red wlne grapes should be met from a prolected 30 per
cent increase in production of these grapes
ABARI? RESEARCH REPORT 92.1 7
I
e ABARE