Projected Change in Working Age Population (Age 25-64) by Race/Ethnicity, 2000-2030
26
Higher Education: A Presentation to the Budget Trends Commission May 27, 2008 Mark Misukanis Director of Fiscal Policy and Research Office of Higher Education 1
description
Higher Education: A Presentation to the Budget Trends Commission May 27, 2008 Mark Misukanis Director of Fiscal Policy and Research Office of Higher Education. Projected Change in Working Age Population (Age 25-64) by Race/Ethnicity, 2000-2030. 7%. 152%. 270%. 169%. 341%. 75%. - PowerPoint PPT Presentation
Transcript of Projected Change in Working Age Population (Age 25-64) by Race/Ethnicity, 2000-2030
Higher Education:A Presentation to the
Budget Trends Commission May 27, 2008
Mark MisukanisDirector of Fiscal Policy and Research
Office of Higher Education
1

Projected Change in Working Age Population (Age 25-64) by Race/Ethnicity, 2000-2030
Source: Minnesota State Demographic Center
7% 152% 270% 169%
75%
341%

Projected Percent Minority by Age Group 2000-30
3Source: Minnesota State Demographic Center

Educational Attainment and Rank Among States—Minnesota, 2000 (Percent)
19th
9th
7th
1st
12th
01020304050
Age 25-64 withGraduate/Prof. Degree
Age 25-64 with Bachelor's orHigher
Age 25-64 with AssociateDegree
Age 25-64 with High SchoolDiploma
Age 18-24 with High SchoolDiploma
Source: U.S. Census Bureau, 2000 Census
79.3
9.0
92.4
8.9
30.5
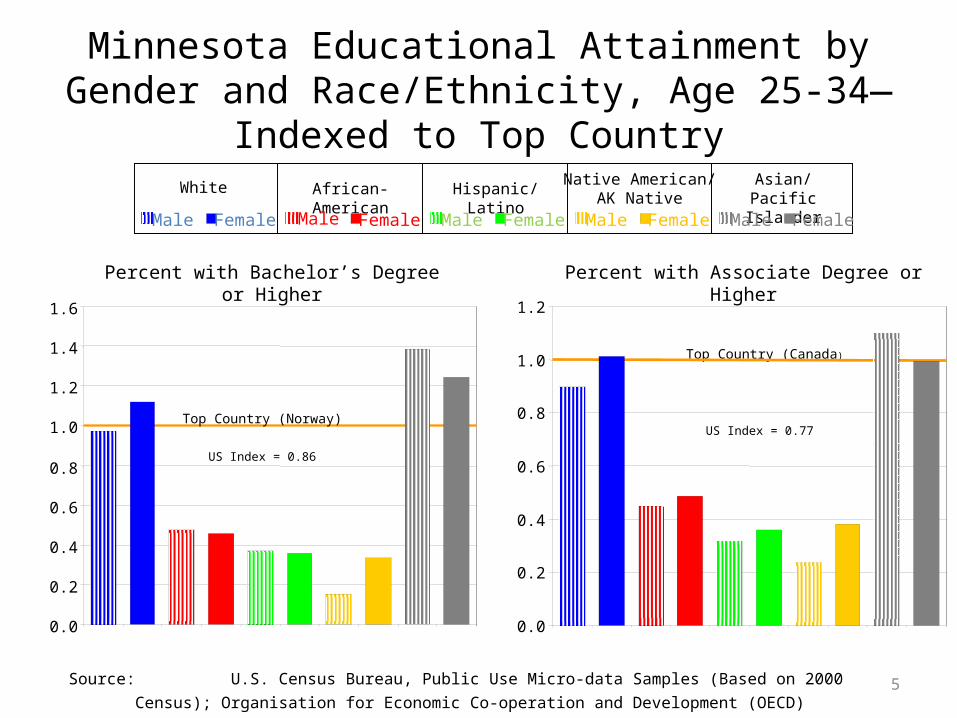
Minnesota Educational Attainment by Gender and Race/Ethnicity, Age 25-34—Indexed to Top Country
5
Percent with Bachelor’s Degree or Higher Percent with Associate Degree or Higher
White African-American Hispanic/Latino Native American/AK Native
Asian/Pacific Islander
Male Female Male Female Male Female Male Female Male Female
Source: U.S. Census Bureau, Public Use Micro-data Samples (Based on 2000 Census); Organisation for Economic Co-
operation and Development (OECD)
0.0
0.2
0.4
0.6
0.8
1.0
1.2
1.4
1.6
Top Country (Norway)
US Index = 0.86
Top Country (Canada)
US Index = 0.77
0.0
0.2
0.4
0.6
0.8
1.0
1.2

Minnesota High School Graduates1991-92 through 2014-15
6Source: Minnesota State Demographer and Office of Higher Education
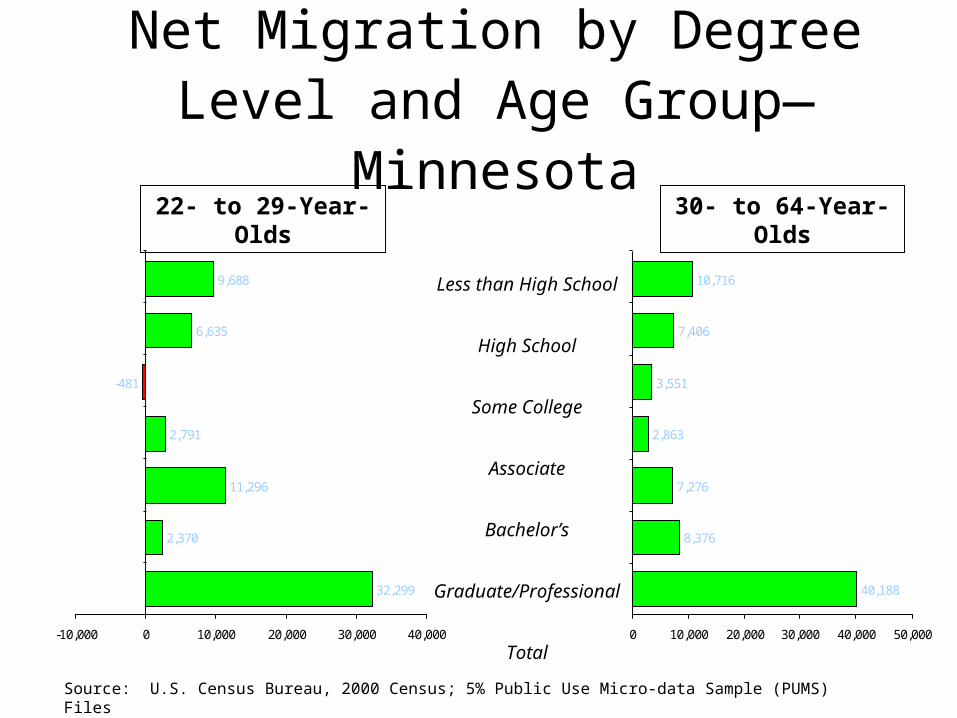
Net Migration by Degree Level and Age Group—Minnesota
Source: U.S. Census Bureau, 2000 Census; 5% Public Use Micro-data Sample (PUMS) Files
22- to 29-Year-Olds 30- to 64-Year-Olds
32,299
2,370
11,296
2,791
-481
6,635
9,688
-10,000 0 10,000 20,000 30,000 40,000
40,188
8,376
7,276
2,863
3,551
7,406
10,716
0 10,000 20,000 30,000 40,000 50,000
Less than High School
High School
Some College
Associate
Bachelor’s
Graduate/Professional
Total

Post Secondary Headcount Enrollment 1997-2006
8
Annual Growth
1997 1998 1999 2000 2001 2002 2003 2004 2005 2006 RatePublic InstitutionsCommunity and Technical Colleges 96,417 93,631 98,509 101,875 105,267 109,844 113,408 112,582 112,111 114,616 1.9%State Universities 53,239 51,503 55,815 58,073 60,523 62,704 63,686 63,542 63,654 63,785 2.0%University of Minnesota 58,937 61,284 58,161 59,183 60,433 62,789 63,769 65,247 65,489 65,753 1.2%
Total Public 208,593 206,418 212,485 219,131 226,223 235,337 240,863 241,371 241,254 244,154 1.7%
Private InstitutionsColleges & Universities 58,773 62,084 54,013 57,351 57,649 59,948 60,480 61,912 63,067 64,433 1.0%Career Schools 7,020 8,772 10,977 9,705 9,624 12,845 33,511 40,967 56,455 23,343 13.4%Career Online Schools 50,572
Graduate & Professional 4,977 5,745 4,144 3,423 3,661 3,108 4,812 4,132 4,129 4,103 -2.1%
Total Private 70,770 76,601 69,134 70,479 70,934 75,901 98,803 107,011 123,651 142,451 7.8%
Total Enrollment 279,363 283,019 281,619 289,610 297,157 311,238 339,666 348,382 364,905 386,605 3.6%
Public Share of Total 74.7% 72.9% 75.5% 75.7% 76.1% 75.6% 70.9% 69.3% 66.1% 63.2%
Source: Office of Higher Education

Allocation of AppropriationsFY 2008-09 Biennium
9Source: Department of Finance

Higher Education Spendingas a Percent of the General Fund
10Source: Department of Finance: February 2008 Forecast

Minnesota State Colleges and Universities Revenue Components
(000’s)
11Source: Integrated Postsecondary Education Data System

Minnesota State Colleges and UniversitiesTuition as a Share of Total Revenue
12Source: Integrated Postsecondary Education Data System

University of Minnesota Revenue Components
(000’s)
13Source: Integrated Postsecondary Education Data System

University of Minnesota Tuition as a Share of Total Revenue
14Source: Integrated Postsecondary Education Data System
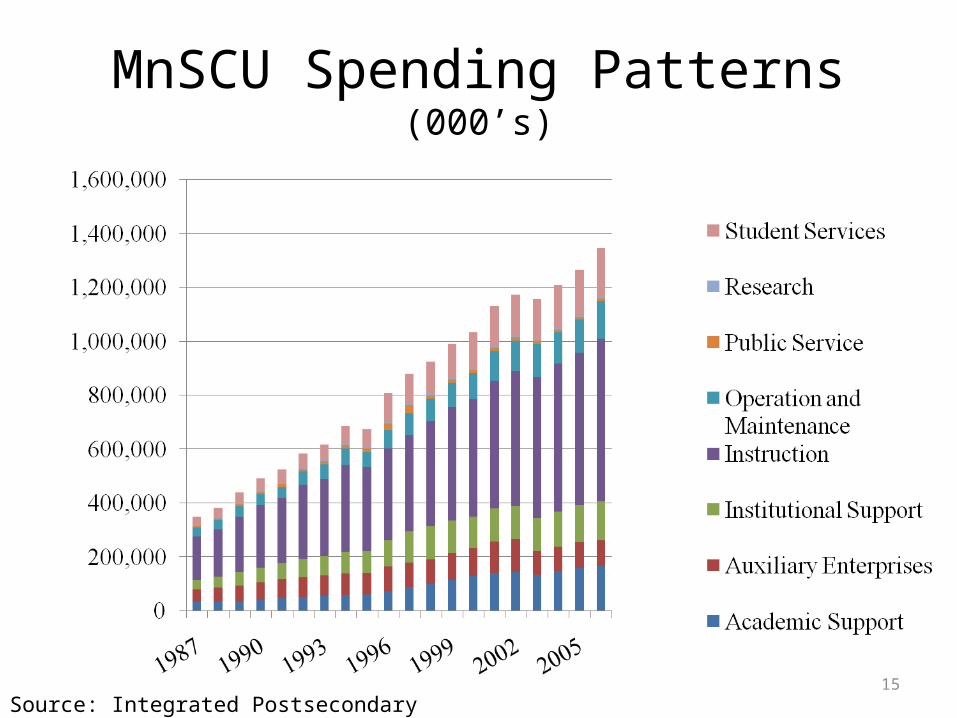
MnSCU Spending Patterns(000’s)
15Source: Integrated Postsecondary Education Data System

MnSCU Instructional Spendingas a Share of Total
16Source: Integrated Postsecondary Education Data System

U of M Spending Patterns(000’s)
17Source: Integrated Postsecondary Education Data System
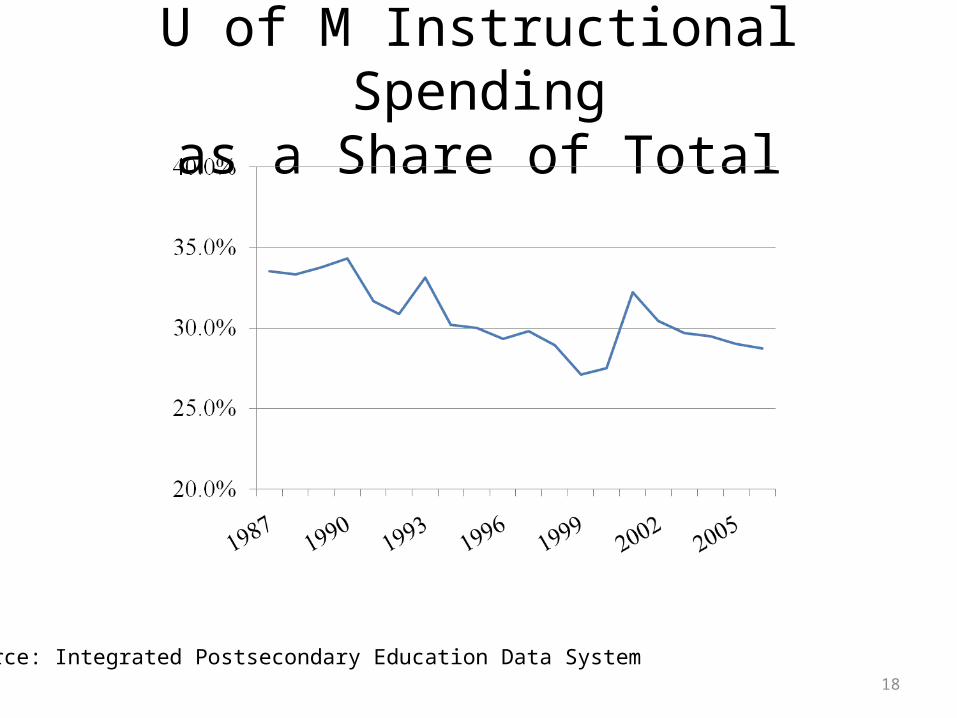
U of M Instructional Spendingas a Share of Total
18
Source: Integrated Postsecondary Education Data System
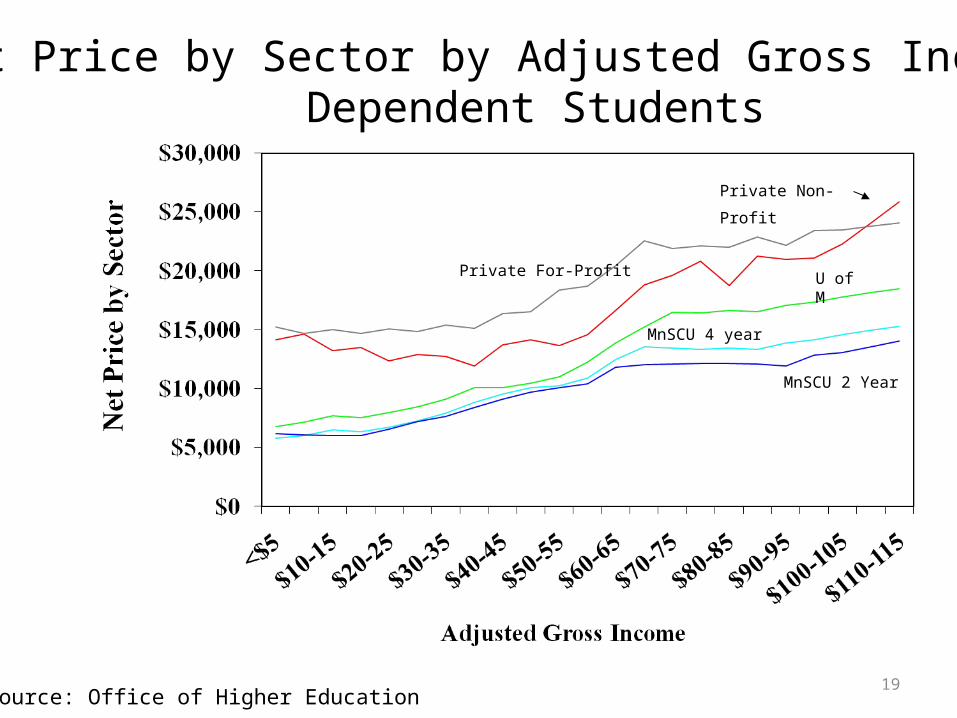
Net Price by Sector by Adjusted Gross Income Dependent Students
Private Non-Profit
Private For-Profit U of M
MnSCU 4 year
MnSCU 2 Year
19Source: Office of Higher Education

Student and Parent Saving
20
Minnesota 529 Plan :• Operating since 2001
• Current Assets of $625 million
• Account Beneficiaries 48,058

Student Borrowing
21
•In general, a larger percent of undergraduates in Minnesota had student loans than nationally, and Minnesota students borrowed more, on average, during the 2003-2004 academic year.
• Among Minnesota undergraduates who attended full-time for the full academic year, 63 percent had student loans.
• The average annual amount borrowed by all undergraduates was approximately $5,500. Full-time students who attended for the full academic year borrowed an average of $6,600 annually.

Student Borrowing (Continued)
22
•Much of the recent increase in the percentage of students with loans occurred in the upper income brackets. In 2000, 28 percent of full-time, full-year dependent students in Minnesota coming from families with incomes of $90,000 or more had student loans while, in 2004, 57 percent of similar students had loans.
• In Minnesota, full-time, dependent students whose parents belong to the middle income categories ($30,000-$89,999) were still more likely to borrow than those in the lowest or highest income categories.
•In recent years, students have increased their reliance on “alternative” student loans from on-federal sources.
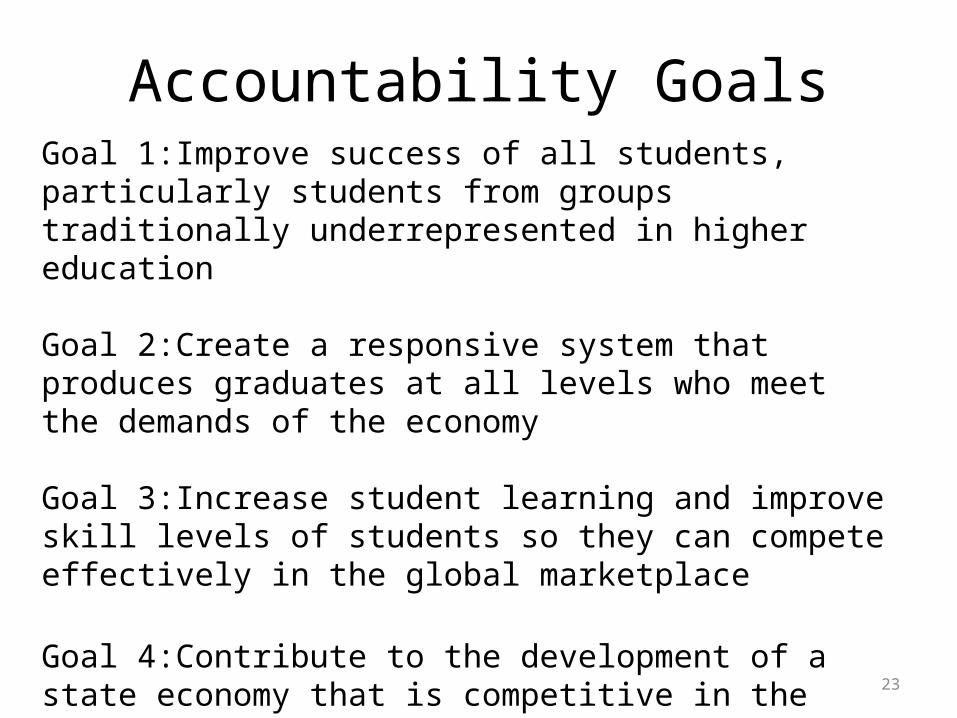
Accountability Goals
23
Goal 1:Improve success of all students, particularly students from groups traditionally underrepresented in higher education
Goal 2:Create a responsive system that produces graduates at all levels who meet the demands of the economy
Goal 3:Increase student learning and improve skill levels of students so they can compete effectively in the global marketplace
Goal 4:Contribute to the development of a state economy that is competitive in the global market through research, workforce training and other appropriate means
Goal 5:Provide access, affordability and choice to all students
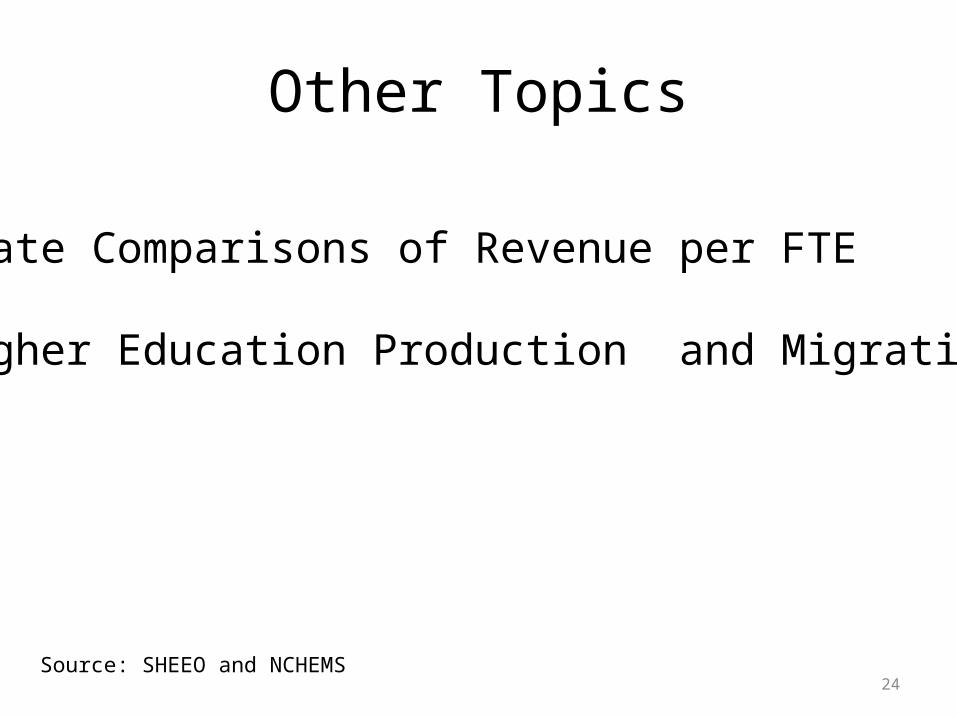
Other Topics
24
State Comparisons of Revenue per FTE
Higher Education Production and Migration
Source: SHEEO and NCHEMS

Future Budget Issues
25
1.High School Graduates and Preparation
2.The New Millennial Student
3.Faculty Retirements and Replacement
4.Workforce Supply
5. Facility Utilization and Other Cost Issues

26
Mark MisukanisDirector of Fiscal Policy and ResearchMinnesota Office of Higher Education