Tools & Techniques Idea Generating Solution Generating Solution Selection.

Projected 2016-2020 Existing Generating Unit Retirements Under EPA 111(d) Proposal
2 3
States with Announced Coal Unit Retirements and Conversions Due to EPA Policies*
*361 units nationally representing 55,702 MW of Capacity. 318 units are retiring, 43 are converting to natural gas or biomass.
Source Data: ACCCE, Coal Unit Shutdowns as of July 28th, 2014; www.americaspower.org
Announced Coal Plant Retirements and Conversions due to EPA Policies (as of July 28, 2014)
States with EPA-Projected Coal Unit Retirements Under 111(d) Proposal* (2016-2020)
Source Data: http://www.regulations.gov/#!documentDetail;D=EPA-HQ-OAR-2013-0602-0220
*Excludes committed retirements prior to 2016
2016-2020 Coal Plant Retirements projected under EPA’s 111(d) proposal
EPA-Projected Coal Capacity Retirements Under 111(d) Proposal* (2016-2020)
Up to 2,500 MW Capacity
2,500 – 5,000 MW Capacity
> 5,000 MW Capacity
111(d) State Legislation and Resolutions Adopted During 2014 Session
111(d) Legislation Passed
111(d) Resolution Passed
111(d) Legislation in Progress
VA – Study Bill
Source Data: http://www.regulations.gov/#!documentDetail;D=EPA-HQ-OAR-2013-0602-0220
*Excludes committed retirements prior to 2016
4 5
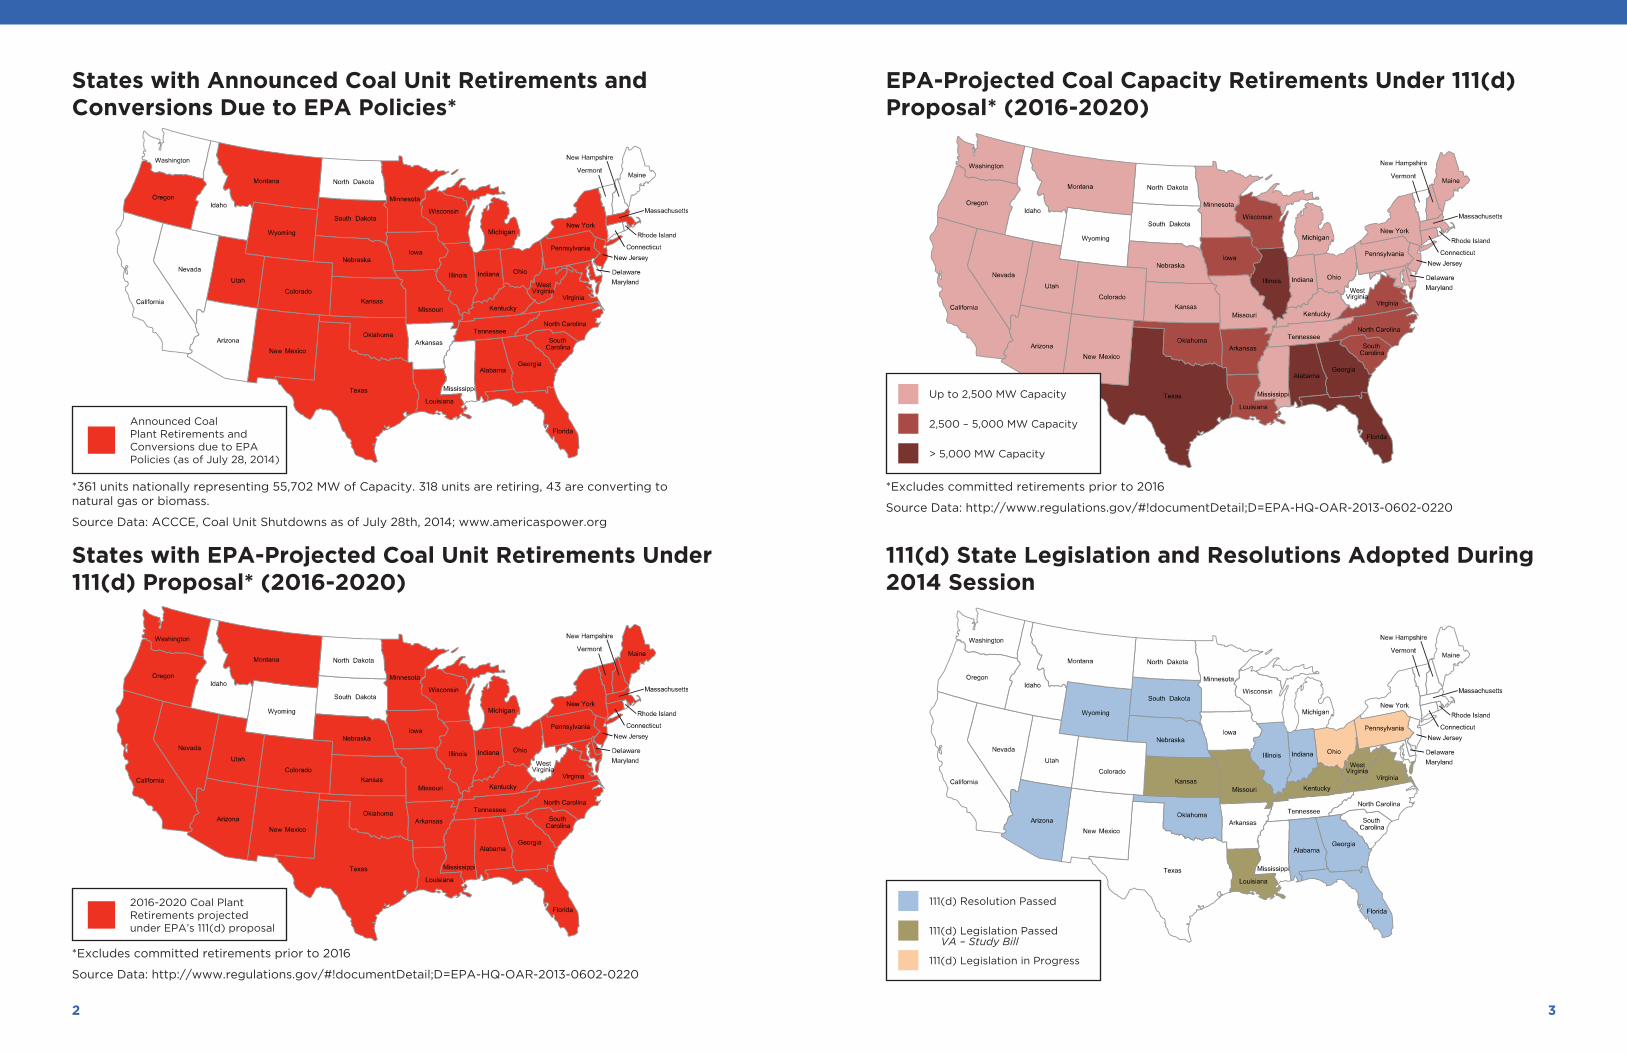
OVERVIEWAccording to EPA predictions, approximately 50 gigawatts of retirements of baseload coal generation could occur between 2016 and 2020 due to its proposed regulations to reduce CO
2 from existing coal-fueled power plants commonly called EPA’s “Clean Power Plan.”
This is in addition to the approximately 70 gigawatts of coal-fueled generation that EPA acknowledges has already retired or will retire this decade due to other factors. This combined total of lost generation is enough to power 60 million homes. Almost every state would experience retirements shown on the maps and spreadsheet from EPA’s database.
Greater or fewer Clean Power Plan retirements, and differences in associated jobs, electricity costs and output from manufacturing and agriculture-based economies might occur depending upon a state’s ability to achieve EPA’s very high levels of plant unit and consumer end use energy efficiency, natural gas generating unit capacity factor, and new renewable and nuclear generating unit deployments on EPA’s extremely ambitious schedule.
Summary of EPA 111d Generation Retirements• According EPA’s IPM modeling of the proposed 111(d) rule using a regional compliance
approach, 132 GW of generating capacity will retire between 2016 and 2020.
• 68 GW of the 132 GW is projected to retire directly in response to the proposed 111(d) rule (i.e. is incremental), including 46 GW of low cost, base load, coal generation and 11 GW of oil/gas steam generation.
• Of the 68 GW projected to come off-line directly in response to the rule, 44 GW is projected to retire in 2016 or less than 18 months from now.
- Includes 28 GW of coal units and 11 GW of oil/gas steam units which are likely in the process of engineering and constructing (i.e. spending money on) emission control equipment to become MATS compliant.
- Retirement of this 44 GW has likely not been considered within reliability planning efforts.
• Between 2010 and 2015 EPA has also concluded that 48 GW of capacity has retired or has firm plans to retire, including 30 GW of coal.
• In total, EPA projects 180 GW of electric generation capacity will retire between 2010 and 2020 in response to the 111(d) rule and other factors.
- This represents greater than 15% of the total U.S. installed capacity.
Notes:
1. EPA’s IPM analysis assumes “building blocks” are available for compliance commensurate with their assumptions in developing state targets. Real world achievability of building blocks could result in dramatically different retirement scenarios in the various states.
2. Accompanying unit specific spreadsheet shows a total of 121 GW of retirements during 2016-20 (less than the 132 GW total shown above). This is because it does NOT account for 11 GW of capacity that EPA projects will be retired but cannot be explicitly attributed to a specific generating unit due to the unique IPM modeling process.
Source Data: http://www.regulations.gov/#!documentDetail;D=EPA-HQ-OAR-2013-0602-0220
State Retired Capacity (MW)
PlantCoal
SteamCombined
CycleCombustion
TurbineIGCC Nuclear
O/G Steam
Grand Total
Alabama 5,976 5,976
Barry 886 886
Charles R Lowman 80 80
Colbert 1,184 1,184
E C Gaston 1,020 1,020
Gadsden 130 130
Gorgas 1,241 1,241
Greene County 497 497
Widows Creek 938 938
Arizona 766 766
Apache Station 350 350
Cholla 260 260
H Wilson Sundt Generating Station
156 156
Arkansas 4,007 743 4,750
Harvey Couch 123 123
Independence 1,678 1,678
Lake Catherine 620 620
Plum Point Energy Station
670 670
White Bluff 1,659 1,659
California 120 2,602 1,236 6,122 10,080
AES Alamitos LLC 667 667
Agnews Power Plant 30 30
Alameda 44 44
Almond Power Plant 50 50
Berry Cogen 35 35
Berry Cogen Tanne Hills 18
14 14
Cardinal Cogen 41 41
Carson Ice-Gen Project
58 51 109
Civic Center 24 24
Coalinga 25D Cogen 11 11
Coalinga Cogeneration
36 36
Coalinga Cogeneration Facility
6 6
Combustion Turbine Project No 2
49 49
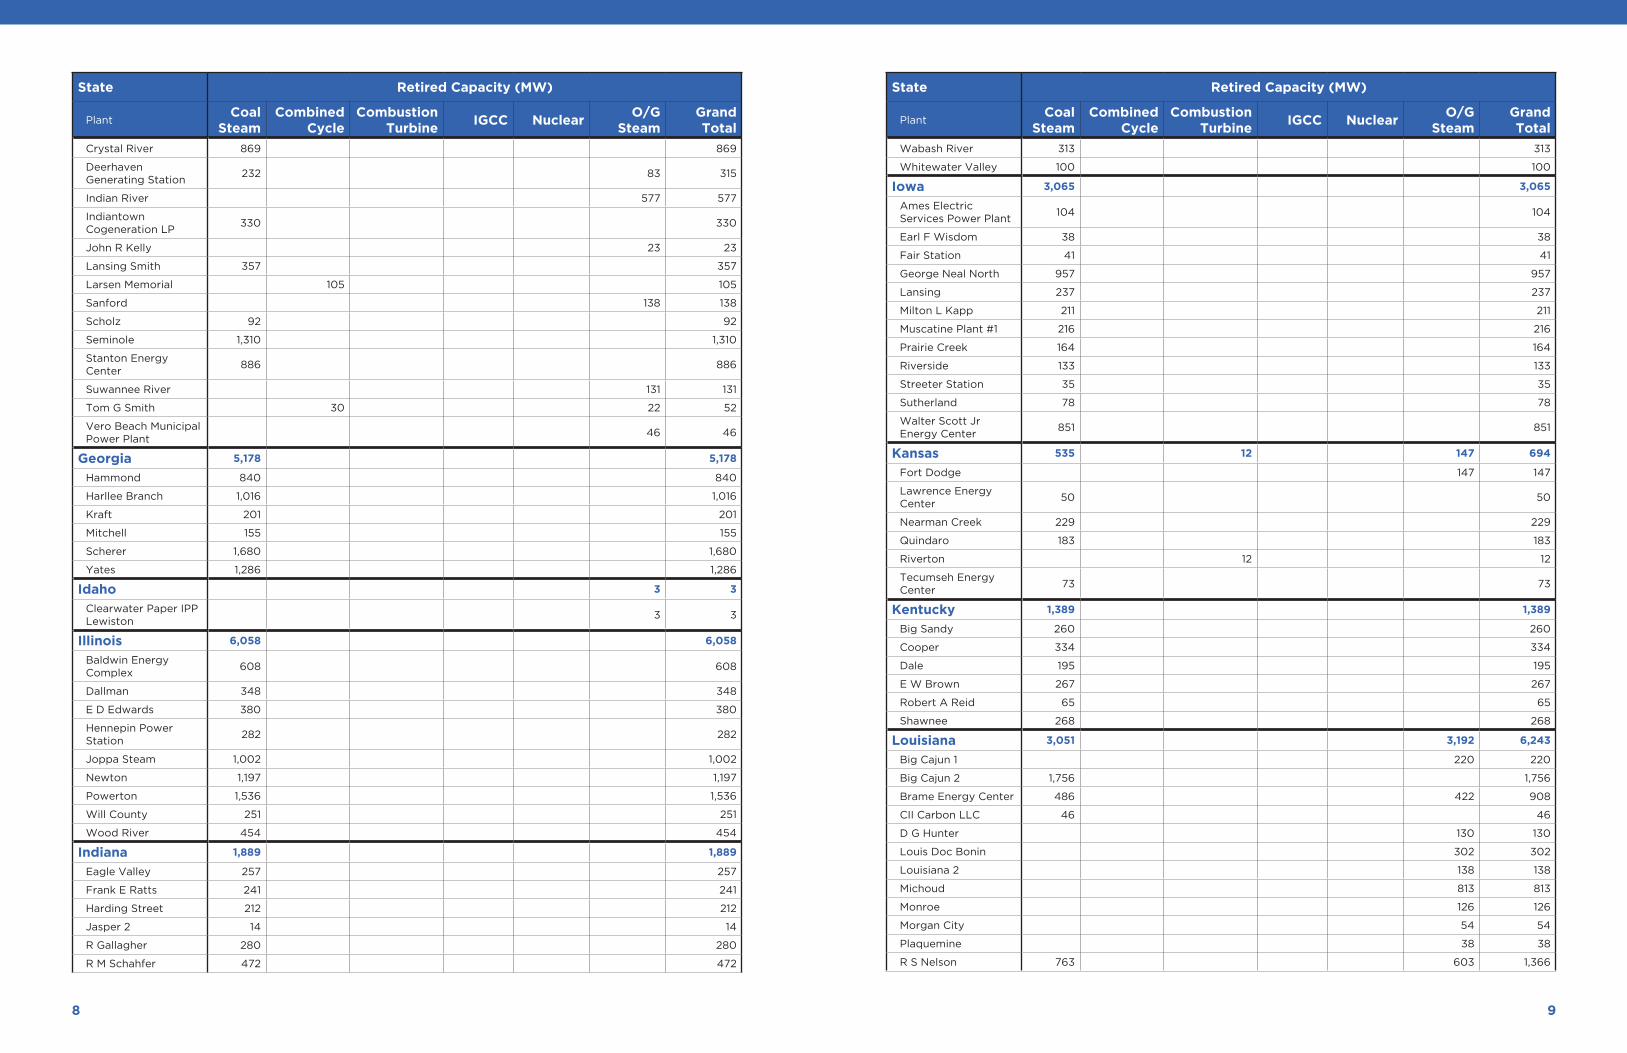
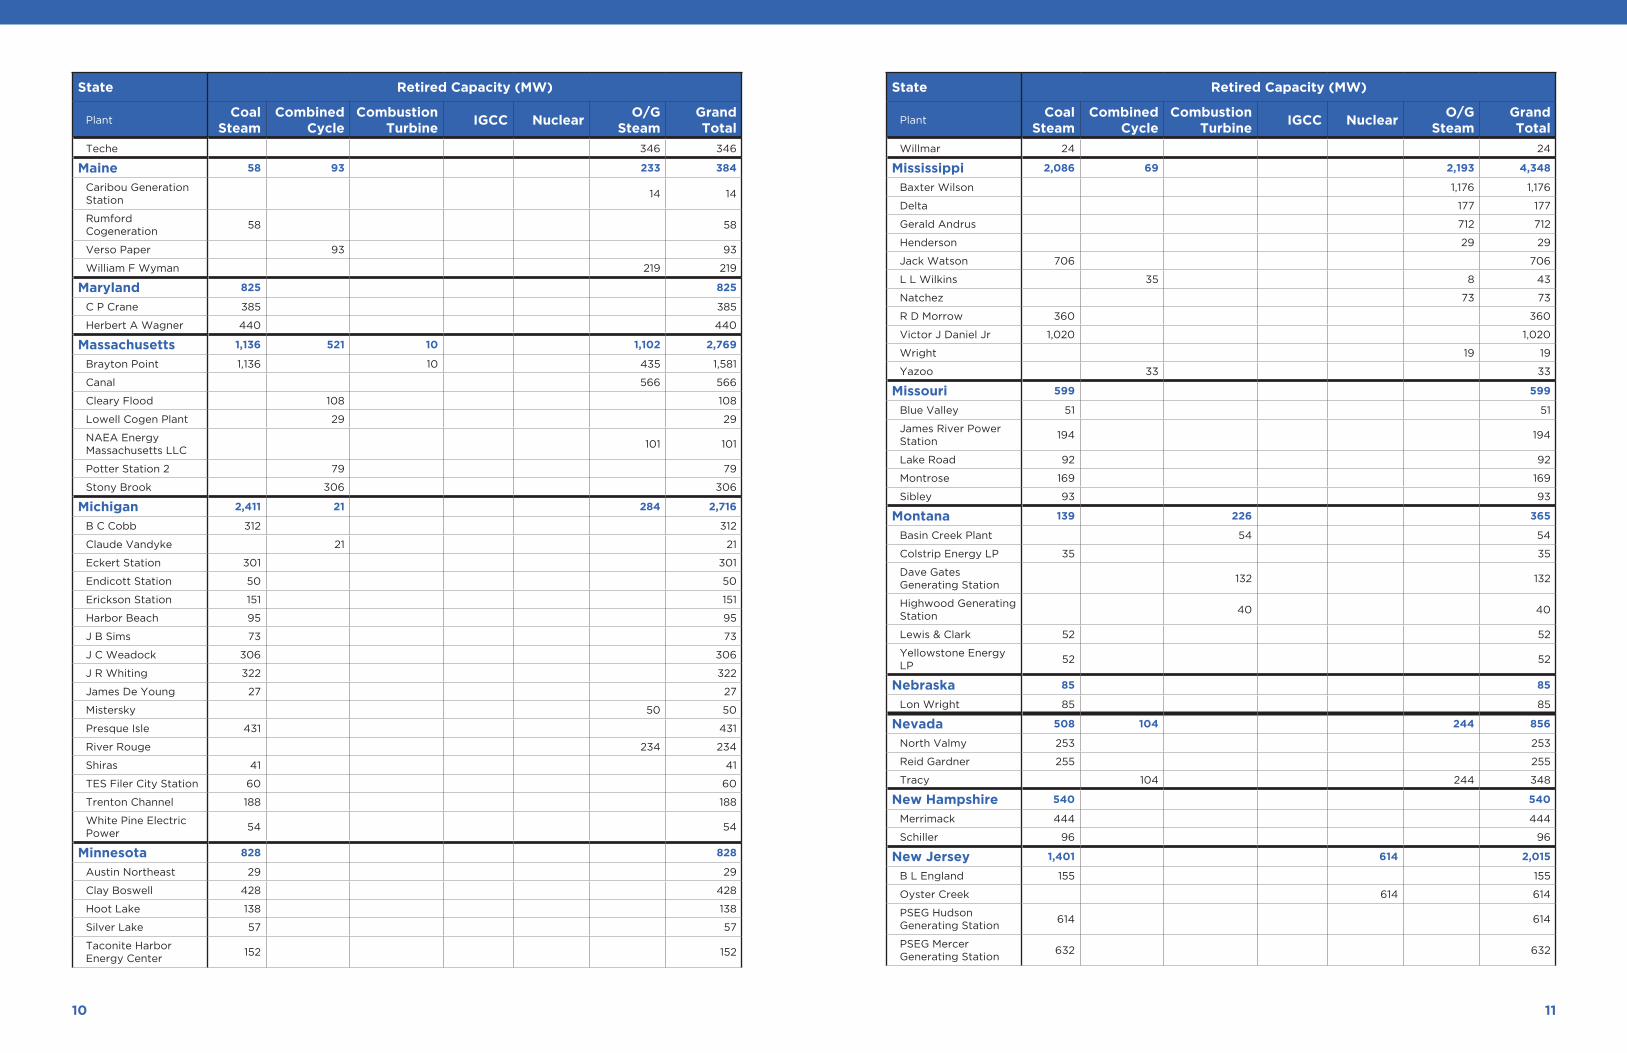
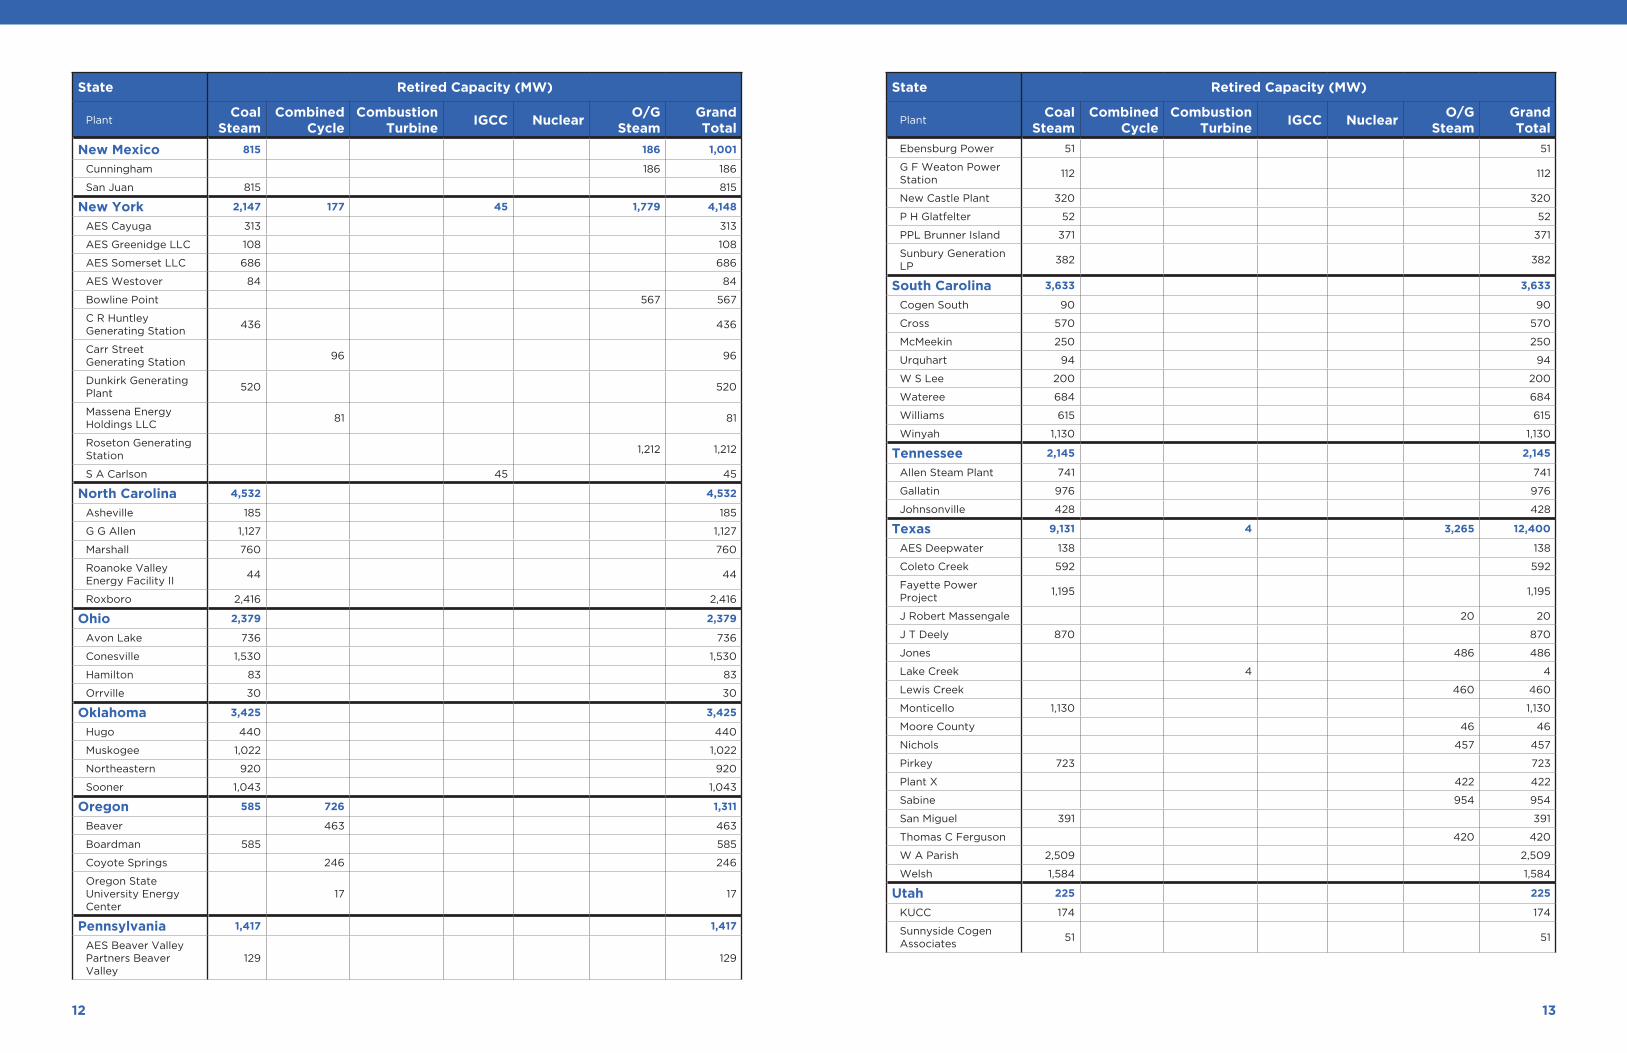
Projected 2016-2020 EGU Retirements Under 111(d) Proposal*
EPA’s IPM Assessment of Option 1 with Regional Compliance 2020 Run Year
6 7
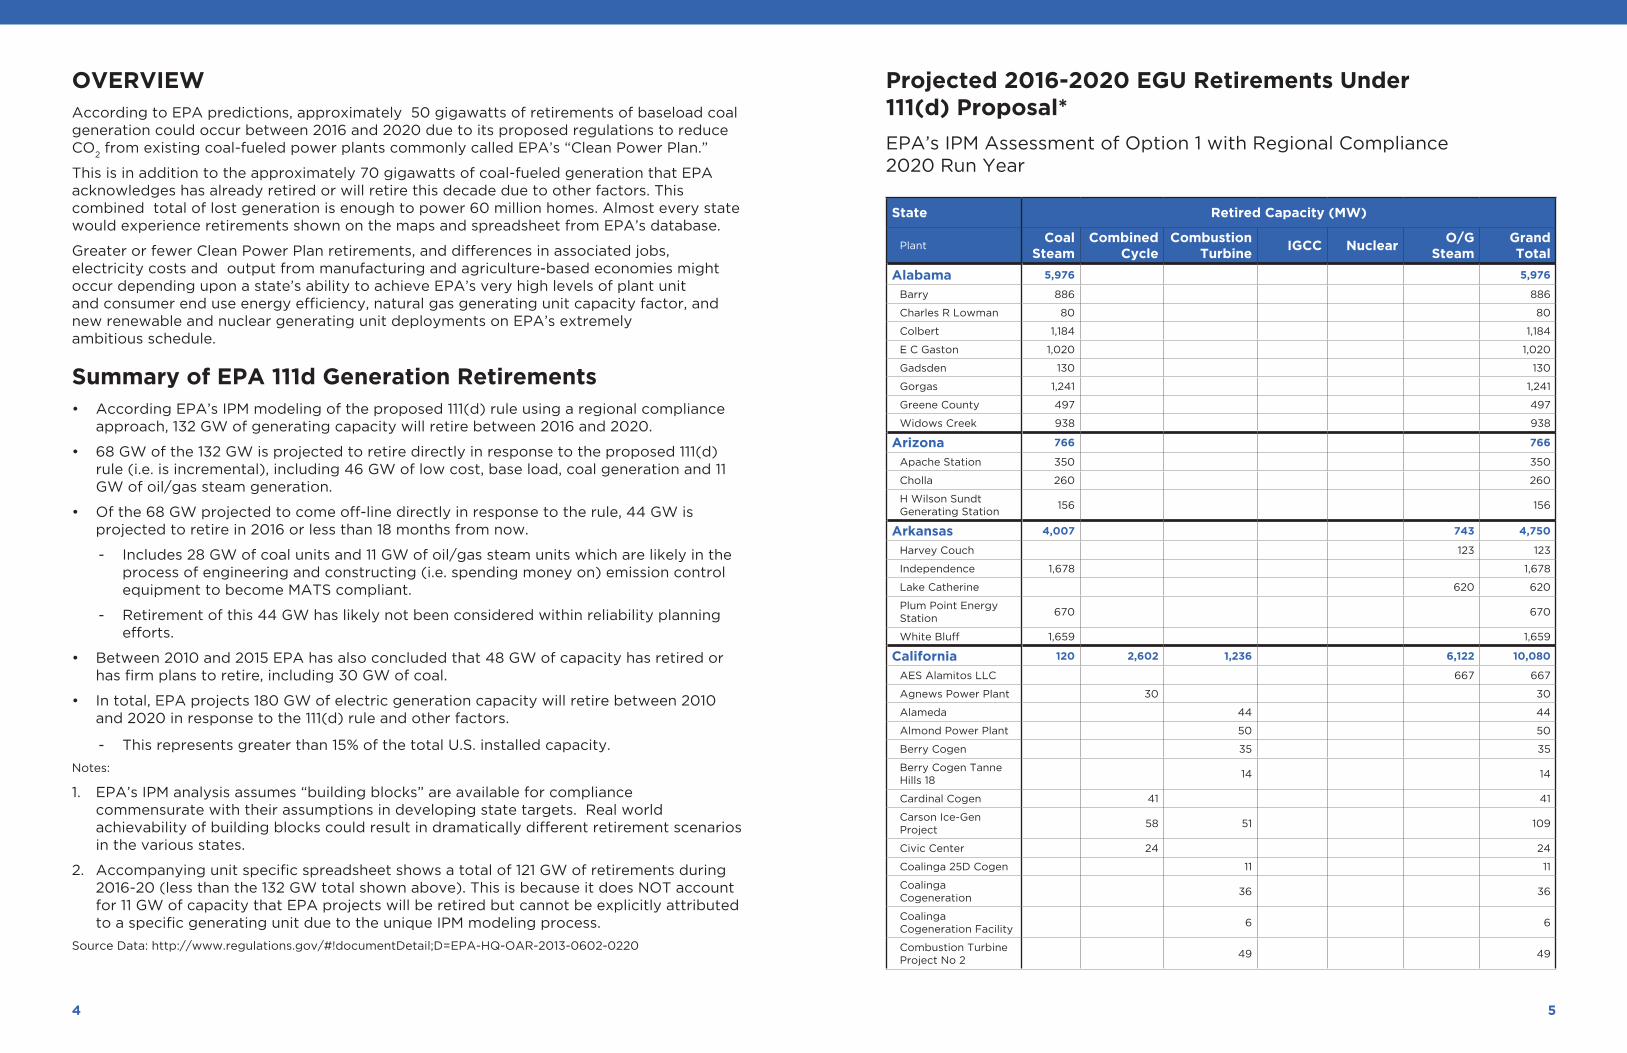
State Retired Capacity (MW)
PlantCoal
SteamCombined
CycleCombustion
TurbineIGCC Nuclear
O/G Steam
Grand Total
Coolwater 462 462
Cymric 31X Cogen 5 5
Cymric 36W Cogen 11 11
Cymric 6Z Cogen 5 5
DAI Oildale 30 30
Dome Project 6 6
Dynegy Morro Bay LLC
999 999
Dynegy Moss Landing Power Plant
1,509 1,509
Dynegy Oakland Power Plant
165 165
El Centro 110 116 226
Foster Wheeler Martinez
104 104
Fresno Cogen Partners
73 73
Frito-Lay Cogen Plant 6 6
Gateway Generating Station
563 563
Gianera 52 52
Gilroy Power Plant 105 105
Grayson 57 57
Greenleaf 2 Power Plant
50 50
Harbor 225 225
Harbor Cogen 81 81
Haynes 974 974
JRW Associates LP 2 2
Kern River Eastridge Cogen
42 42
Kern River Fee A Cogen
6 6
Kern River Fee B Cogen
3 3
Kern River Fee C Cogen
6 6
King City Power Plant 111 111
Kingsburg Cogen 34 34
Lodi 23 23
McClellan 77 77
McClure 112 112
McKittrick Cogen 9 9
North Midway Cogen 9 9
Oildale Energy LLC 39 39
Olive 99 99
Olive View Medical Center
5 5
OLS Energy Chino 29 29
State Retired Capacity (MW)
PlantCoal
SteamCombined
CycleCombustion
TurbineIGCC Nuclear
O/G Steam
Grand Total
Panoche Peaker 40 40
Pittsburg Power 1,311 1,311
Redding Power 106 106
Rio Bravo Jasmin 33 33
Rio Bravo Poso 33 33
Roseville 42 42
Salinas River Cogeneration
33 33
San Jose Cogeneration
6 6
Santa Clara Cogen 8 8
Sargent Canyon Cogeneration
30 30
SCA Cogen 2 134 134
Scattergood 445 445
Sconza Candy Company
5 5
SPA Cogen 3 164 164
Stockton Cogen 54 54
Taft 26C Cogen 11 11
United Cogen 29 29
Walnut 47 47
Wheelabrator Lassen 43 43
Wheelabrator Norwalk Energy
27 27
Woodland 48 48
Colorado 645 645
Arapahoe 109 109
Cherokee 352 352
Valmont 184 184
Connecticut 394 1,669 2,063
Bridgeport Station 394 394
Middletown 400 400
Montville Station 491 491
New Haven Harbor 448 448
NRG Norwalk Harbor 330 330
Delaware 260 260
Edge Moor 260 260
Florida 7,260 135 2,192 9,587
Anclote 1,011 1,011
Arvah B Hopkins 76 76
Big Bend 1,552 1,552
C D McIntosh Jr 342 85 427
Cedar Bay Generating Company LP
249 249
Central Power & Lime 135 135
Crist 906 906
8 9
State Retired Capacity (MW)
PlantCoal
SteamCombined
CycleCombustion
TurbineIGCC Nuclear
O/G Steam
Grand Total
Crystal River 869 869
Deerhaven Generating Station
232 83 315
Indian River 577 577
Indiantown Cogeneration LP
330 330
John R Kelly 23 23
Lansing Smith 357 357
Larsen Memorial 105 105
Sanford 138 138
Scholz 92 92
Seminole 1,310 1,310
Stanton Energy Center
886 886
Suwannee River 131 131
Tom G Smith 30 22 52
Vero Beach Municipal Power Plant
46 46
Georgia 5,178 5,178
Hammond 840 840
Harllee Branch 1,016 1,016
Kraft 201 201
Mitchell 155 155
Scherer 1,680 1,680
Yates 1,286 1,286
Idaho 3 3
Clearwater Paper IPP Lewiston
3 3
Illinois 6,058 6,058
Baldwin Energy Complex
608 608
Dallman 348 348
E D Edwards 380 380
Hennepin Power Station
282 282
Joppa Steam 1,002 1,002
Newton 1,197 1,197
Powerton 1,536 1,536
Will County 251 251
Wood River 454 454
Indiana 1,889 1,889
Eagle Valley 257 257
Frank E Ratts 241 241
Harding Street 212 212
Jasper 2 14 14
R Gallagher 280 280
R M Schahfer 472 472
State Retired Capacity (MW)
PlantCoal
SteamCombined
CycleCombustion
TurbineIGCC Nuclear
O/G Steam
Grand Total
Wabash River 313 313
Whitewater Valley 100 100
Iowa 3,065 3,065
Ames Electric Services Power Plant
104 104
Earl F Wisdom 38 38
Fair Station 41 41
George Neal North 957 957
Lansing 237 237
Milton L Kapp 211 211
Muscatine Plant #1 216 216
Prairie Creek 164 164
Riverside 133 133
Streeter Station 35 35
Sutherland 78 78
Walter Scott Jr Energy Center
851 851
Kansas 535 12 147 694
Fort Dodge 147 147
Lawrence Energy Center
50 50
Nearman Creek 229 229
Quindaro 183 183
Riverton 12 12
Tecumseh Energy Center
73 73
Kentucky 1,389 1,389
Big Sandy 260 260
Cooper 334 334
Dale 195 195
E W Brown 267 267
Robert A Reid 65 65
Shawnee 268 268
Louisiana 3,051 3,192 6,243
Big Cajun 1 220 220
Big Cajun 2 1,756 1,756
Brame Energy Center 486 422 908
CII Carbon LLC 46 46
D G Hunter 130 130
Louis Doc Bonin 302 302
Louisiana 2 138 138
Michoud 813 813
Monroe 126 126
Morgan City 54 54
Plaquemine 38 38
R S Nelson 763 603 1,366
10 11
State Retired Capacity (MW)
PlantCoal
SteamCombined
CycleCombustion
TurbineIGCC Nuclear
O/G Steam
Grand Total
Teche 346 346
Maine 58 93 233 384
Caribou Generation Station
14 14
Rumford Cogeneration
58 58
Verso Paper 93 93
William F Wyman 219 219
Maryland 825 825
C P Crane 385 385
Herbert A Wagner 440 440
Massachusetts 1,136 521 10 1,102 2,769
Brayton Point 1,136 10 435 1,581
Canal 566 566
Cleary Flood 108 108
Lowell Cogen Plant 29 29
NAEA Energy Massachusetts LLC
101 101
Potter Station 2 79 79
Stony Brook 306 306
Michigan 2,411 21 284 2,716
B C Cobb 312 312
Claude Vandyke 21 21
Eckert Station 301 301
Endicott Station 50 50
Erickson Station 151 151
Harbor Beach 95 95
J B Sims 73 73
J C Weadock 306 306
J R Whiting 322 322
James De Young 27 27
Mistersky 50 50
Presque Isle 431 431
River Rouge 234 234
Shiras 41 41
TES Filer City Station 60 60
Trenton Channel 188 188
White Pine Electric Power
54 54
Minnesota 828 828
Austin Northeast 29 29
Clay Boswell 428 428
Hoot Lake 138 138
Silver Lake 57 57
Taconite Harbor Energy Center
152 152
State Retired Capacity (MW)
PlantCoal
SteamCombined
CycleCombustion
TurbineIGCC Nuclear
O/G Steam
Grand Total
Willmar 24 24
Mississippi 2,086 69 2,193 4,348
Baxter Wilson 1,176 1,176
Delta 177 177
Gerald Andrus 712 712
Henderson 29 29
Jack Watson 706 706
L L Wilkins 35 8 43
Natchez 73 73
R D Morrow 360 360
Victor J Daniel Jr 1,020 1,020
Wright 19 19
Yazoo 33 33
Missouri 599 599
Blue Valley 51 51
James River Power Station
194 194
Lake Road 92 92
Montrose 169 169
Sibley 93 93
Montana 139 226 365
Basin Creek Plant 54 54
Colstrip Energy LP 35 35
Dave Gates Generating Station
132 132
Highwood Generating Station
40 40
Lewis & Clark 52 52
Yellowstone Energy LP
52 52
Nebraska 85 85
Lon Wright 85 85
Nevada 508 104 244 856
North Valmy 253 253
Reid Gardner 255 255
Tracy 104 244 348
New Hampshire 540 540
Merrimack 444 444
Schiller 96 96
New Jersey 1,401 614 2,015
B L England 155 155
Oyster Creek 614 614
PSEG Hudson Generating Station
614 614
PSEG Mercer Generating Station
632 632
12 13
State Retired Capacity (MW)
PlantCoal
SteamCombined
CycleCombustion
TurbineIGCC Nuclear
O/G Steam
Grand Total
New Mexico 815 186 1,001
Cunningham 186 186
San Juan 815 815
New York 2,147 177 45 1,779 4,148
AES Cayuga 313 313
AES Greenidge LLC 108 108
AES Somerset LLC 686 686
AES Westover 84 84
Bowline Point 567 567
C R Huntley Generating Station
436 436
Carr Street Generating Station
96 96
Dunkirk Generating Plant
520 520
Massena Energy Holdings LLC
81 81
Roseton Generating Station
1,212 1,212
S A Carlson 45 45
North Carolina 4,532 4,532
Asheville 185 185
G G Allen 1,127 1,127
Marshall 760 760
Roanoke Valley Energy Facility II
44 44
Roxboro 2,416 2,416
Ohio 2,379 2,379
Avon Lake 736 736
Conesville 1,530 1,530
Hamilton 83 83
Orrville 30 30
Oklahoma 3,425 3,425
Hugo 440 440
Muskogee 1,022 1,022
Northeastern 920 920
Sooner 1,043 1,043
Oregon 585 726 1,311
Beaver 463 463
Boardman 585 585
Coyote Springs 246 246
Oregon State University Energy Center
17 17
Pennsylvania 1,417 1,417
AES Beaver Valley Partners Beaver Valley
129 129
State Retired Capacity (MW)
PlantCoal
SteamCombined
CycleCombustion
TurbineIGCC Nuclear
O/G Steam
Grand Total
Ebensburg Power 51 51
G F Weaton Power Station
112 112
New Castle Plant 320 320
P H Glatfelter 52 52
PPL Brunner Island 371 371
Sunbury Generation LP
382 382
South Carolina 3,633 3,633
Cogen South 90 90
Cross 570 570
McMeekin 250 250
Urquhart 94 94
W S Lee 200 200
Wateree 684 684
Williams 615 615
Winyah 1,130 1,130
Tennessee 2,145 2,145
Allen Steam Plant 741 741
Gallatin 976 976
Johnsonville 428 428
Texas 9,131 4 3,265 12,400
AES Deepwater 138 138
Coleto Creek 592 592
Fayette Power Project
1,195 1,195
J Robert Massengale 20 20
J T Deely 870 870
Jones 486 486
Lake Creek 4 4
Lewis Creek 460 460
Monticello 1,130 1,130
Moore County 46 46
Nichols 457 457
Pirkey 723 723
Plant X 422 422
Sabine 954 954
San Miguel 391 391
Thomas C Ferguson 420 420
W A Parish 2,509 2,509
Welsh 1,584 1,584
Utah 225 225
KUCC 174 174
Sunnyside Cogen Associates
51 51

14
State Retired Capacity (MW)
PlantCoal
SteamCombined
CycleCombustion
TurbineIGCC Nuclear
O/G Steam
Grand Total
Vermont 620 620
Vermont Yankee 620 620
Virginia 2,862 48 2,910
Bremo Bluff 227 227
Chesapeake 373 48 421
Chesterfield 1,237 1,237
Clinch River 460 460
Mecklenburg Power Station
138 138
Spruance Genco LLC 104 104
Yorktown 323 323
Washington 1,340 1,540 596 3,476
Chehalis Generating Facility
509 509
Crystal Mountain 3 3
Encogen 158 158
Frederickson 134 134
Fredonia 280 280
Northeast 45 45
River Road Gen Plant 220 220
Sumas Power Plant 126 126
Tenaska Ferndale Cogeneration Station
271 271
Transalta Centralia Generation
1,340 256 1,596
Whitehorn 134 134
Wisconsin 2,713 9 2,722
Alma 120 120
Blount Street 101 101
Columbia 1,118 1,118
Edgewater 378 378
John P Madgett 372 372
Manitowoc 116 116
Menasha 27 27
Port Edwards Mill 5 5
Pulliam 213 213
UW Madison Charter Street Plant
4 4
Valley 268 268
Grand Total** 88,556 5,986 2,131 45 1,234 23,363 121,316
*Excludes committed retirements prior to 2016
**Totals may not match regulatory impact analysis due to how EPA assigns retrofit/retired capacity to individual units
Source Data: http://www.regulations.gov/#!documentDetail;D=EPA-HQ-OAR-2013-0602-0220