Project Update Shallow Water Use Studies and Shoreline Inventory Donna Marie Bilkovic and Marcia...
27
Project Update Shallow Water Use Studies and Shoreline Inventory Donna Marie Bilkovic and Marcia Berman Center for Coastal Resources Management Virginia Institute of Marine Science June 2007
-
Upload
job-marshall -
Category
Documents
-
view
214 -
download
1
Transcript of Project Update Shallow Water Use Studies and Shoreline Inventory Donna Marie Bilkovic and Marcia...
Project Update
Shallow Water Use Studies and Shoreline Inventory
Donna Marie Bilkovic and Marcia Berman
Center for Coastal Resources ManagementVirginia Institute of Marine Science
June 2007
Shallow water use project objectives
1. Assess tidal creek fish community characteristics in Lynnhaven Bay
2. Compare fish communities in dredged andundredged tidal creek systems
3. Inventory shoreline condition in Lynnhaven Bay --
including land use, structures and bank conditions

Coastal development stressors on estuarine communities include
Shoreline hardeningLand use conversionVegetation removal
Dredging
Possible stressors caused from dredging with particular importance to fish
Habitat removal Loss of prey items (e.g. burial of benthos) Increased turbidity Alteration of physical habitat (e.g. sediment, current
patterns, water quality, salinity, reduction in flushing)
What are the recovery rates of fish communities? Research on benthic communities indicates recovery rates are
dependent on several factors including salinity, system size, and sediment grain size. (faster in fine-grained and lower salinity
regions)
Limited research on fish recovery rates in tidal creek systems

Fish Survey Locations:August-October 2006
6 Creeks in the Western Branch(3 dredged; 3 undredged)
Each Creek sampled with multiple gear types;
Monthly
When DredgedNorth Creek: Feb 2006Hebden Creek: Mar 2000Buchanan Creek: Jul 2000

Push NetsBeach Seines
Experimental
Gill nets
Water Qualitymeasures
Multiple facets of the fish communities were targeted with different gear types
For example: nearshore juvenile species—beach seine

0.05 km2
0.09 km2
Dredged Feb 2006
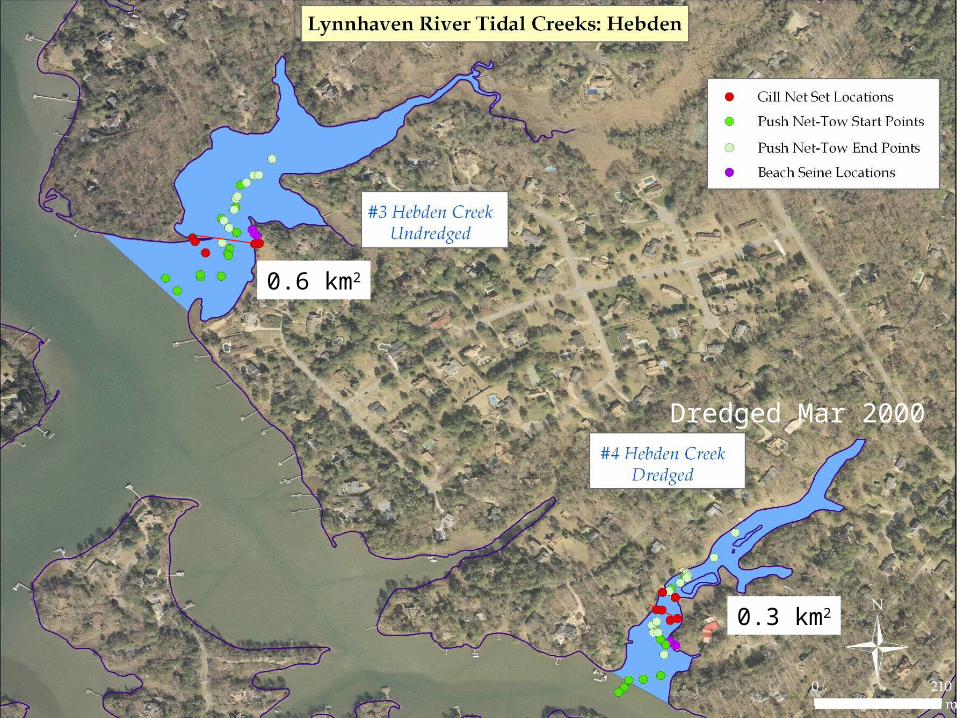
0.6 km2
0.3 km2
Dredged Mar 2000
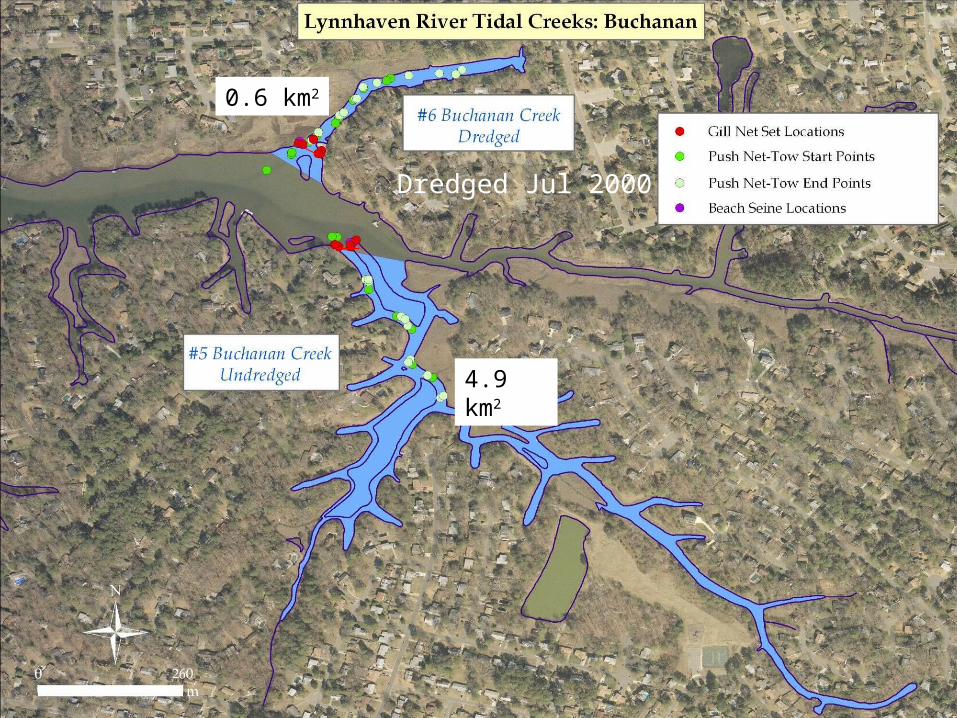
0.6 km2
4.9 km2
Dredged Jul 2000

2.8
4.3
2.9
4.0
4.3
3.6
Site Tidal Creek State Depth Cond DO NTU pH Salinity Temp 1 North Undredged 2.87 33538 6.90 18.01 7.91 21.17 23.22 2 North Dredged 4.45 33725 7.12 18.42 7.94 21.13 23.24 3 Hebden Undredged 3.18 33768 6.87 38.27 7.79 21.16 24.37 4 Hebden Dredged 4.20 33402 6.59 54.72 7.66 20.90 23.43 5 Buchanan Undredged 3.97 29983 5.66 34.35 7.37 18.59 23.67 6 Buchanan Dredged 3.48 31005 5.81 48.08 7.48 19.35 23.31
Site Characteristics on Average: August-October 2006

Extreme variability in basic water quality measures:e.g. Salinity, Temperature, Dissolved Oxygen, Turbidity
Sal
inity
(pp
t)
10/1
9/06
10/1
3/06
10/7/06
10/1/0
6
9/25
/06
9/19
/06
9/13
/06
9/7/
06
9/1/06
8/25
/06
8/19
/06
8/13
/06
40
30
20
10
0
Buchanan UndredgedBuchanan Dredged
Average Daily Salinity in Buchanan Creeks
Date
Tur
bidi
ty (
NTU)
200
150
100
50
0
Buchanan UndredgedBuchanan Dredged
Average Daily Turbidity in Buchanan Creeks
Date
Dis
solv
ed O
xyge
n (m
g/L)
10/19/
06
10/13/
06
10/7
/06
10/1/0
6
9/25
/06
9/19
/06
9/13
/06
9/7/06
9/1/
06
8/25
/06
8/19
/06
8/13
/06
12
10
8
6
4
2
Buchanan UndredgedBuchanan Dredged
Average Daily Dissolved Oxygen in Buchanan Creeks
Tem
pera
ture
(C)
10/1
9/06
10/13/
06
10/7
/06
10/1
/06
9/25
/06
9/19
/06
9/13
/06
9/7/06
9/1/
06
8/25
/06
8/19
/06
8/13
/06
30.0
27.5
25.0
22.5
20.0
17.5
15.0
Buchanan UndredgedBuchanan Dredged
Average Temperature in Buchanan Creeks
Ernesto

Fish Survey Results5972 fish and
31 species collected
Other SppBlue Crab
MummichogSpot
Red DrumMullet spp
Atl. CroakerWhite PerchKillifish spp
Spotfin mojarraAmerican eelStriped bass
Summer flounder
Naked goby
The catches in the systems combined were dominated byAtl silverside, Bay anchovy, Gizzard shad, Silver perch, and
Atl. menhadenAverage sizes = 13.9 ± 4.6 cm (range 2.3—50 cm)
Blackcheek tonguefishBluefishPermitSheepshead minnowCrevalle jackHogchokerLadyfishSharptail gobySpotted seatroutTripletailWeakfish
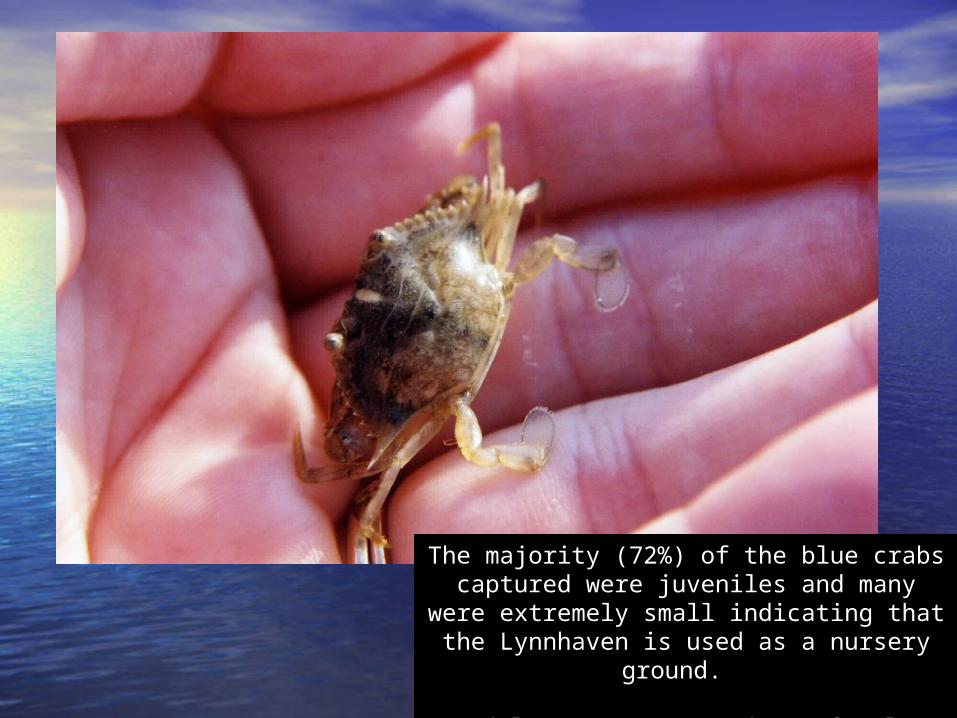
The majority (72%) of the blue crabs captured were juveniles and many were
extremely small indicating that the Lynnhaven is used as a nursery ground.
26 adults were captured (11 female and 15 male).

Lynnhaven Tidal Creek Fish Community Similarity
Hebden_Undredged
Buch_Undredged
Hebden_Dredged
Buch_Dredged
North_Undredged
North_Dredged
1009080706050
Similarity

CreekCreek D/D/UU
Size Size (km(km2)2)
AbuAbu No. Spp = No. Spp = 99% 99%
NorthNorth UU 0.050.05 414414 1010
NorthNorth DD 0.090.09 294294 1010
HebdenHebden UU 0.60.6 10501050 1212
HebdenHebden DD 0.30.3 11171117 1010
BuchanaBuchanann
UU 4.94.9 968968 1010
BuchanaBuchanann
DD 0.60.6 21292129 88
General Community Characteristics among Creeks

Transform: Square rootResemblance: S17 Bray Curtis similarity
Location123
Similarity7075
N-U
N-D
H-U
H-D B-U
B-D
2D Stress: 0

Transform: Square rootResemblance: S17 Bray Curtis similarity
Spot
0.4
1.6
2.8
41
2
3
4
5
6
2D Stress: 0
Transform: Square rootResemblance: S17 Bray Curtis similarity
Red drum
0.3
1.2
2.1
3
N-U
N-D
H-U
H-D
B-U
B-D
2D Stress: 0
Species overlays
1) Spot more prominent
in the upriver systems Hebden and Buchanan
2) Red drum in higher abundance in
undredged systems vs. dredged systems

Fish Community Characteristics among Creeks
Variety of ways to describe communities:1) Abundance
2) Biomass3) Size
4) Diversity5) Fish community index
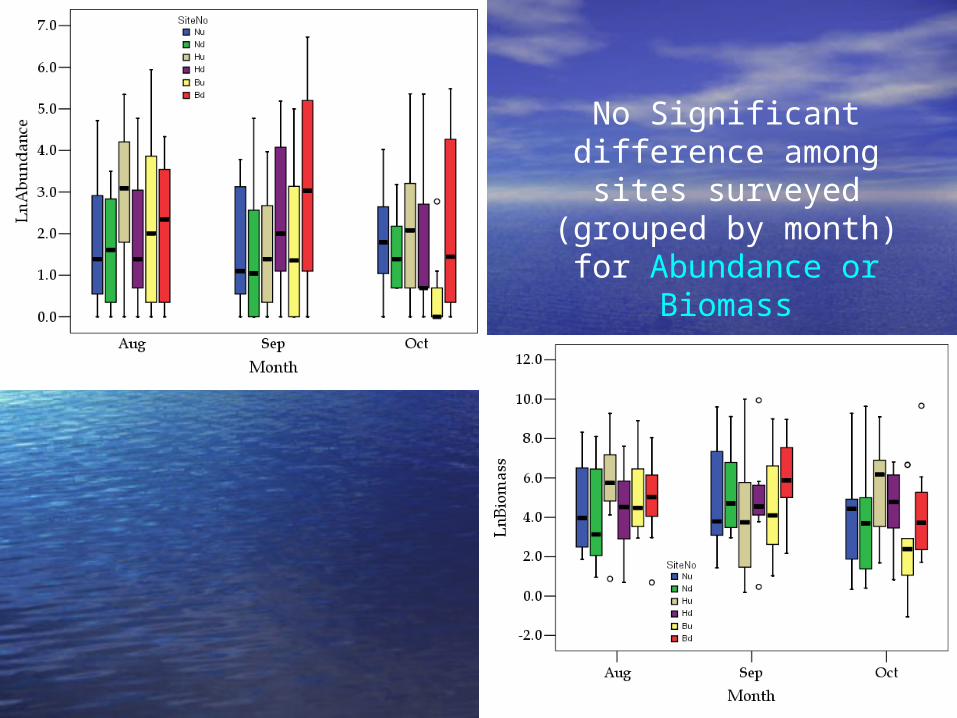
No Significant difference among sites surveyed (grouped by month) for Abundance
or Biomass

SIZE—NO difference among creeks or across months!!
Beach Seine
Gill Net
All Data

Diversity Among Creeks: NO significant difference!!
One-way ANOVA

Metrics were combined into an aggregate index--Fish
Community index (FCI)-- used to assess relative measures of fish community structure and function.
Fish Community Metrics
Species Richness/Diversity MeasuresSpecies Richness
Proportion of benthic-associated speciesNumber of dominant species (90% of total abundance)
Number of resident species
Fish Abundance Ln Abundance
Trophic CompositionTrophic Index
Nursery FunctionNumber of estuarine spawning speciesNumber of estuarine nursery species
Fish Community Index (FCI)

Fish Community Index comparison among creeks
NO difference!

Preliminary Conclusions All six creeks supported similar fish communities
Slight differences among fish communities (seen in multivariate analyses) may be related to the size of the watershed (i.e. North creeks differed)
Extreme variability in physical and chemical features in the Lynnhaven are driving influences to structuring fish communities
Diverse communities in Lynnhaven (related to its location at the Bay mouth) utilize the Bay as feeding/nursery grounds
The most recently dredged system was similar to the adjacent undredged system (North creeks) which may indicate a quick recovery rate for fish communities post-dredging
HOWEVER, presence of fish does not mean no impact occurs from dredging, information on prey communities is necessary, as well as long term studies to estimate impacts.

Three-tiered shoreline assessment approach, dividing the shorezone into three regions
1) the immediate riparian zone, evaluated for land use;
2) the bank, evaluated for height, stability, cover and natural protection; and
3) the shoreline, describing the presence of shoreline structures for shore protection and recreational purposes.
Shoreline Continuous Inventory: Lynnhaven Bay


Dix Creek
Example survey map of Shoreline
structures in Lynnhaven Bay
Preliminary Results: Total Survey Miles: 139.42 Coded Miles: 107.46 Marsh Islands Miles: ~ 17.69
Line structures for the coded shl: 26.12 miles
So far we estimate ~30% of coded shoreline is hardened
TMI (from 1970s): 1157.1 acres

Webpage for Shoreline Inventory Data, Maps and Reports
http://ccrm.vims.edu/shoreline_inventories/virginia/lynnhaven/
lynnhaven_disclaimer.html