Project Update: Evaluation of Methods to Reduce Thermal...
42
Project Update: Domestic Wastewater Cooling Technology Alternatives Feasibility Analysis PRESENTED TO THE COLORADO WATER QUALITY FORUM MARCH 5, 2018
Transcript of Project Update: Evaluation of Methods to Reduce Thermal...

Project Update:Domestic Wastewater Cooling Technology Alternatives Feasibility Analysis
PRESENTED TO THE COLORADO WATER QUALITY FORUMM A R C H 5 , 2 0 1 8

Presentation OverviewBackground
- Temperature standards- Facility data- Discharger specific variances
Feasibility Study- Scope- Report Structure- Technology Categorization and Examples- General Results- Innovative, Hybrid, and Combination Approaches
Next Steps

Temperature Standards
Jan Feb Mar Apr May Jun Jul Aug Sep Oct Nov Dec
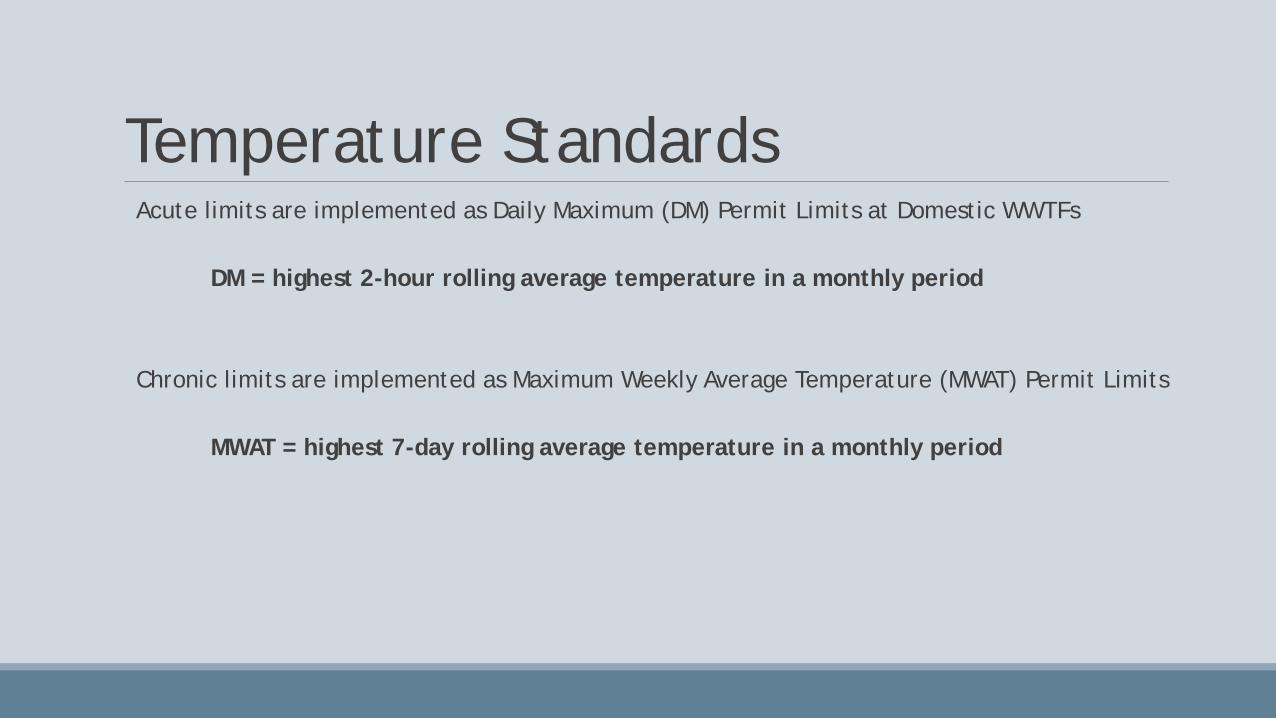
Temperature StandardsAcute limits are implemented as Daily Maximum (DM) Permit Limits at Domestic WWTFs
DM = highest 2-hour rolling average temperature in a monthly period
Chronic limits are implemented as Maximum Weekly Average Temperature (MWAT) Permit Limits
MWAT = highest 7-day rolling average temperature in a monthly period

Effluent Temperature Mechanical Facilities
Jan Feb Mar Apr May Jun Jul Aug Sep Oct Nov Dec

Effluent Temperature Lagoon Facilities
Jan Feb Mar Apr May Jun Jul Aug Sep Oct Nov Dec
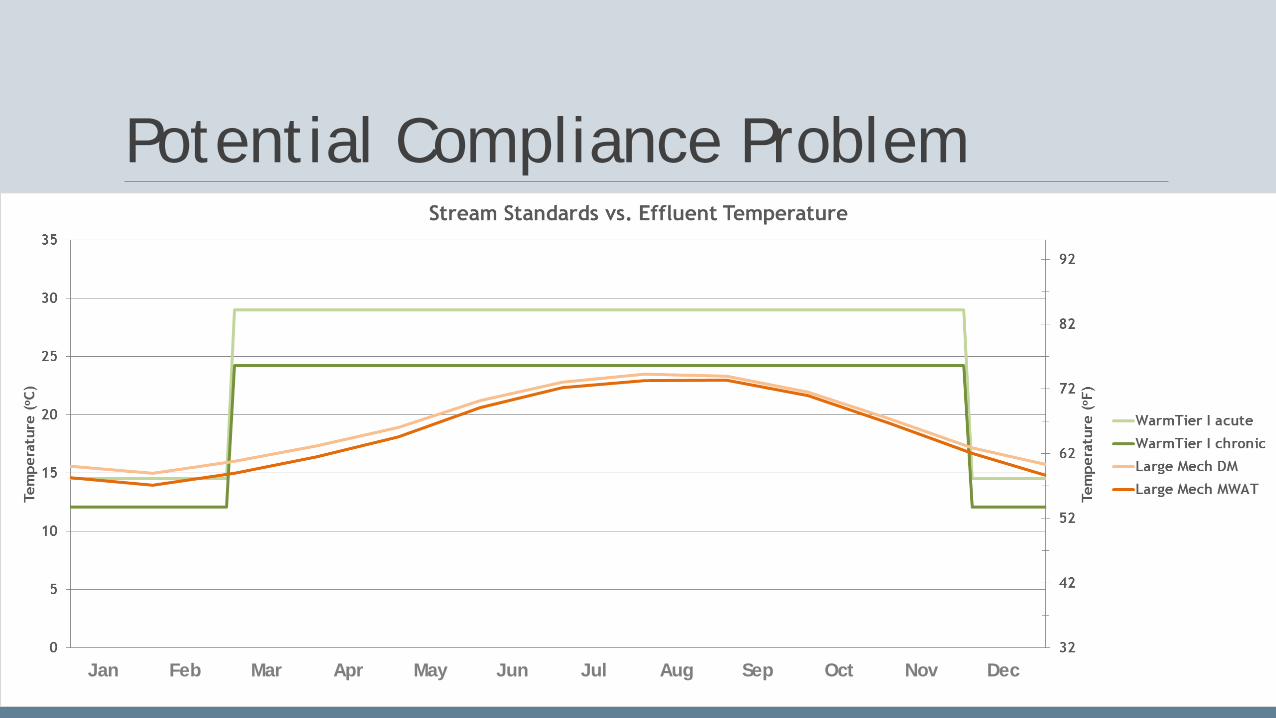
Potential Compliance Problem
Jan Feb Mar Apr May Jun Jul Aug Sep Oct Nov Dec

Discharger Specific Variances (DSVs)- DSVs are temporary, facility-specific water quality standards
- Colorado adopted current provisions in 2010, became effective in 2013
- EPA adopted framework in 2015, generally consistent
- WQCC Regulation 31, Section 31.7 (4):Variances to numeric standards are authorized only where a comprehensive alternatives analysis demonstrates that there are no feasible alternatives that would allow for the regulated activity to proceed without a discharge that exceeds water quality-based effluent limits.

DSV – Feasibility TestsLimits of Technology: Demonstration that attaining the water quality standard is not feasible because, as applied to the point source discharge, pollutant removal techniques are not available or it is technologically infeasible to meet the standard;
Economics: Demonstration that attaining the water quality standard is not feasible because meeting the standard, as applied to the point source discharge, will cause substantial and widespread adverse social and economic impacts in the area where the discharge is located. Considerations include such factors as the cost and affordability of pollutant removal techniques; or
Other Consequences: Human caused conditions or sources of pollution prevent the attainment of the use and cannot be remedied or would cause more environmental damage to correct than to leave in place.

Feasibility Study Impetus- Multiple dischargers with various pollutants have pursued a DSV
- Challenges regarding scope/level of detail in DSV alternatives analysis
- Funds through CWRPDA earmarked for temperature reduction study
- WQCD is working to develop comprehensive technical guidance with multiple pollutant-specific fact sheets, including T, NH3, TIN, Se, etc.

Scope of Feasibility Study- Identify temperature reduction alternatives- Categorize and select representative technologies for analysis- Develop and apply sizing/costing methodology- Administer questionnaire to other states- Prepare guidance document, including:
Applicability and limitations of each technologyPlanning level cost estimatesGeneralized environmental impactsConsiderations for temperature related DSV applications

Beyond Scope of ProjectThe following items are not included or intended for the project:
- Develop novel or innovative treatment approaches
- Provide detailed design procedures
- Create categorically eligible facilities
- Decide if environmental impacts are worse than leaving in place
- Establish methodology to determine Alternate Effluent Limits

Status of Feasibility Studies- Final phase of drafting and internal review
- Guidance should be published this spring

Technology CategorizationCategories based on underlying heat transfer mechanisms allows simplification by identifying a spectrum of representative technologies for:
- Source Control, Site Considerations, and Other Mitigation Options
- Natural Heat Flow
- Evaporative Cooling
- Mechanical Cooling

Source Control/Other Mitigation OptionsA lot of heat in domestic wastewater comes from residential water use. How much comes from industrial, commercial, or retail sources?
Potential Source Control Options:
- Outreach and education to residential users
- Evaluate heat loads from industrial, commercial, and retail sources
- Consider implementing voluntary or mandatory controls for select users
- Options at WWTF are limited (more on this in solar shade section)
Other non-technologic options (alternate discharge locations, consolidation, etc.) are highly site-specific and beyond scope of feasibility study.
Encouraging residents to minimize hot water use alone may not achieve compliance, but it can be easily incorporated into any DSV proposal

Natural Heat FlowHeat energy transfers from areas of high temperature to areas of low temperature
Hot Substance(Heat Source)
Cold Substance(Heat Sink)
Q (heat flux)
Q = Uoverall * Area * (Tsource-Tsink)
Uoverall = overall heat transfer coefficient, varies based on substance properties

Natural Heat FlowExample: Heat Exchanger – allows natural heat flow but keeps fluids separate
The outlet wastewater temperature can never get below the inlet cooling water temperature

Natural Heat FlowLimit of Technology:Natural heat flow cannot cool wastewater below the temperature of the heat receiving sink (e.g. soil, groundwater, surface water, other cooling fluid, ambient air)
Teffluent > Tsink
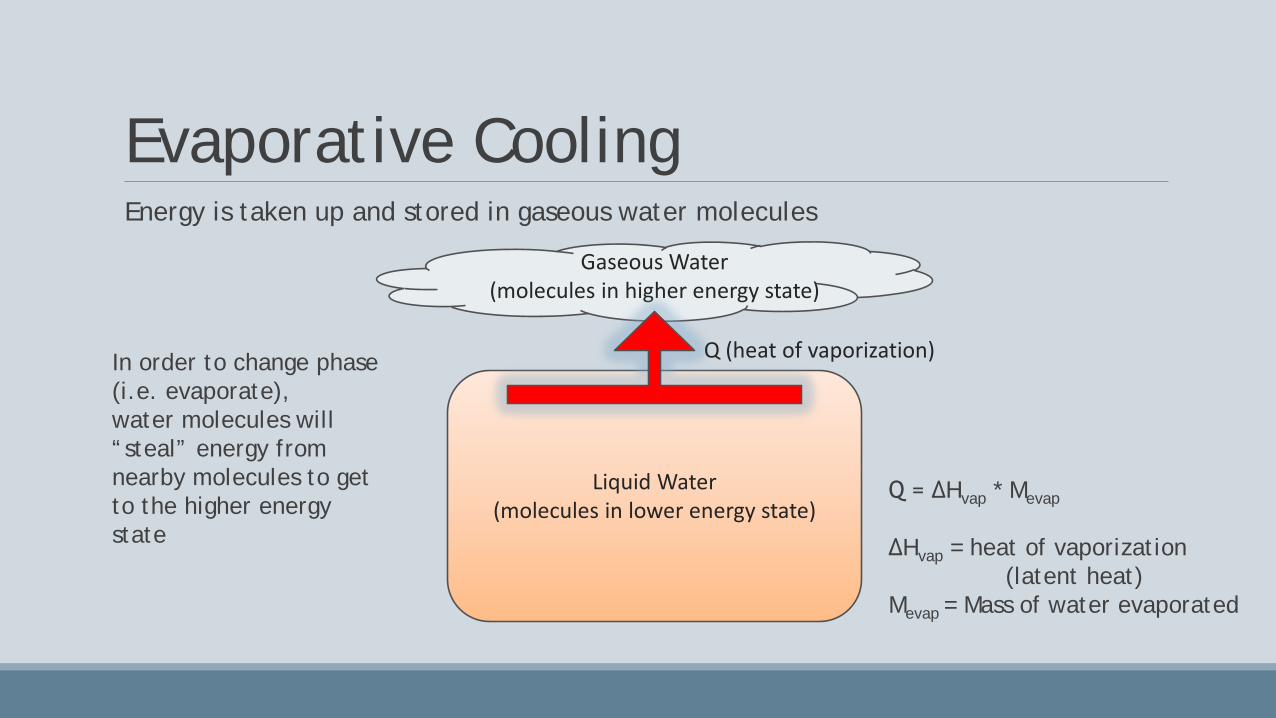
Evaporative CoolingEnergy is taken up and stored in gaseous water molecules
Liquid Water(molecules in lower energy state)
Gaseous Water(molecules in higher energy state)
In order to change phase (i.e. evaporate), water molecules will “steal” energy from nearby molecules to get to the higher energy state
Q (heat of vaporization)
Q = ∆Hvap * Mevap
∆Hvap = heat of vaporization (latent heat)
Mevap = Mass of water evaporated

Evaporative CoolingWhat is the wet bulb (WB) temperature?
The lowest temperature that can be reached by evaporating water into the air.
- Measured by placing a wetted muslin sock on a thermometer with air blowing over it.
- Combines the ambient air temperature (aka dry bulb (DB) temperature) and the relative humidity into one factor that shows the limit to which evaporation can be used for cooling.
Note:◦ When relative humidity = 100%, wet bulb = dry bulb ◦ When relative humidity < 100%, wet bulb < dry bulb◦ Therefore: wet bulb ≤ dry bulb

Evaporative Cooling

Evaporative CoolingExample: Once-through Cooling Tower – optimization of air to water contact
The outlet wastewater temperature can never get below the ambient wet bulb temperature

Evaporative CoolingLimit of Technology:Evaporative cooling cannot cool wastewater below the wet bulb temperature of the ambient air.
Teffluent > Twetbulb

Mechanical CoolingHeat energy is transferred from areas of low temperature to areas of higher temperature (Trying to cheat nature)
Hot Substance(Heat Sink)
Cold Substance(Heat Source)
Q (heat flux)
External Energy Input
Q = COPchiller * Wexternal
COPchiller = coefficient of performance, varies based on technology and heat sink temperatureWexternal = external energy input

Mechanical CoolingIn WQCD’s feasibility document,
“Mechanical Cooling”, “Heat Pump”, and “Chiller” mean the same thing:
Heat energy is transferred in the opposite direction of natural heat flow
Type of Heat Pump How it works Common places to find it
Vapor-compression refrigeration Driven by external electricity Almost any refrigerator
Absorption refrigeration Driven by external heat Places with waste heat or cheap fuel
Thermoelectric Relation between heat flux and voltage Laboratory
Thermoelastic Change in internal energy due to stretching Laboratory
Thermoacoustic Driven by controlled pressure waves Laboratory
Thermomagnetic Driven by external magnetic field Laboratory

Mechanical CoolingExample: Air-cooled Chiller (vapor compression) – electricity used to drive process
The efficiency of a chiller is affected by the temperature of the receiving sink,it would only approach zero in extreme conditions
Heat is taken up by evaporating refrigerant
Heat is dumped when refrigerant is compressed to a liquid

Mechanical CoolingLimit of Technology:Mechanical cooling would only be technologically limited in extreme situations.
Teffluent > Tfreezing

Estimating Environmental Impacts- Primary impact associated with impacts from electric use
- Study assumes electricity is purchased from the grid, impacts are indirect
- Region-specific multipliers applied to electric use values, USEPA eGRID2014
carbon dioxide: 1737.7 lbCO2/MWh
- Water loss and PM10 calculations are direct impacts from the plant site
- Other waste issues qualitatively identified, e.g. refrigerant disposal

Technologies Analyzed in Study- Transfer heat to a colder material (natural heat flow)
1. Heat exchanger using surface water for cooling2. Effluent blending with deep groundwater3. Ground loop exchanger/geothermal cooling
- Evaporative cooling (energy transfer by heat of vaporization)4. Passive cooling pond5. Spray pond6. Cooling tower
- Mechanical cooling (trying to cheat nature)7. Chiller using traditional vapor-compression cooling

Generalized Findings Technology Capital Cost Energy Usage
GHG SOx NOxEmissions
Onsite PM10Emissions
Water Loss
1. Heat Exchanger UsingSurface Water $
2. Blending with Deep Groundwater $$
3. Ground loop exchanger/ geothermal cooling $$$$
4. Cooling Tower $$
5. Passive Cooling Pond $$$
6. Spray Pond $$
7. Chiller $$

Innovative, Hybrid & Combo ApproachesThe guidance document discussed these options in more qualitative fashion:
- Chiller with Closed Loop Cooling Tower or Other Cooling Water Source- Other Combinations and Hybrids- Retractable Solar Shades- Use of High Efficiency Motors and Energy Efficient Designs- Alternate Electric Sources- Energy Recovery and Reuse- Absorption Refrigeration- Energy Recovery & Mechanical Cooling
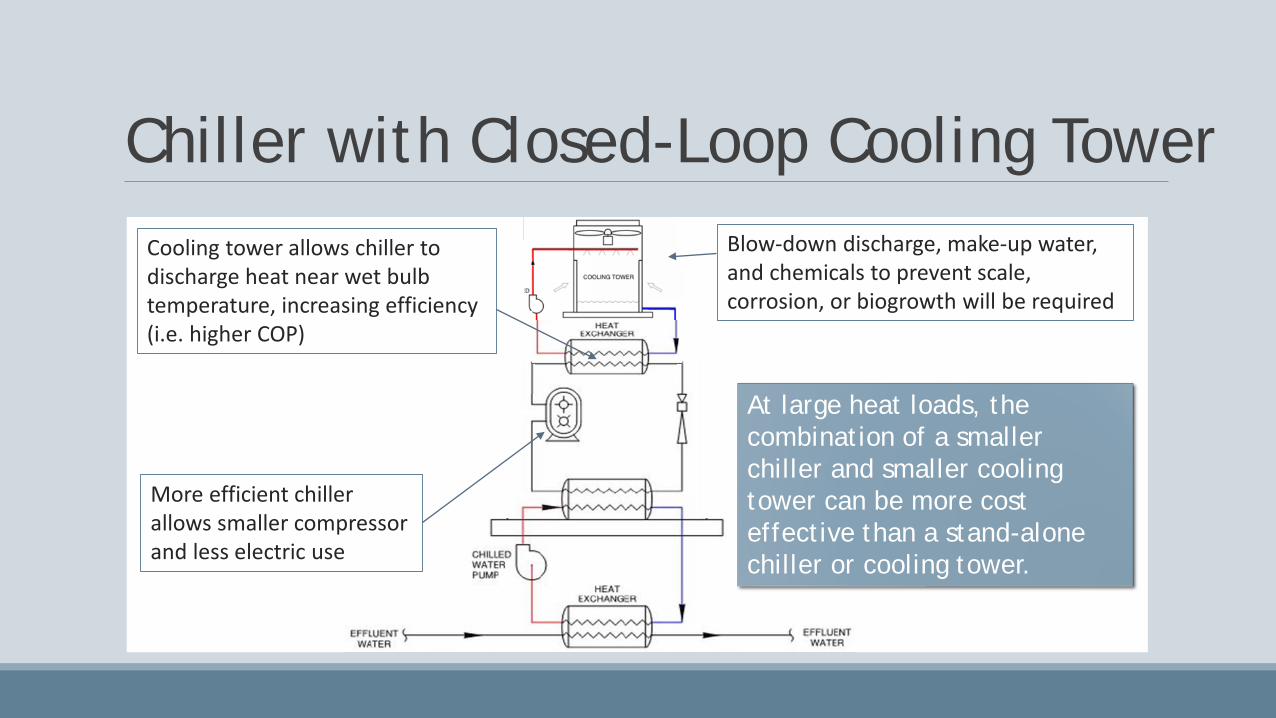
Chiller with Closed-Loop Cooling Tower
More efficient chiller allows smaller compressor and less electric use
Cooling tower allows chiller to discharge heat near wet bulb temperature, increasing efficiency (i.e. higher COP)
At large heat loads, the combination of a smaller chiller and smaller cooling tower can be more cost effective than a stand-alone chiller or cooling tower.
Blow-down discharge, make-up water, and chemicals to prevent scale, corrosion, or biogrowth will be required

Other Combinations and HybridsCountless combinations and hybrids of the basic heat transfer mechanisms exist.
Example:
Pipe-in-pond cooling is …
a heat exchanger, in a
passive cooling pond,
with possible blending
Q1
Q2
Q1 = Q2 + Q3
Q3
Unless there is colder water flowing through this pond, it will need to be as big as a standalone passive cooling pond.

Retractable Solar ShadesMinimizing incoming solar radiation while maintaining as much outgoing long-wave (e.g. infrared) radiation as possible may have a measureable impact on effluent temperatures
Energy Transfer Phenomena Temperature change oC/day
Short-wave radiation [net incoming solar radiation] + 0.5 to 2.5Long-wave radiation [net outgoing blackbody radiation] - 0.5 to 1.0Sensible heat [heat transferred to the air and through aeration] +/- 0.5 to 3.5Evaporation - 0.5 to 2.5Process energy [energy released from biological reactions] + 0.5 to 2.0Mechanical energy [heat from blower inefficiency/friction losses] + < .1Geothermal energy [heat transferred to ground through basin walls] +/- <0.05Precipitation, rain/snow at surface +/- <0.2Typical Range of Contributions, Temperature Changes in Treatment Plants
Reproduced from la Cour Jansen et al., 1992
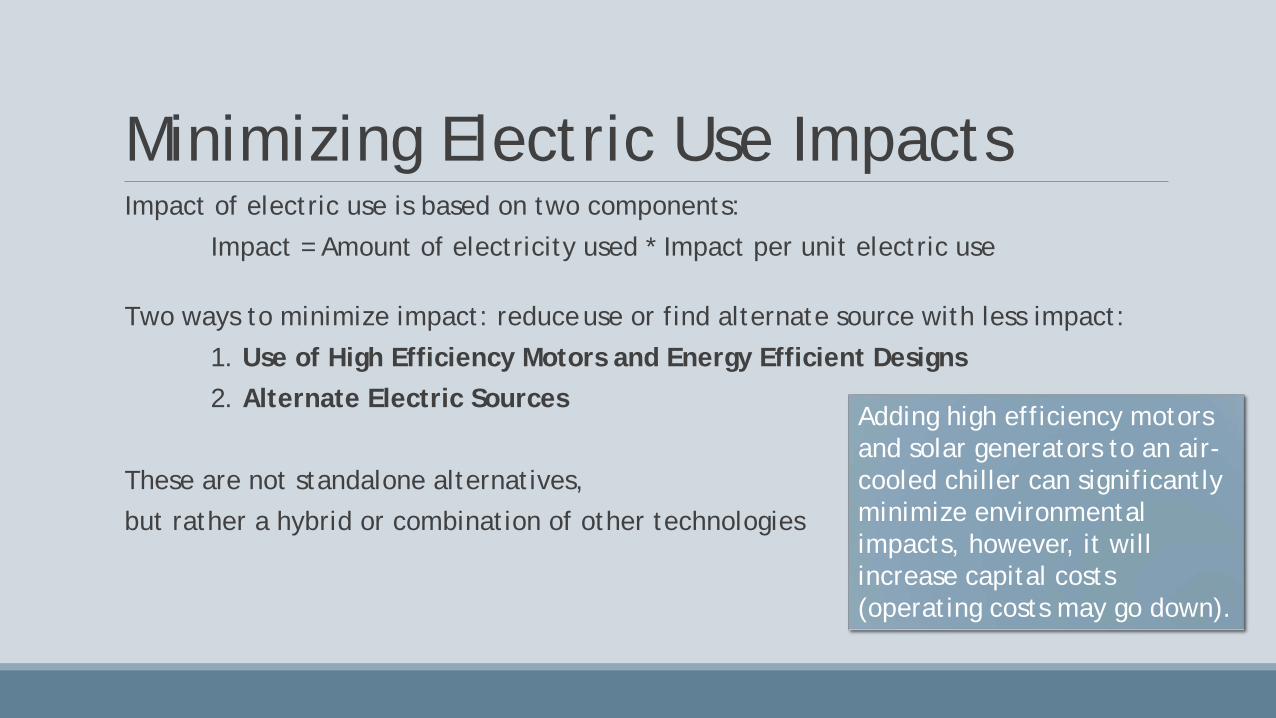
Minimizing Electric Use ImpactsImpact of electric use is based on two components:
Impact = Amount of electricity used * Impact per unit electric use
Two ways to minimize impact: reduce use or find alternate source with less impact:1. Use of High Efficiency Motors and Energy Efficient Designs2. Alternate Electric Sources
These are not standalone alternatives,but rather a hybrid or combination of other technologies
Adding high efficiency motors and solar generators to an air-cooled chiller can significantly minimize environmental impacts, however, it will increase capital costs (operating costs may go down).

Energy Recovery and ReuseThermal energy in wastewater can be recovered using a similar system as a residential heat pump (note, this is a chiller):
Energy must be transported in a fluid such as air or water Low grade heat sufficient for space heating, snow melting, and other limited useMost attractive if installed at point of demand, e.g. throughout collection system
Chemical energy can be recovered as methane from anaerobic digesters
Combined Heat and Power (CHP), aka Co-Gen, uses biogas to produce heat and electricity

Absorption RefrigerationAbsorption Refrigeration is a mechanical cooling option that is powered by external heat.
Use of an anaerobic digester and a co-gen system allows two options for powering a chiller with recovered energy:
1. Electricity generated from biogas can be used to power a vapor compression chiller
2. Heat generated from biogas can be used to power an absorptionrefrigerator
Facility-wide energy balance may be appropriate to determine best use of biogas

Energy Recovery & Mechanical Cooling5 MGD Example Facility with new CHP Process
Comparison of Mechanical Refrigeration OptionsVapor Compression
RefrigerationAbsorption
RefrigerationCooling Load 1830 kW Capacity 1830 kW 1830 kW
COP 3.3 1.8Electricity from CHP 130 kW Electric Req’d 548 kW -
Amount from CHP 24% -Usable Heat from CHP 146 kW Heat Req’d - 1020 kW
Amount from CHP - 14%Current Electric use 500 kW
This is overly detailed and I will it pare back
Example: Combined heat and power (CHP) potential for cooling from literature values
Based on medium to low strength waste – high strength waste will boost CHP production
CHP can be used year round – how do these numbers balance over a year of operation?

Next StepsFindings of Feasibility Study beg many questions
Are these technologies in the realm of feasibility?Are the proven and reliable technologies (cooling towers and chillers) sustainable?What is the most sustainable approach to recovering energy from wastewater?How does sustainable energy use and recovery fit in with cooling wastewater to improve aquatic habitat and minimize other environmental impacts?How does all this fit in with the “other consequences” criterion?

Next StepsA complete feasibility analysis requires multiple steps.
1. Sizing, costing, and estimating output rate of environmental pollutants is relatively straightforward and objective.
2. Weighing the relative impacts of each alternative is highly subjective.
Landmine alert!How many miles of aquatic habitat should be allowed to be impacted to save a ton of greenhouse gas emissions?
Engaging stakeholders such as EPA and individual dischargerswill be critical and is underway.
The feasibility study provides a solid foundation of the objective.From here, we begin the strange adventure into the subjective…

Questions and Discussion
“It is better to know some of the questions than all of the answers.” – James Thurber

Feasibility Study Results (5 MGD, 2 oC Temperature Reduction)
TechnologyCapital Cost(2017 USD)
Energy Usage(kWh/mo)
GHG Emissions(Tons CO2e/mo)
PM10 Emissions(lb/mo)
Water Loss(MG/mo)
1. Heat Exchanger UsingSurface Water 278,737 25399 22 0 0
2. Blending with Deep Groundwater 756,675 367504 321 0 0
3. Ground loop exchanger/ geothermal cooling 1,849,000 55026 48 0 0
4. Cooling Tower1,380,669 0 0 0 1.4
5. Passive Cooling Pond305,216 38885 34 12000 2.76
6. Spray Pond507,000 42801 37 41 0.5
7. Chiller860,000 391250 342 0 0