Project title: Vegetable crops: Development of a FV 394a Pa… · Project title: Vegetable crops:...
23
Project title: Vegetable crops: Development of a screening programme for plant growth enhancement products. Project number: FV 394a Project leader: Pat Croft, STCRF Report: Final report, March 2013 Previous report: None Key staff: Pat Croft Catherine Jones Chantel Davies Julie Langdale Location of project: STCRF, Cawood, Selby, North Yorkshire YO8 3TZ Industry Representative: Martin Evans Date project commenced: March 2012 Date project completed (or expected completion date): March 2013
Transcript of Project title: Vegetable crops: Development of a FV 394a Pa… · Project title: Vegetable crops:...

Project title: Vegetable crops: Development of a screening programme for plant growth enhancement products.
Project number: FV 394a Project leader: Pat Croft, STCRF Report: Final report, March 2013 Previous report: None Key staff: Pat Croft Catherine Jones Chantel Davies Julie Langdale Location of project: STCRF, Cawood, Selby, North
Yorkshire YO8 3TZ Industry Representative: Martin Evans Date project commenced: March 2012 Date project completed (or expected completion date):
March 2013
Agriculture and Horticulture Development Board 2012. All rights reserved
DISCLAIMER
AHDB, operating through its HDC division seeks to ensure that the information contained
within this document is accurate at the time of printing. No warranty is given in respect
thereof and, to the maximum extent permitted by law the Agriculture and Horticulture
Development Board accepts no liability for loss, damage or injury howsoever caused
(including that caused by negligence) or suffered directly or indirectly in relation to
information and opinions contained in or omitted from this document.
Copyright, Agriculture and Horticulture Development Board 2013. All rights reserved.
No part of this publication may be reproduced in any material form (including by photocopy
or storage in any medium by electronic means) or any copy or adaptation stored, published
or distributed (by physical, electronic or other means) without the prior permission in writing
of the Agriculture and Horticulture Development Board, other than by reproduction in an
unmodified form for the sole purpose of use as an information resource when the Agriculture
and Horticulture Development Board or HDC is clearly acknowledged as the source, or in
accordance with the provisions of the Copyright, Designs and Patents Act 1988. All rights
reserved.
AHDB (logo) is a registered trademark of the Agriculture and Horticulture Development
Board.
HDC is a registered trademark of the Agriculture and Horticulture Development Board, for
use by its HDC division.
All other trademarks, logos and brand names contained in this publication are the
trademarks of their respective holders. No rights are granted without the prior written
permission of the relevant owners.
[The results and conclusions in this report are based on an investigation conducted over a
one-year period. The conditions under which the experiments were carried out and the
results have been reported in detail and with accuracy. However, because of the biological
nature of the work it must be borne in mind that different circumstances and conditions could
produce different results. Therefore, care must be taken with interpretation of the results,
especially if they are used as the basis for commercial product recommendations.]

Agriculture and Horticulture Development Board 2012. All rights reserved
PLEASE NOTE: The HDC, whilst reporting the results of this independent work, does not
advocate or promote the use of the products reviewed in this study for crop protection. It is
important to note that:
a) The trials reported in this study are not specifically designed regulatory trials to
support a product claim and they have not been through any regulatory scrutiny to
assess consistency, level of control and appropriate dose of the products.
b) It is important for growers to remember that before using any product for plant
protection purposes always check whether the product is currently approved for the
intended use and situation.

Agriculture and Horticulture Development Board 2012. All rights reserved
AUTHENTICATION
We declare that this work was done under our supervision according to the procedures described herein and that the report represents a true and accurate record of the results obtained. Dr Pat Croft Project Leader STCRF Signature ............................................................ Date ............................................ Catherine Jones STCRF Signature ............................................................ Date ............................................ Report authorised by: [Name] [Position] [Organisation] Signature ............................................................ Date ............................................ [Name] [Position] [Organisation] Signature ............................................................ Date ............................................

Agriculture and Horticulture Development Board 2012. All rights reserved
CONTENTS
GROWER SUMMARY .............................................................................................. 1 Headline ................................................................................................................. 1 Background ............................................................................................................ 1
Summary ................................................................................................................ 1 Financial benefits ................................................................................................... 5 Action points ........................................................................................................... 6
SCIENCE SECTION ................................................................................................. 7 Introduction ............................................................................................................ 7
Materials and methods ........................................................................................... 7 Results ................................................................................................................. 10 Conclusions .......................................................................................................... 18
Agriculture and Horticulture Development Board 2012. All rights reserved 1
GROWER SUMMARY
Headlines
A wide selection of speciality crop nutrition products were applied to lettuce, carrots
and peas, and their effects on yield, and pest and disease damage, were assessed
during the 2012 season.
As in the first year of the trial in 2011, the most significant, beneficial effects were
particularly seen in lettuce.
Background
Vegetable growers are faced with increased demand for UK-grown produce in an arena of
reduced pesticide availability, increased fertiliser costs, pressure to reduce greenhouse
emissions, and demands to improve productivity and quality, whilst protecting the
environment and improving biodiversity. High yields require the management and
optimisation of all resources, including nitrogen (N), phosphorus (P), potassium (K) and
micronutrient availability.
This project is a repeated trial of project FV 394, which was conducted in 2011, and focuses
on screening plant growth enhancers (non-NPK macro and micronutrient products). The
aim of the project is to provide a service to the UK horticultural sector that uses recent
science, known expertise and grower consultations to better inform vegetable growers on
the options available for crop improvement using plant enhancers.
Summary of the results and main conclusions
Tables 1–3 below summarise the recorded effects of the different treatments for
each of the three crops (lettuce, carrots and peas) and compares the findings to the
previous year (2011).
The tables provide a simple comparison of the treatments against the control (NPK
only), indicating where the treatments gave a better performance than the control (>)
or not (x). The tables also indicate where these differences are significant after
statistical analysis (p<0.05) (+).
As previously recorded in the 2011 trials, significant treatment effects were recorded
on lettuce for fresh weight. Weights (dry and fresh) were recorded at harvest; Omex
Biomex Plus, TTL Plus and Phos-Star produced statistically significant increases in

Agriculture and Horticulture Development Board 2012. All rights reserved 2
yield (Table 1a). Due to the wet climate in 2012, downy mildew appeared quickly
throughout the lettuce crop; therefore assessment on percentage of leaves affected
was recorded. Botrytis cinerea, Sclerotinia sclerotiorum and tip-burn were not
recorded in 2012.
In the pea crop some treatments did improve measurements marginally in
comparison to the control plots (Table 2a), but there were no statistically valid
improvements. Root nodules were very poor in 2012 and it is possible this is
because the peas had been flooded due to the wettest year on record. Generally the
pea crop was poor due to this heavy rainfall and made comparisons of treatments
difficult.
Table 1a: Lettuce (Frisco) 2012
Treatments Means per plot (20 plants per plot)
Fresh Weight (g)
Dry weight (g) Disease (Downy mildew)
1 Commercial NPK * * * 2 InCa > X > 3 Wormcast X X X 4 Omex Biomex Starter > X > 5 Omex Biomex Plus + + > 6 PHC Colonise AG X X + 7 PHC Complete Plus > X X 8 TTL Plus + X X 9 Serenade > X X 10 Bactolife DP104 X X X 11 Bactolife A10 > X X 12 Phos-Star + X >

Agriculture and Horticulture Development Board 2012. All rights reserved 3
Table 1b: Lettuce (Frisco) 2011
Treatments Means per plot (20 plants per plot)
Weight (g) No. with Botrytis
No. with Sclerotinia
No. with tip burn
1 Control (NPK only) * * * * 2 InCA > + > > 3 Wormcast Pro > + X > 4 Omex Biomex Starter > > > > 5 Omex Biomex Plus > + > > 6 PLC Colonize AG X + > > 7 PHC Complete Plus X > > X 8 TTL Plus X + > X 9 Serenade + + > > 10 HYT b > + > > 11 HYTb + a + c > + > > 12 Phos-Star + + > >
Table 2a: Peas 2012
Treatments Means per sample
Numbers of pods
Stem length Pod weights
1 Control (NPK only) * * * 2 InCa X X X 3 Wormcast X X X 4 Omex Biomex Starter > > > 5 Omex Biomex Plus > > > 6 PHC Colonise AG X X X 7 PHC Complete Plus X > X 8 TTL Plus X > X 9 Serenade X > X 10 Bactolife DP104 > X > 11 Bactolife A10 > X X 12 Phos-Star X > X

Agriculture and Horticulture Development Board 2012. All rights reserved 4
Table 2b: Peas 2011
Treatments Means per sample (2 x 0.5 m)
Numbers of pods
Stem length
Pod weights
Nodule score
1 Control (NPK only) * * * * 2 InCa > > > > 3 Wormcast > > X X 4 Omex Biomex Starter > X > > 5 Omex Biomex Plus > > > > 6 PHC Colonise AG > X > X 7 PHC Complete Plus X > X X 8 TTL Plus > X > X 9 Serenade > X > X 10 HYTb X x > X 11 HYT abc > > > > 12 Phos-Star > > > X
2012 demonstrated that some treatments did improve marketable yield in carrots
compared to the control plots (PHC Complete plus, TTL plus, Serenade and
Wormcast), but results were not statistically significant. Cavity spot and carrot root
fly levels were low as in the previous year.
Table 3a: Carrots 2012
Treatments
Means per m2
Cavity spot score
No. of carrots with carrot root per m2
Weight per m2
Marketable weight per m2
1 Control (NPK only) * * * * 2 InCa > X > X 3 Wormcast X X > > 4 Omex Biomex Starter X X > X 5 Omex Biomex Plus X > X X 6 PHC Colonise AG > X X X 7 PHC Complete Plus > > > > 8 TTL Plus > > > > 9 Serenade X > > > 10 Bactolife DP104 > > > X 11 Bactolife A10 X X > X 12 Phos-Star > X X X

Agriculture and Horticulture Development Board 2012. All rights reserved 5
Table 3b: Carrots 2011
Treatments
Means per sample (60 carrots)
Cavity spot score
Carrot root fly score
Diameter Length
1 Control (NPK only) * * * * 2 InCa > X X X 3 Wormcast X X X X 4 Omex Biomex Starter X > X X 5 Omex Biomex Plus > X > > 6 PHC Colonise AG > > X X 7 PHC Complete Plus > X X X 8 TTL Plus > X X X 9 Serenade > X X X 10 HYTb X > > > 11 HYT abc X > X X 12 Phos-Star X X X X
The second year data have showed some marginal improvements in yield for carrots
and lettuce with some products. The results from two years of trials do not as yet
provide clear indications of the efficacy of these plant growth enhancing products.
However weather conditions for the two years were very different, with the 2012
being the wettest year on record.
Additional data would provide a clearer effect of the products on yield and disease. It
has been also suggested that introducing an additional control treatment with no
NPK application would be useful, as scientific evidence suggests that the addition of
NPK may counteract the potential benefits that some of the products are trying to
achieve in their promotion of beneficial microbes within the soil.
Research is needed to address the complex interactions of micronutrients and their role in
sustainable crop production before recommendations can be made to growers.
Financial benefits
It is possible that micronutrient treatments may provide sustainable methods of maintaining,
or even increasing, yield and quality. It is important for the horticultural industry to begin to
understand the evidence on micronutrient nutrition and whether these plant growth-
enhancing products are useful tools in crop production.
Agriculture and Horticulture Development Board 2012. All rights reserved 6
Action points for growers
Growers can use the results of this project to make more informed decisions on the
nutritional products applied to their crops
PLEASE NOTE: The HDC, whilst reporting the results of this independent work, does not
advocate or promote the use of the products reviewed in this study for crop protection. It is
important to note that:
c) The trials reported in this study are not specifically designed regulatory trials to
support a product claim and they have not been through any regulatory scrutiny to
assess consistency, level of control, and appropriate dose of the products.
d) It is important for growers to remember that before using any product for plant
protection purposes always check whether the product is currently approved for the
intended use and situation.
Agriculture and Horticulture Development Board 2012. All rights reserved 7
SCIENCE SECTION
Introduction
With increasing pressure on growers to produce larger yields or maintain current yields
using fewer inputs, there has been an increase in the market for yield-enhancing products.
These products exploit existing knowledge of macronutrients other than nitrogen (N),
phosphorus (P) and potassium (K) (e.g. magnesium, sulphur and calcium), micronutrients
(copper, manganese, boron and molybdenum) and microbials (mycorrhizal fungi).
There is currently no screening programme to provide information on the efficacy of these
plant growth enhancers. The aim of this project is to provide a first step towards
understanding the role that these products can play in helping growers achieve increased
yield and better quality crops.
Materials and methods
All work conducted for the project was undertaken at the Stockbridge Technology Centre
Research Foundation (STCRF).
Lettuces were propagated at STCRF before being transplanted; peas and carrot were
directly drilled.
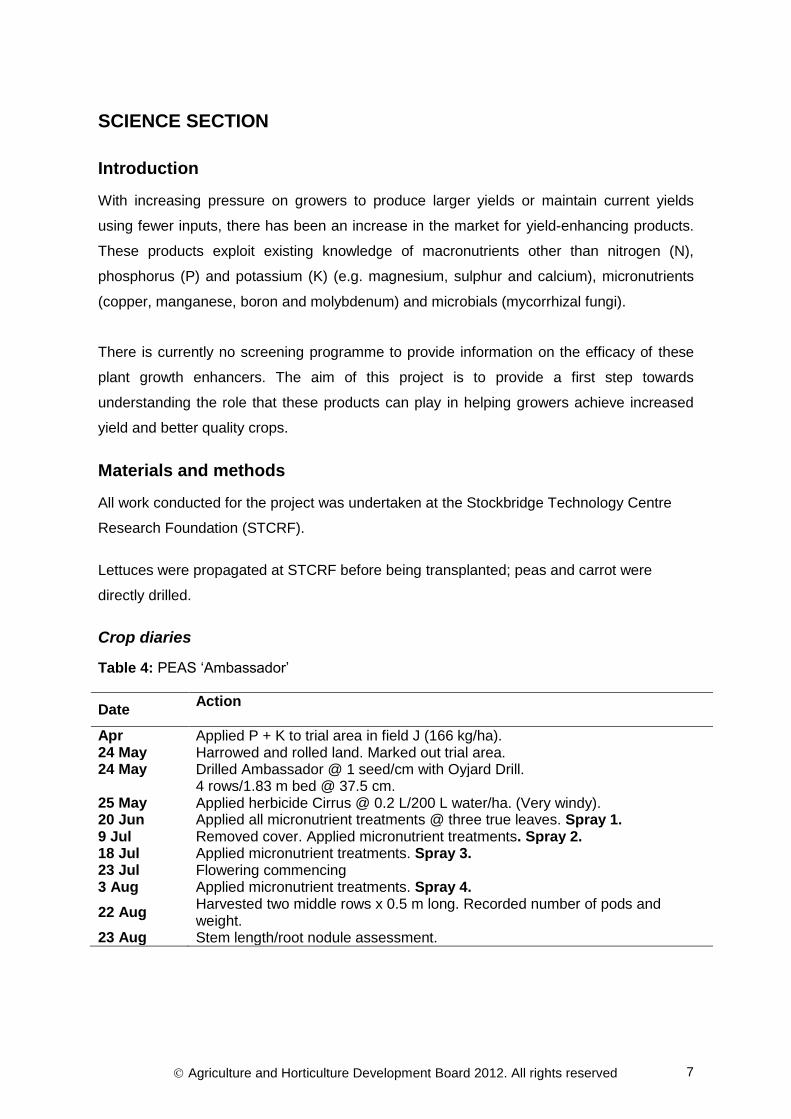
Crop diaries
Table 4: PEAS ‘Ambassador’
Date Action
Apr Applied P + K to trial area in field J (166 kg/ha). 24 May Harrowed and rolled land. Marked out trial area. 24 May Drilled Ambassador @ 1 seed/cm with Oyjard Drill. 4 rows/1.83 m bed @ 37.5 cm. 25 May Applied herbicide Cirrus @ 0.2 L/200 L water/ha. (Very windy). 20 Jun Applied all micronutrient treatments @ three true leaves. Spray 1. 9 Jul Removed cover. Applied micronutrient treatments. Spray 2. 18 Jul Applied micronutrient treatments. Spray 3. 23 Jul Flowering commencing 3 Aug Applied micronutrient treatments. Spray 4.
22 Aug Harvested two middle rows x 0.5 m long. Recorded number of pods and weight.
23 Aug Stem length/root nodule assessment.

Agriculture and Horticulture Development Board 2012. All rights reserved 8
Table 5: CARROTS ‘Nairobi’
Date Action
Apr Applied P and K to trial area in field J. 23 May Applied nitrogen @ 100 kg/ha. Harrowed and rolled seedbed. 24 May Drilled Nairobi @ 150–180 seeds/m2. 4 rows/1.83 m bed @ 37.5 cm. 24 May Applied herbicide. Linuron @ 1.2 L/200 L water/ha. 20 Jun Applied micronutrient treatments @ 2nd true leaf. Spray 1. 24 Jun Carrots hand weeded. 9 Jul Applied micronutrient treatments. Spray 2. 18 Jul Applied micronutrient treatments. Spray 3. 3 Aug Applied micronutrient treatments. Spray 4. 16 Aug Applied micronutrient treatments. Spray 5. 12 Nov Harvested middle 2 m rows and assessed.
Table 6: LETTUCE ‘Frisco’
Date Action
Apr Applied P and K to trial area in field J. Jun Lettuce cv. Frisco sown into blocks.
30 Jul Applied micronutrient treatments to run-off as a pre-planting drench. Spray 1. 30 Jul Applied nitrogen @ 100 kg/ha. Harrowed and rolled trial area. 30 Jul Marked out 4 rows/1.83 m bed @ 37.5 cm x 30 cm within rows. 1 Aug Planted lettuce. Irrigated 15 mm. 16 Aug Applied micronutrient treatments. Spray 2. 22 Aug Top dressed nitrogen @ 100 kg/ha 30 Aug Applied micronutrient treatments. Spray 3. 13 Sep Applied micronutrient treatments. Spray 4. 10 Oct Harvested.
Treatment application
Treatments were applied to the three crops using an Oxford Precision Sprayer at a pressure
of 2 bar.

Agriculture and Horticulture Development Board 2012. All rights reserved 9
Table 7: Treatments and rates
Product Rate Volume in 4 L of Water
Application
A Commercial NPK (Control)
4x at 14 day intervals
B InCa 1 L/ha 19.4 ml 4x at 14 day intervals C Wormcast Pro-Tea 10 L/ha 195 ml 4x at 14 day intervals D Omex Biomex Starter 0.5 L/ha 9.7 ml 4x at 14 day intervals E Omex Biomex Plus 2.5 L/ha 48.7 ml 4x at 14 day intervals F PHC Colonize AG 2 kg/ha 38.6 g 4x at 14 day intervals G PHC Complete Plus 2 kg/ha 38.6 g 4x at 14 day intervals H TTL Plus 4 L/ha 78.5 ml 4x at 14 day intervals I Serenade 10 L/ha 195 ml 4x at 14 day intervals J Bactolife DP104 2 kg/ha 38.6 g 4x at 14 day intervals K Bactolife A10 2.0 L/ha 40 ml 4x at 14 day intervals L Phos-Star PO3-PO4 1 L/ha 19.4 ml 4x at 14 day intervals
Each of the twelve treatments (including commercial NPK) was replicated four times. The
plots measured 9 m in length and 1.8 m in width. Treatments were applied at 200 L/ha.
Yield assessments:
Lettuce: At harvest each plant was assessed for fresh weight, dry weight and rated as either
marketable or non-marketable.
Peas: Peas were assessed for root nodulation, stem length and number and weight of pods.
Carrots: At harvest 2 x 1 m per plot were taken from middle rows and were scored for
diameter, length and weight.
Disease assessments:
Lettuce: At harvest, twenty lettuces were removed from the centre two rows of each plot
and assessed for disease.
Carrots: Harvested carrots were assessed for carrot root fly damage and cavity spot.
Peas: No disease was observed.
Data analysis
Analysis of Variance (ANOVA) was performed. Data sets with percentages were
transformed with angular transformations. Means were compared using least significant
difference (LSD) at the 5% level of significance.

Agriculture and Horticulture Development Board 2012. All rights reserved 10
Results
Lettuce (Frisco)
Dry weight
The average dry weight for each treatment is presented in Figure 1. Treatment with Omex
Biomex Plus gave the greatest mean dry weight. ANOVA results suggested no significant
differences between treatments at the 5% confidence level, but significant differences at the
10% level (p 0.07) were seen.
Fig. 1: Mean dry weight of lettuces in each treatment (+/- SE)
Fresh weight
Average marketable yield (fresh weight) for each treatment is shown in Figure 2. Treatment
with Phos-Star PO3-PO4 gave highly significant lettuce yield compared to the control
(273.23 g ± 12.56 and 214.75 g ± 9.14 respectively, p <0.001); this result was also
established in 2011 (FV 394). Omex Biomex Plus and TTL Plus also had significantly higher
fresh weights (p 0.02) compared to the control. An increase in fresh weight that does not
correspond to an increase in dry weight, as observed in treatments with Phos-Star or TTL
Plus and Phos-Star, reflects an increase in moisture content that may result in reduced
shelf-life. However, it may also be because of the inherent variability within the data set due
to extreme weather conditions.

Agriculture and Horticulture Development Board 2012. All rights reserved 11
Fig. 2: Mean fresh weight (yield) of lettuces in each treatment (+/- SE)
Disease
Due to the high rainfall experienced in 2012, tip-burn was not observed during the trial,
however, downy mildew appeared rapidly and evenly throughout the crop. To assess this
impact, the numbers of infected leaves per lettuce were recorded. Mean infection extent for
each treatment is shown in Figure 3. Treatment with PHC Colonize AG and Omex products
gave the lowest mean infection rates, but values were not significantly better than the
control.
Fig 3: Treatment differences in mean percentage of lettuce leaves infected with downy
mildew (+/- SE).

Agriculture and Horticulture Development Board 2012. All rights reserved 12
Carrots (Nairobi)
Marketable yield
High within-treatment variation suggests that few treatments have an effect on yield
compared to the NPK control treatment. Greatest mean marketable yields were found in the
PHC Complete Plus, TTL Plus and Serenade treatments; however, there was no
statistically significant difference in means of these treatments compared to the NPK
control. Figure 4 outlines these results.
Unmarketable yield
See Figure 5 for comparisons of mean unmarketable weight per metre. Greatest mean
unmarketable weight was found with the Wormcast treatment, but plots were highly
variable.
Fig. 4: Mean weight of carrots per metre of each plot for all treatments (+/- SE)

Agriculture and Horticulture Development Board 2012. All rights reserved 13
Fig. 5: Mean unmarketable weight per metre for each treatment (+/- SE).
Disease and pest damage
Cavity spot
The incidence of cavity spot was too low to measure any treatment effect. A maximum of
two carrots per plot were found to have the disease, and the majority had none. It was not
appropriate to calculate mean scores of cavity spot damage but total mean numbers of
infected carrots per treatment are given below.
Table 8: Mean number of carrots infected with cavity spot (numbers were very low across
all treatments).
Treatment Mean number of carrots infected with cavity spot
Commercial NPK 0.5
InCa 0
Wormcast 0.5
Omex Biomex Starter 1
Omex Biomex Plus 0.5
PHC Colonise AG 0
PHC Complete Plus 0.25
TTL Plus 0
Serenade 0.5
Bactolife DP104 0.25
Bactolife A10 1.25
Phos-Star 0

Agriculture and Horticulture Development Board 2012. All rights reserved 14
Carrot root fly
Carrot root fly incidence was also lower than in the previous year and, as a consequence,
damage assessment scores per carrot were replaced with mean numbers of carrots
showing signs of damage. Figure 6 shows the results of this assessment. No significant
difference in carrot fly incidence was identified following any of the treatments when
compared to commercial NPK. Slight but non-significant decreases in carrot root fly,
compared to the control plots, were found in Serenade, TTL Plus and PHC Complete Plus
treatments. Treatments showing greater incidence of carrot root fly than NPK have higher
within-treatment variability than other treatments; this is likely to be due to an edge effect,
whereby low numbers of carrot fly moved into the crop but kept close to the perimeter.
Fig 6: Mean number of carrots infected with carrot root fly per meter for each treatment.
Peas (Ambassador)
Stem length
Mean stem length amongst all treatments was fairly uniform (Fig. 7).

Agriculture and Horticulture Development Board 2012. All rights reserved 15
Fig. 7: Mean stem length of peas for each treatment (+/- SE)
Fig.8: Mean number of pods per plant for each treatment (+/- SE).
Figure 8 shows the comparison of mean numbers of pods per plant for the different
treatments. No treatments had a strong or significant effect on yield in terms of pod
numbers.
Agriculture and Horticulture Development Board 2012. All rights reserved 16
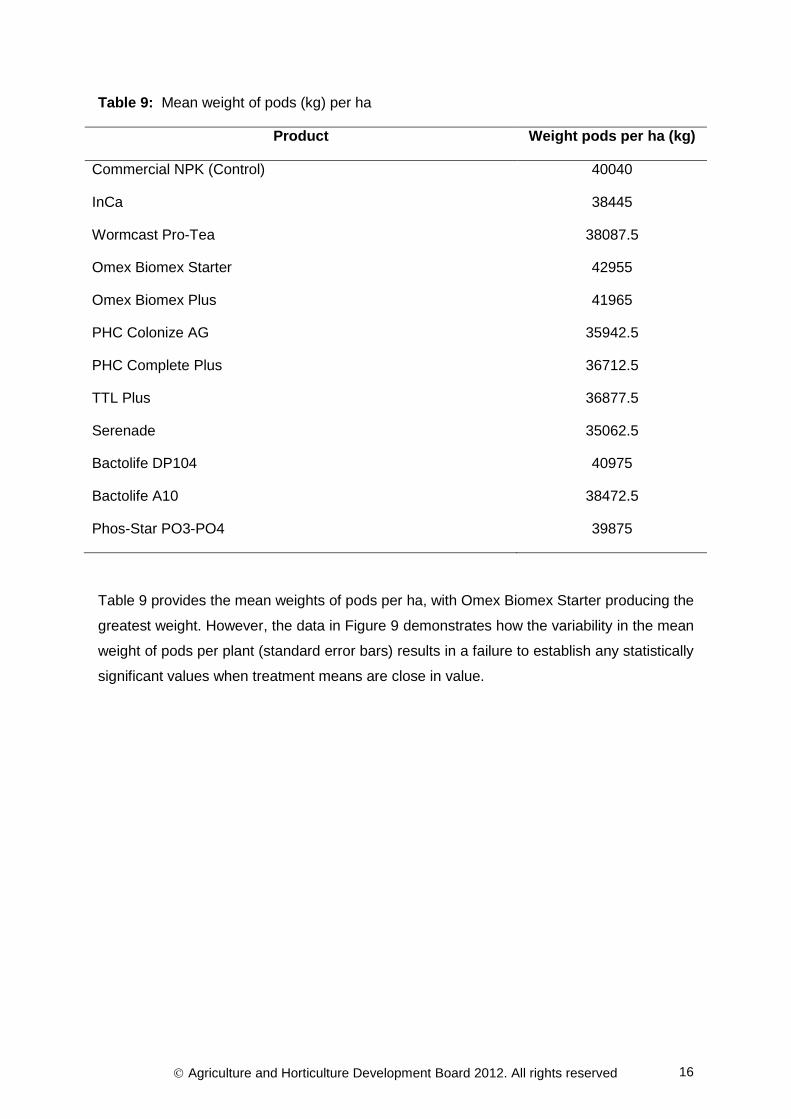
Table 9: Mean weight of pods (kg) per ha
Product Weight pods per ha (kg)
Commercial NPK (Control) 40040
InCa 38445
Wormcast Pro-Tea 38087.5
Omex Biomex Starter 42955
Omex Biomex Plus 41965
PHC Colonize AG 35942.5
PHC Complete Plus 36712.5
TTL Plus 36877.5
Serenade 35062.5
Bactolife DP104 40975
Bactolife A10 38472.5
Phos-Star PO3-PO4 39875
Table 9 provides the mean weights of pods per ha, with Omex Biomex Starter producing the
greatest weight. However, the data in Figure 9 demonstrates how the variability in the mean
weight of pods per plant (standard error bars) results in a failure to establish any statistically
significant values when treatment means are close in value.

Agriculture and Horticulture Development Board 2012. All rights reserved 17
Figure 9: Mean weight of pods (g) (±SE) per plant per plot.
Root nodule formation for all plants – regardless of treatment – was lower than expected
compared to the 2011 data. The maximum score for any plant was 6. There was no
significant treatment effect. Figure 10 highlights these results.
Fig. 10: Mean root nodule score for each treatment (+/- SE). The highest score possible for
a plant was 10.

Agriculture and Horticulture Development Board 2012. All rights reserved 18
Conclusions
The trial results for 2012 show significant increases in the fresh and dry weights of
lettuce. Dry and fresh weights recorded at harvest showed statistically significant
increases in yields with treatments of Omex Biomex Plus, TTL Plus and Phos-Star.
Treatment with Phos-Star produced similar results in trials conducted in 2011.
Due to wet weather in 2012 downy mildew appeared quickly through the lettuce
crop; therefore assessment of the percentage of leaves affected was recorded.
Botrytis cinerea, Sclerotinia sclerotiorum and tip-burn were not recorded in 2012.
It was demonstrated in 2012 that some treatments improved marketable yield in
carrots compared to the control plots, but there were no statistically valid results.
Cavity spot and carrot root fly levels were low as in the previous year.
In the pea crop, some treatments did improve yield measurements marginally in
comparison to the control plots (Table 2a). Omex Biomex Starter produced the
largest yield, but the results were not statistically significant in comparison to the
NPK control plots. Root nodules were very poor in 2012 and it is possible this is due
to the very wet year. Generally, the pea crop was poor due to this heavy rainfall and
made treatment comparisons difficult.
Overall, a wide selection of products have been tested over two growing seasons although
both years were subjected to extreme record breaking weather conditions: 2011 had the
driest spring and 2012, the wettest summer. There has been statistical evidence that some
products have provided benefits in yield and disease control, especially in association with
lettuce crops. However, the data is very variable and it is suggested that a further year of
trials is required to collect data that will provide a clearer picture. It would also be interesting
to understand the effects of these products on other parameters such as post-harvest
quality. An understanding of the interactions of the best candidate products would also be
useful to test for cumulative benefits.
In addition, there is much scientific evidence to suggest that fertilisers can reduce the
beneficial effects that mycorrhizal fungi and other microbes can play in crop growth. It is has
been suggested that the testing of vigour-enhancing products needs to be determined in the
absence of fertilisers.