Dr Paul Jelfs, ABS: Monitoring and Reporting on Socioeconomic Difference

Project title:Socioeconomic Monitoring (SocMon) Program
in the Philippines to Support Effective Coral Reef Conservation and Coastal Resources Management:
Initiation in Oriental Mindoro Province and Continuation in Puerto Princesa City,
Palawan Province
Submitted by:Palawan State University
Puerto Princesa City, Philippines
Submitted to:National Oceanic and Atmospheric Administration
Silver Spring, Maryland, USA
FINAL PROJECT REPORT September 2012
“Socioeconomic Monitoring (SocMon) Program in the Philippines to Support Effective
Coral Reef Conservation and Coastal Resources Management: Initiation in Oriental
Mindoro Province and Continuation in Puerto Princesa City, Palawan Province”
Institutional Partners and Members
City Government of Puerto Princesa
Mellissa Macasaet
Delia Martinez
Gloria Taggueg
Miguelito Cervancia
Omega Tabang
Ma. Teresa Casenas
Ivan Oja
Jerry Samoza
Joven Delgado
Melanie Sildera
Palawan Council for Sustainable Development Staff
John Francisco Pontillas
Jesus Bream
Palawan State University
Michael Pido
Marissa Pontillas
Eva Marie Ponce de Leon
Nelly Mendoza
Gianina Decano
Phabe Tabucalde
Ricardo Tajolosa
Catherine Mae Postre
Rainier Manalo
Arselene Bitara
Evelyn Tomas
Janeth Montilla
Ma Aynon Gonzales
Gretchen Pilapil
Fritz Ann Rodriguez
Jose Buenconsejo
Mary Aileen delas Alas

Mindoro State College of Arts and Technolology
Edna Piol
Magdalena Elaydo
Rhea de Guzman
Nilo Royo
Mylene Catapang
Angelita Baldon
Rolando Urate
Rosalia Soriano
Randy Quitain
Jean Gayeta
Jessica Enriquez
Regal Izon
Sheryl Dino
Gerolyn Bacudo
Eva Brinosa
Myla Izon

1
Table of Contents
Part 1 Expanded Summary ............................................................................................................. 2
1.1 Introduction ...................................................................................................................... 3
1.2 Methodology .................................................................................................................... 4
1.3 Results and Discussion ..................................................................................................... 6
1.4 Policy Directions and Lessons Learned ......................................................................... 10
Part 2 SocMon Site Report Barangay Inagawan, Puerto Princesa City, Palawan ........................ 17
Part 3 SocMon Site Report Barangay Kamuning, Puerto Princesa City, Palawan ....................... 78
Part 4 SocMon Site Report Barangay Cawayan, Bongabong, Oriental Mindoro ......................... 150
Part 5 SocMon Site Report Barangay Masaguisi, Bongabong, Oriental Mindoro ....................... 203
Part 6 Appendices ......................................................................................................................... 255
6. 1 Socioeconomic Monitoring Household Questionnaire ...................................................... 256
6.2 Socioeconomic Monitoring Key Informant Interview Questionnaire ................................ 261
6.3 Socioeconomic Monitoring Field Manual .......................................................................... 267

2
Part 1 Expanded Summary
“Socioeconomic Monitoring (SocMon) Program in the
Philippines to Support Effective Coral Reef Conservation and
Coastal Resources Management: Initiation in Oriental Mindoro
Province and Continuation in Puerto Princesa City, Palawan
Province”
3
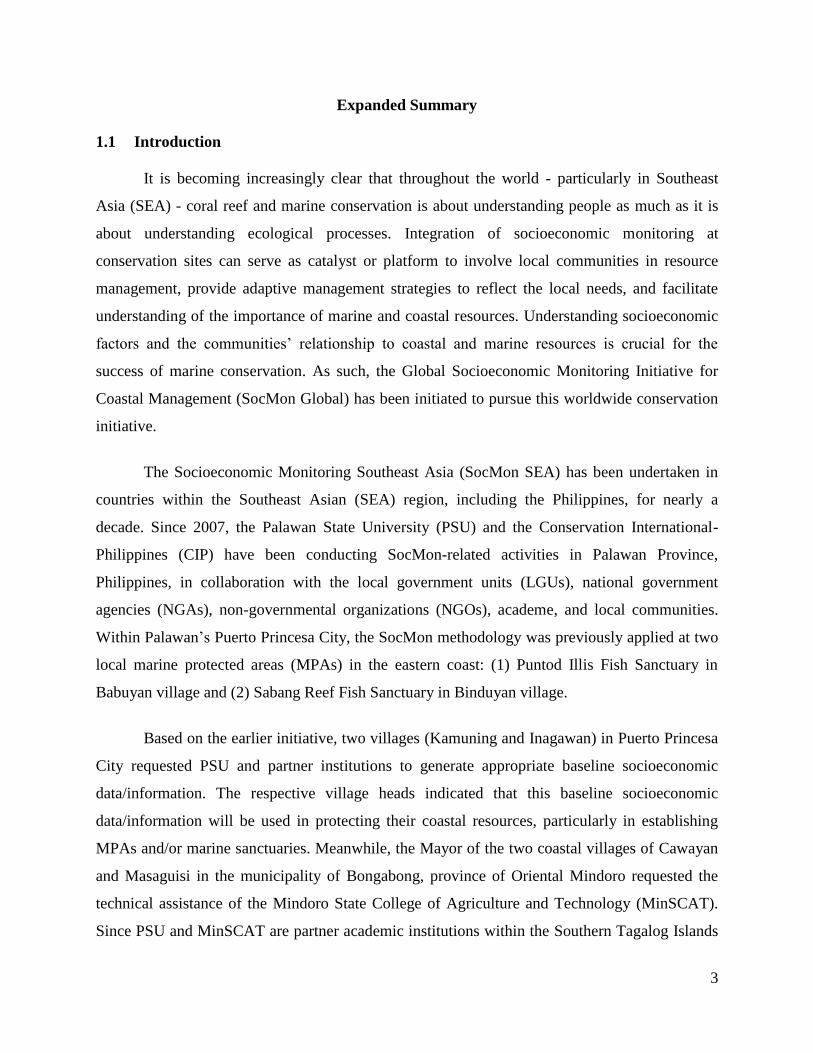
Expanded Summary
1.1 Introduction
It is becoming increasingly clear that throughout the world - particularly in Southeast
Asia (SEA) - coral reef and marine conservation is about understanding people as much as it is
about understanding ecological processes. Integration of socioeconomic monitoring at
conservation sites can serve as catalyst or platform to involve local communities in resource
management, provide adaptive management strategies to reflect the local needs, and facilitate
understanding of the importance of marine and coastal resources. Understanding socioeconomic
factors and the communities‟ relationship to coastal and marine resources is crucial for the
success of marine conservation. As such, the Global Socioeconomic Monitoring Initiative for
Coastal Management (SocMon Global) has been initiated to pursue this worldwide conservation
initiative.
The Socioeconomic Monitoring Southeast Asia (SocMon SEA) has been undertaken in
countries within the Southeast Asian (SEA) region, including the Philippines, for nearly a
decade. Since 2007, the Palawan State University (PSU) and the Conservation International-
Philippines (CIP) have been conducting SocMon-related activities in Palawan Province,
Philippines, in collaboration with the local government units (LGUs), national government
agencies (NGAs), non-governmental organizations (NGOs), academe, and local communities.
Within Palawan‟s Puerto Princesa City, the SocMon methodology was previously applied at two
local marine protected areas (MPAs) in the eastern coast: (1) Puntod Illis Fish Sanctuary in
Babuyan village and (2) Sabang Reef Fish Sanctuary in Binduyan village.
Based on the earlier initiative, two villages (Kamuning and Inagawan) in Puerto Princesa
City requested PSU and partner institutions to generate appropriate baseline socioeconomic
data/information. The respective village heads indicated that this baseline socioeconomic
data/information will be used in protecting their coastal resources, particularly in establishing
MPAs and/or marine sanctuaries. Meanwhile, the Mayor of the two coastal villages of Cawayan
and Masaguisi in the municipality of Bongabong, province of Oriental Mindoro requested the
technical assistance of the Mindoro State College of Agriculture and Technology (MinSCAT).
Since PSU and MinSCAT are partner academic institutions within the Southern Tagalog Islands

4
Research and Development Consortium (STIRDC) - and PSU being the new center of SocMon
SEA since 2009 - MinSCAT solicited PSU‟s assistance. The pressing need was recognized to
generate socioeconomic data/information in these two villages to serve as bases for their
villages‟ coral reef and coastal conservation program initiatives.
In view of the above, the project titled “Socioeconomic Monitoring (SocMon) Program in
the Philippines to Support Effective Coral Reef Conservation and Coastal Resources
Management: Initiation in Oriental Mindoro Province and Continuation in Puerto Princesa City,
Palawan Province” was launched in October 2010. The goal of this project is to propagate the
use of socioeconomic monitoring (SocMon) among academics, researchers, policy makers, and
coastal managers thereby enhancing coral reef conservation and coastal resources management.
This project also aims to highlight the utility and practical applications that can be derived from
using SocMon as a tool for adaptive management. The objectives include: (1) train researchers,
managers, and key stakeholders in applying the SocMon SEA methodology in generating
relevant socio-economic information, (2) undertake SocMon field surveys at four coastal villages
in the provinces of Oriental Mindoro and Palawan, Philippines; (3) analyze the collected data
and prepare appropriate technical reports, policy briefs, and recommendations for use by relevant
stakeholders, including the documentation of the experiences and lessons learned on the use of
SocMon; and (4) disseminate the results to policy makers, coastal managers, local communities
and other relevant stakeholders to ensure their utilization.
1.2 Methodology
The overall methodology and/or general procedure for training, field data collection and
data analysis followed the SocMon methodology (Bunce and Pomeroy 2000, Bunce et al. 2003).
The SocMon Process basically follows three major steps. The first part was advance preparation
that included defining the objectives of SocMon, establishing the SocMon team and preparing
the logistics. The second part was data collection, which was the generation of field data whereas
three complementary research methods were employed namely, household interview (HHI), key
informant interview (KII), and focused group discussion (FGD). The total number of respondents
for the four study sites is as follows: HHI – 515; KII – 29; and FGD – 5. The third part was data

5
analysis which made use of qualitative and quantitative analysis, while communication consisted
of disseminating the results to the relevant stakeholders.
The partners involved in project planning and implementation belonged to different
institutional categories. PSU and MinSCAT are publicly-funded academic institutions, classified
as state universities and colleges (SUCs) with an existing partnership as members of the
STIRDC. The City Government of Puerto Princesa (CGPP) and the Municipality of Bongabong
are classified as LGUs. On the other hand, the Palawan Council for Sustainable Development
Staff (PCSDS) is a national government agency. Funding support for this research project was
provided by the US National Oceanic and Atmospheric Administration (NOAA) as an external
donor. The PSU Center for Strategic Policy and Governance, Inc. (PSU-CSPGI), as the „private
and non-profit‟ arm of PSU, also served as a conduit for fund management.
Two coastal villages (barangays) were selected in each of the provinces of Mindoro and
Palawan. The villages of Kamuning and Inagawan in Puerto Princesa City were chosen in
Palawan, while the two coastal villages of Cawayan and Masaguisi in the Municipality of
Bongabong were selected in Oriental Mindoro. These four villages expressed need for socio-
economic information for their local development planning. Details of these villages are
contained in the individual site reports.
The project covered a two-year period, which started its implementation in October 2010
and was completed in September 2012. During the “Project Start-up Meeting” held on 2-3
December 2010, the key project partners attended a workshop in Puerto Princesa City. The
workshop enabled the participants to consensually select the SocMon indicators to be used for
the study. From December 2010 until April 2011, the following were undertaken: formation of
the SocMon training team, development of the SocMon training design, and preparation of
research instruments for household interviews (HHIs), key informant interviews (KIIs), and
focus group discussions (FGDs). The SocMon Methodology Training was held in May 2011 for
both provinces while the field work to gather data were undertaken from June to November
2011. Methodologically, the SocMon data gathering was a participatory process involving the
local resident communities, selected stakeholders of local (municipal/city) governments. A
random sample of household respondents was chosen for the HHIs. Respondents for the KIIs
included: village officials, municipality officials, law enforcement personnel, and members of

6
fisheries and aquatic resources management councils. FGDs were conducted for fisher groups
and farmers.
Trainings on SocMon data analysis were held in Oriental Mindoro in August 2011, and in
Puerto Princesa City in November 2011. After the initial data analysis and reports were written,
community validation workshops were undertaken in September 2012 to solicit the stakeholders‟
feedback concerning the results of HHIs, FGDs and KIIs. Two „Stakeholder Roundtable
Discussions‟ were also conducted as part of the project closure in September 2012. These events
enabled the project team to: (1) disseminate the initial SocMon results; (2) present the
communication plan; (3) present some policy implications/recommendations; and (4) discuss the
next steps. The project formally concluded on 28 September 2012.
1.3 Results and Discussion
This part presents key results and highlights findings of the study. The coastal habitats in
the four study sites are broadly similar consisting of coral reefs, mangroves, and seagrass beds.
All villages are in the process of establishing marine protected areas (MPAs) or fish sanctuaries
as a conservation measure. All fisheries are multi-species and multi-gear but dominated by gill
net and hook-and-line.
Most households have between 4-6 members. They have relatively high levels of literacy.
Across sites, more than 44% have completed high school education. Roman Catholic is the most
dominant religion. Coastal residents are highly dependent on fisheries for food, livelihoods, and
income. As aggregate, however, they are more dependent on farming rather than fishing for
livelihoods. There is low livelihood-diversification as evidenced by the high retention of
residents within farming and fishing occupations.
Because of the methodological difficulties of measuring household income, particularly
in rural villages whereby income is not officially declared, SocMon does not attempt to measure
it. Instead, the variable “material style of life” is used as a substitute. Hence, as a proxy variable,
this is used as a rough measure of the economic status of the households. Material style of life
was quantified as an aggregate ordinal value derived from scoring the type of the household‟s
residential structure with respect to roof, structural walls, windows, and floor.

7
Over-all, about two-thirds of the households have very low or low material style of life as
reflected in their use of light materials such as bamboo and nipa (a type of palm that grows in
estuarine areas) in their residential dwellings. It can therefore be inferred that majority of the
households are not economically well off, if the basis to be used is the materials of their
residential dwellings. It was noted, however, that nearly one third of the households have houses
that are predominantly made of tin/galvanized iron roofs, thatch/bamboo walls and windows, and
cement floors. This was surprising considering that these villages have high (over 30%)
unemployment rates. We have found out that most of these expensive house materials were
purchased through the remittances of relatives and/or family members who are overseas foreign
workers, particularly in Barangay Masaguisi.
Generally, the respondents have positive attitudes towards non-market and non-use
values of coastal resources. They recognized the indirect non-market value of reef for protecting
land from storm waves as well as its value as habitats for fisheries; they also recognized the
value of mangroves as nursery grounds for fisheries. In terms of existence non-use value, they
acknowledged the significance of corals reefs beyond fishing and diving, that fishing should be
restricted in certain areas to allow fish and coral to grow, and that seagrass beds have existence
value. Majority of villagers recognize the bequest value of coastal resources. Hence, they want
future generations to enjoy the mangroves and coral reefs and are in agreement to restrict
development in some coastal areas so that future generations will still have natural environments.
Overall, the net perception ratings of resource conditions are positive. Such holds true for
mangroves, coral reefs, upland forests, seagrass, beach, spring, river/creeks, and ground water.
On a comparative scale, the highest net rating was groundwater in Masaguisi at 97.7%, while the
lowest was for upland forest in Inagawan at 22.1%.
The coastal resources in the project sites are under varying forms of threats. Those
specific for mangroves include cutting for household and commercial uses, charcoal making and
natural phenomenon (typhoons, big waves), conversion into fish pond and clearing for
settlements. Threats to coral reefs include cyanide/compressor fishing, dynamite/blast fishing,
natural phenomenon (typhoon, waves), illegal fishing activities, coral gathering for

8
household/commercial use, and clearing/mining/digging. In the case of seagrass beds, the
perceived threats are clearing/mining/digging, fishing using dragnets, natural phenomenon
(typhoon, waves), gathering for household and commercial uses, illegal fishing activities, and
pollution/dumping of garbage.
There are also threats to other resources. For beach, it includes sand quarrying,
pollution/dumping of garbage , natural phenomena (such as sea level rise, typhoons, big waves,
etc.), soil erosion from the uplands, and residential area expansion. Highly mentioned perceived
threats to upland forests include charcoal making, slash and burn farming, forest conversion into
residential settlements , and cutting trees for household/commercial uses. Key threats to
rivers/creeks include water pollution, dumping of garbage, soil erosion/ upland sedimentation,
and natural phenomenon (e.g. typhoons). Meanwhile, threats to ground water include natural
phenomenon, deforestation/cutting of trees in watershed, pollution/dumping of garbage, water
contamination due to sewage, expansion of residential settlements, tourist- and resort-related
development, overexploitation for household use and saltwater intrusion.
It is also noted that there is a tendency among village residents to attribute to natural
phenomenon the threat to their resources, whether coastal or non-coastal. In one village, natural
phenomenon was among the top three threats cited by residents for each of their resources. They
seemed to perceive that natural occurrences such as typhoons and strong waves are a threat to
the integrity of their resources. This view may breed passivity and a sense of helplessness among
community residents with regard to their responsibility and role in resource management and
conservation.
Their level of awareness of resource rules and regulations varies across resource use.
They were most aware of coastal resource use particularly those related to fishing, mangroves,
and aquaculture. Their level of awareness is the least for recreational and transport related
activities. The level of awareness of village-level and municipal-level resource rules and
regulations likewise varies.
The current ratings of participation in decision making are generally low for resource
uses and/or coastal activities. Majority prefer to enhance their future level of participation across

9
resources they use or activities engaged in, mainly fishing, mangrove management and pebble
gathering. s. However, at present, majority are not members of stakeholder organizations.
Common associations in the villages relate to fisheries, agriculture, and women groups.
Typical to most coastal villages in the Philippines, there are a host of problems and issues
that needs to be addressed. Such concerns are broadly classified into three categories: (1) bio-
physical issues, (2) socio-economic issues, and (3) institutional/governance issues. Bio-physical
issues include: depleted/declining fishery resources, degraded fishery habitats, pollution/waste of
coastal waters, coastal erosions/ siltation, climate change, sea level rise and salt water intrusion.
Socio-economic issues relate to lack of alternative/supplemental livelihood, post harvest losses,
and intensified resource use competition and conflict. Institutional/governance issues cover
inadequate/inconsistent fisheries policies, limited institutional capabilities, weak institutional
partnerships, lack of harmonization of plans, programs or projects, weak/limited coastal law
enforcement and unclear property rights.
Despite the existence of several problems, there are also perceived successes in coastal
management. These relate to: (1) conservation of coastal habitats, (2) community mobilization
and (3) enforcement. Conservation of coastal habitats largely covers mangrove reforestation as
well as protection of seagrass beds and coral reefs. Community mobilization efforts include
activities such as coastal cleanups, village environmental sanitation, and socio-cultural activities
such as feast for the seas (Piyesta ng Karagatan). Enforcement successes include initiatives for
stricter enforcement of fishery laws and regulations as well as very active organizations such as
BFARMC and Bantay Dagat in some villages. Included in regulatory successes are stricter
implementation of prohibition on sand quarrying and enforcement of ecological waste
management programs.
Several program recommendations are forwarded to address these concerns. These
program recommendations are clustered into five categories: (1) indirect regulation, (2) direct
regulation, (3) conservation and protection measures, (4) economic measures, and (5)
governance/institutional measures. Indirect regulation is exemplified by the banning on the use
of specific fishing gears and limiting the number of fishing boats, while direct regulation may
take the form of catch quotas and fish size limits. Conservation and protection measures include

10
ban on catching of threatened species, establishment of fish sanctuaries, habitat restoration,
zoning and seasonal closures (on-and off-seasons). Economic measures cover livelihoods
promotion (both alternative and supplemental employment, including their sustainability), credit
support, fishery subsidies and marketing assistance. Examples of governance/institutional
measures are information and education campaign, capacity-building, constituency-building,
law enforcement, management planning, policy development, organizational development and
private-public sector partnership.
1.4 Policy Directions and Lessons Learned
The above program recommendations imply the need to pursue certain policy directions.
An obvious direction is „Development‟ whereby sufficient employment must be generated to
address the issue of poverty and rural deprivation. The concerns for alternative and supplemental
livelihoods have been highlighted in these four villages. As may be needed, fisheries and tourism
development may be pursued in appropriate geographical areas. Another policy direction is
„Protection‟ of the coastal habitats: coral reefs, mangroves, seagrass beds and soft-bottom
communities. Either mitigative or preventive measures need to be undertaken to protect the
coastal resources and ecosystems against the negative impacts of development endeavors. To the
extent possible, land-based sources of pollutants, which in these cases are agricultural effluents,
must be minimized.
There must be a policy direction towards „Sustainability „for the rational use of the
coastal resources for the benefit of both current and future generations. In the case of fisheries,
for example, species must be harvested within their sustainable yields. The same principle holds
true for the freshwater resources. Institutionally, „Capacitation‟ of the local government units is
needed. There are many technical and/or substantive requirements to effectively manage the
coastal environments. Included here are various forms of training related to livelihoods, habitat
restoration and environmental sanitation, among others.
A crucial direction is policy towards „Integration‟ or integrated management. There is the
need for physical integration that involves an ecosystem approach that considers connectivity
and interface among land, sea and people. Operations of various economic sectors must be
harmonized. The initiatives of various organizations/institutions involved in coastal management

11
need to be synchronized to achieve maximum benefits. Efforts of external donors must be
channeled to address critical concerns in appropriate geography. Policy direction for effective
„communication‟ is needed. The local academic institutions must be fully-tapped to generate the
necessary data and/or information for effective policy making and on-the-ground actions. A
healthy exchange of ideas and information among relevant stakeholders is essential for effective
fisheries governance. It also includes the use of scientific knowledge for adaptive management.
In pursuit of diverse societal objectives, the governance of coastal areas will continue to
be a delicate balancing act. The situation in these four SocMon villages somehow exemplify that
management is complicated as all of these objectives may either be in conflict over the short-
term – or difficult to achieve simultaneously. It is hoped that the SocMon methodology will help
achieve the balance.
SocMon methodology proved to be a practical assessment tool for coastal management.
What is presented in the succeeding discussions are 10 lessons culled from its use in this research
project and, therefore, are areas of improvement for future use. First, „SocMon methodology has
enhanced community awareness.‟ The community members in the four villages actively
participated in the project‟s data gathering activities and validations. Hence, they became more
aware of the status of their surrounding coastal areas. They were able to recall programs or
projects that were successfully implemented, and those that need to be improved in
implementation. The village stakeholders have also become more purposive as to what programs
and policies to implement that would effectively solve the coastal management issues and
community problems.
Through the SocMon, they became more privy to the details of the coastal conditions of
their villages. For instance, the specifics of the rules and regulations in coastal management
being enforced by the villages and/or local government units (LGUs) are not generally known to
the local populace. The community learned to give more importance on the protection and
management of their coastal resources since this would eventually affect the socioeconomic
conditions of their villages.

12
Second, „SocMon methodology is a practical diagnostic tool.‟ The SocMon methodology
used was able to diagnose in a practical manner the various facets of the four coastal
communities. Relevant socio-economic and governance elements were conveniently generated;
pertinent biophysical facets were obtained through household interviews and/or community
consultations. The methodology was relatively cost-effective, relying on a selected
multidisciplinary team of local academics and professional from the LGUs and other partner
agencies. The data gathering instruments were found to be suitable to the intended tasks - as
basis for recommendations on policies and programs. Therefore, the methodology can be applied
to other similar data generation activities in the community or locality.
The third lesson is „SocMon is a flexible field methodology.‟ It allows researchers to
modify and/or add related variables and to introduce other data gathering methods. For this
study, level of participation in resource use decision making was further delineated into a
current level (referring to the present) and a desired level (referring to how much they are willing
to participate) in order to find out whether people‟s participation levels can still be increased, and
if so desired, to what extent. Data on current and desired participation levels gave researchers
the opportunity to statistically compare the two facets of participation, the results of which is
useful in community mobilization. Data gathering can also be made more participatory and
communal by conducting group interviews through focus group discussions (FGD) with five to
ten key informants. The interviewer serves as the facilitator/moderator who asks questions to be
answered by any one or all of the key informants. The response of one could be immediately
validated by the others and a consensus is usually arrived at as an answer to the question. Richer
data are usually drawn from key informants in an FGD compared to individual interviews.
Fourth, „Bio-physical assessments may complement SocMon methodology.‟ To
complement the socio-economic assessments, some simple biophysical measurements could be
undertaken. Some issues related to environmental conservation and CRM are best supported with
field or physical evidence, although this is more of a snapshot data rather than time series data.
These may include measuring soil loss through simple erosion plots, measuring selected
mangrove stands at diameter at breast height, and measuring turbidity using a secchi disk to
indicate the status of marine water quality. The status of coral reefs can easily be assessed
through a manta tow survey. As the need arises, experimental test fishing can be conducted.

13
These field assessments are best undertaken by biologists. Hence, it is ideal to have field
researchers who are experts in the natural and social science disciplines.
Fifth, „SocMon is useful for „academe-local government‟ collaboration.‟ SocMon
provided a unique avenue for a more cooperative partnership between academic institutions and
LGUs. The academe is particularly good in generating and/or analyzing information. Barangay
officials gave their full support to the project by providing invaluable information during the key
informants and household interviews.
Overall, the project team received more than adequate support from the concerned
villages and municipal/city LGUs. The visited local communities were very receptive of the
project team. Such enthusiasms were reflected by the active participation of the village officials
during data gathering activities as well as provision of meals during community consultations. In
addition, the partnership arrangements served as a catalytic forum for developing future
collaborative projects between the academe and LGUs. Partnerships forged because of this
program enable true collaboration with one another especially on the sharing of resources, tasks
and responsibilities to produce useful results in the implementation of CRM programs and
establishment of marine protected areas which can be replicated in other sites.
Sixth, SocMon methodology would require creativity involving contextualization and
dynamic use of matrices. This was done in, „material style of life” that was put into context.‟
Because of the methodological difficulties of measuring household income, particularly in rural
villages whereby income is not officially declared, SocMon does not attempt to measure it.
Instead, the variable “material style of life” is used as a substitute. Hence, as a proxy variable,
this is used as a rough measure of the economic status of the households. To quantify material
style of life, an aggregate ordinal value was derived from scoring the type of the household‟s
residential structure with respect to roof, structural walls, windows, and floor.
As a whole, about two-thirds of the households have very low or low material style of life
as reflected in their use of light materials such as bamboo and nipa in their residential dwellings.
It can therefore be inferred that majority of the households are not economically well off if the
basis to be used is the materials of their residential dwellings. It was noted, however, that nearly
one third of the households have houses that are predominantly made of tin/galvanized iron
14
roofs, thatch/bamboo walls and windows, and cement floors. This was surprising, considering
that these villages have high (over 30%) unemployment rates. We have found out that most of
these expensive materials were purchased through the remittances of their relatives and/or family
members who are overseas foreign workers, particularly in Barangay Masaguisi.
Furthermore, the need for creativity was underscored in data generation using FGD.
Experience with FGD revealed the effective use of output tables to gather and summarize data
from a group. Output tables give simplified view of relationships between variables, and
allowed the researchers to solicit information in a stepwise, logical, interactive, and iterative
manner. With an effective facilitator, the questions naturally flow and become simple to answer
for the participants.
Seventh, „Community perceptions of issues appear to be geographic and livelihood-
based.‟ Perceptions of community members, in general, appear to be based on geographical
factors or livelihood considerations – or both. Many full-time farmers living in the interior of the
villages seemed to have little idea about coastal marine activities. They are also not privy to
marine pollution issues, such as garbage and siltation. Similarly, most full-time coastal fishers
have limited inkling about agricultural practices that are related to crops and livestock. This may
be the reasons why there were few respondents who identified the commonly-recognized
problems.
Corollary with this, more allocation of government resources are desired for enhanced
coastal management. The village governments have limited resources to allocate for coral reef
conservation and CRM. Hence, more government resources need to be allocated at the
municipal/city level, which serves as the main center for coastal management. Some village
officials have expressed that they cannot undertake effective coastal law enforcement by
themselves. Most often, the least allocation happens at the village level while a few resources are
allocated at the provincial level. There is also reliance on externally-funded projects.
Eighth, „project partnership may transcend geographical boundaries.‟ Although unusual,
the partnership arrangement was generally successful. The Palawan State University (PSU),
classified as a state university or college (SUC), spearheaded the project given its experience in

15
undertaking SocMon-related activities since 2007. Within the Palawan province, PSU has
partnered with three institutions namely: the City Government of Puerto Princesa, an LGU; the
Palawan Council for Sustainable Development Staff, a national government agency (NGA); and
the PSU Center for Strategic Policy and Governance, Inc., which served as a conduit for fund
management as the ‘private and non-profit’ arm of PSU.
Some 447 km away in the province of Oriental Mindoro were two more partners: the
Mindoro State College of Agriculture and Technology, another SUC and the Municipality of
Bongabong, an LGU. Collectively, these six institutions undertook their respective
responsibilities based on the agreed work plan. They also provided counterpart contributions (in-
kind and cash). Meantime, as an external donor, the US National Oceanic and Atmospheric
Administration provided an equivalent of US$24,900.00. Through this unusual institutional set-
up, this SocMon project came to a successful conclusion.
The ‘need to expand partnerships in coastal management’ is the ninth lesson learned.
There is a need to expand partnerships in coral reef conservation and CRM. Given the complex
problems/issues that confront the coastal areas, the cost of program/project interventions cannot
be borne solely by the LGUs and/or SUCs. For example, the Bureau of Fisheries and Aquatic
Resources and the Department of Environment and Natural Resources can be tapped for more
mangrove reforestation activities/programs. As an NGA, the Department of Science and
Technology - given its various programs of support on capacity building and technology transfer
can prove to be a potent partner in CRM – particularly in product value adding for agriculture
and fishery commodities. Linking with ‘non-traditional’ partners - such as civic organizations
and external donors – is also becoming a necessity. MinSCAT has established linkages with the
Korean International Agency and the Malampaya Foundation, Inc. that they intend to enhance
through this SocMon initiative.
Tenth, ‘interventions to address coastal issues need to be streamlined.’ Many of the coral
reef and CRM issues and concerns that were identified are relatively well known. They have
been listed in various government reports, national plans and academic reports over the last few
decades. The management interventions and/or measures – in the forms of broad programs and
specific projects – that are needed to address these issues are also generally well known.

16
Mangrove reforestation is used to address mangrove destruction; gear regulation may be
employed to reduce overfishing; and the introduction of livelihood projects to address the issue
of rural poverty and deprivation.
At the governance side, the LGUs are being capacitated for coral reef conservation and
CRM. Relevant policies are likewise being modified and/or new ones are being developed to
enhance the CRM efforts. The emerging need is meant for better structuring of these many
management measures to ensure that they address the critical/crucial issues and maximize their
effectiveness as well. The prioritized programs and projects would provide00 the coastal political
leaders and policy makers alike – as well as coastal managers – with more solid basis for
making informed decisions on where to allocate their limited administrative and financial
resources.
Overall, as a participatory tool, the SocMon methodology was found useful in the
characterization of coastal villages. Through the 10 lessons learned from this project, the
SocMon methodology may be improved for future use.

17
Part 2 SocMon Site Report Barangay
Inagawan, Puerto Princesa City, Palawan
“Socioeconomic Monitoring (SocMon) Program in the
Philippines to Support Effective Coral Reef Conservation and
Coastal Resources Management: Initiation in Oriental Mindoro
Province and Continuation in Puerto Princesa City, Palawan
Province”

Socioeconomic Monitoring (SocMon) Program in the Philippines to Support Effective
Coral Reef Conservation and Coastal Resources Management: Initiation in Oriental Mindoro
Province and Continuation in Puerto Princesa City, Palawan Province
SocMon Site ReportBarangay Inagawan, Puerto Princesa City
Palawan, PhilippinesCenter for Strategic Policy and Governance
Palawan State UniversityPuerto Princesa City
City Agriculture OfficeCity Goverment of Puerto Princesa
Puerto Princesa City
Palawan Council for Sustainable Development StaffPuerto Princesa City
September 2012
2
Table of Contents
List of Tables ........................................................................................................................ 3
List of Figures ........................................................................................................................ 5
List of Appendices ................................................................................................................. 5
List of Acronyms and Abbreviations ..................................................................................... 7
Summary ................................................................................................................................ 8
2.1 Introduction ...................................................................................................... 11
2.2 Methodology .................................................................................................... 14
2.3 Results and Discussion ..................................................................................... 17
2.3.1 Household Demographics ................................................................................. 17
2.3.2 Household Occupations and Income Sources ................................................... 20
2.3.3 Coastal and Marine Activities ........................................................................... 23
2.3.4 Attitudes towards Indirect Values of Resources ............................................... 24
2.3.5 Perceived Resource Conditions ........................................................................ 28
2.3.6 Perceived Threats to Resources ........................................................................ 30
2.3.7 Awareness of Rules and Regulations on Resource Use.................................... 39
2.3.8 Participation in Decision Making ..................................................................... 41
2.3.9 Membership in Resource Use Stakeholder Organizations ................................ 44
2.3.10 Perceptions on Coastal Management Problems and Solutions ......................... 45
2.3.11 Perceptions of Successes and Challenges in Coastal Management .................. 48
2.3.12 Perceptions of Community Management Problems and Solutions................... 51
2.3.13 Governance ....................................................................................................... 54
2.4 Conclusions and Recommendations ................................................................. 55
2.5 Bibliography ..................................................................................................... 57
2.6 Appendices ................................................................................................................... 58

3
List of Tables
Table 1.Household demographic characteristics in Household demographic characteristics in
Barangay Inagawan, Puerto Princesa City, Philippines,.(n = 115) ...................... 18
Table 2. Summary quantitative indices for household size and age in Barangay Inagawan,
Puerto Princesa City, Philippines, (n =155) . ......................................................... 19
Table 3. Household socio-cultural characteristics in Barangay Inagawan, Puerto Princesa
City, Philippines, (n = 115). ................................................................................... 19
Table 4. Primary and secondary occupations of household members* in Barangay Inagawan,
Puerto Princesa City, Philippines, (n = 115). ......................................................... 20
Table 5. Most important income sources of households Barangay Inagawan, Puerto Princesa
City, Philippines, (n = 115). ................................................................................... 21
Table 6. Material style of life in Barangay Inagawan, Puerto Princesa City, Philippines, (n =
115). ........................................................................................................................ 22
Table 7. Household coastal and marine activities in Barangay Inagawan, Puerto Princesa
City, Philippines. .................................................................................................... 23
Table 8. Attitudes towards non-market & non-use values of coastal resources at ................ 25
Table 9. Means and standard deviations of rating scores of attitudes towards non-market and
non-use values of coastal resources at Barangay Inagawan, Puerto Princesa City,
Philippines, (n = 115) ............................................................................................. 26
Table 10. Aggregate rating scores on attitudes towards non-market and non-use values of
coastal resources at Barangay Inagawan, Puerto Princesa City, Philippines, (n =
115) ......................................................................................................................... 27
Table 11. Means and standard deviations of aggregate rating scores on attitudes towards non-
market & non-use values of coastal resources atBarangay Inagawan, Puerto
Princesa City, Philippines, (n = 115) ...................................................................... 27
Table 12. Perceptions of resource conditions at Barangay Inagawan, Puerto Pprincesa City,
Philippines, (n = 115) ............................................................................................. 29
Table 13. Means and standard deviations of ratings on perceived Resource conditions at
Barangay Inagawan, Puerto Princesa City, Philippines, (n = 115) ....................... 29
Table 14. Perceived threats to mangroves Barangay Inagawan, Puerto Princesa City,
Philippines, (n = 115) ............................................................................................. 31
Table 15. Perceived threats to coral reefs at Barangay Inagawan, Puerto Princesa City,
Philippines, (n = 115) ............................................................................................. 32
Table 16. Perceived threats to upland forests Barangay Inagawan, Puerto Princesa City,
Philippines, (n = 115) ............................................................................................. 33
Table 17. Perceived threats to seagrass Barangays Inagawan, Puerto Princesa City,
Philippines, (n = 115) ............................................................................................. 34

4
Table 18. Perceived Threats to Beach at Barangays Inagawan, Puerto Princesa City,
Philippines, (n = 115) ............................................................................................. 35
Table 19. Perceived threats to springs Barangay Inagawan, Puerto Princesa City,
Philippines, (n = 115) ............................................................................................. 36
Table 20. Perceived threats to rivers/creeks Barangays Inagawan, Puerto Princesa City,
Philippines, (n = 115) ............................................................................................. 37
Table 21. Perceived Threats to Ground Water Barangay Inagawan, Puerto Princesa City,
Philippines, (n = 115) ............................................................................................. 38
Table 22. Top perceived threats to coastal resources at Barangay Inagawan, Puerto Princesa
City, Philippines (n = 115) ..................................................................................... 39
Table 23. Top perceived threats to non-coastal resources at Barangay Inagawan, Puerto
Princesa City, Philippines (n = 115) ....................................................................... 39
Table 24. Awareness of resource rules and regulations Barangay Inagawan, Puerto Princesa
City, Philippines, (n = 115) .................................................................................... 40
Table 25. Current and desired levels of participation in decision making Barangays
Inagawan, Puerto Princesa City, Philippines, (n = 115) ........................................ 42
Table 26. Means and standard deviations of ratings of participation in decision making
Barangays Inagawan, Puerto Princesa City, Philippines, (n = 115) ..................... 43
Table 27. Comparisons of current and desired levels of participation in decision making
Barangays Inagawan, Puerto Princesa City, Philippines, (n = 115) ..................... 44
Table 28. Household membership in resource use stakeholder organizations Barangay
Inagawan, Puerto Princesa City, Philippines, (n = 115) ........................................ 44
Table 29. Membership in resource use stakeholder organizations Barangays Inagawan,
Puerto Princesa City, Philippines, (n = 115) .......................................................... 45
Table 30. Perceived coastal management problems Barangay Inagawan, Puerto Princesa
City, Philippines, (n = 115) .................................................................................... 46
Table 31. Perceived coastal management solutions (n = 115) Barangay Inagawan, Puerto
Princesa City, Philippines, (n = 115) ...................................................................... 47
Table 32. Top perceived coastal management problems and solutions Barangay Inagawan,
Puerto Princesa City, Philippines, (n = 115) .......................................................... 48
Table 33. Perceived successes in coastal management Barangay Inagawan, Puerto Princesa
City, Philippines, (n = 115) .................................................................................... 49
Table 34. Perceived challenges in coastal resources management Barangay Inagawan, Puerto
Princesa City, Philippines, (n = 115) ...................................................................... 50
Table 35. Top perceived successes and challenges in coastal management Barangay
Inagawan, Puerto Princesa City, Philippines, (n = 115) ........................................ 50
Table 36. Perceived community problems Barangay Inagawan, Puerto Princesa City,
Philippines, (n= 115) .............................................................................................. 51
Table 37. Perceived Community ProblemsBarangay Inagawan, Puerto Princesa City,
Philippines, (n = 115) ............................................................................................. 52

5
Table 38. Top perceived community problems and solutions Barangay Inagawan, Puerto
Princesa City, Philippines, (n = 115) ...................................................................... 53
Table 39. Community organizations and functions. ............................................................... 54
List of Figures
Figure 1. Map showing the location of Barangay Inagawan in Puerto Princesa City, Palawan,
Philippines. ............................................................................................................. 11
Figure 2. Mean ratings for items on attitudes towards non-market and non-use values
(n=115). .................................................................................................................. 26
Figure 3. Mean ratings of perceived resource conditions at Barangay Inagawan, Puerto
Princesa City, Philippines (n = 115). ...................................................................... 30
List of Appendices
Appendix 1. Commonly used fishing gears, Barangay Inagawan, Puerto Princesa City,
Palawan, Philippines .......................................................................................... 58
Appendix 2. Common names and equivalent local names of commonly caught marine
species, Barangay Inagawan, Puerto Princesa City, Palawan, Philippines ........ 59

6
“Socioeconomic Monitoring (SocMon) Program in the Philippines to Support Effective
Coral Reef Conservation and Coastal Resources Management: Initiation in Oriental
Mindoro Province and Continuation in Puerto Princesa City, Palawan Province”
Institutional Partners and Members
City Government of Puerto Princesa
Mellissa Macasaet
Delia Martinez
Gloria Taggueg
Miguelito Cervancia
Omega Tabang
Ma. Teresa Casenas
Ivan Oja
Jerry Samoza
Joven Delgado
Melanie Sildera
Palawan Council for Sustainable Development Staff
John Francisco Pontillas
Jesus Bream
Palawan State University
Michael Pido
Marissa Pontillas
Eva Marie Ponce de Leon
Nelly Mendoza
Gianina Decano
Phabe Tabucalde
Ricardo Tajolosa
Catherine Mae Postre
Rainier Manalo
Arselene Bitara
Evelyn Tomas
Janeth Montilla
Ma Aynon Gonzales
Gretchen Pilapil
Fritz Ann Rodriguez
Jose Buenconsejo
Mary Aileen delas Alas

7
List of Acronyms and Abbreviations
BFARMC Barangay Fisheries and Aquatic Resources Management Council
CBMS Community-Based Monitoring Survey
CGPP City Government of Puerto Princesa
CWA Community Women Association
CWF Charity Women’s Foundation
DILG Dept. of Interior and Local Government
FGD focused group discussions
GI galvanized iron
ha hectares
HH household
HHI household interview
INKAISA Inagawan Kamuning Irrigators’ Association
KCRDI Kamuning Coastal Residents Development, Incorporated
KI key informant
KII key informant interview
km kilometers
MPA marine protected area
NGO non-government organization
PALECO Palawan Electric Cooperative
PCSDS Palawan Council for Sustainable Development Staff
RA Republic Act
RIC Rural Improvement Club
SCO Senior Citizen Organization
SEA Southeast Asia
SK Sangguniang Kabataan
SocMon Socioeconomic Monitoring

8
Summary
Introduction
Understanding socioeconomic factors and the communities’ relationship to coastal
and marine resources is crucial for the success of marine conservation. This is addressed
through socioeconomic monitoring, a global initiative for coastal management being
undertaken in the Southeast Asian Region through the Socioeconomic Monitoring Southeast
Asia (SocMon SEA) , including the Philippines, for nearly a decade. This report provides a
synopsis of the socio-economic monitoring (SocMon) conducted in Barangay Inagawan,
Puerto Princesa City, Palawan Province, Philippines. The goal of this project is to propagate
the use of socioeconomic monitoring (SocMon) among academics, researchers, policy
makers, and coastal managers thereby enhancing coral reef conservation and coastal
resources management.
Methodology
The SocMon methodology followed three major steps. The first part was advance
preparation that included defining the objectives of SocMon, establishing the SocMon team
and preparing the logistics. The second part was data collection, which was the generation of
field data using three complementary research methods namely, household interview (HHI),
key informant interview (KII), and focused group discussions (FGD). The number of
respondents is as follows: HHI – 115 households; KII – 2; and FGD – 2. Field data were
gathered from June 2011 to August 2012 in Barangay Inagawan, Puerto Princesa City. The
third part was analysis of both qualitative and quantitative data, while communication
consisted of disseminating the results to the relevant stakeholders. The Palawan State
University took the lead and the partners involved were the City Government of Puerto
Princesa (CGPP) and the Palawan Council for Sustainable Development Staff (PCSDS).
Results and Discussion
Barangay Inagawan is a rural village located 53 kilometers south of Puerto Princesa
City proper. It has a total land area of 711 ha, 94% of which is agricultural and mostly

9
planted with rice. Its shoreline of about .34 km is on its eastern side facing the Sulu Sea. As
of 2009, the village has 351 households comprised of 1,454 individuals. The number (54%)
of households rely on farming, either as a primary or secondary source of income, was twice
as much as those who relied on fishing. Unemployment was high; 38.1% of those who are 16
years old and above were not regularly engaged in any occupational activity. About 60% of
the households had very low or low material style of life as reflected in their use of light
materials such as bamboo and nipa for their residential dwellings.
Fishing activities included capture fisheries and aquaculture while non-fishing
activities are nipa shingles making, farming, and livestock raising. Fishermen used various
devices and methods to catch fish such as push net for milkfish fry gathering, beach seine,
hook and line, multiple handline, gillnet, crab pot and squid jigger. Most of the catch was
sold both within and outside the village.
Community residents had mostly positive attitudes on the indirect non-market and
non-use values of their coastal resources, with the highest appreciation expressed for the
resources’ indirect non-market values particularly for corals and mangroves, followed by
bequest values, and the lowest appreciation of their existence non-use values.
The community’s ground water, springs, river/creeks, beach, seagrass, coral reefs and
mangroves are generally perceived to be in good condition but the terrestrial forests were in
neither good nor bad condition. A low of 25.2% (for upland forests) to a high of 61.7% (for
groundwater) perceived no threat to their resources while from 12.2% (for beach) to 30.5%
(for upland forests) acknowledged that they are not in a position to answer or do not know of
any threat. For those who knew of at least one threat, the most often cited threats were
cutting of trees for commercial/household uses, including charcoal making for mangroves
and terrestrial forests; illegal fishing methods for coral reefs, sand quarrying and
pollution/garbage dumping for beach, springs, and rivers/creeks. Natural phenomena such as
typhoons were also attributed as a threat to all fresh water sources.
Most residents were aware of rules and regulations on fishing (82.6%) and
mangroves (77.4%) that were said to originate from the City Government of Puerto Princesa.
However, fewer than 30% were aware of rules on pebble gathering, residential development,

10
and aquaculture. Though there are resource use stakeholder organizations in the village, only
36.5% of the households are a member of at least one. Hence, most households rated their
current levels of participation in decision-making as no participation, except for fishing and
mangroves which had higher degrees of participation. There is an expression of a greater
desire to participate in decision making particularly in fishing and mangroves. Overall, the
residents’ desired levels are higher than their currents levels, and these differences are all
statistically significant.
Even if about 6 out of 10 said that they don’t have or don’t know any coastal
management problem, those who knew of at least one gave problems related to: (1) the use of
illegal fishing methods such as dynamite, cyanide, compressor, fine mesh net; (2) decrease
in fish catch/over-exploitation of coastal resources; (3) resource competition/conflict; and (4)
sanitation. Though they perceived that they are successful in community mobilization,
enforcement of fishery laws and ordinances, and organizing the BFARMC and Bantay Dagat,
these are still a continuing challenge to them – community compliance of the fishery rules
and regulations, and enforcement of such rules and regulations. The proposed solutions given
by the residents can be categorized into three: governance – enforcement, governance –
policy, and community mobilization.
For the community as a whole, the top problems perceived by the residents are the
inadequate infrastructure (drainage, bridge, feeder road); the need for
alternative/supplemental livelihoods; lack of electricity/street lights and poverty. Because of
the large group of out-of-school youth, juvenile delinquency was also mentioned. The cited
solutions center on employment, access to credit, infrastructure improvement through action
by concerned authorities, and access to electricity.
Greater support to village-level governance, particularly on enforcement and policy,
needs to be provided. The village council’s initiative to declare a certain portion of the
coastal waters within the vicinity of the village as a marine protected area (MPA) has to be
formalized by delineating its boundaries and by enacting a city ordinance declaring the said
area as an MPA. It is hoped that the relevant recommendations described herein will be
adopted by the concerned implementers, planners, and policy makers.

11
2.1 Introduction
Barangay Inagawan is a village in Puerto Princesa City, located 53 km south of the
City proper (Figure 1). It has a total land area of 711 ha of which 20 ha is residential, 666 ha
is agricultural and 25 ha is woodland. It has a shoreline of approximately .34 km on its
eastern side facing the Sulu Sea. It is bounded on the North and the West by Barangay
Inagawan Sub-Colony, on the South by Barangay Kamuning, and on the East by the Sulu
Sea. It has three sitios and seven puroks. Three puroks - Mangingisda, Masagana, and
Mabuhay - are located along the coastal area facing the Sulu Sea.
Figure 1. Map showing the location of Barangay Inagawan in Puerto Princesa City, Palawan,
Philippines.
Barangay Inagawan has soils that are mostly alluvial in formation and are usually
fertile, which are classified as prime agricultural lands suitable for agricultural production. It
is also one of the areas in Puerto Princesa City with large tracts of lowland rice fields due to
its almost flat terrain Its water resources include Inagawan River with an estimated

12
catchment area of 15,592 hectares. The Inagawan River provides a good source of irrigation
water, making it a major rice producer in Puerto Princesa City.
Based on the Puerto Princesa City Government’s Community-Based Monitoring
Survey (CBMS) conducted in 2009, the village had a total of 351 households and a
population of 1,454 divided into 756 (52.0%) males and 698 (48.0%) females. On the other
hand, the average household size is comprised of 4 members while the population density is
2.04 per ha (City Government of Puerto Princesa, 2009).
With regards to religion, 90% of the population is Roman Catholic while the
remaining 10% is divided into Protestant, Baptist, and Born Again Christian religious groups
The presence of a public elementary and a public high school within the village contributes
to a high literacy rate. As such, 568 male and 541 female of the population (10 years old and
above) are literate (Dept. of Interior and Local Government (DILG), 2009).
Majority of the population are engaged in farming (60%). Other sources of income are
employment in government and private institutions and entrepreneurial activities (25%) and
fishing (15%) (DILG, 2009). The following matrix shows the residents’ various sources and
ranges of monthly income:
Sources of Income Income (PhP)
Government Employment 9,000.00 – 15,000.00
Business (e,g. sari-sari store) 7,000.00 – 9,000.00
Farming 6,000.00 – 8,000.00
Fishing 5,000.00 – 7,000.00
Source: Inagawan Barangay Profile (DILG, 2009)
At present, the total registered fisher folks are 93, of whom 48 are full time and 45
are part time. These are composed of fishermen, gleaners, and fish vendors. The fish catch of
the village is on a downward trend since 2010 due to competition from fishermen coming
from nearby municipalities of Aborlan and Narra as alleged by the locals. However, fish
production is also affected by natural calamities such as typhoons that usually affect the area
during the latter half of the year thereby restricting the fishermen from fishing. Majority of
the fishermen utilized hook and line and gill net while others used fish pots, fish corral, and
13
speargun (Puerto Princesa City Agriculture Office, 2012; Puerto Princesa City Government,
2007).
The village’s 22 ha of mangrove area function as buffer along the shore and estuarine
areas, aside from serving as breeding and nursery grounds for various marine organisms. Sea
grass, on the other hand, is located on the southeastern waters of the village and has 50%
expanding vegetation cover. Grazing marks of dugong were found on the sea grass bed
indicating their presence in the area. Moreover, the marine waters in front of Barangay
Inagawan are inhabited by rare and threatened dolphins such as the bottlenose dolphin
(Tursiops truncatus) and the long-snouted spinner dolphin (Stenella longirostris). The
presence of these dolphins in the area led to the development of a dolphin watching project
City Government of Puerto Princesa, 2007). Some of the identified successes in the coastal
management include mangrove conservation along the riverbank and the maintenance of
coastal cleanliness (City Government of Puerto Princesa, 2011).
To help the village in addressing the needs of its constituents, different agencies and
associations provide support by establishing projects or extending technical assistance. Some
of these associations and agencies are Charity Women’s Foundation (CWF), Rural
Improvement Club (RIC), Farmers Association, 4H Club, Barangay Fisheries and Aquatic
Resources Management Council (BFARMC), and Senior Citizens Association. The agencies
that have been providing services to the village are the City Social Welfare and
Development, City Agriculture Office, City Tourism Office, City Health Office, City
Veterinary Office and Bantay Puerto Program of the City (City Government of Puerto
Princesa, Socioeconomic Profile 2007; City Agriculture Office, 2009; DILG, 2009).
Presently, the Office of the City Agriculture provides extension services such as farm
inputs in crop production and capacity building training to organizations such as the
BFARMC. The agency also issues fishermen’s identification cards based on the Registry of
Fishers that is mandated under RA 8550 or the Fisheries Code of 1998. Other programs
implemented in the village include land preparation services through the Tractor Pool and
deployment of equipment to assist in irrigation development. Trainings to improve farm
productivity are also done especially in rice production and other plantation crops such as
cacao and vegetable production. Moreover, information dissemination about existing fishery

14
laws and ordinances are also conducted in the community especially to fisher folks. In
addition, the City Agriculture Office offers assistance in empowering farm youth and rural
women in the area through the organization of 4H club and Rural Improvement Club.
The City Veterinary Office is tasked to provide technical services pertaining to the
raising of livestock, poultry, and other domestic animals. On the other hand, the City Health
Office has available programs on the development and improvement of community health
education as well as to motivate, encourage, and improve community participation in health
activities (City Government of Puerto Princesa, 2012). One satellite clinic was established in
the village to cater to the health needs of the community as well as the constituents of the
nearby village. On the other hand, the Bantay Puerto Program ensures proper utilization of
the resources and that all the activities pertaining to the environment are in accordance with
the existing laws. Conversely, the City Tourism Office helps in the development of tourism
sites and extends assistance to the local community in the management of these sites. In
addition, the City Social Welfare and Development Office also have socio-civic programs
that can be availed by the residents of the community. These programs include the following:
aid to individuals in crises, services for minors, practical skills development, self-
employment assistance, disaster relief assistance, stress debriefing, training of village disaster
coordinating councils (relief committee), Unlad Kabataan, comprehensive and integrated
delivery of social services, issuance of PhilHealth cards, and strengthening/training of the
barangay council for the protection of children in Puerto Princesa City (City Government of
Puerto Princesa, 2012).
2.2 Methodology
The overall methodology and/or general procedure for training, field data collection
and data analysis followed the SocMon methodology (Bunce and Pomeroy 2000, Bunce et al.
2003). SocMon is “a set of guidelines for establishing a socioeconomic monitoring program
at a coastal management site in Southeast Asia” in order to gain an understanding of the
social, cultural, economic, and political characteristics and conditions of individuals,
households, groups, and communities (Bunce and Pomeroy, 2003). The SocMon process
basically follows three major steps. The first part was advance preparation that included

15
defining the objectives of SocMon, establishing the SocMon team and preparing the logistics.
The second part was data collection, which was the generation of field data whereas three
complementary research methods were employed namely, household interview (HHI), key
informant interview (KII), and focused group discussions (FGD). The third part was analysis
of the gathered qualitative and quantitative data, while communication consisted of
disseminating the results to the relevant stakeholders.
The SocMon methodology provides a standardized set of 32 indicators and 28
indicators using key informant/secondary source and household interviews, respectively.
Household interview indicators are categorized into household demographics (9), coastal and
marine activities (5), attitudes and perceptions (13), and the material style of life (1). A mix
of both quantitative and qualitative data arises out of undertaking a SocMon community-level
survey using all or subsets of these 28 indicator variables. The results are summarized with
the end view of translating data into useful information for any or all of the following
purposes: (1) identifying threats, problems, solutions, and opportunities; (2) determining the
importance, value, and cultural significance of resources and its uses; (3) assessing positive
and negative impacts of management measures; (4) assessing how the management body is
doing (management effectiveness); (5) building stakeholder participation and appropriate
education and awareness programs; (6) verifying and documenting assumptions of
socioeconomic conditions in the area, community dynamics and stakeholder perceptions; and
(7) establishing baseline household and community profile.
The main purpose of undertaking the SocMon in Inagawan is to establish the
necessary socioeconomic baseline information needed for establishing marine sanctuaries
and for resource use planning by communities. For the four study sites, all 60 key informant
(KI) and household (HH) indicators were chosen and utilized to obtain the necessary
information required by the communities for planning and decision–making. These variables
were chosen after a consultation with community leaders/site managers and other key
stakeholders to ensure the responsiveness of the research variables to the local conditions.
The process/means of data collection involved extracting data from both primary and
secondary sources. In addition to a review of available documents such as but not limited to

16
village profiles, municipal statistics, and relevant national reports, data gathering instruments
were utilized to collect and cross-validate data. Primary data were collected in the field to
complement secondary data as well as to fill identified gaps. Primary data collection took
place through the development and administration of household questionnaire survey and
through individual/group interview of key informants (KIs). The selected key informants
(KIs) were individuals who, because of their position, experience and/or knowledge,
provided insights into the larger population. The KIs chosen included local leaders,
community elders, coastal managers, representatives of non-governmental organizations and
policy makers. Individual KIIs were conducted to collect useful baseline data, as well as to
validate the primary and secondary data collected through other methods. The FGDs, on the
other hand, were group interviews designed to gather/validate both questionnaire and KII
data for the baseline. Focused group participants included fishers, tourist operators,
community elders, farmers, and NGO representatives present in the community. The
socioeconomic household surveys collected data directly from the household head, usually
the husband or wife in the family, through face-to-face interviews.
Systematic sampling was employed to randomly select the sample households thereby
ensuring representatives of the population, with the sampling interval computed as the
quotient of the population size divided by the desired sample size. The list of households was
used as the sampling frame for Barangay Inagawan. From the population of 351 households,
a systematic random sample of 115 households was drawn. This sample size is 32.8% of the
household population, and is comprised of 495 individuals. Two key informant interviews
and two focus group discussions were also conducted during the research.
The SocMon household survey was conducted by trained enumerators while the team
statistician supervised the development of the database, encoding, and data analysis. Results
of the surveys were then presented to the community and other stakeholders for validations.
After the validations were completed, the technical reports for each village were finalized.
Some of these reports will be translated into layman’s language, such as policy briefs.
Appropriate reports were also disseminated to the relevant stakeholder groups so that they
may use the research results for planning and adaptive management.

17
2.3 Results and Discussion
2.3.1 Household Demographics
Household demographics relate to size, gender, and educational attainment of
household members (Table 1 and Table 2). Out of the 115 households surveyed, 62 (53.9%)
had four to six members while about a third had three or less. Though half of the households
had at most 4 members, the other half had greater than 4, making the typical household size
around 4 to 5 members. There are slightly more males (53%) than females in the community.
About 40% of the residents are less than 19 years old while 15% are aged 50 years and
above. The median age is 25 which is lower than the mean age of 28.40, confirming that the
distribution of ages is positively skewed; that is, there are more younger people and fewer
older people in the community. Only 13.1% were born outside the province, with 63.7%
having been born in the community. For those beyond the school-age population (aged 16
years and below), 45.9% were last enrolled in or graduated from high school, 22.9% did not
go beyond grade six and 17.6% have had some years of college education. Only 10% are
college graduates and very few (2.7%) had vocational-technical education.

18
Table 1. Household demographic characteristics in Barangay Inagawan, Puerto Princesa
City, Philippines (n = 115).
Demographic Characteristic Frequency Percentage
Household Size
1 to 3 members
4 to 6 members
7 to 9 members
10 or more members
38
62
13
2
33.0
53.9
11.3
1.7
Gender
Male
Female
266
232
53.4
46.6
Age (as of last birthday)
0 to 9 years
10 to 19 years
20 to 29 years
30 to 39 years
40 to 49 years
50 to 59 years
60 to 69 years
70 years and above
No response
90
115
66
76
73
41
22
12
3
18.1
23.1
13.3
15.3
14.7
8.2
4.4
2.4
0.6
Highest Educational Attainment
(for household members > 16 years)
No formal schooling
At most grade 4
At most grade 6/elementary grad
At most 3rd
year high school
At most 4th
year/high school grad
College undergraduate
College graduate
Vocational/technical graduate
5
17
51
40
106
56
33
9
1.6
5.4
16.1
12.6
33.4
17.7
10.4
2.8
Birthplace
Barangay locale
Municipal locale
Provincial locale
Regional locale
Other regions in Luzon
Other regions in Visayas
Other regions in Mindanao
No response
317
75
39
11
23
16
5
12
63.7
15.1
7.8
2.2
4.6
3.2
1.0
2.4

19
Table 2. Summary of quantitative indices for household size and age in Barangay Inagawan,
Puerto Princesa City, Philippines (n =155).
Statistical Measure Household Size Age (in years)
Total Number 115 households 495 individuals
Median 4 25
Mean 4.3 28.4
Standard Deviation 1.9 19.1
Skewness 0.6 0.5
The community is predominantly Roman Catholic with a very small 5.4% belonging
to other religions (Table 3). In terms of ethnicity, about 12% belongs to the Tagbanua tribe,
which is an indigenous group in the village, 41% belongs to other ethnic groups within the
province, while a third does not identify itself to a distinct ethnic group, suggesting
generations of mixed ethnic offspring. This is also reflected in the preponderance of Tagalog
as the lingua franca or primary language spoken even as it is not an ethnic language in the
research site.
Table 3. Household socio-cultural characteristics in Barangay Inagawan, Puerto Princesa
City, Philippines (n = 115).
Socio-Cultural Characteristic Frequency Percentage
Religion
Roman Catholic
Iglesia ni Kristo
Born-again Christian
Baptist
471
6
6
13
94.6
1.2
1.2
2.6
Ethnic Membership
Ethnic group within the locality
Ethnic group within the province
Ethnic group within the region
Ethnic group within Luzon
Ethnic group within Visayas
Ethnic group within Mindanao
No response/None
59
207
1
32
34
3
162
11.8
41.6
0.2
6.4
6.8
0.6
32.5
Primary Language Spoken
Tagalog
Cuyunin
Cebuano
No response/missing
444
44
7
3
88.8
8.8
1.4
0.6

20
2.3.2 Household Occupations and Income Sources
A big group (121 or 38.1%) of those who are 16 years old and above is not regularly
engaged in any occupational activity (Table 4). For those who are working, close to half (88
or 44.7%) is engaged in farming as their primary or secondary occupation, making it the
largest occupational group. Fishing ranks as the second largest occupational group with a
much lower 23.4% engaged in it. The other sizable occupational groups are self-
employed/small businessmen (20.8%) and laborer/construction workers (16.2%).
Table 4. Primary and secondary occupations of household members* in Barangay Inagawan,
Puerto Princesa City, Philippines (n = 115).
Occupation Category Primary Secondary Total/Combined
No. % No. % No. %
Fishing 36 18.3 10 5.1 46 23.4
Farming 69 35.0 19 9.6 88 44.7
Regular government employment 8 4.1 8 4.1
Private professional employment 11 5.6 11 5.6
Laborer/construction worker 19 9.6 13 6.6 32 16.2
Self-employed/small business 27 13.7 14 7.1 41 20.8
Animal raising 7 3.6 8 4.1 15 7.7
Singles making 13 6.6 4 2.0 17 8.6
Tricycle driver 5 2.5 5 2.5
Others 2 1.0 4 2.0 6 3.0
Sub-total 197 100.0 71 36.0
No occupation/no information 121 38.1
Total 318 100.0
*For those aged 16 years and above
Since the main occupation in the community is farming, it is not surprising that
40.9% of the households rely on farming as their primary source of income, followed by
fishing (19.1%) and self-employment/small businesses (13.9%) (see Table 5). Almost 70% of
the households have a secondary source of income, mostly on self-employment/small
business, farming, laborer/construction worker, and shingles making. Overall, 53.9% of the
households rely on farming either as a primary or secondary source of income. This group is
twice as much as those whose primary or secondary source of household income is fishing
(27.0%).

21
Table 5. Most important income sources of households Barangay Inagawan, Puerto Princesa
City, Philippines (n = 115).
Source of Income
Primary Secondary Total/
Combined
No. % No. % No. %
Pension 1 0.9 1 0.9
Local remittance from relatives 1 0.9 1 0.9
Foreign remittance from relatives 0 0.00 0 0.00
Fishing 22 19.1 9 7.8 31 27.0
Farming 47 40.9 15 13.0 62 53.9
Regular government employment 6 5.2 3 2.6 9 7.8
Private professional employment 3 2.6 1 0.9 4 3.5
Laborer/construction worker 10 8.7 15 13.0 25 21.7
Self-employed/small business 16 13.9 17 14.8 33 28.7
Animal raising 3 2.6 13 11.3 16 13.9
Singles making 5 4.3 7 6.1 12 10.4
None 1 0.9
Total 115 100.00 80 69.57
Due to the methodological difficulties of measuring household income, SocMon does
not make any attempt to measure it but instead substitutes the variable “material style of life”
as a rough measure of the economic status of the households. The measure for material style
of life is an aggregate ordinal value derived from scoring the type of the household’s
residential structure with respect to materials used for roof, structural walls, windows, and
floor (Table 6). Observations of the residential dwellings of the sample households show that
most are predominantly made of tin/galvanized iron (GI) roofs, thatch/bamboo walls and
windows, and cement floors. Overall, about 60% of the households have very low or low
material style of life as reflected in their use of light materials such as bamboo and nipa in
their residential dwellings. It can therefore be inferred that majority of the households are
not economically well off if the basis to be used is the materials that they used for their
houses. Yet it is also noted that close to a third (27.8%) owned a land-based motor vehicle,
18.3% possessed a banca and almost half (48.7%) had a television set.

22
Table 6. Material style of life in Barangay Inagawan, Puerto Princesa City, Philippines
(n=115).
Material Style of Life No. %
Type of Roof:
Thatch/nipa
Thatch/bamboo
Tin/GI sheet
Missing
42
7
62
4
37.8
6.3
55.9
0.0
Type of outside structural walls
Thatch/nipa
Thatch/bamboo
Wood/plywood
Brick/concrete
Tiles
Missing
11
52
12
35
1
4
9.9
46.8
10.8
31.5
0.9
Windows:
Open
Thatch/bamboo
Wooden
Steel bars
Glass
Missing
11
44
28
9
18
5
10.0
40.0
25.5
8.2
16.4
Floor
Dirt
Bamboo
Cement
Wooden
Missing
9
40
55
6
5
7.8
34.8
47.8
5.2
4.3
Other Household Assets:
2/3/4-wheel Motor Vehicle
Banca
Computer
Refrigerator
Television set
32
21
5
30
56
27.8
18.3
4.3
26.1
48.7
Aggregate Ratings
4 - 8: Very low
9 - 12: Low
13 – 16: High
17 – 20: Very High
46
19
43
1
42.2
17.4
39.5
0.9
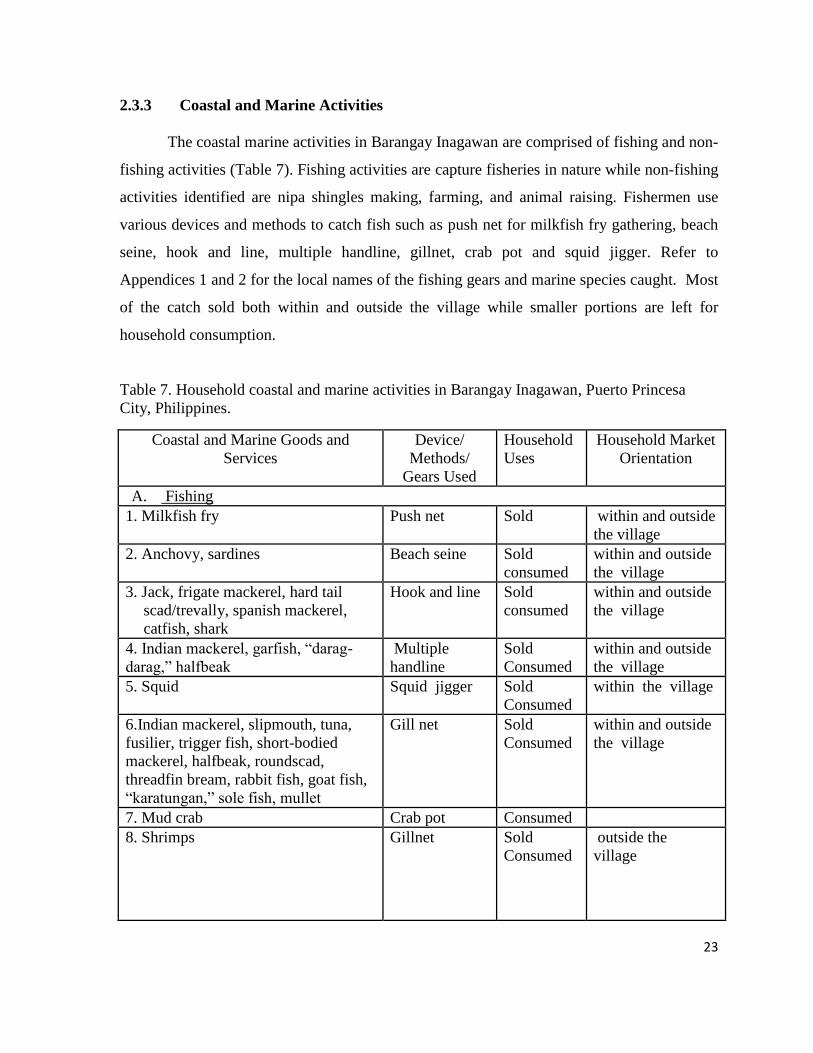
23
2.3.3 Coastal and Marine Activities
The coastal marine activities in Barangay Inagawan are comprised of fishing and non-
fishing activities (Table 7). Fishing activities are capture fisheries in nature while non-fishing
activities identified are nipa shingles making, farming, and animal raising. Fishermen use
various devices and methods to catch fish such as push net for milkfish fry gathering, beach
seine, hook and line, multiple handline, gillnet, crab pot and squid jigger. Refer to
Appendices 1 and 2 for the local names of the fishing gears and marine species caught. Most
of the catch sold both within and outside the village while smaller portions are left for
household consumption.
Table 7. Household coastal and marine activities in Barangay Inagawan, Puerto Princesa
City, Philippines.
Coastal and Marine Goods and
Services
Device/
Methods/
Gears Used
Household
Uses
Household Market
Orientation
A. Fishing
1. Milkfish fry Push net Sold within and outside
the village
2. Anchovy, sardines Beach seine Sold
consumed
within and outside
the village
3. Jack, frigate mackerel, hard tail
scad/trevally, spanish mackerel,
catfish, shark
Hook and line Sold
consumed
within and outside
the village
4. Indian mackerel, garfish, “darag-
darag,” halfbeak
Multiple
handline
Sold
Consumed
within and outside
the village
5. Squid Squid jigger Sold
Consumed within the village
6.Indian mackerel, slipmouth, tuna,
fusilier, trigger fish, short-bodied
mackerel, halfbeak, roundscad,
threadfin bream, rabbit fish, goat fish,
“karatungan,” sole fish, mullet
Gill net Sold
Consumed
within and outside
the village
7. Mud crab Crab pot Consumed
8. Shrimps Gillnet Sold
Consumed
outside the
village

24
2.3.4 Attitudes towards Indirect Values of Resources
Generally, people recognize and value the direct economic benefits derived from
the resources in their environment. However, SocMon looks at the community’s appreciation
of their coastal and other resources beyond the direct economic benefits and from an
ecosystem perspective. Hence, eight Likert-type item statements were asked pertaining to
their attitudes towards non-market and non-use values of coastal resources (Table 8 and
Table 9). Strong agreement indicates most positive attitude and is given a score of 5 while
the lowest score of 1 is given to a response of strong disagreement. The first three items
focus on the indirect non-market values of coastal resources: (1) importance of reefs as
protection against storm waves ( x = 4.7); 2) contribution of corals to fishing ( x = 4.62); and
3) protection of mangroves for fishery ( x = 4.6). The frequencies and mean ratings indicate
that people’s attitudes are generally very positive with respect to the indirect non-market
contribution of mangroves and corals to fishery. The lowest ratings were given to items
pertaining to existence non-use values such as importance of corals beyond fishing and
diving ( x = 4.2), restriction of fishing in certain coral and fish habitats ( x = 4.22), and value
of sea grass ( x =4.09). It can be inferred that people have a positive though lower
appreciation of the existence non-use values of resources but a higher appreciation of their
B. Mangrove Swamp Resources Utilization
1. Nipa leaves Bolo Sold;
House-hold
use
within and outside
the village
C. Agriculture
1. Coconuts Bolo Sold;
house-hold
use
within and outside
the village
2. Vegetable (i.e. eggplants, okra,
squash, bitter gourd, tomatoes)
knife/ picking
with hands
Sold
Consumed
within and outside
the village
C. Animal Husbandry
1. Cattle/ox Fattening Sold outside the village
2. Pig Fattening Sold outside the village
3. Chicken Growing
Sold
Consumed
within and outside
the village

25
bequest values. The mean rating scores for items on bequest values of resources are 4.69
(wanting future generations to enjoy the mangroves and coral reefs) and 4.37 (restricting
development in some coastal areas so that future generations will have natural
environments). The frequencies and means of aggregate ratings for the three types of non-
market values show that the residents have generally positive attitudes, with highest
appreciation of the resources’ indirect non-market values and lowest appreciation of their
existence non-use values (Table 10 and Table 11).
Table 8. Attitudes towards non-market and non-use values of coastal resources at Barangay
Inagawan, Puerto Princesa City, Philippines (n = 115).
Item Statement Response Options* No Res-
ponse SD D NAD A SA
Reefs are important for protecting land
from storm waves
1
(0.9)
6
(5.2)
19
(16.5)
88
(76.5)
1
(0.9)
In the long run, fishing would deteriorate if
we cleared the corals
7
(6.1)
29
(25.2)
78
(67.8)
1
(0.9)
Mangroves are to be protected so that we
will have fish to catch
1
(0.9)
7
(6.1)
29
(25.2)
77
(67.0)
1
(0.9)
Corals are only important for fishing and
diving (-)
67
(58.3)
24
(20.9)
11
(9.6)
3
(2.6)
9
(7.8)
1
(0.9)
I want future generations to enjoy the
mangroves and coral reefs
1
(0.9)
1
(0.9)
3
(2.6)
22
(19.1)
87
(75.7)
1
(0.9)
Fishing should be restricted in certain areas
to allow fish and coral to grow
7
(6.1)
3
(2.6)
12
(10.4)
28
(24.3)
64
(55.7)
1
(0.9)
We should restrict development in some
coastal areas for future generations to have
natural environments
2
(1.7)
2
(1.7)
11
(9.6)
36
(31.3)
63
(54.8)
1
(0.9)
Sea grass beds have no value to people (-) 74
(64.3)
13
(11.3)
6
(5.2)
9
(7.8)
12
(10.4)
1
(0.9)
*Statements are rated on a 5-point scale with the following options: SA – Strongly Agree; A – agree;
NAD – neither agree nor disagree; D – Disagree; and SD – Strongly Disagree.
Note: Figures enclosed in parentheses are the corresponding percentages for each response category
across an item.
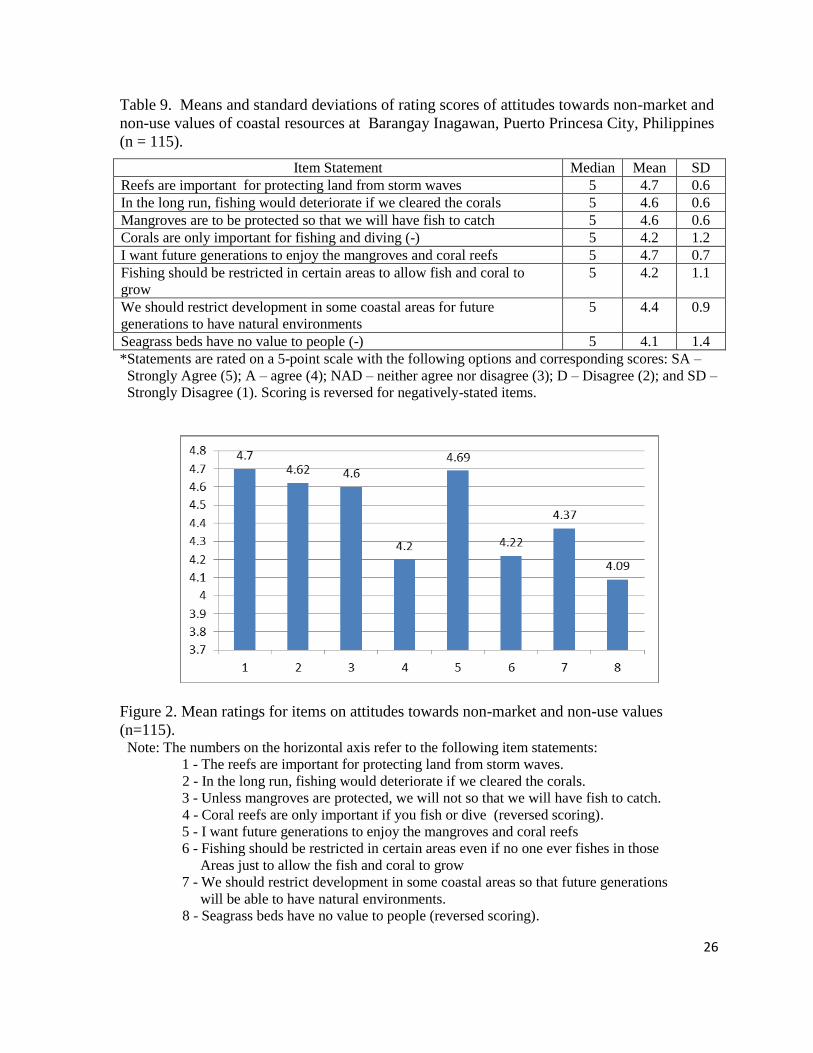
26
Table 9. Means and standard deviations of rating scores of attitudes towards non-market and
non-use values of coastal resources at Barangay Inagawan, Puerto Princesa City, Philippines
(n = 115).
Item Statement Median Mean SD
Reefs are important for protecting land from storm waves 5 4.7 0.6
In the long run, fishing would deteriorate if we cleared the corals 5 4.6 0.6
Mangroves are to be protected so that we will have fish to catch 5 4.6 0.6
Corals are only important for fishing and diving (-) 5 4.2 1.2
I want future generations to enjoy the mangroves and coral reefs 5 4.7 0.7
Fishing should be restricted in certain areas to allow fish and coral to
grow
5 4.2 1.1
We should restrict development in some coastal areas for future
generations to have natural environments
5 4.4 0.9
Seagrass beds have no value to people (-) 5 4.1 1.4
*Statements are rated on a 5-point scale with the following options and corresponding scores: SA –
Strongly Agree (5); A – agree (4); NAD – neither agree nor disagree (3); D – Disagree (2); and SD –
Strongly Disagree (1). Scoring is reversed for negatively-stated items.
Figure 2. Mean ratings for items on attitudes towards non-market and non-use values
(n=115). Note: The numbers on the horizontal axis refer to the following item statements:
1 - The reefs are important for protecting land from storm waves.
2 - In the long run, fishing would deteriorate if we cleared the corals.
3 - Unless mangroves are protected, we will not so that we will have fish to catch.
4 - Coral reefs are only important if you fish or dive (reversed scoring).
5 - I want future generations to enjoy the mangroves and coral reefs
6 - Fishing should be restricted in certain areas even if no one ever fishes in those
Areas just to allow the fish and coral to grow
7 - We should restrict development in some coastal areas so that future generations
will be able to have natural environments.
8 - Seagrass beds have no value to people (reversed scoring).

27
Table 10. Aggregate rating scores on attitudes towards non-market and non-use values of
coastal resources at Barangay Inagawan, Puerto Princesa City, Philippines, (n = 115)
Classification of attitude statements Freq %
Indirect non-market value
1.00 – 1.50 : Very negative
1.51 – 2.50 : Negative
2.51 – 3.50 : Neither positive nor negative
3.51 – 4.50 : Positive
4.51 – 5.00 : Very positive
No response
0
0
0
32
82
1
0.0
0.0
0.0
23.7
71.3
0.9
Existence non-use value
1.00 – 1.50 : Very negative
1.51 – 2.50 : Negative
2.51 – 3.50 : Neither positive nor negative
3.51 – 4.50 : Positive
4.51 – 5.00 : Very positive
No response
0
10
10
44
50
1
0.0
8.7
8.7
38.2
43.5
0.9
bequest non-use value
1.00 – 1.50 : Very negative
1.51 – 2.50 : Negative
2.51 – 3.50 : Neither positive nor negative
3.51 – 4.50 : Positive
4.51 – 5.00 : Very positive
No response
0
2
9
45
58
1
0.0
1.7
7.9
39.1
50.4
0.9
Mean rating for attitudes towards non-market and non-use
values of coastal resources
1.00 – 1.50 : Very negative
1.51 – 2.50 : Negative
2.51 – 3.50 : Neither positive nor negative
3.51 – 4.50 : Positive
4.51 – 5.00 : Very positive
No response
0
0
5
60
49
1
0.0
0.0
4.3
52.1
42.6
0.9
Table 11. Means and standard deviations of aggregate rating scores on attitudes towards non-
market and non-use values of coastal resources at Barangay Inagawan, Puerto Princesa City,
Philippines (n = 115).
Value Classification Median Mean Std Dev
Indirect non-market value 5.0 4.6 0.5
Existence non-use value 4.3 4.2 0.8
Bequest value 5.0 4.5 0.6
Over-all attitude towards non-market and non-use values
of resources
4.5 4.4 0.5

28
2.3.5 Perceived Resource Conditions
On a scale of 1 to 5 with 1 as “very bad” and 5 as “very good”, community residents
who felt that they had enough knowledge about their resources mostly gave ratings of 4 and 5
indicating that such were in good to very good conditions (Table 12). There were a number
of residents who did not rate a specific resource and instead answered “don’t know” or “not
applicable”; these were usually non-users of the specific resource or individuals whose
residences were geographically far from the specific resource’s location. Hence, they
considered themselves without enough knowledge about the condition of the resource
mentioned.
For those who responded, 21.8% perceived their terrestrial forest to be in very bad to
neither good nor bad condition thus resulting to the lowest mean rating of 3.22 which fell
into the “neither good nor bad” category. Residents generally perceive their fresh water
resources (ground water and springs) to be in very good condition as indicated by the highest
mean ratings of 4.7 and 4.6, respectively. The computed net ratings in the last column of
Table 12 provides the percentage of individuals who perceive the said resource condition to
be good/very good rather than bad/very bad. Hence, the large positive net ratings reflected in
Table 12 attest that more residents perceive their resources to be good compared to those
who found them bad. The lowest net rating is for upland forest, there is only 22.1% more
residents who perceived their upland forest to be good than those who found them bad. This
is also echoed by the mean rating of perceived upland forest condition which is lowest at 3.2
(Table 13). Residents’ perceptions of upland forest condition is also most varied (SD = 1.3)
compared to the other resources. With the exception of upland forests, all other resources had
mean ratings of at least 4.0. Among coastal resources, the highest mean ratings were
computed for beach (x = 4.42) compared to that of mangroves ( x = 3.9), seagrass ( x =
4.30), and coral reefs ( x = 4.11).

29
Table 12. Perceptions of resource conditions at Barangay Inagawan, Puerto Princesa City,
Philippines (n = 115).
Resource Perceived Resource Condition* Don’t
know
Not
Apply
Net
Rating** VB B NGB G VG
Mangroves 3
(2.6)
4
(3.5)
12
(10.4)
33
(28.7)
28
( 24.3)
21
(18.3)
14
(12.2)
67.5%
Coral reefs 4
(3.5)
18
(15.7)
25
(21.7)
35
(30.4)
26
(22.6)
7
(6.1)
68.2%
Upland
forests
7
(6.1)
10
(8.7)
8
(7.0)
22
(19.1)
7
(6.1)
11
(9.6)
50
(43.5)
22.1%
Seagrass 1
(0.9)
12
(10.4)
31
(27.0)
40
(34.8)
19
(16.5)
12
(10.4)
83.3%
Beach 1
(0.9)
3
(2.6)
6
(5.2)
35
(30.4)
59
(51.3)
5
(4.3)
6
(5.2)
86.5%
Spring 1
(0.9)
18
(15.7)
34
(29.6)
10
(8.7)
52
(45.2)
96.1%
River/
Creeks
1
(0.9)
1
(0.9)
6
(5.2)
32
(27.8)
38
(33.0)
5
(4.3)
32
(27.8)
87.0 %
Ground
water
2
(1.7)
20
(17.4)
70
(60.9)
1
(0.9)
22
(19.1)
95.8%
*Each community resource is rated on a 5-point scale with the following options and
corresponding scores: VG – Very good (5);G – good (4); NGB - neither good nor bad (3);
B – bad (2); and VB – very bad (1).
**Net Rating = % freq [(VG + G)] – % freq [(VB + B)]
Table 13. Means and standard deviations of ratings on perceived resource conditions at
Barangay Inagawan, Puerto Princesa City, Philippines (n = 115).
Resource Valid
Responses
Median Mean Std
Dev
Mangroves 80 4 4.0 1.0
Coral reefs 82 4 4.1 0.9
Upland forests 54 4 3.2 1.3
Seagrass 84 4 4.3 0.8
Beach 104 5 4.4 0.8
Spring 53 5 4.6 0.7
River/creeks 78 4 4.4 0.8
Ground water 92 5 4.7 0.7
*Each community resource is rated on a 5-point scale with the following
options and corresponding scores: VG – Very good (5);G – good (4); NGB
– neither good nor bad (3); B – bad (2); and VB – very bad (1).

30
Legend: 1- Mangroves; 2- Coral reefs; 3 - Upland forests; 4 - Seagrass; 5 - Beach;
6 - Spring; 7 - River/creeks; 8 - Ground water
Figure 3. Mean ratings of perceived resource conditions at Barangay Inagawan, Puerto
Princesa City, Philippines (n = 115).
2.3.6 Perceived Threats to Resources
Since community residents are usually the direct users of the resources, they are
presumed to be knowledgeable not only on the conditions of their resources but also on their
associated threats. Hence, an open ended-question soliciting the threats to each of the
community resource, as perceived by them, was asked. Similar to the question on perception
of resource conditions, there were respondents who either answered “don’t know” or “not
applicable”, which again indicated a lack of knowledge about the specific resource (Table
14). These were mostly non-users or residents who live far from the resource. It is also
noticeable that a sizeable number of residents answered “none” when they were asked of the
threats to the natural resources in their community, ranging from 25.2% (for upland forests)
to 61.7% (for groundwater). The preponderance of this response could be interpreted in two
ways: (1) the resource may be well protected such that its threats have been eliminated, or (2)
residents may believe in the infiniteness of the resource and that there can never be any threat
to its existence.
No options were given to the respondents when each was asked of what he/she
perceived to be a threat to a given resource, in order to solicit and determine the range of
perceived threats, whether valid or not. This was also done to avoid getting a response set,
3.99 4.11
3.22
4.3 4.42 4.58 4.35
4.7
0
0.5
1
1.5
2
2.5
3
3.5
4
4.5
5
1 2 3 4 5 6 7 8

31
the tendency of a respondent to agree that something is a threat because it was mentioned by
the enumerator. The enumeration of all perceived threats cited by the community residents
for each resource is provided in Table 14 to Table 21. These tables provide a comprehensive
listing of at most three perceived threats for each resource with its classification as primary,
secondary, or tertiary. If any threat is cited as any 2 or 3 of the three levels of threats, the
frequencies as a primary, secondary, or tertiary threat are combined with the highest
frequencies ranked, to get, at most, five top threats.
Palawan was declared as a mangrove swamp and forest reserve in 1981. Yet a
number of community residents still consider cutting mangrove trees for household or
commercial use as a major threat, along with clearing and charcoal making (Table 14). One
possible explanation is that though these activities are illegal, they may have been undertaken
in the community on a sporadic or small-scale basis. Therefore, they still pose a threat to the
mangrove resources. Apparently, mangroves are used by residents in their household
principally as housing material and as fuel, either as firewood or charcoal.
Table 14. Perceived threats to mangroves Barangay Inagawan, Puerto Princesa City,
Philippines (n = 115).
Perceived Threat Primary Second Tertiary Combined Rank
None 34
(29.6)
97
(84.3)
98
(85.2)
Cutting for household use 29
(25.2)
1
(0.9)
2
(1.7)
32
(27.8)
1
Cutting for commercial use 10
(8.7)
4
(3.5)
14
(12.2)
2
Clearing 12
(10.4)
1
(0.9)
13
(11.3)
3
Charcoal making 7
(6.1)
5
(4.3)
1
(0.9)
13
(11.3)
4
Conversion into fish pond 1
(0.9)
1
(0.9)
2
(1.8)
5
Natural phenomenon (typhoons, big waves) 1
(0.9)
1
(0.9)
6
Disease/infestation of mangroves 1
(0.9)
1
(0.9)
6
Not applicable 6
(5.2)
4
(3.5)
4
(3.5)
Don't know 15
(13.0)
1
(0.9)
7
(6.1)
Note: Figures enclosed in parentheses are the corresponding percentages for each category
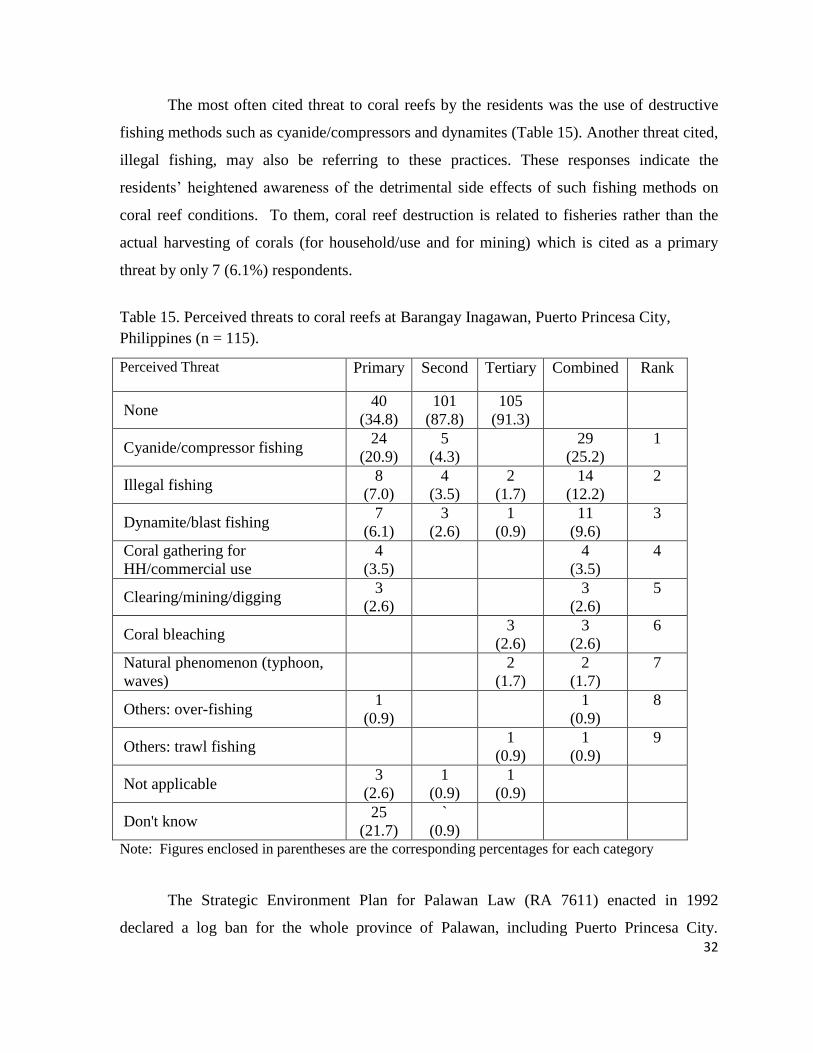
32
The most often cited threat to coral reefs by the residents was the use of destructive
fishing methods such as cyanide/compressors and dynamites (Table 15). Another threat cited,
illegal fishing, may also be referring to these practices. These responses indicate the
residents’ heightened awareness of the detrimental side effects of such fishing methods on
coral reef conditions. To them, coral reef destruction is related to fisheries rather than the
actual harvesting of corals (for household/use and for mining) which is cited as a primary
threat by only 7 (6.1%) respondents.
Table 15. Perceived threats to coral reefs at Barangay Inagawan, Puerto Princesa City,
Philippines (n = 115).
Perceived Threat Primary Second Tertiary Combined Rank
None 40
(34.8)
101
(87.8)
105
(91.3)
Cyanide/compressor fishing 24
(20.9)
5
(4.3)
29
(25.2)
1
Illegal fishing 8
(7.0)
4
(3.5)
2
(1.7)
14
(12.2)
2
Dynamite/blast fishing 7
(6.1)
3
(2.6)
1
(0.9)
11
(9.6)
3
Coral gathering for
HH/commercial use
4
(3.5)
4
(3.5)
4
Clearing/mining/digging 3
(2.6)
3
(2.6)
5
Coral bleaching 3
(2.6)
3
(2.6)
6
Natural phenomenon (typhoon,
waves)
2
(1.7)
2
(1.7)
7
Others: over-fishing 1
(0.9)
1
(0.9)
8
Others: trawl fishing 1
(0.9)
1
(0.9)
9
Not applicable 3
(2.6)
1
(0.9)
1
(0.9)
Don't know 25
(21.7)
`
(0.9)
Note: Figures enclosed in parentheses are the corresponding percentages for each category
The Strategic Environment Plan for Palawan Law (RA 7611) enacted in 1992
declared a log ban for the whole province of Palawan, including Puerto Princesa City.

33
Though the local and national government agencies work together to implement this
provision of the law, it appears that at the community level, residents still perceive that
upland forests are threatened the most by the demand for wood, either for household or
commercial use, which fuels the cutting of trees and/or illegal logging (Table 16). Similar to
mangroves, the household need for charcoal was also seen as a threat to upland forests.
Table 16. Perceived threats to upland forests Barangay Inagawan, Puerto Princesa City,
Philippines (n = 115).
Perceived Threat Primary Second Tertiary Combined Rank
None 29
(25.2)
90
(78.3)
101
(87.8)
Charcoal making 10
(8.7)
9
(7.8)
3
(2.6)
22
(19.1)
1
Cutting trees for household use 16
(13.9)
2
(1.7)
18
(15.6)
2
Illegal logging 10
(8.7)
2
(1.7)
1
(0.9)
13
(11.3)
3
Cutting trees for commercial use 6
(5.2)
2
(1.7)
8
(6.9)
4
Conversion into residential
settlements
5
(4.3)
2
(1.7)
7
(6.0)
5
Slash and burn farming
(swidden agriculture)
2
(1.7)
3
(2.6)
1
(0.9)
6
(5.2)
6
Natural phenomenon (typhoons) 1
(0.9)
1
(0.9)
8
Others: quarrying 2
(1.7)
2
(1.7)
7
Not applicable 31
(27.0)
5
(4.3
5
(4.3)
Don’t know 4
(3.5)
1
(0.9)
1
(0.9)
Note: Figures enclosed in parentheses are the corresponding percentages for each category.
It has been noted earlier that community residents have the least appreciation for the
indirect and non-use values of seagrass (refer to Table 8 and Table 9) in comparison with
other coastal resources. Hence, it is not surprising that 48.7% thought that there were no
threats to seagrass and another 29.6% did not know any possible threat to seagrass (Table
17). They may not have been paying any attention to this resource, thinking that sea grasses
do not have economic value or a key role in the coastal ecosystem. Perceived threats by the

34
few (20 or 17.4%) who responded to this question are clearing/mining/digging, gathering for
household use, and fishing using dragnets/gleaning.
Table 17. Perceived threats to seagrass Barangays Inagawan, Puerto Princesa City,
Philippines (n = 115).
Perceived Threat Primary Second Tertiary Combined Rank
None 56
(48.7)
100
(87.0)
101
(87.8)
Clearing/mining/digging 7
(6.1)
1
(0.9)
8
(7.0)
1
Gathering for household use 3
(2.6)
4
(3.5)
1
(0.9)
8
(7.0)
2
Illegal fishing activities 2
(1.7)
2
(1.7)
2
(1.7)
6
(5.1)
3
Fishing using dragnets/gleaning 3
(2.6)
1
(0.9)
1
(0.9)
5
(4.4)
4
Pollution/dumping of garbage 3
(2.6)
3
(2.6)
5
Dynamite/blast fishing 2
(1.7)
1
(0.9)
3
(2.6)
6
Natural phenomenon (typhoon,
waves)
1
(0.9)
2
(1.7)
3
(2.6)
7
Disease 1
(0.9)
1
(0.9)
8
Not applicable 5
(4.3)
1
(0.9)
1
(0.9)
Don't know 34
(29.6)
5
(4.3)
4
(3.5)
Note: Figures enclosed in parentheses are the corresponding percentages for each category
Similar to the views on seagrass, 43.5% of the residents did not perceive any present
threat to their beach (Table 18). This could mean two things: the beach may have been well
protected that its threats have been eliminated, or the residents may believe that the beach is
infallible and cannot be subjected to any threat. Yet the answers given by the 20 (17.4%)
who did respond suggest the possibility that there might have been sand quarrying for
commercial/household use, past or present. Since the beach is near residential settlements,
another threat cited is pollution/garbage dumping, indicating that waste management is still
an issue in the community.

35
Table 18. Perceived Threats to Beach at Barangay Inagawan, Puerto Princesa City,
Philippines (n = 115).
Perceived Threat Primary Second Tertiary Combined Rank
None 50
(43.5)
100
(87.0)
104
(90.4)
Sand quarrying for commercial use 13
(11.3)
1
(0.9)
14
(12.2)
1
Pollution/dumping of garbage 11
(9.6)
1
(0.9)
12
(10.5)
2
Natural phenomenon (typhoons, big
waves)
11
(9.6)
11
(9.6)
3
Sand quarrying for household use 7
(6.1)
1
(0.9)
8
(7.0)
4
Pebble/stone gathering for
commercial use
3
(2.6)
2
(1.7)
5
(4.3)
5
Pebble/stone gathering for
household use
1
(0.9)
3
(2.6)
4
(3.5)
6
Soil erosion from the uplands 1
(0.9)
1
(0.9)
1
(0.9)
3
(2.7)
9
Residential area expansion 2
(1.7)
3
(2.6)
5
(4.3)
7
Beach erosion/sea level rise 1
(0.9)
4
(3.5)
5
(4.4)
8
Tourist-related & resort
development
1
(0.9)
1
(0.9)
2
(1.8)
Not applicable 4
(3.5)
1
(0.9)
1
(0.9)
Don't know 10
(8.7)
2
(1.7)
2
(1.7)
Note: Figures enclosed in parentheses are the corresponding percentages for each category
Majority (58.3%) of the respondents did not cite any perceived threat to their spring
but those who did had varied answers, with water contamination having the most frequency
(8 or 7.0%), which raises the possibility of some pollution and sanitation issues in the nearby
areas of the spring (Table 19). Similar to springs, the residents’ top perceived threats to
rivers/creeks is pollution/dumping of garbage, which is again a sanitation issue (Table 20).
The second ranking threat is natural phenomena, referring to heavy rains brought by
typhoons and to seasonal changes when there is reduced flow of water during the summer
season. Other cited threats are river bed resource extraction, sand and pebble quarrying, both
for commercial and household uses, and soil erosion from the uplands.

36
Table 19. Perceived threats to springs Barangay Inagawan, Puerto Princesa City, Philippines
(n = 115).
Perceived Threat Primary Second Tertiary Combined Rank
None 67
(58.3)
96
(83.5)
102
(88.7)
Sand quarrying for commercial
use
1
(0.9)
4
(3.5)
5
(4.4)
2
Pollution/dumping of garbage 2
(1.7)
2
(1.7)
5
Water contamination 8
(7.0)
1
(0.9)
9
(7.9)
1
Sedimentation 1
(0.9)
3
(2.6)
4
(3.5)
3
Deforestation/cutting of trees in
watershed
1
(0.9)
1
(0.9)
2
(1.8)
5
Salt intrusion 1
(0.9)
1
(0.9)
6
Soil erosion from the uplands 1
(0.9)
2
(1.7)
3
(2.6)
4
Not applicable 28
(24.3)
2
(1.7)
2
(1.7)
Don't know 7
(6.1)
4
(3.5)
4
(3.5)
Note: Figures enclosed in parentheses are the corresponding percentages for each category

37
Table 20. Perceived threats to rivers/creeks Barangay Inagawan, Puerto Princesa City,
Philippines (n = 115).
Perceived Threat 1st 2
nd 3
rd Combined Rank
None 55
(47.8)
98
(85.2)
104
(90.4)
Pollution/dumping of garbage 10
(8.7)
2
(1.7)
12
(10.4)
1
Natural phenomenon (typhoons, big
waves)
8
(7.0)
1
(0.9)
1
(0.9)
10
(8.8)
2
Sand quarrying for commercial use 5
(4.3)
4
(3.5)
9
(7.8)
3.5
Soil erosion from the uplands 5
(4.3)
1
(0.9)
3
(2.6)
9
(7.8)
3.5
Sand quarrying for household use 3
(2.6)
1
(0.9)
4
(3.5)
5.5
Pebble/stone gathering for
commercial use
3
(2.6)
1
(0.9)
4
(3.5)
5.5
Pebble/stone gathering for
household use
1
(0.9)
1
(0.9)
2
(1.8)
6
Sedimentation 1
(0.9)
1
(0.9)
8.5
Tourist- & resort-related
development
2
(1.7)
2
(1.7)
7
Others: deforestation 1
(0.9)
1
(0.9)
8.5
Not applicable 13
(11.3)
1
(0.9)
1
(0.9)
Don't know 10
(8.7)
4
(3.5)
4
(3.5)
Note: Figures enclosed in parentheses are the corresponding percentages for each category
Another related resource to springs and river/creeks is groundwater. Only 20% of the
residents cited a threat to their ground water with the most often cited threat being natural
phenomenon, which might be referring to seasonal changes wherein there is less ground
water to tap during the summer/dry season compared to the rainy season. A few (4 or 3.5%)
showed a deeper understanding, citing deforestation/cutting of trees in the watershed as a
primary threat. The respondents knew that their watershed has to be kept intact to protect
their aquifer.

38
Table 21. Perceived Threats to Ground Water Barangay Inagawan, Puerto Princesa City,
Philippines (n = 115).
Perceived Threat Primary Second Tertiary Combined Rank
None 71
(61.7)
103
(89.6)
104
(90.4)
Natural phenomenon (typhoons) 13
(11.3)
1
(0.9)
1
(0.9)
15
(13.1)
1
Deforestation/cutting of trees in
watershed
4
(3.5)
1
(0.9)
5
(4.4)
2
Pollution/dumping of garbage
3
(2.6)
1
(0.9)
1
(0.9)
5
(4.4)
3
Tourist- & resort-related
development
1
(0.9)
1
(0.9)
4
Water contamination due to sewage 2
(1.7)
2
(1.7)
5
Over-exploitation for household use 1
(0.9)
1
(0.9)
2
(1.8)
6
Not applicable 7
(6.1)
1
(0.9)
1
(0.9)
Don't know 14
(12.2)
5
(4.3)
5
(4.3)
Note: Figures enclosed in parentheses are the corresponding percentages for each category.
Table 22 and Table 23 below provide a summary of this section by listing in ranked
order the most often cited threats for each resource. Some threats were common to two or
more resources, affirming that collectively, resources are interconnected and two or more
resources may be facing the same threat/s. All threats for both mangroves and upland forests
relate to cutting of trees for timber (household/commercial use) and charcoal making. Coral
reefs are endangered by the use of destructive fishing methods such as cyanide, dynamites,
and compressor. Clearing seagrass compromises its regeneration but it can also be damaged
by illegal fishing activities and dragnets/gleaning. Sand quarrying is also a common threat to
beaches, springs and rivers/creeks while sanitation issues, such as water contamination and
dumping of garbage, are concerns for springs and rivers/creeks.

39
Table 22. Top perceived threats to coastal resources at Barangay Inagawan, Puerto Princesa
City, Philippines (n = 115).
Mangroves Coral Reefs Seagrass Beach
None - 29.6% None - 34.8% None - 48.7% None - 43.5%
Don’t know /Not
applicable – 18.2%
Don’t know / Not
applicable – 24.3%
Don’t know / Not
applicable – 33.9%
Don’t know / Not
applicable – 12.2%
Cutting for household
use
Cyanide/compressor
fishing
Clearing/mining/
digging
Sand quarrying for
commercial/household
use
Cutting for
commercial use Illegal fishing
Gathering for
household use
Pollution/dumping of
garbage
Clearing Dynamite/
blast fishing
Dynamite/illegal
fishing activities
Natural phenomenon
(typhoons, big waves)
Charcoal making Fishing using
dragnets/gleaning
Table 23. Top perceived threats to non-coastal resources at Barangay Inagawan, Puerto
Princesa City, Philippines (n = 115).
Upland Forests Springs Rivers/Creeks Ground Water
None - 25.2% None - 58.3% None - 47.8% None - 61.7%
Don’t know - 30.5% Don’t know - 30.4% Don’t know / Not
applicable - 20.0%
Don’t know / Not
applicable - 18.3
Charcoal making Water contamination Pollution/dumping of
garbage
Natural phenomenon
(typhoons)
Cutting trees for
household
/commercial use
Sand quarrying Natural phenomenon
(typhoons, big waves)
Deforestation/cutting
of trees in watershed
Illegal logging Sedimentation Sand quarrying for
commercial use
Pollution/dumping of
garbage
Cutting trees for
commercial use
Soil erosion from the
uplands
Tourist- & resort-
related development
2.3.7 Awareness of Rules and Regulations on Resource Use
Residents are aware of rules and regulations on fishing (82.6%), mangroves (77.4%),
pebble gathering (27.8%), and residential development (21.7%) (Table 24). Very few
respondents expressed awareness of rules and regulations on other forms of resource
use/activity such as water sports and tourist transportation, suggesting that these are not
concerns that impinge on their daily economic or social lives as evidenced by the large
frequencies of “don’t know” and “not applicable” responses. It appears that the fishing and

40
mangrove rules that the residents are aware of originated primarily from the City
Government of Puerto Princesa and to a lesser extent, the Barangay Council of Inagawan as
attributed by the residents themselves. There were very few who said that the resource rules
and regulations they were aware of were enacted at the provincial or national levels.
Table 24. Awareness of resource rules and regulations in Barangay Inagawan, Puerto
Princesa City, Philippines (n = 115).
Resource Used/ Activity Awareness of Rules &
Regulations
Origin of Regulation
None Yes Don’t
Know
Not
Apply
Brgy Mun/
City
Prov Natl
Fishing 6
(5.2)
95
(82.6)
11
(9.6)
3
(2.6)
31
(27.0)
50
(43.5)
2
(1.7)
12
(10.4)
Mangroves 6
(5.2)
89
(77.4)
9
(7.8)
11
(9.6)
25
(21.7)
51
(44.3)
2
(1.7)
10
(8.7)
Aquaculture 17
(14.8)
21
(18.3)
22
(19.1)
55
(47.8)
10
(8.7)
10
(8.7)
1
(0.9)
Resort/pension/hotel
development
17
(14.8)
11
(9.6)
21
(18.3)
66
(57.4)
5
(4.3)
5
(4.3)
1
(0.9)
1
(0.9)
Residential development 19
(16.5)
25
(21.7)
33
(28.7)
37
(32.2)
11
(9.6)
13
(11.3)
1
(0.9)
Watersports 23
(20.0)
7
(6.1)
19
(16.5)
65
(56.5)
2
(1.7)
3
(2.6)
1
(0.9)
2
(1.7)
Recreational climb/trek/camp 21
(18.3)
8
(7.0)
23
(20.0)
62
(53.9)
4
(3.5)
3
(2.6)
2
(1.7)
Pebble gathering 22
(19.1)
32
(27.8)
32
(27.8)
32
(27.8)
15
(13.0)
13
(11.3)
3
(2.6)
1
(0.9)
Tourist transportation 22
(19.1)
10
(8.7)
25
(21.7)
57
(49.6)
6
(5.2)
4
(3.5)
1
(0.9)
Marine transportation 26
(22.8)
17
(14.8)
25
(21.7)
45
(39.1)
13
(11.3)
4
(3.5)
1
(0.9)
1
(0.9)
Note: Figures enclosed in parentheses are the corresponding percentages for each category.
This finding is further supported by the results in the focus group discussion (FGD)
wherein the community identified some rules and regulations that pertain to the use of marine
and coastal resources. These rules are mostly city regulations on illegal fishing, building
constructions and sand quarrying. The FGD participants were unaware of any rules and
regulations on other resource use or activities.

41
2.3.8 Participation in Decision Making
Because coastal management is usually a community effort entailing high
engagement among residents, they were asked to rate their current and desired levels of
participation in decision making on each resource activity. A 5-point scale was used with “no
participation” scored as 1 and “full participation” scored as 5. The earlier observed trend that
people are only concerned with resources that they use or those that affect their daily lives is
again confirmed as shown in the more than 50% frequencies of “not applicable” in all items.
Exceptions are those items related to fishing, mangroves, residential development, and
pebble gathering. It can thus be noted that residents were consistent in their responses along
this area.
The current levels of participation in decision making for these four
resources/activities are quite low as can be seen in the bulk of “no participation” response
though there were a few who indicated active to full participation (Table 25). The highest
mean rating is only 1.6 for fishing and 1.2 for mangroves, which is indicative of very
minimal participation with only very few rating themselves on the higher levels (Table 26).
These results may be cultural to Filipinos since decision-making is traditionally left to the
leaders. They are often regarded to be vested with the responsibility and authority by virtue
of their positions, indicating that community members may not have been empowered
enough for them to take it upon themselves to actively participate in decision making.

42
Table 25. Current and desired levels of participation in decision making in Barangay
Inagawan, Puerto Princesa City, Philippines (n = 115).
Activity Rating Scores* Not
apply 1 2 3 4 5
Fishing Current 67
(58.3)
6
(5.2)
11
(9.6)
5
(4.3)
9
(7.8)
13
(11.3)
Desired 43
(37.4)
5
(4.3)
14
(12.2)
19
(16.5)
17
(14.8)
13
(11.3)
Mangroves Current 66
(57.4)
4
(3.5)
7
(6.1)
5
(4.3)
4
(3.5)
24
(20.9)
Desired 46
(40.0)
5
(4.3)
9
(7.8)
14
(12.2)
12
(10.4)
25
(21.7)
Aquaculture Current 40
(34.8)
2
(1.7)
3
(2.6)
1
(0.9)
2
(1.7)
63
(54.8)
Desired 24
(20.9)
5
(4.3)
3
(2.6)
8
(7.0)
8
(7.0)
63
(54.8)
Resort/pension/
hotel
development
Current 40
(34.8)
2
(1.7)
3
(2.6)
1
(0.9)
65
(56.5)
Desired 25
(21.7)
4
(3.5)
4
(3.5)
7
(6.1)
6
(5.2)
65
(56.5)
Residential
development
Current 45
(39.1)
4
(3.5)
5
(4.3)
1
(0.9)
1
(0.9)
55
(47.8)
Desired 27
(23.5)
3
(2.6)
7
(6.1)
10
(8.7)
9
(7.8)
55
(47.8)
Watersports Current 36
(31.1)
1
(0.9)
4
(3.5)
1
(0.9)
69
(60.0)
Desired 22
(19.1)
1
(0.9)
6
(5.2)
7
(6.1)
6
(5.2)
69
(60.0)
Recreational
climb/trek/camp
Current 38
(33.0)
1
(0.9)
4
(3.5)
68
(59.1)
Desired 22
(19.1)
3
(2.6)
5
(4.3)
6
(5.2)
6
(5.2)
68
(59.1)
Pebble gathering Current 57
(49.6)
4
(3..5)
3
(2.6)
3
(2.6)
2
(1.7)
41
(35.7)
Desired 42
(36.5)
3
(2.6)
6
(5.2)
9
(7.8)
9
(7.8)
42
(36.5)
Tourist
transportation
Current 39
(33.9)
3
(2.6)
1
(0.9)
2
(1.7)
66
(57.4)
Desired 26
(22.6)
3
(2.6)
4
(3.5)
6
(5.2)
6
(5.2)
66
(57.4)
Marine
transportation
Current 40
(34.8)
3
(2.6)
3
(2.6)
4
(3.5)
2
(1.7)
59
(51.3)
Desired 26
(22.6)
3
(2.6)
6
(5.2)
8
(7.0)
9
(7.8)
59
(51.3)
Note: Rating is on a scale of 1 – 5, with 1- no participation, and 5 - full participation

43
Table 26. Means and standard deviations of ratings of participation in decision making
Barangay Inagawan, Puerto Princesa City, Philippines (n = 115).
Resource Used/ Activity Current Level of
Participation
Desired Level of
Participation
Mean Std Dev Mean Std Dev
Fishing 1.6 1.4 2.3 1.7
Mangroves 1.2 1.2 1.8 1.7
Aquaculture 0.6 1.0 1.0 1.6
Resort/pension/hotel development 0.5 0.8 0.9 1.5
Residential development 0.7 0.9 1.2 1.7
Watersports 0.6 0.8 0.9 1.6
Recreational climb/trek/camp 0.5 0.7 0.9 1.5
Pebble gathering 0.9 1.0 1.3 1.6
Tourist transportation 0.5 0.8 0.9 1.5
Marine transportation 0.7 1.1 1.1 1.7
Yet the residents’ responses as to their desired levels of participation also reflect a
beginning shift from a passive to a more active involvement in decision making. It is
remarkable that there are more ratings of 4/5 and fewer ratings of 1/2, suggesting a greater
desire to participate among residents (Table 25 and Table 26). This is also mirrored in the
higher mean ratings for desired level, particularly for fishing and mangrove management. A
one-to-one correspondence of residents’ current and desired levels of participation also
shows that their desired levels are always higher than their current levels, and these
differences between current and desired levels of participation are all statistically significant
(Table 27). It is further noted that the paired correlations between residents’ current and
desired levels are all positive and highly significant, indicating that those who have low
current levels of participation tend to also have low desired levels and vice versa. Even
though there is a window of opportunity for village leaders to tap and seek greater
involvement from community members who have generally expressed a greater desire to be
more active in present and future decision making endeavors, greater effort needs to be
exerted in order to encourage and make those who did not participate previously become
actively involved in decision making.
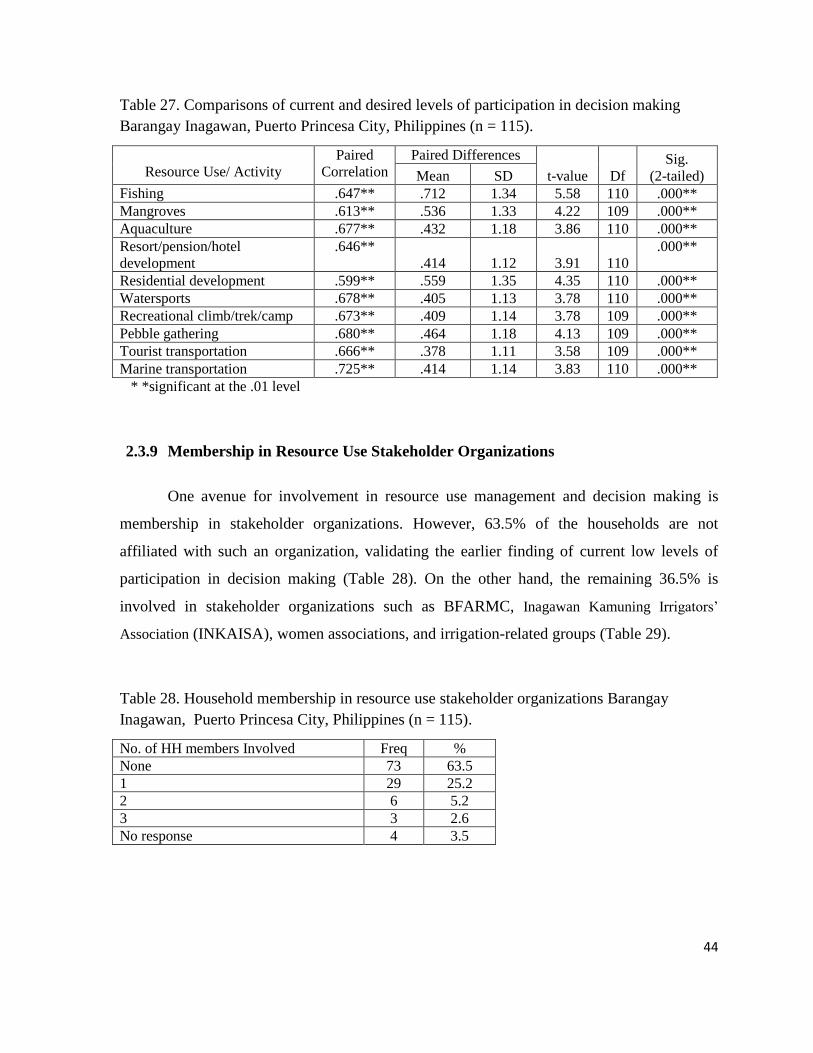
44
Table 27. Comparisons of current and desired levels of participation in decision making
Barangay Inagawan, Puerto Princesa City, Philippines (n = 115).
Resource Use/ Activity
Paired
Correlation
Paired Differences
t-value Df
Sig.
(2-tailed) Mean SD
Fishing .647** .712 1.34 5.58 110 .000**
Mangroves .613** .536 1.33 4.22 109 .000**
Aquaculture .677** .432 1.18 3.86 110 .000**
Resort/pension/hotel
development
.646**
.414 1.12 3.91 110
.000**
Residential development .599** .559 1.35 4.35 110 .000**
Watersports .678** .405 1.13 3.78 110 .000**
Recreational climb/trek/camp .673** .409 1.14 3.78 109 .000**
Pebble gathering .680** .464 1.18 4.13 109 .000**
Tourist transportation .666** .378 1.11 3.58 109 .000**
Marine transportation .725** .414 1.14 3.83 110 .000**
* *significant at the .01 level
2.3.9 Membership in Resource Use Stakeholder Organizations
One avenue for involvement in resource use management and decision making is
membership in stakeholder organizations. However, 63.5% of the households are not
affiliated with such an organization, validating the earlier finding of current low levels of
participation in decision making (Table 28). On the other hand, the remaining 36.5% is
involved in stakeholder organizations such as BFARMC, Inagawan Kamuning Irrigators’
Association (INKAISA), women associations, and irrigation-related groups (Table 29).
Table 28. Household membership in resource use stakeholder organizations Barangay
Inagawan, Puerto Princesa City, Philippines (n = 115).
No. of HH members Involved Freq %
None 73 63.5
1 29 25.2
2 6 5.2
3 3 2.6
No response 4 3.5

45
Table 29. Types of resource use stakeholder organizations and membership in Barangay
Inagawan, Puerto Princesa City, Philippines (n = 115).
Resource use stakeholder organization No. %
None 73 63.5
BFARMC 15 13.1
Women’s associations 7 6.2
Inagawan Kamuning Irrigators’ Association 5 4.3
Agriculture-related 6 5.4
Others 9 8.1
2.3.10 Perceptions on Coastal Management Problems and Solutions
About 6 out of 10 household informants were not able to give any coastal
management problem, either because they are not knowledgeable enough or do not perceive
any problem related to the resource. The coastal management problems most often cited by
the rest who gave at least one answer (a maximum of two problems were solicited) were
those related to the use of illegal fishing methods such as cyanide, dynamite, compressor,
fine mesh net (bayakos); overexploitation of coastal resources; competition or conflict in
resources, and sanitation. Specific problems under each of these categories are enumerated
in Table 30.
These specific concerns were also corroborated by the FGD results with participants
saying that there are existing coastal management problems in the community. They
enumerated problems related to illegal fishing such as the use of prohibited gear types by
some fishermen. It can thus be inferred that though there are collaborative efforts from the
different government agencies to stop destructive fishing methods through regulation and
enforcement, such efforts are still inadequate and so the prohibited practices continue.
Improper waste management was also mentioned because of the non-observance of
RA 9003 (Solid Waste Management Act of 2003) by some community members. Another
concern brought up was resource use conflict, which was identified because of the
restrictions given by private land owners to the public to access the coastal areas adjacent to
their lands. In addition to this, several FGD participants also cited resource use competition,
alleging that fishers from the neighboring municipality of Aborlan use the fishing grounds of

46
their community. Finally, lack of logistical and budgetary support to coastal resource
management monitoring was mentioned as a management problem.
Table 30. Perceived coastal management problems Barangay Inagawan, Puerto Princesa
City, Philippines (n = 115).
Coastal Management Problems Problem 1 Problem 2 Combined
No. % No. % No. %
Livelihood 2 1.7 1 0.9 3 2.6
Mangrove cutting 2 1.7 1 0.9 3 2.6
Natural calamities 2 1.7 2 1.7
Over-exploitation of coastal resource for
HH/commercial use/decrease in fish catch
12 10.4 12 10.4
Sanitation (Pollution and garbage dumping; waste
management)
5 4.3 1 0.9 6 5.2
Illegal fishing methods: dynamite, cyanide,
compressor, fine mesh net/beach seine) 19
16.5 3 2.6 22 19.1
Resource competition/conflict (fish corral, intrusion
of transient fishers, beach encroachment 4
3.5 3 2.6 7 6.1
Governance (boats without permit, logistical
problems of Bantay Dagat) 1
0.9 2 1.7 2 1.7
Food security issue (fish sold outside the barangay) 1 0.9 1 0.9
Sub-total 48 41.7 48 41.7
None 51 44.3 78 67.8 51 44.3
Don’t know 6 5.2 5 4.3 4 4.2
Not concerned/no answer 10 8.7 21 18.3 10 18.3
Whenever a coastal management problem is raised by the respondent, a follow-up
question is asked to elicit the respondent’s perceived corresponding solution/s with at most,
two solutions solicited. Though majority (62 or 53.9%) failed to provide solutions, 53
respondents (46.1%) were able to suggest 72 specific and straight forward solutions to either
of the two major problems cited (Table 31). Those that were related/similar were lumped
together and categorized according to commonalities of concerns. When grouped according
to governance concerns, 31 respondents (58.5%) suggested solutions focused on enforcement
of rules and regulations such as apprehension/prosecution of illegal fishers while 22 (41.5%)
cited solutions related to policy formulation on resource utilization regulation. The third
category of solutions given, such as coastal clean-ups and waste segregation, requires
community mobilization. For reference purposes, a summary of the top perceived coastal
management problems and solutions are provided in Table 32.

47
Table 31. Perceived coastal management solutions (n = 115) Barangay Inagawan, Puerto
Princesa City, Philippines, (n = 115).
Coastal Management Solutions Problem
1
Problem
2
Combined
Governance-Enforcement (apprehend illegal fishers, conduct
intensive patrols, enforce fishery laws, prohibit sand quarrying,
prohibit over-exploitation of coastal resource, prohibit use of fine
meshed nets/bayakus, enforce fishery laws & ordinances,
Prosecute illegal fishers, Prohibit claims of land near the shore)
27
(23.5)
4
(3.5)
31
(27.0)
Governance-Policy (Designate zones for fish corrals, Designate
docking area for boats, Legislate laws & ordinances to protect
coastal resource, Limit fishing practices to hook & line method,
Regulate fishing activities, Regulate prices of fish sold in the
village, Prohibit transient fishers, Relocate fish corrals, Mobile
registration of boats to the village)
17
(14.5)
5
(4.3)
22
(19.1)
Governance-Logistical Support (Provide assistance to BFARMC
officers, provide patrol boats, communication equipment)
1
(0.9)
3
(2.6)
4
(3.5)
Governance-Educational Awareness (educate people about the use
of illegal fishing methods, educate people on disaster
preparedness)
3
(2.6)
3
(2.6)
Governance -Negotiation (Talk to offender to remove fences on
the beach, Talk to offender to stop using illegal fishing methods,
mangrove cutting, etc)
2
(1.7)
2
(1.7)
Governance-Personnel (add more patrollers) 1
(0.9)
1
(0.9)
Community Mobilization (coastal cleanups, practice proper waste
segregation, report violators of laws)
8
(15.1)
1
(0.9)
9
(7.8)
Sub-total 48
(41.7)
None 51
(44.3)
Missing/no answer 10
(8.7)
Don’t know 6
(5.2)
Note: Figures in parentheses are the corresponding percentages.
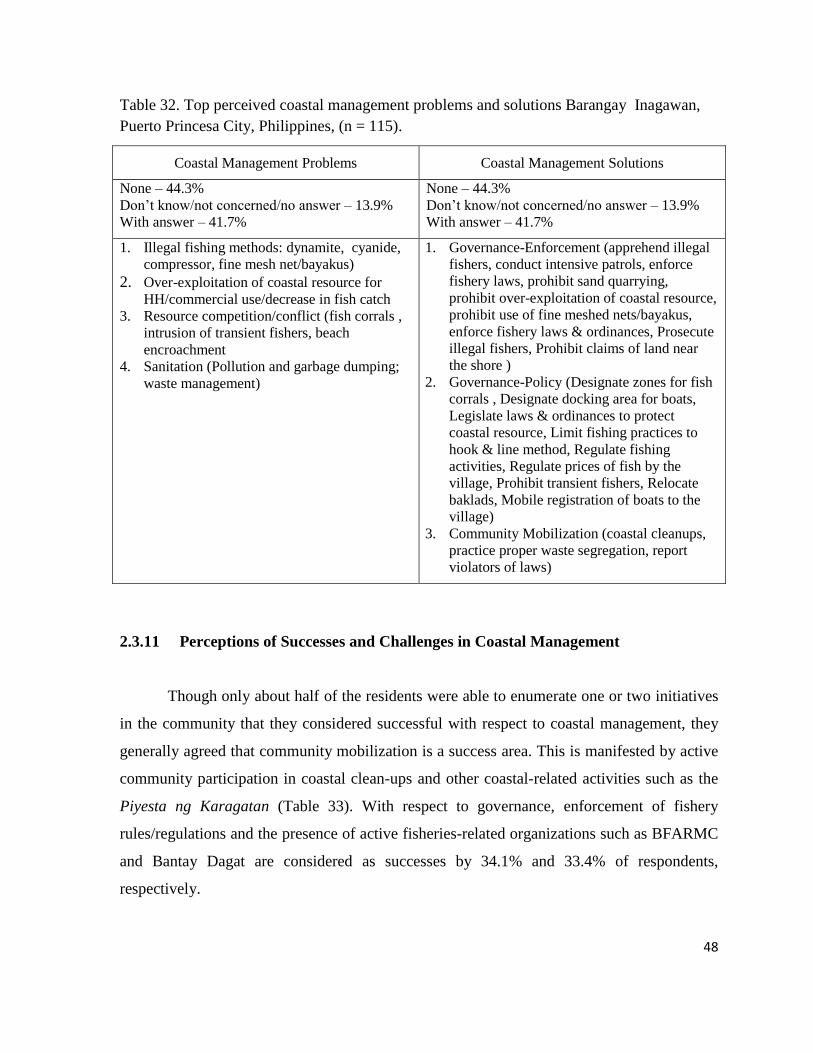
48
Table 32. Top perceived coastal management problems and solutions Barangay Inagawan,
Puerto Princesa City, Philippines, (n = 115).
Coastal Management Problems Coastal Management Solutions
None – 44.3%
Don’t know/not concerned/no answer – 13.9%
With answer – 41.7%
None – 44.3%
Don’t know/not concerned/no answer – 13.9%
With answer – 41.7%
1. Illegal fishing methods: dynamite, cyanide,
compressor, fine mesh net/bayakus)
2. Over-exploitation of coastal resource for
HH/commercial use/decrease in fish catch 3. Resource competition/conflict (fish corrals ,
intrusion of transient fishers, beach
encroachment
4. Sanitation (Pollution and garbage dumping;
waste management)
1. Governance-Enforcement (apprehend illegal
fishers, conduct intensive patrols, enforce
fishery laws, prohibit sand quarrying,
prohibit over-exploitation of coastal resource,
prohibit use of fine meshed nets/bayakus,
enforce fishery laws & ordinances, Prosecute
illegal fishers, Prohibit claims of land near
the shore )
2. Governance-Policy (Designate zones for fish
corrals , Designate docking area for boats,
Legislate laws & ordinances to protect
coastal resource, Limit fishing practices to
hook & line method, Regulate fishing
activities, Regulate prices of fish by the
village, Prohibit transient fishers, Relocate
baklads, Mobile registration of boats to the
village)
3. Community Mobilization (coastal cleanups,
practice proper waste segregation, report
violators of laws)
2.3.11 Perceptions of Successes and Challenges in Coastal Management
Though only about half of the residents were able to enumerate one or two initiatives
in the community that they considered successful with respect to coastal management, they
generally agreed that community mobilization is a success area. This is manifested by active
community participation in coastal clean-ups and other coastal-related activities such as the
Piyesta ng Karagatan (Table 33). With respect to governance, enforcement of fishery
rules/regulations and the presence of active fisheries-related organizations such as BFARMC
and Bantay Dagat are considered as successes by 34.1% and 33.4% of respondents,
respectively.

49
During the FGD session with resource users, the identified challenges of the
community in coastal management were on resource conservation and on the implementation
of ordinances on costal resource conservation and management. There was also general
agreement that the coastal clean-up drive of the community was successful in addressing the
issue.
Table 33. Perceived successes in coastal management Barangay Inagawan, Puerto Princesa
City, Philippines (n = 115).
Coastal Management Success Success 1 Success 2 Combined
No. % No. % No. %
Governance-Enforcement (Strict enforcement of fishery
laws & ordinances)
8 7.0 6 5.2 14 12.2
Governance-Policy (Issuance of village ordinances to
maintain clean beaches, Designation of zones for
baklads)
2 1.7 1 0.9 3 2.6
Governance-Administration (Active organizations such
as BFARMC and Bantay Dagat)
13 11.3 5 4.3 18 15.7
Governance-Logistical (Nets are distributed) 1 0.9 1 0.9
Community Mobilization (Active community
participation in coastal cleanups and other coastal
resource-related activities such as Piyesta ng
Karagatan, community strictly follows the fishery laws
& ordinances )
27 23.5 7 6.1 34 29.6
Sub-total 54 47.0 20 17.4
None 33 28.7 55 47.8
Don’t know 26 22.6 26 22.6
Missing/no answer 6 5.2 14 12.2
It is apparent that most residents found it difficult to pinpoint a challenge to coastal
resource management in their community as 45.2.0% said “none”, 8.7% did not respond and
23.5% answered “don’t know” (Table 34). Each respondent was asked to enumerate at most
two successes. However, all the 22.6% who responded only cited one challenge. Their
responses are parallel to the coastal resource management problems they enumerated earlier.
Governance is still the challenge, both from the perspectives of strict enforcement of the law
and the compliance of users to the resource rules and regulations. The multi-dimensionality
of coastal resource management is highlighted in the residents’ responses with some of them
seeing the challenge as an enforcement issue while others recognizing that the difficulty is in
the compliance by the resource users of what is being enforced. The most frequently cited

50
successes and challenges in coastal management as perceived by respondents are
summarized in Table 35.
Table 34. Perceived challenges in coastal resources management Barangay Inagawan, Puerto
Princesa City, Philippines (n = 115).
Challenges in Coastal Management
Challenge 1
No. %
Natural calamities: typhoon, strong waves 2 1.7
Beautification and cleanliness of beach (sustained cleanliness/coastal clean-up,
maintenance of beach, 2
1.7
Governance-administration (dissatisfaction with performance of village officials 2 1.7
Governance-enforcement (apprehension of illegal fishers, continuous monitoring,
consistent enforcement of regulations, 6
5.2
Governance – community compliance (use of illegal fishing methods, token regard
of rules and regulations 8
7.0
Conservation of resources (establishing fish sanctuary, mangrove reforestation,
destruction of fish habitat) 3
2.6
Governance – logistics (not enough patrollers, insufficient funds of village) 2 1.7
Lack of alternative livelihood like seaweeds 1 0.9
Sub-total 26 22.6
None 52 45.2
Don’t know 27 23.5
Missing/not concerned 10 8.7
Table 35. Top perceived successes and challenges in coastal management Barangay
Inagawan, Puerto Princesa City, Philippines (n = 115).
Coastal Management Successes Coastal Management Challenges
None – 28.7 %
Don’t know – 22.6 %
Missing/no answer – 5.2 %
With answer – 47.0 %
None – 45.2 %
Don’t know – 23.5 %
No answer/missing – 8.7 %
With answer – 22.6 %
1. Community Mobilization (Active community
participation in coastal cleanups & other
coastal resource-related activities such as
Piyesta ng Karagatan, community strictly
follows the fishery laws & ordinances)
2. Governance-Enforcement (Strict enforcement
of fishery laws & ordinances)
3. Governance-Administration (Active
organizations such as BFARMC and Bantay
Dagat)
1. Governance – community compliance (use of
illegal fishing methods, token regard of rules
and regulations
2. Governance-enforcement (apprehension of
illegal fishers, continuous monitoring,
consistent enforcement of regulations,

51
2.3.12 Perceptions of Community Management Problems and Solutions
Compared to coastal management problems/solutions, more residents are able to
enumerate at least one community management problem and the corresponding suggested
solution. This indicates a greater sense of community awareness among residents. Since the
village’s feeder roads are dirt roads and there are no access roads within the sitios of the
village, it is not surprising that infrastructure (such as bridge, feeder roads, drainage and
related facilities) is a major concern for most of community members (38.1%) (Table 36).
Other top community problems as indicated by the high frequencies are lack of
livelihood/occupational opportunities, lack of electricity and street lights, poverty, and
juvenile delinquency. This fifth ranking problem of juvenile delinquency arises out of the
presence of a number of out-of-school youths in the village.
Table 36. Perceived community problems Barangay Inagawan, Puerto Princesa City,
Philippines (n= 115).
Community Problem Problem 1 Problem 2 Combined
No. % No. % No. %
Alternative/supplemental livelihood projects and lack of
occupation opportunities 21 25.0 21 25.0
Natural calamities: typhoons, floods 3 3.6 3 3.6
Inter-personal conflicts among family/community
members 2 2.4 1 1.2 3 3.6
No Infrastructure: Drainage, bridge, feeder road 25 29.8 7 8.3 32 38.1
Lack of Electricity/street lights 9 10.7 6 7.1 15 17.9
Poverty/financial difficulties 10 11.9 3 3.6 13 15.5
Garbage/waste disposal management 2 2.4 2.4 2 2.4
Juvenile delinquency: Lack of activities for out-of-school
youth; vice/drunkenness/discipline among youth, out-of-
school youth
6 7.1 4 4.8 10 11.9
Access to credit/loans: Lack of funds for fishing 2 2.4 2 2.4
Lacks financial assistance/support from government 4 4.8 1 1.2 5 5.9
Deforestation/cutting of trees 2 2.4 1 1.2 3 3.6
Agriculture : plant/coconut pests ; waste from copra, foul
smell from piggery 5 5.9 5 5.9
Others: food security; docking area for boats; lack of
people’s participation; increase in informal settlers;
drunkenness
4 4.8 1 1.2 5 5.9
Sub-total 84 100.0
Don’t know/Missing 7 6.1
None 24 20.9

52
Table 37. Perceived community problems in Barangay Inagawan, Puerto Princesa City,
Philippines (n=115)
Coastal Management Problems Solution 1 Solution 2 Combined
No. % No. % No. %
Provision of electricity: Add more street lights, request action
from Palawan Electric Cooperative (PALECO) support to
households to tap power
10
8.7 10
8.7
Action needs to be taken by concerned authorities and village
council
6
5.2 7
6.1 13
11.3
Improve infrastructure: roads, canals/drainage improvement,
village to provide gravel and sand, employ bayanihan, provide
filling materials for low lying areas
13
11.3 4
3.5 17
14.8
Access to credit: Provide start-up capital, establish credit
cooperative in village; low-interest loans from government
16
13.9 3
2.6 19
16.5
Curfew 3 2.6 1 0.9 4 3.5
Employment: Additional livelihood/job opportunities; conduct
livelihood trainings
17
14.8 7
6.1 24
20.9
Livelihood support: government to provide fishing gears,
pesticides
5
4.3 5
4.3
Youth program: Sports, skills training 2 1.7 2 1.7
Cleanliness and proper waste segregation, use of septic tank
for piggery, waste management seminar
5 4.3 5 4.3
Strict law enforcement, prohibition of cutting of trees 3 2.6 1 0.9 4 3.5
Others: seaweed culture, move houses away from the shore 2 1.7 2 1.7
Sub-total 81 70.4
Missing/don’t now 7 6.1
None 27 23.5
Consequently, many of the suggested solutions to community problems fall into four
broad categories, namely: (1) provide alternative/supplemental livelihood opportunities, (2)
provide access to credit, (3) develop infrastructure, and (4) improve access to electricity
(Table 37). Majority of the respondents listed alternative/supplemental livelihood
opportunities as the topmost solution to their community problems. It seems that the lack of
start-up capital or financial difficulty in general prevents residents from engaging in other
livelihood endeavors; hence, access to credit ranked high among the respondent. Suggested
solutions gathered include: provide start-up capital, establish credit cooperative in the
village, and low-interest loans from government. For problems related to infrastructure, the
residents proposed that canal/road/drainage improvement be undertaken, with the village
council taking the lead in addressing these concerns. Possible modalities could be either by

53
direct action of providing the materials or by coordinating with concerned government
agencies so that the corresponding action on these problems may be made. PALECO, the
local electricity distributor, has already set up power lines in the village that will enable
households to subscribe and tap electricity for their daily use. The community wanted to
have street lights while some households are still without electricity apparently because of
the relatively high costs associated with getting connected to power lines. Hence, these are
concerns for which assistance is sought. The top perceived community problems and
solutions are ranked and listed in Table 38.
These community problems were also echoed by the key informants during the FGD
and KIIs. Many of these problems were related to economic, socio-cultural, and
infrastructure concerns. Economic problems included the lack of livelihood opportunities and
access to credit facilities. According to FGD session participants, these economic problems
can be resolved through provision of livelihood programs to most out-of-work individuals in
the community. Meanwhile, socio-civic related concerns such as vices, stray animals, and
declining fish catch were seen to call for village ordinances.
Table 38. Top perceived community problems and solutions Barangay Inagawan, Puerto
Princesa City, Philippines, (n = 115)
Community Problems Community Solutions
Missing/don’t know/no answer – 6.1%
None – 23.5%
With answer – 70.4%
Missing/don’t know/no answer – 6.1%
None – 23.5%
With answer – 70.4%
1. No Infrastructure: Drainage, bridge, feeder
road
2. Alternative/supplemental livelihood projects
and lack of occupation opportunities
3. Lack of Electricity/street lights
4. Poverty/financial difficulties
5. Juvenile delinquency: Lack of activities for
out-of-school youth;
vice/drunkenness/discipline among youth, out-
of-school youth
1. Employment: Additional livelihood/job
opportunities; conduct livelihood trainings
2. Access to credit: Provide start-up capital,
establish credit cooperative in the village;
low-interest loans from government
3. Improve infrastructure: roads,
canals/drainage improvement, village to
provide gravel and sand, employ bayanihan,
provide filling materials for low lying areas
4. Action needs to be taken by concerned
authorities and village council
5. Provision of electricity: Add more street
lights, request action from PALECO; support
to households to tap power
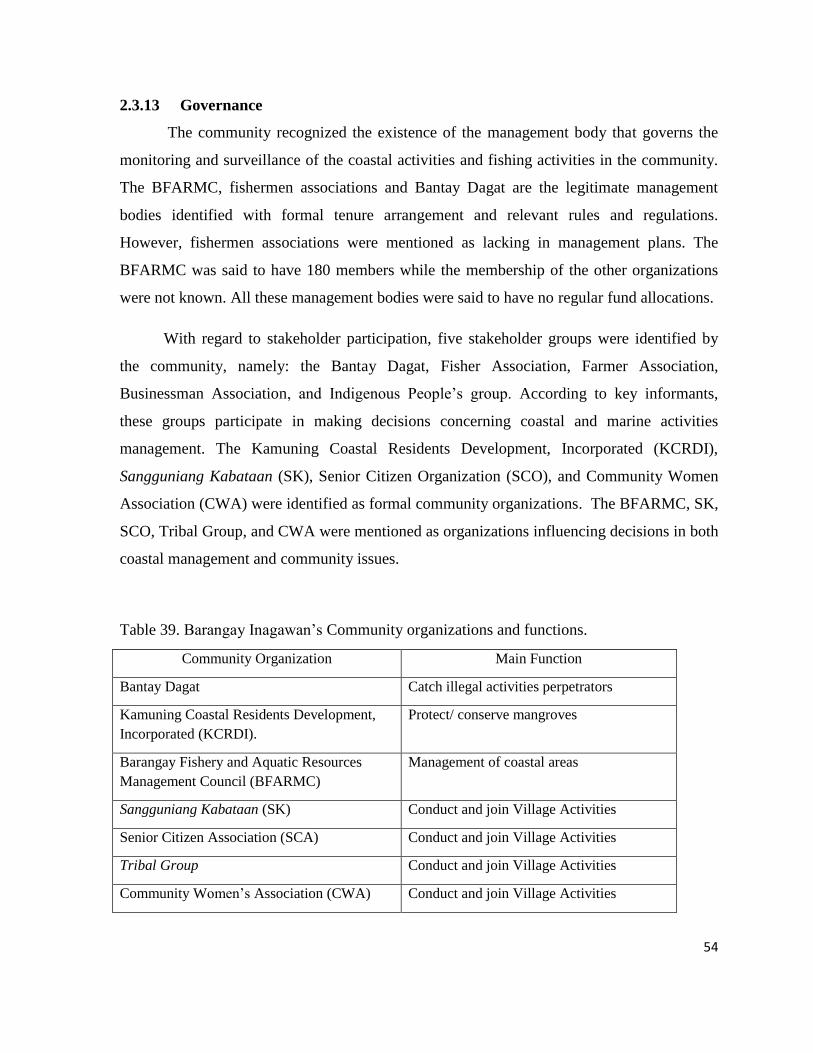
54
2.3.13 Governance
The community recognized the existence of the management body that governs the
monitoring and surveillance of the coastal activities and fishing activities in the community.
The BFARMC, fishermen associations and Bantay Dagat are the legitimate management
bodies identified with formal tenure arrangement and relevant rules and regulations.
However, fishermen associations were mentioned as lacking in management plans. The
BFARMC was said to have 180 members while the membership of the other organizations
were not known. All these management bodies were said to have no regular fund allocations.
With regard to stakeholder participation, five stakeholder groups were identified by
the community, namely: the Bantay Dagat, Fisher Association, Farmer Association,
Businessman Association, and Indigenous People’s group. According to key informants,
these groups participate in making decisions concerning coastal and marine activities
management. The Kamuning Coastal Residents Development, Incorporated (KCRDI),
Sangguniang Kabataan (SK), Senior Citizen Organization (SCO), and Community Women
Association (CWA) were identified as formal community organizations. The BFARMC, SK,
SCO, Tribal Group, and CWA were mentioned as organizations influencing decisions in both
coastal management and community issues.
Table 39. Barangay Inagawan’s Community organizations and functions.
Community Organization Main Function
Bantay Dagat Catch illegal activities perpetrators
Kamuning Coastal Residents Development,
Incorporated (KCRDI).
Protect/ conserve mangroves
Barangay Fishery and Aquatic Resources
Management Council (BFARMC)
Management of coastal areas
Sangguniang Kabataan (SK) Conduct and join Village Activities
Senior Citizen Association (SCA) Conduct and join Village Activities
Tribal Group Conduct and join Village Activities
Community Women’s Association (CWA) Conduct and join Village Activities

55
2.4 Recommendations
From these findings and conclusions, the following recommendations are hereby offered:
1. Verify the bio-physical status of the resources in the village to validate the residents’
perceptions regarding the conditions of their coastal and non-coastal resources.
2. Monitor the resource areas to determine if the threats cited are still continuing up to
the present and if so, take the necessary actions to mitigate and/or eliminate the threat.
3. Undertake wider dissemination of environmental rules and regulations not only to the
resource users but to the community at large so that resource protection and
conservation would be a “community affair.” This is because at present, awareness of
resource rules and regulations is mostly limited to the actual resource users.
4. Organize and/or strengthen agriculture-related stakeholder organizations so that more
farmers may get involved in communal decision making. Though there is already an
active BFARMC, Barangay Inagawan is a combined farming/fishing community with
more households relying on farming rather than fishing as their occupation.
5. Give greater attention to the governance dimension, specifically on enforcement of
rules in coastal management. Designate environmental police personnel who can
immediately respond and apprehend violators. Assign them to critical areas where
they can provide quick response to reports of violations. Though the BFARMC and
Bantay Dagat members are deputized to apprehend offenders, they hesitate to do so
because of the attendant risks to their lives. Hence, it is best for them and other
community residents to form a network of informants linked with the concerned law
enforcement agencies.
6. Develop policy options that may be considered to include: designation of fish corral
(baklad) zones; docking area for boats; limitation of fishing to hook and line
methods; mobile registration of boats in the community; and prohibition of transient
fishers from other municipalities. There is an emerging consensus among residents
that the focus of governance with respect to policy formulation should be more on
regulating fishery activities.
7. Mobilize more community residents for coastal clean-ups, waste segregation
programs, and monitoring/reporting of violators of resource rules and regulations.

56
The more residents are involved in community work, the greater would be the sense
of community responsibility and involvement.
8. Support the village council’s initiative to establish a marine protected area (MPA)
within the Barangay Inagawan coastal area by enacting an appropriate city-level
ordinance and by providing logistical support in delineating the MPA boundaries.
9. Explore alternative/supplemental livelihood opportunities that would allow village
residents to become entrepreneurs and/or self-employed. The assistance should not
only be limited to training and capital support but must also include marketing
support. Fishers are already experiencing decreasing fish catch, thus, limiting fishing
and resource use activities may further result to reduced income for them, in the short
term.
10. Establish more basic infrastructure facilities that could, in turn, spur economic
development. Such infrastructure may include feeder roads and canals/drainage
improvement. The residents are willing to help by providing the manpower (locally
called bayanihan), provided that the concerned government agencies, including the
Barangay Council, would supply the construction materials.
11. Rationalize the issue of power. Electricity is already available to the village; hence,
there is a clamor for more street lights. Some households seem unable to pay for the
attendant expenses in order to connect to the Palawan Electric Cooperative
(PALECO), the electricity provider in the area. The Barangay may therefore serve as
a conduit to help the households negotiate with PALECO so that some compromise
may be arranged for them to be able to tap electricity and pay the initial costs, like
doing so on an instalment basis.
12. Undertake the same baseline in the future. Since the data presented herein were
collected in order to establish baseline conditions at Barangay Inagawan, it is also
recommended that a similar undertaking be conducted three or five years from now in
order to monitor changes and trends.

57
2.5 Bibliography
Bunce L, Pomeroy R.S. 2000 Socioeconomic monitoring guidelines for coastal managers in
southeast Asia: SocMon SEA. World Commission on Protected Areas and Australian
Institute of Marine Science, Australia.
Bunce L, Townsley P, Pomeroy R, Pollnac R. 2003. Socioeconomic manual for coral reef
management. Australian Institute of Marine Science, Australia.
City Government of Puerto Princesa. 2007. Socioeconomic and Physical Profile. Puerto
Princesa City, Palawan.
City Government of Puerto Princesa. 2009. Community Based Monitoring System Database.
Puerto Princesa City, Palawan.
City Government of Puerto Princesa. 2012. Annual Executive Budget. Puerto Princesa City,
Palawan.
Department of Interior and Local Government. 2009. Barangay Profile of Barangay
Inagawan. 2 pp. Puerto Princesa City, Palawan.
City Agriculture Office. 2009. Coastal Resource Management Plan of Barangay Inagawan.
9pp. Puerto Princesa City, Palawan.
City Agriculture Office. 2012. Master List of Fishermen Database. Puerto Princesa City,
Palawan.

58
2.6 Appendices
Appendix 1. Commonly used fishing gears, Barangay Inagawan, Puerto Princesa City,
Palawan, Philippines
English Name Local Name
Beach seine Bayakos
Crab pot Bobo
Gill net Lambat
Hook and line Kawil
Multiple handline Kawil
Push net ( bangus fry gathering) Sud-sud
Squid jigger Ganti-ganti

59
Appendix 2. Common names and equivalent local names of commonly caught marine
species, Barangay Inagawan, Puerto Princesa City, Palawan, Philippines
Common Name Local Name
FINFISHES
Anchovy Dilis
Catfish Hito
Frigate mackerel Tulingan
Fusilier Dalagang
bukid
Garfish Balo
Goatfish Salmonetis
Halfbeak Baritos
Hardtail scad/Trevally Lapis
Indian mackerel Alumahan
Jack Talakitok
Milkfish Bangus
Mullet Banak
Rabbitfish Samaral
Roundscad Galunggong
Sardine Tamban
Shark Pating
Short-bodied mackerel Hasa-hasa
Slipmouth Sapsap
Sole fish Palad
Spanish mackerel Tanigue
Squid Pusit
Threadfin bream Bisugo
Trigger fish Pakol
Tuna Tambakol
"Unknown" Darag-darag
“Unknown” Karatungan
CRUSTACEAN
Crab Alimango
Shrimp Hipon

60
This document may be cited as:
PSU-CGPP-PCSDS (Palawan State University-City Government of Puerto Princesa-Palawan
Council for Sustainable Development Staff). 2012. SocMon Site Report in Barangay
Inagawan, Puerto Princesa City, Palawan, Philippines. 60 p. Center for Strategic Policy and
Governance/Palawan State University, Puerto Princesa City.
78
Part 3 SocMon Site Report Barangay Kamuning, Puerto Princesa City,
Palawan
“Socioeconomic Monitoring (SocMon) Program in the
Philippines to Support Effective Coral Reef Conservation and
Coastal Resources Management: Initiation in Oriental Mindoro
Province and Continuation in Puerto Princesa City, Palawan
Province”

Socioeconomic Monitoring (SocMon) Program in the Philippines to Support Effective
Coral Reef Conservation and Coastal Resources Management: Initiation in Oriental Mindoro
Province and Continuation in Puerto Princesa City, Palawan Province
SocMon Site ReportBarangay Kamuning, Puerto Princesa City
Palawan, PhilippinesCenter for Strategic Policy and Governance
Palawan State UniversityPuerto Princesa City
City Agriculture OfficeCity Goverment of Puerto Princesa
Puerto Princesa City
Palawan Council for Sustainable Development StaffPuerto Princesa City
September 2012

2
Table of Contents
List of Tables .................................................................................................................................. 3
List of Figures ................................................................................................................................. 5
List of Appendices .......................................................................................................................... 5
List of Acronyms and Abbreviations .............................................................................................. 6
Summary ......................................................................................................................................... 8
3.1. Introduction ........................................................................................................................ 12
3.2. Methodology ...................................................................................................................... 14
3.3. Summary of Results ........................................................................................................... 16
3.3.1. Household Demographics........................................................................................... 16
3.3.2. Coastal and Marine Activities .................................................................................... 23
3.3.3. Types and Value of Goods and Services .................................................................... 24
3.3.4. Consumption and Market Orientation ........................................................................ 27
3.3.5. Attitudes towards Non-Market and Non-Use Values of Resources ........................... 34
3.3.6. Perception of Resource Conditions ............................................................................ 39
3.3.7. Perceived Threats ....................................................................................................... 41
3.3.8. Awareness of Rules and Regulations ......................................................................... 50
3.3.9. Participation in Decision Making ............................................................................... 51
3.3.10. Membership in Resource Use Stakeholder Organization ........................................... 54
3.3.11. Perceived Coastal Management Problems and Solutions........................................... 55
3.3.12. Successes and Challenges in Coastal Management .................................................... 58
3.3.13. Perceived Community Problems and Solutions to Community Problems ................. 61
3.3.14. Governance ................................................................................................................. 64
3.4. Recommendations .............................................................................................................. 65
3.5. Bibliography ...................................................................................................................... 68
3.6 Appendices ......................................................................................................................... 69
3
List of Tables
Table 1. Household demographic characteristics, Barangay Kamuning, Puerto Princesa City, Philippines
(n = 94). ...................................................................................................................................... 18
Table 2. Summary quantitative indices for household size and age, Barangay Kamuning, Puerto Princesa
City, Philippines (n = 94). .......................................................................................................... 19
Table 3. Sociocultural Characteristics of Household Members, Barangay Kamuning, Puerto Princesa City,
Philippines, (n = 94). .................................................................................................................. 20
Table 4. Primary and secondary occupations of household members*, Barangay Kamuning, Puerto
Princesa City, Philippines. .......................................................................................................... 21
Table 5. Most important income sources of households, Barangay Kamuning, Puerto Princesa City,
Philippines, (n = 94). .................................................................................................................. 22
Table 6. Material style of life, Barangay Kamuning, Puerto Princesa City, Philippines, (n = 94). ............ 23
Table 7. Coastal and Marine Activities, Types of Use, and the Identified Goods and Services, Barangay
Kamuning, Puerto Princesa City, Palawan, Philippines, 2011 ................................................... 24
Table 8. Perceived values and market value of goods and services, Barangay Kamuning, Puerto Princesa
city, Palawan, Philippines, 2011. ................................................................................................ 26
Table 9. Comparison of Perceived Values of Goods and Services, and Mean Volume, Mean Price and
Revenue per unit Effort, Barangay Kamuning, Puerto Princesa City, Palawan, Philippines,2011
.................................................................................................................................................... 27
Table 10. Market orientation of goods and services, Barangay Kamuning, Puerto Princesa City, Palawan,
Philippines, 2011. ....................................................................................................................... 28
Table 11. Use Pattern of coastal marine activities, Barangay Kamuning, Puerto Princesa City, Palawan,
Philippines. ................................................................................................................................. 29
Table 12. Level and Type of Impact of Coastal Marine Activities on Resources Barangay Kamuning,
Puerto Princesa City, Palawan, Philippines, 2011 ...................................................................... 31
Table 13. Level of Use of Coastal Marine Resources by Outsiders Barangay Kamuning, Puerto Princesa
City, Palawan, Philippines, 2011 ................................................................................................ 32
Table 14. Attitudes towards non-market and non-use values of coastal resources, Barangay Kamuning,
Puerto Princesa City, Philippines, (n = 94) ................................................................................. 35
Table 15. Means and standard deviations of rating scores of attitudes towards non-market and non-use
values of coastal resources, Barangay Kamuning, Puerto Princesa City, Philippines, .............. 36
Table 16. Aggregate rating scores on attitudes towards non-market and non-use values of coastal
resources, Barangay Kamuning, Puerto Princesa City, Philippines, (n = 94). .......................... 38
Table 17. Means and standard deviations of aggregate rating scores on attitudes towards non-market and
non-use values of coastal resources, Barangay Kamuning, Puerto Princesa City, Philippines (n
= 94). ........................................................................................................................................... 38
Table 18. Perceptions of resource conditions, Barangay Kamuning, Puerto Princesa City, Philippines, (n =
94). .............................................................................................................................................. 39
Table 19. Means and standard deviations of ratings on perceived resource conditions, Barangay
Kamuning, Puerto Princesa City, Philippines, (n = 94). ............................................................ 40

4
Table 20. Perceived threats to mangroves, Barangay Kamuning, Puerto Princesa City, Philippines (n =
94) ............................................................................................................................................... 42
Table 21. Perceived threats to coral reefs, Barangay Kamuning, Puerto Princesa City, Philippines (n = 94)
.................................................................................................................................................... 43
Table 22. Perceived threats to upland forests, Barangay Kamuning, Puerto Princesa City, Philippines (n =
94) ............................................................................................................................................... 44
Table 23. Perceived threats to seagrass, Barangay Kamuning, Puerto Princesa City, Philippines (n = 94).
.................................................................................................................................................... 45
Table 24. Perceived threats to beach, Barangay Kamuning, Puerto Princesa City, Philippines (n=94) ..... 46
Table 25. Perceived threats to rivers/creeks, Barangay Kamuning, Puerto Princesa City, Philippines, (n =
94) ............................................................................................................................................... 47
Table 26. Perceived threats to ground water, Barangay Kamuning, Puerto Princesa City, Philippines (n =
94). .............................................................................................................................................. 48
Table 27. Top perceived threats to coastal resources, Barangay Kamuning, Puerto Princesa City,
Philippines, (n = 94). .................................................................................................................. 49
Table 28. Top perceived threats to non-coastal resources, Barangay Kamuning, Puerto Princesa City,
Philippines, (n = 94). .................................................................................................................. 49
Table 29. Awareness of resource rules and regulations, Barangay Kamuning, Puerto Princesa City,
Philippines, (n = 94) ................................................................................................................... 50
Table 30. Current and desired levels of participation in decision making, Barangay Kamuning, Puerto
Princesa City, Philippines, (n = 94). ........................................................................................... 51
Table 31. Means and standard deviations of ratings of participation in decision making, Barangay
Kamuning, Puerto Princesa City, Philippines, (n = 94) .............................................................. 53
Table 32. Comparisons of current and desired levels of participation in decision making, Barangay
Kamuning, Puerto Princesa City, Philippines, (n = 94) .............................................................. 54
Table 33. Household membership in resource use stakeholder organizations, Barangay Kamuning, Puerto
Princesa City, Philippines (n = 94). ............................................................................................ 55
Table 34. Membership in resource use stakeholder organizations, Barangay Kamuning, Puerto Princesa
City, Philippines (n = 94). .......................................................................................................... 55
Table 35. Perceived coastal management problems, Barangay Kamuning, Puerto Princesa City,
Philippines (n = 94). ................................................................................................................... 56
Table 36. Perceived solutions to coastal management problems, Barangay Kamuning, Puerto Princesa
City, Philippines (n = 94). .......................................................................................................... 57
Table 37. Top perceived coastal management problems and solutions, Kamuning, Puerto Princesa City,
Philippines, (n = 94) ................................................................................................................... 58
Table 38. Perceived successes in coastal management, Barangay Kamuning, Puerto Princesa City,
Philippines (n = 94). ................................................................................................................... 59
Table 39. Perceived challenges in coastal management, Barangay Kamuning, Puerto Princesa City,
Philippines (n = 94). ................................................................................................................... 60
Table 40. Top perceived coastal management successes and challenges, Barangay Kamuning, Puerto
Princesa City, Philippines (n = 94). ............................................................................................ 61
Table 41. Perceived community problems, Barangay Kamuning, Puerto Princesa City, Philippines, (n =
94). .............................................................................................................................................. 62

5
Table 42. Perceived solutions to community problems, Barangay Kamuning, Puerto Princesa City,
Philippines (n = 94). ................................................................................................................... 63
Table 43. Top perceived community problems and solutions, Barangay Kamuning, Puerto Princesa City,
Philippines. ................................................................................................................................. 64
List of Figures
Figure 1. Map showing the location of Barangay Kamuning in Puerto Princesa City, Palawan,
Philippines. ................................................................................................................... 12
Figure 2. Mean ratings for items on attitudes towards non-market and non-use values (n=94). . 36
Figure 3. Mean ratings of perceived resource conditions at Barangay Kamuning, Puerto Princesa
City, Philippines (n = 94). ............................................................................................ 41
List of Appendices
Appendix 1. Commonly used fishing gears, Barangay Kamuning, Puerto Princesa City, ........... 69
Appendix 2. Common names and equivalent local names of commonly caught marine species,
Barangay Kamuning, Puerto Princesa City, Palawan, Philippines .......................... 70

6
List of Acronyms and Abbreviations
BFARMC Barangay Fisheries and Aquatic Resources Management Council
CBMS Community-Based Monitoring Survey
CGPP City Government of Puerto Princesa
CLUP Comprehensive Land Use Plan
CWA Community Women Association
CWF Charity Women’s Foundation
FGD focused group discussions
GI galvanized iron
ha hectares
HH household
HHI household interview
IP Indigenous People
KCDAI Kamuning Coastal Development Association, Inc
KI key informant
KII key informant interview
km kilometers
MPA marine protected area
NGO non-government organization
PALECO Palawan Electric Cooperative
PCSDS Palawan Council for Sustainable Development Staff
RA Republic Act
SCO Senior Citizen Organization
SEA Southeast Asia
SK Sangguniang Kabataan
SocMon Socioeconomic Monitoring

7
“Socioeconomic Monitoring (SocMon) Program in the Philippines to Support Effective
Coral Reef Conservation and Coastal Resources Management: Initiation in Oriental
Mindoro Province and Continuation in Puerto Princesa City, Palawan Province”
Institutional Partners and Members
City Government of Puerto Princesa
Mellissa Macasaet
Delia Martinez
Gloria Taggueg
Miguelito Cervancia
Omega Tabang
Ma. Teresa Casenas
Ivan Oja
Jerry Samoza
Joven Delgado
Melanie Sildera
Palawan Council for Sustainable Development Staff
John Francisco Pontillas
Jesus Bream
Palawan State University
Michael Pido
Marissa Pontillas
Eva Marie Ponce de Leon
Nelly Mendoza
Gianina Decano
Phabe Tabucalde
Ricardo Tajolosa
Catherine Mae Postre
Rainier Manalo
Arselene Bitara
Evelyn Tomas
Janeth Montilla
Ma Aynon Gonzales
Gretchen Pilapil
Fritz Ann Rodriguez
Jose Buenconsejo
Mary Aileen delas Alas

8
Summary
Introduction
Understanding socioeconomic factors and the communities’ relationship to coastal and
marine resources is crucial for the success of marine conservation. As such, the Global
Socioeconomic Monitoring Initiative for Coastal Management (SocMon Global) has been
initiated to pursue this worldwide conservation initiative. The Socioeconomic Monitoring
Southeast Asia (SocMon SEA) is being undertaken in countries within the Southeast Asian
region, including the Philippines, for nearly a decade. This report provides a synopsis of the
socio-economic monitoring (SocMon) project that was undertaken in Barangay Kamuning, a
coastal community located some 56 km from Puerto Princesa City, Palawan Province,
Philippines. The goal of this project is to propagate the use of socioeconomic monitoring
(SocMon) among academics, researchers, policy makers, and coastal managers thereby
enhancing coral reef conservation and coastal resources management.
Methodology
The SocMon methodology followed three major steps. The first part was advance
preparation that included defining the objectives of SocMon, establishing the SocMon team and
preparing the logistics. The second part was data collection, which was the generation of field
data using three complementary research methods namely, household interview (HHI), key
informant interview (KII), and focused group discussions (FGD). The number of respondents is
as follows: HHI – 94 households; KII – 9; and FGD – 1. Field data were gathered from June
2011 to August 2012 in Barangay Kamuning, Puerto Princesa City. The third part was analysis
of both qualitative and quantitative data, while communication consisted of disseminating the
results to the relevant stakeholders. The Palawan State University took the lead and the partners
involved were the City Government of Puerto Princesa (CGPP) and the Palawan Council for
Sustainable Development Staff (PCSDS).
Results and Discussion
Results of the study showed that the typical household size in the village was
approximately five members, with slightly more females than males, and a lot more younger
people. The village has a mixture of Tagbanua (an ethnic group indigenous people group), ethnic

9
groups of Palawan and migrants from other parts of the country who are mostly Visayan in
origin. Tagalog was spoken by the majority of the residents. The community was predominantly
Roman Catholic. About half finished at most elementary level while a fourth had gone beyond
high school. Only 10% finished a college or vocational-technical course. There existed high un-
employment in the villages with majority of the households having very low or low material
style of life.
Typical of most rural villages located near coastal areas but endowed with a sizable
agriculture area, Barangay Kamuning is primarily a farming and secondarily a fishing
community. The community use of its coastal marine resources include marine resource
extraction such as capture fisheries, aquaculture, gravel collection and honey gathering. Non-
extractive activities include tourism-related activities such as accommodation and recreation in
the form of beach picnics, and support to education related undertakings such as venue for
trainings and workshops.
The village was able to supply the demand for fishery products for food beyond the
locality. However, the mismatch between the perceived value of the traded marine products and
the actual market value indicated that the fishers were not getting a fair price. Residents
perceived that key resource bases both on land and sea were in varying stages of degradation
due to the community’s and transient fishermen’s unmitigated exploitation of such resources for
both household and livelihood uses.
Still, the community members generally perceived that their ground water, springs,
river/creeks, beach, seagrass, coral reefs and mangroves were in good condition. They perceived
their terrestrial forests were in neither good nor bad condition. For those who knew of at least
one threat to these resources, the most often cited threats were cutting of trees for
commercial/household uses, including charcoal making for mangroves and swidden farming and
illegal logging for terrestrial forests; illegal fishing methods for coral reefs; pollution/garbage
dumping and natural phenomena for beach and rivers/creeks. Sand quarrying was also attributed
as a threat to all freshwater sources. It is noted, however, that a sizeable number of residents
answered “none” when they were asked of the threats to the natural resources in their
community, ranging from 9.6% (for mangroves) to 58.3% (for springs), or answered “don’t
know” or “not applicable”, indicating lack of knowledge about the specific resource.
10
Furthermore, less threats were identified for beach and seagrass. In the case of the seagrass, this
reflects the generally worldwide poor appreciation of this important resource.
Majority of the residents were also aware of rules and regulations on fishing and
mangrove management. Less than fifty percent of the residents were aware of rules pertaining to
aquaculture, resort/pension/hotel development and pebble gathering. Residents have very limited
awareness of the rules on the rest of the resource uses/activities. The rules and regulations they
are usually aware of originated from concerned agencies of the City Government of Puerto
Princesa. The presence of resource use stakeholder organizations in the village such as the
Barangay Fisheries and Aquatic Resources Management Council (BFARMC), women’s
associations, Kamuning Coastal Development Association, Inc (KCDAI), and agriculture-related
groups is associated with a 57.4 participation rate among household members in community-
groups. Yet most households rated their current levels of participation in decision making as no
participation, with the highest mean rating found for mangrove management and fishing at 3.1
and 3.2, respectively in a scale of 1-5. A number of residents expressed a greater desire to
participate in decision making as evidenced by the higher mean ratings of 3.4 for desired levels
on both fishing and mangroves. Over-all, the residents’ desired levels are higher than their
currents levels, and these differences are all statistically significant.
Although about 6 out of 10 said that they don’t have or don’t know any coastal
management problem, those who knew of at least one mentioned problems related to the use of
illegal fishing methods - such as dynamite, cyanide, compressor and fine mesh nets and use of
other illegal fishing gears, sanitation, and governance on enforcement. The proposed solutions
given by the residents can be categorized into three: governance on enforcement, governance on
educational awareness and social services and livelihoods assistance. Though they perceived that
they are successful in mangrove reforestation, community mobilization, enforcement of fishery
laws and ordinances, interventions in terms of logistical support and enforcement, as well as
sustaining activities on conservation and protection of resources continue to be challenges to
them.
From a more general perspective, the top community problems as perceived by the
residents are the following: inadequate infrastructure (bad road conditions, and farm to market
roads, cemetery, lack of water supply for domestic and agricultural use); and need for

11
alternative/supplemental livelihoods. The cited solutions focus on infrastructure development,
livelihoods assistances, and community mobilization.
In summary, the community of Barangay Kamuning is socially and economically
challenged with the residents perceiving their natural resources to be in good condition but under
threat from the activities of the community and transient users. They have a weak understanding
of these threats, poor knowledge of rules and regulations, feeble support institutions and little
participation by the locals, and the need for the provision of the needed infrastructure. There is
the necessity to address social and economic challenges of the community by strengthening
community understanding of their natural resources at the ecosystem level, enhancement of
existing livelihood and the provision of supplemental income sources. These must be coupled
with backing from the government and non-government organizations through enhancing
institutional support by way of training and linking with existing initiatives, and the provision of
appropriate infrastructure, research and technical assistance.

12
3.1. Introduction
Barangay Kamuning is located 56 km from Puerto Princesa City’s main commercial hub
(Figure 1). It is bounded on the north by Barangay Inagawan, south by the Municipality of
Aborlan, east by Sulu Sea and West by Barangay Inagawan-Sub Colony. It has three sitios and
seven puroks.
The barangay has a total land area of 1,700 ha comprising of 12 ha residential area, 853
ha of agricultural area, and 1,010 ha of forest area. Major coastal habitats found in the area
include mangrove forests (474.6 ha), seagrass beds (142.1) ha, and coral reefs (11.9 ha). The
topography of the area includes limited and relatively flat lands with 0-8% slope.
Figure 1. Map showing the location of Barangay Kamuning in Puerto Princesa City, Palawan,
Philippines.

13
According to the Community-based Monitoring Survey (CBMS) of Puerto Princesa City
in 2009, the village had a population of 480 households with a total of 1,799 members, 892
(49%) of whom are males and 907 (51%) are females. Most households have from 3 to 4
members.
During the same year, the educational background of residents who are beyond school
age included the following: 290 (16.1%) with elementary or primary schooling, 150 (8.3%)
residents with secondary or high school education, 30 (1.7%) residents with tertiary education,
and 10 (0.6%) residents with post-graduate studies. There were also 20 (1.1%) residents who
have finished vocational or technical courses. Tagalog, Waray, Ilonggo, Cuyunon, Ilocano,
Bicolano, and Cebuano are the common languages and dialects spoken by the people in the
village.
With regard to primary livelihoods and income sources, household members from the
village are engaged in the following major activities: 1,349 (75%) in agriculture, 359 (20%) in
fisheries and 89 (5%) in employment and entrepreneurial activities. The monthly income of
residents ranges from PhP3,000.00 to PhP15,000.00 depending on the source, as presented in the
matrix below:
Source of Income Income Range (PhP)
Government Employment 9,000.00 - 15,000.00
Entrepreneur 7,000.00 - 9,000.00
Farming 6,000.00 - 8,000.00
Fishing 5,000.00 - 7,000.00
Labor 3,000.00 - 5,500.00
Source: Socioeconomic Economic Profile, 2009.
At present, the village has a total of 98 residents engaged in fishing, a significant
reduction of 72.7% from 2009. Seventy nine of the present fishers are part-time fishers and 19
are full-time fishers. There are 52 fishing boats classified as motorized (15 units) and non-
motorized (37 units). The community intends to establish an estimated area of 75.7 ha of coastal
marine waters as a marine sanctuary.

14
Housing is classified according to the use of materials such as concrete, wood and
galvanized iron sheet for permanent structures. Those made up of wood, with roofings of
galvanized iron sheet is classified as semi-permanent residential structures. Meanwhile, those
made of thatch bamboo (sawali) or nipa, are classified as temporary residential structures. In the
case of the village, majority of the households (303 or 63.1%) have semi-permanent dwelling
structures, while 98 households (20.4%) are living in permanent structures and 79 are households
(16.5%) in temporary structures.
Households in Barangay Kamuning access their water supply from deep wells and open
or dug well, from which water is harnessed for domestic and residential uses. Majority of the
households (345 households) use electricity for lighting, while approximately 120 households
use kerosene as source of power and light.
3.2. Methodology
The overall methodology and/or general procedure for training, field data collection and
data analysis followed the SocMon methodology (Bunce and Pomeroy 2000, Bunce et al. 2003).
The SocMon Process basically follows three major steps. SocMon is “a set of guidelines for
establishing a socioeconomic monitoring program at a coastal management site in Southeast
Asia” in order to gain an understanding of the social, cultural, economic, and political
characteristics and conditions of individuals, households, groups, and communities (Bunce and
Pomeroy, 2003). The SocMon process basically follows three major steps. The first part was
advance preparation that included defining the objectives of SocMon, establishing the SocMon
team and preparing the logistics. The second part was data collection, which was the generation
of field data whereas three complementary research methods were employed namely, household
interview (HHI), key informant interview (KII), and focused group discussions (FGD). The third
part was analysis of the gathered qualitative and quantitative data, while communication
consisted of disseminating the results to the relevant stakeholders.
The SocMon methodology provides a standardized set of 32 indicators and 28 indicators
using key informant/secondary source and household interviews, respectively. Household
interview indicators are categorized into household demographics (9), coastal and marine
activities (5), attitudes and perceptions (13), and the material style of life (1). A mix of both

15
quantitative and qualitative data arises out of undertaking a SocMon community-level survey
using all or subsets of these 28 indicator variables. The results are summarized with the end
view of translating data into useful information for any or all of the following purposes: (1)
identifying threats, problems, solutions, and opportunities; (2) determining the importance,
value, and cultural significance of resources and its uses; (3) assessing positive and negative
impacts of management measures; (4) assessing how the management body is doing
(management effectiveness); (5) building stakeholder participation and appropriate education
and awareness programs; (6) verifying and documenting assumptions of socioeconomic
conditions in the area, community dynamics and stakeholder perceptions; and (7) establishing
baseline household and community profile.
The main purpose of undertaking the SocMon in Inagawan is to establish the necessary
socioeconomic baseline information needed for establishing marine sanctuaries and for resource
use planning by communities. For the four study sites, all 60 key informant (KI) and household
(HH) indicators were chosen and utilized to obtain the necessary information required by the
communities for planning and decision–making. These variables were chosen after a consultation
with community leaders/site managers and other key stakeholders to ensure the responsiveness
of the research variables to the local conditions.
The process/means of data collection involved extracting data from both primary and
secondary sources. In addition to a review of available documents such as but not limited to
village profiles, municipal statistics, and relevant national reports, data gathering instruments
were utilized to collect and cross-validate data. Primary data were collected in the field to
complement secondary data as well as to fill identified gaps. Primary data collection took place
through the development and administration of household questionnaire survey and through
individual/group interview of key informants (KIs). The selected key informants (KIs) were
individuals who, because of their position, experience and/or knowledge, provided insights into
the larger population. The KIs chosen included local leaders, community elders, coastal
managers, representatives of non-governmental organizations and policy makers. Individual
KIIs were conducted to collect useful baseline data, as well as to validate the primary and
secondary data collected through other methods. The FGDs, on the other hand, were group
interviews designed to gather/validate both questionnaire and KII data for the baseline. Focused

16
group participants included fishers, tourist operators, community elders, farmers, and NGO
representatives present in the community. The socioeconomic household surveys collected data
directly from the household head, usually the husband or wife in the family, through face-to-face
interviews.
Systematic sampling was employed to randomly select the sample households and to
ensure equal representation of the population with the sampling interval computed based on the
population size and desired sample size. The list of households in each community, as provided
by the village council’s secretary, was used as the sampling frame for Barangay Kamuning.
From the population of 480 households, 94 households were selected using the systematic
random sampling. This sample size is 19.6% of the total population, and is composed of 386
individuals. Nine key informants and one focus group discussion were conducted during the
research.
The SocMon household survey was conducted by trained enumerators while the team
statistician supervised the development of the database, encoding, and data analysis. Results of
the surveys were then presented to the community and other stakeholders for validations. After
the validations were completed, the technical reports for each village were finalized. Some of
these reports will be translated into layman’s language, such as policy briefs. Appropriate reports
were also disseminated to the relevant stakeholder groups so that they may use the research
results for planning and adaptive management.
3.3. Summary of Results
3.3.1. Household Demographics
Household demographics relate to size, sex, educational attainment and household size
(Table 1 and Table 2). Out of the 94 households surveyed, 45 (47.9%) had four to six members
while 41 (43.6%) had one to three members, and 8 (8.5%) had seven to nine members. Though
half of the households had at most 4 members while the other half had less than 4, the typical
household size has around 5 members. There are slightly more females (52.8%) than males in the
community. About 44% of the residents are less than 20 years old, while 19.4% belong to the age
range 50 years old and above. The median age is 23 which is lower than the mean age of 28.5,

17
confirming that the distribution of ages is positively skewed; that is, there are more younger
people and fewer older people in the community. The majority (48.7%) of the community
members were born within the village, 30% in other villages in Puerto Princesa City or the
province of Palawan, while 20% come from other parts of the country, notably the Visayan
regions. This shows that the village has a mixture of natives (indigenous populations or IPs,
principally the Tagbanua tribe) and migrants from nearby and far-flung areas. For those beyond
the school-age population (aged 16 years and below), about half finished at most elementary
level while a fourth had gone beyond high school. There were only 10% who finished a college
or vocational-technical course.

18
Table 1. Household demographic characteristics, Barangay Kamuning, Puerto Princesa City,
Philippines (n = 94).
Socio-Demographic Characteristic Frequency Percentage
Household Size
1 to 3 members
4 to 6 members
7 to 9 members
41
45
8
43.6
47.9
8.5
Gender
Male
Female
182
204
47.2
52.8
Age (as of last birthday)
0 to 9 years
10 to 19 years
20 to 29 years
30 to 39 years
40 to 49 years
50 to 59 years
60 to 69 years
70 years and above
83
86
53
48
41
38
24
13
21.5
22.3
13.7
12.4
10.6
9.8
6.2
3.4
Highest Educational Attainment
(for household members > 16 years)
No formal schooling
At most grade 4
At most grade 6/elementary grad
At most 3rd
year high school
At most 4th
year/high school grad
College undergraduate
College graduate
Vocational/technical graduate
2
17
50
46
66
38
14
10
0.8
7.0
20.6
18.9
27.2
15.6
5.8
4.1
Birthplace
Village locale
Municipal locale but in other villages
Provincial locale but in other
municipalities
Regional locale but in other province
Other regions in Luzon
Other regions in Visayas
Other regions in Mindanao
No Response
188
73
45
1
10
62
1
5
48.7
18.9
11.7
0.3
2.6
16.1
0.3
1.3

19
Table 2. Summary quantitative indices for household size and age, Barangay Kamuning, Puerto
Princesa City, Philippines (n = 94).
Household Size Age
Total Number 94 households 386 individuals
Median 5 23
Mean 4.9 28.5
Standard Deviation 1.8 20.5
Skewness 0.1 0.6
Selected sociocultural characteristics of the community like religion, language and
ethnicity is reflected in Table 3. The community is predominantly Roman Catholic with a very
small percentage (6%) belonging to other religions. A third (33.2%) of the residents is identified
with the Tagbanuas, which is an IP group in the locality who were the original settlers in the
area. Almost a third (29.5%) come from ethnic groups within the province and the rest (37.3%)
are from other ethnic groups in the country, mostly Visayan in origin. This again confirms that
the village has become a melting pot of residents of different ethnicities. What emerged as the
most commonly spoken (lingua franca) is Tagalog, which is spoken by 82.1% of residents. It can
thus be inferred that even the Tagbanua has become acculturated and is already speaking the
Tagalog language. Some residents, having originated from the Visayan region of the country,
speak Visayan-related dialects like Cebuano and Ilonggo as their primary language.

20
Table 3. Sociocultural Characteristics of Household Members, Barangay Kamuning, Puerto
Princesa City, Philippines, (n = 94).
Sociocultural Characteristic Frequency Percentage
Religion
Roman Catholic
Islam
Seventh Day Adventist
Born-again Christian
Baptist
363
1
9
8
5
94.0
0.3
2.3
2.1
1.3
Primary Language Spoken
Tagalog
Cebuano
Ilonggo
Ilocano
Bisaya
317
29
15
21
4
82.1
7.5
3.9
5.4
1.0
Ethnic Membership
Ethnic group within the locality
Ethnic group within the province
Ethnic group within the region
Ethnic group within the Luzon
Ethnic group within the Visayas
Ethnic group within the Mindanao
128
114
13
31
96
4
33.2
29.5
3.4
8.0
24.9
1.0
About a third (80 or 31.9%) of those who are 16 years old and above are not engaged in
any regular occupational activity (Table 4). For those who are regularly working, half (49.7%)
have farming as a primary occupation and a tenth (10.8%) as a secondary occupation. Thus,
60.4% of those working are into farming as primary or secondary occupation. In contrast, 18.6%
and 11.4% are into fishing as primary and secondary occupations, respectively. There are only
small percentages of the residents who are engaged in other occupations. This confirms that
Barangay Kamuning is essentially a community of farmers and fishers. Furthermore, there exists
high un-employment in the village.

21
Table 4. Primary and secondary occupations of household members*, Barangay Kamuning,
Puerto Princesa City, Philippines.
Occupation Category Primary Secondary Total/Combined
No. % No. % No. %
Fishing 31 18.6 19 11.4 50 29.9
Farming 83 49.7 18 10.8 101 60.4
Regular government employment 11 6.5 2 1.2 13 7.8
Private professional employment 5 3.0 5 3.0
Labourer/construction worker 5 3.0 11 6.6 16 9.6
Self-employed/small business
owner
13 7.8 9 5.4 22 13.2
Animal/livestock raising 11 6.6 5 3.0 16 9.6
Tricycle/jeepney driver 1 0.6 1 0.6
Nipa shingle (pawid) making 4 2.4 1 0.6 5 3.0
Peddler /ambulant vendor 1 0.6 1 0.6 2 1.2
Gleaning 1 0.6 1 0.6
Barangay Tanod 2 1.2 2 1.2
Subtotal 167 66.5 72 43.1
None/ no information 84 33.5
Total 251 100.0 *For household members with ages of at least 16 years old
With the main occupation in the community as farming, it is therefore not surprising that
the same percentage (60.6%) of the households rely on farming as their primary or secondary
source of income (Table 5). Fishing is a primary source of income for 22.3% and a secondary
source for another 18.1% of the households for a combined percentage of 40.4%. It is thus noted
that most households rely primarily on both farming and fishing as income sources for their
livelihood.

22
Table 5. Most important income sources of households, Barangay Kamuning, Puerto Princesa
City, Philippines, (n = 94).
Primary Secondary Total/Combined
Source of Income No. % No. % No. %
Pension 1 1.1 1 1.1 2 2.1
Local remittance from relatives 2 2.1 2 2.1
Fishing 21 22.3 17 18.1 38 40.4
Farming 44 46.8 13 13.8 57 60.6
Regular government employment 2 2.1 1 1.1 3 3.2
Private professional employment 2 2.1 2 2.1
Labourer/construction worker 4 4.3 10 10.6 14 14.9
Self-employed/small business owner 3 3.2 7 7.4 10 10.6
Animal raising 3 3.2 3 3.2 6 6.4
Nipa shingles (pawid) making 1 1.1 2 2.1 3 3.2
Gleaning 2 2.1 2 2.1
Barangay Tanod 1 1.1 1 1.1
Peddler/ambulant vendor 1 1.1 1 1.1
Tricycle/ Jeepney driver 1 1.1 1 1.1
None/ no information 11 11.7 35 37.2
Total 94 100 94 100
Due to the complexities in measuring household income, SocMon does not make any
attempt to measure it but instead substitutes the variable “material style of life” as an indicator of
the economic status of the households. Observations of the residential dwellings of the sample
households show that most are predominantly made of thatch bamboo/nipa roofs and tin/
galvanized iron (GI) sheets, thatch bamboo walls and windows, and bamboo/concrete floors
(Table 6). Over-all, about 80% of the households have either very low or low material style of
life as indicated by their residential dwellings being made of light materials such as bamboo and
nipa. It can therefore be inferred that majority of the households are not economically well off
based on the materials that they used for their residential dwellings.

23
Table 6. Material style of life, Barangay Kamuning, Puerto Princesa City, Philippines, (n = 94).
Material Style of Life No. %
Type of Roof:
Thatch/nipa
Thatch/bamboo
Tin/GI sheet
47
2
45
50
2.1
47.9
Type of outside structural walls
Thatch/nipa
Thatch/bamboo
Wood/plywood
Brick/concrete
6
69
2
17
6.4
73.4
2.1
18.1
Windows:
Open
Thatch/bamboo
Wooden
Steel bars
Glass
10
51
18
7
5
11.0
56.0
19.8
7.7
5.5
Floor
Dirt
Bamboo
Cement
Wooden
9
45
36
4
9.6
47.9
38.3
4.3
Other Household Assets:
2/3/4-wheel Motor Vehicle
Banca
Computer
Refrigerator
Television set
40
3
16
37
41.7
3.1
16.7
38.5
Aggregate Ratings
4 - 8: Very low
9 - 12: Low
13 – 16: High
41
31
19
45.0
34.1
20.8
3.3.2. Coastal and Marine Activities
The community of Barangay Kamuning utilizes its coastal marine resources for its
economic and daily subsistence and activities. These include marine resource extraction such as
catch fisheries, aquaculture, gravel collection and honey gathering. Non-extractive activities
include tourism-related activities. These include accommodation and recreation in the form of
beach picnics, and support to education-related undertakings such as venue for trainings and
workshops, and settlement which are located in the beach area.

24
Table 7. Coastal and Marine Activities, Types of Use, and the Identified Goods and Services,
Barangay Kamuning, Puerto Princesa City, Palawan, Philippines, 2011
Methods Used Goods and Service
Catch Fisheries
Gill net Frigate mackerel, Mackerel, Rabbit fish, Emperor fish, Sole
fish, “Darag”, Grouper, Jack
Gill net, modified with
scaring device
Rabbit fish, Trevally, Threadfin bream
Hook and line
Mackerel, Trevally, Frigate mackerel, “Budo,” Threadfin
bream, Mackerel
Hook and line, bottom
set-surface set longline
Garfish, Trevally, Snapper, Grouper, “Siga,” “Darag,” Jack
Squid jigger Squid
Fish corral Mackerel, Trevally, Rabbit fish, Parrotfish, Mullet, Grouper,
Sardine
Reef gleaning Jumping shells, seaweed, Arc shell, Sea urchin, “Kaladuga,”,
Spider shell, Mud crab, Marsh clam, Sea snail (small), Sea
snail (big), Mangrove worm
Aquaculture
Aquaculture Milkfish, Prawn, Mud crab
Tourism
Beach Resorts Beach
Others
Household Beach
Gravel collection beach gravel
Honey collection Honey
Capture fisheries is characterized by the use of common fishing gears that include two
types of gill nets, two variants of hook and line, squid jigger, fish corral, and reef gleaning (Table
7). Please refer to Appendix 1 for the equivalent local names of the fishing gears.
3.3.3. Types and Value of Goods and Services
The main marine fishery products derived from capture fisheries and aquaculture include
19 finfishes, 7 shellfishes, 2 crustaceans, 1 echinoderm, 1 mangrove worm, and 1 seaweed
(Table 7). Refer to Appendix 2 for the equivalent local names of the marine species. In addition,
the community members exploit honey from the mangrove forest, and collect gravel from their

25
beach. Furthermore, tourism activities and educational support in terms of venue, and settlement
are afforded by the beach.
The perceived values of the community for these resources are shown on Table 9. The
community rated fishery and aquaculture products of medium-high importance value except in
the cases of mackerel caught using hook and line, rabbit fish, mullet, parrot fish and sardines
caught using fish corral. Jumping shells (Little bear conch), seagrapes, arc shell, sea urchin,
“kaladuga,” and spider shell gathered through reef gleaning were given importance value of low-
medium. Honey is also highly valued. The beach, on the other hand, is perceived to be less
valuable.
Rated as highly valuable catch fishery are finfishes caught using the two variants of gill
nets, hook and line (bottom set-surface set long line), and fish corral specific to groupers and
rabbit fishes. The generally medium-high value accorded to fishery resources indicates the high
importance of fisheries to the community.
Specific to catch fisheries, the price of fishery products range from Php30-150 per kilo
with most of the goods falling in the price range of Php40-80 per kilo. The harvest from hook
and line and squid jigger posted the highest price of PhP80-200 per kilo with a mean of Php100.
Meanwhile, parrot fish and sardines gathered using fish corral commanded the lowest price in
the market at PhP30-40 per kilo.
It is interesting to note the perceived importance value accorded by the community with
regard to its fishery products (Table 8 and Table 9). From the purely economics point of view,
the price of goods and services is theoretically expected to be reflective of the societal value, as
represented by perceived value, but this is apparently not true in this case. A comparison of the
perceived value and actual market value was made using the market price and volume of catch
per unit effort, and using a scale of 1-10, with 10 being the lowest and 1 being the highest (Low:
8-11, Medium: 4-7: High:1-3). The analysis revealed that there exists a mismatch between the
perceived value of a specific fish and the value that they actually realized from the market in 7 of
the 12 cases (Table 10). Analysis of the perceived values and the reported harvest would lead
one to infer that the accorded importance value of the village for the fishery harvest is defined by
some other factors other than the price. These include the volume of catch and its interplay with
price as indicated by the revenue.

26
Table 8. Perceived values and market value of goods and services, Barangay Kamuning, Puerto
Princesa city, Palawan, Philippines, 2011.
Methods Used Goods and Products Rating
Price, PhP Volume, Kg
Low High Mean Low High Mean
Catch Fisheries
Gill net Frigate mackerel,
Mackerel, Rabbit fish,
Emperor fish, Sole fish,
“Darag”, Grouper, Jack
High 40 60 50 5 10 7.5
Gill net,
modified with
scaring device
Rabbit fish, Trevally,
Threadfin bream
High 40 60 50 5 6 11
Hook and line Mackerel, Trevally,
Frigate tuna
Medium 45 60 52.5 5 6 5.5
“Budo,” Threadfin bream Medium 80 120 100 5 6 5.5
Mackerel Low 40 60 76.25 2 3 2.5
Hook and line,
bottom set-
surface set
longline
Garfish, Jack, Snapper High 60 80 70 15 25 20
Grouper, Silverspot
squirrelfish/ Red Bigeye/
redeye/ longfinned
bullseye,”darag,” Jack
High 60 120 35 15 25 20
Squid jigger Squid Medium 80 120 100 5 6 5.5
Fish corral Mackerel, Trevally,
Rabbit fish, Parrot fish,
Mullet
Medium 40 60 50 20 30 25
Rabbit fish, Mullet Low 40 60 50 20 30 25
Grouper, Rabbit fish High 45 150 97.5 15 25 20
Parrot fish, Sardines Low 30 40 35 25 30 27.5
Reef gleaning
Jumping shells (Little
bear conch), seagrapes,
arc shell, sea urchin,
“kaladuga,” Spider shell
Low-
medium
Mud crab, marsh clam,
Seasnail (small), Seasnail
(big)
Medium
Mangrove worm High
Aquaculture
Aquaculture Milkfish, Prawn, Mud
crab
Medium-
High
80
200
140
Tourism
Beach Resorts Low
Others
Household Low
Gravel collection Low

27
Methods Used Goods and Products Rating
Price, PhP Volume, Kg
Low High Mean Low High Mean
Honey collection High
Table 9. Comparison of Perceived Values of Goods and Services, and Mean Volume, Mean
Price and Revenue per unit Effort, Barangay Kamuning, Puerto Princesa City, Palawan,
Philippines,2011 Type of
Fishery
Use
Goods and Services
Per-
ceived
Value
Mean
Vol
(Kg)
Mean
Price
(PhP)
Revenue per
unit effort
(PhP)
Rank
Rating
Gill net Frigate mackerel,
Mackerel, Rabbit fish,
Emperor fish, Sole fish,
“Darag”, Grouper, Jack
High 7.5 50 375 10 Low
Gill net,
modified with
scaring device
Rabbit fish, Trevally,
Threadfin bream
High 11 50 550 8 Medium
Hook and line Mackerel, Trevally,
Frigate tuna
Medium 5.5 52.5 288.75 11 Low
“Budo,” Threadfin bream Medium 5.5 100 550 8 Medium
Mackerel Low 2.5 76.25 190.625 11 Low
Hook and line,
bottom set-
surface set
longline
Garfish, Jack, Snapper High
20 70 1400 2 High
Grouper, Silverspot
squirrelfish/ Red Bigeye/
redeye/ longfinned
bullseye,”darag,” Jack
High 20 35 700 6 Medium
Squid jigger Squid Medium 5.5 100 550 8 Medium
Fish corral Mackerel, Trevally,
Rabbit fish, Parrot fish,
Mullet
Medium 25 50 1250 3.5 High
Rabbit fish, Mullet Low 25 50 1250 3.5 High
Grouper, Rabbit fish High 20 97.5 1950 1 High
Parrot fish, Sardines Low 27.5 35 962.5 5 Medium
Rating Legend: Low:8-11; Medium: 4-7; High: 1-3
3.3.4. Consumption and Market Orientation
Approximately 80-90% of the fishery products are sold either within the village or
outside of the village, with only 10% allotted for household consumption. In the case of gillnet
and fish corral, around 10% is used to barter for other goods or given away to laborers,
respectively. Exceptions are in the case of mud crab, marsh clam, seasnail (small), seasnail (big)

28
gathered through reef gleaning which are utilized solely for household consumption, and honey
and mangrove worm which are destined for the Manila market. The multi-level disposition and
market orientation of fishery products points to the importance of fishery products not only for
the local food security and economy, but as well as to outside villages and even to the national
economy. The market for tourism and training venue are both from within and outside of the
village.
Table 10. Market orientation of goods and services, Barangay Kamuning, Puerto Princesa City,
Palawan, Philippines, 2011.
Coastal and Marine Activities/ Household Use% Market
Types of Use/Goods And Services Own Given Away Sold
Catch Fisheries
Gill net Frigate mackerel,
Mackerel, Rabbit fish,
Emperor fish, Sole fish,
“Darag”, Grouper, Jack
10 10 80 Within the village
Gill net,
modified with
scaring device
Rabbit fish, Trevally,
Threadfin bream
10 90 Both
Hook and line Mackerel, Trevally,
Frigate mackerel
10 90 Within the village
“Budo,” Threadfin bream 10 90 Within the village
Mackerel 10 90 Within the village
Hook and line,
bottom set-
surface set
Garfish, Jack, Snapper 10 90 Outside the village
Grouper, Silverspot
squirrelfish/ Red Bigeye/
redeye/ longfinned
bullseye,”Darag,” Jack
10 90 Outside the village
Squid jigger Squid 10 90 Within the village
Fish Corral
Mackerel, Trevally, Rabbit
fish, Parrot fish, Mullet
10
10
80
Within the village
Grouper, Rabbit fish 10 10 80 Within the village
Parrot fish, Sardines 10 10 80 Within the village
Reef gleaning
Jumping shells (Little bear
conch), seagrapes, arc
shell, sea urchin,
“kaladuga,” Spider shell
20 80 Outside the village
Mud crab, Marsh clam,
Seasnail (small), Seasnail
(big)
100
Mangrove worm 100 Manila

29
Coastal and Marine Activities/ Household Use% Market
Types of Use/Goods And Services Own Given Away Sold
Aquaculture
Aquaculture Milkfish, Prawn, Mud crab 10 10 80 Outside the village
Tourism
Beach resorts Beach Both
Others
Household Beach 100
Gravel
collection
Beach 100
Honey
collection
Honey 100 Manila
3.3.5 Use Patterns
The discussed goods and services are provided by key coastal marine ecosystems that
include the coral reefs, seagrass beds, mangrove forests, the beach and the near-shore open
waters of the village. Meanwhile areas for tourism and settlement are located in the more
landward side of the coastal zone along the beach and back beach, respectively.
Table 11. Use Pattern of coastal marine activities, Barangay Kamuning, Puerto Princesa City,
Palawan, Philippines.
Coastal and Marine Activities/Types of Use /Goods
and Services
Use Pattern
Reef Sea
grass
Mangr
oves
Beach River Coast Open
Catch Fisheries
Gill net Frigate mackerel, Mackerel,
Rabbit fish
X X
Emperor fish, Sole fish X X
“Darag,” Jack X (puntog is)
X
Gill net, modified
with scaring device
Rabbit fish, Trevally,
Threadfin bream
X X X
Hook and line Mackerel, Trevally, Frigate
mackerel
X
“Budo,” Threadfin bream X
Mackerel X (FAD)
Hook and line,
bottom set-surface
set longline
Garfish, Jack, Snapper X
Grouper, Silverspot
squirrelfish/ Red Bigeye/
redeye/ longfinned bullseye
X (sanctuary)

30
Coastal and Marine Activities/Types of Use /Goods
and Services
Use Pattern
Reef Sea
grass
Mangr
oves
Beach River Coast Open
“Darag,” Jack, Grouper X (Puntog Is)
X
Squid jigger Squid X
Fish coral Mackerel, Trevally, Rabbit fish X X X
Parrot fish, Mullet X X
Grouper X X
Rabbit fish, Mullet X X
Parrot fish, Sardines X X X
Reef gleaning Jumping shells (Little bear
conch), seagrapes, arc shell,
sea urchin, “kaladuga,” Spider
shell
X X
Mud crab, Marsh clam,
Seasnail (small), Seasnail (big)
X
Mangrove worm X
Aquaculture
Aquaculture Milkfish, Prawn, Mud crab X
Tourism
Beach resorts Beach X
Others
Household Beach X X
Gravel collection Beach X
Honey collection Honey X
3.3.6 Levels and Types of Impacts of Coastal Marine Activities
The community identified a limited number of activities with specific impacts (Table 12).
These include high levels of impacts by the driving away of spawners and reef destruction due to
gill net fishing (modified with scaring device), overfishing and coral breakage due to fish corral
operation, over collection and damage to key coastal ecosystems from reef gleaning, and nutrient
and pesticide loading from aquaculture. Medium level of impact was identified from anchor
damage attributed to gill net fishing. Perceived to have low impacts include water pollution and
garbage generation from residential areas, and erosion as a result of gravel collection. The
remaining activities were rated from low to high with no specific impacts identified.

31
Table 12. Level and Type of Impact of Coastal Marine Activities on Resources Barangay
Kamuning, Puerto Princesa City, Palawan, Philippines, 2011
Coastal and Marine Activities/ Use Pattern/Level Of Impact Type Of
Types of Use/Goods and Services Reef Seagrass Mangroves Beach River Coast Open Impact
Catch Fisheries
Gill net Frigate mackerel,
Mackerel, Rabbit fish
M M M Anchor
Damage
to reef Emperor fish, Sole
fish
L L
“Darag,” Jack M M
Gill net,
modified
with scaring
device
Rabbit fish, Trevally,
Threadfin bream
H H H Destruction of
reef; driving
away of
spawners
Hook and
line
Mackerel, Trevally,
Frigate mackerel
L
“Budo,” Squid,
Threadfin bream
L
Mackerel (FAD) L
Hook and
line, bottom
set-surface
set longline
Garfish, Jack,
Snapper
M M
Grouper, Silverspot
squirrelfish/ Red
Bigeye/ redeye/
longfinned bullseye
H
“Darag,” Jack,
Grouper
M M
Squid jigger Squid L
Fish corral Mackerel, Trevally,
Rabbit fish
H H H Over-
fishing;
Coral
Breakage
Parrot fish, Mullet H H
Grouper H H
Rabbit fish, Mullet H H
Parrot fish, Sardines H H H
Reef
gleaning
Jumping shells (Little
bear conch),
seagrapes, arc shell,
sea urchin,
“kaladuga,” Spider
shell
H H Over
collection;
damage to
corals,
seagrass,
mangrove
Mud crab, Marsh
clam, Seasnail
(small), Seasnail
(big)
H

32
Coastal and Marine Activities/ Use Pattern/Level Of Impact Type Of
Types of Use/Goods and Services Reef Seagrass Mangroves Beach River Coast Open Impact
Mangrove worm H
Aquaculture
Aquaculture Milkfish, Prawn,
Mud crab
H Nutrient/
pesticide
Loading
Tourism
Beach resorts Beach L
Others
Household Beach L L Water pol
lution,
Garbage
Gravel Beach L Erosion
Collection
Honey
collection
Honey H
3.3.7 Level of Use by Outsiders
Outsiders, or those coming from outside the village, are perceived to have low to high
levels of use of the village’s coastal marine resources. Identified to be of high level of use are
transient fishermen operating the two variants of the gill nets and those who are engaged in reef
gleaning. Those perceived to have medium levels of resource use are fishermen using the two
types of hook and line, squid jigger and reef gleaning.
Table 13. Level of Use of Coastal Marine Resources by Outsiders Barangay Kamuning, Puerto
Princesa City, Palawan, Philippines, 2011
Coastal and Marine Activities/ Level Of Resource Use By Outsiders
Types of Use/Goods and Services Reef Seagrass Mangroves Beach River Coast Open
Catch Fisheries
Gill net Frigate mackerel,
Mackerel, Rabbit fish
H H H
Emperor fish, Sole fish H H H
“Darag,” Jack H H
Gill net,
modified with
scaring
device
Rabbit fish, Trevally,
Threadfin bream
H H H

33
Coastal and Marine Activities/ Level Of Resource Use By Outsiders
Types of Use/Goods and Services Reef Seagrass Mangroves Beach River Coast Open
Hook and
line
Mackerel, Trevally,
Frigate mackerel
M
“Budo,” Threadfin
bream
M
Mackerel M
Hook and
line, bottom
set-surface
set longline
Garfish, Jack, Snapper M M
Grouper, Silverspot
squirrelfish/ Red
Bigeye/ redeye/
longfinned bullseye
M
“Darag,” Jack, Grouper M M
Squid jigger Squid M
Fish corral Mackerel, Trevally,
Rabbit fish
L L L
Parrot fish, Mullet L L
Grouper L L
Rabbit fish, Mullet L L L L
Parrot fish, Sardines L L L L
Reef gleaning Jumping shells (Little
bear conch), seagrapes,
arc shell, sea urchin,
“kaladuga,” Spider shell
H H
Mud crab, Marsh clam,
Seasnail (small),
Seasnail (big)
M
Mangrove worm H
Aquaculture
Aquaculture Milkfish, Prawn, Mud
crab
L
Tourism
Beach
Resorts
Beach L
Others
Household Beach L L
Gravel
collection
Beach L
Honey
collection
Honey L

34
3.3.5. Attitudes towards Non-Market and Non-Use Values of Resources
Generally, people recognize and value the direct economic benefits derived from the
resources in their environment. However, SocMon looks at the community’s appreciation of
their coastal and other resources beyond the direct economic benefits and from an ecosystem
perspective. To measure people’s perception and understanding of the value of resources,
queries pertaining to the non-market and non-use values are included in the survey. Non-market
value of the coastal resources is a measure of how people perceive the enjoyed value of coastal
resources beyond its market value, while non-use value of the resources pertains to the value of
the natural resources accorded by the society based on moral grounds such as the right of future
generations to enjoy these resources (bequest value) and the inherent right of these resources to
exist in perpetuity (existence value).
Eight Likert-type item statements were asked pertaining to attitudes towards non-market
and non-use values of coastal resources (Table 14). Strong agreement indicates most positive
attitude and is given a score of 5 while the lowest score of 1 is given to a response of strong
disagreement. Aside from frequencies, arithmetic mean ratings were also derived for each item
statement and to aggregated statements (Table 15). The first three items focus on the indirect
non-market values of coastal resources: importance of reefs for protecting land from storm
waves (4.67); contribution of corals to fishing (4.53); and protection of mangroves for fishery
(4.74). These mean ratings indicate that people’s attitudes are generally very positive with
respect to the indirect non-market contribution of mangroves and corals to the fisheries. They
must have been aware that mangroves and corals perform important roles as fishery habitats and
as barrier against strong waves.
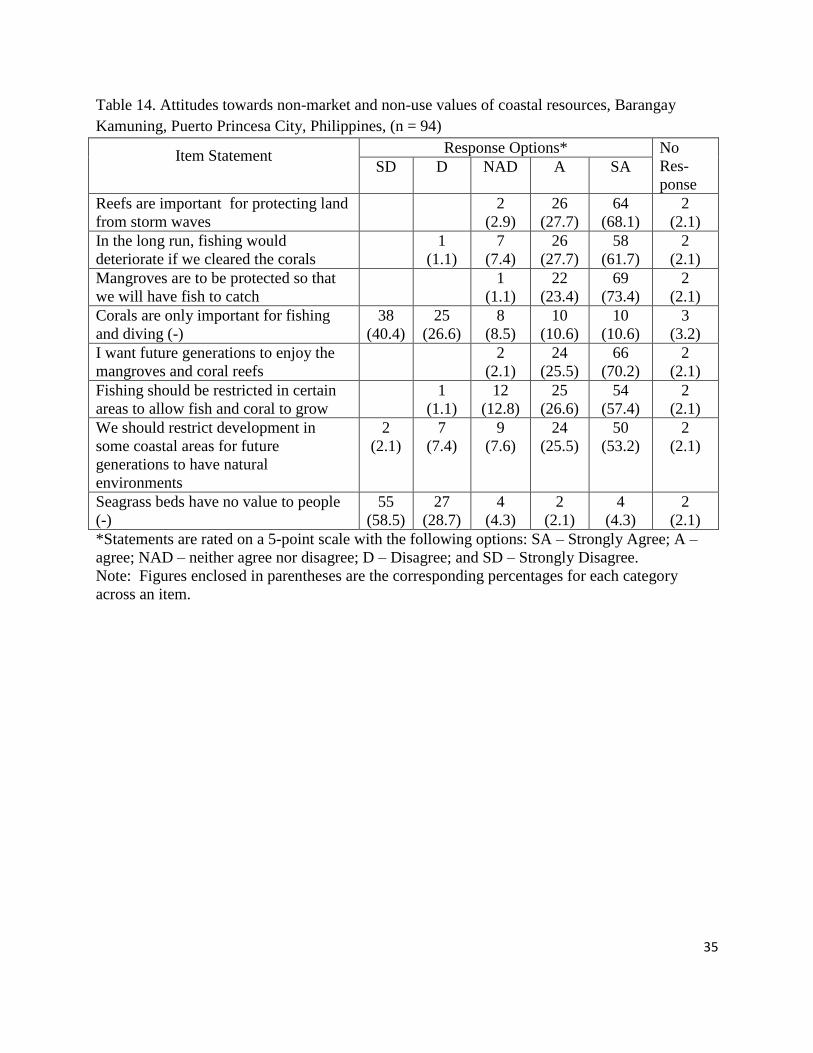
35
Table 14. Attitudes towards non-market and non-use values of coastal resources, Barangay
Kamuning, Puerto Princesa City, Philippines, (n = 94)
Item Statement Response Options* No
Res-
ponse SD D NAD A SA
Reefs are important for protecting land
from storm waves
2
(2.9)
26
(27.7)
64
(68.1)
2
(2.1)
In the long run, fishing would
deteriorate if we cleared the corals
1
(1.1)
7
(7.4)
26
(27.7)
58
(61.7)
2
(2.1)
Mangroves are to be protected so that
we will have fish to catch
1
(1.1)
22
(23.4)
69
(73.4)
2
(2.1)
Corals are only important for fishing
and diving (-)
38
(40.4)
25
(26.6)
8
(8.5)
10
(10.6)
10
(10.6)
3
(3.2)
I want future generations to enjoy the
mangroves and coral reefs
2
(2.1)
24
(25.5)
66
(70.2)
2
(2.1)
Fishing should be restricted in certain
areas to allow fish and coral to grow
1
(1.1)
12
(12.8)
25
(26.6)
54
(57.4)
2
(2.1)
We should restrict development in
some coastal areas for future
generations to have natural
environments
2
(2.1)
7
(7.4)
9
(7.6)
24
(25.5)
50
(53.2)
2
(2.1)
Seagrass beds have no value to people
(-)
55
(58.5)
27
(28.7)
4
(4.3)
2
(2.1)
4
(4.3)
2
(2.1)
*Statements are rated on a 5-point scale with the following options: SA – Strongly Agree; A –
agree; NAD – neither agree nor disagree; D – Disagree; and SD – Strongly Disagree.
Note: Figures enclosed in parentheses are the corresponding percentages for each category
across an item.

36
Table 15. Means and standard deviations of rating scores of attitudes towards non-market and
non-use values of coastal resources, Barangay Kamuning, Puerto Princesa City, Philippines,
(n = 94)
Item Statement Median Mean SD
Reefs are important for protecting land from storm waves 5 4.67 .52
In the long run, fishing would deteriorate if we cleared the corals 5 4.53 .69
Mangroves are to be protected so that we will have fish to catch 5 4.74 .47
Corals are only important for fishing and diving (-) 4 3.78 1.38
I want future generations to enjoy the mangroves and coral reefs 5 4.70 .51
Fishing should be restricted in certain areas to allow fish and
coral to grow
5 4.43 .76
We should restrict development in some coastal areas for future
generations to have natural environments
5 4.23 1.05
Seagrass beds have no value to people (-) 5 4.38 .99 *Statements are rated on a 5-point scale with the following options and corresponding scores: SA –
Strongly Agree (5); A – agree (4); NAD – neither agree nor disagree (3); D – Disagree (2); and SD –
` Strongly Disagree (1). Scoring is reversed for negatively-stated items.
Figure 2. Mean ratings for items on attitudes towards non-market and non-use values (n=94). Note: The numbers on the horizontal axis refer to the following item statements:
1 - The reefs are important for protecting land from storm waves.
2 - In the long run, fishing would deteriorate if we cleared the corals.
3 - Unless mangroves are protected, we will not so that we will have fish to catch.
4 - Coral reefs are only important if you fish or dive (reversed scoring).
5 - I want future generations to enjoy the mangroves and coral reefs
6 - Fishing should be restricted in certain areas even if no one ever fishes in those
Areas just to allow the fish and coral to grow
7 - We should restrict development in some coastal areas so that future generations
will be able to have natural environments.
8 - Seagrass beds have no value to people (reversed scoring).

37
Though still positive, the lowest ratings were given to items pertaining to existence non-
use values such as importance of corals beyond fishing and diving (3.78), restriction of
development in certain areas to preserve natural environments for future generations (4.23) and
value of seagrass bed to people (4.38). On the other hand, the mean rating scores for items on
bequest values of resources are 4.7 (I want future generations to enjoy the mangroves and coral
reefs) and 4.23 (We should restrict development in some coastal areas so that future generations
will be able to have natural environments). The summary and means of ratings for the three types
of non-market values (Table 16 and Table 17) show that the residents have generally positive
attitudes, with highest appreciation of the resources’ indirect non-market values and lowest
appreciation on existence non-use values. Furthermore, the standard deviation showed more
consistent responses for indirect non-use value followed by bequest value and existence non-use
value.

38
Table 16. Aggregate rating scores on attitudes towards non-market and non-use values of coastal
resources, Barangay Kamuning, Puerto Princesa City, Philippines, (n = 94).
Classification of attitude statements Freq %
Indirect non-market value
1.00 – 1.50 : Very negative
1.51 – 2.50 : Negative
2.51 – 3.50 : Neither positive nor negative
3.51 – 4.50 : Positive
4.51 – 5.00 : Very positive
No response
0
0
3
24
65
2
0
0
3.2
25.5
69.1
2.1
Existence non-use value
1.00 – 1.50 : Very negative
1.51 – 2.50 : Negative
2.51 – 3.50 : Neither positive nor negative
3.51 – 4.50 : Positive
4.51 – 5.00 : Very positive
No response
0
4
10
36
39
3
0
4.3
10.6
38.3
41.5
3.2
Bequest non-use value
1.00 – 1.50 : Very negative
1.51 – 2.50 : Negative1
2.51 – 3.50 : Neither positive nor negative
3.51 – 4.50 : Positive
4.51 – 5.00 : Very positive
No response
0
1
13
32
46
2
0
1.1
13.8
34.0
48.9
2.1
Mean rating for attitudes towards non-market and non-
use values of coastal resources
1.00 – 1.50 : Very negative
1.51 – 2.50 : Negative
2.51 – 3.50 : Neither positive nor negative
3.51 – 4.50 : Positive
4.51 – 5.00 : Very positive
No response
0
0
6
36
46
3
0
0
6.4
38.3
48.9
3.2
Table 17. Means and standard deviations of aggregate rating scores on attitudes towards non-
market and non-use values of coastal resources, Barangay Kamuning, Puerto Princesa City,
Philippines (n = 94).
Value Classification Median Mean Std Dev
Indirect non-market value 5.0 4.6 .48
Existence non-use value 4.3 4.2 .79
Bequest value 4.8 4.5 .66
Over-all attitude towards non-market and
non-use values of resources
4.6 4.4 .55

39
3.3.6. Perception of Resource Conditions
On a scale of 1 to 5 with 1 as “very bad” and 5 as “very good”, community residents
perceived the conditions of their resources to be in good condition, except for upland forests.
(Table 18). For upland forests, close to 50% answered “not applicable” which indicates that
many may not be familiar with such resources. There were also a number of residents who
answered “don’t know” or “not applicable” when asked of their perception of resource
conditions; these were usually non-users of the specific resources or individuals whose
residences were geographically far from the location of the resource. Hence, they may have
considered themselves without enough knowledge about the condition of the resource being
referred to.
Table 18. Perceptions of resource conditions, Barangay Kamuning, Puerto Princesa City,
Philippines, (n = 94).
Resource Perceived Resource Condition* Don’t
know
Not
Apply
Net
Rating** VB B NGB G VG
Mangroves 0 2
(2.1)
6
(6.4)
42
(44.7)
39
(41.5)
5
(5.3)
88.8
Coral reefs 2
(2.1)
7
(7.4)
13
(13.8)
39
(41.5)
24
(25.5)
9
(9.6)
63.5
Upland
forests
0 7
(7.4)
15
(16.0)
16
(17.0)
5
(5.3)
5
(5.3)
46
(48.9)
32.6
Seagrass 0 2
(2.1)
14
(14.5)
45
(47.9)
25
(26.6)
7
(7.4)
1
(1.5)
76.3
Beach 0 3
(3.)
10
(10.6)
51
(54.3)
27
(28.7)
2
(2.1)
1
(1.1)
82.4
River/
Creeks
0 7
(7.4)
14
(14.9)
40
(42.6)
14
(14.9)
4
(4.4)
15
(16.0)
62.67
Ground
water
0 5
(5.3)
6
(6.4)
44
(46.8)
25
(26.6)
2
(2.1)
12
(12.8)
80
*Each community resource is rated on a 5-point scale with the following options and corresponding scores:
VG – Very good (5);G – good (4); NGB - neither good nor bad (3); B – bad (2); and VB – very bad (1).
**Net Rating = % [freq (VG + G)] – % [freq (VB + B)]
Note: Figures enclosed in parentheses are the corresponding percentages for each category
The computed net ratings in the last column of Table 18 provides the percentage of
individuals who perceived the resource condition to be good/very good rather than bad/very
bad. Hence, the large positive net ratings reflected in this table attest that a greater percentage of

40
residents perceived their resources to be good compared to a few who found them bad. All other
resources had mean ratings of at least 4.0 with mangroves being highest at 4.33 compared to that
of coral reefs (3.9), seagrass (4.08), and beach (4.12). Groundwater resources, on the other hand,
had a mean rating of 4.11.
The lowest net rating is for upland forest; whereby there is only 22.3% more residents
who perceived their upland forest to be in good condition than those who said that they were in
bad condition. This is also echoed by the mean rating of perceived upland forest condition
which is lowest at 3.44 (Table 19). Residents’ perception on the conditions of their upland forest
is also most varied (SD = 1.38) compared to the other resources. Most also perceived their
rivers/creeks being in good or neither good nor bad conditions, with the mean rating at 3.81.
Table 19. Means and standard deviations of ratings on perceived resource conditions, Barangay
Kamuning, Puerto Princesa City, Philippines, (n = 94).
Resource Valid
Responses
Median Mean Std
Dev
Mangroves 89 4 4.33 .70
Coral reefs 85 4 3.89 .99
Upland forests 43 3 3.44 .91
Seagrass 86 4 4.08 .74
Beach 91 4 4.12 .73
River/creeks 75 4 3.81 .85
Ground water 80 4 4.11 .80
*Each community resource is rated on a 5-point scale with the following options and corresponding
scores: VG – Very good (5);G – good (4); NGB – neither good nor bad (3); B – bad (2); and VB – very
bad (1)

41
Legend: 1- Mangroves; 2- Coral reefs; 3 - Upland forests; 4 - Seagrass; 5 - Beach;
6 - Spring; 7 - River/creeks; 8 - Ground water
Figure 3. Mean ratings of perceived resource conditions at Barangay Kamuning, Puerto Princesa
City, Philippines (n = 94).
3.3.7. Perceived Threats
Since community residents are usually the direct users of the resources, they are
presumed to be knowledgeable not only on the conditions of their resources but also their threats.
Hence, an open-ended question soliciting the threats on each of the community resource, as
perceived by them, was asked. Similar to the question on perceptions, there were respondents
who either answered “don’t know” or “not applicable”, indicating again a lack of knowledge
about the specific resource. These are mostly non-users or residents who live far from the
resource.
It is also noticeable that a sizeable number of residents answered “none” when they were
asked of the threats to the natural resources in their community, ranging from 9.6% (for
mangroves) to 58.3% (for springs) (Table 20 to Table 25). The preponderance of this response
could be interpreted in three ways - first, the resource may be well protected such that its threats
have been eliminated, second threats are non-existent, or, residents may believe in the
infiniteness of the resource and that there could never be any threat to its existence.

42
The enumeration of all perceived threats cited by the community residents for each
resource are provided in Table 20 to Table 25. These tables provide a comprehensive listing of
at most three perceived threats for each resource, classified as primary, secondary, or tertiary. If
any threat is cited as any 2 or 3 of the three levels of threats, the frequencies as a primary,
secondary, or tertiary threat are combined with the highest frequencies ranked to get at most five
top threats.
Despite the declaration of Palawan as a Mangrove Swamp and Forest Reserve in 1981, a
number of community residents still consider harvesting of mangrove trees for household or
commercial use and charcoal making as major threats to mangrove forests (Table 20). A
probable explanation for this is that although these activities are prohibited, they may have been
undertaken in the community on a continuing basis although sporadic and small in scale in
scope.
Table 20. Perceived threats to mangroves, Barangay Kamuning, Puerto Princesa City,
Philippines (n = 94)
Perceived Threat Primary Second Tertiary Combined Rank
None 9
(9.6)
29
(30.9)
84
(89.4)
Cutting for household use 39
(41.5)
15
(16.0)
2
(2.1)
56
(59.6)
1
Cutting for commercial use 30
(31.9)
1
(1.1)
1
(1.1)
32
(34.0)
2
Clearing 3
(3.2)
1
(1.1)
4
(4.3)
5
Charcoal making 2
(2.1)
17
(18.1)
3
(3.2)
22
(23.4)
3
Conversion into fish pond 1
(1.1)
1
(1.1)
2
(2.1)
7
Natural phenomenon
(typhoons, big waves)
1
(1.1)
1
(1.1)
2
(2.1)
8
Disease/infestation of
mangroves
1
(1.1)
4
(4.3)
5
(5.3)
4
Pollution/Dumping of garbage 3
(3.2)
3
(3.2)
6
Others 1
(1.1)
1
(1.1)
Don't know 8
(8.5)
22
(23.4)
3
(3.2)
Note: Figures enclosed in parentheses are the corresponding percentages for each category

43
With regard to coral reefs, residents cited the use of destructive fishing methods such as
cyanide/compressors and dynamites as two of the top three major threats to the resource.
Another threat cited, illegal fishing (ranked 2nd
major threat), may also be interpreted as referring
to these practices (Table 21). These responses indicate the residents’ heightened awareness of the
detrimental side effects of such fishing methods on coral reef conditions. To them, coral reef
destruction is related to fisheries rather than to natural phenomena such as typhoons, and climate
change –related concerns like coral bleaching, which were only cited as a primary threat by 6
(6.4%) of respondents.
Table 21. Perceived threats to coral reefs, Barangay Kamuning, Puerto Princesa City, Philippines
(n = 94)
Perceived Threat Primary Second Tertiary Combined Rank
None 15
(16.0)
29
(38.3)
85
(90.4)
Cyanide/compressor fishing 34
(36.2)
9
(9.6)
43
(45.7)
1
Illegal fishing 14
(14.9)
8
(8.6)
2
(2.1)
24
(25.5)
2
Dynamite/blast fishing 7
(7.4)
7
(7.4)
1
(1.1)
15
(16.0)
3
Coral gathering for
HH/commercial use
2
(2.1)
2
(2.1)
7
Coral bleaching 3
(3.2)
1
(1.1)
4
(4.3)
5.5
Natural phenomenon (typhoon,
waves)
3
(3.2)
1
(1.1)
4
(4.3)
4
Pollution/Dumping of garbage 3
(3.2)
1
(1.1)
4
(4.3)
5.5
Tourism related activities 1
(1.1)
1
(1.1)
8
Others 1
(1.1)
4
(4.3)
2
(2.1)
7
(7.4)
Don't know 14
(14.9)
29
(30.9)
4
(4.3)
Note: Figures enclosed in parentheses are the corresponding percentages for each category
Slash-and-burn farming (kaingin) is the most cited upland forest threat by residents in the
area (Table 22). There is a commercial logging ban in the whole province of Palawan, including

44
Puerto Princesa City, as provided by the Strategic Environment Plan for Palawan Law (RA
7611) that was enacted in 1992. Even as local and national government agencies work together
to implement this provision of the law, it seems that at the community level, residents still
practice kaingin farming which necessitates cutting of trees, usually secondary growth forests.
The second and third most cited threats are cutting of trees for household use and illegal logging,
which are usually fuelled by a strong demand for and high price of lumber/wood in Puerto
Princesa City.
Table 22. Perceived threats to upland forests, Barangay Kamuning, Puerto Princesa City,
Philippines (n = 94)
Perceived Threat Primary Second Tertiary Combined Rank
None 11
(11.7)
66
(70.2)
85
(90.4)
Charcoal making 1 (1.1) 5 (5.3) 6
(6.4)
4
Cutting trees for household
use
11
(1.7) 3 (3.2)
2
(2.1)
16
(17.0)
2
Illegal logging 4
(4.3) 3 (3.2)
2
(1.1)
9
(0.6)
3
Cutting trees for commercial
use
2
(2.1) 1 (1.1)
3
(3.2)
7
Conversion into residential
settlements
3
(3.2)
3
(3.2)
6
Kaingin/slash & burn farming 16
(17.0) 6 (6.4)
1
(1.1)
23
(24.5)
1
Natural phenomenon
(typhoons)
1
(1.1) 3 (3.2)
4
(2.3)
5
Not applicable 36
(38.3) 3 (3.2)
39
(41.5)
Don’t know 9
(9.6) 4 (4.3)
3
(3.2)
Note: Figures enclosed in parentheses are the corresponding percentages for each category
Though there were 32 (34.0%) “none” and 19 (20.2%) “don’t know” responses to
seagrass threats. The very few who answered cited fishing using dragnets/gleaning (combined %
of 17.0), and to a lesser extent - illegal fishing activities, natural phenomenon, and
pollution/dumping of garbage (Table 23) as threats to seagrass.
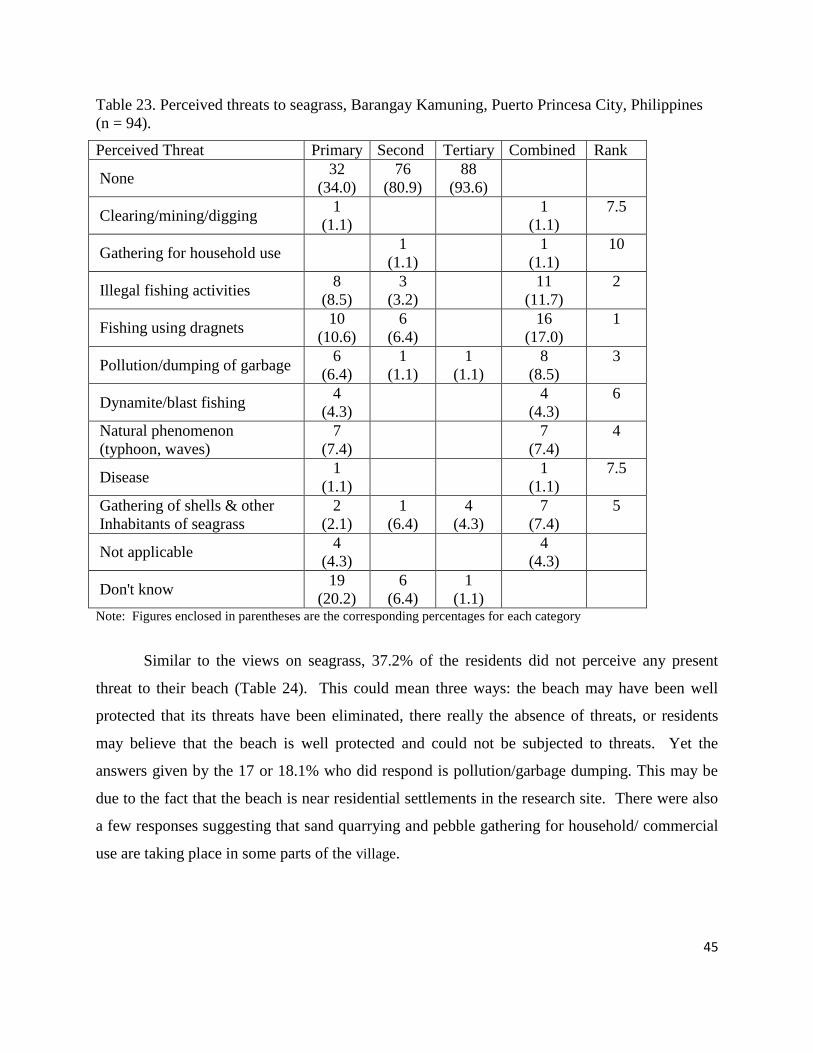
45
Table 23. Perceived threats to seagrass, Barangay Kamuning, Puerto Princesa City, Philippines
(n = 94).
Perceived Threat Primary Second Tertiary Combined Rank
None 32
(34.0)
76
(80.9)
88
(93.6)
Clearing/mining/digging 1
(1.1)
1
(1.1)
7.5
Gathering for household use 1
(1.1)
1
(1.1)
10
Illegal fishing activities 8
(8.5)
3
(3.2)
11
(11.7)
2
Fishing using dragnets 10
(10.6)
6
(6.4)
16
(17.0)
1
Pollution/dumping of garbage 6
(6.4)
1
(1.1)
1
(1.1)
8
(8.5)
3
Dynamite/blast fishing 4
(4.3)
4
(4.3)
6
Natural phenomenon
(typhoon, waves)
7
(7.4)
7
(7.4)
4
Disease 1
(1.1)
1
(1.1)
7.5
Gathering of shells & other
Inhabitants of seagrass
2
(2.1)
1
(6.4)
4
(4.3)
7
(7.4)
5
Not applicable 4
(4.3)
4
(4.3)
Don't know 19
(20.2)
6
(6.4)
1
(1.1)
Note: Figures enclosed in parentheses are the corresponding percentages for each category
Similar to the views on seagrass, 37.2% of the residents did not perceive any present
threat to their beach (Table 24). This could mean three ways: the beach may have been well
protected that its threats have been eliminated, there really the absence of threats, or residents
may believe that the beach is well protected and could not be subjected to threats. Yet the
answers given by the 17 or 18.1% who did respond is pollution/garbage dumping. This may be
due to the fact that the beach is near residential settlements in the research site. There were also
a few responses suggesting that sand quarrying and pebble gathering for household/ commercial
use are taking place in some parts of the village.

46
Table 24. Perceived threats to beach, Barangay Kamuning, Puerto Princesa City, Philippines
(n=94)
Perceived Threat Primary Second Tertiary Combined Rank
None 35
(37.2)
73
(77.7)
87
(92.6)
Sand quarrying for commercial
use
3
(3.2)
3
(3.2)
7
Pollution/dumping of garbage 17
(18.1)
6
(6.4)
1
(1.1)
24
(25.5)
1
Natural phenomenon (typhoons,
big waves)
8
(8.5)
2
(2.1)
1
(1.1)
11
(11.2)
2
Sand quarrying for household
use
6
(6.4)
2
(2.1)
1
(1.1)
8
(8.5)
3
Pebble/stone gathering for
household use
2
(2.1)
1
(1.1)
3
(3.2)
8
Soil erosion from the uplands 3
(3.2)
3
(3.2)
6
(6.4)
5
Residential area expansion 2
(2.1)
2
(2.3)
9
Beach erosion/sea level rise 5
(5.3)
1
(1.1)
6
(6.4)
4
Tourist-related & resort
development
1
(1.1)
3
(2.1)
4
(4.3)
6
Not applicable 3
(3.2)
3
(3.2)
Others 3
(3.2)
1
(1.1)
4
(4.3)
Don't know 6
(6.4)
3
(3.2)
4
(4.3)
Note: Figures enclosed in parentheses are the corresponding percentages for each category
It is noted that 34% of the respondents did not cite any perceived threat to their
river/creeks (Table 25). Other respondents, however, cited various threats to the resource, with
pollution/garbage dumping having the greatest frequency (13 or 13.8%). This was followed by
natural phenomena, such as typhoons and soil erosion from the uplands. The top two threats
cited for rivers/creeks were the same threats cited for ground water though the order was
reversed; natural phenomenon (13.8%) was the most cited threat instead of pollution/garbage
dumping (11.7%), as reflected in Table 26.

47
Table 25. Perceived threats to rivers/creeks, Barangay Kamuning, Puerto Princesa City,
Philippines, (n = 94)
Perceived Threat (Top Ten) 1st 2nd 3
rd Com-
bined
Rank
None 32
(34.0)
74
(78.7)
89
(94.7)
Pollution/dumping of garbage 13
(13.8)
30
(32.0)
43
(45.7)
1
Natural phenomenon (typhoons,
big waves)
9
(9.6)
2
(2.1)
1
(1.1)
12
(12.8)
2
Sand quarrying for commercial
use
4
(4.3)
4
(4.3)
4
Soil erosion from the uplands 4
(4.3)
4
(4.3)
8
(8.5)
3
Sand quarrying for household
use
1
(1.1)
2
(2.1)
1
(1.1)
4
(4.3)
5
Pebble/stone gathering for
household use
1
(1.1)
1
(1.1)
8.5
Sedimentation 2
(2.1)
1
(1.1)
3
(3.2)
6
Tourist- & resort-related
development
1
(1.1)
1
(1.1)
8.5
deforestation 2
(2.1)
2
(2.1)
7
Not applicable 11
(11.7)
5
(5.3)
16
(17.0)
Don't know 14
(14.9)
3
(3.2)
3
(3.2)
Note: Figures enclosed in parentheses are the corresponding percentages for each category

48
Table 26. Perceived threats to ground water, Barangay Kamuning, Puerto Princesa City,
Philippines (n = 94).
Perceived Threat Primary Second Tertiary Combined Rank
None 53
(56.4)
81
(86.2)
91
(96.8)
Natural phenomenon (typhoons) 10
(10.6)
3
(3.2)
13
(13.8)
1
Pollution/dumping of garbage1
9
(9.6)
2
(2.1)
11
(11.7)
2
Water contamination due to
sewage
2
(2.1)
1
(1.1)
3
(3.2)
3
Over-exploitation for household
use
1
(1.1)
1
(1.1)
5
Salt intrusion 1
(1.1)
1
(1.1)
5
Establishment/Expansion of
Human Settlements
1
(1.1)
1
(1.1)
5
Others 4
(4.3)
4
(4.3)
Not applicable 7
(7.4)
3
(3.2)
3
(3.2)
Don't know 6
(6.4)
4
(4.3)
3
(3.2)
7
(7.4)
Note: Figures enclosed in parentheses are the corresponding percentages for each category
Table 27 and Table 28 below provide a summary of the perceived resource threats by
listing in ranked order the most often cited threats for each resource. Some threats are common
to two or more resources, affirming that collectively, resources are interconnected and two or
more resources may be facing the same threat/s. A common threat to both mangroves and upland
forests relate to cutting of trees for timber (household/commercial use). Coral reefs are
endangered by the use of destructive fishing methods such as cyanide, dynamites, and
compressor, which can also be categorized as the same as illegal fishing activities, that threaten
seagrass. In addition to this, residents also cited that fishing using dragnets/gleaning and
pollution/dumping of garbage also threaten seagrass resources. Aside from sand quarrying that is
a threat to both spring and beach, water contamination and sedimentation are also identified by
respondents to damage springs. Sanitation issues, on the other hand - such as garbage dumping

49
and along with natural phenomenon - can also affect the good condition of the beach,
rivers/creeks, and groundwater.
Table 27. Top perceived threats to coastal resources, Barangay Kamuning, Puerto Princesa City,
Philippines, (n = 94).
Mangroves Coral Reefs Seagrass Beach
None – 9.6% None - 16.0% None –34.0% None – 37.2%
Don’t know/ not
applicable –
8.5%
Don’t know/ not
applicable – 14.9%
Don’t know/ not
applicable – 24.5%
Don’t know/ not
applicable – 9.6%
Cutting for
household use
Cyanide/compressor
fishing
Fishing using
dragnets/gleaning
Pollution/dumping of
garbage
Cutting for
commercial use Illegal fishing
Illegal fishing
activities
Natural phenomenon
(typhoons, big waves)
Charcoal making Dynamite/blast
fishing
Pollution/dumping of
garbage
Sand quarrying for
commercial/household
use
Beach erosion/sea level
rise
Table 28. Top perceived threats to non-coastal resources, Barangay Kamuning, Puerto Princesa
City, Philippines, (n = 94).
Upland Forests Springs Rivers/Creeks Ground Water
None – 11.7% None – 58.3% None – 34.0% None – 56.4%
Don’t know/ not
applicable –
47.9%
Don’t know –
30.4%
Don’t know/ not
applicable – 26.6%
Don’t know/ not
applicable – 13.8%
Kaingin/slash &
burn farming
Water
contamination
Pollution/dumping of
garbage
Natural
phenomenon
(typhoons)
Cutting trees for
household use Sand quarrying
Natural phenomenon
(typhoons, big
waves)
Pollution/dumping
of garbage
Illegal logging Sedimentation Soil erosion from the
uplands

50
3.3.8. Awareness of Rules and Regulations
Most residents are aware of the rules and regulations on fishing (86.2%) and mangroves
(86.4%) (Table 29). Many are less aware of rules and regulations on other resources and or
development endeavors of these resources include aquaculture development (35.1%),
Resort/pension/hotel development (37.2), residential development (27.7%), pebble gathering
(38.3%), and residential development (27.7%), and marine transportation (22.3%).Very few
expressed awareness of rules and regulations on other forms of resource use/activity like water
sports, recreational climbing/trekking, and tourist transportation. Such responses suggest that
these are absent in the area or if present are concerns that do not impinge on their daily economic
or social lives as evidenced by the large frequencies on “not applicable” and “don’t know”.
Table 29. Awareness of resource rules and regulations, Barangay Kamuning, Puerto Princesa
City, Philippines, (n = 94)
Resource Used/ Activity Awareness of Rules &
Regulations
Origin of Regulation
None Yes Don’t
Know
Not
Apply
Brgy Mun/
City
Prov Natl
Fishing 4
(4.3)
81
(86.2)
9
(9.6)
- 17
(21.0)
51
(63.0)
1
(1.2)
12
(14.8)
Mangroves 6
(6.4)
81
(86.2)
7
(7.4)
- 22
(27.2)
45
(55.6)
2
(2.5)
12
(14.8)
Aquaculture 22
(23.4)
33
(35.1)
35
(37.2)
- 9
(27.3)
21
(63.6)
3
(9.1)
Resort/pension/hotel
development
19
(20.2)
35
(37.2)
36
(38.3)
4
(4.3)
8
(22.9)
20
(57.1)
2
(5.7)
5
(24.3)
Residential development 22
(23.4)
26
(27.7)
44
(46.8)
2
(2.1)
7
(26.1)
17
(65.4)
1
(3.8)
1
(3.8)
Watersports 15
(16.0)
3
(3.2)
54
(57.4)
21
(22.3)
1
(33.3)
2
(66.7)
Recreational
climb/trek/camp
17
(18.1)
5
(5.3)
54
(57.4)
18
(19.1)
3
(60.0)
2
(40.0)
Pebble gathering 18
(19.1)
36
(38.3)
33
(35.1)
7
(7.4)
15
(41.7)
20
(55.6)
1
(2.8)
Tourist transportation 18
(19.1)
6
(6.4)
52
(55.3)
18
(19.1)
5
(83.3)
1
(16.7)
Marine transportation 17
(18.1)
21
(22.3)
41
(43.6)
15
(16.0)
11
(52.4)
10
(47.6)
Note: Figures enclosed in parentheses are the corresponding percentages for each category.

51
It appears that more of the known resource rules and regulations come primarily from the
City government of Puerto Princesa and secondarily from the Barangay Council of Kamuning as
attributed by the residents themselves. There were very few who said that the resource rules and
regulations they are aware of were enacted at the provincial or national levels.
3.3.9. Participation in Decision Making
Because coastal management is usually a community effort entailing high engagement
among residents, they were asked to rate their current and desired levels of participation in
decision making on each resource activity. A 5-point scale was used with “no participation”
scored as 1 and “full participation” scored as 5. The earlier observed trend that people are
concerned only with resources that they use or resource development that impinge on their daily
lives is again confirmed as shown in the more than 50% frequencies of “not applicable” in all
items except those concerns for fishing, mangroves, aquaculture, resort/pension house
development, residential development, and pebble gathering (Table 30). This is especially true
considering the coastal community focus of this study.
Table 30. Current and desired levels of participation in decision making, Barangay Kamuning,
Puerto Princesa City, Philippines, (n = 94).
Activity Rating Scores* Not applicable
1 2 3 4 5
Fishing Current 30
(31.9)
5
(5.3)
10
(10.6)
10
(10.6)
30
(31.9)
9
(9.6)
Desired 17
(18.1)
4
(4.3)
19
(20.2)
17
(18.1)
27
(27)
10
(10.6)
Mangroves Current 28
(29.8)
7
(7.4)
8
(8.5)
9
(9.6)
34
(36.9)
8
(8.5)
Desired 15
(16)
7
(7.4)
17
(18.1)
14
(14.9)
26
(27.7)
15
(16)
Aquaculture Current 32
(34)
5
(5.3)
3
(3.2)
2
(2.1)
13
(13.8)
39
(4.5)
Desired 33
(35.1)
4
(4.3)
11
(11.7)
8
(8.5)
12
(12.8)
26
(27.7)
Resort/pension/
hotel
Current 40
(42.6)
2
(2.1)
6
(6.4)
2
(2.1)
6
(6.4)
38
(40.4)

52
Activity Rating Scores* Not applicable
1 2 3 4 5
development Desired 36
(38.3)
6
(6.4)
5
(5.3)
4
(4.3)
7
(7.4)
36
(38.3)
Residential
development
Current 35
(37.2)
3
(3.2)
7
(7.4)
4
(4.3)
2
(2.1)
43
(45.7)
Desired 31
(33)
4
(4.3)
10
(10.6)
5
(5.3)
7
(7.4)
37
(39.4)
Watersports Current 21
(22.3)
1
(1.1)
- - 2
(2.1)
69
(73.4)
Desired 36
(38.3)
2
(2.1)
1
(1.1)
2
(2.1)
4
(4.3)
49
(52.1)
Recreational
climb/trek/
Camp
Current 19
(20.2)
- 2
(2.9)
- 1
(1.1)
72
(76.6)
Desired 34
(36.2)
2
(2.1)
3
(3.2)
2
(2.1)
3
(3.2)
50
(53.2)
Pebble
gathering
Current 35
(37.2)
1
(1.1)
9
(9.6)
5
(5.3)
9
(.6)
35
(37.2)
Desired
23
(24.5)
3
(3.2)
13
(13.8)
7
(7.4)
12
(12.8)
36
(38.3)
Tourist
transportation
Current 22
(23.4)
- - - 2
(2.1)
70
(74.5)
Desired 32
(34)
2
(2.1)
1
(1.1)
6
(6.4)
6
(6.4)
47
(50)
Marine
transportation
Current 23
(24.5)
2
(2.1)
6
(6.4)
3
(3.2)
7
(7.4)
53
(56.4)
Desired 30
(31.9)
1
(1.1)
2
(2.1)
4
(4.3)
10
(10.6)
47
(50) Note: Rating is on a scale of 1 – 5, with 1- no participation, and 5 – full participation
The current levels of participation in decision making for four out of six resources/
activities are quite low though, with the bulk of frequencies at “no participation.” These relate to
aquaculture, resort/pension house development, residential development, and pebble gathering.
The highest mean rating is 3.2 for mangroves, followed by 3.1 for fishing (Table 31). This is
indicative that though respondents participate in decision-making, only a few rated themselves
to be participating above the “neutral” to “very high” levels in decision making for the said
activities. These results may be cultural to Filipinos, where decision making is traditionally left
to the discretion of leaders, who are viewed to have the authority and responsibility vested upon
them because of their positions of power.

53
Table 31. Means and standard deviations of ratings of participation in decision making,
Barangay Kamuning, Puerto Princesa City, Philippines, (n = 94)
Resource Used/ Activity Current Level of Participation Desired Level of
Participation
N Mean Std Dev N Mean Std Dev
Fishing 85 3.1 1.7 84 3.4 1.5
Mangroves 86 3.2 1.8 79 3.4 1.5
Aquaculture 55 2.3 1.7 68 2.4 1.6
Resort/pension/hotel
development
56 1.8 1.4 58 2.0 1.5
Residential development 51 1.7 1.2 57 2.2 1.5
Watersports 24 1.4 1.1 45 1.2 1.3
Recreational climb/trek/camp 22 1.4 1.0 44 1.6 1.2
Pebble gathering 59 2.2 1.6 58 2.7 1.6
Tourist transportation 24 1.3 1.1 47 2.0 1.6
Marine transportation 41 2.2 1.6 47 2.2 1.7
Others 11 1.9 1.4 31 1.4 1.0
It can be observed though, that the residents’ responses as to their desired levels of
participation can be an indication of a starting shift from a passive to a more active involvement
in decision–making. In comparison with the current and desired levels of participation in
decision making, there were fewer responses of 1/2 and more of 3/4/5 in the desired level of
participation than that of current participation levels. These values indicate a greater desire to
participate among residents. As reflected in the higher mean ratings for desired levels which are
significantly different from their current levels of participation (Table 31), there appears to be a
one-to-one correspondence of residents’ current and desired levels of participation. The study
shows that their desired levels of participation are higher than their current levels in almost all
resources, and these differences are statistically significant (Table 32). Hence, there is still an
opportunity for village leaders to tap and seek greater participation from their constituents since
community members generally have a greater desire to be more active in the present and future
community undertakings and endeavors.
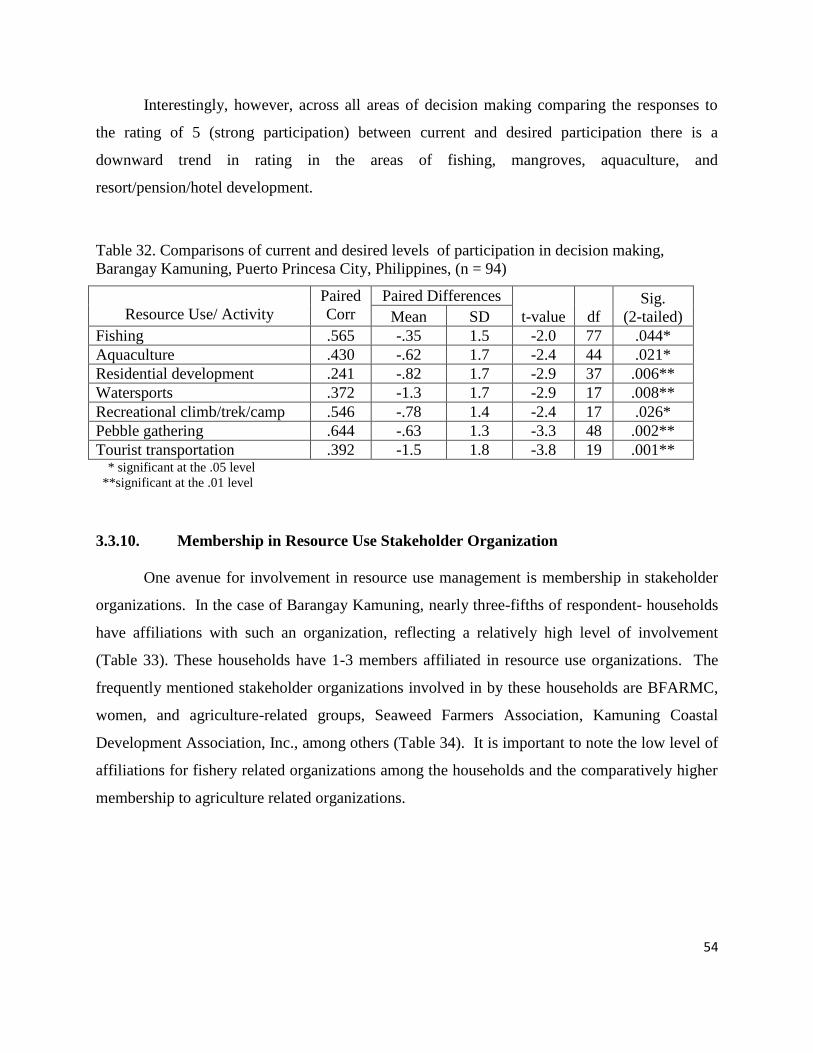
54
Interestingly, however, across all areas of decision making comparing the responses to
the rating of 5 (strong participation) between current and desired participation there is a
downward trend in rating in the areas of fishing, mangroves, aquaculture, and
resort/pension/hotel development.
Table 32. Comparisons of current and desired levels of participation in decision making,
Barangay Kamuning, Puerto Princesa City, Philippines, (n = 94)
Resource Use/ Activity
Paired
Corr
Paired Differences
t-value df
Sig.
(2-tailed) Mean SD
Fishing .565 -.35 1.5 -2.0 77 .044*
Aquaculture .430 -.62 1.7 -2.4 44 .021*
Residential development .241 -.82 1.7 -2.9 37 .006**
Watersports .372 -1.3 1.7 -2.9 17 .008**
Recreational climb/trek/camp .546 -.78 1.4 -2.4 17 .026*
Pebble gathering .644 -.63 1.3 -3.3 48 .002**
Tourist transportation .392 -1.5 1.8 -3.8 19 .001** * significant at the .05 level
**significant at the .01 level
3.3.10. Membership in Resource Use Stakeholder Organization
One avenue for involvement in resource use management is membership in stakeholder
organizations. In the case of Barangay Kamuning, nearly three-fifths of respondent- households
have affiliations with such an organization, reflecting a relatively high level of involvement
(Table 33). These households have 1-3 members affiliated in resource use organizations. The
frequently mentioned stakeholder organizations involved in by these households are BFARMC,
women, and agriculture-related groups, Seaweed Farmers Association, Kamuning Coastal
Development Association, Inc., among others (Table 34). It is important to note the low level of
affiliations for fishery related organizations among the households and the comparatively higher
membership to agriculture related organizations.

55
Table 33. Household membership in resource use stakeholder organizations, Barangay
Kamuning, Puerto Princesa City, Philippines (n = 94).
No. of HH members Involved Freq %
None 40 42.6
1 37 39.4
2 15 16.0
3 3 2.1
Table 34. Membership in resource use stakeholder organizations, Barangay Kamuning, Puerto
Princesa City, Philippines (n = 94).
Resource use stakeholder organization No. %
None 40 42.6
BFARMC 4 4.3
Women’s associations (CSWD, CWA) 15 15.9
Kamuning Coastal Development Association, Inc (KCDAI) 4 4.3
Kamuning Seaweed Farmer Association 2 2.1
Barangay Kamuning Action Group 2 2.1
Agriculture –related (Coconut Farmers, Farmers Group) 21 22.3
Others 6 6.9
3.3.11. Perceived Coastal Management Problems and Solutions
About 6 out of every 10 household informants provided answers on perceived coastal
management problems. The often cited coastal management problem by those who gave at least
one answer (a maximum of two problems were solicited) were those related to illegal fishing
methods, sanitation, and governance on enforcement-related concerns. Specific problems under
each of these categories are enumerated in Table 35. It can thus be inferred that there are
concerted efforts from different government agencies to stop destructive fishing methods through
regulation and enforcement. Nonetheless, such efforts are inadequate and prohibited practices are
still continuing.

56
Table 35. Perceived coastal management problems, Barangay Kamuning, Puerto Princesa City,
Philippines (n = 94).
Coastal Management Problems Problem 1 Problem 2 Combined
No. % No. % No. %
Livelihood related to coastal
resource utilization
4 4.26 1 1.06 5 5.3
Mangrove cutting 4 4.26 1 1.06 5 5.3
Natural calamities 4 4.26 4 4.3
Over-exploitation of coastal
resource for HH/commercial use/
Decrease in fish catch or available
coastal resources
3 3.19 4 4.26 7 7.4
Sanitation (ie., pollution and
garbage dumping, waste
management)
8 8.51 6 6.38 14 14.9
Illegal fishing methods (ie., use of
cyanide in fishing, use of
compressor units, use of fine mesh
nets, use of other illegal fishing
gears) 14
14.89 4 4.26 18 19.2
Illegal logging 1 1.06 1 1.1
Inadequate water supply 1 1.06 1 1.06 2 2.1
Resource competition/ use conflicts
(ie., Prohibition on fish corrals
establishment, Land tenure and
tenurial agreements)
4 4.26 4 4.26 8 8.5
Governance – Enforcement (ie.,
registration and permits for fishing
livelihood, No regular monitoring,
Inadequate trainings on coastal
management )
8 8.51 4 4.26 12 12.8
Food Security (ie., fish catch is
sold outside of the village)
1 1.06 1 1.1
Other 4 4.26 2 2.13 6 6.4
Subtotal 56 59.57
No response/missing 11 11.70
Don’t know 21 22.34
None 6 6.38
Total 94 100.00

57
Whenever a problem is raised, a follow up question was asked to solicit what the
respondent perceives to be the corresponding solution/s wherein at most two solutions may be
given. Though about 80 (79.9%) failed to forward solutions, the 19 (20.2%) who were able to
offer specific suggested solutions to either of the two problems cited (Table 36). Those that were
related were lumped together and categorized according to commonalities of concerns. When
grouped according to governance concerns, most of the suggested solutions focused on
enforcement (ie., of rules and laws on fishery, waste management, and the protection and
conservation of coastal and natural resources). This was succeeded by suggested solutions
focused on enhancing educational awareness by conducting orientations and pertaining to policy
on fisheries. The other category of often cited coastal management problem solution pertained to
social services delivery and livelihoods assistance. A comparison of the top most coastal
management problems and solutions perceived by the residents is provided in Table 37.
Table 36. Perceived solutions to coastal management problems, Barangay Kamuning, Puerto
Princesa City, Philippines (n = 94).
Coastal Management Problems Solutions Problem 1 Problem 2 Combined
No. % No. % No. %
Community Mobilization (ie., conduct coastal
clean-ups, report coastal management related
incidents to the village government)
3 3.2 3 3.2
Social services and livelihoods assistance (ie.,
Provide financial assistance for farm inputs,
Financial assistance for livestock project,
Financial assistance for livelihood projects
4 4.3 4 4.3
Governance- Policy (ie., Establish MPA,
regulate volume and not sell all fish catch to
the city proper)
2 2.1 2 2.1
Governance- Logistical Support (ie., Seek
government support for infrastructure
projects like roads)
1 1.1 1 1.1
Governance- Educational Awareness (ie.,
Conduct policy dissemination and orientation
on fishery laws)
3 3.2 1.0 1.1 4 4.3
Governance- Enforcement- (ie., Consistently
implement and strictly monitor of coastal
management activities, Consistent and strict
implementation of fishery laws, Implement
RA 9003 and impose penalty, Protect
3 3.2 5.0 5.3 8 8.5
)

58
Coastal Management Problems Solutions Problem 1 Problem 2 Combined
No. % No. % No. %
mangrove forests)
Others- Conduct research to control siltation 3 3.2 3 3.2
Subtotal 19 20.2 6.0
No response 74 78.7 74.0
None 1 1.1 14.0
Total 94 100.0 94.0
Table 37. Top perceived coastal management problems and solutions, Kamuning, Puerto
Princesa City, Philippines, (n = 94)
Coastal Management Problems Coastal Management Problems Solutions
None- 6.4%
Don’t Know/Not concerned/ No answer-34.0
With answer- 59.6%
None- 1.1%
Don’t Know/Not concerned/ No answer-78.8 %
With answer- 20.2%
Illegal fishing methods (ie., use of cyanide in
fishing, use of compressor units, use of fine mesh
nets, use of other illegal fishing gears)
Sanitation (ie., pollution and garbage dumping,
waste management)
Governance-Enforcement (ie., registration and
permits for fishing livelihood, No regular
monitoring, Inadequate trainings on coastal
management )
Governance- Enforcement- (ie., Consistently
implement and strictly monitor of coastal
management activities, Consistent and strict
implementation of fishery laws, Implement RA
9003 and impose penalty, Protect mangrove forests
Governance- Educational Awareness (ie., Conduct
policy dissemination and orientation on fishery
laws)
Social services and livelihoods assistance (ie.,
Provide financial assistance for farm inputs,
Financial assistance for livestock project, Financial
assistance for livelihood projects
3.3.12. Successes and Challenges in Coastal Management
Though only about half was able to enumerate one or two things in the community that
they considered as successful with respect to coastal management, there is a general agreement
among those who did respond that mangrove reforestation is a success in coastal management in
the village (Table 38). This is complemented by the active community participation in many
village activities like coastal cleanups and cleanliness drives, as well as other environmental
protection events like Pista ng Karagatan. Another hailed success area by those who replied is

59
governance on enforcement of certain fishery laws, prohibition of resource-destructive and
resource-depletive activities.
Table 38. Perceived successes in coastal management, Barangay Kamuning, Puerto Princesa
City, Philippines (n = 94).
Coastal Management Success Success1 Success 2 Combined
No. % No. % No. %
Community Mobilization (ie.,
Participation of community in Coastal
Clean-up drives, village cleanliness or
Oplan Linis, participation in Pista ng
Karagatan)
14 14.9 9 9.6 23 24.5
Governance- Administration (ie., Active
Bantay Dagat, Organized BFARMC 2 2.1 2 2.1 4 4.3
Governance- Policy (ie., Proposed marine
sanctuary, Controlling the setup of big fish
corrals or designate zone for fish corrals)
1 1.1 1 1.1 2 2.1
Mangrove reforestation 22 23.4 7 7.4 29 30.8
Governance- Enforcement (ie.,
Implementing regulations re illegal
fishing, Regulations on transient fishers,
Strict implementation of prohibition on
sand quarrying, Fishery/ fishing
registration permit, enforcement of
Ecowaste management)
4 4.3 6 6.4 10 10.6
Subtotal 43 45.7 25 26.6
None 6 6.4
Don't know 28 29.8
No response 17 18.1
Total 94 100.0
It seems that most residents find it difficult to pinpoint challenges to coastal resource
management in their community as 7.4% said “none” and 60.7% provided no response or
answered “don’t know”, while only 31.9% mentioned a challenge (Table 39). The multifaceted
dimensions of coastal resource management are highlighted in the responses of residents. The
challenges cited are almost similar to the coastal management problems, but are focused on
governance pertaining to enforcement and logistical matters, in addition to the challenge of

60
conserving and protecting the coastal resources. Table 40 summarizes the perceptions of the
residents as to the village’s successes and challenges in coastal management.
Table 39. Perceived challenges in coastal management, Barangay Kamuning, Puerto Princesa
City, Philippines (n = 94).
Challenges in Coastal Management Challenge 1 Challenge 2 Combined
No. % No. % No. %
Community mobilization (Sustaining
the interest and participation of local
community members to community
projects)
4.0 4.3 1.0 1.1 5.0 5.3
Beautification and cleanliness of the
beach and its surroundings (Sustaining
Coastal Cleanup drives)
5.0 5.3
5.0 5.3
Conservation and protection of
resources (Continuing and sustaining
mangrove reforestation, Establishment
of MPA, sustaining coastal resource
management activities)
5.0 5.3 2.0 2.1 7.0 7.4
Governance: Enforcement (Controlling
illegal fishing incidents, Implementation
of fishery laws, regulations on transient
fishers)
10.0 10.6 2.0 2.1 12.0 12.8
Governance: Policy (Proposed
designation of a zone or ground for fish
corrals)
1.0 1.1
1.0 1.1
Governance: Logistics (Lack of
patrolling equipment for coastal
monitoring and management, Sustaining
community development programs,
Enhancing coastal monitoring activities)
5.0 5.3 5.0 5.3 10.0 10.6
Alternative livelihoods solutions
1.0 1.1 1.0 1.1
Subtotal 30.0 31.9
No response 17.0 18.1
None 7.0 7.4
Don't know 40.0 42.6
Total 94.0 100.0

61
Table 40. Top perceived coastal management successes and challenges, Barangay Kamuning,
Puerto Princesa City, Philippines (n = 94).
Coastal Management Successes Coastal Management Challenges
None- 6.4%
Don’t Know/Not concerned/ No answer-
47.9%
With answer-45.7%
None- 7.4%
Don’t Know/Not concerned/ No answer- 60.7%
With answer- 31.9%
1. Mangrove reforestation
2. Community Mobilization (ie.,
Participation of community in Coastal
Cleanup drives, village cleanliness or
Oplan Linis, participation in Pista ng
Karagatan)
3. Governance- Enforcement (ie.,
Implementing regulations re: illegal
fishing, Regulations on transient fishers,
Strict implementation of prohibition on
sand quarrying, Fishery/ fishing
registration permit, enforcement of
Ecowaste management)
1. Governance Enforcement (ie., Controlling
illegal fishing incidents, Implementation of
fishery laws, regulations on transient
fishers)
2. Governance- Logistics (ie., Lack of
patrolling equipment for coastal monitoring
and management, Sustaining community
development programs, Enhancing coastal
monitoring activities)
3. Conservation and protection of resources
(ie., Continuing and sustaining mangrove
reforestation, Establishment of MPA,
sustaining coastal resource management
activities, )
3.3.13. Perceived Community Problems and Solutions to Community Problems
In comparison to eliciting the perceived coastal management problems and challenges,
there seems to be more residents who are able to cite community problems, and provide
suggested solutions indicating a greater sense of community awareness. The village’s feeder
roads are dirt/gravel roads, with no access roads within its inner sitios. There is also water
shortage for agricultural and household uses. It is not surprising, therefore, that bulk of the
responses pinpointed to infrastructure (Table 41). Other top problems pertained to electrification
and the lack of livelihood alternatives/opportunities. Specific community problems cited by
respondents are listed in Table 42.

62
Table 41. Perceived community problems, Barangay Kamuning, Puerto Princesa City,
Philippines, (n = 94).
Community Problem Problem 1 Problem 2 Combined
No. % No. % No. %
Poverty 4.0 4.3 1.0 1.1 5.0 5.3
Improve Infrastructure: Bad road
conditions, and farm to market roads,
Cemetery, Lack of supply of water for
domestic and agricultural use
14.0 14.9 12.0 12.8 26.0 27.7
Provision of electricity and power: provide
street lights
5.0 5.3 3.0 3.2 8.0 8.5
Flooding (Natural phenomenon) 1.0 1.1 1.0 1.1
Agriculture development : Pests that
destroy rice plant and coconut, Low prices
of produce
4.0 4.3 1.0 1.1 5.0 5.3
Lack of alternative livelihoods 4.0 4.3 4.0 4.3 8.0 8.5
Declining number of community people
participating in community activities
4.0 4.3 4.0 4.3
Cleanliness and proper waste segregation,
Poor sanitation / lack of comfort rooms
1.0 1.1 1.0 1.1
Limited access to credit facilities or sources 1.0 1.1 1.0 1.1
Social services (ie., Need to substantiate
healthcare system, activities for youth
because many young people are out of
school)
2.0 2.0 2.1 4.0 4.3
Others: Noise of rice mills, Drunkards 4.0 2.0 2.1 6.0 6.4
Subtotal 43.0 45.7 26.0 27.7
No response 32.0 34.0 40.0 42.6
Don’t know 17.0 18.1 23.0 24.5
None 2.0 2.1 5.0 5.3
Total 94.0 100.0 94.0 100.0
As solutions to the identified community problems, respondents enumerated 16 specific
suggestions corresponding to problems that are classified into seven broad categories. These
categories are: (1) infrastructure development, (2) enhancement of the delivery of social services,
(3) fund allocation and management, (4) livelihood assistance (5) community mobilization, (6)
social control, and (7) governance on policy (Table 42). Among these categories, the top three
broad solutions are: (1) infrastructure development, which, according to residents, includes the

63
repair and concreting of village roads, construction of drainage systems, cemetery, and
electrification; (2) livelihoods assistance for farmers in terms of irrigation, trainings, and
assistance in seeking buyers for products; and, (3) community mobilization that focuses on
strengthening community participation in village coastal resource management activities, as well
as in decision–making participation. The latter corroborates with the previous findings that
residents desire a higher level of participation in decision making especially if these concerns are
related to the management of coastal resources. Generally, there is a congruence between the
residents’ perceived community problems and solutions (Table 43).
Table 42. Perceived solutions to community problems, Barangay Kamuning, Puerto Princesa
City, Philippines (n = 94).
Community Problems Solutions Problem 1 Problem 2 Combined
No. % No. % No. %
Infrastructure development: Concreting and repair of roads,
drainage system construction, allot funds for village
cemetery, resolution for electricity and power including
street lights
26.0 27.7 3.0 3.2 29.0 30.8
Enhancement of social services: Increase dissemination of
health programs an family planning, intensify barangay
health programs
3.0 3.2 2.0 2.1 5.0 5.3
Fund allocation and management : More financial
assistance from the government to support community
projects, Allocate sufficient funds for community projects
2.0 2.1 1.0 1.1 3.0 5.3
Social control: Implement curfew hours 1.0 1.1
1.0 1.1
Livelihoods assistance: Provide assistance for agriculture
and irrigation, Regular market and buyers for produce and
catch, Provide livelihood trainings
8.0 8.5 5.0 5.3 13.0 13.8
Governance Policy: Establish a fish sanctuary 2.0 2.1
2.0 2.1
Community mobilization: Strengthen community
participation in community activities including coastal
management projects decision making in cooperation with
village officials, Encourage community members to
participate in village activities
6.0 5.4
6.0 6.4
Subtotal 48.0 51.1 11.0 11.7
None 5.0 5.3 9.0 9.6
Don’t know 23.0 24.5 25.0 26.6
No response 18.0 19.1 49.0 52.1
TOTAL 94.0 100.0 94.0 100.0

64
Table 43. Top perceived community problems and solutions, Barangay Kamuning, Puerto
Princesa City, Philippines.
Community Problems Community Problems Solutions
None-2.1%
Don’t Know/Not concerned/ No answer-52.1%
With answer- 45.7%
None- 5.3%
Don’t Know/Not concerned/ No answer- 43.6%
With answer- 51.1%
1. Infrastructure: Bad road conditions, and
farm to market roads, Cemetery, Lack of
supply of water for domestic and
agricultural use
2. Provision of electricity and power:
provide street lights
3. Lack of alternative livelihoods
1. Infrastructure development: Concreting and
repair of roads, drainage system
construction, allot funds for village
cemetery, resolution for electricity and
power including street lights
2. Livelihoods assistance: Provide assistance
for agriculture and irrigation, Regular
market and buyers for produce and catch,
Provide livelihood trainings
3. Community mobilization: Strengthen
community participation in community
activities including coastal management
projects decision making in cooperation
with village officials, Encourage
community members to participate in
village activities
3.3.14. Governance
The community also recognizes the existence of the management body that governs the
monitoring and surveillance of the coastal activities and fishing activities in the community.
BFARMC, Fisherfolk Associations and Bantay Dagat are the management bodies that were
identified by the respondents. These bodies are associated by the residents to be legitimate
groups with formal institutional arrangement as well as relevant rules and regulations. However,
fisherfolk associations were said to have no management plan. The key informants interviewed
do not know of any coastal management plan formulated by these organizations.
In terms of number of personnel and staff, only BFARMC was pointed to have personnel
who work to monitor coastal activities. Though it was mentioned that more than 150 officers and
members were involved in BFARMC, only 4.3% of the households actually count themselves as
members of the BFARMC (Table 34). The rest of the other groups’ memberships were unknown.
These management bodies were said to have no regular fund allocations.

65
Regarding stakeholder participation, five stakeholder groups were also identified by the
community. These are Bantay Dagat, Fisher and Farmer Associations, Businessman Association
and the Indigenous People’s group. According to informants, these groups participate in the
decision making concerning coastal and marine activities management. The KCDAI,
Sangguniang Kabataan (SK), Senior Citizen Organization (SCO), and the Community Women
Association (CWA) were mentioned to belong to the formal community organizations. On the
other hand, BFARMC, SK, SCO, Tribal Group and CWA were cited to influence both coastal
management and community issues.
3.4. Recommendations
From these findings, the following specific recommendations are enumerated:
1. Verify the bio-physical status of the resources in the village to validate the
residents’ perceptions with regard to the conditions of their coastal and non-coastal
resources.
2. Develop a community-based monitoring and enforcement initiative that is linked
with the existing city-wide Bantay Puerto to determine if the threats cited are still
continuing up to the present and in order to take the necessary actions to mitigate
and/or eliminate the threats.
3. Explore value adding, alternative and/or supplemental village-based livelihood
projects that would allow community residents to become entrepreneurs and/or self-
employed.. The assistance should not only be limited to training and capital support
but must also include marketing support such as the formation of marketing
cooperatives to gain market power and realize fair market price for the local
produce including fishery products. Fishers are already experiencing decreasing fish
catch; therefore, it is important to explore and tap economic opportunities beyond
fisheries.
4. Train and promote household financial accounting to foster prudent use of their
income.

66
5. Undertake wider dissemination of information on environment and natural
resources with emphasis on its ecological values and relationships including the
lesser appreciated resources such as the seagrass, beach, and river/estuarine
ecosystems, and environmental rules and regulations not only to the resource users
but to the community at large to foster wider participation of community members
in resource management and development. This is because awareness of resource
rules and regulations are mostly limited to the actual resource users.
6. Strengthen local organizations in terms of encouraging wider and active
participation of members in resource management and sustainable financing.
Organize and/or strengthen agriculture-related stakeholder organizations so that
more farmers may get involved in communal decision making. While there is
already a BFARMC, Barangay Kamuning is a combined farming-fishing
community.
7. Link community enforcement initiatives to city-wide Bantay Dagat and Gubat
taking lessons from the province-wide enforcement system being implemented by
the PCSD. Though the BFARMC and Bantay Dagat members are deputized to
apprehend offenders, they hesitate to do so because of the attendant risks to their
lives.
8. Develop policy and management options on coastal/marine resource use that may
include: designation of fish corral (baklad) zones; limitations on the use of specific
fishing methods; close and open system; and mobile registration of boats in the
village. There is an emerging consensus among residents that the focus of
governance with respect to policy formulation is more on regulation rather than
restriction. These should be supported by studies from support institutions
especially the local research and academic institutions.
9. Develop and implement community-based systems to support national, provincial,
city, and village policies and projects to include Solid Waste Projects (i.e. coastal
clean-ups, waste segregation programs, etc.) Fishery and Forestry Code, Strategic
Environmental Plan for Palawan Act, CLUP and Environmental Code of the City.

67
10. Establish more basic infrastructure facilities that could in turn spur economic
development. Such infrastructure may include feeder roads to the inner sitios of the
village.
11. Rationalize the issue of power. Electricity is already available to the village; hence,
there is a clamor for more street lights. Furthermore, some households seem unable
to pay for the attendant expenses in order to connect to Palawan Electric
Cooperative (PALECO), the electricity provider in the area. The village may
therefore serve as a conduit to help the households negotiate with PALECO so that
some compromise may be arranged for them to be able to tap electricity and pay the
initial costs, like doing so on an instalment basis.
12. The same baseline be undertaken in the future. Because the data presented herein
were collected in order to establish baseline conditions at Barangay Kamuning, it is
also recommended that a similar undertaking be conducted three or five years hence
in order to monitor changes and trends, if any.

68
3.5. Bibliography
Bunce L, Pomeroy R.S. 2000 Socioeconomic monitoring guidelines for coastal managers in
southeast Asia: SocMon SEA. World Commission on Protected Areas and Australian
Institute of Marine Science, Australia.
Bunce L, Townsley P, Pomeroy R, Pollnac R. 2003. Socioeconomic manual for coral reef
management. Australian Institute of Marine Science, Australia.
City Government of Puerto Princesa. 2007. Socioeconomic and Physical Profile. Puerto Princesa
City, Palawan.
City Government of Puerto Princesa. 2009. Community Based Monitoring System Database.
Puerto Princesa City, Palawan.
City Government of Puerto Princesa. 2012. Annual Executive Budget. Puerto Princesa City,
Palawan.
Department of Interior and Local Government. 2009. Barangay Profile of Barangay Inagawan. 2
pp. Puerto Princesa City, Palawan.
City Agriculture Office. 2009. Coastal Resource Management Plan of Barangay Inagawan. 9pp.
Puerto Princesa City, Palawan.
City Agriculture Office. 2012. Master List of Fishermen Database. Puerto Princesa City,
Palawan.

69
3.6 Appendices
Appendix 1. Commonly used fishing gears, Barangay Kamuning, Puerto Princesa City,
Palawan, Philippines
English Name Local Name
Gill net Panti
Gillnet, modified with scaring
device Panti
Hook and line, bottom set Kitang
Hook and line, common Kawil
Squid jigger Ganti-ganti
Fish corral Baklad
Reef flat gleaning Panginginas

70
Appendix 2. Common names and equivalent local names of commonly caught marine species,
Barangay Kamuning, Puerto Princesa City, Palawan, Philippines
Common Name Local Name
FINFISHES
Emperor fish Anupeng
Frigate mackerel Tulingan
Garfish Balo
Grouper Lapu-lapu
Jack Talakitok
Mackerel Burao
Milkfish Bangus
Mullet Banak
Parrotfish/ Busalog
Rabbitfish Danggit, samaral
Sardine Tamban
Snapper Maya-maya
Silverspot squirrelfish/ Red Bigeye/ redeye/ longfinned bullseye Siga
Sole fish Tampal-puke
Squid Pusit
Threadfin bream Bisugo
Trevally Salay-salay, Kalapato
"Unkown" Budo
"Unknown" Darag
SHELLFISHES
Arc clam Bakalan
Jumping shells (Little bear conch) Sikad-sikad
Marsh clam Kibao
Seasnail (small) Suso
Seasnail (big) Balelit
Spider shell Saang
"Unknown" Kaladuga
CRUSTACEAN
Mudcrab Alimango
Prawn Sugpo
ECHINODERM
Sea Urchin Tirik
WORM
Mangrove worm Tamilok
SEAWEED
Seagrapes Lato

71
This document may be cited as:
PSU-CGPP-PCSDS (Palawan State University-City Government of Puerto Princesa-Palawan
Council for Sustainable Development Staff). 2012. SocMon Site Report in Barangay
Kamuning, Puerto Princesa City, Palawan, Philippines. 71 p. Center for Strategic Policy and
Governance/Palawan State University, Puerto Princesa City.

150
Part 4 SocMon Site Report Barangay
Cawayan, Bongabong, Oriental Mindoro
“Socioeconomic Monitoring (SocMon) Program in the
Philippines to Support Effective Coral Reef Conservation and
Coastal Resources Management: Initiation in Oriental Mindoro
Province and Continuation in Puerto Princesa City, Palawan
Province”

Socioeconomic Monitoring (SocMon) Program in the Philippines to Support Effective
Coral Reef Conservation and Coastal Resources Management: Initiation in Oriental Mindoro
Province and Continuation in Puerto Princesa City, Palawan Province
SocMon Site ReportBarangay Cawayan, BongabongOriental Mindoro, Philippines
Center for Strategic Policy and GovernancePalawan State University
Puerto Princesa City
Mindoro State College of Agriculture and Technology (MinSCAT)Bongabong, Oriental Mindoro
September 2012

2
Table of Contents
List of Tables ............................................................................................................................ 3
List of Figure............................................................................................................................. 5
List of Acronyms and Abbreviations ........................................................................................ 6
Summary ................................................................................................................................... 8
4.1. Introduction .................................................................................................................. 11
4.2 Methodology ................................................................................................................ 13
4.3 Summary of Results ..................................................................................................... 15
4.3.1 Household Demographics..................................................................................... 15
4.3.2. Household Members’ Occupations and Income Sources ..................................... 18
4.3.3. Coastal and Marine Activities .............................................................................. 21
4.3.4. Attitudes towards Indirect Values of Resources ................................................... 23
4.3.5. Perceptions of Resource Conditions ..................................................................... 27
4.3.6. Perceived Threats to Resources ............................................................................ 29
4.3.7. Awareness of Resource Rules and Regulations ................................................... 38
4.3.8. Participation in Decision Making ......................................................................... 40
4.3.9. Membership in Resource Use Stakeholder Organization ..................................... 42
4.3.10. Perceptions of Coastal Resource Management Problems and Solutions ............. 43
4.3.11. Perceptions of Coastal Management Successes and Challenges .......................... 45
4.3.12. Perceptions of Community Problems and Solutions ............................................ 47
4.3.13. Governance ........................................................................................................... 49
4.4. Recommendations ........................................................................................................ 49
4.5. Bibliography ................................................................................................................ 52

3
List of Tables
Table 1. Household demographic characteristics, Barangay Cawayan, Bongabong, Oriental
Mindoro, Philippines, (n = 167) ................................................................................. 16
Table 2. Summary quantitative indices for household size and age, Barangay Cawayan,
Bongabong, Oriental Mindoro, Philippines, (n = 167) ............................................... 17
Table 3. Socio-cultural characteristics of household members, Barangay Cawayan,
Bongabong, Oriental Mindoro, Philippines, (n = 167) ............................................... 18
Table 4. Primary and secondary occupations of household members*, Barangay Cawayan,
Bongabong, Oriental Mindoro, Philippines, (n = 167) ............................................... 19
Table 5.Most important income sources of households, Barangay Cawayan, Bongabong,
Oriental Mindoro, Philippines (n=167) ...................................................................... 19
Table 6. Material style of life, Barangay Cawayan, Bongabong, Oriental Mindoro,
Philippines, (n = 167) .................................................................................................. 21
Table 7. Household coastal and marine activities, Barangay Cawayan, Bongabong, Oriental
Mindoro, Philippines (n=167) ..................................................................................... 22
Table 8. Attitudes towards non-market and non-use values of coastal resources, Barangay
Cawayan, Bongabong, Oriental Mindoro, Philippines (n=167) ................................. 24
Table 9. Means and standard deviations of rating scores of attitudes towards non-market and
non-use values of coastal resources, Barangay Cawayan, Bongabong, Oriental
Mindoro, Philippines (n=167) .................................................................................... 25
Table 10. Aggregate rating scores on attitudes towards non-market and non-use values of
coastal resources, Barangay Cawayan Bongabong, Oriental Mindoro, Philippines
(n=167) ........................................................................................................................ 26
Table 11. Means and standard deviations of aggregate rating scores on attitudes towards non-
market and non-use values 0f coastal resources, Barangay Cawayan, Bongabong,
Oriental Mindoro, Philippines (n=167) ...................................................................... 27
Table 12. Perceptions of resource conditions. Barangay Cawayan, Bongabong, Oriental
Mindoro, Philippines (n=167) ..................................................................................... 28
Table 13. Means and standard deviations of ratings on perceived resource conditions,
Barangay Cawayan, Oriental Mindoro, Philippines (n=167) ..................................... 28
Table 14. Perceived threats to mangroves, Barangay Cawayan, Bongabong, Oriental
Mindoro, Philippines (n=167) ..................................................................................... 30
Table 15. Perceived threats to coral reefs, Barangay Cawayan, Bongabong, Oriental
Mindoro, Philippines, (n = 167) .................................................................................. 31
Table 16. Perceived threats to upland forests, Barangay Cawayan, Bongabong, Oriental
Mindoro, Philippines, (n = 167) .................................................................................. 32
Table 17. Perceived threats to seagrass, Barangay Cawayan, Bongabong, Oriental Mindoro,
Philippines (n=167) ..................................................................................................... 33

4
Table 18. Perceived threats to beach, Barangay Cawayan, Bongabong, Oriental Mindoro,
Philippines, (n=167) .................................................................................................... 34
Table 19. Perceived threats to rivers/creeks, Barangay Cawayan, Bongabong, Oriental
Mindoro, Philippines (n=167) ..................................................................................... 35
Table 20. Perceived threats to ground water. Barangay Cawayan, Bongabong, Oriental
Mindoro, Philippines (n=167) ..................................................................................... 36
Table 21. Top perceived threats to coastal resources, Barangay Cawayan, Bongabong,
Oriental Mindoro, Philippines (n=167) ...................................................................... 37
Table 22. Top perceived threats to non-coastal resources, Barangay Cawayan, Bongabong,
Oriental Mindoro, Philippines (n=167) ...................................................................... 38
Table 23. Awareness of resource rules and regulations, Barangay Cawayan, Bongabong,
Oriental Mindoro, Philippines (n=167) ...................................................................... 39
Table 24. Current and desired levels of participation in decision making. Barangay Cawayan,
Bongabong, Oriental Mindoro, Philippines (n=167) .................................................. 40
Table 25. Means and standard deviations of ratings of participation in decision making,
Barangay Cawayan, Bongabong, Oriental Mindoro, Philippines (n=167) ................. 41
Table 26. Comparisons of current and desired levels of participation in decision making ... 42
Table 27. Household membership in resource use stakeholder organizations*, Barangay
Cawayan, Bongabong, Oriental Mindoro, Philippines (n=167) ................................. 42
Table 28. Perceived coastal management problems, Barangay Cawayan, Bongabong,
Oriental Mindoro, Philippines (n=167) ...................................................................... 43
Table 29. Perceived solutions to coastal management problems, Barangay Cawayan,
Bongabong, Oriental Mindoro, Philippines (n=167) .................................................. 44
Table 30. Top perceived coastal management problems and solutions, Barangay Cawayan,
Puerto Princesa City, Philippines (n=167) ................................................................. 45
Table 31. Perceived successes in coastal management, Barangay Cawayan, Bongabong,
Oriental Mindoro, Philippines (n=167) ...................................................................... 45
Table 32. Perceived challenges in coastal resources management, Barangay Cawayan,
Bongabong, Oriental Mindoro, Philippines (n=167) .................................................. 46
Table 33. Top perceived successes and challenges in coastal management, Barangay
Cawayan, Bongabong, Oriental Mindoro, Philippines (n=167) ................................ 47
Table 34. Perceived community problems, Barangay Cawayan, Bongabong, Oriental
Mindoro, Philippines (n=167) ..................................................................................... 47
Table 35. Perceived solutions to community problems, Barangay Cawayan, Bongabong,
Oriental Mindoro, Philippines (n=167) ...................................................................... 48
Table 36. Top perceived community problems and solutions, Barangay Cawayan,
Bongabong, Oriental Mindoro, Philippines (n=167) .................................................. 48

5
List of Figures
Figure 1. Map of Barangay Cawayan, Bongabong, Oriental Mindoro ................................... 11
Figure 2. Mean ratings for items on attitudes towards non-market and non-use values
(n=167). ................................................................................................................................... 25
Figure 3. Mean ratings of perceived resource conditions at Barangay Cawayan, Bongabong,
Oriental Minodro (n=167)....................................................................................................... 29

6
List of Acronyms and Abbreviations
BFARMC Barangay Fisheries and Aquatic Resources Management Council
CBMS Community-Based Monitoring Survey
FGD focused group discussions
GI galvanized iron
ha hectares
HH household
HHI household interview
KI key informant
KII key informant interview
km kilometres
MIMAROPA Mindoro-Marinduque-Romblon-Palawan
NGO non-government organization
ORMECO Oriental Mindoro Electric Company
SEA Southeast Asia
SocMon Socioeconomic Monitoring
UV ultra violet
7
“Socioeconomic Monitoring (SocMon) Program in the Philippines to Support Effective
Coral Reef Conservation and Coastal Resources Management: Initiation in Oriental
Mindoro Province and Continuation in Puerto Princesa City, Palawan Province”
Institutional Partners and Members
Mindoro State College of Arts and Technolology
Edna Piol
Magdalena Elaydo
Rhea de Guzman
Nilo Royo
Mylene Catapang
Angelita Baldon
Rolando Urate
Rosalia Soriano
Randy Quitain
Jean Gayeta
Jessica Enriquez
Regal Izon
Sheryl Dino
Gerolyn Bacudo
Eva Brinosa
Myla Izon
Palawan State University
Michael Pido
Marissa Pontillas
Eva Marie Ponce de Leon
Nelly Mendoza
Gianina Decano
Phabe Tabucalde
Jose Buenconsejo
Mary Aileen delas Alas

8
Summary
Introduction
Understanding socioeconomic factors and the communities’ relationship to coastal
and marine resources is crucial for the success of marine conservation. This is addressed
through socioeconomic monitoring (SocMon), a global coastal management initiative being
undertaken in the South East Asia (SEA) region, that includes the Philippines, through the
Socioeconomic Monitoring Southeast Asia (SocMon SEA). This report provides a synopsis
of the SocMon initiated in Barangay Cawayan, Bongabong, Oriental Mindoro Province,
Philippines. The goal of this project is to propagate the use of socioeconomic monitoring
(SocMon) among academics, researchers, policy makers, and coastal managers thereby
enhancing coral reef conservation and coastal resources management.
Methodology
The SocMon methodology followed three major steps. The first part was advance
preparation that included defining the objectives of SocMon, establishing the SocMon team
and preparing the logistics. The second part was data collection, which was the generation of
field data using three complementary research methods, namely: household interview (HHI),
key informant interview (KII), and focused group discussions (FGD). The numbers of
respondents are as follows: HHI – 167 households; KII – 9; and FGD – 1. Field data were
gathered from June 2011 to August 2012 in Barangay Cawayan, Bongabong. The third part
was analysis of both qualitative and quantitative data, while communication consisted of
disseminating the results to the relevant stakeholders. The Palawan State University took the
lead and the partners involved were the Mindoro State Agricultural College (MinSCAT) –
Bongabong Campus, and the Municipal Government of Bongabong, Oriental Mindoro.
Results and Discussion
Barangay Cawayan is located approximately four kilometers (km) south of the town
proper of Bongabong, Oriental Mindoro. It is bounded by Tablas Strait on the east. It has a
total land area of 651.5 hectares (ha), 86.3% of which is used for planting coconut, rice and
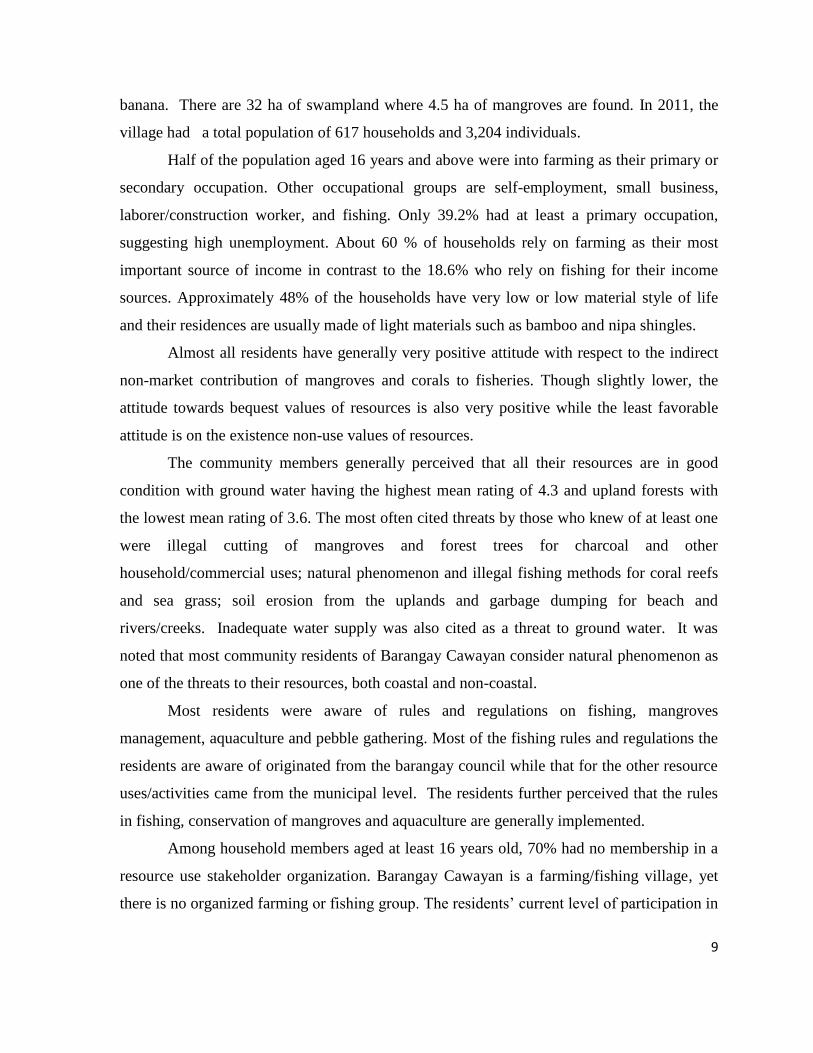
9
banana. There are 32 ha of swampland where 4.5 ha of mangroves are found. In 2011, the
village had a total population of 617 households and 3,204 individuals.
Half of the population aged 16 years and above were into farming as their primary or
secondary occupation. Other occupational groups are self-employment, small business,
laborer/construction worker, and fishing. Only 39.2% had at least a primary occupation,
suggesting high unemployment. About 60 % of households rely on farming as their most
important source of income in contrast to the 18.6% who rely on fishing for their income
sources. Approximately 48% of the households have very low or low material style of life
and their residences are usually made of light materials such as bamboo and nipa shingles.
Almost all residents have generally very positive attitude with respect to the indirect
non-market contribution of mangroves and corals to fisheries. Though slightly lower, the
attitude towards bequest values of resources is also very positive while the least favorable
attitude is on the existence non-use values of resources.
The community members generally perceived that all their resources are in good
condition with ground water having the highest mean rating of 4.3 and upland forests with
the lowest mean rating of 3.6. The most often cited threats by those who knew of at least one
were illegal cutting of mangroves and forest trees for charcoal and other
household/commercial uses; natural phenomenon and illegal fishing methods for coral reefs
and sea grass; soil erosion from the uplands and garbage dumping for beach and
rivers/creeks. Inadequate water supply was also cited as a threat to ground water. It was
noted that most community residents of Barangay Cawayan consider natural phenomenon as
one of the threats to their resources, both coastal and non-coastal.
Most residents were aware of rules and regulations on fishing, mangroves
management, aquaculture and pebble gathering. Most of the fishing rules and regulations the
residents are aware of originated from the barangay council while that for the other resource
uses/activities came from the municipal level. The residents further perceived that the rules
in fishing, conservation of mangroves and aquaculture are generally implemented.
Among household members aged at least 16 years old, 70% had no membership in a
resource use stakeholder organization. Barangay Cawayan is a farming/fishing village, yet
there is no organized farming or fishing group. The residents’ current level of participation in

10
decision making is focused on activities related to fishing, mangroves, pebble gathering, and
aquaculture. The highest current participation levels can be described as moderately active in
the following socio-economic endeavors: fishing, mangroves, and pebble gathering. More
respondents expressed a greater desire to participate in these three resource uses/activities
and such differences between current and desired levels of participation are statistically
significant.
Most of the perceived coastal management problems were over-exploitation of
coastal resources, decrease in fish catch, mangrove cutting and natural calamities. Aside from
mangrove planting/reforestation which was the top solution cited, other perceived solutions
pertain to enforcement of rules and regulations, proper waste disposal/management by the
community, and the conduct of orientation/seminar on proper utilization of coastal resources.
Majority of residents considered mangrove planting/conservation as one of their successes in
coastal management. Governance, particularly strict implementation of fishing
laws/ordinances, ranked highest among the challenges cited by the residents.
Poverty appears to be pervasive since this is one of the perceived community problem
enumerated by more than half of the households. This is reinforced by the second ranking
community problem which is unemployment. Most of the residents connect their poor
economic conditions to unemployment, and hence, the need for livelihood opportunities
arises as the perceived solution.
Greater support to village-level governance, particularly on enforcement and policy,
needs to be provided. Residents need to be more organized and pro-active in community
resource management. It is hoped that the relevant recommendations described herein will
be adopted by the concerned implementers, planners, and policy makers.

11
1.1. Introduction
Barangay Cawayan is located at the southern part of Bongabong, Oriental Mindoro,
approximately 4 km from the town proper and 6 km from the province’s national highway. It
is bounded by Tablas Strait on the East, Barangay Labonan on the West, Barangay Mina de
Oro on the North and Barangay Camantigue on the South (Figure 1). It is composed of 7
sitios, namely: Poblacion, Tono, Bagong Sikat, Narra, Nyugan, Maagap, and Maligaya. Its
topography is plain land near the coast where Bongabong River and Cawayan River run
through.
Figure 1. Map of Barangay Cawayan, Bongabong, Oriental Mindoro
Barangay Cawayan has a total land area of 651.5 hectares (ha), the biggest portion
(562 ha or 86.3%) of which is used for the plantation of coconut, rice and banana. The rest
are divided into the following land uses: residential areas (9.5 ha), village hall site (1 ha),
commercial site (9 ha), school site (4 ha), playground (2 ha), reserved land for cemetery (1.5
ha), and idle land (30 ha). Among the common products of Cawayan are coconut (762

12
tons/yr), rice (73.6 tons/yr) and banana (29 tons /yr). There are 5 rice mills with a milling
capacity of 300 cavans of rice per day. Animal raising is usually focused in poultry and
piggery. The number of farmers is not known but farming is the most common occupation of
the head of the family.
There are 32 ha of swamp in the village where 4.5 ha of mangroves are found. Most
of the mangrove plants are still seedlings (62.7%) while the rest are mature (24.8%) and
saplings (12.8%). The barangay has 22 ha of fishponds and 25 bancas for catching fish.
As reported in the Barangay Socioeconomic Profile & Development Plan prepared by
the Municipal Poverty Reduction Team, the Municipal Planning and Development Plan and
the Community–Based Monitoring System (CBMS) Network Coordinating System in 2011,
Cawayan has a total population of 617 households and 3,204 individuals. Out of this total,
1,711 (50.94%) are male and 1,1493 (49.06%) are female. Majority of the households’
income per month is PhP4,001 and above with an average expenses of PhP3,024 /month.
Residential dwellings are combined bamboo and nipa (44.2%), combined wood and GI roof
(28.5%) and concrete (26.3%). Residents get water for drinking, household and agricultural
uses from 298 free-flowing water supply system. For house lighting, 374 households are
tapped to electricity distributed by the Oriental Mindoro Electric Company (ORMECO).
Firewood is the primary fuel used by 467 households for cooking, while 27 households use
liquefied petroleum gas.
Bisaya and Tagalog are the two dialects commonly spoken by community residents.
As to religious beliefs, 55.6 % of the people are Roman Catholics while the others belong to
Protestants, Pentecostal and Seventh Day Adventist groups. The government has provisions
for free public basic education - a day care center, a kindergarten school, elementary school,
and secondary school – yet some 20.6% of school-age children do not attend school.

13
4.2 Methodology
The overall methodology and/or general procedure for training, field data collection
and data analysis followed the SocMon methodology (Bunce and Pomeroy 2000, Bunce et al.
2003). The SocMon Process basically follows three major steps. SocMon is “a set of
guidelines for establishing a socioeconomic monitoring program at a coastal management
site in Southeast Asia” in order to gain an understanding of the social, cultural, economic,
and political characteristics and conditions of individuals, households, groups, and
communities (Bunce and Pomeroy, 2003). The first part was advance preparation that
included defining the objectives of SocMon, establishing the SocMon team and preparing the
logistics. The second part was data collection, which was the generation of field data whereas
three complementary research methods were employed namely, household interview (HHI),
key informant interview (KII), and focused group discussions (FGD). The third part was
analysis of the gathered qualitative and quantitative data, while communication consisted of
disseminating the results to the relevant stakeholders.
The SocMon methodology provides a standardized set of 32 indicators and 28
indicators using key informant/secondary source and household interviews, respectively.
Household interview indicators are categorized into household demographics (9), coastal and
marine activities (5), attitudes and perceptions (13), and the material style of life (1). A mix
of both quantitative and qualitative data arises out of undertaking a SocMon community-level
survey using all or subsets of these 28 indicator variables. The results are summarized with
the end view of translating data into useful information for any or all of the following
purposes: (1) identifying threats, problems, solutions, and opportunities; (2) determining the
importance, value, and cultural significance of resources and its uses; (3) assessing positive
and negative impacts of management measures; 4) assessing how the management body is
doing (management effectiveness); (5) building stakeholder participation and appropriate
education and awareness programs; (6) verifying and documenting assumptions of
socioeconomic conditions in the area, community dynamics and stakeholder perceptions; and
(7) establishing baseline household and community profile.
The main purpose of undertaking the SocMon in Inagawan is to establish the
necessary socioeconomic baseline information needed for establishing marine sanctuaries

14
and for resource use planning by communities. For the four study sites, all 60 key informant
(KI) and household (HH) indicators were chosen and utilized to obtain the necessary
information required by the communities for planning and decision–making. These variables
were chosen after a consultation with community leaders/site managers and other key
stakeholders to ensure the responsiveness of the research variables to the local conditions.
The process/means of data collection involved extracting data from both primary and
secondary sources. In addition to a review of available documents such as but not limited to
village profiles, municipal statistics, and relevant national reports, data gathering instruments
were utilized to collect and cross-validate data. Primary data were collected in the field to
complement secondary data as well as to fill identified gaps. Primary data collection took
place through the development and administration of household questionnaire survey and
through individual/group interview of key informants (KIs). The selected key informants
(KIs) were individuals who, because of their position, experience and/or knowledge,
provided insights into the larger population. The KIs chosen included local leaders,
community elders, coastal managers, representatives of non-governmental organizations and
policy makers. Individual KIIs were conducted to collect useful baseline data, as well as to
validate the primary and secondary data collected through other methods. The FGDs, on the
other hand, were group interviews designed to gather/validate both questionnaire and KII
data for the baseline. Focused group participants included fishers, tourist operators,
community elders, farmers, and NGO representatives present in the community. The
socioeconomic household surveys collected data directly from the household head, usually
the husband or wife in the family, through face-to-face interviews.
Systematic sampling was employed to randomly select the sample households and to
ensure representatives of the population with the sampling interval computed based on the
population size and desired sample size. The list of households in each community as
provided by the village council’s secretary was used as the sampling frame for Barangay
Cawayan. From the population of 617 households, a systematic random sample of 167
households was drawn. This sample size is 27.1% of the household population, and is
comprised of 613 individuals. Nine key informants were identified and one focus group
discussion was conducted during the research.

15
The SocMon household survey was conducted b by trained enumerators while the
team statistician supervised the development of the database, encoding, and data analysis.
Results of the surveys were then presented to the community and other stakeholders for
validations. After the validations were completed, the technical reports for each village were
finalized. Some of these reports will be translated into layman’s language, such as policy
briefs. Appropriate reports were also disseminated to the relevant stakeholder groups so that
they may use the research results for planning and adaptive management.
4.3 Summary of Results
4.3.1 Household Demographics
Household demographics pertain to the household characteristics pertaining to size,
gender, age, highest educational attainment, and birthplace (Table 1 and Table 2). It also
describes the socio–cultural characteristics of the household members like their religious
affiliations, ethnic membership, and languages being spoken (Table 3).
Table 1 reveals that 84 (50.3%) of the households had 4 to 6 members while 47
(28.1%) had 1 to 3 members. With the median size at 5 and the mean at 4.95, the typical
household has 5 members. In terms of gender, there are more males (52.1%) than females in
the community. About half (51.2%) of the residents are young, with ages less than 19 years.
Only 13.2% were aged 50 years and above. The median age of 19 years is lower than the
mean age of 24.98 years, indicating that the distribution of ages is positively skewed; that is,
there are more youths and fewer older people in the community.
As to birthplace, majority (69.6%) of the residents were born in Barangay Cawayan
where they are presently residing. About a third (30.4%) was born outside the locality,
indicating in-migration from other areas. The bulk (46.6%) of the residents reached high
school level; those who finished at most elementary level comprised 37.9%. The remaining
15.5% are college undergraduates (7.42%), college graduates (5.1%), and vocational
technical graduates (2.3%).

16
Table 1. Household demographic characteristics, Barangay Cawayan, Bongabong, Oriental
Mindoro, Philippines, (n = 167).
Socio-Demographic Characteristic Frequency Percentage
Household Size
1 to 3 members
4 to 6 members
7 to 9 members
10 or more members
47
84
32
4
28.1
50.3
19.2
2.4
Gender
Male
Female
432
397
52.1
47.9
Age (as of last birthday)
0 to 9 years
10 to 19 years
20 to 29 years
30 to 39 years
40 to 49 years
50 to 59 years
60 to 69 years
70 years and above
201
223
95
113
88
58
31
20
24.2
26.9
11.5
13.6
10.6
7.0
3.7
2.5
Highest Educational Attainment
(for household members > 16 years)
No formal schooling
At most grade 4
At most grade 6/elementary grad
At most 3rd
year high school
4th
year/high school grad
College undergraduate
College graduate
With Vocational/technical education
Vocational/technical graduate
With master’s units/degree
No information/missing
Total
10
41
128
83
136
35
24
4
11
0
0
472
2.1
8.7
27.1
17.6
28.8
7.4
5.1
0.8
2.3
0.0
0.0
100.0
Birthplace
Village locale
Municipal locale but in other villages
Provincial locale but in other
municipality/city
Regional locale but in other province
Other regions in Luzon
Other regions in Visayas
577
67
55
64
51
14
1
69.6
8.1
6.6
7.7
6.2
1.7
.1

17
Table 2. Summary quantitative indices for household size and age, Barangay Cawayan,
Bongabong, Oriental Mindoro, Philippines, (n = 167)
Household Size Age
Total Number 167 households 829 individuals
Median 5 19.00
Mean 4.95 24.98 years
Standard Deviation 2.140 19.252
Skewness 0.597 0.782
Roman Catholic is still the dominant religion; however, it is only embraced by 39.1%
(Table 3). Other religious groups proliferate, particularly the Born again Christian and
protestant groups, comprising of 24.4% and 14.2% respectively, are members of. The rest
are affiliated with at least five other religious sects. Though majority were born in the
village, residents do not trace their generational roots to Barangay Cawayan since about 7 out
of every 10 individuals belong to ethnic groups found in the Southern Tagalog
(MIMAROPA) region and only 5.7% belong to an ethnic group within the locality. Hence,
Tagalog, the lingua franca in the region, is the predominant language used. Nonetheless,
about 1 out of 4 speaks Bisaya, which is the medium of communication among Filipinos
from the Visayan Islands of the Philippine archipelago.

18
Table 3. Socio-cultural characteristics of household members, Barangay Cawayan,
Bongabong, Oriental Mindoro, Philippines (n = 167).
Socio-Demographic Characteristic Frequency Percentage
Religion
Roman Catholic
Iglesia ni Kristo
Born-again Christian
Protestant
Seventh Day Adventist
Aglipay/Philippine Independent Church
Church of God
Ang Dating Daan
324
18
202
118
31
36
68
21
39.1
2.2
24.4
14.2
3.7
4.3
8.2
2.5
Ethnic Membership
Ethnic group within the locality
Ethnic group within the province
Ethnic group within the region
Ethnic group within Luzon
Ethnic group within Visayas
47
0
615
164
3
5.7
0.0
74.2
19.8
0.4
Primary Language Spoken
Tagalog
Cebuano
Ilonggo
Ilocano
Bisaya
612
6
5
10
196
73.8
0.7
0.6
1.2
23.6
4.3.2. Household Members’ Occupations and Income Sources
Majority of the population aged 16 years and above cited farming (54.2%) as their
primary or secondary occupation (Table 4). The next big occupational groups in the
community are self-employment/small business (31.1%) and laborer/construction worker
(30.5%). Fishing ranked fourth with 24 (13.6%) engaged in it as a primary occupation and
another 15 (8.5%) as secondary occupation. This distribution of occupational groups
confirms that Barangay Cawayan is more of a farming community rather than a fishing
community. It is further observed that only 177 or 39.2% had at least a primary occupation
while the rest had none or missing information. This value suggests that a high 60.8% of the
working age members may not have a regular primary occupation and are therefore
unemployed.

19
Table 4. Primary and secondary occupations of household members*, Barangay Cawayan,
Bongabong, Oriental Mindoro, Philippines (n = 167).
Occupational Category Primary Secondary Total/Combined
No. % No. % No. %
Fishing 24 13.6 15 8.5 39 22.1
Farming 80 45.2 16 9.0 96 54.2
Regular government employment 2 1.1 2 1.1 4 2.2
Private professional employment 3 1.7 1 0.6 4 2.2
Labourer/construction worker 25 14.1 29 16.4 54 30.5
Self-employed/small business 29 16.4 26 14.7 55 31.1
Animal/livestock raising 3 1.7 6 3.4 9 5.1
Tricycle/jeepney driver 7 4.0 4 2.2 11 6.2
Dressmaking 4 2.2 8 4.5 12 6.8
Sub-total 177 100.0 107 60.5 177
None 33 7.3 96 21.2
Missing/No information 242 53.5 249 55.1
Total 452 100.00 452 100.00 *For household members with ages of at least 16 years
Similar to occupational distribution, a greater percentage of households (59.3% as
primary, 9.6% as secondary) rely on farming as their most important source of income (Table
5). This is in contrast to the 18.6% of households that rely on fishing for their income
sources. The second and third important income sources of households are self-
employment/small business and laborer/construction work that are depended on by 23.4%
and 20.4%, respectively.
Table 5.Most important income sources of households, Barangay Cawayan, Bongabong,
Oriental Mindoro, Philippines (n=167).
Source of Income
Primary Secondary Total/Combined
No. % No. % No. %
Pension 1 0.6 1 0.6
Fishing 19 11.4 12 7.2 31 18.6
Farming 99 59.3 16 9.6 105 62.9
Livestock/animal raising 2 1.2 4 2.4 6 3.6
Regular government employment 1 0.6 1 0.6
Private professional employment 2 1.2 1 0.6 3 1.8
Labourer/construction worker 14 8.4 20 12.0 34 20.4
Self-employed/small business 19 11.4 20 12.0 39 23.4
None 12 7.2 92 55.1
Total 167 100.0 167 100.0

20
Because of the methodological difficulties in measuring household income, SocMon
does not make any attempt to measure it. Instead, it substitutes the variable “material style of
life” as a rough measure of the economic status of the households. The measure for material
style of life is an aggregate ordinal value derived from scoring the type of the household’s
residential structure with respect to roof, structural walls, windows, and floor. Observations
of the residential dwellings of the sample households show that most are predominantly
made of tin/galvanized iron (GI) roofs, concrete walls, thatch/bamboo windows, and cement
floors. Overall, about 47.9% of the households have very low to low material style of life as
reflected in their use of light materials such as bamboo and nipa in their residential dwellings
(Table 6). Yet, half of the households (51.5%) have a high material style of life if the basis is
their use of more permanent and sturdy materials for their residential dwellings. It is quite
surprising that the village has high unemployment, yet its residents are able to construct
houses whose materials are relatively expensive.

21
Table 6. Material style of life, Barangay Cawayan, Bongabong, Oriental Mindoro,
Philippines (n = 167).
Material Style of Life No. %
Type of Roof:
Thatch/nipa
Thatch/bamboo
Wood/plywood
Tin/GI sheet
54
7
4
102
32.3
4.2
2.4
61.1
Type of outside structural walls
Thatch/bamboo
Wood/plywood
Brick/concrete
Tiles
Missing
23
13
44
86
1
13.8
7.8
26.3
51.5
0.6
Windows:
Open
Thatch/bamboo
Wooden
Steel bars
Glass
8
66
74
187
1
4.8
39.5
44.3
10.82
0.6
Floor
Dirt
Bamboo
Cement
Wooden
Tiles
49
13
101
3
1
29.3
7.8
60.5
1.8
0.6
Other Household Assets:
2/3/4-wheel Motor Vehicle
Computer
Television set
24
1
47
14.4
0.6
28.1
Aggregate Ratings
4 - 8: Very low
9 - 12: Low
13 – 16: High
17 – 20: Very High
60
20
86
1
35.9
12.0
51.5
0.6
4.3.3. Coastal and Marine Activities
The coastal and marine activities in the community are comprised of fishing and non-
fishing activities (Table 7). Community residents who are engaged in fishing usually catch
tilapia, milkfish, tulingan, and crabs. Catch of finfishes and crabs are usually intended for
household consumption, and only a minimal portion is sold. There were several aquaculture

22
projects observed in the community. These mostly consist of the culture of tilapia and
milkfish in fishponds. The products of fishponds are mostly intended for sale, and are sold
within the barangay.
Though the residents conduct coastal cleanups and mangrove planting, charcoal-
making for household or commercial uses utilizing mangroves is also undertaken by some of
the residents. Non-fishing activities, on the other hand, consist of farming and livestock
raising.
Table 7. Household coastal and marine activities, Barangay Cawayan, Bongabong, Oriental
Mindoro, Philippines (n=167).
Coastal and
Marine
Activities
Coastal and Marine
Goods and Services
Types of
Household
Uses
Household Market
Orientation
Fishing Sardines; Manamsi; Purse seine For consumption
Lumahan For sale
Tilapia; Milkfish;
Tulingan
Salap; kawil For consumption
For sale
Crab Lambat/Panti For consumption
For sale
Fishpond Tilapia; Milkfish Salap/kawil For sale
For consumption
Charcoal making Mangroves Planting;
harvesting
Household use
For sale
Farming Palay Planting;
harvesting
For consumption
For sale
Coconuts Planting;
harvesting
For consumption
For sale
Bananas Planting;
harvesting
For consumption;
For sale
Livestock raising Cattle/Ox Fattening For Consumption
For sale
Piggery Fattening For Consumption
For sale
Poultry Fattening For Consumption
For sale

23
Some coastal and marine activities are perceived by the community members to cause
some adverse impacts on the coastal resources. Key informants identified overfishing, anchor
damage, decline in fish catch, and pollution as negative impacts or effects of such activities.
They also attributed the reduction in volume of the local fisher’s catch to illegal fishing
activities such as the use of prohibited fishing gears and catching of undersized fish. The
presence of commercial fishing vessels in the area may have also contributed to such decline.
Pollution, on the other hand, was attributed to nutrient loading in operating fishponds. They
also mentioned that as a consequence, calamities may happen because of the cutting of
mangroves and destruction of corals.
4.3.4. Attitudes towards Indirect Values of Resources
The people are naturally aware of the significant economic benefits and market values
that could be derived from the resources that are available in their environment. On the other
hand, SocMon looks at the community’s appreciation of their coastal and other resources
beyond the direct economic benefits that are usually measured in monetary terms. To
determine the people’s perception and understanding of the value of resources, investigations
pertaining to the non-market and non-use values are included in the survey. Indirect non–
market value of the coastal resource is a measure of how people perceive its indirect
economic benefits such as biological support functions. Non-use values are not associated
with any use and include option value (the value of knowing that the resource is available
should one decide to use it at some future time), bequest value (the value of knowing that the
resource will be available to future generations), and existence value (the value of knowing
that the resource exists in a certain condition) (Bunce & Pomeroy, 2003).
For this reason, eight Likert-type item statements were asked pertaining to attitudes
towards non-market and non-use values of coastal resources (Table 8 and Table 9). Strong
agreement indicates most positive attitude and is given a score of 5. Meanwhile, the lowest
score of 1 is given to a response of strong disagreement. Scoring is reversed for the
negatively stated items. The net rating is the difference between the percentage of
respondents who agree and disagree to the statement, indicating how much more have

24
positive than negative attitude if the net rating is positive. Results suggest that residents have
generally positive attitudes since most of them either agree or strongly agree to the positively
stated items, with mean ratings on the higher end, ranging from 4.6 to 4.8 (Table 8 and Table
9). Except for the two negatively-stated items, the net ratings are all positive and high
reflecting that at least 80% more have positive than negative attitudes. The most varied and
lowest ratings were on the two negatively stated items: corals are only important for fishing
and diving (3.0) and seagrass beds have no value to people (3.4).
Table 8. Attitudes towards non-market and non-use values of coastal resources, Barangay
Cawayan, Bongabong, Oriental Mindoro, Philippines (n=167).
Item Statement Response Options* Net
Rating** SD D NAD A SA
Reefs are important for protecting land
from storm waves
1
(0.6)
2
(1.2)
1
(0.6)
23
(13.8)
134
(80.2)
92.2%
In the long run, fishing would deteriorate
if we cleared the corals
1
(0.6)
1
(0.6)
3
(1.8)
26
(15.6)
130
(77.8)
92.2%
Mangroves are to be protected so that we
will have fish to catch
1
(0.6)
1
(0.6)
3
(1.8)
23
(13.8)
133
(79.6)
93.2%
Corals are only important for fishing and
diving (-)
39
(23.4)
23
(13.8)
11
(6.6)
76
(45.5)
12
(7.2)
15.5%
I want future generations to enjoy the
mangroves and coral reefs
4
(2.4)
1
(0.6)
3
(1.2)
18
(10.9)
135
(80.8)
88.7%
Fishing should be restricted in certain
areas to allow fish and coral to grow
1
(0.6)
4
(2.4)
1
(0.6)
25
(15.0)
130
(77.8)
89.8%
We should restrict development in some
coastal areas for future generations to
have natural environments
3
(1.8)
6
(3.6)
3
(1.8)
24
(14.4)
125
(74.9)
83.9%
Seagrass beds have no value to people (-) 19
(11.4)
92
(55.1)
8
(4.8)
22
(13.2)
20
(12.0)
41.3%
*Statements are rated on a 5-point scale with the following options: SA – Strongly Agree; A – agree;
NAD – neither agree nor disagree; D – Disagree; and SD – Strongly Disagree.
**Net Rating = % [frequency (SA + A)] – % [frequency (SD + D)]
Note: Figures enclosed in parentheses are the corresponding percentages for each category

25
Table 9. Means and standard deviations of rating scores of attitudes towards non-market and
non-use values of coastal resources, Barangay Cawayan, Bongabong, Oriental Mindoro,
Philippines (n=167)
Item Statement Valid
cases
Median Mean SD
Reefs are important for protecting land from storm waves 161 5 4.8 .58
In the long run, fishing would deteriorate if we cleared the corals 161 5 4.8 .58
Mangroves are to be protected so that we will have fish to catch 161 5 4.8 .57
Corals are only important for fishing and diving (-) 161 4 3.0 1.38
I want future generations to enjoy the mangroves and coral reefs 161 5 4.7 .76
Fishing should be restricted in certain areas to allow fish and
coral to grow 161 5 4.7 .66
We should restrict development in some coastal areas for future
generations to have natural environments 161 5 4.6 .85
Seagrass beds have no value to people (-) 161 4 3.4 1.23
*Statements are rated on a 5-point scale with the following options and corresponding scores: SA –
Strongly Agree (5); A – agree (4); NAD – neither agree nor disagree (3); D – Disagree (2); and SD –
Strongly Disagree (1). Scoring is reversed for negatively-stated items.
Figure 2. Mean ratings for items on attitudes towards non-market and non-use values
(n=167). Note: The numbers on the horizontal axis refer to the following item statements:
1 - The reefs are important for protecting land from storm waves.
2 - In the long run, fishing would deteriorate if we cleared the corals.
3 - Unless mangroves are protected, we will not so that we will have fish to catch.
4 - Coral reefs are only important if you fish or dive (reversed scoring).
5 - I want future generations to enjoy the mangroves and coral reefs
6 - Fishing should be restricted in certain areas even if no one ever fishes in those
Areas just to allow the fish and coral to grow
7 - We should restrict development in some coastal areas so that future generations
will be able to have natural environments.
8 - Seagrass beds have no value to people (reversed scoring).
4.8 4.8 4.8
3
4.7 4.7 4.6
3.4
0
1
2
3
4
5
6
1 2 3 4 5 6 7 8
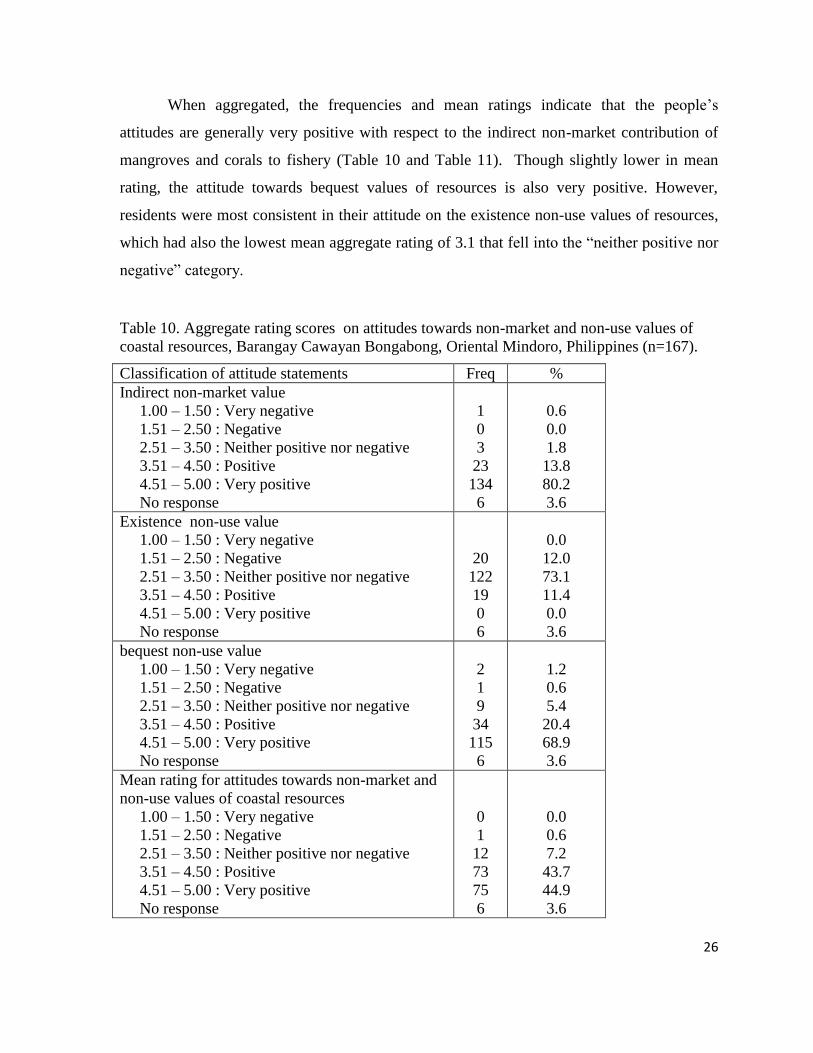
26
When aggregated, the frequencies and mean ratings indicate that the people’s
attitudes are generally very positive with respect to the indirect non-market contribution of
mangroves and corals to fishery (Table 10 and Table 11). Though slightly lower in mean
rating, the attitude towards bequest values of resources is also very positive. However,
residents were most consistent in their attitude on the existence non-use values of resources,
which had also the lowest mean aggregate rating of 3.1 that fell into the “neither positive nor
negative” category.
Table 10. Aggregate rating scores on attitudes towards non-market and non-use values of
coastal resources, Barangay Cawayan Bongabong, Oriental Mindoro, Philippines (n=167).
Classification of attitude statements Freq %
Indirect non-market value
1.00 – 1.50 : Very negative
1.51 – 2.50 : Negative
2.51 – 3.50 : Neither positive nor negative
3.51 – 4.50 : Positive
4.51 – 5.00 : Very positive
No response
1
0
3
23
134
6
0.6
0.0
1.8
13.8
80.2
3.6
Existence non-use value
1.00 – 1.50 : Very negative
1.51 – 2.50 : Negative
2.51 – 3.50 : Neither positive nor negative
3.51 – 4.50 : Positive
4.51 – 5.00 : Very positive
No response
20
122
19
0
6
0.0
12.0
73.1
11.4
0.0
3.6
bequest non-use value
1.00 – 1.50 : Very negative
1.51 – 2.50 : Negative
2.51 – 3.50 : Neither positive nor negative
3.51 – 4.50 : Positive
4.51 – 5.00 : Very positive
No response
2
1
9
34
115
6
1.2
0.6
5.4
20.4
68.9
3.6
Mean rating for attitudes towards non-market and
non-use values of coastal resources
1.00 – 1.50 : Very negative
1.51 – 2.50 : Negative
2.51 – 3.50 : Neither positive nor negative
3.51 – 4.50 : Positive
4.51 – 5.00 : Very positive
No response
0
1
12
73
75
6
0.0
0.6
7.2
43.7
44.9
3.6

27
Table 11. Means and standard deviations of aggregate rating scores on attitudes towards non-
market and non-use values 0f coastal resources, Barangay Cawayan, Bongabong, Oriental
Mindoro, Philippines (n=167).
Value Classification Valid
cases
Median Mean Std
Dev
Skew-
ness
Indirect non-market value (Items 1, 2, 3) 161 5.0 4.8 .51 -3.88
Existence non-use value (Items 4, 6, 8) 161 3.3 3.1 .41 -.874
Bequest value (Items 5, 7) 161 5.0 4.7 .68 -3.07
Over-all attitude towards non-market and
non-use values of resources (Items 1-8)
161 4.5 4.4 .49 -1.32
4.3.5. Perceptions of Resource Conditions
On a scale of 1 to 5 with 1 as “very bad” and 5 as “very good”, community
residents who felt that they had enough knowledge about their resources mostly gave ratings
of 4 and 5 (Table 12). Such rating indicated that their resources were perceived to be in good
to very good condition. There were a number of residents who did not rate a specific resource
and instead answered “don’t know” or “not applicable”; these were usually non-users of the
specific resources or individuals whose residences were geographically far from the resource.
Hence, they may have considered themselves without enough knowledge about the condition
of the resource being referred to.
A big number of those who responded said that their resources were in good or very
good condition; very few gave ratings of neither very poor to neither good nor poor. Hence,
the net ratings which are the differences (in percent) between those who rated the resource to
be in very good/good condition and those who rated it as very poor/poor condition are all
positive and high. The highest net positive rating is for ground water (93.4%) and the lowest
is for upland forests (52.7%). This means that there are 93.4% more residents who perceived
their ground water good rather than bad. Similarly, there are 52.7% more residents who
perceived their upland forests to be in good rather than in bad condition. Other resources with
high net ratings are mangroves (73.1%) and beach (73.1%). These results are also echoed in
the respective mean perception ratings for each resource (Table 13). Residents generally
perceived their ground water to be in good condition as indicated by the highest mean rating

28
of 4.33 while that of upland forest is the lowest at 3.64. Residents’ perceptions of resource
conditions were most varied for sea grass and least varied for ground water.
Table 12. Perceptions of resource conditions. Barangay Cawayan, Bongabong, Oriental
Mindoro, Philippines (n=167).
Resource Perceived Resource Condition* Don’t
know/
Missing
Net
Rating** VB B NGB G VG
Mangroves 4
(2.4)
4
(2.4)
21
(12.6)
100
(59.9)
30
(18.0)
8
(4.8)
73.1%
Coral reefs 1
(0.6)
1
(0.6)
16
(9.6)
93
(55.7)
27
(16.2)
29
(12.4)
70.7%
Upland
forests
6
(3.6)
12
(7.2)
19
(11.4)
97
(58.1)
9
(5.4)
24
(14.4)
52.7%
Sea grass 9
(5.4)
6
(3.6)
10
(6.0)
100
(59.9)
17
(10.2)
25
(15.0)
61.1%
Beach 1
(0.6)
4
(2.4)
20
(12.0)
103
(61.7)
24
(14.4)
15
(9.0)
73.1%
River/
Creeks
1
(0.6)
7
(4.2)
21
(12.6)
94
(56.3)
32
(19.2)
12
(7.2)
70.7%
Ground
water
1
(0.6)
1
(0.6)
103
(61.7)
55
(32.9)
6
(3.6)
93.4%
*Each community resource is rated on a 5-point scale with the following options
And corresponding scores: VG – Very good (5); G – good (4); NGB - neither good
nor bad (3); – Bad (2); and VB – very bad (1).
**Net Rating = % [frequency (VG + G)] – %[frequency (VB + B)]
Note: Figures enclosed in parentheses are the corresponding percentages for each category
Table 13. Means and standard deviations of ratings on perceived resource conditions,
Barangay Cawayan, Oriental Mindoro, Philippines (n=167)
Resource Valid
Responses
Median Mean Std
Dev
Mangroves 159 4 3.93 .80
Coral reefs 138 4 4.04 .64
Upland forests 143 4 3.64 .88
Seagrass 142 4 3.77 .94
Beach 152 4 3.95 .67
River/creeks 155 4 3.96 .76
Ground water 161 4 4.33 .52
*Each community resource is rated on a 5-point scale with the following
options and corresponding scores: VG – Very good (5); G – good (4); NGB
– neither good nor bad (3); B – bad (2); and VB – very bad (1).

29
Legend: 1- Mangroves; 2- Coral reefs; 3 - Upland forests; 4 - Seagrass; 5 - Beach;
6 - River/creeks; 7 - Ground water
Figure 3. Mean ratings of perceived resource conditions at Barangay Cawayan, Bongabong,
Oriental Mindoro (n=167)
4.3.6. Perceived Threats to Resources
Information on perceived threats is useful for identifying threats to the coastal
resources. Community members, particularly those who directly use the resources, are often
the most knowledgeable about threats to their resources. If community members do not
consider that there are threats to their resources, it will be difficult to actively engage them
in resource management.
The top threats to mangrove as perceived by community residents are illegal
logging; charcoal making, natural phenomenon, and cutting for household and commercial
use (Table 14). When mangroves are cut for whatever intended use but without appropriate
permit, it is considered illegal. It is surprising to note that the residents consider
typhoons/big waves as a threat to mangroves in spite of their role as protective barrier to the
shoreline against strong waves. During the community validation, stakeholders maintained
that charcoal making is no longer done in the village but acknowledged that it was an
activity in the past. Household respondents may have attributed the loss of their mangrove
3.93
4.04
3.64
3.77
3.95 3.96
4.33
3.2
3.4
3.6
3.8
4
4.2
4.4
1 2 3 4 5 6 7

30
areas to this past activity; hence, they still consider it as a threat. There is always a demand
for charcoal even at the community level since it is usually a cheaper fuel for household
cooking.
Table 14. Perceived threats to mangroves, Barangay Cawayan, Bongabong, Oriental
Mindoro, Philippines (n=167).
Perceived Threat Primary Second Tertiary Combined Rank
Cutting for household use 15
(9.0)
16
(9.6)
2
(1.2)
33
(19.8)
4
Cutting for commercial use 15
(9.0)
2
(1.2)
3
(1.8)
23
(13.8)
5
Clearing 8
(4.8)
3
(1.8)
11
(6.6)
6
Charcoal making 24
(14.4)
18
(10.8)
9
(5.4)
51
(30.5)
2
Conversion into fish pond 2
(1.2)
2
(1.2)
8
Natural phenomenon
(typhoons, big waves)
27
(16.2)
6
(3.6)
8
(4.8)
41
(24.6)
3
Disease/infestation of
mangroves
1
(0.6)
1
(0.6)
2
(1.2)
9
Pollution/dumping of garbage 1
(0.6)
1
(0.6)
10.5
Establishment/expansion of
nearby human settlements
1
(0.6)
1
(0.6)
10.5
Illegal logging 53
(31.7)
53
(31.7)
1
Sea level rise 8
(4.8)
8
(4.8)
7
Don't know 15
(9.0)
121
(72.5)
144
(86.2)
Not applicable 1
(0.6)
Note: Figures enclosed in parentheses are the corresponding percentages for each category
The primary threat to coral reef cited by 74 (44.3%) of the residents is natural
phenomenon, indicating a perception that they cannot do much to mitigate such a threat
(Table 15). However, typhoons and strong waves may not really pose a significant threat to

31
corals. Exception is if the phenomenon being mentioned is the rise of sea water temperatures
which is associated with global warming thereby causing coral bleaching.
Table 15. Perceived threats to coral reefs, Barangay Cawayan, Bongabong, Oriental
Mindoro, Philippines (n = 167).
Perceived Threat Primary Second Tertiary Combined Rank
Cyanide/compressor fishing 3
(1.8)
3
(1.8)
3
(1.8)
9
(5.4)
5
Illegal fishing activities 8
(4.8)
4
(2.4)
3
(1.8)
15
(9.0)
2
Dynamite/blast fishing 7
(4.2)
4
(2.4)
2
(1.2)
13
(7.8)
3
Coral gathering for HH/commercial
use
3
(1.8)
2
(1.2)
1
(0.6)
6
(3.6)
6
Clearing/mining/digging 10
(6.0)
1
(0.6)
11
(6.6)
4
Coral bleaching 1
(0.6)
1
(0.6)
9
Natural phenomenon (typhoon,
waves)
74
(44.3)
7
(4.2)
3
(1.8)
84
(50.3)
1
Tourism-related: recreational diving 3
(1.8)
3
(1.8)
8
Pollution/garbage dumping 3
(1.8)
1
(0.6)
2
(1.2)
6
(3.6)
7
Don't know 33
(19.8)
143
(85.6)
151
(90.4)
None 2
(1.2)
Not applicable (resource is not
available in barangay)
23
(13.8)
Note: Figures enclosed in parentheses are the corresponding percentages for each category
Clearing/mining activities are perceived to be the primary threat to upland forests.
Interestingly, charcoal making which is perceived as a primary threat to mangroves, is also
often cited as a threat to upland forests. Charcoal comes from burning felled trees, whether
they are in the coastal areas or in the upland areas. Others in the top five threats to upland
forests are kaingin/slash and burn farming, illegal logging and natural phenomenon (typhoon)
(Table 16). As people move into areas near the forests, they have to cut trees for household
use and clear land to plant staple crops and raise livestock.

32
Table 16. Perceived threats to upland forests, Barangay Cawayan, Bongabong, Oriental
Mindoro, Philippines (n = 167).
Perceived Threat Primary Second Tertiary Combined Rank
Charcoal making 22
(13.2)
14
(8.4)
1
(0.6)
37
(22.2)
2
Cutting trees for household
use
6
(3.6)
3
(1.8)
2
(1.2)
11
(6.6)
6
Illegal logging 12
(7.2)
6
(3.6)
7
(4.2)
25
(15.0)
4
Cutting trees for commercial
use
5
(3.0)
1
(0.6)
2
(1.2)
8
(4.8)
7
Conversion into residential
settlements
1
(0.6)
1
(0.6)
2
(1.2)
8.5
Conversion into farm lands 1
(0.6)
1
(0.6)
10.5
Kaingin/slash and burn
farming
18
(10.8)
4
(2.4)
8
(4.8)
30
(18.0)
3
Natural phenomenon
(typhoons)
5
(3.0)
6
(3.6)
3
(1.8)
13
(7.8)
5
Clearing /mining 53
(31.7)
53
(31.7)
1
Conversion into farmlands 1
(0.6)
1
(0.6)
2
(1.2)
8.5
Landslides/soil erosion 1
(0.6)
1
(0.6)
10.5
Don’t know 35
(21.0)
133
(79.6)
142
(85.0)
None 1
(0.6)
Not applicable (resource not
available)
16
(9.6)
Note: Figures enclosed in parentheses are the corresponding percentages for each category
Community residents perceived that the utmost threat to sea grass is primarily natural
phenomenon and not any human activity (Table 17). There is a growing evidence that
seagrass beds are experiencing decline globally due to natural disturbances such as storms
and floods. Threats from climate change include rising sea levels, changing tidal regimes,
ultra violet (UV) radiation damage, sediment hypoxia and anoxia, increases in sea
temperatures and increased storm and flooding events. Thus, seagrass meadows, the
ecosystems that they support and the ecosystem services that they provide are threatened by a
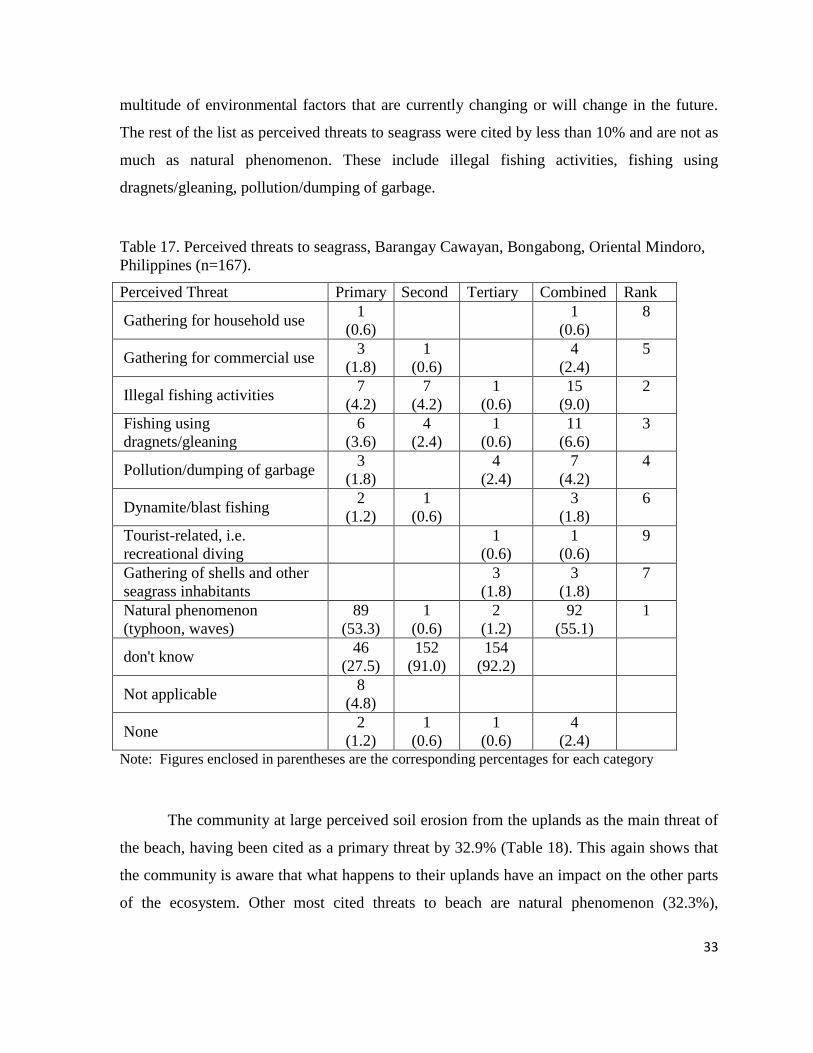
33
multitude of environmental factors that are currently changing or will change in the future.
The rest of the list as perceived threats to seagrass were cited by less than 10% and are not as
much as natural phenomenon. These include illegal fishing activities, fishing using
dragnets/gleaning, pollution/dumping of garbage.
Table 17. Perceived threats to seagrass, Barangay Cawayan, Bongabong, Oriental Mindoro,
Philippines (n=167).
Perceived Threat Primary Second Tertiary Combined Rank
Gathering for household use 1
(0.6)
1
(0.6)
8
Gathering for commercial use 3
(1.8)
1
(0.6)
4
(2.4)
5
Illegal fishing activities 7
(4.2)
7
(4.2)
1
(0.6)
15
(9.0)
2
Fishing using
dragnets/gleaning
6
(3.6)
4
(2.4)
1
(0.6)
11
(6.6)
3
Pollution/dumping of garbage 3
(1.8)
4
(2.4)
7
(4.2)
4
Dynamite/blast fishing 2
(1.2)
1
(0.6)
3
(1.8)
6
Tourist-related, i.e.
recreational diving
1
(0.6)
1
(0.6)
9
Gathering of shells and other
seagrass inhabitants
3
(1.8)
3
(1.8)
7
Natural phenomenon
(typhoon, waves)
89
(53.3)
1
(0.6)
2
(1.2)
92
(55.1)
1
don't know 46
(27.5)
152
(91.0)
154
(92.2)
Not applicable 8
(4.8)
None 2
(1.2)
1
(0.6)
1
(0.6)
4
(2.4)
Note: Figures enclosed in parentheses are the corresponding percentages for each category
The community at large perceived soil erosion from the uplands as the main threat of
the beach, having been cited as a primary threat by 32.9% (Table 18). This again shows that
the community is aware that what happens to their uplands have an impact on the other parts
of the ecosystem. Other most cited threats to beach are natural phenomenon (32.3%),

34
pollution/dumping of garbage (13.8%), beach erosion/ sea level rise (7.2%), and cutting of
aroma tree (6.6%).
Table 18. Perceived threats to beach, Barangay Cawayan, Bongabong, Oriental Mindoro,
Philippines (n=167).
Perceived Threat Primary Second Tertiary Combined Rank
Sand quarrying for household
use
2
(1.2)
1
(0.6)
3
(1.8)
7.5
Pollution/dumping of garbage 15
(9.0)
1
(0.2)
7
(4.2)
23
(13.8)
3
Natural phenomenon (typhoons,
big waves)
44
(26.3)
8
(4.8)
2
(1.2)
54
(32.3)
2
Soil erosion from the uplands 54
(32.3)
1
(0.6)
55
(32.9)
1
Residential area expansion 2
(1.2)
2
(1.2)
2
(1.2)
6
(3.6)
6
Beach erosion/sea level rise 5
(3.0)
3
(1.8)
4
(2.4)
12
(7.2)
4
Development of resorts and
tourist-related facilities
3
(1.8)
3
(1.8)
7.5
Cutting of aroma tree 4
(2.4)
6
(3.6)
1
(0.6)
11
(6.6)
5
None 1
(0.6)
1
(0.6)
Don't know 37
(22.2)
145
(86.8)
151
(90.4)
Note: Figures enclosed in parentheses are the corresponding percentages for each category
Aside from being a threat to the beach, soil erosion is again perceived as a threat to
rivers/creeks as cited by a third of the residents (Table 19). Erosion occurs as the result of the
land being disturbed. One of the disturbances that cause erosion in and around the river
systems is land clearing. This is the negative impact of removing vegetation along the
riverbanks. As a consequence, the soil is no longer held together by the roots thereby
exposing it to the eroding effects of wind, rain and flood waters. Another disturbance is
flood damage since the strong water flow can move exposed areas of soil with a lot more
force and take out big chunks of land along the riverbank and from the river bed. And lastly,
animal damage such as when livestock animals (cattle and goat) disturb the soil while
munching on grasses. The eroded soil that goes into the beach is carried through the waters

35
in rivers/creeks; hence, soil erosion is a threat to both rivers/creeks and beach. Another
fraction (28.1%) of the residents perceived that pollution/dumping of garbage is another
threat to rivers/creeks. Other top ranking threats include natural phenomenon (15.6%),
poisoning (6.0%), and establishment/expansion of nearby human settlements (3.0%).
Table 19. Perceived threats to rivers/creeks, Barangay Cawayan, Bongabong, Oriental
Mindoro, Philippines (n=167).
Perceived Threat 1st 2
nd 3
rd Combined Rank
Pollution/dumping of garbage 42
(25.1)
5
(3.0)
47
(28.1)
2
Natural phenomenon (typhoons, big
waves)
13
(7.8)
10
(6.0)
3
(1.8)
26
(15.6)
3
Sand quarrying for commercial use 1
(0.6)
1
(0.6)
7.5
Soil erosion 55
(32.9)
1
(0.6)
56
(33.5)
1
Pebble/stone gathering for household
use
1
(0.6)
1
(0.6)
7.5
Establishment/expansion of nearby
human settlements
1
(0.6)
1
(0.6)
3
(1.8)
5
(3.0)
5
Poisoning 5
(3.0)
1
(0.6)
6
(6.0)
4
Used for bathing animals 1
(0.6)
1
(0.6)
7.5
Battery-powered electrocution device
used to stun and catch fish
1
(0.6)
1
(0.6)
2
(1.2)
6
Don't know 41
(24.6)
151
(90.4)
153
(91.6)
Not applicable 8
(4.8)
Note: Figures enclosed in parentheses are the corresponding percentages for each category
As cited by most residents who knew of at least one threat, inadequate water supply,
natural phenomenon, deforestation/cutting of trees, damage to pipes, and over-exploitation
for household use were mostly enumerated as the top perceived threats to ground water
(Table 20). To the residents of Barangay Cawayan, ground water is important for both
household use and irrigation in rice farms. They may have experienced decreased supply of

36
ground water during periods of dry season and may have associated this with the natural
phenomenon of changing seasons of the year. Including deforestation/cutting of trees as a
threat to ground water indicates their greater awareness of the connection between forest
cover and groundwater supply.
Table 20. Perceived threats to ground water. Barangay Cawayan, Bongabong, Oriental
Mindoro, Philippines (n=167).
Perceived Threat Primary Second Tertiary Combined Rank
Natural phenomenon (typhoons) 23
(13.8)
2
(1.2)
25
(15.0)
2
Deforestation/cutting of trees 15
(9.0)
15
(9.0)
3
Pollution/dumping of garbage1
3
(1.8)
3
(1.8)
8.5
Water contamination due to
sewage
2
(1.2)
1
(0.6)
2
(1.2)
5
(3.0)
6.5
Over-exploitation for household
use
3
(1.8)
3
(1.8)
1
(0.6)
7
(4.2)
5
Salt intrusion 1
(0.6)
1
(0.6)
9.5
Establishment/expansion of human
settlements
4
(2.4)
1
(0.6)
5
(3.0)
6.5
Damaging of pipes 2
(1.2)
4
(.4)
3
(1.8)
9
(5.4)
4
Blockage pipes 3
(1.8)
3
(1.8)
8.5
Not following the rules
/regulations
1
(0.6)
1
(0.6)
9.5
Inadequate water supply 53
(31.7)
53
(31.7)
1
None 7
(4.2)
1
(0.6)
8
(4.8)
Don't know 52
(31.1)
153
(91.6
)
161
(96.4)
None 7
(4.2)
Note: Figures enclosed in parentheses are the corresponding percentages for each category.

37
It can be generally noted that most community residents of Barangay Cawayan
consider natural phenomenon as one of the threats to their coastal and non-coastal resources
(Tables 21 and 22). If community members consider nature to be primarily impacting and
threatening their resources, it would be difficult to engage them in resource management.
Though they cited other threats that are induced by humans and can therefore be readily
addressed by management intervention in order to protect the resource, attributing the cause
of the deterioration or destruction of a resource to the forces of nature reflects a passive
rather than proactive view of the relationship users to the resources in their environment.
Consequently, the conservation of resources may tend to be viewed as outside one’s control
as a resource user and caretaker. This perspective, if adopted by the community as a whole,
may lead to the residents’ lack of conscious and active efforts to take responsibility and
direct action for protecting their resources.
Table 21. Top perceived threats to coastal resources, Barangay Cawayan, Bongabong,
Oriental Mindoro, Philippines (n=167).
Mangroves Coral Reefs Seagrass Beach
None – 0.0% None – 1.8% None – 1.2% None – 0.6%
DK/NA – 9.6% DK/NA – 33.6% DK/NA – 32.3% DK/NA – 22.2%
Illegal logging Natural phenomenon Natural
phenomenon
Soil erosion from
the uplands
Charcoal making Illegal fishing Illegal fishing Natural
phenomenon
Natural
phenomenon
Dynamite/blast fishing fishing using
dragnets/ gleaning
Pollution due to
garbage dumping
Cutting for
household use
Clearing/mining/digging Pollution due to
dumping of garbage
Beach erosion/sea
level rise
Cutting for
commercial use
Cyanide/compressor
fishing
Cutting of aroma
tree
Note: DK/NA – do not know/not applicable

38
Table 22. Top perceived threats to non-coastal resources, Barangay Cawayan, Bongabong,
Oriental Mindoro, Philippines (n=167)
Upland Forests Rivers And Creeks Ground Water
None – 1.2% None – 0.0% None – 4.2%
DK/NA -30.6% DK/NA – 33.4% DK/NA – 35.3%
Charcoal making Soil erosion Inadequate water supply
Kaingin/slash and farming Pollution/dumping of
garbage
Natural phenomenon
Illegal logging Natural phenomenon Dumping of garbage
Natural phenomenon
Cutting trees for household
use
Note: DK/NA – do not know/not applicable
4.3.7. Awareness of Resource Rules and Regulations
Residents are most aware of rules and regulations on fishing (76%), mangroves
(75%), aquaculture (66.5%), water sports (45.5%), pebble gathering (65.9%), and resort
development (45.5%) (Table 23). It is noted that about half of residents gave “not applicable”
answers with respect to resort/pension/hotel development (54.5%), residential development
(52.5%) and water sports (54.5%). These responses suggest that these resource uses/activities
do not impinge on their daily economic or social lives. Except for fishing, most of the
resource use/activity rules and regulations that the residents are aware of originated from the
municipal government.

39
Table 23. Awareness of resource rules and regulations, Barangay Cawayan, Bongabong,
Oriental Mindoro, Philippines (n=167).
Resource Used/
Activity
Awareness of Rules and
Regulations
Origin of Regulation
None Yes Don’t
Know/No
answer
Not
Apply
Barangay Mun/
City
Prov/
Natl
None/
Missing
Fishing 32
(19.2)
127
(76.0)
8
(4.8)
113
(67.7)
6
(3.6)
8
(4.8)
40
(24.0)
Mangroves 30
(18.0)
126
(75.)
11
(6.6)
42
(25.1)
82
(49.1)
2
(1.2)
41
(24.6)
Aquaculture 42
(25.1)
111
(66.5)
14
(8.4)
25
(15.0)
81
(48.5)
5
(3.0)
56
(33.5)
Resort/pension/hotel
development
76
(45.5)
91
(54.5)
76
(45.5)
91
(54.5)
Residential
development
4
(2.4)
76
(45.5)
87
(52.1)
4
(2.4)
163
(97.6)
Watersports
76
(45.5)
91
(54.5)
76
(45.5)
91
(54.5)
Pebble gathering 43
(25.7)
110
(65.9)
14
(8.4)
32
(19.2)
77
(46.1)
1
(0.6)
57
(34.1) Note: Figures enclosed in parentheses are the corresponding percentages for each category.
Based on the FGD with key informants, the rules and regulations in fisheries which
the residents are aware of are the prohibition of using dynamites, cyanide and other
poisonous substances in fishing. They are also aware of the intrusion of commercial fishing
gears in their municipal waters. Similar to the household interview findings, key informants
were also unaware of the rules and regulations in aquaculture, resort and hotel development
since these activities do not exist in Cawayan.
It appears that more of the known resource rules and regulations come primarily from
the village council and secondarily from the Municipality of Bongabong as attributed by the
residents themselves. There were very few who said that the resource rules and regulations
they are aware of were enacted at the provincial or national levels.
The FGD participants further revealed that the residents of Cawayan perceived that
the rules in fishing and conservation of mangroves are highly implemented. They also
perceived that community residents have high compliance with the coastal resource

40
management rules and regulations in fishing and the conservation of mangroves. In contrast,
there is only moderate compliance with aquaculture rules and regulations.
4.3.8. Participation in Decision Making
The residents’ current level of participation in decision making is focused on
activities related to fishing, mangroves, pebble gathering, and aquaculture (Table 24). This
can simply be explained by the residents’ involvement in these activities because of their
livelihood. The other resource uses/activities are non-existent in the community as indicated
by the big number of “not applicable” response.
Table 24. Current and desired levels of participation in decision making. Barangay Cawayan,
Bongabong, Oriental Mindoro, Philippines (n=167).
Activity Rating Scores*
1 2 3 4 5
Fishing Current 47
(28.1)
4
(2.4)
6
(3.6)
7
(4.2)
103
(61.7)
Desired
45
(26.1)
1
(0.6)
121
(72.5)
Mangroves Current 55
(32.9)
5
(3.0)
6
(3.6)
101
(60.5)
Desired 1
(0.6)
44
(26.3)
3
(1.8)
119
(71.3)
Aquaculture Current 134
(80.2)
3
(1.8)
5
(3.0)
6
(3.6)
19
(11.4)
Desired 76
(45.5)
45
(26.9)
4
(2.4)
42
(25.1)
Residential
development
Current 78
(46.7)
3
(1.8)
2
(1.2)
1
(0.6)
Desired 76
(45.5)
1
(0.6)
2
(1.2)
1
(0.6)
Pebble
gathering
Current 57
(34.1)
3
(1.8)
5
(3.0)
5
(3.0)
97
(58.1)
Desired 2
(1.2)
1
(0.6)
43
(25.7)
2
(1.2)
119
(71.3) Note: Rating is on a scale of 1 – 5, with 1- no participation, and 5 – full participation

41
On a scale of 1 to 5 where 1 is no participation and 5 is full participation, current
participation levels are at both extremes – no participation and full participation (Table 24).
The highest current participation levels were in fishing ( x = 3.69), and mangroves ( x =
3.59), and pebble gathering ( x = 3.49). (Table 25). On the other hand, the residents expressed
none to very little participation in aquaculture ( x = 1.64) and residential development ( x =
1.15)
Table 25. Means and standard deviations of ratings of participation in decision making,
Barangay Cawayan, Bongabong, Oriental Mindoro, Philippines (n=167).
Resource Used/ Activity Current Level of Participation Desired Level of
Participation
N Mean Std Dev N Mean Std Dev
Fishing 167 3.69 1.79 167 4.46 0.89
Mangroves 167 3.59 1.86 167 4.43 0.92
Aquaculture 167 1.64 1.37 167 2.62 1.65
Residential development 84 1.15 0.65 80 1.10 0.47
Pebble gathering 167 3.49 1.88 167 4.41 0.97
Majority of the residents expressed a desire for full participation in three resource
uses/activities, namely: fishing, mangroves, and pebble gathering. More of their responses
for desired levels of participation were in the 4 to 5 ratings (Table 24). Hence, the mean
rating scores for desired levels of participation in these three areas are all uniformly high at
4.41 to 4.46 (Table 25). In contrast, most residents still desired no participation in
aquaculture and residential development. The residents do not and may not want to
participate in decision making in aquaculture and residential development because. Many
consider that such activities are not related to their livelihood or are deemed to be outside
their locus of control/responsibility.
The paired differences between individuals’ respective current and desired levels of
participation in decision making are all statistically significant at the .01 level (Table 26).
The only exception is for residential development. These means imply that generally, a
resident’s desired level is higher than his/her current level of participation in fishing,
mangroves, aquaculture, and pebble gathering. Community and local leaders may thus be

42
able to tap residents and encourage them to be more participative in decision making, since
there is an innate desire for them become more engaged.
Table 26. Comparisons of current and desired levels of participation in decision making
Barangay Cawayan, Bongabong, Oriental Mindoro, Philippines (n=167).
Resource Use/ Activity
Paired
Corr
Paired Differences
t-value Df
Sig.
(2-tailed) Mean SD
Fishing .710** .766 1.32 7.52 166 .000**
Mangroves .816** .844 1.23 8.89 166 .000**
Aquaculture .639** .976 1.31 9.64 166 .000**
Resort/pension/hotel
development
.848* -.038 0.25 1.35 79 .181
Pebble gathering .734* .916 1.34 8.85 166 .000** * significant at the .05 level
* *significant at the .01 level
4.3.9. Membership in Resource Use Stakeholder Organization
Of the 452 household members who are at least 16 years old, 78.3% are not affiliated
with any resource use organization (Table 27). Some 18.8% are beneficiaries of 4P’s, a
welfare and subsistence program under the national government’s Department of Social
Welfare and Development (DSWD). As envisioned, the 4P’s program provides cash
assistance and other forms of subsidy to the “poorest of the poor” in the country. Hence, it is
not technically, a resource use stakeholder organization. The Card Bank, on the other hand,
is a private micro-finance business enterprise. Judging by the lack of other responses, it
appears that there are no existing resource use stakeholder organizations in the community.
Table 27. Household membership in resource use stakeholder organizations*, Barangay
Cawayan, Bongabong, Oriental Mindoro, Philippines (n=452).
No. of HH members Involved Freq %
4P’s 85 18.8
Card Bank 13 2.9
None/No information 354 78.3
Total 452 100.0
*For household members > 16 years

43
4.3.10. Perceptions of Coastal Resource Management Problems and Solutions
When asked to provide two top coastal management problems of the community,
residents of Barangay Cawayan gave varied answers as listed in Table 28. However, 38.3%
of them cited exploitation of coastal resources for household/commercial use as a primary
problem. Another top problem mentioned by 14.4% of the respondents is decrease in fish
catch/available coastal resource which is also related to exploitation of coastal resources. To
a lesser degree but still on the top five highest frequencies are the following: mangrove
cutting, natural calamities, and illegal fishing/use of cyanide. It is noted that though there are
clear indications that the coastline of the village has been heavily experiencing erosion within
the past years, only very few residents considered this a coastal management problem. Many
appears to accept this as a natural phenomenon and the construction of a dike is its perceived
solution.
Table 28. Perceived coastal management problems, Barangay Cawayan, Bongabong,
Oriental Mindoro, Philippines (n=167).
Coastal Management Problems Problem 1 Problem 2 Combined
No. % No. % No. %
Livelihood related to coastal resource utilization 1 0.6 1 0.6
Mangrove cutting 12 7.2 1 0.6 13 7.8
Natural calamities 8 4.8 4 2.4 12 7.2
Sea level rise/sand erosion 2 1.2 4 2.4 6 3.6
Entry of other fishers from outside areas 4 2.4 5 3.0 9 5,4
Decrease in fish catch/available coastal resources 23 13.8 1 0.6 24 14.4
exploitation of coastal resource for HH/commercial
use
64 38.3 64 38.3
Sanitation (Pollution and garbage dumping; waste
management)
1 0.6 1 0.6 2 1.2
Illegal fishing/use of cyanide in fishing 9 5.4 2 1.2 11 6.6
Ignorance of laws related to coastal management 1 0.6 1 0.6 2 1.2
Not organized management (Bantay
Dagat/BFARMC/ village officials 1
0.6 1 0.6 2 1.2
Others (Stealing, illegal logging) 4 2.4 1 0.6 5 3.6
Sub-total 130 77.8
No response 0 0.0 76 45.5
Don’t know 37 22.2 70 41.9

44
About 5 out of every 10 residents perceived that mangrove planting/reforestation is a
solution to their primary coastal management problems (Table 29). Another 19.8% suggested
solutions that fall under governance – enforcement such as strict implementation of fishing
laws or barangay ordinance and prevention of intrusive commercial fishing vessels within
their municipal waters. Other suggested solutions were the practice of proper waste
management and the conduct of orientation/seminar on the proper utilization of coastal
resources. A summary of the top coastal management problems and solutions perceived by
the community is provided in Table 30.
Table 29. Perceived solutions to coastal management problems, Barangay Cawayan,
Bongabong, Oriental Mindoro, Philippines (n=167).
Coastal Management Problems Problem 1 Problem 2 Combined
No. % No. % No. %
Governance – enforcement (Strict implementation of
fishing laws/village ordinance, Prevent intrusion of
commercial fishing vessel)
21 12.6 12 7.2 33 19.8
Community mobilization: Proper waste
disposal/management
14 8.4 1 0.6 15 9.0
Governance-education (Conduct orientation/
seminar related to proper utilization of coastal
resources )
3 1.8 7 4.2 10 6.0
Livelihood project 5 3.0 3 1.8 8 4.8
Mangrove planting/conservation 77 46.1 2 1.2 79 47.3
Infrastructure: Dike construction 5 3.0 2 1.2 7 4.2
Others 1 0.6 1 0.6
Financial assistance 2 1.2 2 1.2
Sub-total 126 75.4 29 37.1 126 75.4
Don’t know 41 24.6 62 42.5
None 76 46.1

45
Table 30. Top perceived coastal management problems and solutions, Barangay Cawayan,
Puerto Princesa City, Philippines (n=167)
None – 0%
Don’t know/not concerned – 22.2%
With answer – 71.8%
None – 0%
Don’t know/not concerned – 24.6%
With answer –75.4%
1. Exploitation of coastal resource for
HH/commercial use
2. Decrease in fish catch/available
coastal resources
3. Mangrove cutting
4. Natural calamities
1. Mangrove planting/conservation
2. Governance – enforcement (Strict
implementation of fishing laws/barangay
ordinance, Prevent intrusion of commercial
fishing vessel)
3. Community mobilization: Proper waste
disposal/management
4. Governance-education (Conduct
orientation/seminar related to proper
utilization of coastal resources )
4.3.11. Perceptions of Coastal Management Successes and Challenges
Only 68.9% enumerated one or two successes in the community in relation to
coastal management. Nonetheless, there is an overwhelming response that mangrove
planting/conservation is a success as mentioned by 104 (62.3%) residents (Table 31). To a
much lesser extent, coastal cleanliness and the existence of a protected fish sanctuary were
also mentioned as successes by a number of respondents.
Table 31. Perceived successes in coastal management, Barangay Cawayan, Bongabong,
Oriental Mindoro, Philippines (n=167).
Coastal Management Success Success1 Success 2 Combined
No. % No. % No. %
Mangrove planting/conservation 102 61.1 2 1.2 104 62.3
Community mobilization (Coastal cleanliness) 1 0.6 11 6.6 12 7.2
Governance-enforcement (Protected fish
sanctuary) 5
3.0 6 3.6 11 6.6
Governance-policy (formulating and
implementing barangay ordinance) 5
3.0 5 3.0
Peace and order 2 1.2 2 1.2 4 2.4
Sub-total 115 68.9
Don’t know/no response 52 31.1 70 41.9
None 0 0.0 76 45.5
Total 167 100.0
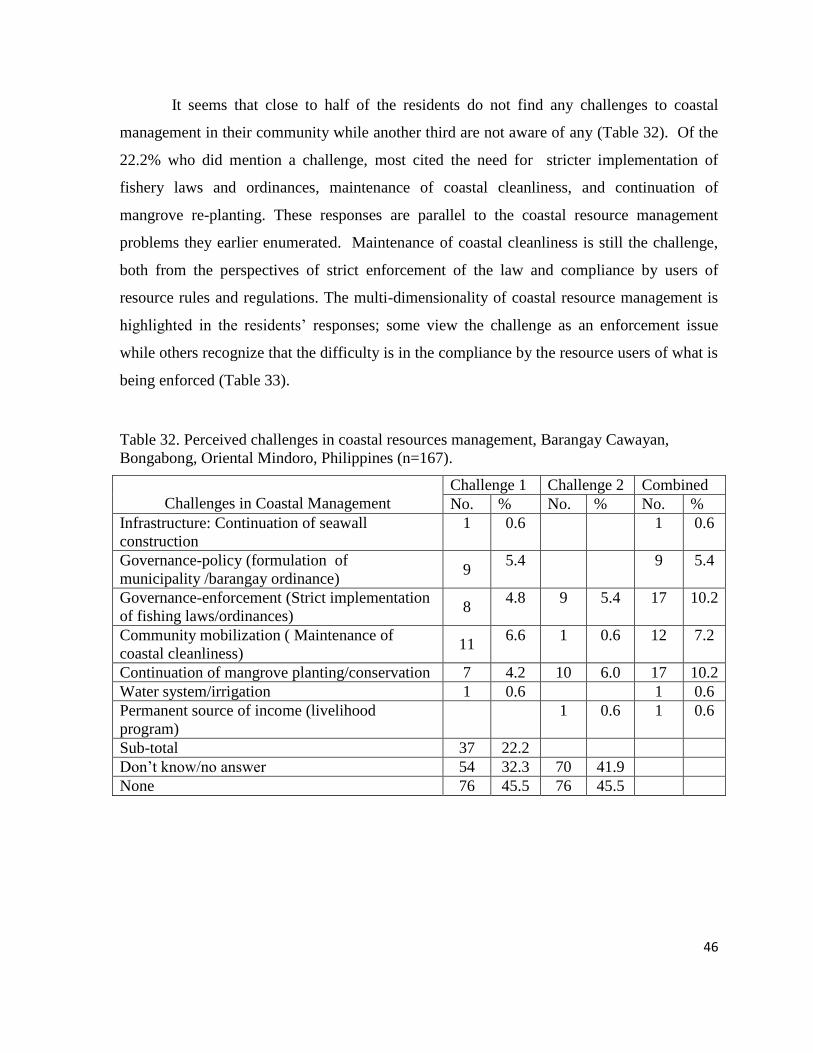
46
It seems that close to half of the residents do not find any challenges to coastal
management in their community while another third are not aware of any (Table 32). Of the
22.2% who did mention a challenge, most cited the need for stricter implementation of
fishery laws and ordinances, maintenance of coastal cleanliness, and continuation of
mangrove re-planting. These responses are parallel to the coastal resource management
problems they earlier enumerated. Maintenance of coastal cleanliness is still the challenge,
both from the perspectives of strict enforcement of the law and compliance by users of
resource rules and regulations. The multi-dimensionality of coastal resource management is
highlighted in the residents’ responses; some view the challenge as an enforcement issue
while others recognize that the difficulty is in the compliance by the resource users of what is
being enforced (Table 33).
Table 32. Perceived challenges in coastal resources management, Barangay Cawayan,
Bongabong, Oriental Mindoro, Philippines (n=167).
Challenges in Coastal Management
Challenge 1 Challenge 2 Combined
No. % No. % No. %
Infrastructure: Continuation of seawall
construction
1 0.6 1 0.6
Governance-policy (formulation of
municipality /barangay ordinance) 9
5.4 9 5.4
Governance-enforcement (Strict implementation
of fishing laws/ordinances) 8
4.8 9 5.4 17 10.2
Community mobilization ( Maintenance of
coastal cleanliness) 11
6.6 1 0.6 12 7.2
Continuation of mangrove planting/conservation 7 4.2 10 6.0 17 10.2
Water system/irrigation 1 0.6 1 0.6
Permanent source of income (livelihood
program)
1 0.6 1 0.6
Sub-total 37 22.2
Don’t know/no answer 54 32.3 70 41.9
None 76 45.5 76 45.5
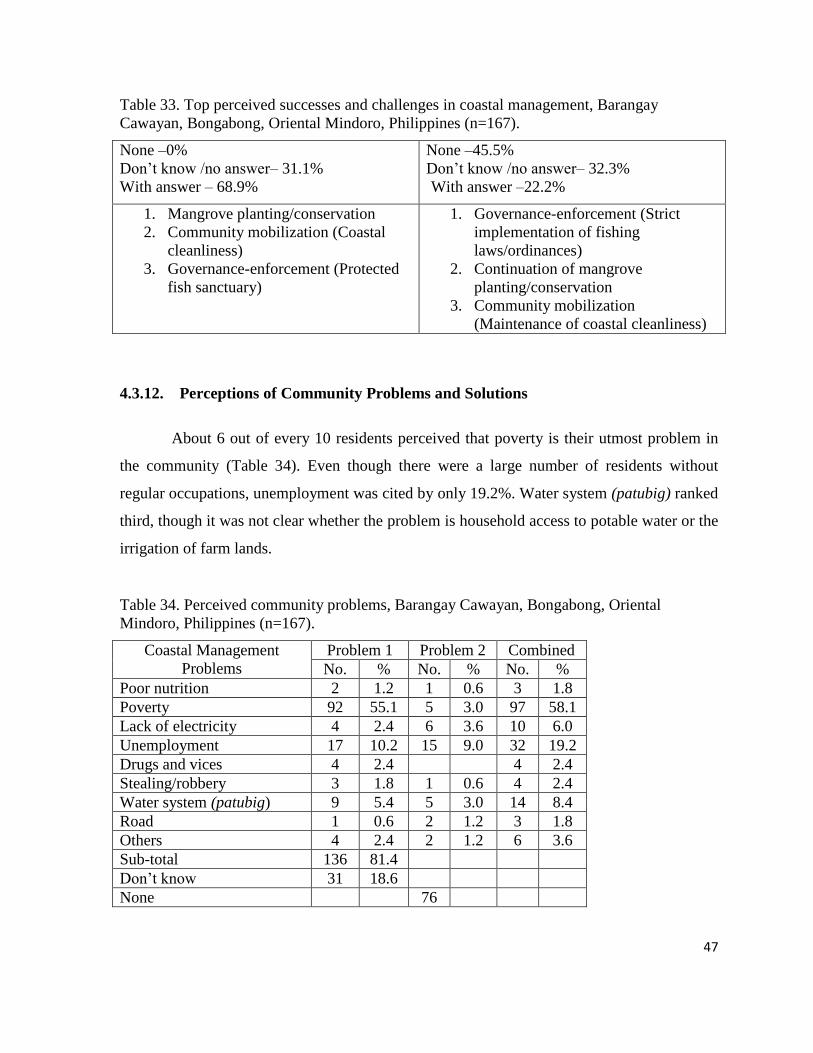
47
Table 33. Top perceived successes and challenges in coastal management, Barangay
Cawayan, Bongabong, Oriental Mindoro, Philippines (n=167).
None –0%
Don’t know /no answer– 31.1%
With answer – 68.9%
None –45.5%
Don’t know /no answer– 32.3%
With answer –22.2%
1. Mangrove planting/conservation
2. Community mobilization (Coastal
cleanliness)
3. Governance-enforcement (Protected
fish sanctuary)
1. Governance-enforcement (Strict
implementation of fishing
laws/ordinances)
2. Continuation of mangrove
planting/conservation
3. Community mobilization
(Maintenance of coastal cleanliness)
4.3.12. Perceptions of Community Problems and Solutions
About 6 out of every 10 residents perceived that poverty is their utmost problem in
the community (Table 34). Even though there were a large number of residents without
regular occupations, unemployment was cited by only 19.2%. Water system (patubig) ranked
third, though it was not clear whether the problem is household access to potable water or the
irrigation of farm lands.
Table 34. Perceived community problems, Barangay Cawayan, Bongabong, Oriental
Mindoro, Philippines (n=167).
Coastal Management
Problems
Problem 1 Problem 2 Combined
No. % No. % No. %
Poor nutrition 2 1.2 1 0.6 3 1.8
Poverty 92 55.1 5 3.0 97 58.1
Lack of electricity 4 2.4 6 3.6 10 6.0
Unemployment 17 10.2 15 9.0 32 19.2
Drugs and vices 4 2.4 4 2.4
Stealing/robbery 3 1.8 1 0.6 4 2.4
Water system (patubig) 9 5.4 5 3.0 14 8.4
Road 1 0.6 2 1.2 3 1.8
Others 4 2.4 2 1.2 6 3.6
Sub-total 136 81.4
Don’t know 31 18.6
None 76

48
To address the problem of poverty, 84.3% of the residents believe that the solution is
the provision of livelihood programs (Tables 35 and 36). It is evident that most of the
residents connect their poor economic conditions to their lack of productivity as manifested
by their unemployment and hence, the need for livelihood opportunities. As water system
ranks third among their problems, it is not surprising that the installation of pipes and a water
system also ranked second as a perceived solution. Though only a minority are affected,
some households do not have access to electricity yet. Thus, they consider its installation to
their residences as a solution to their community problem.
Table 35. Perceived solutions to community problems, Barangay Cawayan, Bongabong,
Oriental Mindoro, Philippines (n=167).
Coastal Management Problems Problem 1 Problem 2 Combined
No. % No. % No. %
Livelihood programs 112 67.1 20 12.0 122 87.1
Financial assistance 1 0.6 2 1.2 3 1.8
Installation of electricity 5 3.0 5 3.0 10 6.0
Active involvement of village officials/tanods 5 3.0 1 0.6 6 3.6
Intensified health services 2 1.2 1 0.6 3 1.8
Road construction 1 0.6 2 1.2 3 1.8
Construction of water system 8 4.8 5 3.0 13 7.8
Sub-total 134 80.2 36 21.6
Don’t know/no answer 33 19.8 55 32.9
None 0 0.0 76 45.5
Table 36. Top perceived community problems and solutions, Barangay Cawayan,
Bongabong, Oriental Mindoro, Philippines (n=167)
None –0%
don’t know /no answer–18.6%
With answer – 81.4%
None –0%
don’t know /no answer– 19.8%
With answer –80.2%
1. Poverty
2. Unemployment
3. Water system (patubig)
1. Livelihood programs
2. Construction of water system
3. Installation of electricity
49
4.3.13. Governance
The community declared that there are management bodies that oversee fishing
activities and coastal management in Barangay Cawayan. However, these bodies are said to
have no management plan even though there is an enabling legislation for this management
body to function. According to village leaders, there is a BFARMC (Barangay Fishery and
Aquatic Resource Management Council). Nonetheless, it is currently inactive because of an
unresolved issue as to who should be heading it. Community residents also consider fishers
from other barangays of their municipality who use their fishing ground as intruders even if
there is no such regulation that prevents fishers from one village fishing in the coastal waters
of another village within the same municipality.
4.4. Recommendations
From these findings, the following are recommended:
1. Verify the bio-physical status of the resources in the community to validate the
residents’ perceptions with regard to the conditions of their coastal and non-coastal
resources.
2. Monitor the resource areas to determine if the threats cited are still continuing up to
the present so that necessary actions to mitigate and/or eliminate the threat can be
taken.
3. Revitalize the BFARMC and Bantay Dagat as community-based organizations
spearheading the protection of the coastal resources within the community. The
leadership issue of the BFARMC also needs to be resolved so that the organization
can move forward and perform its mandated tasks.
4. Undertake wider dissemination of environmental rules and regulations not only to the
resource users but to the community at large to make resource protection and
conservation a “community affair”. This is because awareness of resource rules and
regulations are mostly limited to the actual resource users.
5. Organize and/or strengthen agriculture-related stakeholder organizations so that more
farmers can get involved in communal decision making. Barangay Cawayan is a

50
combined farming/fishing community with more households relying on farming
rather than fishing as their occupation.
6. Designate environmental police personnel in critical areas who can immediately
respond and confront violators. Give greater attention to the governance dimension,
more specifically on enforcement of rules in coastal management. Although the
BFARMC and Bantay Dagat members are deputized to apprehend offenders, they
hesitate to do so because of the attendant risks to their lives.
7. Harmonize policies being implemented by concerned government agencies.
Although 15 km from the shoreline is the limit for municipal waters, commercial
fishing vessels are allowed to operate beyond 10 km from the shoreline.
8. Consider policy options that would ease the pressure on exploitation of coastal
resources and fishery by using some of these measures: limitation of fishing to hook
and line methods, designation of no-take zones, and prohibition of commercial fishers
within municipal waters. Residents are already aware that there is over-extraction as
evidenced by decreased fish catches. This declining trend shall continue unless
interventions are introduced to allow the fishery to recover.
9. Explore alternative/supplemental livelihood opportunities that would allow
community residents to become entrepreneurs and/or self-employed. The assistance
should not only be limited to training and capital support but must also include
organizational and marketing support. Fishers are already experiencing decreasing
fish catch. Limiting fishing and resource use activities may further result to reduced
income for them, in the short term. Hence, more viable alternative and/or
supplemental livelihoods to fishing need to be introduced.
10. Mobilize more community residents for coastal clean-ups, waste segregation
programs, and monitoring/reporting of violators of resource rules and regulations.
The more residents are involved in community work, the greater would be their sense
of community responsibility and involvement.
11. Conduct and/or intensify information and education campaigns among all residents
on the proper utilization and conservation of coastal resources. Emphasis may be
given to an ecosystem approach and focus on the role of community members both as

51
a user and steward of such resources. There is a need to empower the residents and
change their perception that natural phenomena are threats to almost all their
resources.
12. Conduct more technical studies on the main factors that are associated with sea level
rise/sand erosion in the village’s coastal areas. In this way, the most efficient
mitigation and/or adaptive measures can be adopted by the community. Barangay
Cawayan would be a very good case study for climate change–related research.
13. Use the SocMon research results to update community and municipal/city level
development plans and to serve as basis for policy formulation and evaluation.
14. Undertake the same baseline in the future. Because the data presented herein were
collected in order to establish baseline conditions at Barangay Cawayan, it is also
recommended that a similar undertaking be conducted three or five years from now in
order to track changes and trends that may occur.

52
4.5. Bibliography
Alconices, A. M. and V. M. Bartolome. 2006. Coastal Environment Profile of Bongabong,
Oriental Mindoro, Coastal Management Project- Provincial Government of Oriental
Mindoro. Oriental Mindoro.
Bunce, L. and Pomeroy, R. S. 2000. Socioeconomic monitoring guidelines for coastal
managers in Southeast Asia: SocMon SEA. World Commission on Protected Areas
and Australian Institute of Marine Science, Australia.
Bunce L, Townsley P, Pomeroy R, Pollnac R. 2003. Socioeconomic manual for coral reef
management. Australian Institute of Marine Science, Australia.
Municipality of Bongabong. 2010. Barangay Cawayan Socio-economic Profile and
Development Plan. Oriental Mindoro.
Municipality of Bongabong. 2010. Community Based Monitoring System Database.
Oriental Mindoro.
This document may be cited as:
PSU-MinSCAT (Palawan State University-Mindoro State College of Agriculture and
Techonology ). 2012. SocMon Site Report in Barangay Cawayan, Bongabong, Oriental
Mindoro, Philippines. 52 p. Center for Strategic Policy and Governance/Palawan State
University, Puerto Princesa City.

203
Part 5 SocMon Site Report Barangay
Masaguisi, Bongabong, Oriental Mindoro
“Socioeconomic Monitoring (SocMon) Program in the
Philippines to Support Effective Coral Reef Conservation and
Coastal Resources Management: Initiation in Oriental Mindoro
Province and Continuation in Puerto Princesa City, Palawan
Province”

Socioeconomic Monitoring (SocMon) Program in the Philippines to Support Effective
Coral Reef Conservation and Coastal Resources Management: Initiation in Oriental Mindoro
Province and Continuation in Puerto Princesa City, Palawan Province
SocMon Site ReportBarangay Masaguisi, Bongabong
Oriental Mindoro, PhilippinesCenter for Strategic Policy and Governance
Palawan State UniversityPuerto Princesa City
Mindoro State College of Agriculture and Technology (MinSCAT)Bongabong, Oriental Mindoro
September 2012

2
Table of Contents
List of Tables ............................................................................................................................ 3
List of Figure............................................................................................................................. 5
List of Acronyms and Abbreviations ........................................................................................ 5
Summary ................................................................................................................................... 7
5.1. Introduction .................................................................................................................. 10
5.2 Methodology ................................................................................................................ 12
5.3 Summary of Results ..................................................................................................... 14
5.3.1 Household Demographics ........................................................................................ 14
5.3.2 Household Members’ Occupations and Income Sources ......................................... 17
5.3.3 Coastal and Marine Activities ................................................................................. 21
5.3.4 Attitudes towards Non-Market and Non-Use Values of Resources ........................ 22
5.3.5 Perceptions of Resource Conditions ....................................................................... 26
5.3.6 Perceived Threats to Resources................................................................................ 28
5.3.7 Awareness of Resource Rules and Regulations ...................................................... 36
5.3.8 Participation in Decision Making ............................................................................. 38
5.3.9. Membership in Resource Use Stakeholder Organizations ........................................ 40
5.3.10 Perceptions of Coastal Management Problems and Solutions ............................... 41
5.3.11 Perceptions of Successes and Challenges in Coastal Management ......................... 44
5.3.12 Perceptions of Community Problems and Solutions ................................................ 46
5.3.13 Governance............................................................................................................... 48
5.4. Recommendations ........................................................................................................ 49
5.5 Bibliography ................................................................................................................ 51

3
List of Tables
Table 1. Household demographic characteristics, Barangay Masaguisi, Bongabong, Oriental
Mindoro, Philippines (n= 139) ................................................................................... 15
Table 2. Summary quantitative indices for household size and age, Barangay Masaguisi,
Bongabong, Oriental Mindoro, Philippines (n=139) .................................................. 16
Table 3. Socio-cultural characteristics of household members, Barangay Masaguisi,
Bongabong, Oriental Mindoro, Philippines (n=139) .................................................. 17
Table 4. Primary and secondary occupations of household members*, Barangay Masaguisi,
Bongabong, Oriental Mindoro, Philippines (n=139) .................................................. 18
Table 5. Most important income sources of households, Barangay Masaguisi, Bongabong,
Oriental Mindoro, Philippines (n=139) ...................................................................... 19
Table 6. Material style of life, Barangay Masaguisi, Bongabong, Oriental Mindoro,
Philippines (n=139) ..................................................................................................... 20
Table 7. Attitudes towards non-market and non-use values of resources, Barangay
Masaguisi, Bongabong, Oriental Mindoro, Philippines (n=139) ................................ 23
Table 8. Means and standard deviations of rating scores of attitudes towards non-market and
non-use values of coastal resources, Barangay Masaguisi, Bongabong, Oriental
Mindoro, Philippines (n=139) .................................................................................... 23
Table 9. Aggregate rating scores on attitudes towards non-market and non-use values of
coastal resources, Barangay Masaguisi, Bongabong, Oriental Mindoro, Philippines
(n=139) ........................................................................................................................ 25
Table 10. Means and standard deviations of aggregate rating scores on attitudes towards non
market and non-use values 0f coastal resources, Barangay Masaguisi, Bongabong,
Oriental Mindoro, Philippines (n=139) ...................................................................... 25
Table 11. Perceptions of resource conditions, Barangay Masaguisi, Bongabong, Oriental
Mindoro, Philippines (n=139) ..................................................................................... 26
Table 12. Means and standard deviations of ratings on perceived Resource conditions,
Barangay Masaguisi, Bongabong, Oriental Mindoro, Philippines (n=139) ............... 27
Table 13. Perceived threats to mangroves, Barangay Masaguisi, Bongabong, Oriental
Mindoro, Philippines (n=139) ..................................................................................... 29
Table 14. Perceived threats to coral reefs, Barangay Masaguisi, Bongabong, Oriental
Mindoro, Philippines (n=139) ..................................................................................... 30
Table 15. Perceived threats to upland forests, Barangay Masaguisi, Bongabong, Oriental
Mindoro, Philippines (n=139) ..................................................................................... 31
Table 16. Perceived threats to seagrass, Barangay Masaguisi, Bongabong, Oriental Mindoro,
Philippines (n=139) ..................................................................................................... 32
Table 17. Perceived threats to beach, Barangay Masaguisi, Bongabong, Oriental Mindoro,
Philippines (n=139) ..................................................................................................... 33
Table 18. Perceived threats to rivers/creeks, Barangay Masaguisi, Bongabong, Oriental
Mindoro, Philippines (n=139) ..................................................................................... 34

4
Table 19. Perceived threats to ground water, Barangay Masaguisi, Bongabong, Oriental
Mindoro, Philippines (n=139) ..................................................................................... 35
Table 20. Top perceived threats to coastal resources, Barangay Masaguisi, Bongabong,
Oriental Mindoro, Philippines (n=139) ...................................................................... 36
Table 21. Top perceived threats to non-coastal resources, Barangay Masaguisi, Bongabong,
Oriental Mindoro, Philippines (n=139) ...................................................................... 36
Table 22. Awareness of resource rules and regulations, Barangay Masaguisi, Bongabong,
Oriental Mindoro, Philippines (n=139) ...................................................................... 37
Table 23. Current and desired levels of participation in decision making, Barangay
Masaguisi, Bongabong, Oriental Mindoro, Philippines (n=139) ................................ 38
Table 24. Means and standard deviations of ratings of participation in decision making,
Barangay Masaguisi, Bongabong, Oriental Mindoro, Philippines (n=139) ............... 39
Table 25. Comparisons of current and desired levels of participation in decision making,
Barangay Masaguisi, Bongabong, Oriental Mindoro, Philippines (n=139) ............... 40
Table 26. Household membership in resource use stakeholder organizations, Barangay
Masaguisi, Bongabong, Oriental Mindoro, Philippines (n=139) ................................ 41
Table 27. Perceived coastal management problems, Barangay Masaguisi, Bongabong,
Oriental Mindoro, Philippines (n=139) ...................................................................... 42
Table 28. . Perceived solutions to coastal management problems, Barangay Masaguisi,
Bongabong, Oriental Mindoro, Philippines (n=139) .................................................. 43
Table 29. Top perceived coastal management problems and solutions, Barangay Masaguisi,
Bongabong, Oriental Mindoro, Philippines (n=139) .................................................. 43
Table 30. Perceived successes in coastal management, Barangay Masaguisi, Bongabong,
Oriental Mindoro, Philippines (n=139) ...................................................................... 44
Table 31. Perceived challenges in coastal resources management, Barangay Masaguisi,
Bongabong, Oriental Mindoro, Philippines (n=139) .................................................. 45
Table 32. Top perceived successes and challenges in coastal management, Barangay
Cawayan, Bongabong, Oriental Mindoro, Philippines (n=139) ................................ 46
Table 33. Perceived community problems, Barangay Masaguisi, Bongabong, Oriental
Mindoro, Philippines (n=139) ..................................................................................... 46
Table 34. Table 34. Perceived solutions to community problems, Barangay Masaguisi,
Bongabong, Oriental Mindoro, Philippines (n=139) .................................................. 47
Table 35. Top perceived community problems and solutions , Barangay Masaguisi,
Bongabong, Oriental Mindoro, Philippines (n=139) .................................................. 47

5
List of Figures
Figure 1. Location Map of Barangay Masaguisi, Bongabong, Oriental Mindoro Philippines.
................................................................................................................................ 10
Figure 2. Mean ratings for items on attitudes towards non-market and non-use values
(n=139). .................................................................................................................. 24
Figure 3. Mean ratings of perceived resource conditions at Barangay Masaguisi, Bongabong,
Oriental Mindoro (n=139) ...................................................................................... 28
List of Acronyms and Abbreviations
BFARMC Barangay Fisheries and Aquatic Resources Management Council
BHW Barangay Health Workers
FGD focused group discussions
ha hectares
HH household
HHI household interview
KALAHI-CIDSS Kapit Bisig Laban sa Kahirapan Comprehensive and Integrated
Delivery of Social Services
KI key informant
LPG liquified petroleum gas
MinsCAT Mindoro State College of Agriculture and Trade
NGO non-government organization
km kilometers
KII key informant interview
SocMon Socioeconomic Monitoring
SEA Southeast Asia

6
“Socioeconomic Monitoring (SocMon) Program in the Philippines to Support Effective
Coral Reef Conservation and Coastal Resources Management: Initiation in Oriental
Mindoro Province and Continuation in Puerto Princesa City, Palawan Province”
Institutional Partners and Members
Mindoro State College of Arts and Technolology
Edna Piol
Magdalena Elaydo
Rhea de Guzman
Nilo Royo
Mylene Catapang
Angelita Baldon
Rolando Urate
Rosalia Soriano
Randy Quitain
Jean Gayeta
Jessica Enriquez
Regal Izon
Sheryl Dino
Gerolyn Bacudo
Eva Brinosa
Myla Izon
Palawan State University
Michael Pido
Marissa Pontillas
Eva Marie Ponce de Leon
Nelly Mendoza
Gianina Decano
Phabe Tabucalde
Jose Buenconsejo
Mary Aileen delas Alas

7
Summary
Introduction
Understanding socioeconomic factors and the communities’ relationship to coastal
and marine resources is crucial for the success of marine conservation. This is addressed
through socioeconomic monitoring, a global initiative for coastal management being
undertaken in the Southeast Asian Region through the Socioeconomic Monitoring Southeast
Asia (SocMon SEA). This report provides a synopsis of the socio-economic monitoring
(SocMon) conducted in Barangay Masaguisi, Municipality of Bongabong, Oriental Mindoro
Province, Philippines. The goal of this project is to propagate the use of socioeconomic
monitoring (SocMon) among academics, researchers, policy makers, and coastal managers
thereby enhancing coral reef conservation and coastal resources management.
Methodology
The SocMon methodology followed three major steps. The first part was advance
preparation that included defining the objectives of SocMon, establishing the SocMon team
and preparing the logistics. The second part was data collection, which was the generation of
field data using three complementary research methods namely, household interview (HHI),
key informant interview (KII), and focused group discussions (FGD). The number of
respondents is as follows: HHI – 139 households; KII – 9; and FGD – 1. Field data were
gathered from June 2011 to August 2012 in Barangay Masaguisi, Bongabong. The third part
was analysis of both qualitative and quantitative data, while communication consisted of
disseminating the results to the relevant stakeholders. The Palawan State University took the
lead and the partners involved were the Mindoro State College of Agriculture and Trade
(MinsCAT) – Bongabong Campus and the Municipal Government of Bongabong.
Results and Discussion
Barangay Masaguisi is 16 kilometers (km) south of the town proper of Bongabong,
province of Oriental Mindoro, lying east of Tablas Strait. The village has a total land area of
434 hectares (ha) of which 70% is mostly agricultural land. As of 2010, the village

8
population stood at 2,459 residents in 451 households. Though Barangay Masaguisi may
have been traditionally regarded as a coastal village, there are now more residents whose
primary occupation is farming rather than fishing. Overall, 43% of the working age residents
were engaged in farming either as a primary or secondary occupation in contrast to the 25.4%
who were into fishing. There is high unemployment rate; 47.8% of residents aged at least 16
years old do not have a regular occupation. About 52.6% of the households had very low or
low material style of life as reflected in their use of light materials such as bamboo and nipa
for their residential dwellings.
Aside from valuing their natural resources because of the direct economic and market
benefits derived therein, almost all residents recognize the indirect use and bequest values
of their resources more than their existence non-use values. They have highest appreciation
of the indirect non-market contribution of coral reefs and mangroves to the fisheries.
The community members generally perceived that all their resources are in good
condition, foremost of which is their ground water. Residents were most knowledgeable of
the threats to their mangroves and least knowledgeable of threats to their ground water. The
most often cited threats by those who knew of at least one threats were: charcoal making and
cutting for commercial/household use for mangroves; illegal fishing methods for coral reefs;
fishing using dragnets/gleaning for sea grass; natural phenomenon and garbage dumping for
both beach and rivers/creeks; conversion into residential settlements and charcoal making for
terrestrial forests; and natural phenomenon and water contamination due to sewage for
ground water. They are most aware of rules and regulations on fishing, mangroves
management, and aquaculture. Awareness of rules and regulations for the other resource
uses/activities - such as pebble gathering and residential development - are much lower.
Among household members aged at least 16 years old, a high 91.6% had no
membership in any resource use stakeholder organization. The residents’ current level of
involvement in resource use decision-making is mostly at the “no participation” level. The
residents’ current level of participation is low, but they expressed a greater desire to
participate in all resource uses/activities. Those who utilize the resource or are affected by
the resource activity desired to participate more than the others, suggesting that participation
9
in decision making can be easily generated among users/beneficiaries of a particular
resource,
Almost half of the residents do not know any coastal management problem in their
community. The other half gave at least one primary problem, with sanitation concerns, lack
of organized operation of Bantay Dagat/BFARMC, sea level rise/sand erosion, decrease in
fish catch, and the exploitation of coastal resource for household and commercial use as the
most cited coastal management problem. A large percentage (70.5%) of residents said that
there are no coastal management challenges in their community. For those who knew of at
least one challenge, the dike/seawall construction in the barangay is most cited, followed by
the continuing coastal cleanliness program.
Since unemployment is pervasive in the community, it was cited as a pressing
problem by 45.3% of the residents. The second most commonly cited community problem is
poverty which is also related to unemployment. Hence, livelihood programs are their
perceived solution to the community problem.
Alternative and/or supplemental livelihoods to fishing and farming need to be
explored in order for residents to become micro-entrepreneurs and self-employed. The
assistance need to be comprehensive to include not only training and capital investments, but
also organizational and marketing support. Sanitation concerns need to be addressed more
consistently through a systematic waste management program. Fishery rules and regulations
need to be constantly enforced by concerned agencies, particularly apprehending violators by
those who are trained and granted police powers. Finally, the initiative of the village council
to declare their reef area a fish sanctuary need to be supported by the Municipal Government
of Bongabong by fast-tracking the enactment of a municipal ordinance declaring the reef area
a fish sanctuary and by providing logistical support to ensure that the integrity of the zone
shall be established and maintained.

10
5.1. Introduction
Barangay Masaguisi is located in the southern part of the Municipality of Bongabong,
province of Oriental Mindoro. The barangay has a total land area of 434 hectares (ha) of
which 70% is mostly agricultural land. It is located 16 kilometers (km) away from the town
proper of Bongabong and is bounded on the east by Tablas Strait, on the north by Barangay
Anilao, on the west by Barangay Orconuma and on the south by Barangay Mina de Oro.
There are six sitios within the jurisdiction of Barangay Masaguisi. Its topography ranges
from flatlands to steep slopes.
Figure 1. Location Map of Barangay Masaguisi, Bongabong, Oriental Mindoro
Philippines.
Based from the records of the Sangguniang Barangay (Village Council) of Masaguisi
in 2010, the village has 2,459 residents composed of 1,109 males and 1,350 females. The
total number of households in the village is 451. The residents are fairly homogenous in
terms of ethnicity, religion, and occupation. The people are also heavily dependent on coastal
resources for survival and livelihood.

11
Being a coastal village, Masaguisi has rich fishing grounds; hence, fishing is
considered a major industry. In fact, the name of the village is derived from the fish species
called as snapper locally known as “saguisi” which was said to be abundant in its coastal
waters. Masaguisi thus means having plenty of saguisi. Previous reports estimate the number
of fishermen at 200 with some farmers also working as fishers to augment their income.
Some of the fishers use crude fishing gears. Part of the fishermen’s daily catch is marketed
within the village but good or high value catch are sold to the neighboring towns. Aside from
the fishing grounds, there is approximately 25 ha for fishponds. These fishponds are operated
by the private sector and have contributed to the economic development of the village.
Masaguisi is rich in natural resources. Sand and gravel abound in the area, especially
along rivers and stream banks. Coastal habitats support the coastal resource base. Cognizant
of Masaguisi reef’s relatively good coral cover and fish abundance, the village council of
Masaguisi has initiated activities to delineate and protect it as a fish sanctuary for the past
two years, even though the municipal government of Bongabong has not yet passed an
ordinance declaring the area as such. This shows that the village leadership within the
vicinity of the reef is organized and can be relied upon to manage the sanctuary. Estimated
percentage of hard coral cover for this site is 45.5% predominantly of mix non-acroporid
foliose (24.9%), submissive (11.2%), encrusting (4.3%), massive (3.7%), mushroom (0.8%)
and branching (0.6%) corals while Acropora corals are totally absent. Non–Acropora corals
are composed of the following genera: Porites, Diploastrea, Favites, Favia, Fungia,
Goniopora, Galaxea and Pavona. Though there are dead corals, they represent only 15.6%
of the total cover – of which 9.9% are without algae and 5.9% are with algae. Other fauna
such as sponges and crinoids with algal cover were relatively low at 9.26% and 0.80%
respectively (Municipality of Bongabong, 2005).
Barangay Masaguisi has potential to become a tourist destination since it has scenic
tourist spots being developed by some private individuals. There are beach houses to cater
tourists and vacationers, who can enjoy swimming and snorkelling along its shores. The
Kalinga Sea Wall is also frequently visited by local tourists. Tourism as an industry is
gradually becoming one of the income earners for the locality. Further development of

12
beaches will provide more local employment among the residents. The full development of
the said tourist spots will boost the economy and make the village more popular.
5.2 Methodology
Realizing the inter-relationship between a community’s socio-economic context and
its uses of coastal resources, the SocMon methodology was adopted. It is “a set of guidelines
for establishing a socioeconomic monitoring program at a coastal management site in
Southeast Asia” in order to gain an understanding of the social, cultural, economic, and
political characteristics and conditions of individuals, households, groups, and communities
(Bunce and Pomeroy, 2003).
The SocMon methodology provides a standardized set of 32 indicators and 28
indicators using key informant/secondary source and household interviews, respectively.
Household interview indicators are categorized into household demographics (9), coastal and
marine activities (5), attitudes and perceptions (13), and the material style of life (1). A mass
of both quantitative and qualitative data arises out of undertaking a SocMon community-level
survey using all or subsets of these 28 indicator variables. The results are summarized with
the end view of translating data into useful information for any or all of the following
purposes: (1) identifying threats, problems, solutions, and opportunities; (2) determining the
importance, value, and cultural significance of resources as well as its uses; (3) assessing
positive and negative impacts of management measures; (4) assessing management
effectiveness; (5) building stakeholder participation along with appropriate education and
awareness programs; (6) verifying and documenting assumptions of socioeconomic
conditions in the area, community dynamics and stakeholder perceptions; and (7)
establishing baseline household and community profile.
The main purpose of undertaking the SocMon in these four field sites in the
Philippines (two villages each in Puerto Princesa City, Palawan Province and in Bongabong,
Oriental Mindoro Province) is to establish the necessary socioeconomic baseline information
needed for establishing marine sanctuaries and for resource use planning by communities.
For the four study sites, all 60 key informant (KI) and household (HH) indicators were
chosen and utilized to obtain the necessary information required by the communities for

13
planning and decision–making. These variables were chosen after consultation with
community leaders/site managers and other key stakeholders to ensure the responsiveness of
the research variables to the local conditions.
The process/means of data collection involved extracting data from both primary and
secondary sources. In addition to a review of available documents such as but not limited to
village profiles, municipal statistics, and relevant national reports, data gathering instruments
were utilized to collect and cross-validate data. Primary data were collected in the field to
complement secondary data as well as to fill identified gaps. Primary data collection took
place through the development and administration of a household questionnaire survey and
through individual/group interview of key informants (KIs). The selected key informants
(KIs) were individuals who, because of their position, experience and/or knowledge,
provided insights into the larger population. The KIs chosen included local leaders,
community elders, coastal managers, representatives of non-governmental organizations and
policy makers. Individual key informant interviews (KIIs) were conducted to collect useful
baseline data, as well as to validate the primary and secondary data collected through other
methods. The focus group discussions (FGDs), on the other hand, were group interviews
designed to gather/validate both questionnaire and KII data for the baseline. Focused group
participants included fishers, tourist operators, community elders, farmers, and
representatives of NGOs present in the community. The socioeconomic household surveys
collected data directly from the household head, usually the husband or wife in the family,
through face-to-face interviews.
Systematic sampling was employed to randomly select the sample households and to
ensure representatives of the population with the sampling interval computed based on the
population size and desired sample size. The list of households in each community as
provided by the village council’s secretary was used as the sampling frame for Barangay
Masaguisi. From the population of 451 households, a systematic random sample of 139
households was drawn. This sample size is 30.8 % of the household population, and is
comprised of 613 individuals. Nine key informant interviews and one focused group
discussion was conducted during the research.

14
The SocMon household survey was conducted by trained enumerators while the team
statistician supervised the development of the database, encoding, and data analysis. Results
of the surveys were then presented to the community and other stakeholders for validations.
After the validations were completed, the technical reports for each village were finalized.
Some of these reports will be translated into layman’s language, such as policy briefs.
Appropriate reports were also disseminated to the relevant stakeholder groups so that they
may use the research results for planning and adaptive management.
5.3 Summary of Results
5.3.1 Household Demographics
Household demographics pertain to the residents’ demographic characteristics that
include household size, gender, age, highest educational attainment, and birthplace (Table 1
and Table 2). It also includes the socio–cultural characteristics of the household members
like their religious beliefs, ethnic membership, and languages spoken (Table 3).
Table 1 indicates that an almost equal number of households have 4 to 6 members (58
or 41.7%) and 1 to 3 members (56 or 40.3%). Though half of the households have less than 5
members and the other half has more than 4, the mean household size is 4.4, showing that
there are a few households with a large number of members. There were slightly more males
(51.7%) than females (48.3%) in the community. Almost half (46.5%) of the residents were
less than 19 years old while 17.3% were aged 50 years and above. The median age is 21
which is lower than the mean age of 26.91 years, confirming that the distribution of ages is
positively skewed; that is, there are more younger people and fewer older people in the
community. Only 28% were born outside the province, with 71.9% having been born in the
village.

15
Table 1. Household demographic characteristics, Barangay Masaguisi, Bongabong, Oriental
Mindoro, Philippines (n= 139).
Socio-Demographic Characteristic Frequency Percentage
Household Size
1 to 3 members
4 to 6 members
7 to 9 members
10 or more members
56
58
21
4
40.3
41.7
15.1
2.9
Sex
Male
Female
317
296
51.7
48.3
Age (as of last birthday)
0 to 9 years
10 to 19 years
20 to 29 years
30 to 39 years
40 to 49 years
50 to 59 years
60 to 69 years
70 years and above
125
160
89
74
65
56
32
12
20.4
26.1
14.5
12.1
10.6
9.1
5.2
2.0
Highest Educational Attainment
(for household members > 16 years)
No formal schooling
At most grade 4
At most grade 6/elementary grad
At most 3rd
year high school
4th
year/high school grad
College undergraduate
College graduate
With Vocational/technical education
Vocational/technical graduate
With master’s units/degree
No information/missing
9
34
70
55
88
39
37
6
1
8
3
2.6
9.7
20.0
15.7
25.1
11.1
10.6
0.3
2.3
1.1
0.9
Birthplace
Barangay locale
Municipal locale but in other barangays
Provincial locale but in other
municipality
Regional locale but in other province
Other regions in Luzon
Other regions in Visayas
Other regions in Mindanao
No response
461
33
30
36
32
8
4
9
75.2
9.4
8.6
10.3
9.1
2.3
1.1
2.6

16
Table 2. Summary quantitative indices for household size and age, Barangay Masaguisi,
Bongabong, Oriental Mindoro, Philippines (n=139)
Quantitative Index Household Size Age
Total Number 139 households 613 individuals
Median 4 21
Mean 4.4 26.9 years
Standard Deviation 2.2 19.4
Skewness 0.86 0.63
In terms of educational attainment, 32.3% of the residents had not gone beyond the
elementary level while 40.8% reached up to high school level. The other 26.9% went beyond
high school education as college undergraduates (11.1%) and college graduates (10.6%),
among others. Hence, majority may be literate but only about 25% would have employment
skills gained from their educational exposures beyond basic education.
As summarized in Table 3, the community is predominantly Roman Catholic
(70.0%). The only other sizable group is that of Born Again Christians (24.8%). Though it
was observed that 3 out of every 4 residents were already born in the village, they were
mostly migrants since their parents are not natives to the village, with 68.9% who identified
themselves to ethnic groups outside of the province of Oriental Mindoro, mainly Region IV-
B (the region comprising the provinces of Occidental Mindoro, Oriental Mindoro,
Marinduque, Romblon, and Palawan) and the Visayas area. Tagalog is the primary language
spoken in the community.

17
Table 3. Socio-cultural characteristics of household members, Barangay Masaguisi,
Bongabong, Oriental Mindoro, Philippines (n=139).
Socio-Demographic Characteristic Frequency Percentage
Religion
Roman Catholic
Iglesia ni Kristo
Born-again Christian
Protestant
Seventh Day Adventist
Others
No response
429
8
152
19
2
1
2
70.0
1.3
24.8
3.1
0.3
0.2
0.3
Ethnic Membership
Ethnic group within the locality
Ethnic group within the province
Ethnic group within the region
Ethnic group within Luzon
Ethnic group within Visayas
Ethnic group within Mindanao
No response/None
186
5
223
129
60
2
8
30.3
0.8
36.4
9.8
21.0
0.3
1.3
Primary Language Spoken
Tagalog
Ilonggo
Bisaya
No response/missing
580
7
24
2
94.6
1.1
3.9
0.3
5.3.2 Household Members’ Occupations and Income Sources
Although Barangay Masaguisi may have been traditionally regarded as a coastal
village with fishing as a main livelihood, data from the household survey show that there are
now more residents whose primary occupation is farming (35.8%) rather than fishing
(20.7%) (Table 4). Overall, 43% of the working age residents were engaged in farming
either as a primary or secondary occupation in contrast to the overall 25.4% for fishing. The
other major occupations engaged in by residents were laborer/construction work (23.3%) and
self-employed/small businessmen (17.60%) for their primary and/or secondary occupations.
These are the top four occupation categories in the village. However, there is a high
unemployment with 370 (47.8%) residents aged at least 16 years old who did not have a
regular occupation.

18
Table 4. Primary and secondary occupations of household members*, Barangay Masaguisi,
Bongabong, Oriental Mindoro, Philippines (n=139)
Occupation Category Primary Secondary Total/Combined
No. % No. % No. %
Fishing 40 20.7 9 4.7 49 25.4
Farming 69 35.8 14 7.3 83 43.0
Regular government employment 12 6.2 12 6.3
Private professional employment 3 1.6 3 1.6
Labourer/construction worker 30 15.5 15 7.8 45 23,3
Self-employed/small business 24 12.4 10 5.2 34 17.6
Animal/livestock raising 8 4.1 11 5.7 19 9.8
Tricycle/jeepney driver 2 1.0 3 1.6 5 2.6
Dressmaking 4 2.1 13 6.7 17 8.8
Others 1 0,5 1 0.5
Sub-total 193 100.0 75 38.9 193 100.0
None 177 47.8 295 79.7
Total 370 100.00 370 100.00
*For household members with ages of at least 16 years
With the main occupation in the community as farming, it is therefore not surprising
that 46.0% of the households rely on farming as their primary source of income, followed by
fishing (17.3%), self-employment/small business (10.1%) and laborer/construction worker
(10.1%) (Table 5). If the secondary source of household income is further considered, a total
of 54.0% of the households have farming as either their primary or secondary source of
income in contrast to the 23.0% that rely on fishing. Again, almost half of the households
rely on self-employment/small business or labourer/construction work as either primary or
secondary income source.

19
Table 5. Most important income sources of households, Barangay Masaguisi, Bongabong,
Oriental Mindoro, Philippines (n=139)
Source of Income
Primary Secondary Total/Combined
No. % No. % No. %
Pension 5 3.6 2 1.4 7 5.0
Local remittance from relatives 5 3.6 5 3.6
Foreign remittance from
relatives
1 0.7 4 2.9 5 3.6
Fishing 24 17.3 8 5.8 32 23.0
Farming 64 46.0 11 7.9 75 54.0
Livestock/animal raising 6 4.3 8 5.8 14 10.1
Regular government
employment
4 2.9 4 2.9
Private professional
employment
1 0.7 1 0.7
Labourer/construction worker 14 10.1 17 12.2 31 22.3
Self-employed/small business 14 10.1 20 14.4 34 24.5
None 1 0.7 69 49.6
Total 139 100.0 139 100.0
Even though the actual household income was not measured in this research due to its
methodological as well as measurement complexities, a proxy variable used was “material
style of life” as an indicator of the economic status of the households. Observations of the
residential dwellings of the sample households show that these are predominantly made of
tin/galvanized iron (GI) sheet roofs (62.6%), brick/concrete walls (55.4%), thatch/bamboo
windows (33.8%), and cement floors (57.6%) (Table 6). Overall, about 45.9% and 29.6% of
the households have high and very low material style of life as indicated by their residential
dwellings, respectively. It can thus be surmised that about 53% of the households have low
economic status and the rest (47.14%) may belong to the middle class and are more
economically stable if the basis is their residential dwellings.

20
Table 6. Material style of life, Barangay Masaguisi, Bongabong, Oriental Mindoro,
Philippines (n=139).
Material Style of Life No. %
Type of Roof:
Thatch/nipa
Thatch/bamboo
Wood/plywood
Tin/GI sheet
Tiled
41
5
1
87
2
29.5
3.6
0.7
62.6
1.4
Type of outside structural walls
Thatch/nipa
Thatch/bamboo
Wood/plywood
Brick/concrete
Tiles
Missing
31
21
7
77
1
2
22.3
15.1
5.0
55.4
0.7
1.4
Windows:
Open
Thatch/bamboo
Wooden
Steel bars
Glass
Missing
12
47
32
27
20
1
8.6
33.8
23.0
19.4
14.4
0.7
Floor
Dirt
Bamboo
Cement
Wooden
tiles
Missing
38
11
80
7
1
1
27.3
7.9
57.6
5.0
0.7
0.7
Other Household Assets:
2/3/4-wheel Motor Vehicle
Banca
Computer
Television set
25
1
2
2
18.0
7
1.4
1.4
Aggregate Ratings
4 - 8: Very low
9 - 12: Low
13 – 16: High
17 – 20: Very High
40
31
62
2
29.6
23.0
45.9
1.5

21
5.3.3 Coastal and Marine Activities
The coastal and marine resources of Barangay Masaguisi were primarily utilized for
fishing and aquaculture. The marine products harvested are said to range from being of low
to high value. The community sees the marine and coastal resources as a source of livelihood
and food for the household with their fish catch used for household consumption, for sale,
and for payment of debts. Some fishers pay their debts and wages in kind or by using a
portion of their catch as payment. According to key informants, fishers who sell part or all of
their fish catch have the village itself as their primary market since the local community is a
sizeable market for the marine products of local fishers. However, a part of other sea
products (including those produced from aquaculture) were also sold outside the village. In
general, the main market of the fish catch is still the local village.
The key informants interviewed stated that fish and other sea products can be found
in the reefs and along the coasts of the village and that fishers normally utilize these areas to
catch their target species. Majority of the interviewees said that the fishes they catch were
found in the coral reefs with the actual fishing areas described to be just a few kilometers
away from the shoreline.
On the level of impact of these activities, they perceived that fishing and aquaculture
caused high level of impact on the reefs but low level of impact on other coastal resources.
Unregulated fishing activities will cause overfishing, damages to the reefs, and decline in fish
catch of the community. The community already senses that their marine resources are
threatened by overfishing due to illegal fishing activities, presence of commercial fishing
vessels, and natural calamities that affect the marine resources.
Residents alleged that fishers from other villages/municipalities utilized the coastal
resources more than they did. They reported that fishers in the adjacent communities and
other outsiders were normally found fishing in coastal waters within the immediate vicinity
of Barangay Masaguisi, and that they were usually the ones who used illegal fishing
methods.
22
5.3.4 Attitudes towards Non-Market and Non-Use Values of Resources
It is natural for people to value the resources in their environment that are of
economic significance and/or which is directly useful to them. On the other hand, SocMon
looks at the community’s appreciation of their coastal and other resources beyond the direct
economic benefits and from an ecosystem perspective. To determine the people’s perception
and understanding of the value of resources, investigating the residents’ perception of the
non-market and non-use values of their resources were included in the survey.
For this reason, eight Likert-type item statements were asked pertaining to attitudes
towards non-market and non-use values of coastal resources (Table 7 and Table 8). Strong
agreement indicates most positive attitude and is given a score of 5 while the lowest score of
1 is given to a response of strong disagreement. Scoring was reversed for the negatively
stated statements. Items 2 and 3 which focus on the protection of mangroves for fishery ( x =
4.79) and the contribution of coral reefs for fishing ( x = 4.78) had the highest mean rating
scores. This was followed by item 5 which is about the restriction of fishing in certain coral
and fish habitats and item 6 which focuses on the preservation of coral reefs and mangroves
for future generation, both with mean ratings of 4.73. Item 7 on restriction of development in
coastal areas had a mean of 4.61. The frequencies and mean ratings indicate that people’s
attitudes are generally very positive with respect to the indirect non-market contribution of
mangroves and corals to fishery. Meanwhile, the lowest ratings were given to items
pertaining to existence non-use values such as importance of corals beyond fishing and
diving ( x =2.88), value of seagrass ( x = 3.38) and to indirect non-market value of coral
reefs in protecting land from storm waves ( x = 3.65)

23
Table 7. Attitudes towards non-market and non-use values of resources, Barangay Masaguisi,
Bongabong, Oriental Mindoro, Philippines (n=139).
Item Statement Response Options* No Res-
ponse SD D NAD A SA
Reefs are important for protecting land
from storm waves
5
(3.6)
10
(7.2)
6
(4.3)
90
(64.7)
2
(1.4)
26
(18.7)
In the long run, fishing would deteriorate if
we cleared the corals
1
(0.7)
3
(3.2)
19
(13.7)
109
(78.4) 7
(5.0) Mangroves are to be protected so that we
will have fish to catch
1
(0.7)
1
(0.7)
3
(3.2)
15
(10.8)
112
(80.6) 7
(5.0) Corals are only important for fishing and
diving (-)
12
(8.6)
54
(38.8)
11
(7.9)
16
(11.5)
39
(28.1)
7
(5.0)
I want future generations to enjoy the
mangroves and coral reefs
4
(2.9)
1
(0.7)
3
(2.2)
10
(7.2)
114
(82.0) 7
(5.0) Fishing should be restricted in certain areas
to allow fish and coral to grow
1
(0.7)
4
(2.9)
1
(0.7)
17
(12.2)
109
(78.4) 7
(5.0) We should restrict development in some
coastal areas for future generations to have
natural environments
3
(3.2)
6
(4.3)
3
(3.2)
16
(11.5)
104
(74.8)
7
(5.0)
Seagrass beds have no value to people (-) 19
(13.7)
69
(49.6)
8
(5.8)
15
(10.8)
21
(15.1) 7
(5.0) *Statements are rated on a 5-point scale with the following options: SA – Strongly Agree; A – agree;
NAD – neither agree nor disagree; D – Disagree; and SD – Strongly Disagree.
Note: Figures enclosed in parentheses are the corresponding percentages for each category across an
item.
Table 8. Means and standard deviations of rating scores of attitudes towards non-market and
non-use values of coastal resources, Barangay Masaguisi, Bongabong, Oriental Mindoro,
Philippines (n=139).
Item Statement Valid
cases
Median Mean SD
Reefs are important for protecting land from storm waves 113 4 3.6 .84
In the long run, fishing would deteriorate if we cleared the corals 132 5 4.7 .56
Mangroves are to be protected so that we will have fish to catch 132 5 4.8 .59
Corals are only important for fishing and diving (-) 132 3.5 2.9 1.44
I want future generations to enjoy the mangroves and coral reefs 132 5 4.7 .81
Fishing should be restricted in certain areas to allow fish and coral
to grow
132 5 4.7 .70
We should restrict development in some coastal areas for future
generations to have natural environments
132 5 4.6 .91
Seagrass beds have no value to people (-) 132 4 3.4 1.31
*Statements are rated on a 5-point scale with the following options and corresponding scores: SA –
Strongly Agree (5); A – agree (4); NAD – neither agree nor disagree (3); D – Disagree (2); and SD –
Strongly Disagree (1). Scoring is reversed for negatively-stated items.

24
Figure 2. Mean ratings for items on attitudes towards non-market and non-use values
(n=139). Note: The numbers on the horizontal axis refer to the following item statements:
1 - The reefs are important for protecting land from storm waves.
2 - In the long run, fishing would deteriorate if we cleared the corals.
3 - Unless mangroves are protected, we will not so that we will have fish to catch.
4 - Coral reefs are only important if you fish or dive (reversed scoring).
5 - I want future generations to enjoy the mangroves and coral reefs
6 - Fishing should be restricted in certain areas even if no one ever fishes in those
Areas just to allow the fish and coral to grow
7 - We should restrict development in some coastal areas so that future generations
will be able to have natural environments.
8 - Seagrass beds have no value to people (reversed scoring).
The overall attitude ratings towards non-market and non-use of resources as
summarized in the aggregate frequencies and mean ratings for the three categories show
that the residents had generally positive attitudes on the non-market and non- use values
of their coastal resources (Table 9 and Table 10), with highest appreciation on their bequest
value ( x = 4.7), followed by indirect non-market value ( x = 4.4), and lowest appreciation
of existence non-use value ( x = 3.7 ).
3.6
4.7 4.8
2.9
4.7 4.7 4.6
3.4
0
1
2
3
4
5
6
1 2 3 4 5 6 7 8

25
Table 9. Aggregate rating scores on attitudes towards non-market and non-use values of
coastal resources, Barangay Masaguisi, Bongabong, Oriental Mindoro, Philippines (n=139).
Classification of attitude statements Freq %
Indirect non-market value
1.00 – 1.50 : Very negative
1.51 – 2.50 : Negative
2.51 – 3.50 : Neither positive nor negative
3.51 – 4.50 : Positive
4.51 – 5.00 : Very positive
No response/Missing
-
2
3
36
66
32
-
1.4
2.2
25.9
51.8
23.0
Existence non-use value
1.00 – 1.50 : Very negative
1.51 – 2.50 : Negative
2.51 – 3.50 : Neither positive nor negative
3.51 – 4.50 : Positive
4.51 – 5.00 : Very positive 1
No response
-
16
36
73
7
7
-
11.5
25.9
52.5
5.0
5.0
Bequest non-use value
1.00 – 1.50 : Very negative
1.51 – 2.50 : Negative
2.51 – 3.50 : Neither positive nor negative
3.51 – 4.50 : Positive
4.51 – 5.00 : Very positive
No response
2
1
9
25
95
7
1.4
0.7
6.5
18.0
68.4
5.0
Mean rating for attitudes towards non-market and
non-use values of coastal resources
1.00 – 1.50 : Very negative
1.51 – 2.50 : Negative
2.51 – 3.50 : Neither positive nor negative
3.51 – 4.50 : Positive
4.51 – 5.00 : Very positive
No response
-
1
8
69
29
32
-
0.7
5.8
49.6
20.9
23.0
Table 10. Means and standard deviations of aggregate rating scores on attitudes towards non
market and non-use values 0f coastal resources, Barangay Masaguisi, Bongabong, Oriental
Mindoro, Philippines (n=139).
Value Classification Valid
cases
Median Mean Std
Dev
Indirect non-market value (Items 1, 2, 3) 107 4.7 4.4 0.5
Existence non-use value (Items 4, 6, 8) 132 3.7 3.7 0.8
Bequest value (Items 5, 7) 132 5.0 4.7 0.7
Over-all attitude towards non-market and non-use
values of resources (Items 1-8)
107 4.2 4.2 0.5

26
5.3.5 Perceptions of Resource Conditions
On a scale of 1 to 5 with 1 as “very bad” and 5 as “very good”, community residents
who felt that they had enough knowledge about their resources mostly gave ratings of 4 and 5
(Table 11). These ratings indicate that such resources were perceived to be in good to very
good condition. There were a number of residents who did not rate a specific resource and
instead answered “don’t know” or “not applicable”; these were usually non-users of the
specific resources or individuals whose residences were geographically far from the resource.
Hence, they may have considered themselves without enough knowledge about the condition
of the resource mentioned.
Table 11. Perceptions of resource conditions, Barangay Masaguisi, Bongabong, Oriental
Mindoro, Philippines (n=139).
Resource Perceived Resource Condition* Don’t know Net Rating**
VB B NGB G VG
Mangroves 4
(2.9)
4
(2.9)
21
(15.1)
72
(51.8)
30
(21.6)
8
(5.8)
71.7%
Coral reefs 1
(0.7)
1
(0.7)
16
(11.5)
65
(46.8)
27
(19.4)
29
(20.9)
81.8%
Upland forests 6
(4.3)
12
(8.6)
20
(14.4)
68
(48.9)
9
(6.5)
24
(17.3)
51.3%
Seagrass 9
(6.5)
6
(4.3)
10
(7.2)
72
(51.8)
17
(12.2)
25
(18.0)
64.9%
Beach 1
(0.7)
4
(2.9)
20
(14.4)
75
(54.0)
24
(17.3)
15
(10.8)
75.8%
Spring Not applicable
River/
Creeks
1
(0.7)
7
(5.0)
21
(15.1)
66
(47.5)
32
(23.0)
12
(8.6)
70.8%
Ground water 1
(0.7)
1
(0.7)
75
(54.0)
55
(39.6)
7
(5.0)
97.72%
*Each community resource is rated on a 5-point scale with the following options and
corresponding scores: VG – Very good (5);G – good (4); NGB - neither good nor bad (3);
B – bad (2); and VB – very bad (1).
**Net Rating = % freq [(VG + G)] – % freq [(VB + B)]
Note: Figures enclosed in parentheses are the corresponding percentages for each category
For those who responded, not more than 15% rated their resource conditions as bad
and very bad with the least such frequencies for coral reefs, beach, rivers/creeks, and
mangroves. The computed net ratings in the last column of Table 11 provides the difference,
in percentage, between those who perceived the resource condition to be good/very good

27
and those who perceived it to be bad/very bad. Hence, the large positive net ratings reflected
in Table 11 indicate that so much more residents perceive their resources to be good
compared to those who found them bad. The highest net rating is for ground water (97.7%)
followed by coral reefs with 81.8%, while the upland forest received the lowest net rating.
More than half of the residents (51.3%) perceived their upland forest to be good than those
who found them bad. This is also echoed by the mean rating of perceived upland forest
condition which is lowest at 3.54 which fell into the “neither good nor bad” category (Table
12). Residents generally perceived their ground water to be in very good condition as
indicated by the highest mean rating of 4.4. Residents’ perceptions were also most varied on
the condition of their sea grass and least varied on ground water conditions.
Table 12. Means and standard deviations of ratings on perceived resource conditions,
Barangay Masaguisi, Bongabong, Oriental Mindoro, Philippines (n=139).
Resource Valid
Responses
Median Mean Std
Dev
Mangroves 131 4 3.92 .886
Coral reefs 111 4 4.05 .715
Upland forests 115 4 3.54 .967
Seagrass 114 4 3.72 1.043
Beach 124 4 3.94 .747
Spring Not applicable
River/creeks 127 4 3.95 .844
Ground water 133 4 4.40 .550 *Each community resource is rated on a 5-point scale with the following
options and corresponding scores: VG – Very good (5);G – good (4); NGB
– neither good nor bad (3); B – bad (2); and VB – very bad (1).

28
Legend: 1- Mangroves; 2- Coral reefs; 3 - Upland forests; 4 - Seagrass; 5 - Beach;
6 - River/creeks; 7 - Ground water
Figure 3. Mean ratings of perceived resource conditions at Barangay Masaguisi, Bongabong,
Oriental Mindoro (n=139)
5.3.6 Perceived Threats to Resources
The top threats to mangroves as perceived by community residents were charcoal
making, cutting both for household and commercial uses, and conversion into fishpond
(Table 13). Some 13.7% did not know of any threat. The residents seemed to view charcoal
making as the main reason for the destruction of mangroves in their area. This may be
because wood charcoal is the cheapest source of household fuel that is readily available for
their consumption or easily sold for cash income. Mangrove forests provide good quality fuel
wood and charcoal for cooking which are commonly used in most rural households because
of its cheaper cost compared to liquified petroleum gas (LPG) and kerosene. Many people,
especially those living in rural areas, find these other fuel sources as too expensive.
Community leaders also stated that the conversion of mangrove areas into fishponds for
aquaculture has led into a significant decrease of their mangrove trees. Unfortunately, loss of
mangrove forests makes the coastal area more vulnerable to erosion from storms and
destroys essential nursery areas of many commercially important fisheries and coral reef
species.
3.92 4.05 3.54 3.72 3.94 3.95
4.4
0
1
2
3
4
5
1 2 3 4 5 6 7

29
Table 13. Perceived threats to mangroves, Barangay Masaguisi, Bongabong, Oriental
Mindoro, Philippines (n=139).
Perceived Threat Primary Second Tertiary Combined Rank
Cutting for household use 6
(4.3)
27
(19.4)
5
(3.6)
38
(27.3)
3
Cutting for commercial use 10
(7.1)
10
(7.1)
23
(16.5)
43
(30.9)
2
Clearing 5
(3.5)
4
(2.9)
1
(0.7)
10
(7.1)
4
Charcoal making 90
(64.7)
16
(11.5)
106
(76.2)
1
Conversion into fish pond 2
(1.4)
6
(4.3)
5
(3.6)
13
(9.3)
5
Natural phenomenon
(typhoons, big waves)
5
(3.6)
5
(3.6)
6
Disease/infestation of
mangroves
1
(0.7)
1
(0.7)
2
(1.4)
7.5
Pollution/dumping of garbage 1
(0.7)
1
(0.7)
2
(1.4)
7.5
Don't know 19
(13..7)
74
(53.2)
105
(75.5)
Note: Figures enclosed in parentheses are the corresponding percentages for each category
As summarized in Table 14, the most often mentioned threat to coral reefs by the
residents is the use of destructive fishing methods like dynamite or blast fishing and
cyanide/compressor fishing. Residents also cited coral gathering for household/commercial
use (21.6%), clearing/mining/digging (8.7%) and illegal fishing activities (6.4%) as threats to
their coral reefs. Some community members also saw natural phenomenon, pollution/garbage
dumping, and recreational diving as threats. On the other hand, almost half (48.9%) of the
residents do not know of any threat to coral reefs.

30
Table 14. Perceived threats to coral reefs, Barangay Masaguisi, Bongabong, Oriental
Mindoro, Philippines (n=139).
Perceived Threat Primary Second Tertiary Combined Rank
None 4
(2.9)
Cyanide/compressor fishing
12
(8.6)
16
(11.5)
2
(1.4)
30
(21.6)
2
Illegal fishing activities 6
(4.3)
2
(1.4)
1
(0.7)
9
(6.4)
5
Dynamite/blast fishing 23
(16.5)
6
(4.3)
29
(20.8)
1
Coral gathering for HH/commercial
use
8
(5.8)
7
(5.0)
15
(10.8)
30
(21.6)
3
Clearing/mining/digging 6
(4.3)
3
(2.2)
3
(2.2)
12
(8.7)
4
Natural phenomenon (typhoon,
waves)
6
(4.3)
1
(0.7)
2
(1.4)
9
(6.4)
6
Tourism-related: recreational diving 1
(0.7)
3
(2.2)
4
(2.9)
8
Pollution/garbage dumping 5
(3.6(
1
(0.7)
1
(0.7)
7
(5.0)
7
Don't know 68
(48.9)
100
(71.0)
115
(82.7)
283
(203.5)
Note: Figures enclosed in parentheses are the corresponding percentages for each category.
Most of the cited threats to coral reefs pertain to destructive fishing methods that have
long been declared illegal through national fisheries legislations. These replies indicate a
heightened awareness among residents of the harmful effect of dynamite/blast and
cyanide/compressor fishing practices on coral reefs. They do realize that the impact of
destructive fishing activities extends beyond catching the target species and ultimately causes
damage to coral reefs.
As indicated in Table 15, residents still perceived that terrestrial forests are most
threatened by converting them into residential settlements (41.0%), charcoal making
(21.6%), cutting trees for household use (20.9%), and cutting trees for commercial use
(20.7%). Residents may have noticed a trend of expanding human settlements in terrestrial
forests of the village which are on relatively flat lowlands and near farming areas thereby
making it attractive for residential settlement.
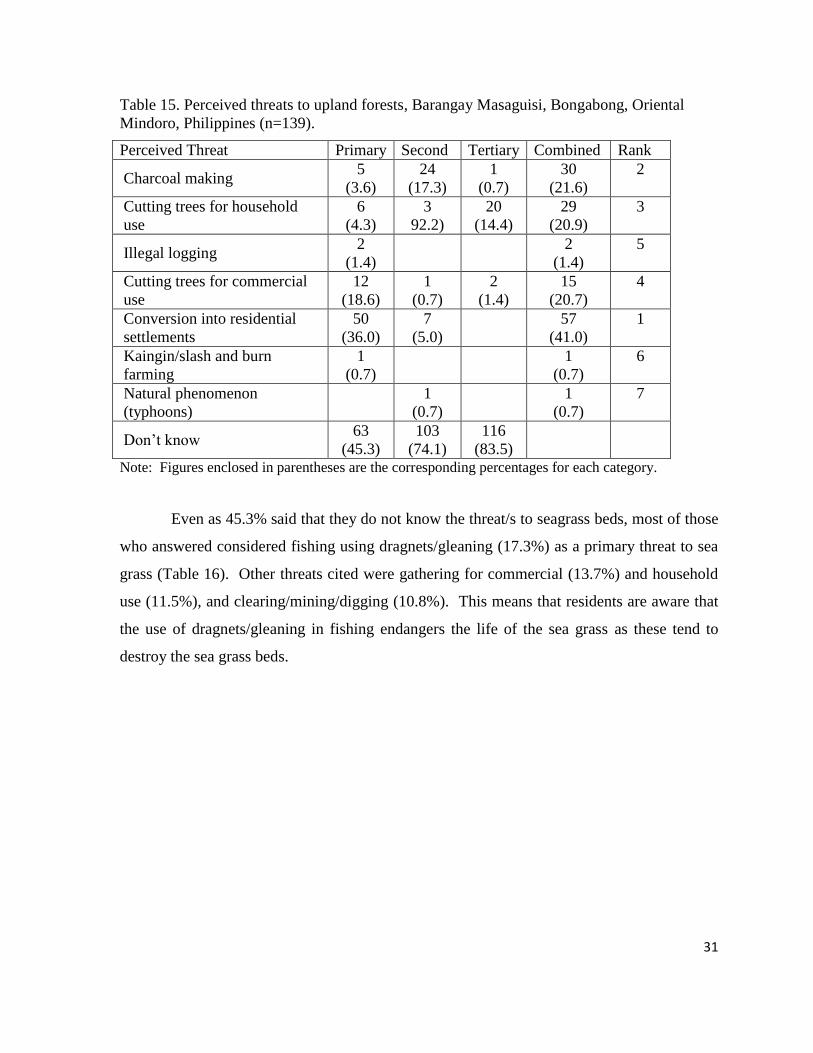
31
Table 15. Perceived threats to upland forests, Barangay Masaguisi, Bongabong, Oriental
Mindoro, Philippines (n=139).
Perceived Threat Primary Second Tertiary Combined Rank
Charcoal making 5
(3.6)
24
(17.3)
1
(0.7)
30
(21.6)
2
Cutting trees for household
use
6
(4.3)
3
92.2)
20
(14.4)
29
(20.9)
3
Illegal logging 2
(1.4)
2
(1.4)
5
Cutting trees for commercial
use
12
(18.6)
1
(0.7)
2
(1.4)
15
(20.7)
4
Conversion into residential
settlements
50
(36.0)
7
(5.0)
57
(41.0)
1
Kaingin/slash and burn
farming
1
(0.7)
1
(0.7)
6
Natural phenomenon
(typhoons)
1
(0.7)
1
(0.7)
7
Don’t know 63
(45.3)
103
(74.1)
116
(83.5)
Note: Figures enclosed in parentheses are the corresponding percentages for each category.
Even as 45.3% said that they do not know the threat/s to seagrass beds, most of those
who answered considered fishing using dragnets/gleaning (17.3%) as a primary threat to sea
grass (Table 16). Other threats cited were gathering for commercial (13.7%) and household
use (11.5%), and clearing/mining/digging (10.8%). This means that residents are aware that
the use of dragnets/gleaning in fishing endangers the life of the sea grass as these tend to
destroy the sea grass beds.

32
Table 16. Perceived threats to seagrass, Barangay Masaguisi, Bongabong, Oriental Mindoro,
Philippines (n=139).
Perceived Threat Primary Second Tertiary Combined Rank
None 3
(2.2)
3
(2.2)
Clearing/mining/digging 1
(0.7)
14
(10.1)
15
(10.8)
4
Gathering for household use 14
(10.1)
2
(1.4)
16
(11.5)
3
Gathering for commercial use 3
(2.2)
15
(10.8)
1
(0.7)
19
(13.7)
2
Illegal fishing activities 4
(2.9)
1
(0.7)
2
(1.4)
7
(5.0)
6
Fishing using
dragnets/gleaning
17
(12.2)
4
(2.9)
3
(2.20)
24
(17.3)
1
Pollution/dumping of garbage 4
(2.9)
1
(0.7)
5
(3.6)
7
Dynamite/blast fishing 3
(2.2)
1
(0.7)
1
().7)
5
(1.4)
8
Tourist-related recreation 2
(1.4)
1
(0.7)
3
(2.1)
9
Natural phenomenon
(typhoon, waves)
6
(4.3)
(0.7)
1
(0.7)
8
(5.7)
5
Don't know 82
(59.0)
113
(81.3)
117
(84.2)
Note: Figures enclosed in parentheses are the corresponding percentages for each category.
Most of those who were aware of at least one threat to their beaches said that natural
phenomena such as typhoons and strong waves, as well as pollution/dumping of garbage, are
threats (Table 17). Other threats enumerated by residents were residential area expansion,
beach erosion/sea level rise, and sand quarrying for household use. Very few considered soil
erosion from the uplands, pebble/stone gathering for commercial use, and development of
resorts and tourist-related facilities as threats to beaches. Generally, residents seemed to
consider nature as a threat to contend with, alongside human actions such as garbage
dumping or marine pollution.

33
Table 17. Perceived threats to beach, Barangay Masaguisi, Bongabong, Oriental Mindoro,
Philippines (n=139).
Perceived Threat Primary Second Tertiary Combined Rank
None 1
(0.7)
Sand quarrying for household
use
4
(2.9)
6
(4.3)
4
(2.9)
14
(10.1)
5
Pollution/dumping of garbage 19
(13.7)
12
(8.6)
1
(0.7)
32
(23.0)
2
Natural phenomenon (typhoons,
big waves)
21
(15.1)
8
(5.8)
3
(2.2)
32
(23.1)
1
Pebble/stone gathering for
commercial use
3
(2.2)
2
(1.4)
1
(0.7)
6
(4.3)
7
Soil erosion from the uplands 5
(3.6)
2
(1.4)
3
(2.2)
10
(7.2)
6
Residential area expansion 13
(9.4)
9
(6.5)
22
(15.9)
3
Beach erosion/sea level rise 15
(10.8)
2
(1.4)
17
(12.2)
4
Development of resorts and
tourist-related facilities
1
(0.7)
1
(0.7)
4
(2.9)
6
(4.3)
8
Don't know 57
(41.0)
96
(69.1)
112
(80.6)
Note: Figures enclosed in parentheses are the corresponding percentages for each category.
More than half of the respondents (55%) identified pollution/garbage dumping as the
top threats to rivers/creeks (41.9%). Other threats mentioned were natural phenomenon
(18%), sedimentation (13.7%), soil erosion (9.4%), and sand quarrying for household use
(6.4%) (Table 18). Perhaps, many residents considered garbage dumping as the primary
threat to their rivers/creeks because it can cause major flooding due to the congestion of
waterways or possible contamination of the water being used by the residents.

34
Table 18. Perceived threats to rivers/creeks, Barangay Masaguisi, Bongabong, Oriental
Mindoro, Philippines (n=139).
Perceived Threat 1st 2nd 3
rd Combined Rank
Pollution/dumping of garbage 49
(35.4)
6
(4.3)
3
(2.2)
58
(41.9)
1
Natural phenomenon (typhoons,
big waves)
7
(5.0)
10
(7.2)
8
(5.8)
25
(18.0)
2
Sand quarrying for commercial
use
1
(0.7)
1
(0.7)
8
Soil erosion 3
(2.2)
2
(1.4)
8
(5.8)
13
(9.4)
4
Sand quarrying for household
use
7
(5.0)
2
(1.4)
9
(6.4)
5
Pebble/stone gathering for
household use
1
(0.7)
1
(0.7)
2
(1.4)
7
Sedimentation 7
(5.0)
9
(6.5)
3
(2.2)
19
(13.7)
3
Establishment/expansion of
nearby human settlements
2
(1.4)
2
(1.4)
6
Don't know 63
(45.3)
111
(79.9)
114
(82.6)
Note: Figures enclosed in parentheses are the corresponding percentages for each category
Table 19 enumerates the residents’ perceived threats to ground water threats, among
which are natural phenomena such as typhoon (13.7%), salt intrusion (12.7%), water
contamination due to sewage (10.1%), establishment/expansion of human settlements
(8.6%), and overexploitation for household use (5.7%).
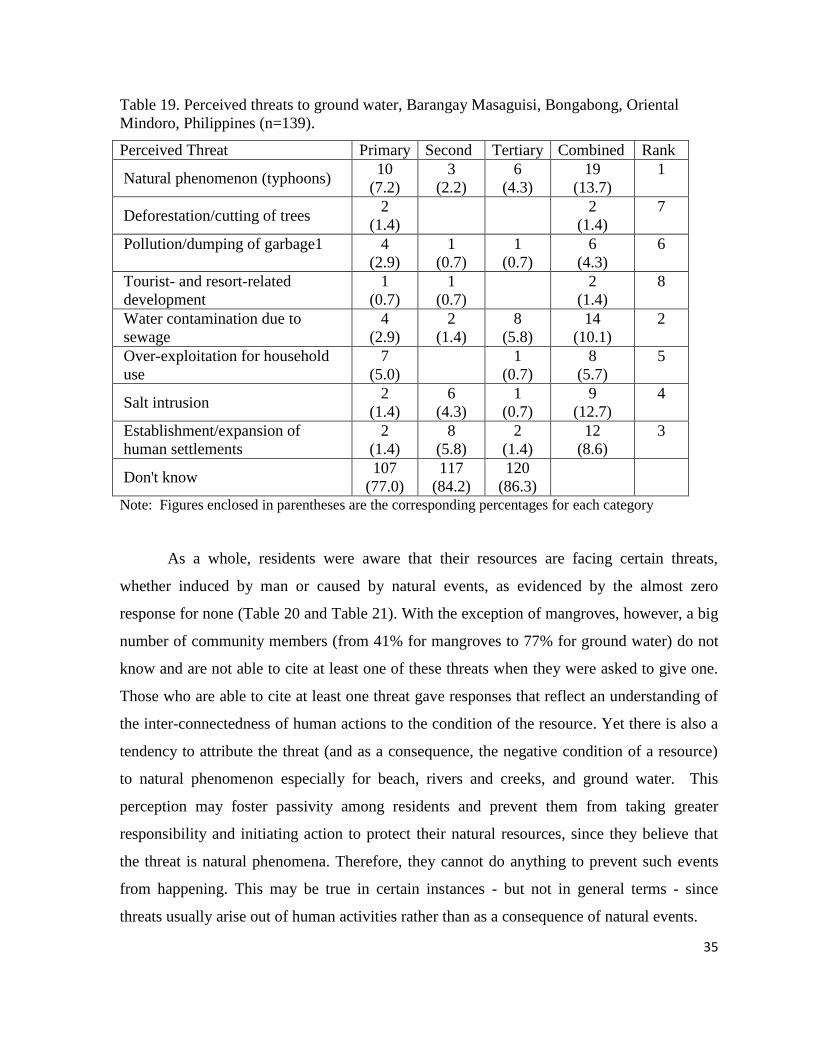
35
Table 19. Perceived threats to ground water, Barangay Masaguisi, Bongabong, Oriental
Mindoro, Philippines (n=139).
Perceived Threat Primary Second Tertiary Combined Rank
Natural phenomenon (typhoons) 10
(7.2)
3
(2.2)
6
(4.3)
19
(13.7)
1
Deforestation/cutting of trees 2
(1.4)
2
(1.4)
7
Pollution/dumping of garbage1
4
(2.9)
1
(0.7)
1
(0.7)
6
(4.3)
6
Tourist- and resort-related
development
1
(0.7)
1
(0.7)
2
(1.4)
8
Water contamination due to
sewage
4
(2.9)
2
(1.4)
8
(5.8)
14
(10.1)
2
Over-exploitation for household
use
7
(5.0)
1
(0.7)
8
(5.7)
5
Salt intrusion 2
(1.4)
6
(4.3)
1
(0.7)
9
(12.7)
4
Establishment/expansion of
human settlements
2
(1.4)
8
(5.8)
2
(1.4)
12
(8.6)
3
Don't know 107
(77.0)
117
(84.2)
120
(86.3)
Note: Figures enclosed in parentheses are the corresponding percentages for each category
As a whole, residents were aware that their resources are facing certain threats,
whether induced by man or caused by natural events, as evidenced by the almost zero
response for none (Table 20 and Table 21). With the exception of mangroves, however, a big
number of community members (from 41% for mangroves to 77% for ground water) do not
know and are not able to cite at least one of these threats when they were asked to give one.
Those who are able to cite at least one threat gave responses that reflect an understanding of
the inter-connectedness of human actions to the condition of the resource. Yet there is also a
tendency to attribute the threat (and as a consequence, the negative condition of a resource)
to natural phenomenon especially for beach, rivers and creeks, and ground water. This
perception may foster passivity among residents and prevent them from taking greater
responsibility and initiating action to protect their natural resources, since they believe that
the threat is natural phenomena. Therefore, they cannot do anything to prevent such events
from happening. This may be true in certain instances - but not in general terms - since
threats usually arise out of human activities rather than as a consequence of natural events.

36
Table 20. Top perceived threats to coastal resources, Barangay Masaguisi, Bongabong,
Oriental Mindoro, Philippines (n=139).
Mangroves Coral Reefs Seagrass Beach
None – 0.0% None – 2.9% None – 2.2% None – 0.8%
DK/NA – 13.7% DK/NA – 48.9% DK/NA – 59.0% DK/NA – 41.0%
Charcoal making Dynamite/blast fishing Fishing using
dragnets/ gleaning
Natural
phenomenon
Cutting for
commercial use
Cyanide/compressor
fishing
Gathering for
commercial use
Pollution due to
garbage dumping
Cutting for
household use
Coral gathering for
household/commercial
use
Gathering for
household use
Residential area
expansion
Clearing Clearing/mining/digging Clearing/mining/
Digging
Beach erosion/sea
level rise
Conversion into fish
pond
Sand quarrying for
household use Note: DK=don’t know; NA=not applicable
Table 21. Top perceived threats to non-coastal resources, Barangay Masaguisi, Bongabong,
Oriental Mindoro, Philippines (n=139)
Upland Forests Rivers And Creeks Ground Water
None – 0.0% None= 0.0% None – 0.0%
DK/NA - 45.3% DK/NA – 45.3% DK/NA – 77.0%
Conversion into residential
settlements
Pollution/dumping of
garbage
Natural phenomenon
Charcoal making Natural phenomenon Water contamination due to
sewage
Cutting trees for household
use
Sedimentation Expansion of residential
settlements
Cutting trees for commercial
use
Soil erosion Over-exploitation for
household use
Sand quarrying for
household use
Salt intrusion
Note: DK=don’t know; NA=not applicable
5.3.7 Awareness of Resource Rules and Regulations
About half of the residents are aware of rules and regulations on fishing (58.3%)
and on mangroves (54%) (Table 22). Aside from these, the only other resource uses that
people are most aware of are aquaculture (27.3%) and pebble gathering (15.1%). Very few

37
expressed awareness of rules and regulations on other forms of resource uses/activities such
as water sports, resort development and tourist/marine transportation. Such response suggests
that these are not concerns that impinge on their daily economic or social lives as evidenced
by the large frequencies on “not applicable”.
Table 22. Awareness of resource rules and regulations, Barangay Masaguisi, Bongabong,
Oriental Mindoro, Philippines (n=139).
Resource Used/
Activity
Awareness of Rules and
Regulations
Origin of Regulation
None Yes Don’t
Know/No
answer
Not
Apply
Brgy Mun/
City
Prov Natl
Fishing 29
(20.9)
81
(58.3)
11
(7.9)
18
(12.9)
40
(28.8)
23
(16.5)
19
(13.7)
Mangroves 32
(23.0)
75
(54.0)
8
(5.8)
24
(17.3)
33
(23.7)
27
(19.4) 16
(11.5)
Aquaculture 50
(36.0)
38
(27.3)
13
(9.4)
38
(27.3)
10
(7.2)
20
(14.4) 6
(4.30
Resort/pension/hotel
development
53
(38.1)
7
(5.0)
18
(12.9)
61
(43.9)
1
(.7)
6
(4.3)
1
(0.70
Residential
development
51
(36.7)
11
(7.9)
19
(13.7)
58
(41.7)
6
(4.3)
5
(3.6)
Pebble gathering 49
(35.3)
21
(15.1)
25
(18.0)
44
(31.7)
13
(9.4)
Tourist
transportation
51
(36.7)
5
(3.6)
33
(23.7)
50
(36.0)
2
(1.4)
Marine
transportation
53
(38.1)
2
(1.4)
15
(10.8)
69
(49.6)
2
(1.4
Note: Figures enclosed in parentheses are the corresponding percentages for each category.
It appears that more of the known resource rules and regulations come primarily from
the local village council of Barangay Masaguisi and secondarily from the Municipality of
Bongabong as attributed by the residents themselves. There were very few who said that the
resource rules and regulations they were aware of came from the provincial or national
levels.

38
5.3.8 Participation in Decision Making
Not more than 15% of the residents were actively participating in decision–making
related to the use of their coastal resources (Table 23). At least half said that they did not
participate in such decision–making. The highest participations were registered for fishing,
mangroves, and aquaculture of 1.89, 1.85, and 1.67 respectively. It can thus be inferred that
residents are generally passive rather than active when it comes to participating in decision–
making.
Table 23. Current and desired levels of participation in decision making, Barangay
Masaguisi, Bongabong, Oriental Mindoro, Philippines (n=139)
Activity Rating Scores* Not
apply 1 2 3 4 5
Fishing Current 81
(58.3)
3
(2.2)
9
(6.5)
4
(2.9)
17
(12.2)
25
(18.0)
Desired 67
(48.2)
2
(1.4)
5
(3.6)
3
(2.2)
62
(44.6)
Mangroves Current 84
(60.4)
2
(1.4)
13
(9.4)
8
(5.7)
9
(6.5)
23
(16.5)
Desired 72
(51.8)
3
(2.2)
3
(2.2)
5
(3.6)
55
(40.3)
Aquaculture Current 69
(49.6)
2
(1.4)
8
(5.8)
5
(3.6)
7
(5.0)
48
(34.5)
Desired 74
(53.2)
3
(2.2)
5
(3.6)
2
(1.4)
54
(38.8)
1
(0.7)
Resort/pension/
hotel
development
Current 73
(52.5)
1
(.7)
2
(1.4)
1
(.7)
4
(2.9)
58
(417)
Desired 82
(59.0)
1
(.7)
3
(2.2)
3
(2.2)
49
(35.3)
1
(.7)
Residential
development
Current 71
(51.1)
2
(1.4)
3
(2.2)
1
(0.7)
3
(2.2)
59
(42.4)
Desired 82
(59.0)
2
(1.4)
2
(1.4)
4
(2.9)
48
(34.5)
1
(0.7)
Recreational
climb/trek/camp
Current 70
(50.4)
3
(2.2)
1
(.7)
3
(2.2)
62
(44.5)
Desired 83
(59.7)
2
(1.4)
3
(2.2)
1
(.7)
49
(35.3)
1
(.7)
Pebble
gathering
Current 68
(48.9)
2
(1.4)
5
(3.6)
2
(1.4)
5
(3.6)
57
(410)
Desired 84
(60.4)
2
1.4)
2
(1.4)
50
(35.0)
1
(.7)

39
Activity Rating Scores* Not
apply 1 2 3 4 5
Tourist
transportation
Current 60
(43.2)
1
(.7)
4
(2.9)
2
(1.4)
4
(2.9)
68
(48.9)
Desired 84
(60.4)
1
(.7)
2
(1.4)
2
(1.4)
49
(35.4)
1
(.7)
Marine
transportation
Current 62
(44.6)
4
(2.9)
2
(1.4)
4
(2.9)
67
(48.2)
Desired 85
(61.9)
1
(.7)
2
(1.4)
49
(35.4)
1
(.7) Note: Rating is on a scale of 1 – 5, with 1- no participation, and 5 – full participation
Though half of the residents still expressed that they had no desire to participate in
decision making, it is noticeable that another 35% to 45% also said that they desired to fully
participate, as reflected in the percentages for ratings of 5 (fully active) in all the listed
resource uses/activities. Similar to the current levels of participation, the highest mean ratings
for desired levels of participation were in fishing (2.94), mangroves (2.78), and coral reefs
(2.70) (Table 24).
Table 24. Means and standard deviations of ratings of participation in decision making,
Barangay Masaguisi, Bongabong, Oriental Mindoro, Philippines (n=139).
Resource Used/ Activity Current Level of Participation Desired Level of
Participation
n Mean Std Dev N Mean Std Dev
Fishing 114 1.89 1.51 139 2.94 1.94
Mangroves 116 1.84 1.68 139 2.78 1.93
Aquaculture 91 1.67 1.30 139 2.70 1.92
Resort/pension/hotel
development
81 1.30 .97 138 2.54 1.91
Residential development 80 1.29 .90 138 2.52 1.90
Watersports 72 1.17 .80 138 2.44 1.92
Reacreational climb/trek/
camp
77 1.27 .91 138 2.50 1.90
Pebble gathering 82 1.46 1.12 138 2.52 1.92
Tourist transportation 71 1.44 1.10 138 2.50 1.91
Marine transportation 72 1.42 1.10 138 2.48 1.92
When the individuals’ current levels were compared to their respective desired levels
of participation, the differences were statistically significant (at the .01 level) for all resource

40
uses/activities thereby indicating that the respondents’ desired levels of participation are
higher than their current levels (Table 25). The highest paired differences between current
and desired levels were in residential development and in other resource use activities with
the lowest current levels. This is a good indication for the village and other local leaders;
they may be able to seek greater participation from their community members. Though most
may not have participated in the past, there is an expressed desire to become more involved
in decision–making.
Table 25. Comparisons of current and desired levels of participation in decision making,
Barangay Masaguisi, Bongabong, Oriental Mindoro, Philippines (n=139).
Resource Use/ Activity
Paired
Corr
Paired Differences
t-value df
Sig.
(2-tailed) Mean SD
Fishing .298** .807 2.05 4.21 113 .000**
Mangroves .254** .647 2.16 3.22 115 .000**
Aquaculture .270** 1.044 1.98 4.99 89 .000**
Resort/pension/hotel
development
.269* 1.350
1.89
6.39
79
.000**
Residential development .248* 1.903 1.90 6.44 78 .000**
Watersports .117 1.403 2.04 5.82 70 .000**
Recreational climb/trek/camp .219 1.43 1.95 6.41 75 .000**
Pebble gathering .165 1.160 2.08 5.02 80 .000**
Tourist transportation .179 1.400 2.07 5.65 69 .000**
Marine transportation .190 1.380 2.07 5.63 70 .000**
* significant at the .05 level
* *significant at the .01 level
5.3.9. Membership in Resource Use Stakeholder Organizations
One possible reason that can explain the current low levels of participation in
decision–making is the low membership of households to stakeholder organizations which
serve as venues for vigorous community involvement of individuals (Table 26). There are
only three organizations mentioned by the respondents – Barangay Fisheries and Aquatic
Resources Management Council (BFARMC), 4P’s (a poverty alleviation program of the
national government under its Department of Social Work and Development), and
CARDBank (a private microfinance business organization). Only the BFARMC is directly

41
related to resource use. The limited membership (23%) of households may thus be attributed
to a lack of resource-based stakeholder organizations in the community.
Table 26. Household membership in resource use stakeholder organizations, Barangay
Masaguisi, Bongabong, Oriental Mindoro, Philippines (n=139).
No. of HH members Involved Freq %
None 107 77.0
1 23 16.5
2 9 6.5
Several community organizations were described by the key informants as influential
in the management and direction of decision-making of coastal activities. BFARMC and 4Ps
are viewed to be formal organizations whose main functions are on coastal management.
Aside from these two organizations, there are other organizations that were present in the
community like Barangay Health Workers (BWH) and Kapit Bisig Laban sa Kahirapan
Comprehensive and Integrated Delivery of Social Services: Kapangyarihan at Kaunlaran sa
Barangay (KALAHI-CIDSS), but their main concerns are on health, nutrition and
community issues. These two organizations also influence both coastal resource management
and the decision–making.
Key informants also identified an informal organization, which is the Clean and
Green. Though its main function is not well known to the community, it is said to influence
both coastal management and the direction of decision–making.
5.3.10 Perceptions of Coastal Management Problems and Solutions
Almost half of the residents did not know any coastal management problem in their
community (Table 27). The other half gave at least one primary problem, with 30% of them
giving an additional problem. Sanitation concerns, such as garbage dumping and waste
management, were cited by 29% as one of the top two problems. Other problems
enumerated were: disorganized management of Bantay Dagat, BFARMC, and the village
officials (17.4%), sea level rise/sand erosion (15.9%), and decrease in fish catch/exploitation
of coastal resource for household and commercial use (14.5%). The range of coastal

42
management problems cited and their corresponding frequencies can also be seen in the table
below.
Table 27. Perceived coastal management problems, Barangay Masaguisi, Bongabong,
Oriental Mindoro, Philippines (n=139).
Coastal Management Problems Problem 1 Problem 2 Combined
No. % No. % No. %
Livelihood related to coastal resource utilization 2 2.9 3 4.3 5 7.2
Illegal logging 8 11.6 1 1.4 9 13.0
Mangrove cutting 2 2.9 6 8.7 8 11.6
Natural calamities 4 5.8 8 8.2 12 17.4
Sea level rise/sand erosion 9 13.0 2 2.9 11 15.9
Not organized management (Bantay
Dagat/BFARMC/
Village officials)
10 14.5 2 2.9 12 17.4
Entry of fishers from other villages/ municipalities
(dayuhang mangingisda)
4 5.8 7 10.1 11 15.9
Decrease in fish catch/available coastal resources,
exploitation of coastal resource for household or
commercial use,
10 14.5 10 14.5
Sanitation (Pollution and garbage dumping, waste
management)
14 20.3 6 8.7 20 29.0
Illegal fishing; use of cyanide 6 8.7 6 8.7 12 17.4
Others 1 1.4 1 1.4
Sub-total 69 49.6 42 30.2
Don’t know 68 48.9 97 69.8
None 2 1.4
Congruent to the perceived problems are also the perceived solutions. Similar to the
perceived problems, the biggest group of response as to solutions was “don’t know” (53.2%).
As reflected in Table 28, 31 respondents (22.3%) perceived that governance through strict
enforcement of fishing laws or village ordinances is a solution to their coastal management
problems. Another often cited solution was mangrove reforestation, which falls under
conservation of resources. In response to the problem of sanitation, proper waste disposal and
management is the suggested solution. Table 29 summarizes the top coastal management
problems and solutions perceived by the village residents.

43
Table 28. Perceived solutions to coastal management problems, Barangay Masaguisi,
Bongabong, Oriental Mindoro, Philippines (n=139).
Coastal Management Problems Solution 1 Solution 2 Combined
No. % No. % No. %
Governance-enforcement: Strict implementation of
fishing laws/Village ordinance
20 14.4 11 7.9 31 22.3
Livelihood project 3 2.2 6 4.3 9 6.5
Conservation of resources: Mangrove planting 18 12.9 14 10.1 32 23.0
Sanitation: Proper waste disposal/management 15 10.8 7 5.0 22 15.8
Governance-policy: Prevent intrusion of
commercial fishing vessel, Disallow sand quarrying
for commercial use
5
3.6 1 0.7 6 4.3
Governance-education: Conduct orientation/seminar
related to proper utilization of coastal resources 6
6.3 4 2.9 10 7.2
Put up water supply system 1 0.7 1 0.7
Sub-total 62 44.6 37
Don’t know 74 53.2 100
None 3 2.2
Table 29. Top perceived coastal management problems and solutions, Barangay Masaguisi,
Bongabong, Oriental Mindoro, Philippines (n=139).
Coastal Management Problems Coastal Management Solutions
None–1.4%
Don’t know/not concerned – 48.9%
With answer – 49.6%
None– 2.2%
Don’t know – 53.2%
With answer – 44.6%
1. Sanitation (Pollution and garbage
dumping, waste management)
2. Not organized management (Bantay
Dagat/BFARMC/Village officials)
3. Illegal fishing; use of cyanide
4. Natural calamities
1. Governance-enforcement: Strict
implementation of fishing laws/Village
ordinance
2. Sanitation: Proper waste
disposal/management
3. Conservation of resources: Mangrove
planting
4. Governance-education: Conduct
orientation/seminar related to proper
utilization of coastal resources
Sanitation in coastal resource management becomes a problem when human-induced
garbage/trash is thrown into the beach and coastal waters or is deposited by waterways
leading to the sea. The community is aware that collectively, they need to adopt proper
waste management practices rather than conduct periodic clean-ups which is a short-term

44
rather than a long-term solution. It also appears that residents expect more management
skills from their village officials so that they would become better organized as a community.
One corresponding solution to this is proper education by way of conducting
orientations/seminars related to proper utilization of coastal resources. As to be expected in
coastal areas that are heavily utilized, the community has been experiencing decreasing fish
catches and declining coastal resources. Proper governance, particularly continuous and
consistent enforcement of fishery rules and regulations, is their perceived solution. They
generally believed that the laws were sufficient and only needed to be properly enforced at
all times. Mangrove planting or reforestation is also seen as a general conservation measure
that people can undertake. Sea level rise/sand erosion has also been experienced in the
village and this has been partially addressed by building a seawall along the most vulnerable
part of the residential settlement.
5.3.11 Perceptions of Successes and Challenges in Coastal Management
As reported in Table 30, only 2 out of every 5 residents were able to enumerate at
least one success in coastal management. Responses of those who answered converged into
four success areas ranked from highest to lowest in frequency: dike/seawall construction;
mangrove planting; coastal cleanliness; and protected fish sanctuary.
Table 30. Perceived successes in coastal management, Barangay Masaguisi, Bongabong,
Oriental Mindoro, Philippines (n=139).
Coastal Management Success Success1 Success 2 Combined
No. % No. % No. %
Conservation of resources: Mangrove planting 16 11.5 7 5.0 23 16.5
Community mobilization: Coastal cleanliness 6 4.3 16 11.5 22 15.8
Infrastructure: Dike/seawall construction 29 20.9 2 1.4 31 22.3
Conservation of fish habitat: Protected fish sanctuary 6 4.3 8 5.8 14 10.1
Sub-total 57 41.0
None 82 59.0 105 75.5
Don’t know/no response 1 0.7
The dike/seawall construction in the village was considered a success by 22.3% of
the residents but another 18.0% of them also perceived the continuation of its construction a

45
challenge (Table 31). If sand erosion is a consequence of sea level rise which in turn is due
to climate change, then the problem would still persist in the near future. The dike/seawall is
only one of the many possible adaptive measures that the village may undertake against sea
level rise. Another challenge, which was also earlier mentioned as a problem, is maintenance
of coastal cleanliness (18.0%). Still, a much bigger percentage (70.5%) of residents said that
there are no coastal management challenges in their community.
Table 31. Perceived challenges in coastal resources management, Barangay Masaguisi,
Bongabong, Oriental Mindoro, Philippines (n=139).
Challenges in Coastal Management
Challenge 1 Challenge 2 Combined
No. % No. % No. %
Infrastructure: Continuation of seawall construction 24 17.3 1 0.7 25 18.0
Governance-policy: enactment of municipality
ordinance re fish sanctuary 4
2.9 1 0.7 5 3.6
Governance-enforcement: Strict implementation of
fishing laws/ordinances 6
4.3 2 1.4 8 5.8
Sanitation: Maintenance of coastal cleanliness 6 4.3 9 6.5 15 18.0
Sub-total 40 28.8
Don’t know/no answer 1 0.7 5 3.6
None 98 70.5 121 87.1
Even though only 28.8% cited a challenge, their responses are parallel to the coastal
resource management problems they earlier enumerated. Maintenance of coastal cleanliness
is still the challenge, both from the perspectives of strictly enforcing the law and compliance
to the resource rules and regulations of the users (Table 32). The multi-dimensionality of
coastal resource management is highlighted in the residents’ responses; some view the
challenge as more of infrastructure-related in nature. Others, though, recognize that the
difficulty is in the compliance of the resource users but a few consider it from the perspective
of governance – law enforcement and fish sanctuary establishment. Meanwhile, village
leaders added during the validation meeting that they also found that the Masaguisi River
was already heavily silted and they have drawn up plans to launch a “Sagip Ilog” (Save the
River) program in the community.
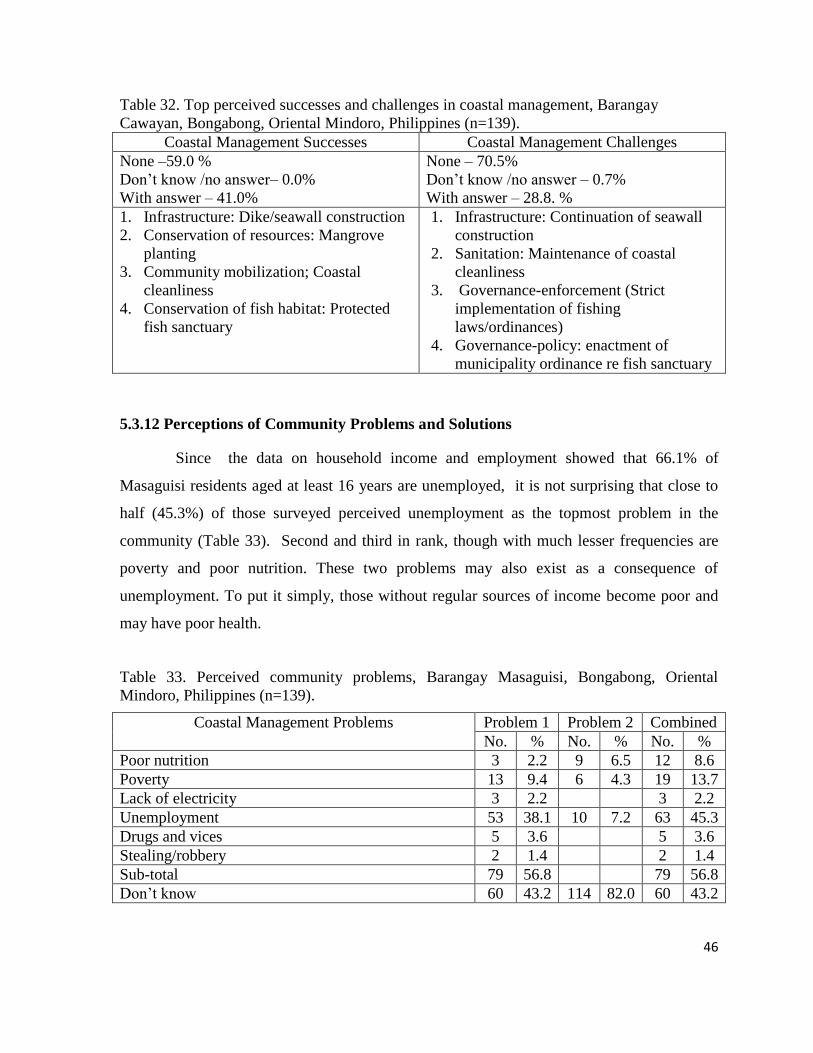
46
Table 32. Top perceived successes and challenges in coastal management, Barangay
Cawayan, Bongabong, Oriental Mindoro, Philippines (n=139).
Coastal Management Successes Coastal Management Challenges
None –59.0 %
Don’t know /no answer– 0.0%
With answer – 41.0%
None – 70.5%
Don’t know /no answer – 0.7%
With answer – 28.8. %
1. Infrastructure: Dike/seawall construction
2. Conservation of resources: Mangrove
planting
3. Community mobilization; Coastal
cleanliness
4. Conservation of fish habitat: Protected
fish sanctuary
1. Infrastructure: Continuation of seawall
construction
2. Sanitation: Maintenance of coastal
cleanliness
3. Governance-enforcement (Strict
implementation of fishing
laws/ordinances)
4. Governance-policy: enactment of
municipality ordinance re fish sanctuary
5.3.12 Perceptions of Community Problems and Solutions
Since the data on household income and employment showed that 66.1% of
Masaguisi residents aged at least 16 years are unemployed, it is not surprising that close to
half (45.3%) of those surveyed perceived unemployment as the topmost problem in the
community (Table 33). Second and third in rank, though with much lesser frequencies are
poverty and poor nutrition. These two problems may also exist as a consequence of
unemployment. To put it simply, those without regular sources of income become poor and
may have poor health.
Table 33. Perceived community problems, Barangay Masaguisi, Bongabong, Oriental
Mindoro, Philippines (n=139).
Coastal Management Problems Problem 1 Problem 2 Combined
No. % No. % No. %
Poor nutrition 3 2.2 9 6.5 12 8.6
Poverty 13 9.4 6 4.3 19 13.7
Lack of electricity 3 2.2 3 2.2
Unemployment 53 38.1 10 7.2 63 45.3
Drugs and vices 5 3.6 5 3.6
Stealing/robbery 2 1.4 2 1.4
Sub-total 79 56.8 79 56.8
Don’t know 60 43.2 114 82.0 60 43.2

47
There is general agreement among community members that the problem of
unemployment can be addressed through the provision of livelihood programs with 54.7%
citing this as a solution. During the community validation, village leaders admitted that there
were already some livelihood projects initiated in the past. These included poultry raising as
a supplement to farming, smoked fish making, sewing, and meat processing as livelihoods
for women. However, these were short-lived because of the lack of a working capital and
passive community involvement. They therefore suggested that livelihood assistance needs
to be comprehensive by including provisions for marketing. To a much lesser extent,
financial assistance and construction of a village health center were also mentioned. Other
suggested solutions are listed in Table 34. Side-by-side, the perceived solutions correspond to
the perceived problems enumerated earlier (Table 35).
Table 34. Perceived solutions to community problems, Barangay Masaguisi, Bongabong,
Oriental Mindoro, Philippines (n=139).
Coastal Management Problems Problem 1 Problem 2 Combined
No. % No. % No. %
Employment; livelihood programs 62 44.6 12 8.6 76 54.7
Financial assistance 5 3.6 2 1.4 8 5.8
Educational trainings/seminars 2 1.4 1 0.7 3 2.2
Installation of electricity 2 1.4 2 1.4 4 2.9
Construction of Village health center 2 1.4 6 4.3 8 5.8
Active involvement of Village officials/tanods 3 2.2 3 2.2
Strict implementation of fishing laws and Village
ordinance
2 1.4 2 1.4
Intensive health services 1 0.7 1 0.7
Sub-total 78 56.1
Don’t know/no answer 61 43.9 115 82.7
Table 35. Top perceived community problems and solutions, Barangay Masaguisi,
Bongabong, Oriental Mindoro, Philippines (n=139).
Community Problems Community Solutions
don’t know – 43.2%
With answer – 56.8%
don’t know/no answer – 43.9%
With answer – 56.1%
1. Unemployment
2. Poverty
3. Poor nutrition
1. Employment: livelihood programs
2. Financial assistance
3. Construction of Village health center

48
5.3.13 Governance
Contrary to the perception of some community residents that there is no organized
management of the village’s Bantay Dagat, BFARMC, and village council, key informants in
the village declared that the village council plans and enforces rules and regulations
pertaining to coastal management activities in Barangay Masaguisi. It was also noted that
this governing body is in the process of developing a coastal management plan for the village
in order to set the direction of its coastal activities. However, despite having a legitimate and
legal basis for performing coastal management activities, logistical problems hamper the
BFARMC’s performance of its functions, particularly the lack of regular fund allocations.
During the community validation, village leaders also complained that the municipal
government grants permits for commercial fishers to operate within the 10.1 – 15 kilometer
(from the shoreline) of municipal waters. Yet, these commercial fishers actually go beyond
their limits and fish nearer within the 10.1 kilometers, thereby intruding into the fishing
grounds of small fishers. They also mentioned that the municipal government previously
allowed them to use fish aggregating device (“payaw” in the local dialect). But for reasons
which seem unclear to them, their permits were not renewed this year, 2012. The decrease in
fishers’ catches was attributed to these two conditions.
The village council leaders have already initiated the delineation and protection of
Masaguisi Reef as a fish sanctuary. They have passed a resolution requesting the Municipal
Government of Bongabong to enact an ordinance establishing a fish sanctuary in the village.
They have established its boundaries and are about to set up demarcation buoys, in addition
to having two motor boats to patrol the reef. The village council has also deputized seven
fish wardens and obtained a donation of a speed boat for the proposed fish sanctuary. Yet the
village leadership is still waiting for the legislative council of the Municipal Government of
Bongabong to pass a municipal ordinance declaring the reef as a fish sanctuary.

49
5.4. Recommendations
Based on the stated findings, the following recommendations are offered:
1. Verify the bio-physical status of the resources in the village to validate the residents’
perceptions of the conditions of their coastal and non-coastal resources.
2. Monitor the resource areas to determine if the threats cited are still continuing up to
the present so that necessary actions to mitigate and/or eliminate the existing threat
can be undertaken.
3. Efficiently operationalize the BFARMC and Bantay Dagat as mass- and community-
based organizations spearheading the protection of the coastal resources within the
village.
4. Undertake wider dissemination of environmental rules and regulations, not only to the
resource users but as well as to the community at large if resource protection and
conservation will have to be a “community affair.” This is because awareness of
resource rules and regulations are mostly limited to the actual resource users.
5. Organize and/or strengthen agriculture-related stakeholder organizations so that more
farmers may get involved in communal decision making. Barangay Masaguisi is a
combined farming/fishing community with more households relying on farming
rather than fishing as their occupation.
6. Designate environmental police personnel in critical areas who can immediately
respond and confront violators. Give greater attention to the governance dimension,
more specifically on enforcement of rules in coastal management. Though the
BFARMC and Bantay Dagat members are deputized to apprehend offenders, they
hesitate to do so because of the attendant risks to their lives.
7. Pass a municipal ordinance declaring the delineated coral reef area within the waters
off the coast of Barangay Masaguisi as a fish sanctuary and provide logistical support
to ensure that the integrity of the zone shall be established and maintained.
8. Harmonize policy being implemented by concerned government agencies. Although
the municipal government permits commercial fishing vessels to operate from 10.1 to
15 kilometers away from the shoreline, it is quite difficult on the ground to ensure
that they keep to their boundaries and not fish nearer than 10 km to the shoreline.

50
9. Consider other policy options that would ease the pressure on exploitation of coastal
resources and fishery such as the regulation of fishing methods. Residents are already
aware that there is over-extraction as evidenced by decreased fish catches and this
trend would continue unless interventions are introduced to allow the fish stocks to
recover.
10. Explore alternative/supplemental livelihood opportunities that would allow village
residents to become micro-entrepreneurs and or self-employed, which is the most
realistic employment option for them. The assistance should not only be limited to
training and capital support but must also include organizational and marketing
support. Fishers are already experiencing decreasing fish catch. Limiting fishing and
resource use activities may further result to reduced income for them, in the short
term. Hence, more viable alternatives to fishing as a livelihood need to be introduced.
11. Mobilize more community residents for coastal clean-ups, waste segregation
programs, and monitoring/reporting of violators of resource rules and regulations.
The more residents are involved in community work, the greater would be their sense
of community responsibility and involvement.
12. Conduct and/or intensify information and education campaigns among all residents
on the proper utilization and conservation of coastal resources, with emphasis on an
ecosystem approach. There is also a need to focus on the role of man both as a user
and steward of such resources.
13. Utilize the SocMon results to update development plan/s at the village and municipal
levels and to formulate/review/evaluate resource use policy.
14. Undertake the same baseline study in the future. Because the data presented herein
were collected in order to establish baseline conditions at Barangay Masaguisi, it is
also recommended that a similar undertaking be conducted three or five years hence
in order to monitor changes and trends, if any.

51
5.5 Bibliography
Alconices, A. M. and Bartolome, V.M. 2006. Coastal Environment Profile of Bongabong,
Oriental Mindoro, Coastal Management Project- Provincial Government of Oriental
Mindoro. Oriental Mindoro.
Bunce L, Pomeroy R.S. 2000 Socioeconomic monitoring guidelines for coastal managers in
southeast Asia: SocMon SEA. World Commission on Protected Areas and Australian
Institute of Marine Science, Australia.
Bunce L, Townsley P, Pomeroy R, Pollnac R. 2003.Socioeconomic manual for coral reef
management.Australian Institute of Marine Science, Australia.
Municipality of Bongabong. 2005. Bongabong, Oriental Mindoro, Coastal Environment
Profile.
Municipality of Bongabong. 1980. Bongabong, Oriental Mindoro Land Use Plan. Oriental
Mindoro.
Municipality of Bongabong. 2010. Barangay Masaguisi Socio-economic Profile and
Development Plan. Oriental Mindoro.
Municipality of Bongabong. 2010. Community Based Monitoring System Database.
Oriental Mindoro.
This document may be cited as:
PSU-MinSCAT (Palawan State University-Mindoro State College of Agriculture and
Techonology ). 2012. SocMon Site Report in Barangay Cawayan, Bongabong, Oriental
Mindoro, Philippines. 51 p. Center for Strategic Policy and Governance/Palawan State
University, Puerto Princesa City.

255
Part 6 Appendices
“Socioeconomic Monitoring (SocMon) Program in the
Philippines to Support Effective Coral Reef Conservation and
Coastal Resources Management: Initiation in Oriental Mindoro
Province and Continuation in Puerto Princesa City, Palawan
Province”

256
Household Survey ID Number
Socioeconomic Monitoring (SocMon) Household Interview Questionnaire
(Patnubay sa Sambahayang- Panayam Para sa “Socioeconomic Monitoring”)
Date of Interview (Petsa ng Panayam):________________________ Time Interview (Oras ng Panayam): Start (Simula) ___________ End (Natapos): __________
Survey Site: ___ Bongabong, Oriental Mindoro Barangay: ___________________ Sitio/Purok: ______________________ Street (Kalye): _________________
___ Puerto Princesa City, Palawan Barangay: ___________________ Sitio/Purok: ______________________ Street (Kalye): _________________
Interviewee (Kinapanayam): Name (Pangalan) _______________________Household Role (Tungkulin): __________________________Sex: ________ Age: __________
Interviewer (Tagapanayam): Name (Pangalan) _____________________________________________Signature (Lagda): __________________________
Checked by: Name of Field Supervisor: ___________________________________ Signature: ________________________________ Date: ___________________
Encoded by: Name of Encoder: __________________________________________ Signature: ________________________________ Date: __________________
1. H O U S E H O L D D E M O G R A P H I C S (Demograpiya ng Sambahayan)
H1-8. Age, Gender, Ethnicity, Education, Religion, Language, Occupation, Household Size:
(Edad, Kasarian, Ethnicity, Edukasyon, Relihiyon, Wika, Hanapbuhay, Laki ng Sambahayan):
H1A: Name
of Household
Member
(Pangalan ng
Miyembro ng
Sambahayan)
H1B: Role/
Relationship
with Household
Head
(Tungkulin/
Kaugnayan sa
Pinuno ng
Sambahayan)
H2
Age, to
the
nearest
year
(Edad)
H3
Gender
(Kasarian)
Male - 1
Female -2
H4
Education
Level
Completed
(only ask
if > 16 yr)
(Edukasyon)
H5
Religion
(Relihiyon)
H6A
Birthplace (Saan
Pinanganak)
H6B
Ethnicity
(Pangkat
Etniko)
H7 Primary
Language
Spoken
(Pangunahing
Wika)
H8A
Primary
Occupation
(Pangunahing
Hanapbuhay)
H8B
Secondary
Occupation
(Pangalawang
Hanapbuhay)

257
H9. Household Income (Kita ng Sambahayan)
A. What is your household’s most important source of income? _____________________________________________
(Ano ang pinakamahalagang pinagmumulan ng kita ng inyong sambahayan?)
B. What is your household’s second important source of income? ____________________________________________
(Ano ang pangalawang mahalagang pinagmumulan ng kita ng inyong sambahayan?)
2. C O A S T A L A N D M A R I N E A C T I V I T I E S (Mga Gawaing Pantabing-Dagat at Pandagat)
H10-14: Household activities, Household Goods and Services, Types of Household Uses, Household Market
Orientation, Household Uses (Mga Gawain ng Sambahayan, Produkto at Serbisyo ng Sambahayan, Uri ng Pinaggagamitan
ng Sambahayan, Oryentasyon ng Sambahayan sa Palengke, Pinaggagamitan ng Sambahayan):
H10
Coastal and Marine
Activities (eg
fishing, tourism, etc)
(Mga Gawaing
Pantabing-Dagat at
Pandagat)
(hal. Pangingisda,
turismo, atbp.)
H11
Coastal and Marine
Goods and Services
(Uri ng Produktong
Dagat at Serbisyong
Pantabing-Dagat)
H14
Household Uses
(eg. sale, consumption,
giveaway, payment to
labor, etc)
(Mga Pinaggagamitan ng
Sambahayan: Pambenta,
pagkain, pamigay,
pambayad sa manggagawa,
atbp.)
H13
Household Market
Orientation
( eg Within the
barangay/ outside the
barangay)
(Lokasyon ng bentahan:
Sa loob ng barangay/sa
ibang barangay ng
munisipyo o lungsod/sa
labas ng munisipyo o
lungsod)
%
Sold/
bartered
1. 1 1 1
2 2
3 3
2 1 1
2 2
3 3
3 1 1
2 2
3 3
2.
1 1 1
2 2
3 3
2 1 1
2 2
3 3
3 1 1
2 2
3 3
3.
1 1 1
2 2
3 3
2 1 1
2 2
3 3
3 1 1
2 2
3 3
3. A T T I T U D E S A N D P E R C E P T I O N S (Saloobin/Palagay at Pansin)
H15. Non- market and Non- Values: Indicate degree of agreement/disagreement with the following statement using the scale: strongly agree (5); agree (4);
neither agree nor disagree (3); disagree (2); strongly disagree (1).(Tukuyin ang antas ng pagsang-ayon sa bawat
pangungusap gamit ang sumusunod na sukatan :lubusang sumasang-ayon (5); sumasang-ayon (4); neutral o walang
mapili (3); di sumasang-ayon (2); lubusang di-sumasang-ayon (1).

258
_____A. The reefs are important for protecting land from storm waves. (indirect non- market value)
(Mahalaga ang mga batuhan at bahura upang maprotektahan ang lupa laban sa malalakas na alon).
_____B. In the long- run, fishing would deteriorate if we cleared the coral. (indirect non-market value)
(Sa kalaunan, mas mapipinsala ang pangisdaan kapag nawala ang mga bahura)
_____C.* Unless mangroves are protected, we will not have fish to catch. (indirect non-market value)
(Ang mga bakawan ay nakakatulong upang dumami ang mga isda.)
_____D.* Coral reefs are only important if you fish or dive. (existence non-use value)
(Mahalaga lamang ang mga bahura para sa mga mangingisda at maninisid.)
_____E. I want future generations to enjoy the mangroves and coral reefs. (bequest non- use value)
(Gusto kong matamasa pa ng susunod na henerasyon ang mga bakawan at bahura).
_____F. Fishing should be restricted in certain areas even if no one ever fishes in those areas just to allow the fish
and coral to grow. (existence value)
(Dapat limitahan ang pangingisda sa ilang piling lugar kahit na walang nangingisda doon upang hayaang
lumaki at dumami ang mga isda at bahura).
_____G. We should restrict development in some coastal areas so that future generations will be able to
have natural environments. (bequest value)
(Dapat limitahan ang pagpapaunlad sa ilang parte ng tabing-dagat upang magkaroon pa ng natural
na kapaligiran ang susunod na henerasyon).
_____H.* Seagrass beds have no value to people. (existence value )
(Walang halaga sa mga tao ang mga lusayan o nakalatag na damong-dagat).
(Ang mga lusayan o damong dagat ay may halaga sa mga tao. )
H16. Perception of Resource Conditions (Pagpansin sa mga Kalagayan ng Yaman):
How would you describe current coastal resource conditions on a scale from very good (5), good (4), not good nor bad
(3), bad (2) to very bad (1) (edit list to reflect site resources ):
Paano mo ilalarawan ang kasalukuyang kalagayan ng inyong tabing-dagat, gamit ang 5-puntong sukatan:
napakaganda (5); maganda (4); di-maganda,di-pangit (3); pangit (2);napakapangit (1) ; hindi alam (9) :
Resource/ Rating (Yaman/Rating) Perceived Condition
(Nakikitang Kondisyon)
A Mangroves (Bakawan) 1 2 3 4 5 9
B Coral reefs (Bahura)) 1 2 3 4 5 9
C Upland Forests (Kagubatan/gubat sa bundok) 1 2 3 4 5 9
D Seagrass (Lusay o damong-dagat) 1 2 3 4 5 9
E Beach (Aplaya) 1 2 3 4 5 9
F Spring (Bukal) 1 2 3 4 5 9
G River/Creeks (Ilog/Sapa) 1 2 3 4 5 9
H Waterfalls (Talon) 1 2 3 4 5 9
I Ground Water (Pinagkukunang-tubig na gamit pambahay) 1 2 3 4 5 9
H17. Perceived Threats (Mga Natuklasang Banta):
What are the top 3 major threats to the health of coastal resources? (please list threats)
Ano ang 2 pangunahing banta sa kalusugan ng mga yaman sa tabing-dagat? (pakilista ang mga banta)
Resource
(Yaman) Threat
(Banta 1) Threat 2
(Banta 2) Threat 3
(Banta 3)
A Mangroves (Bakawan)
B Coral reef (Bahura)
C Upland Forests (Kagubatan/ gubat sa bundok)
D Seagrass ( Lusay o Damong-dagat)
E Beach (Aplaya)
F Spring (Bukal)
G River/ Creeks (Ilog/sapa)
H Waterfalls (Talon)
I Ground Water (Pinagkukunang –tubig)

259
H18. Awareness of Rules and Regulations (Kabatiran/Kamalayan sa mga Patakaran at Regulasyon): Are there rules and regulations related to the following activities in your communities? Please tick appropriate box. If yes,
what types are these? Sa inyong pagkakaalam, may regulasyon ba kaugnay sa pagpapaunlad ng mga gawaing nakalista
sa ibaba? Bilugan ang binigay na sagot): 1 – Yes/Meron; 2 – none/wala; 9 – don’t know/hindi alam. Kung meron, saan
nagmula ang regulasyong ito? 1 – sa barangay; 2 – sa munisipyo/syudad; 3 – sa probinsya; 4 – sa bansa
Activities (Mga Gawain) Response
(Sagot) If yes, Origin of Regulation
(Pinagmulan ng patupad)
A Fishing (Pangingisda) 1 2 9 1 2 3 4
B Mangrove Use (Gamit ng bakawan) 1 2 9 1 2 3 4
C Aquaculture (Pag-aalaga ng mga piling yamang-dagat) 1 2 9 1 2 3 4
D Resort/ pension house/ hotel development
(Bakasyunan/Bahay-panulugan/Pagpapalaki ng hotel)
1 2 9 1 2 3 4
E Residential development (Pagpapalaki ng tirahan) 1 2 9 1 2 3 4
F Watersports (Libangang-pantubig) 1 2 9 1 2 3 4
G Recreational climbing/ trekking/camping
(Nakalilibang na pag-akyat sa bundok/paglilibot/kamping)
1 2 9 1 2 3 4
H Pebble gathering (Pagkuha ng graba/maliliit na bato sa aplaya) 1 2 9 1 2 3 4
I Tourist transportation (daungan ng mga sasakyang-panturista) 1 2 9 1 2 3 4
Marine transportation (daungan ng sasakyang pang-dagat) 1 2 9 1 2 3 4
J Others (specify): 1 2 9 1 2 3 4
H21. Participation in Decision-making (Partisipasyon sa Paggawa ng Desisyon):
On a scale of 1 to 5 (1=no participation, 5= fully active participation), to what extent do you participate in coastal
management decision-making? Gamit ang 5 sukatan mula sa walang partisipasyon (1) hanggang napaka-aktibong
partisipasyon (5), gaano kalawak ang iyong partisipasyon sa paggawa ng desisyon sa pamamahala sa tabing-dagat?
Coastal-Related Activities
(Mga Gawaing pang tabing-dagat)
Levels of Participation
(Antas ng partisipasyon)
Current Level
(Kasalukuyan) Desired Level
(Kagustuhan)
A Fishing (Pangingisda) 1 2 3 4 5 1 2 3 4 5
B Mangrove Use (Gamit ng bakawan) 1 2 3 4 5 1 2 3 4 5
C Aquaculture (Pag-aalaga ng mga piling yamang-dagat) 1 2 3 4 5 1 2 3 4 5
D Resort/ pension house/ hotel development
(Bakasyunan/Bahay-panulugan/Pagpapalaki ng hotel)
1 2 3 4 5 1 2 3 4 5
E Residential development (Pagpapalaki ng tirahan) 1 2 3 4 5 1 2 3 4 5
F Watersports (Libangang-pantubig) 1 2 3 4 5 1 2 3 4 5
G Recreational climbing/ trekking/camping
(Nakalilibang na pag-akyat sa bundok/paglilibot/kamping)
1 2 3 4 5 1 2 3 4 5
H Pebble gathering (Pagkuha ng graba/maliliit na bato sa aplaya) 1 2 3 4 5 1 2 3 4 5
I Tourist transportation (daungan ng mga sasakyang-panturista) 1 2 3 4 5 1 2 3 4 5
Marine transportation (daungan ng sasakyang pang-dagat) 1 2 3 4 5 1 2 3 4 5
J Others (specify) (Iba pa, ilista):
H22. Membership in Resource Use Stakeholder Organizations (Pagiging Miyembro sa Organisasyon ng Stakeholder).
How many from your household is/are member of a resource use stakeholder organization?
(Ilan sa inyong sambahayan ang miyembro ng organisasyon nauukol sa yamang natural ?
Number of HH members (check): ___0 (none) ___1 ___2 ___ 3 ___4 Others: specify ___
Name of Household Member
(Pangalan ng Miyembro ng Sambahayan) Organization
(Pangalan ng Organisasyon)
For Questions H23-24. Complete the box below
(Para sa mga katanungan sa H 23-24. Sagutan ang mga kahon sa ibaba
H23. Perceived Coastal Management Problems (Nakikitang Problema sa Pamamahala ng Tabing-dagat):
Aside from threats, what do you see as the two major problems facing coastal management in the
community? (Maliban sa mga banta, ano sa iyong palagay ang dalawang pangunahing problema ng komunidad
sa pamamahala sa tabing-dagat?)

260
H24. Perceived Coastal Management Solutions (Nakikitang solusyon sa pamamahala ng tabing-dagat):
What do you see as solution to these problems?(Anosa iyong palagay ang mga solusyon sa ganitong mga problema?)
H.23. Two Major Problems
(Dalawang Pangunahing Problema) H.24 Solutions to Problems
(Solusyon sa mga Problema)
H25 Perceived Community Problems (Nakikitang Problema ng Komunidad):
What are two major problems facing the community? (Sa iyong palagay, ano ang 2 pangunahing problema ng inyong
komunidad?)
H.25. Two Major Problems
(Dalawang Pangunahing Problema) H.25a Solutions to Problems
(Solusyon sa mga Problema)
H26. Success in Coastal Management (Tagumpay sa pamamahala sa tabing-dagat):
What two things do you think have worked well for coastal management in the community? (Sa inyong palagay,
anong dalawang bagay ang naging matagumpay sa pamamahala sa tabing- dagat ng inyong komunidad?)
1. _______________________________________________________________________________________
2. _______________________________________________________________________________________
H27. Challenges in Coastal Management (Mga Hamon sa Pamamahala sa Tabing-dagat):
What two things do you think have not worked well for coastal management in the community?
(Sa iyong palagay, ano ang dalawang hamon ng inyong komunidad sa pamamahala sa tabing-dagat?)
1. _______________________________________________________________________________________
2. ________________________________________________________________________________________
4. M A T E R IA L S T Y L E O F L I F E (Materyal na Istilo ng Buhay):
H28. Material Style of Life (Materyal na Istilo ng Buhay): For each house note and encircle appropriate number:
A. Type of roof (Uri ng bubong) 1 = tile (tisa) 4 = thatch/ bamboo (kawayan)
2 = tin / GI sheet (lata/yero) 5 = thatch / nipa (pawid/nipa)
3 = wood/ plywood (kahoy/plywood) Others: __________________
B. Type of outside structural walls (Uri ng panlabas na kayarian ng dingding):
1 = tiled (tisa) 4 = thatch/nipa (pawid/nipa)
2 = brick/concrete (kongkreto) 5 = thatch/ bamboo (kawayan)
3 = wood /plywood (kahoy/plywood) Others: __________________
C. Windows (Bintana): 1 = glass (salamin) 4 = open (bukas)
2 = steelbars/ grill (bakal/rehas) 5= none (wala)
3 = wooden (kahoy) Others: __________________
D. Floors (Sahig): 1 = tile (tisa) 4 = bamboo (nipa/kawayan)
2 = wooden (kahoy) 5 = dirt (lupa)
3 =cement (semento) Others: ___________________
E. Other Household Assets (Check, if applicable):
1 = Vehicle (type): __________________ 4 = Refrigerator
2 = Banca (type): ___________________ 5 = Television set
3 = Computer: _________________ 6 = Other Appliances: ______
Other Observations & Notes: ______________________________________________________________________
Time of End of Interview: _____________

261
KII Survey ID Number
Socioeconomic Monitoring (SocMon) Key Informant Interview/ Guide
Date of Interview (Petsa ng Panayam):__________ Time Interview (Oras ng Panayam): Start (Simula): ________
End (Natapos):________
Survey Site: ___ Bongabong, Oriental Mindoro ___ Puerto Princesa City, Palawan
Interviewee (Kinapanayam): Name (Pangalan): ________________________ Sex: ________ Age: ________
Role (Tungkulin sa komuninad): ___________________________________________
Interviewer (Tagapanayam): Name (Pangalan): ________________________Signature (Lagda): _______________
Checked by: Name of Field Supervisor: ________________________Signature: ______________Date:__________
Encoded by: Name of Encoder: ______________________________ Signature: _____________________________
Part 1. COMMUNITY- LEVEL DEMOGRAPHICS (Hanay ng Demograpiya sa Komunidad)
KS1. Study Area: (Lawak ng Pag-aaral)
What are the boundaries of the study area? Note on base map.
Anu-ano ang mga hangganan ng lawak ng pag-aaral? Isulat sa mapa.
KS2. Population: (Populasyon)
How many people live in the study area? (Ilan ang mga taong naninirahan sa lugar na pag-
aaralan?) __________
KS3. Number of households: (Bilang ng Sambahayan)
How many households are in the study area? (Ilan ang sambahayan sa lugar na pag-aaralan?)
___________
KS4. Migration rate: (Bilang ng Pandarayuhan)
What was the net increase or decrease in people moving into and out of the study area in the last
year? (Note + or- to reflect moving in or out)
( Ano ang aktwal na karagdagan o kabawasan ng mga taong dumarating at umaalis sa lugar na pag-
aaralan, nang mga nakarang taon?)(Isulat + o – upang ipakita ang dumarating o umaalis)
____________
KS5. Age: (Edad)
What percent of the people in the study area are currently?
(Ilang porsyento ng mamamayan sa lugar na pag-aaralan ang kasalukuyang may edad na:)
____ 0-18; ____19-30; ____31-50; ____over 50?
KS6. Gender: (Kasarian)
What percentage of the population is (Ilang porsyento ang) male (lalake)? _______
female (babae)?_______

262
KS7. Education: (Edukasyon)
What is the average number of years of education of people over 16 years old in the study area?
Sa lugar na pag-aaralan, ano ang karaniwang bilang ng taon ng edukasyon ng mga mamamayang
mahigit sa 16 na taong gulang?) _______
KS8. Literacy: What percentage of the population is literate (can read and write) ____________
(Pinag-aralan: Ilang porsyento ng populasyon ang may pinag-aralan? (nakasusulat at nakababasa)
KS9. Ethnicity: (Ethnicity)
What is the ethnic make-up of the study area (percent of each major ethnic group in the study area)?
(Ano and kabuuang bilang ng katutubo sa lugar na pag-aaralan?) (Porsyento ng bawat grupo ng
pangunahing katutubo sa lugar na pag-aaralan.)
Major Ethnic Groups (please list) Percent
KS10. Religion: (Relihiyon)
What is the religious make-up of the area (percent of each religious group in the study area)?
(Ano ang kabuuang relihiyon sa lugar na pag-aaralan?) (Porsyento ng bawat relihiyon ng grupo sa
lugar na pag-aaralan)
Religion (please list) Percent
KS11. Language: (Wika)
What are the major languages spoken in the study area (percent of each major religious group in the
study area)?
(Anu-ano ang mga pangunahing wika sa lugar na pag-aaralan) (Porsyento ng bawat pangunahing
wika ng grupo sa lugar na pag-aaaralan)
Major Languages Spoken Percent

263
KS12. Occupation: Complete the following table
(Hanapbuhay: Sagutan ang sumusunod na talahanayan)
Major occupations
in community (Mga pangunahing hanapbuhay sa
komunidad)
Percent of working population
conducting this occupation as
primary occupation ( ∑n=100%)
(Porsyento ng populasyong
nagtatrabaho na ang trabaho ay
siyang pangunahing hanapbuhay)
Number of people conducting
this occupation as primary
occupation
(pls count; give number)
(Bilang ng mamamayan na ang
trabaho ay pangunahing
hanapbuhay)
Percent of working
population conducting
this occupation as
secondary occupation
(Porsyento ng populasyong
nagtatrabaho na ang trabaho ay
pangalawang hanapbuhay)
1.
2.
3.
4.
5.
6.
7.
Part 2. COMMUNITY INFRASTRUCTURE (Balangkas ng komunidad)
KS13. Community Infrastructure: Circle which services exist in the study area:
(Balangkas ng komunidad: Bilugan kung alin ang umiiral na serbisyo sa lugar na pag-aaralan.)
Schools, resident doctors, resident nurses, hospitals, medical clinics, electricity, telephone, internet access, radios televisions, news papers, sewage treatment plant, ice plant, hard top
road access, water supply to homes, banking/credit union services, rotating credit associations, guesthouses/hotels/inns, restaurants.
(Mga paaralan, naninirahang doktor, naninirahang nars, ospital, medikal klinik, elektrisidad, telepono, internet access, suplay ng koryente sa mga bahay, serbisyo ng bangko /
naglilibot na asosasyong nagpapautang, radio at telebisyon, sewage treatment plant, pagawaan ng yelo, hard top road access, suplay ng tubig sa mga bahay, bahay-paupahan
(guesthouse) / hotels / bahay-panuluyan ( inns), at restauran.

264
Part 3 COASTAL AND MARINE ACTIVITIES (Mga Gawaing Pantabing-dagat at Pandagat)
KS14-23. Activities, Goods and Services, Types of Use, Value Goods and Services, Goods and Services Market Orientation, Use Patterns, Levels of Impact, Types of Impact, Level of
Use by Outsiders, Household Use
(Mga Gawain, produkto at serbisyo, uri ng gamit, kahalagahan ng produkto at serbisyo kaangkupan sa pamilihan ng produkto at serbisyo, pinaggagamitan, lebel ng bisa, lebel ng
gamit ng tagalabas (outsiders), gamit ng sambahayan:)
Complete the following table (see Appendix A for examples of how to complete the table):(Sagutan ang mga sumusunod na talahanayan) (Tingnan ang Apendiks A para sa halimbawa ng
pagsagot)
Coastal
and
Marine
Activities (Mga gawaing
pantabing-dagat
at pandagat)
Costal and
Marine Goods
and Services
(Produkto at
serbisyong
pantabing dagat
at pandagat)
KS16/ H16 Types of
Household Uses
(identify specific
method to acquire the
goods and services or
the device being
employed)
(Pinaggagamitan ng
Sambahayan)
(tukuyin ang tiyak na
paraan sa pagtamo ng
produkto at serbisyo o
ang kagamitan sa
pagtatrabaho)
Value of
Goods
and
Services (Kahalagahan
ng mga
produkto at
serbisyo)
(ie: High,
Medium,
Low)
Goods and
Services Market
Orientation
(primary)
(Mga produkto at
serbisyong
angkop sa
pamilihan
( ie Within the
barangay,
outside the
barangay,)
Use Patterns
(Location of
coastal and
marine activities)
(tukuyin ang lugar
na pinagkukunan
ng mga gawaing
pantabing-dagat at
pandagat)
(eg. reef, bay,
coast)
Level of
Impact ( of
coastal
and
marine
activities
to
resources)
(ie: High,
Medium,
Low)
Types of Impact
(primary)
(Identify the
activities that
have impact on
resources)
(eg. overfishing,
pollution,
anchor damage,
nutrient
loading)
Level of
(resource)
use by
Outsiders
(Lebel ng
paggamit ng
tagalabas)
(ie: High,
Medium,
Low)
Household Uses
(eg. sale,
consumption,
giveaway, payment
to labor, etc)
(Mga
Pinaggagamitan ng
Sambahayan)
(hal. Pabenta,
pagkain, pamigay,
pambayad sa
manggagawa, atbp.)
1 1 1 1 1 1 1 1 1 1
2 2 2 2 2 2 2 2 2
3 3 3 3 2 3 3 3 3
2 1 1 1 1 1 1 1 1 1
2 2 2 2 2 2 2 2 2
3 3 3 3 3 3 3 3 3
3 1 1 1 1 1 1 1 1 1
2 2 2 2 2 2 2 2 2
3 3 3 3 3 3 3 3 3
4 1 1 1 1 1 1 1 1 1
2 2 2 2 2 2 2 2 2
3 3 3 3 3 3 3 3 3
5 1 1 1 1 1 1 1 1 1
2 2 2 2 2 2 2 2 2
3 3 3 3 3 3 3 3 3

265
KS24. Stakeholders: (Stakeholders: individuals, groups, or organizations of people who are interested, involved or affected (positively and negatively by
CRM)
Complete the following table: (Sagutan ang mga sumusunod na talahanayan)
Coastal Activity*
( Gawaing patabing-dagat) Stakeholder Group 1
(Pangunahing hanay/ grupo ng
nakikinabang)
Stakeholder Group 2
(Ikalawang hanay/ grupo ng
nakikinabang)
Stakeholder Group 3
(Ikatlong hanay/ grupo ng
nakikinabang)
1
2
3
4
5
Part 4 GOVERNANCE (Pamamahala)
KS25-29. Management Body, Management Plan, Enabling Legislations, Resources Allocations, Formal Tenure and Rules:
(Pangkat ng namamahala, Plano sa pamamahala, Paggawa ng batas, Alokasyon ng yaman. (Karaniwang panunungkulan at patakaran)
Complete the following table (see Appendix A, KS25-29 for examples of how to complete the table):
(Sagutan ang mga sumusunod na talahanayan) (Tingnan sa apendiks A, KS 25-29 ang mga halimbawa sa pagsagot)
Note: Formal Tenure: de jure use right/ access
Coastal
Activity*
(Mga gawaing
pantabing –
dagat)
Management
Body(s) & Name
(indicate: Yes or
No)
(Pangkat ng
namamahala)
(Pangalan)
Management Plan
(indicate: Yes or
No)
(Plano ng
pamamahala)
Enabling
Legislation
(indicate: Yes or
No)
(Mga batas na
nagbibigay bisa
patungkol sa
pamamahala)
Number
of Staff
(Bilang
ng
tauhan)
Budget
(Perang
nakalaan)
Formal Tenure
Arrangements
(indicate: Yes or
No)
(Karaniwang
pagsasaayos ng
panunungkulan)
Relevant Rules
and Regulations
(indicate: Yes or
No)
(Nauugnay na
patakaran at
regulasyon)
1
2
3
4
5

266
KS31: Stakeholder Participation: (Partisipasyon ng Stakeholders)
Complete the following table: (Sagutan ang talahanayan)
Stakeholder Group*
(Grupo ng Stakeholder) Stakeholder Participation (Yes/No)
(Partisipasyon ng Stakeholder) (Oo / Hindi)
KS32: Stakeholder and Community Organizations: (Organisasyon ng Stakeholder at komunidad)
Complete the following table: (Sagutan ang talahanayan)
Community Organization
(Organisasyon ng komunidad)
Formal or Informal
(Karaniwan o di-
karaniwan)
Main Functions
Pangunahing tungkulin)
Influence (on coastal management; community
issues; both; none)
(Impluwensya) (sa pamamahala sa tabing-dagat,
isyu sa komunidad; pareho; wala)
END

SOCIOECONOMIC MONITORING FIELD MANUAL
MARISSA S. PONTILLAS
Lead Trainor
MICHAEL D. PIDO EVA MARIE C. PONCE DE LEON
NELLY I. MENDOZA Trainors
SocMon Center for Southeast Asia (SocMon-SEA) Center for Strategic Policy & Governance (CSPG)
Palawan State University Puerto Princesa City, Palawan, Philippines
March 2011
267

Table of Contents
I. INTRODUCTION .............................................................................................................. 1
A. About the Manual ............................................................................................................ 1
B. Background ..................................................................................................................... 1
C. Socmon Component Goal And Objectives ..................................................................... 2
II. METHODOLOGY ............................................................................................................. 2
A. Survey Coverage ............................................................................................................. 2
B. Sampling Procedure ........................................................................................................ 2
C. Confidentiality of the Survey .......................................................................................... 3
D. Selection Requirements for Field Staff ........................................................................... 3
E. Specific Duties of the Field Staff .................................................................................... 4
III. SURVEY FIELD GUIDE ............................................................................................... 5
A. Preparations for the Survey ............................................................................................. 5
B. HHS Field Work Procedures ........................................................................................... 5
C. Interview Proper .............................................................................................................. 8
D. Recording Accurately...................................................................................................... 9
E. Closing the Interview .................................................................................................... 10
F. Setting Appointments .................................................................................................... 10
G. Rules for Replacement. ................................................................................................. 10
H. Post-HH Survey Interview ............................................................................................ 10
I. Documentation .............................................................................................................. 10
IV. IMPLEMENTING THE HOUSEHOLD SURVEY QUESTIONNAIRE .................... 11
A. Preliminary Household Survey Information ................................................................ 11
B. Household Demographics ............................................................................................. 12
C. Household Income ........................................................................................................ 14
D. Household Coastal and Marine Activities..................................................................... 15
E. Attitudes and Perceptions .............................................................................................. 16
F. Material Style of Life .................................................................................................... 22
V. IMPLEMENTING THE KEY INFORMANT INTERVIEW SCHEDULE ................... 23

A. Key Informant ID Number ............................................................................................ 24
B. Part 1. Community- Level Demographics ................................................................... 25
C. Part 2. Community Infrastructure ............................................................................... 26
D. Part 3. Coastal and Marine Activities .......................................................................... 27
E. Part 4. Governance ....................................................................................................... 29
VI. IMPLEMENTING THE FOCUS GROUP DISCUSSION (FGD) ............................... 31
A. Purpose of FGDs ........................................................................................................... 31
B. The FGD Moderator’s Role and Responsibilities ......................................................... 31
C. Some Tips and Guidelines (“Tricks” of the Trade) for FGD Moderators .................... 32
D. FGD Guide for Selected Socmon Variables ................................................................. 32
D.1. KS 14-14. Coastal and Marine Activities, Goods and Services, Types of
Household Uses, Household Uses, Market Orientation. .................................................. 32
D.2. H19. Compliance (Pagsunod) and H20. Enforcement (Pagpapatupad) .............. 37
D.4. KS30: Informal Tenure and Rules, Customs and Traditions ................................. 38
D.5. KS31: Stakeholder Participation ............................................................................ 39
E. Writing the FGD Report................................................................................................ 39
F. Reporting and Use of FGD Results ............................................................................... 40

1
I. INTRODUCTION
A. About the Manual
This field manual is published as reference guide for the researchers and enumerators
undertaking socioeconomic monitoring activities for the “The Last Frontier: Improved Law
Enforcement & MPA Management” project of the Municipal Agriculturist Office of the local
government of the Municipality of Taytay in the province of Palawan, Philippines. The
project is being implemented under a $19,389 funding grant from the US National Fish and
Wildlife Foundation – Coral Reef Conservation Fund 2011, with matching contribution from
the Municipal Government of Taytay in Taytay, Palawan.
The first section of the manual provides an overview of the project. The second
section presents the methodology of the project, as well as guidelines for enumerators. The
third part describes the contents of the questionnaires and guidelines on how to administer
them.
B. Background
The project seeks to increase the capacity of the local government of Taytay, Palawan
to improve fishery law enforcement and MPA management with the help of necessary
equipment, community education, an eco-friendly guard station and increased monitoring
capacity.
This project will implement objective 1.3 of NOAA's International Strategy on coral
reef conservation by increasing local government capacity to protect and conserve the
precious coral reef resources of Taytay Bay, a marine area within the Coral Triangle. With the
assistance of NFWF, the local government will achieve the material and technical capacity to
greatly improve fishery law enforcement and MPA management. The Office of the Municipal
Agriculturist will gain the necessary materials to conduct law enforcement through all areas of
the municipal waters and clearly mark three newly established MPAs with marker buoys and
signs. In order to increase compliance with MPA codes the local government will conduct
environmental and MPA awareness campaigns in nearby communities, which will culminate
in the establishment of a fully functional guard station at the Dinot Island MPA constructed
largely from plastic trash and bottles collected and prepared by school children from these
communities, thereby increasing stakeholder investment in this MPA and concern for environmental conservation. Finally, the fisheries staff will gain the capacity to conduct
biophysical and socioeconomic surveys from expert trainers from nearby universities,
including the regional SocMon coordinator. The local government will then establish a
regular schedule of biophysical and SocMon surveys in the area to ensure the ongoing
monitoring of fisheries conservation practices, particularly MPA management. By the end of
this project, local government capacity to implement fisheries law and manage MPAs will
increase significantly to ensure the long term sustainable protection of Taytay Bay.

2
C. Socmon Component Goal And Objectives
The goal of this component is to implement and strengthen the Socioeconomic
Monitoring (SocMon SEA) Program in key coastal areas in the province of Palawan thereby
promoting more effective coral reef conservation and coastal resources management in the
Philippines. Implicit in this goal is to showcase the utility and practical applications that may
be derived from using SocMon as tool for adaptive management. The associated objectives to
achieve this goal are to:
1. train new researchers, managers and key stakeholders in applying the SocMon SEA
methodology, in generating relevant socioeconomic information;
2. undertake SocMon field surveys at four coastal villages in the municipality of Taytay,
province of Palawan, Philippines;
3. analyze the collected data and prepare appropriate technical reports, policy briefs and
recommendations for use by relevant stakeholders, including documentation of the
experiences and lessons learned on the use of SocMon; and
4. disseminate the results to policy makers, coastal managers, local communities and other
relevant stakeholders to ensure that results are used for adaptive management.
This field manual is thus being produced as a material for the training of
researchers and practitioners in the SocMon Methodology. It shall also serve as a guide
during the researchers’ actual field surveys to facilitate gathering, encoding and
processing of data and to ensure data quality assurance.
II. METHODOLOGY
A. Survey Coverage
The SocMon Survey has four sections; the secondary data gathering, the household survey
(HHS), the focus group discussion (FGD), and the Key Informant Interview (KII).
B. Sampling Procedure
The sample size for the Household survey is determined using a statistical formula, with
the total number of households in the study areas as the population size. The household samples
are to be selected at random, using stratified proportional sampling (with sitios as strata) and
systematic sampling (every household in the sitio will be visited, with k = number of households
in the sitio/desired number of sample households in the sitio.

3
C. Confidentiality of the Survey
The role of an enumerator is very important and crucial. It demands impartiality and
confidentiality at all times. Otherwise, the integrity of the survey, the Palawan State University
and its partner institutions in the project and the interviewer himself will be compromised. The
enumerator should never, in any way, engage the respondent in any unprofessional relationship
nor take advantage of the research project for personal gains.
Information about the project to which the enumerator is involved must remain classified
and must not be divulged to friends or relatives. Survey materials must be in a secure place to
help maintain the confidentiality of the project. In addition, all personal and professional
information about the respondent obtained by the enumerator during the course of the survey is
privileged. Professional ethical standards of confidentiality must be maintained at all times
regarding what the enumerator has learned from or about the respondents.
D. Selection Requirements for Field Staff
In choosing the enumerators, there are five (5) major factors being considered: education,
mastery of the dialect, age, sex and civil status.
Education. Preferred enumerators should have at least a college-level background and have
experience conducting surveys because interview work requires special communication skills,
including the handling of people from different economic strata. Those who will be doing the
FGDs and KIIs should be senior members of the survey team or those who have had similar
exposures in the past.
Mastery of the language. Each of the interviewers must be conversant in the language (or dialect
used) of the place.
Age. There is no strict preference as to age – interviewers are simply required to be healthy
enough to take on the physical rigors of the job.
Sex. Females are given priority. Based on previous surveys, women interviewers are perceived
as more acceptable and less threatening than the male counterparts to respondents, especially
when the subject matter tended to be delicate or controversial.
Civil Status. Whether single or married, the status of interviewers should not at all disturb
quality of performance or authenticity of work. It should be understood by everybody that the
nature of work demands availability and flexibility of time.
Personal Qualities of Interviewers. Aside from the above factors, enumerators need to possess
the following qualities:
1. Honest/sincere – must have unquestionable integrity in order for the enumerator to be
credible
2. Patient/kind – must exert effort to draw answers from respondents without showing
irritability
3. Punctual – being on time

4
4. Flexible/dependable – resourceful enough to find ways and means to accomplish task without
being rigid
5. Legible handwriting – very important in gathering information for clarity purposes
6. Organized and thorough – must devise a system in order to fast track the activity
7. well groomed and personable – to ensure that the enumerator will be respectable in the eyes
of the respondents
8. Has the right/positive attitude – it enables him/her to look at the bright side of work, making
tasks easier
9. Always prepared – knowledgeable about the project, the objectives and the data needed to be
gathered.
E. Specific Duties of the Field Staff
Site Team Leader (STL)
Heads the overall implementation of the survey plan in the area
Assures the accuracy and completeness of the entire data gathering process; conducts spot
checks of enumerators
Supervises the data collection and processing activities
Evaluates completed questionnaires submitted by the enumerators
Meets enumerators to discuss and resolve concerns/problems
Pre-Survey Duties
Gets the master list of households from the concerned barangay, for the HHS.
Gets list of stakeholders in the sample barangay and the municipality where it is located, as a
basis for identifying the FGD and KII respondents
Does the sampling for respondents, following the sampling procedures.
Coordinates with barangay/sitio leaders to schedule interviews with sample respondents. Coordinates with concerned stakeholders to schedule FGDs and KIIs with sample
respondents.
Enumerator
Conducts or schedules interviews with sample HHS respondents.
Submits completed questionnaires to the STL daily, after the field interviews.
Obtain copies of the needed data.
Documents significant events in the field in a log notebook. Writes neatly and legibly.

5
III. SURVEY FIELD GUIDE
A. Preparations for the Survey
The enumerator should check that his/her survey kit is complete. Knowing what to do
and being equipped with the necessary materials will make the enumerator better prepared for
the interview. Each enumerator should have the following materials: letter of introduction, ID,
questionnaires, field notebook, pencils and pens.
During actual fieldwork:
The enumerator must look presentable. Since the enumerator is there to represent the
institutional partners in the research, it is a must that he/she appears as professional as possible.
The enumerator must be in good physical condition, as fieldwork demands a lot of legwork
and stamina. The enumerator should anticipate covering eight or more respondents a day.
The enumerator should be emotionally prepared. An enumerator meets various kinds of
people from all walks of life and emotional stability is important in being able to establish proper
rapport. The enumerator must be ready to listen and be able to handle all types of respondents.
Personal concerns should not be allowed to affect the interview. Enumerator should not show
surprise or shock with the answers of the respondents.
The enumerator must know the questionnaire and response codes by heart. The
enumerator must be well-versed with the questionnaire, short of being able to memorize the
exact question wordings so that he/she will be able to speak up well. Such will convey to the
respondent confidence and pride in interview work.
B. HHS Field Work Procedures
For efficiency in the data collection process, the deployment plan for each project area will
serve as guide for the actual field survey. The deployment plan contains the target households for the HHS and the target key informants for the KIIs and FGDs.
A. Approaching the respondent and establishing rapport.
Introduce self and purpose of visit. Show your credentials or the letter of introduction. If
needed, request from the respondent to conduct an interview.
The field enumerator’s approach, patience and persistence are important factors that affect the
quality of interviewing.
Approach. It is important for the enumerator to maintain a smiling and cheerful
countenance. The amount of cooperation from the respondent depends greatly on the
respondent’s first impression of the enumerator. It should be remembered that the enumerator is

6
a stranger meeting the respondent for the first time. A friendly smile will help the respondent to
be at ease and be assured of the enumerator’s good intentions.
It is also important to be polite at all times. A courteous greeting given to the respondent
in the most charming manner can make the enumerator’s job a lot easier.
When provoked by an ill-mannered respondent, the enumerator should never lose his/her
temper. The enumerator should continue to treat the respondent nicely as though he/she is
likeable. Nothing is ever gained by being impolite, graciousness may make the respondent
realize his/her won rudeness.
Be always alert and ready. Before approaching a respondent, the enumerator should b
ready to begin the interview, making sure that the correct questionnaire and interview materials
are on hand.
Right after the introduction, the first question should be asked right away, getting on with
the interview and avoiding wasted time in asking unnecessary questions and other social
pleasantries, which may bias the interview.
As soon as an answer to the first question is given, the next question should be asked
immediately. Once the enumerator hesitates or looks uncertain on what to say next, the
respondent will have the opportunity to ask questions ahead.
The enumerator should know the questions as these are asked in the right order, short of
memorizing them. Referring to the instructions for the next question is allowed during the first
few interviews. After that, the enumerator should be able to deliver the questions from memory
but without sounding mechanical. If the enumerator is not prepared, the respondent will show
signs of irritation towards the middle of the interview and may even become uneasy and
impatient for the interview to conclude.
The enumerator should be prepared to interview under inconvenient circumstances.
He/she should never show signs of discomfort or disgust if not offered a seat, if the place is too
hot or too cramped.
The enumerator should be alert for instances when the respondent drifts off to topics
which are of no relevance to the question being asked. The enumerator should tactfully steer the
conversation back to the questionnaire and obtain the needed information. He/She should
remember always to confine the discussion within the scope of the survey and not engage in any
business deals or discuss politics, religion or any controversial topic with the respondent.
It is also important to look and sound enthusiastic and interesting. The respondent’s
interest needs to be stimulated. Therefore, the enumerator should look and sound alive, fresh and
show that he/she enjoys the interview. These conditions would encourage the respondent to take
interest in the interviews and thus cooperate.
It is important to be flexible. The enumerator should use his/her discretion and judgment
in selecting the most appropriate approach in every situation. The quality of information
obtained from the respondents depends largely on the approach used.
The enumerator must take note of the time started. Indicate on the upper right part of the
first page of the questionnaire. Also, take note of the time finished. Indicate on the lower right
on the last page of the questionnaire.

7
Patience and persistence. The enumerator should take time in interviewing. Enough time
should be given to the respondent to think, as some may be slow in giving answers. Irritability
or impatience should never be shown. However, if there are indications that the respondent can
no longer continue or will no longer want to continue with the interview, the enumerator can
politely request for another appointment, or politely terminate the interview should the
respondent refuse to continue participating in the survey.
For items where multiple answers are allowed, the enumerator should prompt the
respondent and probe by asking “anything else?”.
Handling “special” respondents
It is possible that some respondents fall under the category “special”, that is, they may be
more difficult to handle during the interview.
The gossip type. When interviewing a perfectly amiable type who happens to be a great
gossiper, the enumerator should not entertain his/her chatter or the interview will never progress.
When the respondent pauses for breath, the next question should be asked. He/She sill not notice
that he/she has been interrupted.
The busy type. When coming across a respondent who says he/she does not have time
with the interview, the enumerator should not get easily discouraged. The respondent may just
be trying to put the interview off. A statement such as “This won’t take long” or “We could do
this in two parts” can help begin the interview and make the respondent give his/her full
attention.
The hostile/uncooperative type. When coming across the type who simply refuses to
answer questions or for some reasons is antagonistic to surveys, the first thing to do is to let
things go out of the respondent’s system. If the respondent makes a few strong statements and
the enumerator listens to him/her sympathetically, the respondent would soon identify himself
with the enumerator. If he/she still refuses to cooperate, repeating the purpose of the survey,
without overdoing it, may help. However, insincere praise, which can be spotted as an obvious
sales pitch, should be avoided.
Should the enumerator see that he/she is not getting anywhere despite all the efforts to
establish rapport, it is better to terminate the interview and record the call as an outright refusal.
Approach an alternative interviewee.
The suspicious type. Some respondents are suspicious at the start. The enumerator
should listen carefully to what they say. Suspicions are usually allayed by explaining to the
respondents the purpose of the study and that the information would be used for statistical
purposes. An assurance that everything they say will be treated with utmost confidentiality can
also help. Often, their suspicions will disappear as the interview goes on.
The nervous type. Some respondents are nervous in giving answers for fear that they
might not have the correct answer. Prior to the start of the interview, it is necessary to give the
respondents assurance that there are no wrong answers to the questions to allay the respondent’s
fear of saying the wrong things.
Presence of “kibitzers” or “onlookers. Should this scenario occur, it is important that
these kibitzers and onlookers be requested to leave the place during the interview. Some ways of

8
getting rid of kibitzers or onlookers or at least minimizing their presence is:
Diverting and side-tracking the outsider.
Satisfying the outsider’s curiosity like explaining the purposes of the survey
simultaneously to the respondent and outsider before the interview.
Role educating the outsider like giving the reason for needing privacy and that the presence of another person might bias the respondent’s answers.
Getting the respondent to initiate telling the outsider that the interview will not begin unless he outsider will leave the interview area.
C. Interview Proper
The enumerator can use the “6 helpers” in the interview process: what, who, why, where,
when, and how. He/she should give time to the respondent to think over the questions and
answers.
A major source of erroneous data is the enumerator: when he/she cheats, introduces his/her
personal biases, lacks rapport with the respondent, records answers improperly, misreads
instructions, deviates from asking the actual questions and probes inadequately, among others.
In surveys, QUALITY IS MORE IMPORTANT THAN QUANTITY. The enumerator
should aim for accuracy first, speed second.
It is important that each respondent is asked the same question in the same way. To do
this, the enumerator is requested to read the questionnaire verbatim during the interview. The
enumerator should never ad lib nor explain what a question means beyond what has been
discussed. The enumerator must not say anything that would bias the respondent’s answer. Any
deviation from the phrasing of the definitive question can potentially affect the outcome of the
survey.
It is also important that the enumerator records exactly and only what the respondent
answered. The enumerator should not edit the answers of the respondent.
The enumerator should also not suggest specific answers to the respondent. The
enumerator should leave the respondent alone to come up with his/her own responses. However,
it is permissible to help the respondent in certain special cases, particularly if the question needs
a factual answer and not an opinion.
A translated copy of the questionnaire is provided to be used for the interview of
respondents who are not able to understand English well. The questionnaire is translated to
Filipino or the local dialect in the area.
9
D. Recording Accurately
The following are general instructions that enumerators should observe when
administering the questionnaire:
1. Use only pencil (Mongol #2 or its equivalent) in recording the answers on the questionnaire.
No need to re-write with ballpen the final answers.
2. Always indicate the Time Start and the Time End for all interviews.
3. For close-ended questions: just encircle the appropriate answer in the answer grid. In cases
where the respondent’s answer is not in the answer grid, just write the answer verbatim in the
space provided for others. Record relevant side comments at the margin space. If no answer
grid is provided in the question, write the answer provided by the respondent and its
corresponding number code
4. For open-ended questions: Write the verbatim answers given by the respondent as the
interview is in progress. Record all replies in the very words the respondent uses. Do not
summarize or paraphrase answers. A good technique is to start repeating what the
respondent has said while you are writing the replies. If vague, do some probing so that the
given information would be relevant to the specific question. You may use abbreviations
during editing of questionnaire.
5. For quantitative answers: For answers given as range, politely probe the respondent for his
closest estimate. The final answer must be a single number or percentage. For responses that
require lengthy computation or conversion, record verbatim response on the margin space to
save time. Compute the exact response right after the interview.
6. In cases where the respondent cannot answer the question, verify whether the respondent
cannot respond because he/she does not know the answer or refuses to answer the question.
Record all responses as coded No question should be left unmarked. A blank means
negligence of the interviewer.
7. If respondent gave abbreviated answers, ask for the meaning of these abbreviations.
8. Likewise, there should be no prompting of a possible answer to any question. Interviewees
should not be lead towards a desired answer.
9. If an interviewer fails to immediately answer, wait for a while in case he/she might be taking
time before giving out answers. Should it be necessary, repeat or rephrase the question
without altering its main thought.
10. Fill out the questionnaires neatly and legibly.
11. If number codes are given to possible answers to an open-ended question, write the number
code. If the answer does not have a number code, write it as given.
12. There should be no prompting of any question by the interviewer. Try to sense the
respondent, he/she might be taking time before giving out answers.
13. Fill out the questionnaires neatly and legibly. Ensure that all questions are answered by the
respondent.

10
E. Closing the Interview
Review if all questions have been asked or answered. Then, thank the respondent for sharing
his/her time. Indicate on the last page of the questionnaire the exact time of end of interview.
F. Setting Appointments
Set appointment for a call-back for data gaps, should it be necessary.
G. Rules for Replacement.
Use the replacement household if the sampled household is not available for the interview. If
the replacement household is still not available for interview, ask the field supervisor for
another replacement.
H. Post-HH Survey Interview
1. For certain variables, code the given responses using the coding guide (refer to next section
of this field manual) immediately after the interview, before the accomplished interview is
submitted to the field supervisor.
2. The field supervisor may conduct spot checks with the interviewee to ensure data quality and
accuracy.
3. The field supervisor reviews the filled-up interview questionnaire and ensures that all
questions are appropriately responded to. The field supervisor has to return the questionnaire
to the enumerator should there be data gaps or inconsistencies that have to be addressed.
4. After reviewing the filled-up questionnaire and ensuring that all questions are responded to,
the field supervisor signs s his/her name on the first page, and indicates the date signed.
5. The encoder who enters the questionnaire interview data in the data base needs to sign his/her
name on the first page, and indicates the date of encoding.
I. Documentation
1. Enumerators must log in the logbook for visitors of the barangay, if there is a logbook.
2. Enumerators must write in their field notebook the address and name of the household Head,
interview date and time (start and end). Other uncovered information that maybe relevant to
the study but uncovered in any of the survey questions should also be noted down.
3. After each day of the field surveys, the field team leader should note down in his/her map of
the study area the specific location of the household interviewed and indicate its
corresponding questionnaire identification number.

11
IV. IMPLEMENTING THE HOUSEHOLD SURVEY
QUESTIONNAIRE
A. Preliminary Household Survey Information
The HHS questionnaire will be administered mainly through personal interviews with the
selected respondents identified in this project. It consists mostly of questions with pre-coded
responses. Although instructions are provided in the questionnaires to guide field interviewers,
editors and coders, more specific guidelines for certain questions are presented in this manual to
make sure that accuracy in data-gathering and uniformity in the interpretation of questions are
achieved. The interviewer must let the respondent answer on her own unless it is stated on the
question that the interviewer can read out the options to aid the respondent in answering.
Instructions for the enumerator, coders, and editors are incorporated within the
questionnaire. The training provided to all enumerators should prepare them to have the proper
mind-set and skills to conduct the interviews.
The enumerator must fill out the indicated spaces on the first page of each questionnaire
(see example below) before he/she proceeds with the interview proper.
1. Ensure that there is an identification code for the questionnaire, as indicated by the HH
Survey ID No _____- _____ - ____ where the first element identifies the barangay, the
second element is for the sitio/purok in the barangay, and the third element is the household
sample number.
2. Indicate te date of the interview; time started in hours and minutes (on first page) and time
ended in hours and minutes (on last page)
3. Enumerator to fill out on the first page information on the barangay, sitio, address where the
household is located, name and age of the interviewee and position in the household. Note
whether the interviewed respondent is male or female, and his/her age, in years.
4. Enumerator, site team leader and encoder to sign above their printed names and the
corresponding date after doing their respective assignments. Format of the date is dd/mm/yy
(i.e. 13/5/2011)
The interviewee should be a senior member of the household; the household head or his/her
spouse; a parent of the household head; or the household head’s child who is at least 21 years
old. If nobody among them is physically present in the house, seek an appointment when the
interviewer will return and an interviewee is available. Should there really be none after the first
and second tries, then the interviewer may replace the household with another one nearest to the
targeted household.

12
Before starting with the interview, enumerator must introduce him/herself and the project for
which the survey is being conducted. A guide for introducing the enumerator and the project
would be provided; enumerator must memorize this.
B. Household Demographics
Data for this part of the questionnaire should be collected for each household member. It is
better to seek the required data for each household member in sequence, getting and filling up
information from left to right, per row.
HHSize Indicate the total number of individuals residing in the household, including
relatives and helpers living in the house on a long-term basis.
H1A Write the first and last names of every member of the household. The name of
the respondent being interviewed should be written on the first row. Relatives and
helpers living in the household should also be listed.
H1B Indicate the position or role/relationship of HH member to the HH head.
1 – HH head
2 – wife of HH head
3 – child of HH head
4 – parents/parents-in-law of HH head
5 – grandchild of HH head
6 – son/daughter in-law of HH head
7 – others (i.e. relative, helper)
H2 Write the age as of the nearest birthday, opposite the name of the HH
member.
H3 Sex of the HH members; 1 is male and 2 is female. Encircle the sex of the
respondent. Ask this for other household members being enumerated.
1 - male
2 - female
H4 Education level completed by each HH member listed who is at least 16 years old.
Leave space blank if HH member is less than 16 years, based on response given in
H2.
1 – no formal schooling
2 – reached grades 1 – 4
3 – grades 5 – 6 /elem grad
4 – 1st to 3
rd year high school
5 – 4th
year HS/HS grad
6 – college undergraduate
7 – college graduate

13
8 – with some years of vocational/technical education
9 – vocational/technical education graduate
10 – with masteral units
11 – with at least master’s degree
99 – not known
H5A Primary occupation/main source of income of each HH member. List
answer and code as follows (expand coding guide to include other responses that
may arise during the interview):
0 - none
4 – fishing for finfish
5 - harvesting other marine life
6 - aquaculture/mariculture
7 – seaweed farming
8 – fish/marine-based product processing
9 – farming
10 - tourism-related enterprise
11 – handicrafts making
12 – regular government employment
13 – private professional employment
14 – laborer/construction worker
15 – self-employment as trader/businessman
16 – Others; __________________________
17 – Others; __________________________
18 – Others: ___________________________
NOTE: THIS QUESTION MAY BE ASKED AND ANSWERED LATER IN
CONJUNCTION WITH H9: HOUSEHOLD INCOME.
H5B Secondary occupation. Additional source of income of each HH member,other
than the primary occupation. List answer and use coding for H5A.
NOTE: THIS QUESTION MAY BE ASKED AND ANSWERED LATER IN
CONJUNCTION WITH H9: HOUSEHOLD INCOME.
H6 Migration Status. Ask whether family of respondent is a long-time resident or
newly (within the last ten years) migrated into the area. If yes, ask what year
did the family transfer into the area.
H7A Primary language spoken and used by most members of the household. Ask and
write primary language spoken and used in the household, use code below
(expand coding guide to include other responses that may arise during the
interview):
1 – Tagalog 7 - ______________________
2 – Cebuano 8 - ______________________
3 – Ilonggo 9 - ______________________
4 - Ilocano 10 - ______________________

14
5-________ 11 - ______________________
6 - _______ 12 - ______________________
H7B Secondary language spoken and used by most members in the household. Ask if
there is another language or dialect spoken and used in the household, use code
below (expand coding guide to include other responses that may arise during the
interview):
1 – Tagalog 7 - ______________________
2 – Cebuano 8 - ______________________
3 – Ilonggo 9 - ______________________
4 - Ilocano 10 - ______________________
5-________ 11 - ______________________
6 - _______ 12 - ______________________
H8 Religious affiliation of household. Ask religion of most members of the
members of the household. Refer to coding guide and write number
corresponding to stated religion. Write down given religion if it is not in the list.
If there is more than one religion being practiced in the household, write down at
most two. (expand coding guide to include other responses that may arise during
the interview):
1 – Roman Catholic 6 – Others: ________________________
2 – Iglesia ni Kristo 7 – Others: ________________________
3 – Protestant 8 – Others: ________________________
4 – Moslem 9 – Others; ________________________
5 – Seventh Day Adventist
C. Household Income
H9A Main Livelihood Sources for Cash Income Generation/Household Use, and HH
Members Involved. Probe into the sources of income for the household, and
indicate whether each activity provides cash income or goods being used by the
household. In case the activity provides both cash income to and goods used by
the household, ask for approximate percentages that go for household use and for
generation of cash income.
For sources of income that are seasonal rather than year-round, ask and write down
the particular months when the household derives income from the source/activity.
Ask how many in the household are engaged in each activity, and indicate the role
in the household of those involved (e.g., father, mother, son, daughter, etc.)
H9B Primary occupation/main source of income of each HH member. List
answer and code as follows (expand coding guide to include other responses that
may arise during the interview):

15
0 - none
4 – fishing for finfish
5 - harvesting other marine life
6 - aquaculture/mariculture
7 – seaweed farming
8 – fish/marine-based product processing
9 – farming
10 - tourism-related enterprise
11 – handicrafts making
12 – regular government employment
13 – private professional employment
14 – laborer/construction worker
15 – self-employment as trader/businessman
16 – Others; __________________________
17 – Others; __________________________
18 – Others: ___________________________
NOTE: THIS QUESTION MAY BE ASKED AND ANSWERED IN
CONJUNCTION WITH H5A AND H5B
D. Household Coastal and Marine Activities
For this part, information is being sought about the coastal and marine activities engaged in
by at least one of the household members. Since the unit of analysis is the household, it is not
necessary to identify how many and who among the household members are involved.
H10 Coastal and Marine Activities. Identify the household uses of coastal and marine
resources in the study area. The respondent is asked to identify ALL uses of
coastal and marine resources by household members. A respondent may be
prompted by asking him/her if anyone of the HH members is involved in
fisheries, in marine-based tourism, in aquaculture, marine recreation or any
related activity. Each answer is listed in the column for H10. Possible responses
and their codes are:
1 – fishing 7 – marine transportation
2 – fishing-related: mari/aquaculture 8 - agriculture
3 – tourism 9 – coral mining
4 – mangrove clearing 10 – sand mining
5 - pebble gathering/quarrying 11 - dredging
6 – seaweed farming 12 – oil-gas development
13 – others: __________________________
14 – others: __________________________
H11 Coastal and Marine Goods and Services. Ask about the specific products
produced for each household coastal and marine activity identified in H10.
Possible answers include extractive goods such as sea food/fish (specify type or

16
species), seaweeds, mangrove wood, coral products, and sand; and non-extractive
services such as tourism/recreation activities like resort operation, hotel
development, diving, etc. List answers as given. If the activity is fishing, specify
the types/species of fish caught
H14 Household Uses. For extractive goods such as sea food/fish (specify type or
species), seaweeds, mangrove wood, coral products, and sand, ask about the
household use of each. List answers as given, and code as follows:
1 – for sale
2 – household consumption
3 – give-away
4 – payment to laborer
5 – barter/exchanged with other goods/services
6 – others: ____________________________
7 – others; ____________________________
H13 Household market orientation. Identifies the primary market in which each
coastal and marine product produced by the household is primarily sold. List
responses and code. Ask approximate percent of good/product that is
sold/serviced to the primary market and indicate in the adjoining column:
1 – local, within the barangay only
2 – local, within the municipality only
3 – local, within the province
4 – regional, within Region IV-B
5 – national, within the country
6 – international, outside the country
H12A Perceptions of Seafood Availability. Ask the respondent of his/her experiences
H12B on the availability of seafood for their consumption this year (H12A) compared to
five years ago (H12B). For both questions, use a 10-point ladder-scale where 1 is
lowest for “not available at all” and 10 is highest for “more than enough is
available”.
E. Attitudes and Perceptions
H15 Non-market and Non-use Values of Coastal Resources. Measures how people
think about the value of coastal resources that are not traded in the market (non-
market) and the value of the resources to the portion of society that does not use
the resources (non-use).
Non-market value is the value of resources (e.g. fish) and services (e.g. diving)
that are not traded in any market. These include direct uses such as divers who
have travelled to dive by private means; and indirect uses such as biological
support functions in the form of nutrients, fish habitat and coastline protection
from storm surge.

17
Non-use values are not associated with any use and include option value (the
value of knowing that the resource is available should one decide to use it at some
future time), bequest value (the value of knowing that the resource will be
available to future generations, and existence value (the value of knowing that the
resource exists in a certain condition.)
Agreement or disagreement to each of the item statements are to be sought from
the respondent, with five possible response options:
1 – strongly disagree;
2 – disagree;
3 – neither agree nor disagree;
4 – agree;
5 – strongly agree.
9 – don’t know/no answer
Should the respondent refuse to answer or say that he does not know the answer,
encircle 9.
Statements D and H are stated negatively and hence, scoring for the responses are
to be reversed, i.e. strongly disagree – 5, … strongly agree – 1
H16 Perceptions of Resource Conditions. These measure what people think about the
conditions of the coastal resources in their community. The description of the
current conditions of each coastal resource is obtained by asking the respondent to
choose from any of the following options:
1 – very bad;
2 – bad ;
3 – neither good nor bad;
4 – good;
5 – very good
9 – don’t know/no answer
0 – Not applicable
Should the respondent refuse to answer or say that he does not know the answer,
encircle 9. If the respondent says that the resource is not available, encircle NA
and code as 0.
H17 Perceived Threats to Coastal Resources. Ask respondent to identify at most three
(3) threats for each of the coastal resources listed, and write down the responses
on the table. Possible responses and codes are:
Mangroves:
0 - none
1 – clearing
2 – cutting for commercial use
3 – cutting for household use
4 – charcoal making
5 – conversion into fish pond

18
6 – illegal fishing activities
7 – disease/infestation of mangroves
8 – natural phenomenon (i.e. typhoons, big waves)
9 – pollution/dumping of garbage
10 – others: ____________________________
11 – others: ____________________________
98 – not applicable (the resource is not available in the barangay)
99 - don’t know
Coral reefs:
0 - none
1 – clearing/mining/digging
2 – coral gathering for household/commercial use
3 – cyanide/compressor fishing
4 – dynamite/blast fishing
5 – tourist-related, i.e. recreational diving
6 – illegal fishing activities
7 – coral bleaching
8 – natural phenomenon (i.e. typhoons, big waves)
9 – pollution/dumping of garbage
10 – others: ____________________________
11 – others: ____________________________
98 – not applicable (the resource is not available in the barangay)
99 - don’t know
Upland Forests:
0 - none
1 – cutting of trees for commercial use
2 – cutting of trees for household use
3 – charcoal making
4 – conversion into residential settlements
5 – illegal logging
6 – kaingin/slash and burn farming
7 – natural phenomenon (i.e. typhoons, etc)
8 – conversion into farm lands
9 – others: ____________________________
10 – others: ____________________________
98 – not applicable (the resource is not available in the barangay)
99 - don’t know
Sea grass:
0 - none
1 – clearing/mining/digging
2 – gathering for commercial use
3 – gathering for household use
4 – dynamite/blast fishing

19
5 – tourist-related, i.e. recreational diving
6 – illegal fishing activities
7 – fishing using dragnets/gleaning
8 – natural phenomenon (i.e. typhoons, big waves)
9 – pollution/dumping of garbage
10 - disease
11 – gathering of shells and other inhabitants of sea grass
12 – others: ____________________________
13 – others: ____________________________
98 – not applicable (the resource is not available in the barangay)
99 - don’t know
Beach:
0 - none
1 – gathering of pebbles and stones for commercial use
2 – gathering of pebbles and/stones for household use
3 – quarrying of sand for commercial use
4 – quarrying of sand for household use
5 – development of resorts & tourist-related facilities
6 – soil erosion from the uplands
7 – natural phenomenon (i.e. typhoons, big waves)
8 – expansion of residential areas intruding into the beach
9 – pollution/ dumping of garbage
10 – beach erosion/sea level rise
11 – others: ____________________________
12 – others: ____________________________
98 – not applicable (the resource is not available in the barangay)
99 - don’t know
Springs:
0 - none
1 – contamination of water
2 – salt intrusion
3 – over-exploitation for household consumption
4 – deforestation/cutting of trees in watershed
5 – development of resorts & tourist-related facilities
6 – soil erosion
7 – natural phenomenon (i.e. typhoons)
8 – sedimentation
9 – pollution/ dumping of garbage
10 – establishment/expansion of human settlements nearby to the spring
10 – others: ____________________________
11 – others: ____________________________
98 – not applicable (the resource is not available in the barangay)
99 - don’t know

20
Rivers & Creeks:
0 - none
1 – gathering of pebbles and stones for commercial use
2 – gathering of pebbles and/stones for household use
3 – quarrying of sand for commercial use
4 – quarrying of sand for household use
5 – development of resorts & tourist-related facilities
6 – soil erosion
7 – natural phenomenon (i.e. typhoons)
8 – sedimentation
9 – pollution/ dumping of garbage
10 – establishment/expansion of human settlements nearby
11 – others: ____________________________
12 – others: ____________________________
98 – not applicable (the resource is not available in the barangay)
99 - don’t know
Water falls:
0 - none
1 – development of resorts & tourist-related facilities
2 – deforestation/cutting of trees
3 – natural phenomenon (i.e. typhoons)
4 – establishment/expansion of human settlements nearby to the spring
9 – pollution/ dumping of garbage
5 – others: ____________________________
6 – others: ____________________________
98 – not applicable (the resource is not available in the barangay)
99 - don’t know
Groundwater:
0 - none
1 – contamination due to sewage
2 – salt intrusion
3 – over-exploitation for household consumption
4 – deforestation/cutting of trees
5 – development of resorts & tourist-related facilities
6 – natural phenomenon (i.e. typhoons)
7 – establishment/expansion of human settlements
9 – pollution/ dumping of garbage
8 – others: ____________________________
9 – others: ____________________________
98 – not applicable (the resource is not available in the barangay)
99 - don’t know
H18 Awareness of Rules and Regulations. Ask respondent if he/she knows about the
existence of rules and regulations for each of the coastal resources listed in H14.

21
Possible answers are:
0 - No/none
1 – Yes,
9 – don’t know/no answer.
If the answer is yes, follow-up and ask about the enactment of the regulation/s,
and classify its origin as
1 - barangay
2 - municipality/city
3 - province
4 - country
H21A Current Participation in Decision Making. Measures how active people are in
coastal management, particularly in decision making. For each of the coastal
resources listed in H14, ask the respondent’s current level of participation in
decision making with 2 response options:
0 – No participation
1 – Yes
9 – NA/not applicable (the resource is not available in the barangay)
H21B Desired Participation in Decision Making. Measures the desire of people to
participate in coastal management, particularly in decision making. For each of
the coastal resources listed in H14, ask the respondent whether he desires to
participate in decision making, with responses the same as H21A:
0 – No participation
1 – Yes
9 – NA/not applicable (the resource is not available in the barangay)
H22 Membership in Resource Use Stakeholder Organizations. Refers to both formal
membership and informal membership. The stakeholder organizations include
direct users (e.g. fishermen’s cooperative, diving club) as well as people whose
activities impact the resources (e.g. hotel association, foresters association), and
people who do not use or impact the resources, but have a stake in management
(e.g. environmental organizations). List the household member and the
corresponding resource use stakeholder organization to which he/she is a member.
Count and indicate total number who are members of stakeholder organizations.
H23 Perceived Coastal Management problems. This question assesses what people
think are the top two problems facing the community with respect to coastal
management. Ask and list the top two problems described by respondent.
Possible answers and their corresponding codes are:
0 – none
1 – livelihood related to utilization of coastal resource
2 – decrease in fish catch or available coastal resource
3 – over-exploitation of coastal resource for household/commercial use
6 – pollution and garbage dumping
7 – waste management

22
8 – illegal fishing
9 – use of cyanide in fishing
10 – use of compressors in fishing
11 – illegal logging
12 – mangrove cutting
13 – natural calamities
14 – inadequate water supply
15 – others: ___________________________________
16 – others: __________________________________
17 – others; ____________________________________
99 – don’t know/no answer
H24 Perceived Coastal Management Solutions. Ask the respondent what he/she thinks
are the solution to each of the problems he/she gave in H23. List all perceived
solutions that the respondent provides.
H25A Perceived Community problems. This question assesses what people think are the
top two problems facing the community at large (e.g. poor nutrition, poverty,
lack of electricity, etc.) outside of costal management. List the top two
community problems given by respondent.
H25B Perceived Solutions to Community Problems. Ask the respondent what he/she
thinks are the solutions to each of the problems he/she gave in H23. List all
perceived solutions that the respondent provides.
H26 Successes in Coastal Management. This question solicits what two things the
respondent thinks has worked well for coastal management in the community.
List responses.
H27 Challenges in Coastal Management. This question solicits what two things the
respondent thinks has not worked well for coastal management in the community.
List responses.
F. Material Style of Life
H28 Material style of life is an indicator of the relative social status of a community
and is often used as an indicator of wealth. It can involve assessing house
construction materials (e.g. roof, walls), household furnishings and home
electronics. Data are most easily collected by observation of respondent’s house
materials. If something is not clear, ask the respondent. Record the observed
information for each house.

23
A. Type of roof (Uri ng bubong)
5 = tile (tisa) 2 = thatch/ bamboo (kawayan)
4 = tin / GI sheet (lata/yero) 1 = thatch / nipa (pawid/nipa)
3 = wood/ plywood (kahoy/plywood) Others: __________________
B. Type of outside structural walls (Uri ng panlabas na kayarian ng dingding):
5 = tiled (tisa) 2 = thatch/bamboo (kawayan)
4 = brick/concrete (kongkreto) 1 = thatch/nipa (nipa/pawid)
3 = wood /plywood (kahoy/plywood) Others: __________________
C. Windows (Bintana):
5 = glass (salamin) 2 = bamboo/nipa (kawayan/nipa/pawid)
4 = steelbars/ grill (bakal/rehas) 1= open (wala)
3 = wooden (kahoy) Others: __________________
D. Floors (Sahig):
5 = tile (tisa) 2 = bamboo (kawayan)
4 = wooden (kahoy) 1 = dirt (lupa)
3 = cement (semento) Others: ___________________
E. Other Household Assets
1 = Vehicle (specify type): _______________; 0 = none 1 = owns vehicle
2 = Banca (specify type): _________________; 0 = none 1 = owns banca
3 = Computer (specify type): ___________; 0 = none 1 = owns computer
4 = Refrigerator: 0 = none 1 = owns a refrigerator
5 = Television set: 0 = none 1 = owns a TV set
6 = Other Appliances: _____________________
Other Observations & Notes (specify and list): ________________________________________
V. IMPLEMENTING THE KEY INFORMANT INTERVIEW
SCHEDULE
Key informants are individuals who, because of their position, experience and/or knowledge can
provide insight and information into the larger population and/or a particular group. Key
informants can therefore provide common knowledge, shared knowledge and specialized
knowledge. Some KIs are:
the barangay officials can provide insight into the entire community,
the president of the fishermen’s association can provide insight into fishermen’s activities
the minister of the local church can provide insight into Christians’ perceptions in the
community
may be one of the stakeholders:
BFARMC

24
BFAR
Municipal Planning Officer
MAO
Foresters
Barangay Officials
Presidents of (Women, Youth, Coop) groups within the community
informal leaders and members of resource user groups such as that of fishers,
seaweed farmers, bulk buyers of fish/marine products, vendors, processors of
fish/marine products
A. Key Informant ID Number
The ID numbering for the KII will be as follows: _____ -_____ - ______ where the first
element is the barangay, the second element is the institution or agency being represented, and
the third element is the number corresponding to the respondent’s name.
The KII schedule will be administered mainly through personal interviews with the selected
respondents identified in this project. It consists mostly of questions pertaining to the
community. Although instructions are provided in the questionnaires to guide field interviewers,
editors and coders, more specific guidelines for certain questions are presented in this manual to
make sure that accuracy in data-gathering and uniformity in the interpretation of questions are
achieved. The interviewer must let the respondent answer on her own unless it is stated on the
question that the interviewer can read out the options to aid the respondent in answering.
Instructions for the enumerator, coders, and editors are incorporated within the
questionnaire. The training provided to all enumerators should prepare them to have the proper
mind-set and skills to conduct the interviews.
The enumerator must fill out the indicated spaces on the first page of each questionnaire
(see example below) before he/she proceeds with the interview proper.
1. Indicate the date of the interview; time started in hours and minutes (on first page) and time
ended in hours and minutes (on last page)
2. Enumerator to fill out the information sheet regarding the barangay, sitio, address where the
household is located, name and age of the interviewee and position in the household. Note
whether the interviewed respondent is male or female.
3. Enumerator, site team leader and encoder to sign above their printed names and the
corresponding date after doing their respective assignments. Format of the date is dd/mm/yy
(i.e. 13/5/2011)
The interviewee should be individuals who, because of their position, experience and/or
knowledge can provide insight and information into the larger population and/or a particular
group. Key informants can therefore provide common knowledge, shared knowledge and
specialized knowledge. Before starting with the interview, enumerator must introduce
him/herself. A guide is provided on the cover page of each questionnaire to guide him/her was
and the project before the interview starts. A guide for the enumerator is provided; enumerator
must memorize this.

25
B. Part 1. Community- Level Demographics
KS1. Study Area. The study area refers to the location of the coastal and marine resources and
the stakeholders where the study is being conducted. The boundaries of the study area are
determined by the physical location of the resources and by where the stakeholders live and
work. The study area will therefore often encompass a coastal area and the adjacent water
catchment area. The stakeholders may be highly mobile and spread far wider than the area that is
managed. There may be one or several communities in the defined study area that include all
important stakeholders.
Information on the study area is usually obtained from maps of the area and discussions with key
informants, such as the village captain or secretary or from the local development office. The
informant is asked what the boundaries of the study area are, then the response is noted on a base
map.
KS2. Population, and KS3. Number of households
The population is the total number of people residing in the study area. The number of
households is the number of occupied houses in the study area, regardless of the number of
families residing in the houses.
Data on population and household number are usually obtained from national, regional and/or
local census statistics, which may be available from the census office, and the municipal
planning and development office. It is important to cross-check these data with key informants,
such as the village captain or secretary or from the local development office. This information on
how many people live in the study area is written down on the space provided for in the KII
schedule. The information on how many households are in the study area is also listed down.
KS4. Migration rate. Migration rate refers to the percentage change in population size as a
result of people moving into or out of the study area in the past year.
Data on migration rate are usually obtained from national, regional and/or local census statistics,
which may be available from the census office, and the municipal planning and development
office. It is important to cross-check these data with key informants, such as the village captain
or secretary or from the local development office. The informant is asked about the net increase
or decrease in people moving into and out of the study area in the last year. The reponse is
written down as + or - to reflect moving in or out.
KS5-11. Age, Gender, Education, Literacy, Ethnicity, Religion, Language.
Age, gender, education, literacy, ethnicity and religion are basic demographic indicators.
Education is measured by the average number of years of formal schooling completed by study
area members over 16 years old. Literacy is measured by the percentage of study area members
able to read and write. Age is measured by the percent of study area members in different age
categories. Gender is measured by the percentages of the population that are male and female.
Ethnicity and religion are measured by the percent of study area members that have the various
ethnic and religious affiliations, respectively. Basic demographic information on the study area
is typically available from secondary sources.

26
KS5. Age. Obtain and record what percent of the people in the study area who belong on
the age ranges identified.
KS6. Gender. Obtain and record what percentage of the population is male or female.
KS7. Education. Obtain and record what is the average number of years of education of
people over 16 years old in the study area.
KS8. Literacy. Obtain and record what percentage of the population is literate (can read
and write).
KS9. Ethnicity. Obtain and record what is the ethnic make-up of the study area. Populate
the table by listing down the ethnic groups identified and by recording the corresponding
percent of each major ethnic group in the study area.
KS10. Religion. Obtain and record the religious make-up of the area. Populate the table
by listing down the religious groups identified and by recording the corresponding
percent of each religious group in the study area
KS11. Language. Obtain and record the major languages spoken in the study area.
Populate the table by listing down the major languages spoken and by recording the
percent of each major language in the study area.
KS12. Occupation. Occupation refers to an activity that provides livelihood, such as
income, food or other means of sustenance. The primary occupation is the main source of
livelihood, whereas the secondary occupation is the second most important source of
livelihood.
Complete the table by listing down the major occupations in the community in the first column
of the table; then ascertain the percent of working population conducting each particular
occupation as primary occupation in the second column. Calculate the number of people
conducting each identified occupation as primary occupation as a number out of the total
population in the study area.
C. Part 2. Community Infrastructure
KS13. Community Infrastructure. Community infrastructure is a general measure of the local
community development and wealth. It is a description of the level of community services (e.g.
hospital, school) and infrastructure (e.g. roads, utilities), which can include informationessential
to determining sources of man-made impacts on coastal resources (e.g. sewage treatment).
Encircle from the listed choices which services exist in the study area. This can also be done
doing observation, as well as, from asking an informant. If the identified infrastructure is not part
of the given list, the interviewer records it along with the encircled choices.

27
D. Part 3. Coastal and Marine Activities
KS14-23. Activities, Goods and Services, Types of Use, Value Goods and Services, Goods
and Services Market Orientation, Use Patterns, Levels of Impact, Types of Impact, Level of
Use by Outsiders, Household Use . This portion of the questionnaire is aided by a table where
the responses are to be written. The table presents how the KII Schedule Part 3 indicators relate
with one another. The columns of the table are arranged to indicate indicators KS14 to 23
respectively.
KS14 Activities. Coastal and marine activities is the identification of the uses of coastal and
marine resources in the study area. These may include activities directly or indirectly using or
affecting the coastal and marine resources. These may include, for example: fishing, tourism,
aquaculture, marine transportation, agriculture, coral mining, sand mining, dredging, oil-gas
development, military bases, mangrove clearing, forest clearing, industry and conservation.
Populate the column by obtaining from the KI the coastal and marine activities in the study area.
Record the responses.
KS15 Goods and Services. Coastal and marine goods and services are the specific products
produced from the identified coastal and marine activities. These include extractive goods such
as lobster, mangrove wood, coral products and sand; and non-extractive services such as diving,
snorkeling, glass bottom tours, mangrove tours and recreational fishing.
Populate the column by obtaining from the KI the coastal and marine goods and services
correspondingly derived from the identified coastal and marine activities (from column 1) in the
study area. Record the responses.
KS16 Types of Use. Types of use identifies the specific method or development being employed
(e.g. traps, nets, guest houses, scuba diving) for each coastal and marine good and service.
Populate the column by obtaining from the KI the specific methods used to acquire the
corresponding coastal and marine goods and services (from column 2). Record the responses
KS17 Value of Goods and Services. Types of use identifies the specific method or development
being employed (e.g. traps, nets, guest houses, scuba diving) for each coastal and marine good
and service.
Populate the column by obtaining from the KI this information. Ask the informant to put a value
(high, medium, low) on the product of each coastal and marine goods and services (from
column 3). Record the responses
KS18 Goods and Services Market Orientation. Coastal and marine goods and services
market orientation is the identification of the market in which each product is primarily sold.
Populate the column by obtaining from the KI this information. Ask the informant to asked to
identify the primary market in which each good or service is sold (international, national,
regional, or local). Record the response.
KS19 Use Patterns. Use patterns refers to the location of coastal and marine activities.

28
Populate the column by obtaining from the KI this information. Ask the informant to identify
the location of each coastal and marine activity (from column 1) according to the good or service
(from column 2) and note this on the KII Schedule.
KS20 and KS21 Levels of Impact and Types of Impact. Levels and types of impacts are
measures of the perceptions of the general public and types of impact of coastal and marine
activities on coastal and marine resources. This is not a scientific assessment of levels and types
of impacts, but rather a documentation of what people think.
The key informants are asked to identify using a scale of high/medium/low/none the level of
impact of each coastal and marine activity according to its goods and services. While they will
need to be adapted for each study area, high could mean severe and irreversible impacts on the
resources, such as cutting and filling mangrove areas; medium could mean moderate impacts on
the resources, such as cutting mangrove areas; low could mean minor impacts on the resources,
such as a small percentage of mangrove area being disturbed; and none could mean no impact.
The primary types of impacts are then briefly noted on the KII Schedule.
KS22 Level of Use by Outsiders. Level of use by outsiders refers to the amount of outsiders
using the coastal resources relative to the amount of local users from the study area. For
example, if there are 1000 foreign fishermen and only 10 local fishermen, then the level of use
by outsiders is high. Outsiders are people who do not live in the study area. They may be from a
neighbouring village or another country.
The key informants are asked what the current level of use by outsiders for each coastal and
marine activity is using a scale of high, medium and low. The scale will need to be defined for
each study area, but high could mean a great deal of use by outsiders, such as the majority of
fishing in the study area is conducted by outsiders; medium could mean moderate use by
outsiders, such as a few international tourists, and low could mean minor use by outsiders, such
as one guest house out of twenty in the study area is owned by a foreigner. Record the responses
in the KII Schedule.
KS23. Household Use. Household use of coastal and marine goods and services is a measure of
how households in the study area utilize coastal and marine goods and services for consumption,
leisure and sale.
The key informants are asked to identify and rank the general household use of each good or
service. They are asked if they use the resource for their own consumption, leisure or sale.
“Own consumption” means use in the household, such as fish for food; “leisure” means for
recreation; and “sale” means selling to obtain money or to barter for other goods.
KS24. Stakeholders. Stakeholders are individuals, groups or organizations of people who are
interested, involved or affected (positively and negatively) by coastal resource management.
These stakeholders may or may not actually live within or adjacent to the site, but are people
who have an in interest in or influence on coastal resource management.
This part of the questionnaire will involve populating another table. Column 1 of the table is
identified as KS 14. Activities. The remaining three columns are used for listing down
identified stakeholders who use or befit from the coastal activities identified in Column 1) The
responses is obtained by asking informants (e.g. government officials, elected officials, fishers,

29
business leaders) in the area to identify the three main stakeholder groups for each coastal
activity (e.g. fishing, aquaculture, tourism).
E. Part 4. Governance
KS25-29. Management Body, Management Plan, Enabling Legislations, Resources
Allocations, Formal Tenure and Rules. This portion of the questionnaire is also aided by a
table where the responses are to be written. The table presents how the KII Schedule Part 4
indicators relate with one another. The first column of the table is identified in KS 14 activities,
while the remaining columns of the table are arranged to indicate indicators KS25 to 29
respectively.
KS25 Management Body. A management body is an institution that governs how coastal
resource management is undertaken and ensures that there is a transparent process for planning,
establishing and enforcing rules and regulations. Management bodies may be government, non-
government or community organizations and may operate at the international, national,
state/provincial, or local level. There may be multiple management bodies in the study area for
different coastal activities such as coastal zone management, fisheries, aquaculture, mangroves,
tourism, marine transportation and residential development.
It is important to confirm the existence and name of each management body for each coastal
activity by identifying and interviewing a person responsible for the management body’s
operation. Informant is asked to identify whether there are management bodies existing for each
particular coastal and marine activity (yes or no) and the name of the management body is also
recorded.
KS26 Management Plan. The management plan sets out the strategic directions for the coastal
resources management program. The management plan is a document that states the overall
management program goals and objectives, the institutional structure of the management system
and a portfolio of management measures.
For each coastal activity, the informant is asked to identify whether (yes or no) a management
plan exists. This is noted in the KII schedule.
KS27 Enabling Legislations. Enabling legislation is the formal legislation in place from
government to provide coastal resources management with a sound legal foundation so that the
plan, management structures, rules and regulations, and enforcement procedures can be
recognized, explained, respected and enforced. For example, a national fisheries law or code is
considered to be enabling legislation since it defines how fisheries will be used and managed in
the country.
The interviews and document reviews are conducted to determine the existence (yes or no) of
enabling legislation to support the management plan for each coastal activity. This information is
recorded in the KII schedule.
KS28 Resources Allocations Resource allocations refers to the human and financial resources
that carry out the activities of the management plan.

30
Information on resource allocations can be collected by interviewing the manager or director of
each management body in the study area. The manager or director is requested to present the
organization chart which should identify staff allocations
by program or activity. The number of staff (full-time, part-time, volunteer) assigned to each
program or activity is identified. Where no organization chart exists, one can be developed with
the manager or director by first identifying each of the programs or activities of the management
body and then identifying the staff members. The manager or director is also asked for the
overall budget for the management body and for implementation of the management plan. The
responses are noted in the table columns 5 and 6 respectively.
KS29 Formal Tenure and Rules. Formal tenure is concerned with use rights with respect to
coastal activities. Formal tenure is considered to be a de jure use right, that is, legally written into
law. For example, a formal tenure arrangement is the right given to a fisher to access an area to
fish.
Formal rules are legally written into law and define specifically what acts are required, permitted
and forbidden by stakeholders and government agencies concerning the use of coastal resources.
Rules establish how use rights are to be exercised. For example, for those fishers with a formal
tenure use right to access an area to fish, a formal rule is that they may only use hand lines to fish
in the area.
For this indicator the focus is on formal operational rules and regulations which directly affect
day-to-day decisions made by resource users concerning when, where and how to use coastal
resources. These rules and regulations are specific to a coastal activity and will be established by
an agency with legal responsibility for managing that coastal activity.
For each coastal activity, ask the informant to identify (yes or no) if there exists a formal tenure
arrangement(s) and a formal rule(s) at the community level. Note the responses in table columns
7 and 8 respectively.
KS31: Stakeholder Participations. Stakeholder participation is a measure of the amount of
involvement of stakeholders in making coastal management decisions.
Column 1 of this table refer to the list of stakeholder groups identified in KS24. Column 2 is
populated by obtaining responses from informants. Key informants are asked if stakeholders are
involved in making coastal management decisions (yes or no).
KS32: Stakeholder and Community Organizations. Community and stakeholder
organizations are means for representing resource users and stakeholders in coastal resource
management and for influencing the direction of decision-making and management.
As noted in the Key Informant Interview Schedule table, for each organization, information is
collected on whether the organization is formally or informally authorized and on the
organization’s main functions. Key informants are asked whether the organization influences
coastal management issues, community issues, both coastal management and community issues,
or has no influence.

31
VI. IMPLEMENTING THE FOCUS GROUP DISCUSSION (FGD)
Focus group is a small group of people brought together and guided by a moderator
through an unstructured, spontaneous discussion about some topic . The goal of a focus group is
to draw out ideas, feelings, and experiences about a certain issue that would be obscured or
stifled by more structured methods of data collection (ie HHI or KII). It is called a focus group
because a moderator serves to focus the discussion on a certain topic and does not let the group
move off onto tangents or irrelevant points.
Focus group interviews (FGDs) are a type of semi structured interview. FGDs involve a
selected group of informants (usually 4 to 10) who share homogeneous characteristics -common
background or knowledge (eg. use patterns, language, organization membership). The selection
of focus group participants is largely by the purpose of the focus group. If a group discussions to
take place, it is important for that the physical arrangement of the group be comfortable and
conducive to group discussion.
Like semi-structured interviews, FGDs are based on a set of open-ended questions or
discussion points, and generate qualitative information. This is a flexible method of interviewing
allowing the moderator to probe for answers, follow-up the original questions and pursue new
lines of questions during the interview. Therefore, the interview and information evolve
allowing the moderator to cover a range of topics. FGDs are usually done in the middle or end
of the field data collection, after the team has a strong understanding of the stakeholder groups,
their priority concerns and internal dynamics.
A. Purpose of FGDs
Generates primarily qualitative information on a range of topics and on specific issues
Provides information on the views of a particular stakeholder group as a whole
Identifies local terminology, language and priorities that may help the assessment team
interpret other information received during the course of the assessment.
Allows an exchange of information between the moderator and the participants.
B. The FGD Moderator’s Role and Responsibilities
The moderator is the most crucial factor influencing the effectiveness and usefulness of a
focus group. He moderator is a person who conducts the entire session and guides the flow of
discussion across specific topics (questions) that are important to the research.
The moderator must strive for a balance between stimulating, natural discussions among
all of the group members while ensuring that the focus of the discussion does not stray too far
from the topic (question).
A good moderator must have excellent observation, interpersonal, and communication
skills to recognize and overcome threats to a productive group discussion. He or she must be
prepared, experienced and armed with a detailed list of topics to be discussed. It will also be

32
helpful if the moderator can eliminate any preconceptions on the topic from his or her mind. The
best moderators are experienced, enthusiastic, prepared, involved, energetic, and open-minded.
The FGD’s success depends on the participants’ involvement in the discussion and their
understanding of what is being asked of them. Productive involvement s largely a result of the
moderator’s effectiveness, which in turn is dependent on the purpose and objectives of the
interview.
C. Some Tips and Guidelines (“Tricks” of the Trade) for FGD
Moderators
1. How to make the group great every time.
Be prepared
Be energized
Be nice but firm
Make sure everything about the experience is comfortable
2. How to build rapport with participants
Make meaningful eye contact during each person’s introduction
Learn and remember names
Welcome folks as they come into the room (area where FGD is conducted) and use
small talk
3. How to bring a drifting group back into focus
Tell them the topic (question) is “for another group” and that they need to focus on the
topic (question) for this group
Make a note and tell them they will come back to this topic if there is time.
Tell them the topic is “interesting” but not the subject at hand and refer to the next
question
Suggest that they can talk about it on their own after the focus group is over.
4. How to get participant’s to talk about deeper things than top- of the mind answers
Play naive or dumb and ask them to help understand by letting them explain further
Use probes
Ask for specifics
5. Oftentimes it is more convenient to have someone take down notes or be assigned as a record
keeper during the FGD or have the proceedings of the FGD on audiotape.
D. FGD Guide for Selected Socmon Variables
D.1. KS 14-24. Coastal and Marine Activities, Goods and Services, Types
of Household Uses, Household Uses, Market Orientation.
These variables are as defined and characterized earlier in the Key Informant Guide. Instead of
individual interviews, however, the key informants shall be gathered together for a group discussion

33
with the moderator.
FG Members: Resource Users (fishers, seaweed / aquaculture farmers, resort owners, etc.)
FGD Materials: Village Map (base map); Multicolored Pens or Boardmarkers; Multicolored Paper
(metacards) or Post-its; Double-sided/Masking Tape; Manila Paper (2 pcs); Guide Questions
FGD Mechanics:
1. Participants will be asked to identify the coastal and marine resources in the study area.
2. Participants will mark the areas in the village map that corresponds where the coastal and marine
resources are located
3. Participants will be asked what activities transpire in the location of the coastal and marine
resources and identify how households use the coastal and marine resources n the area
4. Participants will be asked what are the goods and services (ie. specific products) are derived from
the coastal and marine activities, its uses and where are these are sold.
5. The responses of participants will be recorded using an FGD summary table which will also serve
as the basis for transcription of the FGD results, while the map from items 1 and 2 can be utilized as
additional material for the report writing.
FGD Guide Questions:
1. What are the uses of coastal and marine resources in the study area?
a. KS 14 and KS 15: Using a map, identify and mark the location of your community’s coastal
and marine resources. Where are the key fishing areas? the aquaculture areas? mangrove
areas? coral reef areas? beach areas? seaweed areas? farming areas? residential areas?
b. KS 14: What activities transpire in the coastal and marine resources in the area? Are people
involved in fisheries? Tourism? Aquaculture? Mariculture? Marine transportation?
Agriculture? Coral mining? Sand mining? Dredging? Oil-gas development? Mangrove clearing? Forest clearing? Industry and conservation?
c. KS 14: How do households use the coastal and marine resources in the area?
d. KS 24: Who are the users of the coastal and marine resources in the area? Fishermen from
what area? Resort/hotel owners and employees? Aqua/mariculture farmers and employees?
Tourists? Watersport operators?
2. KS 15 and KS 19: What are the goods and services (.ie. specific products) from the coastal and
marine activities? Where are the specific locations in the community map where these goods/
Services/specific products are found or caught (site of bay/reef/mangrove)?
a. What are the extractive goods that are derived from the coastal and marine activities?
(e.g. fish species - , mangrove wood, coral products, sand, etc)
b. What are the non-extractive goods that are derived from coastal and marine activities?
(e.g . tourism, recreation activities, aquaculture, etc.)
c. What species of fishes are caught in the different fishing areas of the community? What are
other marine life/products harvested in the different coastal and marine areas?
3. KS 16: What are the specific methods or development being employed (e.g. hook and line, traps,
nets, guest houses, scuba,diving gears, etc) for each coastal and marine good and services?

34
a. What is the method being used or employed to derive each coastal and marine good and
services?
b. What materials and/or fishing gears are used for each kind of fish caught or marine product
harvested?
4. KS 23: What are the primary household use for each good or service from coastal/marine
activities? The objective is to determine how the household uses the products of the marine
activities.
a. What do you do with the fish catch/products from these activities?
b. Are these products/goods and services for sale? used for own consumption? For leisure?
5. KS 18: For goods and products that are being marketed or sold,
a.. Where is the primary market for each of these products or services?
b. For products or services having multi-markets, what is the percentage distribution for each?
6. KS 17: Determine the value of each costal and marine good/service/product, using a 3-point scale
of high – medium – low. The value may be based on the price of and demand for the good/service
/product.
7. KS 21: Identify the type of negative impacts on coastal and marine resources of each coastal and
marine activities, as perceived by the resource users and the general public. Possible impacts are
over-fishing, pollution, anchor damage, nutrient loading, etc.
8. KS 20: Identify the level of impact of each coastal and marine activity, according to its
good/service/product, as to none (no impact on resources), low (minor impact on resources),
medium (moderate impact on resources), and high (severe and irreversible impact)
9. KS 22: Level of use by outsiders refers to the amount of outsiders using the coastal
resources relative to the amount of local users from the community. What is the current
level of use by outsiders for each coastal and marine activity? Responses are on a 3-point
scale of High ( a great deal of use by outsiders) – Medium (moderate use by outsiders) –Low
(minor use by outsiders)

35
Format: Sample Summary Table for H10-14:
KS 14: Coastal and
Marine
Activities
(Column 1)
Note: Indicate KS24: y
involved stakeholder
groups
KS 15: Coastal
and Marine
Goods and
Services
(Column 2)
KS 16: Device/
Methods/ Gears
Used
(identify specific
method to acquire
the goods and
services or the
device being
employed
( (Column 3)
KS 23: Household
Uses
(eg. sale,
consumption,
giveaway, payment
to labor, etc)
(Column 4)
KS 18: Household
Market
Orientation
( eg Within the
barangay/ outside
the barangay)
(Column 5)
1. 1. 1. 1 1
2. 2. 2 2
3. 3. 3 3
2. 1. 1. 1 1
2. 2. 2 2
3. 3. 3 3
3. 1. 1. 1 1
2. 2. 2 2
3. 3. 3 3
Some Options for Column 1: A-Fishing; B- Mariculture/ Aquaculture; C-Tourism; D-Pebble-gathering/ Quarrying; E- Seaweed farming, G-Others________
No options for Column 2, 3 – Write the answers using metacards Some Options for Column 4: A- Sale B- consumption; C- Giveaway; D- Payment to labor E-Others ____ Options for Column 5: A-Within the barangay; B- Outside the barangay, C- Others _________

36
KS 14: Coastal and
Marine
Activities
Note: Indicate KS24: y
involved stakeholder
groups
KS 15: Coastal
and Marine
Goods and
Services
KS 17: Value of
Goods & Services
(High/Medium/Low)
KS 21: Type of
Impact on Coastal
Resources
KS 20: Level of
Impact on Coastal
Resources
(None/Low/
Medium/HIgh)
1. 1. 1. 1 1
2. 2. 2 2
3. 3. 3 3
2. 1. 1. 1 1
2. 2. 2 2
3. 3. 3 3
3. 1. 1. 1 1
2. 2. 2 2
3. 3. 3 3
KS 15: Coastal
and Marine
Goods and
Services
KS 19: Use
Patterns (Where
the Goods/
Services are
Found
KS 21: Type of
Impact on Coastal
Resources
KS 20: Level of
Impact on Coastal
Resources
(None/Low/
Medium/HIgh)
KS 22: Level of
Use by Outsiders
(Low/Medium/
High)
1. 1. 1 1
2. 2. 2 2
3. 3. 3 3
1. 1. 1 1
2. 2. 2 2
3. 3. 3 3
1. 1. 1 1
2. 2. 2 2
3. 3. 3 3

37
D.2. H19. Compliance (Pagsunod) and H20. Enforcement
(Pagpapatupad)
Compliance measures to what extent people are perceived to be complying with
regulations. Ask the FGD participants about their perceptions pertaining to compliance
with coastal management rules and regulations. Enforcement is measured by people’s
perceptions of how much the rules and regulations are enforced. This is similar to compliance,
except compliance addresses people’s behaviour (i.e. are people adhering to the rules? ).
Enforcement addresses management activities, such as patrolling, imposing fines and
confiscating illegal gear.
FG Members: Resource Managers and Resource Users
FGD Materials: Metacards and/or Paper Cut Outs or Pictures; Multicolored Pens or
Boardmarker; Double-sided/Masking Tape; Manila Paper (2 pcs); Guide Questions
FGD Mechanics:
1. Participants will be asked to enumerate rules and regulations that they aware of regarding coastal
and marine resources in the study area.
2. Participants will be asked to identify which of the rules and regulations that they are aware of are
related/ applicable to a list of coastal and marine resources that can be found in the study area.
3. Participants will be asked about the degree of compliance and enforcement of the rules and
regulations that they mentioned using a 5-point scale.
4. The responses of participants will be recorded using an FGD summary table which will also serve
as the basis for transcription of the FGD results.
FGD Guide Questions:
1. Are there rules and regulations about the use or development of coastal and marine resources?
2. What are the rules and regulations that you know of that pertain to coastal and marine resources
in the area? (Output: Generate a listing of the rules and regulations)
3. Which of these rules are related/ applicable to: (1) fishing; (2) mangrove use; (3) aquaculture;
(4) resort/pension house/ hotel development); (5) residential development; (6) watersports;
(7) recreational climbing/ trekking/ camping; (8) pebble gathering; (9) tourist transportation; (10) others (Output: Categorization of rules and regulations)
4. To what extent do people (resource users) generally comply with each of the coastal management
rules and regulations? Which rules do most people comply with? The group should arrive at the
answer through consensus, using a scale of 1 to 5 (1= no compliance, 5= full compliance). Take
note of the group’s basis/bases for their rating.
5. To what extent are these rules pertaining to coastal management rules and regulations enforced?
The group should arrive at the answer through consensus, using a scale of1 to 5 (1 = no
enforcement, 5=full enforcement) Take note of the group’s basis/bases for their rating.
6. How many people are apprehended because of non compliance to regulations concerning
marine activities?

38
Format: Sample Summary Table for H19-20:
Rules Rules Applicable to
what
Resource?
Levels of Compliance Levels of
Enforcement
1. 5 4 3 2 1 9 5 4 3 2 1 9
3. 2. 5 4 3 2 1 9 5 4 3 2 1 9
3. 5 4 3 2 1 9 5 4 3 2 1 9
Notes to Facilitator and Co-Facilator: Column 1 will be accomplished by writing the responses of
participants; Columns 2 will be accomplished by adding the picture/ drawing of the resource or by
writing corresponding codes pertaining to the resources; and Columns 3-4 will be completed by
encircling the codes that correspond the participants’ responses
D.3. KS30: Informal Tenure and Rules, Customs and Traditions
FG Members: Resource Users and Managers
FG Materials: COLORED CARTOLINA METACARDS, PENTEL PENS, DOUBLE SIDED
TAPES
FGD Mechanics:
The group will be given 5 minutes to do the activity.
Write on the Manila paper the different coastal/marine activities.
Ask them to enumerate any beliefs, customs and traditions, informal tenure
arrangements, and informal rules that are being observed in the community.
FGD Guide Questions:
1. Are there informal management system - tenure and rules, customs and traditions – being
observed by the community of resource users?
2. What are these informal tenure and rules, customs and traditions (provide brief statement) ?
To what coastal/marine resource and/or activity does each apply
Coastal/Marine
Activities
Customs and
Traditions
Informal Tenure
Arrangements
Informal Rules
Fishing
Tourism
Aquaculture
Agriculture
(coconuts, nipa,

39
mango, cashew, etc)
Sand Mining
Coral Mining
Seaweeds Farming
D.4. KS31: Stakeholder Participation
FG Members: Resource Users and Managers
FG Materials: COLORED CARTOLINA METACARDS, PENTEL PENS, DOUBLE SIDED
TAPES
FGD Mechanics:
The group will be given 5 minutes to do the activity.
Using the FGD 9 output, ask the participants to determine if the enumerated stakeholders have actively participated in the coastal management decision-making by writing YES or
NO in their metacards.
FGD Guide Questions:
1. Are stakeholders involved in coastal management/resource decision making?
2. If yes, who are the stakeholders involved? In what way do they participate?
Stakeholder Stakeholder Participation
E. Writing the FGD Report
Data Analysis
1. Develop a plan for analysis consisting of:
background of the research
objectives
methods
discussion details
focus group discussion guide
2. Analyze the content of the group discussion by
reviewing the notes from the focus group
listening again to the cassettes from the session (if tape recorded)
grouping research findings according to key themes
identifying the different positions that emerged under each key theme

40
summarizing each of the different positions and assess the extent to which each position
was held by participants
pulling out verbatim phrases that represent each position.
3. Synthesize the group discussion by:
reviewing the notes of each discussion made by the moderator
identifying the recurrent ideas that came out during the discussion
interpreting these recurrent ideas based upon other findings that emerged in the groups
F. Reporting and Use of FGD Results
The report lists all the themes that have become apparent, and it notes any diversity of opinions
or thoughts expressed by the participants. Some reports may also include complete transcripts of
the FGD. This information is then used as a basis for further research studies or other focus
groups If the information is used for subsequent focus groups, the client uses the first group as a
learning experience, making any adjustments to the discussion topics as needed to improve the
research objectives.