PROJECT TITLE: MAPPING POTENTIAL GROUNDWATER AQUIFERS...
39
PROJECT TITLE: MAPPING POTENTIAL GROUNDWATER AQUIFERS IN NAIROBI COUNTY Author: Mugo Dixon Mugai. F19/1469/2010. Supervisor: Dr. Ing. F. N Karanja.
Transcript of PROJECT TITLE: MAPPING POTENTIAL GROUNDWATER AQUIFERS...

PROJECT TITLE: MAPPING POTENTIAL GROUNDWATER AQUIFERS IN NAIROBI COUNTY
Author: Mugo Dixon Mugai. F19/1469/2010.Supervisor: Dr. Ing. F. N Karanja.

Outline• Introduction• Problem Statement• Objectives• Methodology• Results and Discussions• Conclusions• Recommendations

INTRODUCTION
An aquifer is an underground layer of water-bearing rock. Water-bearing rocks are permeable, meaning that they have openings that liquids and gases can pass through

This illustration shows the two most common types of aquifers, confined aquifers and unconfined aquifers. An unconfined aquifer can receive water directly from the surface, while a confined aquifer is trapped between two layers of rock.

The Role of Geoinformation in Aquifer Siting
The main existing groundwater exploration methods is are the use geophysical and geo-electrical techniques which are relatively expensive and time consuming. The use of a GIS in the modeling of potential groundwater zones is not a new concept. There are a number of works where groundwater potential aquifers have been estimated using geospatial technologies such as; in Kenya Kyalo (2013) used Remote Sensing and GIS to identify and delineate groundwater potential zones in Lake Chala Basin. Karanja (2011) has carried out a project on Effective Planning and Management of water resources through Borehole Profiling using GIS.

Problem Statement
Water resources are of critical importance to society because these resources sustain our livelihood and the ecosystems on which we depend.The increasing urban population is causing strain on the amenities and resources in most urban centers, water being one of the most strained resources.

A research done in 2005 on Nairobi and funded by the World Bank, shows that the surface water from the Athi Basin which is the main source of water for the city is not sufficient to satisfy the industrial enterprises, commercial users as well as the domestic users in Nairobi county. As a result groundwater beneath the county is being pumped by private operators to supplement surface water supply.Thus, optimal exploitation of underground water would greatly contribute to the water supply system of a city like Nairobi and ease the water shortage problems in many parts of the county.

However, underground water is a delicate and scarce resource. Over abstraction of underground water leads to depletion of the specific aquifer from which the water is being drown from.Therefore, it is highly significant to map groundwater aquifers for the optimal groundwater exploitation, monitoring, management and conservation of the aquifers for sustainable development.

OBJECTIVESOverall ObjectiveThe main objective of this project was to map potential groundwater aquifers to facilitate the exploitation, monitoring, management and conservation of the aquifers using, Nairobi County as a case study.

Specific Objectives
• Identifying variables for aquifer siting.• Developing a GIS aquifer database for
Nairobi County• Modeling potential aquifer sites.• Application of the mapped potential
aquifer sites to support decision making.

The area of study is Nairobi County.Nairobi located at 1°16’S, 36°48’E and occupies an area of approximately 696.1 sq. km . It has a population of about 3 million persons(2009 Census).The maximum elevation is 1924 m and the minimum elevation is 1452 m.
Area of Study.

ANCILLARY DATA.Lithology data, Soil
data, Contours, land use/Land cover data,
Landform data
GIS Processing, Clipping, Editing
attribute tables, , DEM generation(GIS database creation)
Lithology map, Soils map, Land use map, Land cover map,
Drainage density map, Slope map.
Overlaying of the thematic
layers (Weighted Overlay
analysis)
Derived Factor Maps
Informed Decision Making.
Overview of the Methodology.
Potential Groundwater Aquifer
Map.

Data Collection.DATA SOURCE CHARACTERISTICS FUNCTION
Soils Kenya National Soils
and Terrain Database
Format: Shape file Feature Class Create a soils thematic map
Land use/Cover Department of
Geology, UoN
Format: Shape file Feature Class Create a land use/cover
thematic map
Land
cover(Rivers)
Oakar Services Format: Shape file Feature Class Evaluate the drainage density
factor map
Topo sheets Oakar Services Format: JFIF Base information
Contours Oakar Services Format: Shape file Feature Class
10 m interval
Generate a drainage density
and slope maps
Boundaries Oakar Services Format: Shape file Feature Class Clip national datasets to area
of interest
Boreholes WaRMA Format: Shape file Feature Class Validate the yield in potential
groundwater aquifers zones
Lithology Kenya National Soils
and Terrain Database
Format: Shape file Feature Class Create a lithology thematic
map
Landforms Kenya National Soils
and Terrain Database
Format: Shape file Feature Class Create a thematic map for
landforms

Modeling Potential Sites for Underground Water Aquifers

Weight Factors Determination
The weights have been taken considering the works carried out by researchers such as Krishnamurthy et al 1996, Saraf &Chowdhury, 1998.The multi influencing factors for groundwater potential zones namely lithology, slope, land-use/land-cover, lithology, landforms, drainage and soils were examined and assigned an appropriate weight and are shown in table 1.1. This method uses the principle of interrelationship between the various factor layers influencing occurrence of underground water.
The effect of each influencing factor may contribute to delineate the
groundwater potential zones. Moreover, these factors are
interdependent. The effect of each major and minor factor is
assigned a weightage of 1.0 and 0.5, respectively. The cumulative
score of both major and minor effects are considered for calculating
the relative rates (Table1.1). This relative rate is further, used to
calculate the proposed weight factor of each influencing factor map
layer. The proposed weight factor for each influencing factor is
calculated using the formula shown in Equation 1.1.

Table 1.1FACTOR Major
Effect(A)
Minor
Effect(B)
Relative Rates Proposed Weight of
Each Factor
Soils 1 0 1 (1/12.5)×100= 8
Lithology 1+1 0.5 2.5 (2.5/12.5)×100= 20
Land
Use/Land
cover
1+1 0.5+0.5 3 (3/12.5)×100= 24
Landform 1 0.5+0.5 2 (2/12.5)×100= 16
Drainage 1+1 0.5 2.5 (2.5/12.5)×100=20
Slope 1 0.5 1.5 (1.5/12.5)×100= 12
TOTAL ∑12.5 ∑ 100

SLOPE
DRAINAGE.
SOIL
LITHOLOGY.
LANDFORM.
LAND USE/LAND COVER.
Minor Effect
Major Effect
Figure 1.2 Major-Minor Flowchart

Validation of the Model Results
The potential groundwater zones generated by the created model were verified with the yield data of the existing boreholes in the study area and found that it was in agreement with the boreholes yield data.

RESULTS AND DISCUSSIONS
This section presents and discusses the results that were acquired after the data acquisition, manipulation, processing and analysis that were carried out during the implementation of this projectIn reflection to the set objectives the following results were obtained:

Results• A geodatabase for the study area that contained
various datasets that were used for analysis
• Creation of a model to generate potential
groundwater aquifer maps
• A potential groundwater aquifer map for the study
area

Factor Maps Created:Lithology Factor Map
Lithology Map

Drainage Density Factor Map
Drainage Density

Slope Factor Map
Slope Map
M

Landforms Factor Map
Landform Map

Land Cover/Use Factor Map
Land Cover/ Use Map
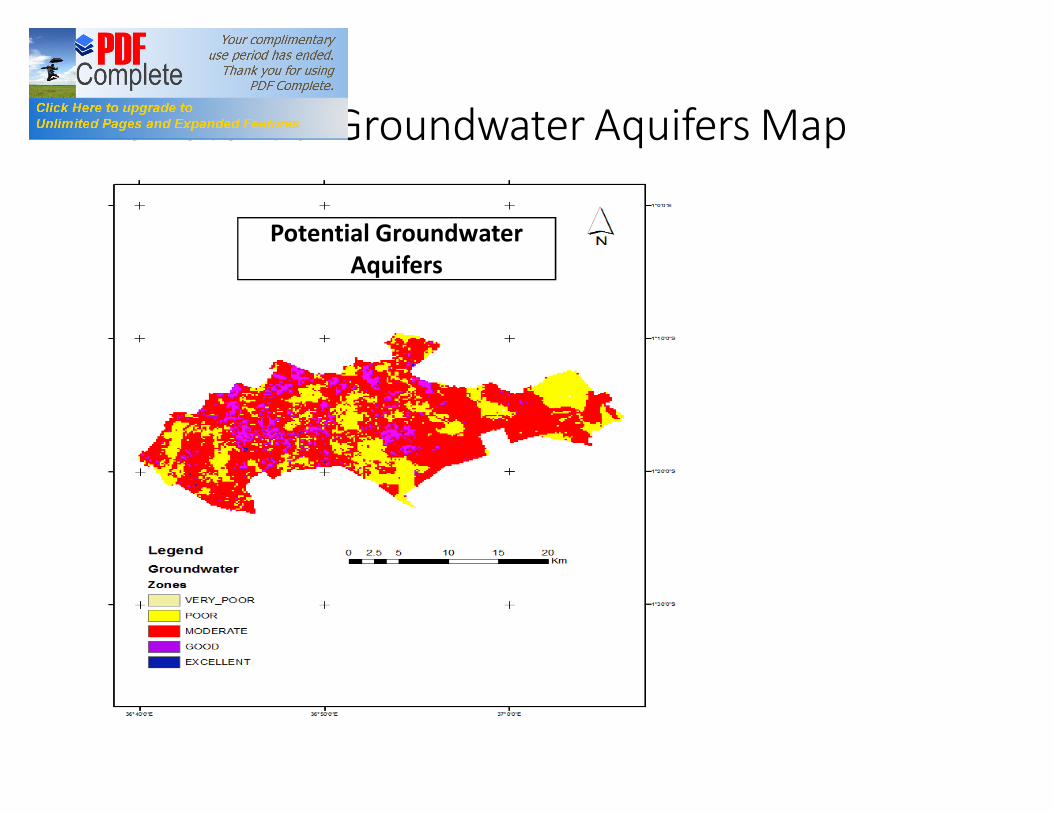
The Potential Groundwater Aquifers Map
Potential Groundwater Aquifers

Quantification of Area Covered by the Modelled Aquifer ZonesThe attribute query calculated the area of each potential aquifer zone and the bar graph on figure 4.8 was generated from the results of the query

Zone Categories
Score Category
0 Very Poor
1 Poor
2 Good
3 Moderate
4 Excellent

Discussion of the Results
This project has focused on empirical models in which map weighting is controlled subjectively (knowledge driven).The weighted overlay approach which, was used in this study, overlays several raster layers using a common measurement scale and weights each according to its importance.Most of the study area is covered by the moderate zone followed by the poor potential zone. The good zone comes third in terms of the area covered. The excellent zone then follows and finally, the very poor zone covers the least area as shown by the bar graph in figure 4.7.
CONCLUSIONS
The objectives of the study were met since the thematic maps for the various parameters influencing the occurrence of groundwater have been developed. The Geospatial Technology techniques used were adequate to generate and map potential groundwater aquifers for the study area.The project has achieved the preparation of a database for future updates in the study area. The project has also succeeded in creating a model that can generate and map potential groundwater aquifers for any area of interest.
Recommendations
The author feels that the study was limited in terms of the temporal accuracy and completeness of some of the datasets and hence, makes the following recommendations meant at improving the accuracy of the groundwater potential map for the study area:

Land use mapping
The land use map used in the study was rather general given the abrupt changes in land use that are occurring within the area of study. The land use map was also incomplete. Use of the SPOT satellite images is recommended which, are more accurate compared to the land use shape file used.

Recharge zones
A similar study may be carried out to establish recharge zones in the area of study. This will help in addressing the problem of lowering water table levels

Addition of other thematic layers
• Addition of other data e.g. recharge, soil suction, pore pressures, temperature changes, annual rainfall as thematic GIS layers, determination of the relevant criteria/ constraint factors, and assigning weightage to data layers based on accepted engineering principles to reflect their characteristics and relative importance.

Screening and Analysis of the Developed MapThere is also need for further screening and analysis of the developed map by experienced hydrologists and geologists. The more accurate map may then be incorporated in the planning mechanisms e.g. use by local authorities for zoning by-laws to protect the high potential groundwater zones and the recharge zones if they are further generated.