Project Title GB or BB name: XYZ. Define Phase D D M M A A I I C C.
34
Project Title GB or BB name: XYZ
-
Upload
amber-harvey -
Category
Documents
-
view
217 -
download
1
Transcript of Project Title GB or BB name: XYZ. Define Phase D D M M A A I I C C.

Project Title
GB or BB name: XYZ
Define Phase
D M A I C
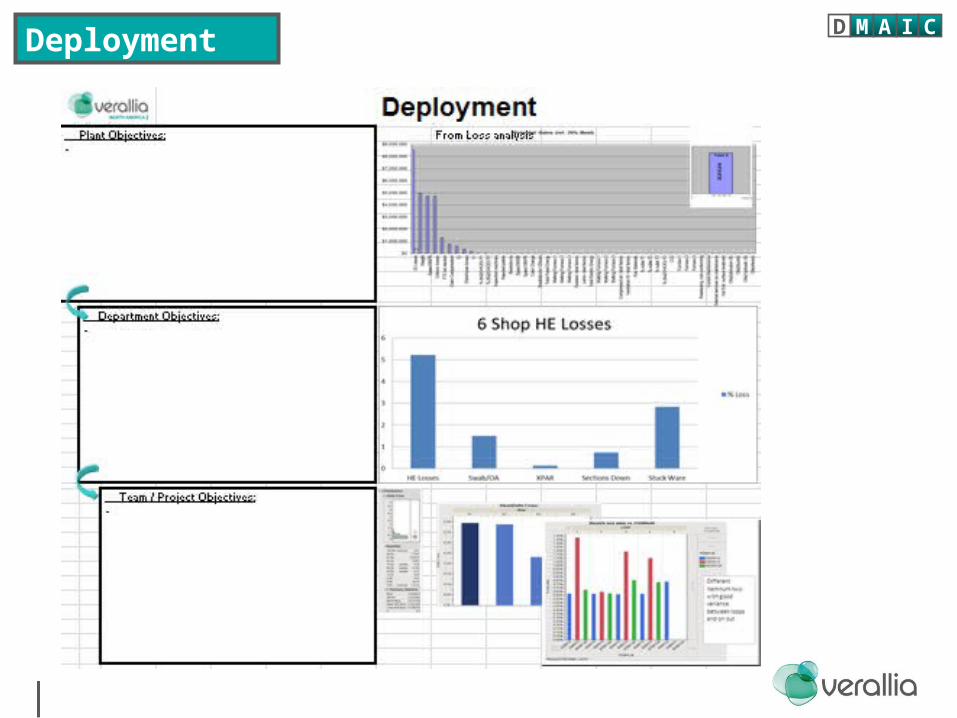
Deployment D M A I C
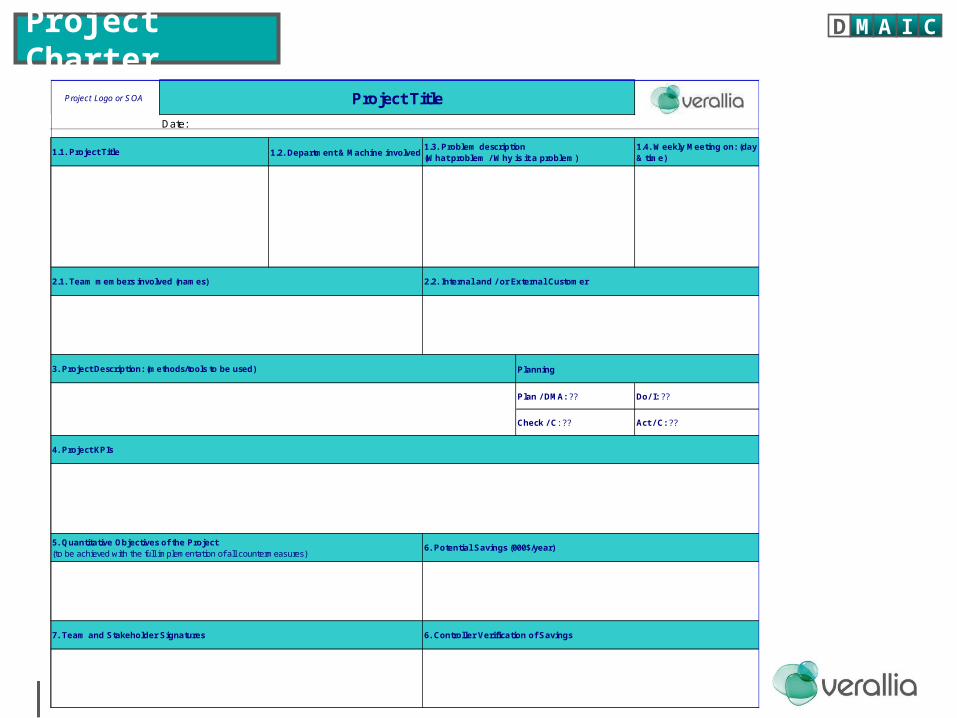
Project Charter D M A I C
Project Logo or SOA
Date:
1.2. Department & Machine involved 1.4. Weekly Meeting on: (day & time)
Planning
Plan / DMA: ?? Do/ I: ??
Check / C: ?? Act / C: ??
7. Team and Stakeholder Signatures 6. Controller Verification of Savings
5. Quantitative Objectives of the Project (to be achieved with the full implementation of all countermeasures)
6. Potential Savings (000$/year)
3. Project Description: (methods/tools to be used)
4. Project KPIs
2.1. Team members involved (names) 2.2. Internal and / or External Customer
Project Title
1.1. Project Title1.3. Problem description (What problem / Why is it a problem)
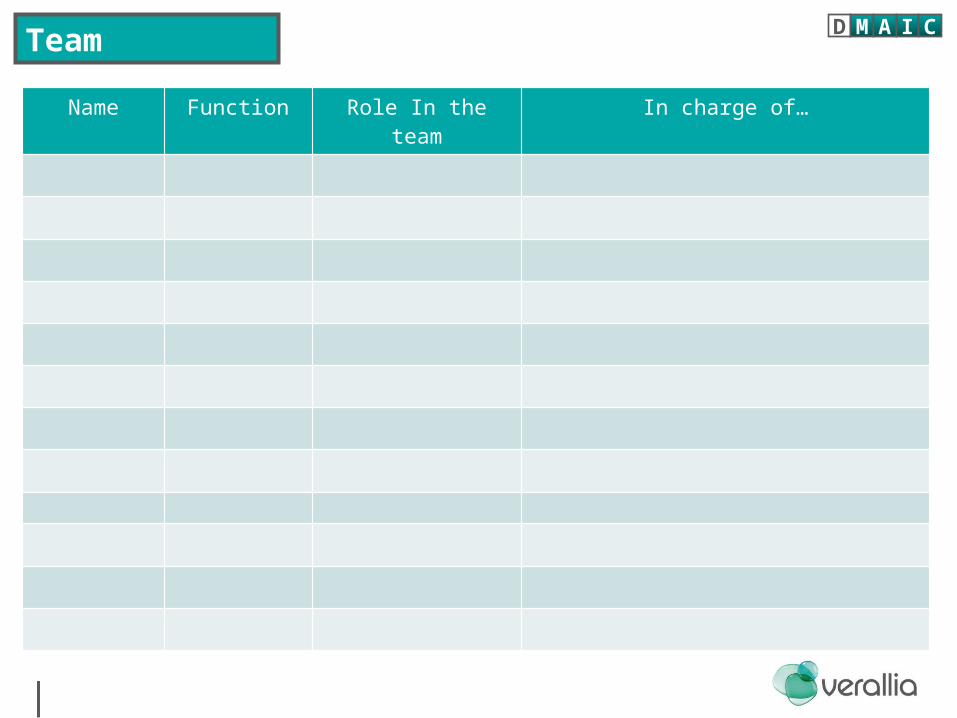
Team D M A I C
Name Function Role In the team In charge of…
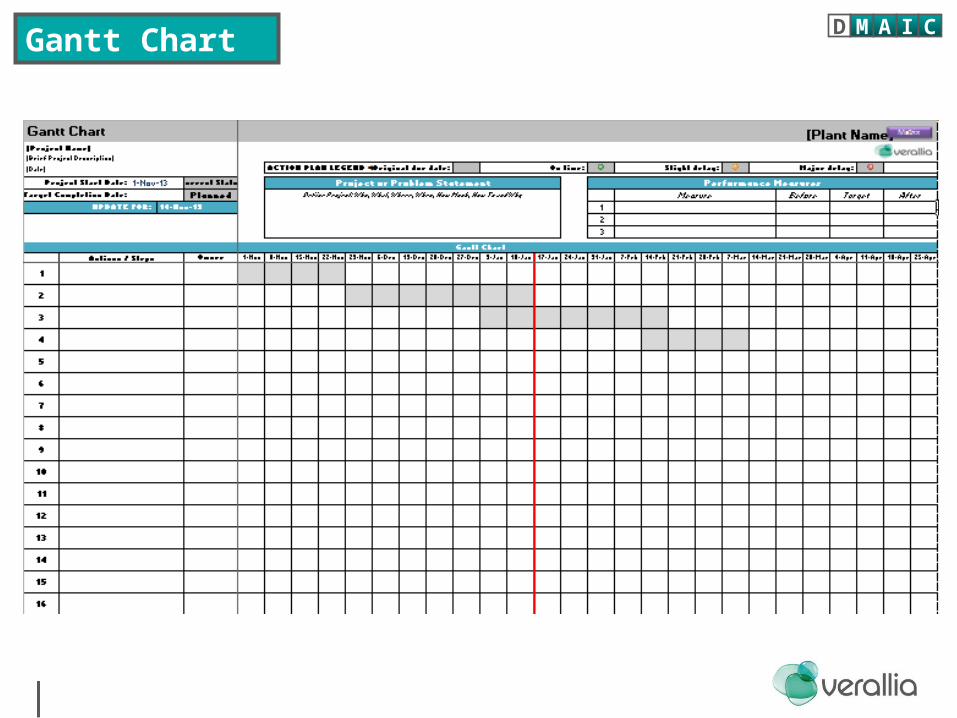
Gantt Chart D M A I C
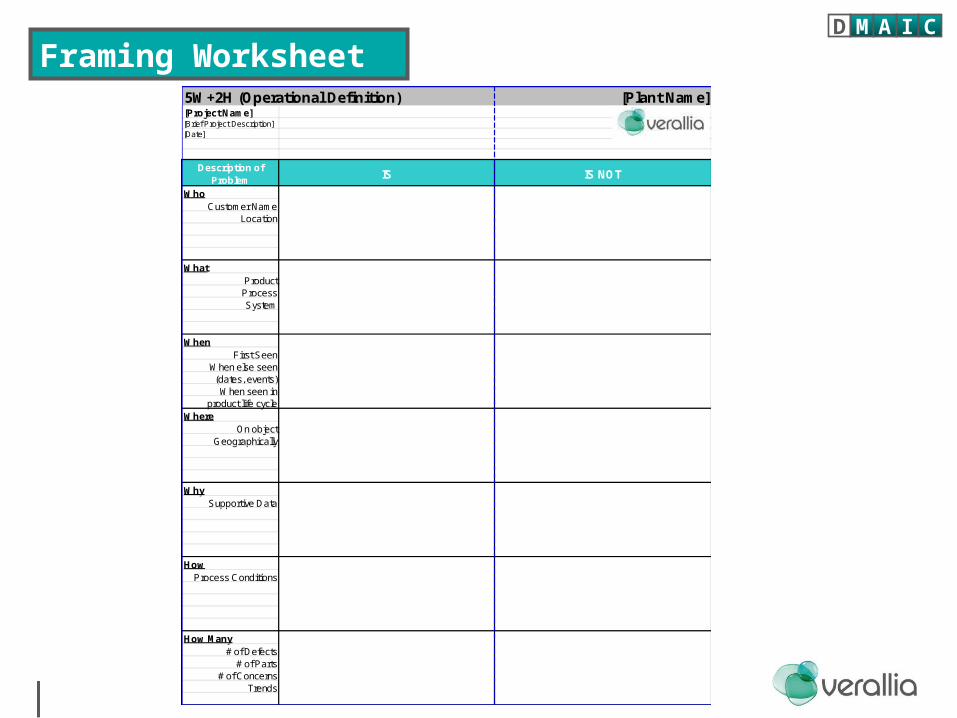
Framing Worksheet5W+2H (Operational Definition) [Plant Name][Project Name][Brief Project Description][Date]
Description of Problem
IS IS NOT
WhoCustomer Name
Location
WhatProductProcessSystem
WhenFirst Seen
When else seen(dates, events)When seen in
product life cycleWhere
On objectGeographically
WhySupportive Data
HowProcess Conditions
How Many# of Defects
# of Parts# of Concerns
Trends
D M A I C
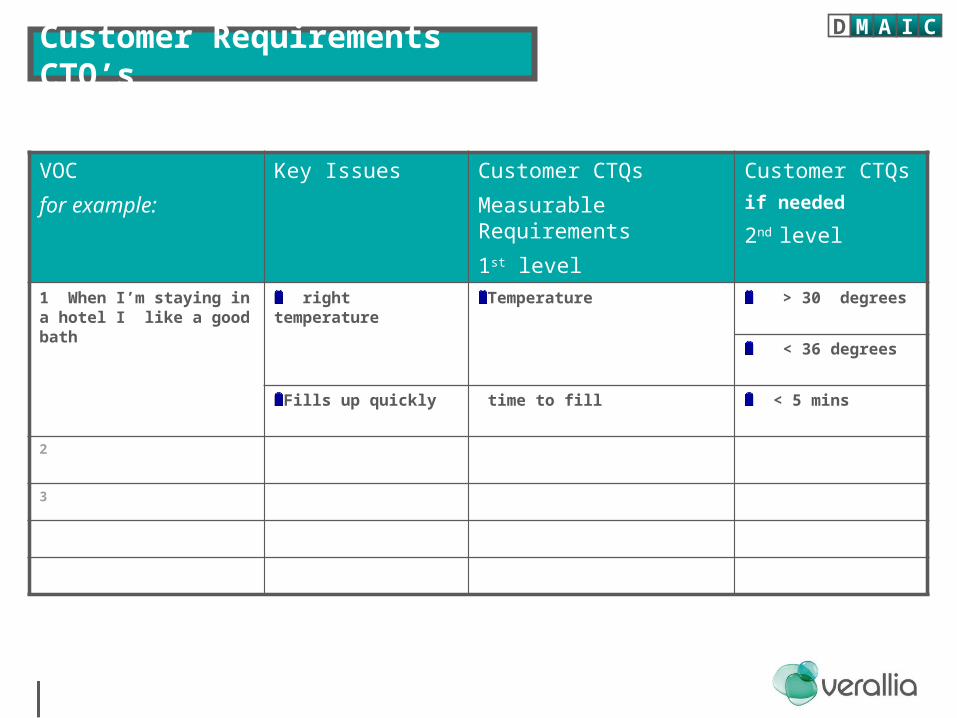
Customer Requirements CTQ’s
VOC
for example:
Key Issues Customer CTQs
Measurable Requirements
1st level
Customer CTQs if needed
2nd level
1 When I’m staying in a hotel I like a good bath
right temperature Temperature > 30 degrees
< 36 degrees
Fills up quickly time to fill < 5 mins
2
3
D M A I C
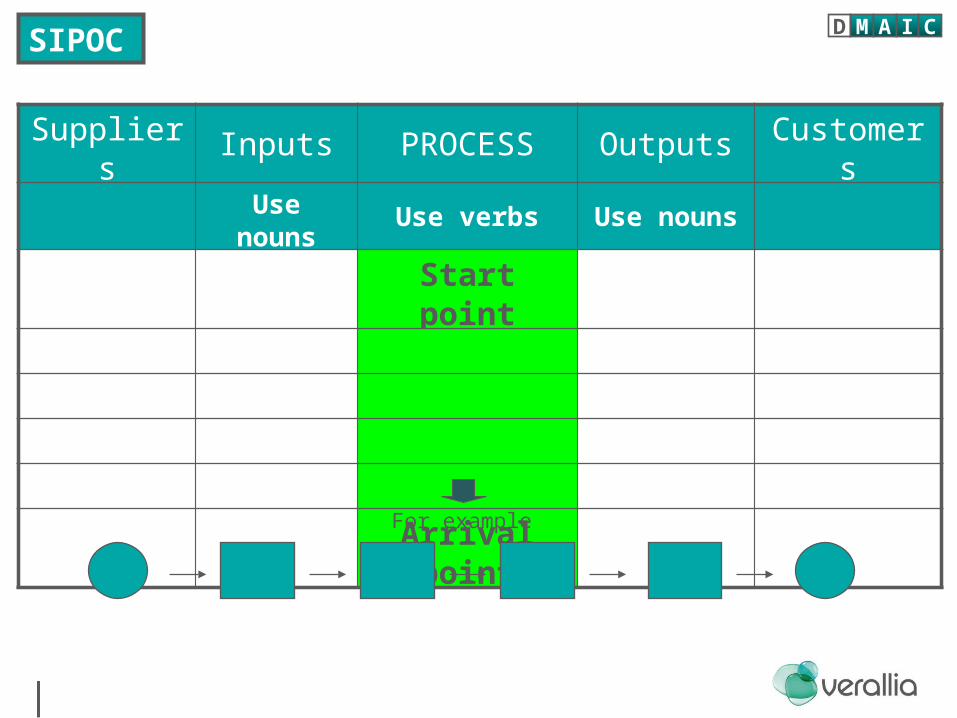
SIPOC
Suppliers Inputs PROCESS Outputs CustomersUse nouns Use verbs Use nouns
Start point
Arrival point
For example
D M A I C
Measure phase
MD A I C
D M A I C
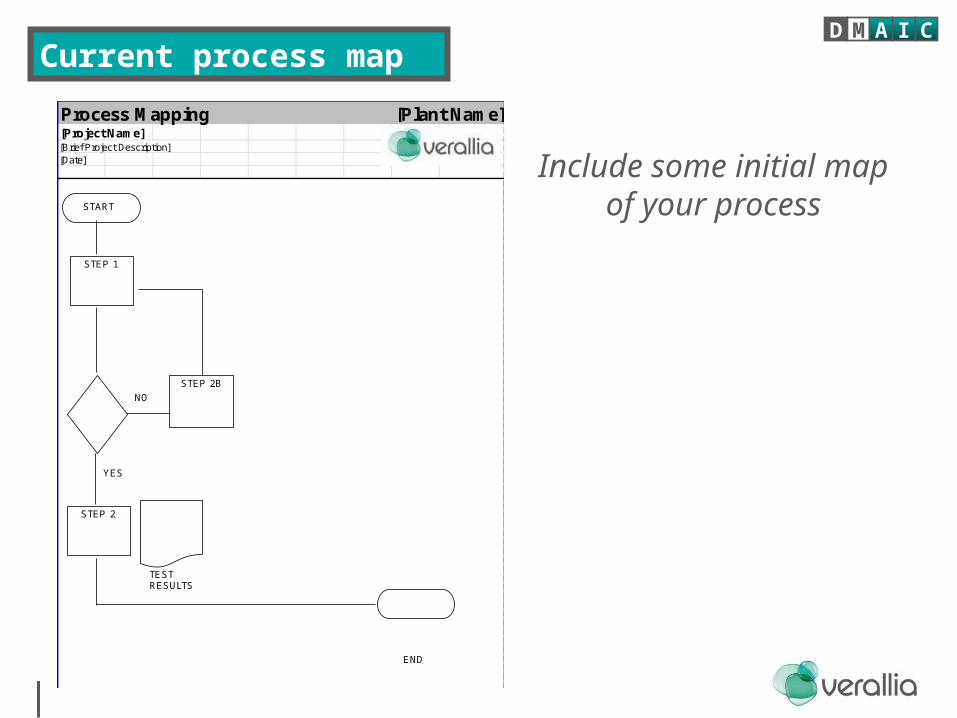
Current process map
Include some initial map of your process
Process Mapping [Plant Name][Project Name][Brief Project Description][Date]
START
END
STEP 1
NO
YES
STEP 2
STEP 2B
TESTRESULTS
D M A I C
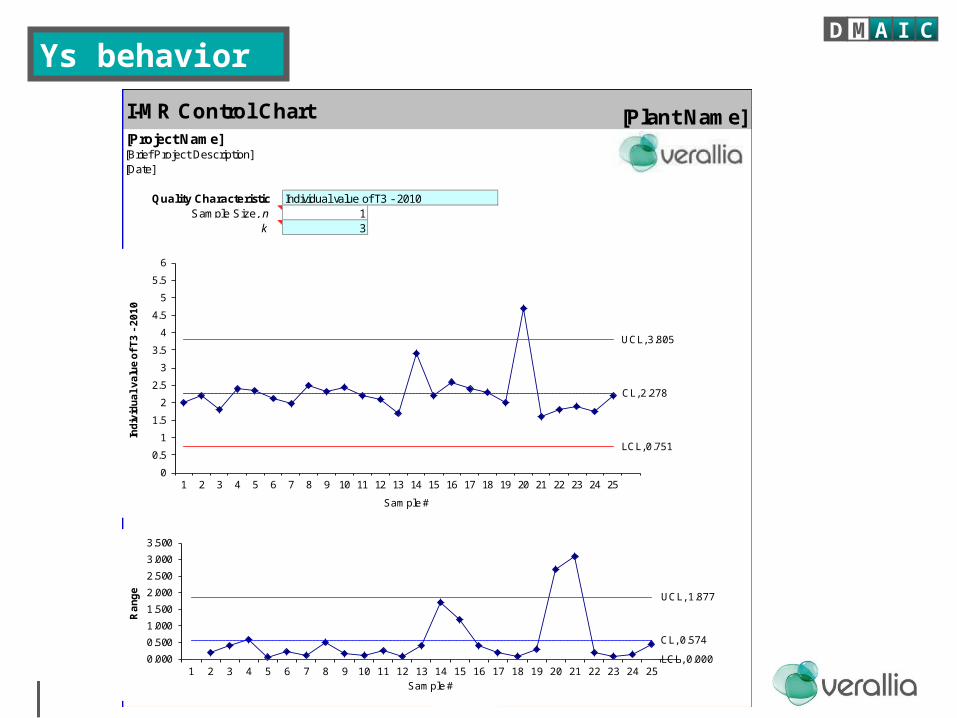
Ys behaviorD M A I C
I-MR Control Chart [Plant Name][Project Name][Brief Project Description][Date]
Quality Characteristic Individual value of T3 - 2010Sample Size, n 1
k 3
CL, 2.278
UCL, 3.805
LCL, 0.751
0
0.5
1
1.5
2
2.5
3
3.5
4
4.5
5
5.5
6
1 2 3 4 5 6 7 8 9 10 11 12 13 14 15 16 17 18 19 20 21 22 23 24 25
Ind
ivid
ua
l v
alu
e o
f T
3 -
20
10
Sample #
CL, 0.574
UCL, 1.877
LCL, 0.0000.000
0.500
1.000
1.500
2.000
2.500
3.000
3.500
1 2 3 4 5 6 7 8 9 10 11 12 13 14 15 16 17 18 19 20 21 22 23 24 25
Ra
ng
e
Sample #
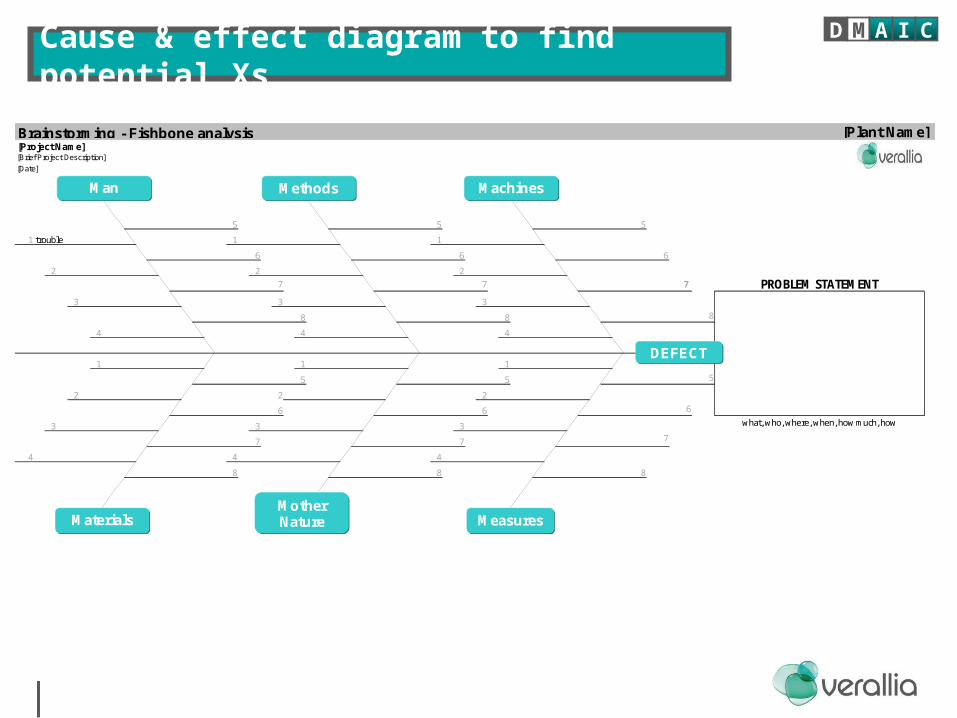
Cause & effect diagram to find potential Xs
Brainstorming - Fishbone analysis [Plant Name][Project Name][Brief Project Description]
[Date]
5 5 5
1 1 1
6 6 6
2 2 27 7 7
3 3 3
8 8 8
4 4 4
1 1 1
5 5 5
2 2 2
6 6 6
3 3 3
7 7 7
4 4 4
8 8 8
trouble
MAN METHODS MACHINES
PROBLEM STATEMENT
MATERIAL MOTHER NATURE MEASURES
what, who, where, when, how much, how
Methods
Measures
Machines
MaterialsMother Nature
Man
DEFECT
D M A I C
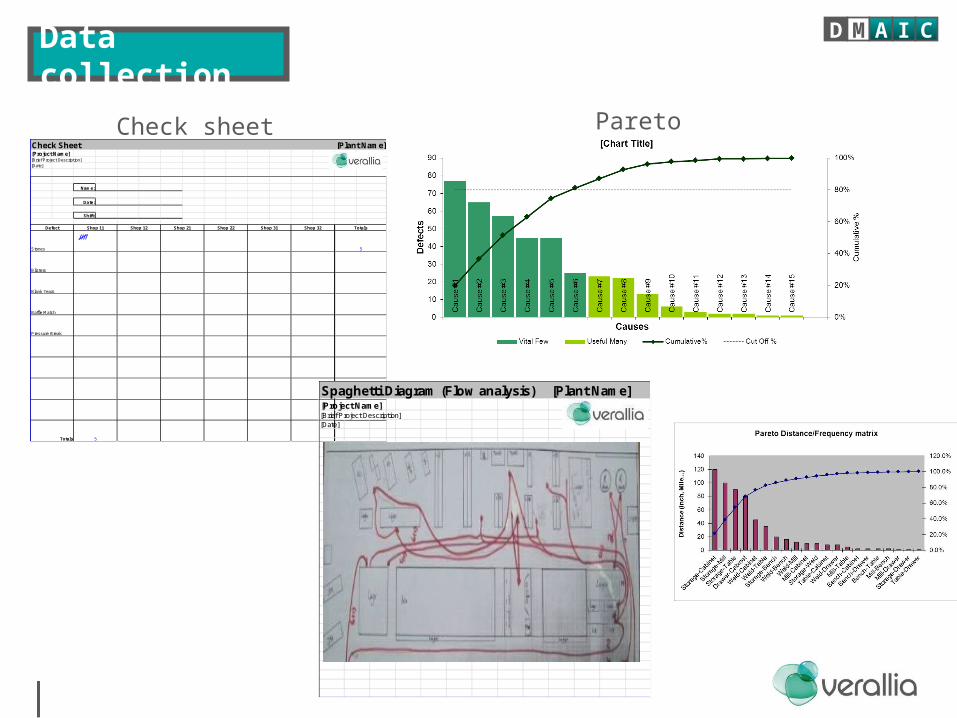
Data collectionD M A I C
Check Sheet [Plant Name][Project Name][Brief Project Description][Date]
Name:
Date:
Shift:
Defect
Stones
Blisters
Blank Tears
Baffle Match
Pressure Break
Totals
Shop 11 Shop 12
5
Shop 22 Shop 31 Shop 32Shop 21 Totals
5
Check sheet Pareto
Spaghetti Diagram (Flow analysis) [Plant Name][Project Name][Brief Project Description][Date]
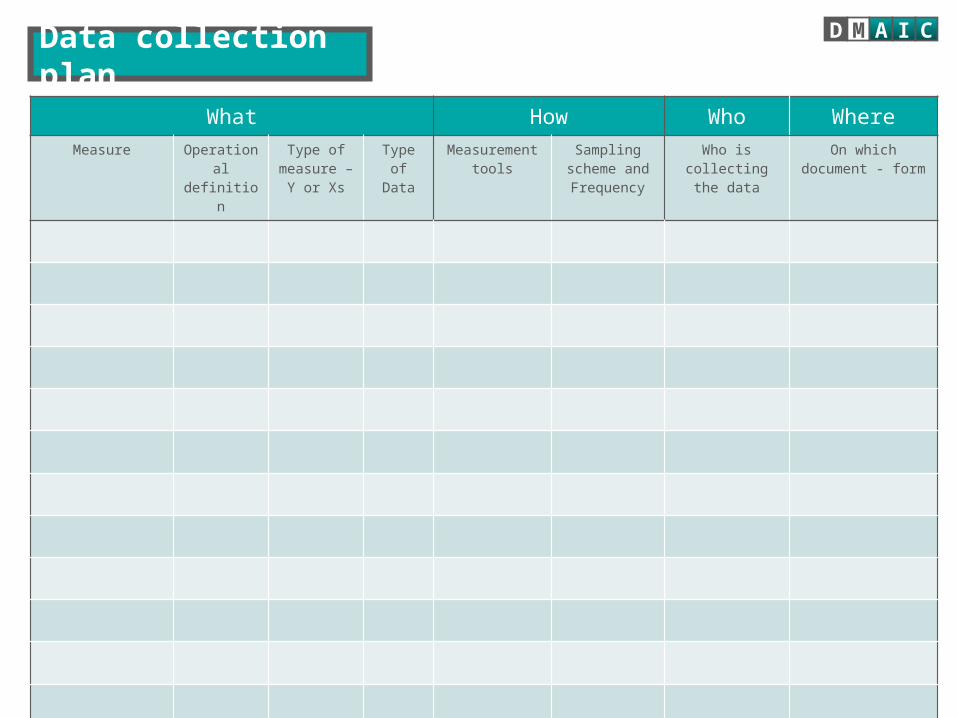
Data collection planD M A I C
What How Who WhereMeasure Operational
definitionType of
measure – Y or Xs
Type of Data
Measurement tools
Sampling scheme and Frequency
Who is collecting the data
On which document - form
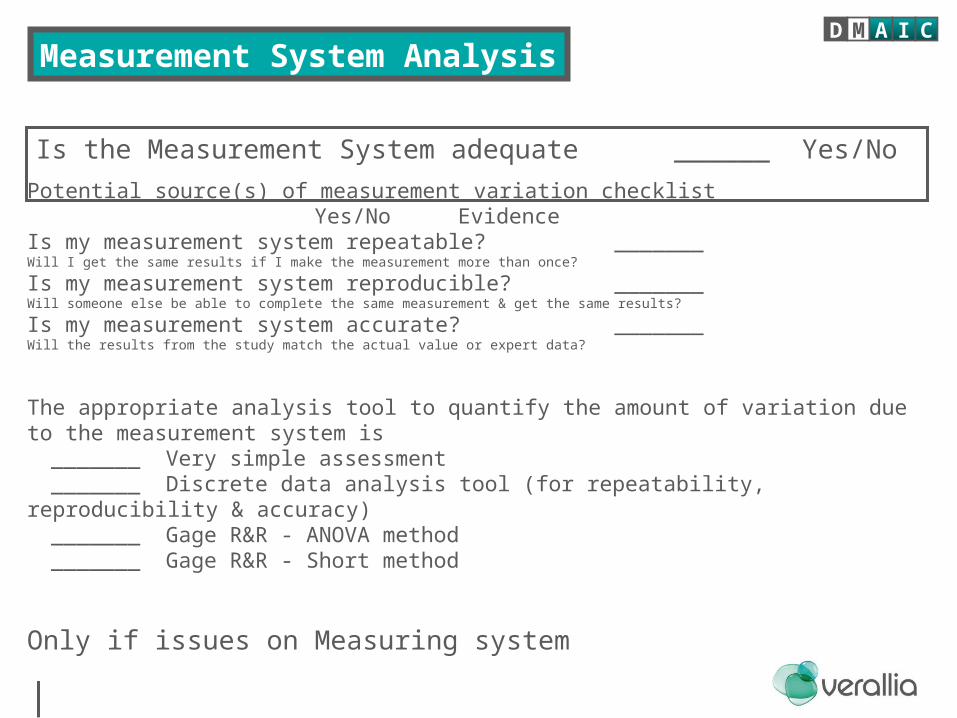
Measurement System Analysis
Potential source(s) of measurement variation checklist Yes/No Evidence
Is my measurement system repeatable? _______Will I get the same results if I make the measurement more than once?
Is my measurement system reproducible? _______ Will someone else be able to complete the same measurement & get the same results?
Is my measurement system accurate? _______Will the results from the study match the actual value or expert data?
The appropriate analysis tool to quantify the amount of variation due to the measurement system is
_______ Very simple assessment_______ Discrete data analysis tool (for repeatability, reproducibility & accuracy)_______ Gage R&R - ANOVA method_______ Gage R&R - Short method
Only if issues on Measuring system
Is the Measurement System adequate ______ Yes/No
D M A I C
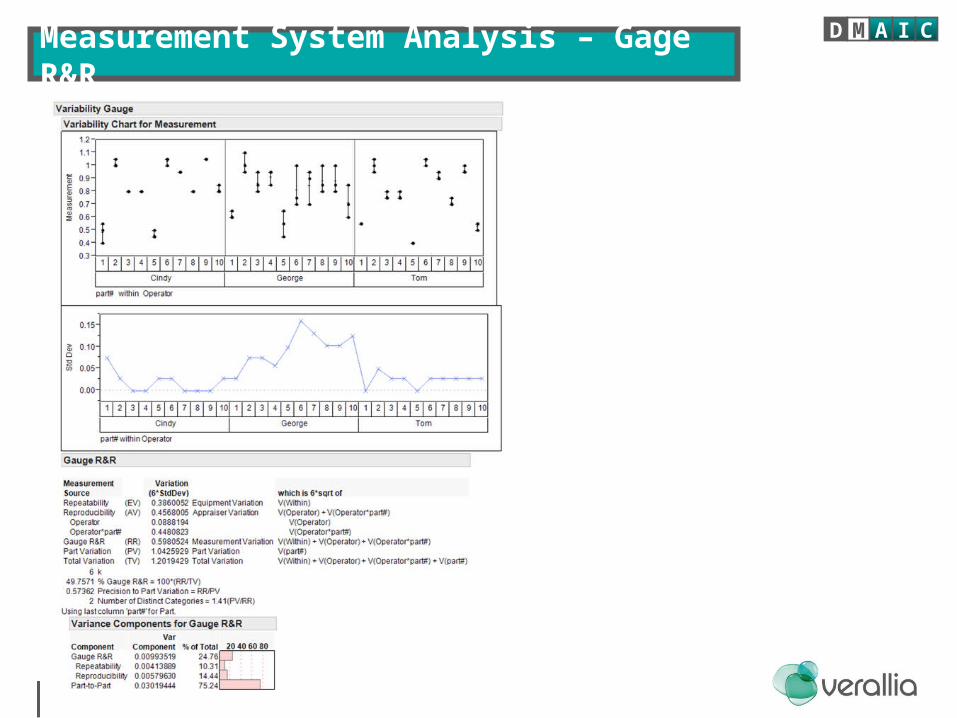
Measurement System Analysis – Gage R&RD M A I C
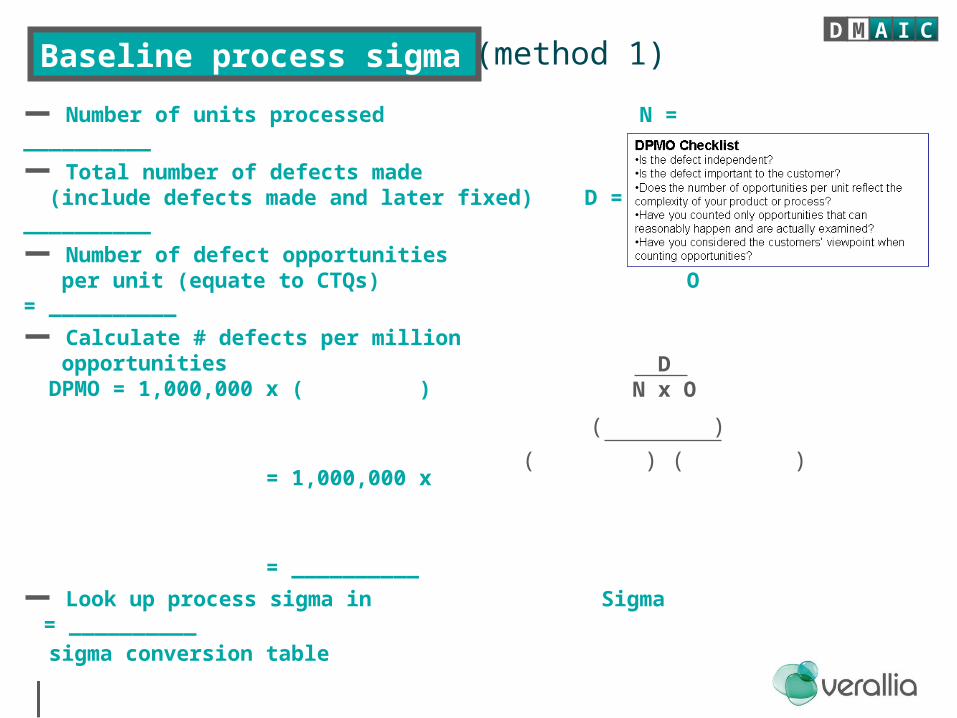
Baseline process sigma
Number of units processed N = __________
Total number of defects made (include defects made and later fixed) D = __________
Number of defect opportunities per unit (equate to CTQs) O = __________
Calculate # defects per million opportunities DPMO = 1,000,000 x ( )
= 1,000,000 x
= __________
Look up process sigma in Sigma = __________ sigma conversion table
DN x O
( )
( ) ( )
(method 1)D M A I C
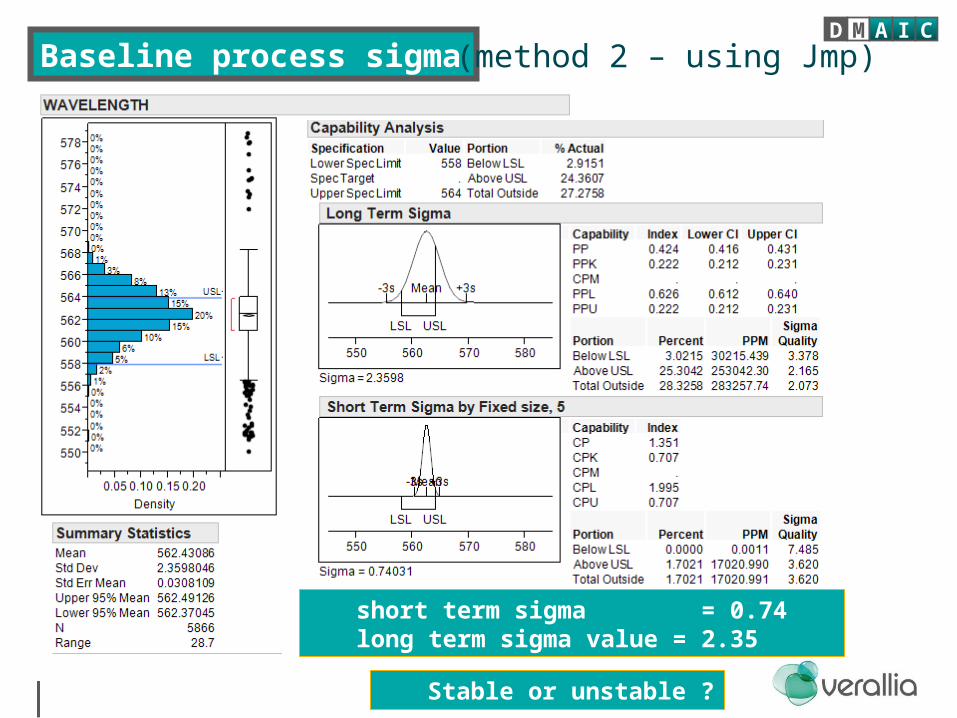
Baseline process sigma (method 2 – using Jmp)D M A I C
short term sigma = 0.74long term sigma value = 2.35
Stable or unstable ?
Analyse phase
MD A I C
D M A I C
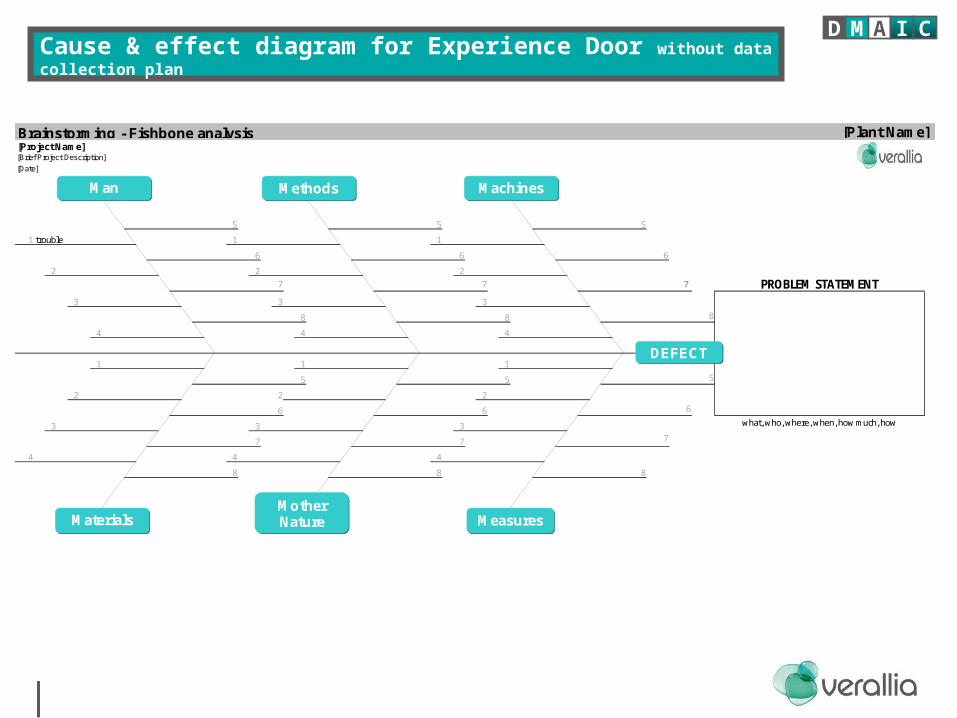
Cause & effect diagram for Experience Door without data collection plan
D M A I C
Brainstorming - Fishbone analysis [Plant Name][Project Name][Brief Project Description]
[Date]
5 5 5
1 1 1
6 6 6
2 2 27 7 7
3 3 3
8 8 8
4 4 4
1 1 1
5 5 5
2 2 2
6 6 6
3 3 3
7 7 7
4 4 4
8 8 8
trouble
MAN METHODS MACHINES
PROBLEM STATEMENT
MATERIAL MOTHER NATURE MEASURES
what, who, where, when, how much, how
Methods
Measures
Machines
MaterialsMother Nature
Man
DEFECT
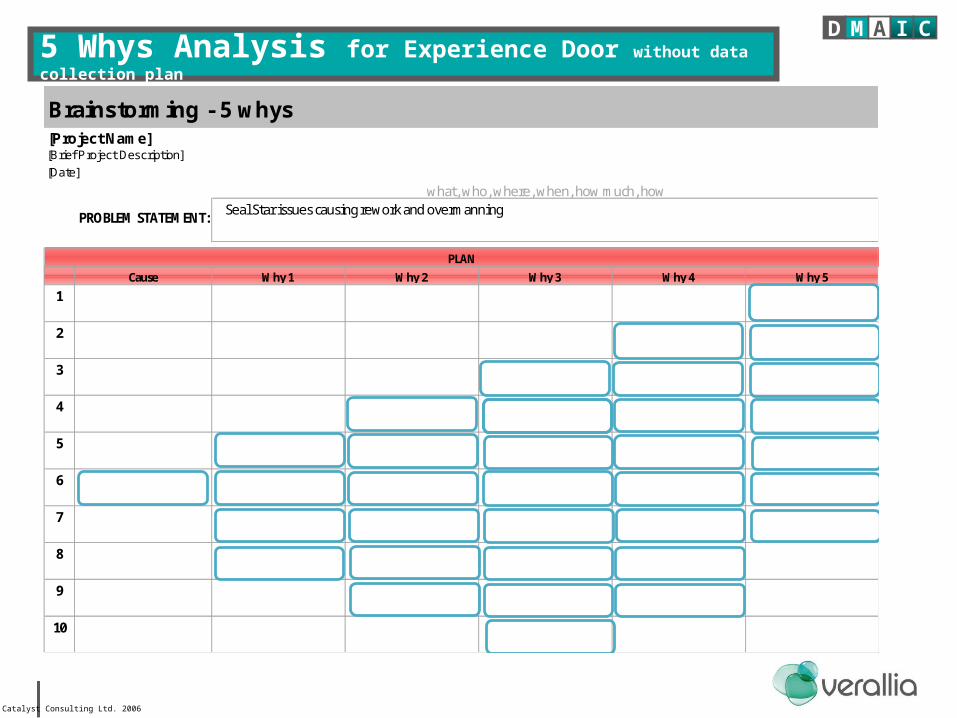
5 Whys Analysis for Experience Door without data collection plan
Catalyst Consulting Ltd. 2006
D M A I C
Brainstorming - 5 whys[Project Name][Brief Project Description]
[Date]
what, who, where, when, how much, how
Cause Why 1 Why 2 Why 3 Why 4 Why 5
1
2
3
4
5
6
7
8
9
10
PLAN
PROBLEM STATEMENT: Seal Star issues causing rework and overmanning

Statistical Analysis
Catalyst Consulting Ltd. 2006
D M A I C
Box plotScatterplotSimple regressionFit Y by XAnovaScreeningPartitioning…
Y=f(Xi) – Statistical ModelD M A I C
Vital few Causes
Critical X
1
2
3
4
D M A I C
Improve phase
ID M A C
D M A I C
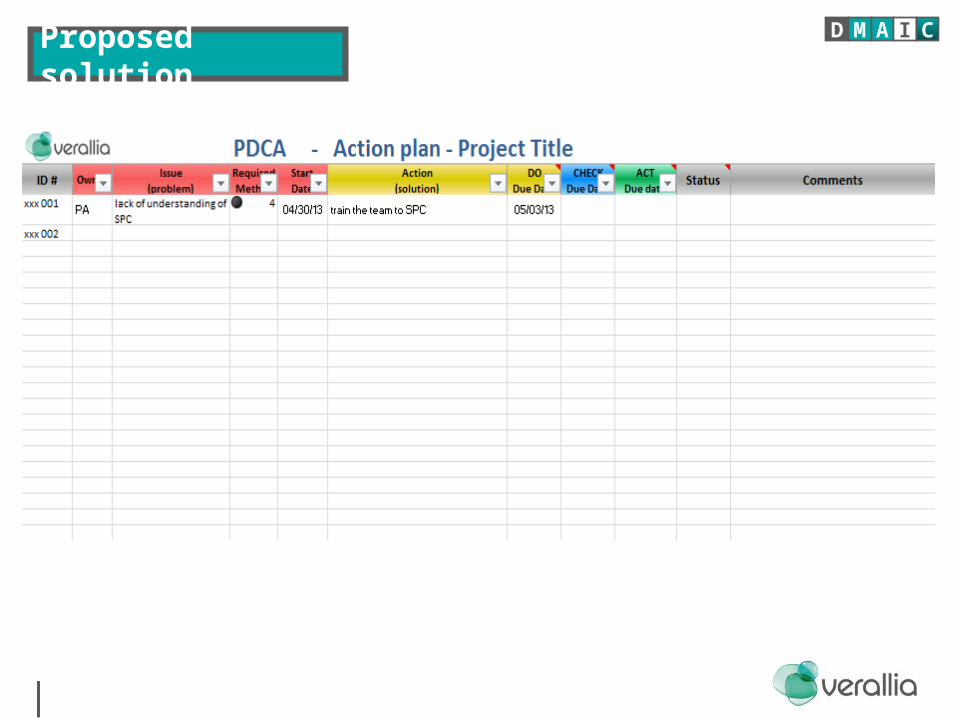
Proposed solution D M A I C
Proposed solution D M A I C
add additional slides to elaborate on actions using pictures and summary activities
Control phase
CD M A I
D M A I C
32
D M A I C
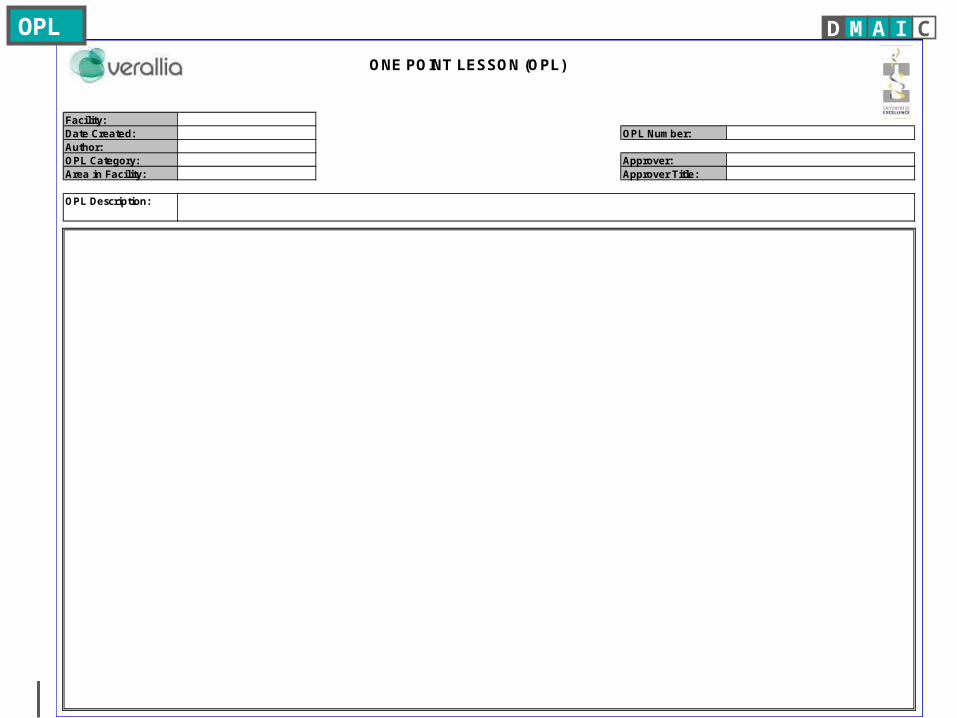
ONE POINT LESSON (OPL)
Facility:Date Created: OPL Number:Author:OPL Category: Approver:Area in Facility: Approver Title:
OPL Description:
OPL
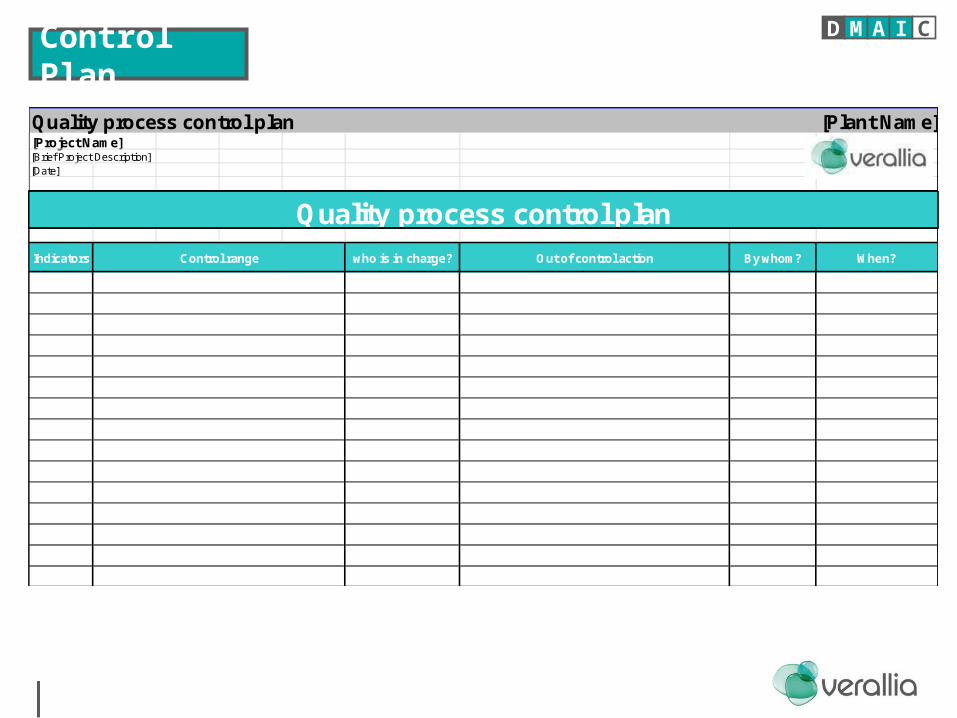
Control PlanD M A I C
Quality process control plan [Plant Name][Project Name][Brief Project Description][Date]
Indicators By whom?
Quality process control plan
When?Out of control actionwho is in charge?Control range
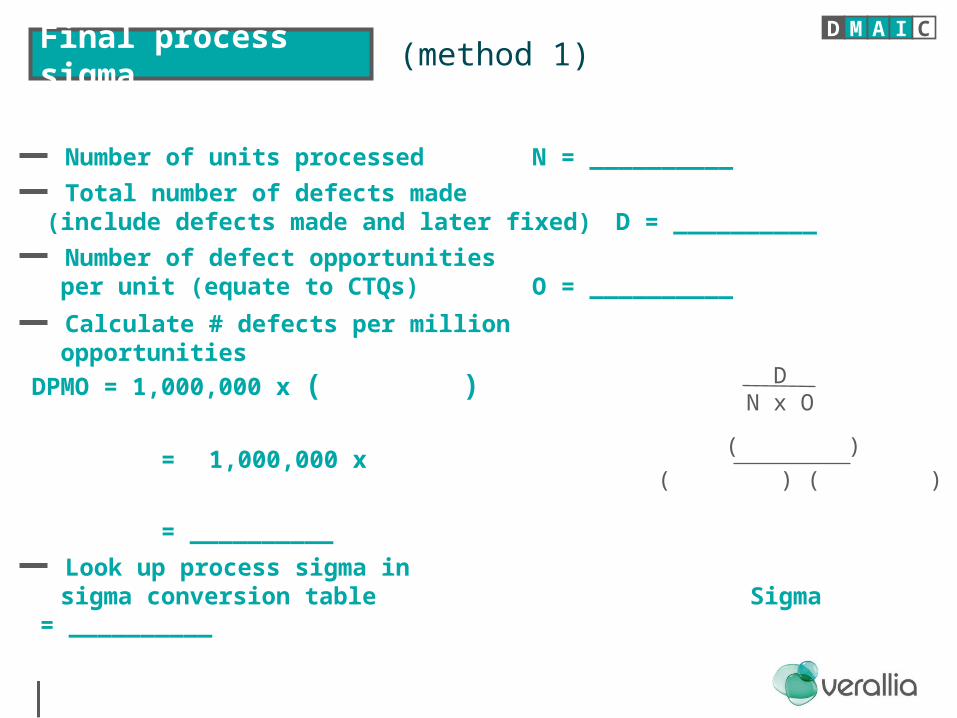
Final process sigma
Number of units processed N = __________
Total number of defects made (include defects made and later fixed) D = __________
Number of defect opportunities per unit (equate to CTQs) O = __________
Calculate # defects per million
opportunities DPMO = 1,000,000 x ( )
= 1,000,000 x
= __________
Look up process sigma in sigma conversion table Sigma = __________
DN x O
( )
( ) ( )
(method 1)D M A I C
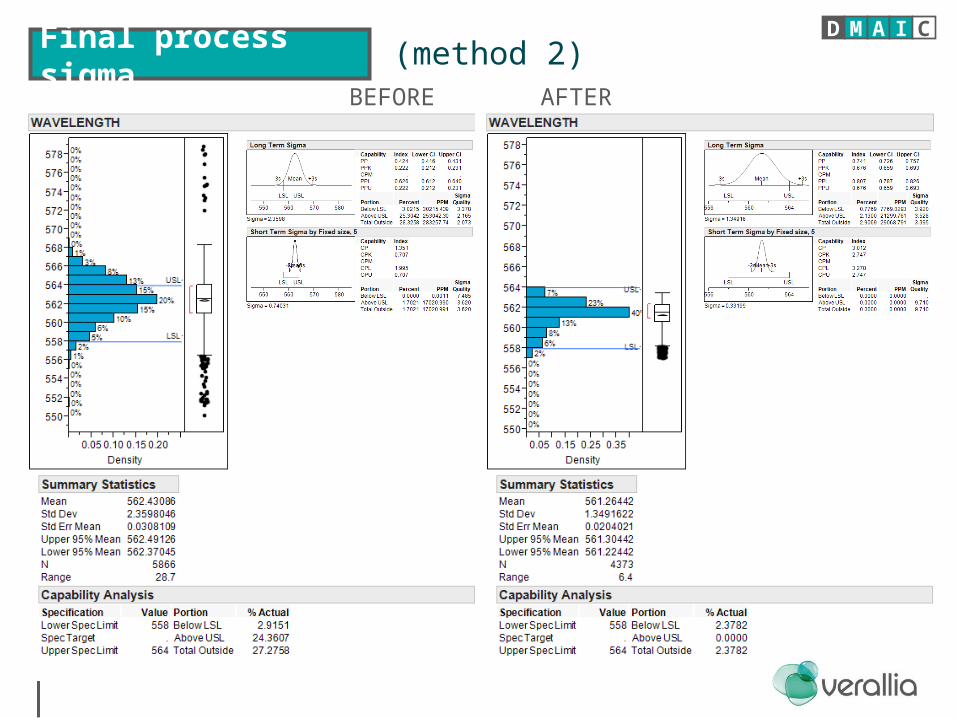
Final process sigma (method 2)D M A I C
BEFORE AFTER
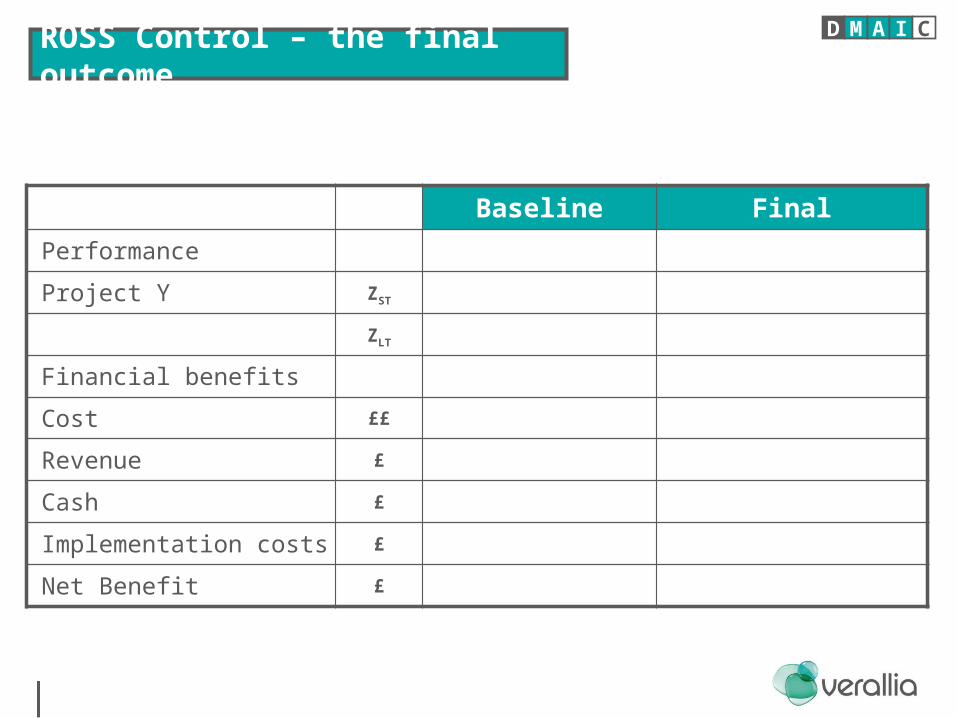
ROSS Control – the final outcome
Baseline Final
Performance
Project Y ZST
ZLT
Financial benefits
Cost ££
Revenue £
Cash £
Implementation costs £
Net Benefit £
D M A I C
![The effects of aqueous ginger extract on …Translate this pagePDF-1.5 %âãÏÓ 5 0 obj /D [ 3 0 R /XYZ null 733.88977 null ] >> endobj 6 0 obj /D [ 3 0 R /XYZ null 733.88977 null](https://static.fdocuments.us/doc/165x107/5aaec4c67f8b9a59478c7931/the-effects-of-aqueous-ginger-extract-on-translate-this-pdf-15-5-0-obj-d.jpg)


![Final Report for AmeriCorps Opportunity Youth Evaluation ......[26 /xyz 70 448 0.00] [27 /xyz 70 445 0.00] [28 /xyz 70 720 0.00] [28 /xyz 70 483 0.00] [30 /xyz 70 420 0.00] [31 /xyz](https://static.fdocuments.us/doc/165x107/5f2350203f441e0a236e3614/final-report-for-americorps-opportunity-youth-evaluation-26-xyz-70-448.jpg)