Project Safe Neighborhoods-A National Program to Reduce ... · PDF fileProject Safe...
231
The author(s) shown below used Federal funds provided by the U.S. Department of Justice and prepared the following final report: Document Title: Project Safe Neighborhoods - A National Program to Reduce Gun Crime: Final Project Report Author: Edmund F. McGarrell, Ph.D.; Natalie Kroovand Hipple, Ph.D.; Nicholas Corsaro, Ph.D.; Timothy S. Bynum, Ph.D.; Heather Perez, M.A.; Carol A. Zimmermann, Ph.D.; Melissa Garmo, MS Document No.: 226686 Date Received: April 2009 Award Number: 2002-GP-CX-1003 This report has not been published by the U.S. Department of Justice. To provide better customer service, NCJRS has made this Federally- funded grant final report available electronically in addition to traditional paper copies. Opinions or points of view expressed are those of the author(s) and do not necessarily reflect the official position or policies of the U.S. Department of Justice.
Transcript of Project Safe Neighborhoods-A National Program to Reduce ... · PDF fileProject Safe...

The author(s) shown below used Federal funds provided by the U.S. Department of Justice and prepared the following final report: Document Title: Project Safe Neighborhoods - A National
Program to Reduce Gun Crime: Final Project Report
Author: Edmund F. McGarrell, Ph.D.; Natalie Kroovand
Hipple, Ph.D.; Nicholas Corsaro, Ph.D.; Timothy S. Bynum, Ph.D.; Heather Perez, M.A.; Carol A. Zimmermann, Ph.D.; Melissa Garmo, MS
Document No.: 226686 Date Received: April 2009 Award Number: 2002-GP-CX-1003 This report has not been published by the U.S. Department of Justice. To provide better customer service, NCJRS has made this Federally-funded grant final report available electronically in addition to traditional paper copies.
Opinions or points of view expressed are those
of the author(s) and do not necessarily reflect the official position or policies of the U.S.
Department of Justice.

This project was supported by Grant #2002-GP-CX-1003 awarded by the National Institute of Justice, Office of Justice Programs, United States Department of Justice. Points of view in this document are those of the authors and do not necessarily represent the official position or policies of the U.S. Department of Justice.
Project Safe Neighborhoods - A National Program to Reduce Gun Crime: Final Project Report
Submitted to the National Institute of Justice
Edmund F. McGarrell, Ph.D.
Michigan State University
Natalie Kroovand Hipple, Ph.D. Michigan State University
Nicholas Corsaro, Ph.D.
Southern Illinois University Carbondale
Timothy S. Bynum, Ph.D. Michigan State University
Heather Perez, M.A.
Michigan State University
Carol A. Zimmermann, Ph.D. Saginaw Valley State University
Melissa Garmo, MS
Michigan State University
February 2009
Michigan State University School of Criminal Justice
560 Baker Hall East Lansing, MI 48824-1118
This document is a research report submitted to the U.S. Department of Justice. This report has not been published by the Department. Opinions or points of view expressed are those of the author(s)
and do not necessarily reflect the official position or policies of the U.S. Department of Justice.

ii
Acknowledgements While there are so many people who over the years contributed to this project, there are some people we wish to specifically acknowledge here. First, Lois Felson Mock, now retired from the National Institute of Justice, an expert on gun crime and policy as well as a terrific advocate for action based research. Thank you for your unwavering support and dedication to this project. Lois was succeeded at NIJ by Phelan Wyrick and subsequently by Louis Tuthill, both of whom have demonstrated a similar commitment to advancing action research and evidence-based practice to address gun crime. We cannot forget the knowledge and expertise of our colleagues and friends, Jack McDevitt, Scott Decker and John Klofas. We are grateful for your collaborations over the years and fondly consider you, as well as Lois, honorary members of the MSU team. We wish to thank Ed Banks, while no longer with us at MSU, for his contribution towards the training and technical assistance portion of this project and his support once moving to the Bureau of Justice Assistance. Stephen Raudenbush gave us invaluable guidance and suggestions regarding the regression models we present in the results chapter. We have been very fortunate to have many dedicated national PSN Coordinators. Reagan Dunn, Spencer Pryor, Kelly Shackelford, John Irving, Natalie Voris, and Tate Chambers. Throughout the years, DOJ’s Robyn Thiemann was a consistent source of support and an advocate of linking research to action through the PSN programs in each U.S. Attorney’s Office. Finally, we must acknowledge the United States Attorneys, Assistant United States Attorneys, Law Enforcement Coordinators, Chiefs of Police, Research Partners and all of those individuals on the ground and in the trenches making PSN happen in their jurisdictions. Without your support and gracious cooperation, our research would not have been possible.
This document is a research report submitted to the U.S. Department of Justice. This report has not been published by the Department. Opinions or points of view expressed are those of the author(s)
and do not necessarily reflect the official position or policies of the U.S. Department of Justice.

iii
Project Safe Neighborhoods Executive Summary
In 2001, the United States Department of Justice developed a major initiative known as Project Safe Neighborhoods (PSN). PSN was intended to be a comprehensive national program to reduce gun violence at the local level. It was implemented in all 94 U.S. Attorney districts nationwide to respond to firearms crime problems in each respective district. An estimated three billion dollars was allocated through Fiscal Year 2008 to fund local and Federal prosecutors; provide resources for law enforcement; support research and community outreach partners; fund a national media campaign; and provide training, technical assistance, and research functions for the initiative (Office of Management and Budget). PSN built on what were viewed as successful approaches utilized in the Boston Ceasefire project, the ten-city Strategic Approaches to Community Safety Initiative (SACSI), and Richmond’s Project Exile. It was designed as a collaborative problem solving initiative utilizing a strategic research-based model to reduce firearms violence through enforcement, deterrence, and prevention.
At the core of the strategy was the increased federal prosecution of illegal gun use and illegal gun possession by prohibited persons. Increased federal prosecution was intended to incapacitate chronic violent offenders as well as to communicate a credible deterrent threat to potential gun offenders. However, it was also recognized that exclusive reliance on increased federal prosecution was of limited utility given the reality that most gun crime is prosecuted in state and local courts. Further, there was recognition of the large variability across communities in the U.S. in terms of the level and nature of gun crime and therefore the program would need flexibility to adapt to local context.
To address these issues, PSN was framed on five key components: 1) partnerships; 2) strategic planning and research integration; 3) training; 4) outreach; and 5) accountability. The intent was that these components would maximize the investment of federal resources through a focus on the contexts driving gun crime in particular jurisdictions. Research would assist in focusing resources and local and state partners would bring understanding of local conditions as well as resources to the interventions. The goal was to significantly reduce gun crime.
This report presents findings on the development and implementation of these various components of PSN. Additionally, the report presents research findings on the impact of PSN on gun crime at the local level.
The key findings include:
Implementation Patterns • Two findings were continually reinforced in interviews and observations of PSN
practices but were difficult to measure systematically across districts and were thus not part of the quantitative analyses presented herein. The first related to the importance of leadership in the United States Attorney’s Office and to distributed leadership. The second related to the extent to which PSN task forces focused on specific high gun crime places and contexts as opposed to spreading resources across an entire district.
o Interviews continually reinforced the power of the U.S. Attorney (USA) and the U.S. Attorney’s Office (USAO) to exert a leadership role in local crime control and prevention programs. PSN districts exhibiting high
This document is a research report submitted to the U.S. Department of Justice. This report has not been published by the Department. Opinions or points of view expressed are those of the author(s)
and do not necessarily reflect the official position or policies of the U.S. Department of Justice.

iv
levels of implementation almost uniformly witnessed a high level of commitment and involvement by the USA and his/her leadership team within the USAO.
o Similarly, interviews suggested that successful task forces developed “distributed leadership.” Specifically, the leadership of key agency leaders such as the USAO, the Chief of Police, the local prosecutor, the chief of probation and parole, and the Mayor or City Manager, was observed in many high functioning task forces. Similarly, it was not only the agency head but leaders from throughout the participating agencies who made the task force function on a day-to-day basis. A number of task forces struggled with the loss of key leaders through turnover. In other instances task forces moved forward significantly when the right constellation of leaders aligned.
o Many U.S.A.’s experienced a tension between the desire to serve their entire judicial district and the recommendation heard in PSN trainings to focus resources on those places, people, and contexts generating gun crime in the district. A number of PSN task forces that appeared to have successfully implemented their program were able to navigate this tension by serving the entire district at one level (e.g., accepting key cases for prosecution, media campaign coverage) while at the same time focusing most of the enforcement, intervention, and prevention resources at specific cities or specific police districts or neighborhoods that had experienced high levels of gun crime.
• Virtually every PSN task force was able to establish partnerships with other agencies to implement PSN. Most common were partnerships with other law enforcement agencies at the federal, state, and local level as well as with other criminal justice agencies. Yet the partnerships were not exclusive to other criminal justice agencies as three-quarters of task forces reported partnerships with community leaders and organizations beyond the criminal justice sector.
• A high level (70 to 80%) of the PSN task forces and research partners reported some degree of integration of research and strategic planning processes. Almost all the task forces conducted some type of local level assessment of gun crime and utilized multiple sources of data.
• The most common barrier to research integration was the availability of crime data. This typically reflected the availability of timely and electronic crime data as opposed to administrative or legal barriers to information. Particularly problematic was the lack of crime data specific to gun crime. As PSN increasingly focused on gangs and gang crime, the lack of crime data specific to gangs became a similar obstacle. Local level prosecution data were often not available in useful form.
• Data and research were considered most useful for the task force when there were available crime information systems and the research partner was included as an active member of the task force.
• PSN task force implementation was measured as a composite of the increase and level of federal prosecution, the number and range of formal PSN task force partners, and the integration of research.
This document is a research report submitted to the U.S. Department of Justice. This report has not been published by the Department. Opinions or points of view expressed are those of the author(s)
and do not necessarily reflect the official position or policies of the U.S. Department of Justice.

v
• The integration of research positively related to number of formal task force partners and to increased federal prosecution.
• Although the level of gun crime (demand or push factor) and prior experience of federal prosecution of gun crime related to implementation of PSN at the bivariate level, in the multivariate analysis the two key factors were information infrastructure and past experience with multi-agency crime control collaborations.
• Information infrastructure and data availability were also related to the number of formal partners and to the level of federal prosecution.
• Federal prosecution increased dramatically in a number of PSN task forces. Yet, there was significant variation across the country and many PSN task forces witnessed either no change or very minimal increases, despite the prioritization by the Attorney General and investment of federal resources.
• The most common strategies employed by PSN task forces were increased federal prosecution; joint federal-local prosecution case screening; directed police patrol; chronic violent offender programs; street level firearms enforcement teams; offender notification meetings; re-entry programs; and firearms supply side interventions. The most common prevention strategies included neighborhood development; education; and school-based prevention programs.
• Every district participated in extensive PSN training offerings and all included a media and/or outreach partner. Further, the national PSN program developed and implemented a major media campaign involving public service announcements broadcast nationally and made available for use by individual PSN task forces. The available measures of the implementation of training and media outreach did not capture significant variation across the districts.
• The accountability dimension of PSN proved challenging. Although there was inclusion of research partners and data were used for problem analysis, reporting of potential performance measures was very limited. At its peak in 2002 only 60 percent of the districts submitted data and by 2005 this dropped to 10 percent. At its peak, only one-third of the data reports were judged to be of good or very good quality in terms of accuracy and completeness. The data submitted by PSN districts could be used for within-district assessment in only a small number of jurisdictions and did not allow for cross-site, much less national, assessment of either program outputs (e.g., arrests, prosecutions, prevention programs, etc.) or outcome measures (e.g., gun crime).
Impact on Gun Crime • Measuring the impact of a national (full coverage) program such as PSN is very
challenging. In effect, PSN occurred everywhere so to what do you compare the trend in violent crime? Several strategies were employed. A series of case studies were conducted in jurisdictions that were considered to represent PSN task forces that had implemented PSN in a serious and significant fashion. The purpose of the case studies was to address the question of whether the evidence suggested PSN could potentially have an impact on crime. The other strategy involved analysis of violent crime patterns in all U.S. cities of 100,000 population or greater. This involved comparisons based on whether the city was a PSN target city and by the level or dosage of implementation. The prediction was that
This document is a research report submitted to the U.S. Department of Justice. This report has not been published by the Department. Opinions or points of view expressed are those of the author(s)
and do not necessarily reflect the official position or policies of the U.S. Department of Justice.

vi
if PSN had an impact on violent crime it should be apparent in comparing PSN target cities in high dosage jurisdictions to non-target cities and target cities in low dosage districts.
• Two of the cities that were included in the PSN case studies followed a Project Exile type approach that combined a significant increase in federal prosecution with an extensive media campaign communicating a deterrence and “costs of gun crime” theme. These were Montgomery in the Middle District of Alabama and Mobile in the Southern District of Alabama. Both experienced significant declines in gun crime compared to the trend in property crime. Mobile also experienced a decline in gunshot wound admissions to the trauma center (not measured in Montgomery). Both findings were consistent with PSN having an impact on gun crime.
• Five cities followed what was described as a strategic problem solving, multiple intervention strategy that roughly followed the model developed in Boston’s Ceasefire (a.k.a. Boston Gun Project) and the Strategic Approaches to Community Safety Initiative. These included Durham, Greensboro, and Winston-Salem (Middle District of North Carolina), Lowell (District of Massachusetts), and St. Louis (Eastern District of Missouri). All of these cities experienced a decline in gun crime following the implementation of PSN. In Durham the decline was not statistically significant. In St. Louis, where PSN was implemented in two particular target neighborhoods, there were also declines in contiguous and control neighborhoods thus making it impossible to attribute the decline to PSN. Additionally, two cities followed a similar model and were subject to rigorous evaluations by the local PSN research partner. Chicago implemented PSN in particular police districts. These target areas experienced very significant declines in gun crime compared to other Chicago neighborhoods and controlling for a number of other factors (Papachristos, Meares, and Fagan, 2007). Stockton implemented a similar strategic approach focused particularly on gang-related violence and witnessed a significant decline in gun crime when compared to a number of other California cities (Braga, 2008). Thus, this series of site specific studies yielded seven tests of the impact of PSN. All seven witnessed declines but one was not statistically significant and another was ambiguous given declines in the controls.
• The study of the trend in violent crime in all cities with a population of 100,000 or more was based on Hierarchical General Linear Modeling that allowed testing of the trend in violent crime while controlling for a variety of other factors known or believed to influence the level of violent crime. The first comparison examined cities designated as PSN target cities (N=82) with non-PSN target cities (N=170) and contrasting levels of implementation dosage. The prediction was that if PSN had an impact on violent crime it should be more apparent in target or treatment cities than non-target cities. The basic results indicated that PSN target cities experienced a 4.1 percent decline in violent crime compared to a 0.9 percent decline in non-target cities. Further, when the level of dosage was included in the multivariate models, it indicated that PSN target cities experienced a greater decline in violent crime as the level of PSN dosage increased, controlling for a number of other factors.
This document is a research report submitted to the U.S. Department of Justice. This report has not been published by the Department. Opinions or points of view expressed are those of the author(s)
and do not necessarily reflect the official position or policies of the U.S. Department of Justice.

vii
• The next stage in the analysis compared PSN target cities with non-target cities by the level of federal prosecution (as a specific type of dosage). The findings revealed that PSN target cities in high federal prosecution districts experienced a 13.1 percent decline in violent crime. In stark contrast, non-target cities in low federal prosecution districts experienced an increase of 7.8 percent in violent crime. The HGLM models revealed that target cities compared to non-target to target cities, in high prosecution compared to low prosecution districts, experienced a significant decline in violent crime, again controlling for other factors.
• Thus, in every model PSN target cities compared to non-target cities, and as the level of dosage increased, experienced a decline in violent crime. This was consistent with an interpretation of PSN having an impact on the trend in violent crime.
• A rebound in violent crime was observed in all cities in the 2004-2006 period. The increase was most evident in non-target, low dosage cities. PSN target cities in high prosecution districts were able to resist the rebound in 2005 and witnessed a much smaller increase in 2006 than other cities.
• The rebound also raised issues of the sustainability of multiple agency collaborative interventions such as PSN. Two of the cities that served as models for this type of strategic problem solving iniative, and the concept of “pulling levers” in particular, Boston and Indianapolis, experienced increases in homicide during the first decade of the 2000 period. Several of the cities that experienced declines in homicide following implementation of PSN later experienced increases in homicide. And, there was the above mentioned rebound in violent crime observed in 2004-2006. This may indicate a short-term effect of focused deterrence strategies such as those utilized in PSN. It may also indicate the challenge of retaining effective multi-agency collaborations and focused interventions. On the other hand, there are examples such as High Point, North Carolina that have sustained long-term reduction and extended the focused deterrence model to other crime types such as drug markets and robbery. Further, the finding that PSN target cities in high prosecution districts resisted the rebound and had the smallest increase, suggested the possibility that those jurisdictions able to continually re-focus efforts and maintain dosage and intensity could have long-term impact on violent crime.
Recommendations • The nation’s limitations in terms of crime information systems were apparent in
PSN. At the local level, although many police departments have developed very sophisticated crime information systems, in many jurisdictions it remains extremely difficult to analyze patterns of gun and gang crime. This was evident in the limited participation and poor quality of data reporting by PSN task forces.
• At a national level, the limitations were also obvious. The UCR crime reporting system is the only consistent national measure of crime at a city level. Yet, its limitations for research are significant. Foremost, there is no category of gun crime. Incident-based reporting systems and the Supplemental Homicide Reporting System do allow breakdown of gun crime, but the incident-based
This document is a research report submitted to the U.S. Department of Justice. This report has not been published by the Department. Opinions or points of view expressed are those of the author(s)
and do not necessarily reflect the official position or policies of the U.S. Department of Justice.

viii
system is not available in many jurisdictions and neither system is available for timely analysis. As DOJ increasingly emphasizes performance measures, and as policymakers seek more timely information about trends in crime and the impact of a program such as PSN, the limitations of existing crime information systems will serve as a source of continual frustration. In the information age, it seems realistic to expect that one could access trends in homicide on as “real-time” a basis as trends in consumer confidence, the consumer price index, or the cost of gasoline in markets across the country.
• One of the strengths of PSN was the flexibility that allowed PSN task forces to adapt the key components of PSN to the local context. The difference in levels and the nature of gun crime across the 50 states and across the nation’s cities are enormous and require local adaptation. Having said this, investment of resources such as those involved in PSN might benefit from the following suggestions:
o Invest in gun crime reduction based on levels of risk. There is enormous variation in levels of gun crime across the federal judicial districts, across cities, and within cities. Strategic investment of PSN-like resources in those jurisdictions with high levels of gun crime could yield significant benefits in terms of the reduction of homicide, gunshot victimization, incarceration, and enhanced community safety.
o Conduct needs and capacity assessment prior to investment. The patterns of implementation suggest that jurisdictions with human capital (experience in multi-agency collaboration) and information infrastructure were significantly more prepared to successfully implement PSN than were other jurisdictions. Needs and capacity assessment could distinguish between those districts where investment in research-based, collaborative problem solving crime reduction strategies are likely to “pay-off” and other jurisdictions that might benefit from investment in information infrastructure and/or collaborative network building.
o The results from the investigation, coupled with prior studies, suggest that this type of intervention holds considerable promise for reducing violent crime. Given the enormous human and fiscal costs of violent and gun related crime, these are important findings. However, the evaluation models too often are based on either single sites or on a population of cities that vary by dosage. Given limited resources, investment in crime control and prevention interventions that allow for systematic comparison of treatment and non-treatment sites is necessary for addressing the question of whether the strategy actually had an impact violent crime. For example, if funding exists for implementation in 10 jurisdictions, enormous value would accrue to creating a pool of 20 potential sites to allow systematic comparison of treatment and control sites. The control or comparison sites could transition to treatment sites in future funding cycles.
This document is a research report submitted to the U.S. Department of Justice. This report has not been published by the Department. Opinions or points of view expressed are those of the author(s)
and do not necessarily reflect the official position or policies of the U.S. Department of Justice.

ix
Contents Acknowledgements ........................................................................................................... ii Project Safe Neighborhoods Executive Summary ........................................................ iii List of Figures ................................................................................................................. xiii List of Tables .................................................................................................................. xiv Chapter One: The Design of the National Project Safe Neighborhoods Program ..... 1 Chapter Two: Strategic Problem Solving and Project Safe Neighborhoods ............... 6
PSN Building Blocks ...................................................................................................... 6 Project Exile................................................................................................................ 7 NYPD COMPSTAT ..................................................................................................... 7 Boston’s Ceasefire ...................................................................................................... 8 Strategic Approaches to Community Safety Initiative (SACSI) .................................. 9
Core Components of PSN ............................................................................................. 11 Partnerships .............................................................................................................. 11 Training..................................................................................................................... 12 Outreach ................................................................................................................... 12 Accountability ........................................................................................................... 13
Strategic Problem Solving Model ................................................................................. 14 Core Themes ................................................................................................................. 16
Focusing Resources .................................................................................................. 16 Using Research to Guide Action ............................................................................... 17 Expanding the Boundaries of Involvement ............................................................... 17
Strategic Interventions .................................................................................................. 19 Summary ....................................................................................................................... 22
Chapter Three: PSN Training and Technical Assistance: MSU’s Role .................... 24 Background and Initial Involvement ............................................................................ 24 PSN Curriculum Development ..................................................................................... 24 PSN Training ................................................................................................................ 25
Strategic Problem Solving ........................................................................................ 25 Advanced and Specialized Workshops ...................................................................... 27 Regional Training ..................................................................................................... 29 Peer to Peer Training and Technical Assistance ...................................................... 29
PSN Technical Assistance ............................................................................................ 30
This document is a research report submitted to the U.S. Department of Justice. This report has not been published by the Department. Opinions or points of view expressed are those of the author(s)
and do not necessarily reflect the official position or policies of the U.S. Department of Justice.

x
Conferences and Meetings ........................................................................................ 32 Focus Groups ............................................................................................................ 32 Telephone Contacts ................................................................................................... 33 Gun Tracing Workstations ........................................................................................ 33
Databases ...................................................................................................................... 34 Technical Assistance ................................................................................................. 34 City Violent Crime and Homicide Data .................................................................... 34
Development of Case Studies ....................................................................................... 35 Products..................................................................................................................... 36
PSN: Evolution to Gangs and Drug Markets ................................................................ 37 Chapter Four: Implementation of PSN Core Components ........................................ 41
Research Partner Survey ............................................................................................... 41 Semi-annual reports to the Attorney General ............................................................... 48 Data Quality Report ...................................................................................................... 57 Changes in Federal Prosecution of Gun Cases ............................................................. 61 Integration of PSN Research: Indicators of Success and Struggles .............................. 67
How helpful is data analysis? ................................................................................... 68 Ingredients of Research Integration and Research Environment ............................. 68 Summary ................................................................................................................... 71
Chapter Five: Predictors of PSN Implementation ...................................................... 72 Evaluation Mission: Theory and Questions .................................................................. 73
Evaluation Limitations .............................................................................................. 74 Defining PSN Implementation .................................................................................. 75 Data Sources ............................................................................................................. 76
Implementation Success: Constructing Measures ........................................................ 77 Partnerships .............................................................................................................. 77 Data-Driven Planning .............................................................................................. 77 Enhanced Federal Prosecution................................................................................. 78 Overall PSN Policy Implementation ......................................................................... 78
Patterns of Policy Implementation ................................................................................ 79 Factors in the External Environment ............................................................................ 82 A Risk Model of PSN Implementation ......................................................................... 83
Needs and Goals - Gun Crime .................................................................................. 84 Infrastructure ............................................................................................................ 84
This document is a research report submitted to the U.S. Department of Justice. This report has not been published by the Department. Opinions or points of view expressed are those of the author(s)
and do not necessarily reflect the official position or policies of the U.S. Department of Justice.

xi
Human Factors – Public and Political Attitudes ...................................................... 85 Resources .................................................................................................................. 85
Data Analysis ................................................................................................................ 85 Analysis of the Risk Model ........................................................................................... 87
Analysis of High and Low Information Technology Groups .................................... 88 Overall Implementation for High and Low Technology Groups .............................. 89
Discussion ..................................................................................................................... 90 Conclusion .................................................................................................................... 91
Chapter 6: Comprehensive Case Studies ...................................................................... 94 Project Exile-Strategy Sites .............................................................................................. 96
The Middle and Southern Districts of Alabama ........................................................... 96 Task Force Structure and Gun Case Screening ........................................................ 98 Communication Strategy ......................................................................................... 100
Evidence of Implementation—Outputs ....................................................................... 101 Evidence of Impact—Outcomes .............................................................................. 102 Challenges Encountered by PSN Task Forces ........................................................ 107 Summary ................................................................................................................. 108
Strategic Problem Solving/Pulling Levers Case Study Sites .......................................... 108 District of Nebraska, Middle District of North Carolina, Eastern District of Missouri, and District of Massachusetts ..................................................................................... 108
Context .................................................................................................................... 109 Development and Implementation .......................................................................... 110 Task Force Structure ............................................................................................... 111 Community Engagement and Media Campaign ..................................................... 113 Nature of the Gun Crime Problem .......................................................................... 114 Evidence of Implementation-Outputs ...................................................................... 115 Evidence of Impact-Outcomes ................................................................................ 118 Additional Findings from the Site Specific Case Studies ........................................ 125
Chapter Seven: Impact Analysis ................................................................................. 129 Analytic Framework ................................................................................................... 129
Data......................................................................................................................... 131 Dependent Variable ................................................................................................ 132 Independent Variables ............................................................................................ 133 PSN Indicators: Treatment and Dosage ................................................................. 134
Analytic Strategy ........................................................................................................ 138
This document is a research report submitted to the U.S. Department of Justice. This report has not been published by the Department. Opinions or points of view expressed are those of the author(s)
and do not necessarily reflect the official position or policies of the U.S. Department of Justice.

xii
Results – Treatment and Multiple Component Dosage .............................................. 140 HGLM Growth Curve Models – Treatment and Multiple Component Dosage ...... 143 Diagnostic Tests ...................................................................................................... 159
Discussion ................................................................................................................... 160 Limitations .................................................................................................................. 161
Chapter Eight: Key Findings, Research and Policy Considerations ....................... 167 Importance of Leadership ........................................................................................... 167 Importance of Focused Interventions.......................................................................... 170 The Role of Research and Research Integration ......................................................... 171 The Emergence of Gun Crime Intervention Strategies ............................................... 173 Integrating Strategies in Project Safe Neighborhoods ................................................ 174 Moving Towards Evidence-Based Practice to Reduce Gun Crime ............................ 177
Directed Police Patrol ............................................................................................ 177 Project Exile............................................................................................................ 178 Strategic Problem Solving/Pulling Levers .............................................................. 179
Summary ..................................................................................................................... 182 Cross-City Comparison ............................................................................................... 183 Research Implications ................................................................................................. 185 Policy Considerations ................................................................................................. 187
References ...................................................................................................................... 191 Appendix A ........................................................................................................................... Appendix B ........................................................................................................................... Appendix C ........................................................................................................................... Appendix D ........................................................................................................................... Appendix E ........................................................................................................................... Endnotes…………………………………………………………………………………...
This document is a research report submitted to the U.S. Department of Justice. This report has not been published by the Department. Opinions or points of view expressed are those of the author(s)
and do not necessarily reflect the official position or policies of the U.S. Department of Justice.

xiii
List of Figures Figure 1: PSN Strategic Problem Solving Model ............................................................. 15 Figure 2: Data rating description ...................................................................................... 58 Figure 3: Data sources used and helpfulness of data analysis .......................................... 70 Figure 4: Percentage of data sources used and research partner attendance ..................... 71 Figure 5: Policy Implementation Measures ..................................................................... 76 Figure 6: Correlation among Implementation Elements ................................................... 82 Figure 7: Comparison of Implementation Levels of Districts in the Lowest Third of Data-
Driven Implementation on Engaging Partners and Enhanced Prosecution ................ 83 Figure 8: Comparison of Low and High Information Technology Districts on PSN
Implementation Levels................................................................................................ 90 Figure 9: Violent Crime Trends in Large U.S. Cities between 2000 and 2006 (Violent
Crime Rate per 100,000) ........................................................................................... 141 Figure 10: Violent Crime Trends in U.S. Cities by Dosage Designation ....................... 142 Figure 11: Violent Crime Changes in PSN Target Sites Grouped by Prosecution Ranking
................................................................................................................................... 152 Figure 12: Violent Crime Changes in Non-PSN Target Sites Grouped by Prosecution
Ranking ..................................................................................................................... 154 Figure 13: Studies Suggestive of Focused Deterrence Impact on Gun Crime .............. 183
This document is a research report submitted to the U.S. Department of Justice. This report has not been published by the Department. Opinions or points of view expressed are those of the author(s)
and do not necessarily reflect the official position or policies of the U.S. Department of Justice.

xiv
List of Tables
Table 1: PSN Foundations ................................................................................................ 14 Table 2: Strategic Problem Solving .................................................................................. 22 Table 3: Strategic Problem Solving Trainings .................................................................. 26 Table 4: Specialized Workshops ....................................................................................... 28 Table 5: Case Studies ........................................................................................................ 35 Table 6: MSU PSN Products ............................................................................................ 36 Table 7: CAGI and DMI cities.......................................................................................... 38 Table 8: Research Partners’ Reports of Role of Research in PSN ................................... 44 Table 9: Potential barriers to research driving problem solving ....................................... 47 Table 10: Task Force Organizations ................................................................................. 51 Table 11: PSN Task Force/Steering Committee meeting frequency ................................ 52 Table 12: Active federal programs in the district ............................................................. 52 Table 13: Data sources used to conduct nature and scope of gun violence assessment ... 53 Table 14: Key elements of the gun violence problem in [your] district ........................... 54 Table 15: Enforcement/deterrence focused strategies ...................................................... 55 Table 16: Prevention Strategies ........................................................................................ 56 Table 17: Data submission profile .................................................................................... 60 Table 18: Data submission profile- categories collapsed ................................................. 60 Table 19: Federal Firearms Cases (U.S. Code 922, 924), Defendant Filings, Ranked by
Percent Change 2000-2004 ......................................................................................... 62 Table 20: Federal Firearms Cases (U.S. Code 922, 924), Defendant Filings, per 100,000
population, Ranked by Rate in 2004 ........................................................................... 65 Table 21: Data helpfulness in focusing the task force on gun violence ............................ 68 Table 22: Research partner attendance and data helpfulness perceptions ....................... 69 Table 23: Correlations among PSN Policy Elements ....................................................... 80 Table 24: Cross tabulation of Implementation Elements .................................................. 81 Table 25: Descriptive Statistics for Predictor Variables ................................................... 86 Table 26: Bivariate Correlations: Implementation to Predictor Variable and Among
Predictor Variables ...................................................................................................... 87 Table 27: Implementation Regressed on the Risk Model ................................................. 88 Table 28: Aggravated Assault and Murder Rates, 2001 ................................................... 98 Table 29: Gun crime trend- Cities of Montgomery and Mobile ..................................... 103 Table 30: Montgomery Time Series Analysis-- May 2002 Intervention Date ............... 104 Table 31: Mobile Time Series Analysis—(through August 1, 2006) ............................. 106 Table 32: Aggravated Assault and Murder Rates, 2001 ................................................. 110 Table 33: Time Series Analysis – February 2003 Intervention Date.............................. 119 Table 34: Total monthly firearm offenses, pre-PSN and post-PSN intervention for three
target cities ................................................................................................................ 120 Table 35: Comparison of Pre- to Post-Intervention Change in Aggravated Assaults with a
Firearm in Select Massachusetts Cities ..................................................................... 122 Table 36: Comparison of Pre- to Post-Intervention Change in Violent Crime Incidents 123 Table 37: Descriptive Statistics ...................................................................................... 144 Table 38: Conditional Random-Effects Poisson Model of Violent Crime Rates in Large
U.S. Cities between 2000 and 2006 (Examining PSN Dosage) ............................... 146
This document is a research report submitted to the U.S. Department of Justice. This report has not been published by the Department. Opinions or points of view expressed are those of the author(s)
and do not necessarily reflect the official position or policies of the U.S. Department of Justice.

xv
Table 39: Conditional Random-Effects Poisson Model of Violent Crime Rates in Large U.S. Cities between 2000 and 2006 (Examining PSN Treatment*Time) ................. 149
Table 40: Descriptive Statistics for Target City Prosecution Analyses .......................... 156 Table 41: Conditional Random Effects Model Examining Changes in Federal Prosecution
across PSN Target Cities .......................................................................................... 157 Table 42: Summary of Changes in Violent Crime in Target and Non-Target Cities, by
Level of Federal Prosecution .................................................................................... 185
This document is a research report submitted to the U.S. Department of Justice. This report has not been published by the Department. Opinions or points of view expressed are those of the author(s)
and do not necessarily reflect the official position or policies of the U.S. Department of Justice.

1
Chapter One: The Design of the National Project Safe Neighborhoods Program
Launched in January of 2001 as one of the Department of Justice’s major
initiatives, Project Safe Neighborhoods (PSN) represented a comprehensive program to
reduce gun violence at the local level. It was implemented in all 94 U.S. Attorney
districts nationwide to respond to firearms crime problems in each respective district. An
estimated three billion dollars has been allocated through Fiscal Year 2008 to fund local
and Federal prosecutors; provide resources for law enforcement; support research and
community outreach partners; fund a national media campaign; and provide training,
technical assistance, and research functions for the initiative (Office of Management and
Budget). Based on what were viewed as successful approaches utilized in the Boston
Ceasefire project, the ten-city Strategic Approaches to Community Safety Initiative
(SACSI), and Richmond’s Project Exile, PSN was designed as a collaborative problem
solving initiative utilizing a strategic research-based model to reduce firearms violence
through enforcement, deterrence, and prevention.
In each U.S. Attorney District a PSN task force was assembled that included law
enforcement and criminal justice agencies at all levels of government. In many
jurisdictions the task force also included local government, schools, social service
agencies, and other organizations interested in reducing gun violence. The task also
included a local research partner who was to collect data to help identify and understand
the precise gun violence problem in the particular district. Together these partners were to
develop strategies specifically designed to target the problem as defined by the research.
The research partner also was intended to monitor the operational agency implementation
of the strategies and provide feedback to help refine and improve the program. Although
This document is a research report submitted to the U.S. Department of Justice. This report has not been published by the Department. Opinions or points of view expressed are those of the author(s)
and do not necessarily reflect the official position or policies of the U.S. Department of Justice.

2
each PSN district had the flexibility to create their own sets of strategies, they were
encouraged through PSN training to include offender deterrence meetings, intensive
prosecution of violent gun criminals, interruption of the supply of illegal guns to
criminals, and support services to encourage alternative behaviors among at-risk offender
populations. Finally, the researcher was to provide an assessment of the impact of the
strategies on the gun violence problem targeted.
The PSN program also involved outreach to and involvement of the community in
these interventions and a media campaign to raise public awareness of the dangers of
firearms violence. Funds were provided to contract with a local outreach technical
assistance provider and a national media campaign was supported by the Department of
Justice.
Five official core components comprised the design of the PSN initiative:
1) Partnerships. As mentioned above, the PSN initiative in each district was a
collaborative program conducted by a multi-agency partnership, involving law
enforcement/criminal justice agencies at all levels, city and social service agencies,
private sector groups (such as businesses, clergy, hospitals), community organizations,
and researchers.
2) Strategic Plan. PSN was intended to be a problem solving program, based on
a strategic planning process in which agencies define the specific components of their
gun violence problem with the help of research data and design focused strategies to
target these problem components through enforcement/prosecution, deterrence, and
prevention. As the practitioner agencies in the partnership implemented the selected
strategies, the research partner was to monitor the process and provide feedback to the
This document is a research report submitted to the U.S. Department of Justice. This report has not been published by the Department. Opinions or points of view expressed are those of the author(s)
and do not necessarily reflect the official position or policies of the U.S. Department of Justice.

3
collaborative so that strategies could be modified or refined if they were not meeting their
objectives.
3) Training. A core component of PSN was the provision of extensive training
opportunities to local district task forces to assist them in the effective implementation of
all aspects of the program. Included were specific training programs in strategic problem
solving, in firearms law enforcement, in gun prosecution, and in community outreach, as
well as sessions addressing research and other special issues and a series of national
training conferences. In addition, specialized technical assistance (TA) for individual
districts was available upon request through a national network of TA providers
(www.psn.gov).
4) Outreach. This PSN component involved both local and national outreach
efforts. Locally, districts were encouraged to send a deterrent message to would-be
criminals stressing “hard time for gun crime”, with simultaneous promotion of
educational, recreational, treatment and employment alternatives. This component was
supported by funding that was provided to each district to secure the services of an
outreach and media resource provider. At a national level, the PSN program partnered
with the National Crime Prevention Council and Ad Council to conduct a public service
advertising campaign against gun violence, including radio and TV spots, educational
and prevention materials, press releases, and news articles.
5) Accountability. Each of the districts was required to provide an accounting of
their activities through bi-annual reports of their activities, bi-annual reporting of crime,
gun violence and related data, and through local monitoring and evaluation by its
research partner. Similar to the funding for outreach coordinators, each district was
This document is a research report submitted to the U.S. Department of Justice. This report has not been published by the Department. Opinions or points of view expressed are those of the author(s)
and do not necessarily reflect the official position or policies of the U.S. Department of Justice.

4
provided with $150,000 to provide a three-year grant to a research partner to work with
the task force on problem analysis, program monitoring, and evaluation. Each district
secured the services of a research partner making this a very significant investment in
research to support problem solving and evaluation.
Nationally, Michigan State University (MSU) was funded to examine the
effectiveness of various types of PSN methods and strategies and to assess the overall
PSN collaborative strategic problem solving approach to reducing gun violence at the
local level. The MSU team also provided training and technical assistance to the task
forces to support the implementation of the strategic problem solving model and the
integration of research into the task force process. The MSU team consisted of faculty,
research specialists, graduate students, and a network of researchers experienced in
collaborative research with criminal justice agencies.
The following represents the final project report of the MSU project. In the
following chapter, the logic model of the PSN intervention based on promising criminal
justice interventions and supported by strategic problem solving is described. Chapter
Three describes the range of MSU activities and provides an overview of the data sources
utilized in the study of PSN. The next two chapters focus on implementation of core
components of PSN. Chapter Four presents data on implementation from self reports by
PSN Project Coordinators and Research Partners, as well as patterns that emerge from
data submitted by PSN task forces and federal prosecution data. The next chapter utilizes
these data sources to analyze the different patterns of implementation that emerged across
the U.S. Attorney’s Offices and their PSN task forces. Chapter Six reviews key strategic
interventions that emerged in various PSN sites and summarizes findings from a series of
This document is a research report submitted to the U.S. Department of Justice. This report has not been published by the Department. Opinions or points of view expressed are those of the author(s)
and do not necessarily reflect the official position or policies of the U.S. Department of Justice.

5
case studies of PSN task forces. Chapter Seven presents research on the impact of PSN
on violent crime. The report concludes with a summary of findings, research
implications, and policy considerations.
This document is a research report submitted to the U.S. Department of Justice. This report has not been published by the Department. Opinions or points of view expressed are those of the author(s)
and do not necessarily reflect the official position or policies of the U.S. Department of Justice.

6
Chapter Two: Strategic Problem Solving and Project Safe Neighborhoods
The last decade of the 20th Century witnessed significant declines in the rate of
crime in the United States. This was true for most types of crime, including homicide
and serious violent crime.1 Despite these declines, the level of gun crime in the United
States remains higher than that experienced in other western democracies and is a source
of untold tragedy for families and communities.2 Given this context, in 2001 the Bush
Administration made the reduction of gun crime one of the two major priorities of the
U.S. Department of Justice (DOJ), along with defeating terrorism and enhancing
homeland security.
The vehicle for translating this goal into action was Project Safe Neighborhoods
(PSN). PSN was intended to represent a commitment to gun crime reduction through a
network of local partnerships coordinated through the nation’s 94 United States
Attorneys Offices. A key component of the PSN strategy was the increased federal
prosecution of gun offenders but with a recognition that increased prosecution was likely
to have the greatest impact if coupled with strategic problem solving at a local level and
communication strategies targeted at both offenders and the general population. With this
recognition, PSN expanded from a purely prosecution-based initiative to a strategy based
on a comprehensive, coordinated, data-driven, and community-based approach.
PSN Building Blocks
The PSN initiative built on a number of promising crime reduction programs that
emerged during the 1990s. These programs included Richmond’s Project Exile, the New
York Police Department’s COMPSTAT Program, the Boston Ceasefire Program, DOJ’s
Strategic Approaches to Community Safety Initiative, Bureau of Alcohol, Tobacco,
This document is a research report submitted to the U.S. Department of Justice. This report has not been published by the Department. Opinions or points of view expressed are those of the author(s)
and do not necessarily reflect the official position or policies of the U.S. Department of Justice.

7
Firearms and Explosives (ATF) illegal firearm market reduction strategies, Weed and
Seed, and similar initiatives.
Project Exile
Richmond, Virginia had long experienced high levels of homicide and gun
assault. Much of this violence was perpetrated by chronic offenders with prior felony
convictions. In the late 1990s, then Managing Assistant U.S. Attorney James Comey
decided that these levels of violence were unacceptable and that the full force of federal
prosecution would be brought to bear against prior felons possessing or using firearms.
Federal prosecutions of gun crime increased significantly. Additionally, the U.S.
Attorney’s Office worked with a coalition of local law enforcement, local government,
and businesses to launch a high profile media campaign to communicate a message that
the illegal possession or illegal use of a gun would result in severe federal sanctions.
Following the implementation of Exile, homicide levels in Richmond declined
significantly from their peak levels.3
NYPD COMPSTAT
During the early 1990s, the New York Police Department gained the attention of
police leaders and scholars through the implementation of a crime analysis and
managerial accountability program known as COMPSTAT (“compare statistics”).4
Regular meetings of the police command staff, area commanders, special units, and
prosecutors were convened to review current crime trends, to develop responses to crime
problems, and to hold commanders accountable for the level and trend in crime in their
precincts. Although the link between COMPSTAT and crime reduction has been
debated, the dramatic decline of crime in New York City throughout the 1990s has led
This document is a research report submitted to the U.S. Department of Justice. This report has not been published by the Department. Opinions or points of view expressed are those of the author(s)
and do not necessarily reflect the official position or policies of the U.S. Department of Justice.

8
many to a greater acceptance of the value of timely crime analysis and to the idea that the
police can influence levels of crime (Silverman, 2006; Weisburd, Mastrofski, Willis, and
Greenspand, 2006).
Boston’s Ceasefire
Boston’s Ceasefire Program, also referred to as the Boston Gun Project, was a
strategic problem solving initiative intended to reduce the high level of youth gun
violence in the city. Ceasefire was initiated by a multi-agency working group involving
the U.S. Attorney’s Office, local prosecutors, the Boston Police Department, probation,
youth service workers, and a team of researchers from Harvard’s Kennedy School of
Government. The problem analysis revealed that youth violence was driven by a
relatively small number of chronic offenders involved in networks of known offenders.
The strategy that emerged was a deterrence-based model whereby the threat of federal
prosecution was directly communicated to these groups of known offenders. Following
crack-downs on several of the most violent groups, and ongoing communication through
meetings with probationers and parolees connected to these offending networks, youth
violence declined dramatically. Indeed, Boston went two and one-half years without a
youth homicide and youth gun violence declined by approximately 60 percent.5
The Boston Project was characterized by several distinctive features. First, a
small working group was convened from multiple agencies and linked to a research team
that conducted systematic analysis of the firearms crime problem. Second, the deterrence
threat was coupled with attempts to link potential offenders to legitimate services offered
by youth service workers, traditional service providers (e.g., jobs, education, drug
treatment), and non-traditional providers including the faith community. Third, several
This document is a research report submitted to the U.S. Department of Justice. This report has not been published by the Department. Opinions or points of view expressed are those of the author(s)
and do not necessarily reflect the official position or policies of the U.S. Department of Justice.

9
distinctive strategies emerged to communicate the deterrence message to potential
offenders. These included offender notification meetings and police-probation teams
conducting visits to high-risk offenders (Operation Nightlife). Fourth, ATF and the
Boston Police Department developed supply-side strategies to disrupt illegal gun
markets.6 Finally, like Project Exile, the U.S. Attorney’s Office played a key leadership
role by convening local-state-federal resources and bringing the threat of federal
prosecution to the issue of illegal gun possession and use.
Strategic Approaches to Community Safety Initiative (SACSI)
Building on the Richmond, New York City, and particularly the Boston project,
DOJ developed the Strategic Approaches to Community Safety Initiative (SACSI) in the
late 1990s.7 Federal support was provided to five initial cities (Indianapolis, IN,
Memphis, TN, New Haven, CT, Portland, OR, and Winston-Salem, NC) and a second set
of cities (Albuquerque, NM, Atlanta, GA, Detroit, MI, St. Louis, MO, and Rochester,
NY). The U.S. Attorneys were asked to convene multi-agency working groups. Local
research partners were asked to be part of the working groups to assist in problem solving
research including problem identification and analysis, development of crime reduction
strategies, and assessment of implementation and impact.
SACSI demonstrated the utility of using strategic problem solving to tailor a
federal initiative to local contexts that varied considerably across the 10 SACSI sites. It
also provided the opportunity for further testing of problem solving approaches and
strategies initially developed in Boston’s Ceasefire. Thus, for example, a number of
SACSI jurisdictions found value in using systematic reviews of homicide incidents and
gun assaults to uncover patterns of offenders, victims, locations, and network connections
This document is a research report submitted to the U.S. Department of Justice. This report has not been published by the Department. Opinions or points of view expressed are those of the author(s)
and do not necessarily reflect the official position or policies of the U.S. Department of Justice.

10
that could then suggest intervention strategies. Many of the SACSI sites implemented
offender notification meetings to communicate the deterrence message and offer the
opportunity for linkage to legitimate services. The offender notification meetings were
coupled with Richmond-style billboards, bus posters, and public service advertisements
warning against illegal gun possession and use. Similarly, many of the SACSI sites
adapted the Nightlife strategy of pairing police and probation teams to enhance
supervision of high-risk offenders and increase the credibility of the deterrence message.
The SACSI process also allowed for cross-site learning among the 10
jurisdictions. As a result, many of these communities developed “Smart Prosecution”
processes whereby federal and local prosecutors, ATF agents and local police,
systematically reviewed all gun cases to decide on whether a case could most effectively
be prosecuted at the state or federal level. Additionally, the processes helped to identify
and fix system gaps that had previously allowed gun cases to fall through the cracks and
avoid prosecution. Many of the jurisdictions developed lists of the most violent offenders
to increase officer safety, suggest targets for proactive investigation, and prioritize cases
for prosecution.
Several promising findings emerged from SACSI research reports at about the
same time that PSN was being developed. For example, Indianapolis experienced
significant reductions in homicide and gun violence similar to that witnessed in Boston.8
Winston-Salem saw continued reductions in youth violence and declines in youth
recidivism and Portland experienced a large reduction in drive-by shootings.9
Additionally, Memphis experienced declines in sexual assault, the target of its SACSI
program.10 Roehl and colleagues’ comparison of crime trends in the SACSI cities to
This document is a research report submitted to the U.S. Department of Justice. This report has not been published by the Department. Opinions or points of view expressed are those of the author(s)
and do not necessarily reflect the official position or policies of the U.S. Department of Justice.

11
comparable cities, suggests that declines in homicide and violent crime were more
pronounced in the SACSI sites.11 Consequently, the multi-agency, strategic problem-
solving model, as well as many of these strategic interventions, became components of
the PSN initiative, and were supported by training and technical assistance.
Core Components of PSN
The basic elements of this aggressive strategy to reduce gun crime were
operationalized by DOJ through five core components: partnerships, strategic planning,
training, outreach, and accountability.
Partnerships
The PSN program was intended to increase partnerships between federal, state,
and local law enforcement agencies through the formation of a local gun crime
enforcement task force. The PSN design recognized the limited role of federal
prosecutors in many aspects of local crime control and prevention and thus sought to
increase partnerships with many elements of the local community. Coordinated by the
U.S. Attorney’s Office, the PSN task force typically included both federal and local
prosecutors, federal law enforcement agencies (particularly ATF and U.S. Marshals),
local and state law enforcement agencies, and probation and parole. PSN coordinators
were also been encouraged to consider inclusion of local government leaders, social
service providers, neighborhood leaders, members of the faith community, business
leaders and health care providers.
Strategic Planning
Recognizing that crime problems, including gun crime, vary from community to
community across the United States, that state laws addressing gun crime vary
This document is a research report submitted to the U.S. Department of Justice. This report has not been published by the Department. Opinions or points of view expressed are those of the author(s)
and do not necessarily reflect the official position or policies of the U.S. Department of Justice.

12
considerably, and that local and state resources vary across the federal judicial districts
covered by U.S. Attorney’s Offices, the PSN program also included a commitment to
strategic planning whereby the federal PSN program would be tailored to local context.
Specifically, PSN provided resources for the inclusion of a local research partner who
would work with the PSN task force to analyze the local gun crime problem and to share
the findings with the task force for the development of a proactive plan for gun crime
reduction. The inclusion of the research partner was also intended to assist in ongoing
assessment in order to provide feedback to the task force.
Training
PSN has involved a significant commitment of resources to support training. This
program has included training provided to law enforcement agencies on topics including
gun crime investigations, gun crime identification and tracing, and related issues.
Training on effective prosecution of gun cases has been provided to state and local
prosecutors. Additional training has focused on strategic problem solving and
community outreach and engagement. DOJ estimates that by July 2005, nearly 17,000
individuals had attended a PSN-related training program. 12
Outreach The architects of PSN within DOJ also recognized that increased sanctions would
have the most impact if accompanied with a media campaign to communicate the
message of the threat of federal prosecution for illegal possession and use of a gun.
Consequently, resources were provided to all PSN task forces to work with a media
partner to devise strategies for communicating this message to both potential offenders
and to the community at large. This outreach effort was also supported at the national
level by the creation and distribution of Public Service Announcements and materials
This document is a research report submitted to the U.S. Department of Justice. This report has not been published by the Department. Opinions or points of view expressed are those of the author(s)
and do not necessarily reflect the official position or policies of the U.S. Department of Justice.

13
(ads, posters). These materials are direct mailed to media outlets and are also available to
local PSN task forces.13
“… the genius of Project Safe Neighborhoods is the marketing of our product …. Our product is fear in the hearts of the criminal…. If gun carrying is a big enough liability we can change the minds of would be gun carrying thugs.”
Deputy Attorney General James Comey, PSN National Conference, June 16, 2004.
The outreach component was also intended to support the development of
prevention and intervention components. Since FY 2003 PSN provided block grant
funding to the local PSN partnerships that could be used to support a variety of initiatives
including prevention and intervention. Many were built on existing programs such as
school-based prevention, Weed and Seed, or juvenile court intervention programs.
Accountability
The leadership of the PSN initiative at DOJ emphasized that PSN would focus on
outcomes – i.e., reduced gun crime -- as opposed to a mere focus on outputs such as
arrests and cases prosecuted. That is, PSN would be measured by the reduction in gun
crime. This accountability component was linked to strategic planning whereby PSN
task forces, working with their local research partner, were asked to report levels of crime
over time within targeted problems and/or targeted areas.
The basic elements and DOJ’s five core components of PSN are illustrated in
Table 1.
This document is a research report submitted to the U.S. Department of Justice. This report has not been published by the Department. Opinions or points of view expressed are those of the author(s)
and do not necessarily reflect the official position or policies of the U.S. Department of Justice.

14
Table 1: PSN Foundations
Basic Elements DOJ’s Core Components
• Increased Federal Prosecution
• Partnerships -Local, state, federal coordinated enforcement -Community prevention and intervention -Research Partner • Strategic Planning
• Focused Deterrence Strategies
-Data driven proactive plan • Training
-Enforcement training -Prosecution training -Strategic problem solving -Outreach and community engagement
• Communication Strategy • Outreach -Communicate deterrence message -Prevention and Intervention • Accountability
-Meaningful implementation -Impact on gun crime
Strategic Problem Solving Model
The Project Exile components of PSN, increased federal prosecution and
communication strategy, coupled with the Boston Ceasefire focused deterrence approach,
were further developed by the strategic problem-solving model developed in the SACSI
program. Specifically, the core components and essential elements of PSN were given
structure through a strategic problem solving process and a set of strategic approaches
and interventions developed in Boston, the SACSI sites, and similar crime reduction
efforts.
The strategic problem-solving model (see Figure Two) was based on systematic
analysis of the local gun crime problem. Specifically, crime analysis would be used to
identify the geographic patterns of gun crime across a PSN district and within specific
jurisdictions of the district. The analysis should also uncover patterns such as linkages to
drug sales and distribution, gangs, chronic offenders, domestic violence, illegal gun sales,
This document is a research report submitted to the U.S. Department of Justice. This report has not been published by the Department. Opinions or points of view expressed are those of the author(s)
and do not necessarily reflect the official position or policies of the U.S. Department of Justice.

15
and related patterns of people, place, and context. On the basis of this analysis, specific
strategies would be developed and implemented to address these patterns. As strategies
are implemented, the research partner would monitor the level of intervention (dosage) as
well as assess evidence of impact. This information could be shared with the task force
to allow for revision or modification of strategy. The process was intended to be
dynamic and ongoing, allowing for continual revision with the ultimate goal of reducing
gun crime. By the end of FY2003, 92 of the 93 PSN task forces had received training on
strategic problem solving and all task forces were working with a research partner.14
Figure 1: PSN Strategic Problem Solving Model
Problem Analysis
Strategies
Implementation
Assessment and Feedback
PSN – TFPartnerships
This document is a research report submitted to the U.S. Department of Justice. This report has not been published by the Department. Opinions or points of view expressed are those of the author(s)
and do not necessarily reflect the official position or policies of the U.S. Department of Justice.

16
Core Themes
The strategic problem-solving model, which was presented to PSN task members
in a series of trainings, was also based on a set of core themes. These include focusing
resources, using research to help guide action, and expanding the boundaries of
involvement.
Focusing Resources
Despite the infusion of significant resources to address gun crime, most
jurisdictions across the United States still face too many problem locations, gun
offenders, probationers and parolees, outstanding warrants, and former inmates returning
to the community, to address solely through the PSN program. Thus, a core theme of the
strategic problem-solving model was to maximize the impact of interventions (e.g.,
increased prosecution, media campaign, probation/parole supervision) by focusing on the
most serious elements of the local gun crime problem (people, places and things). Thus,
although it may be impossible to increase the supervision of all probationers with a
background of firearms possession, it may be possible to identify those suspected to be
involved in high-risk activities (gang networks, drug sales) and subject this subgroup of
probationers to police-probation home visits. Although PSN was designed before the
publication of the influential National Academies of Science report on the effectiveness
and fairness of policing, the model was very consistent with the key finding of this report
that the most effective efforts to reduce crime are those that are most focused and tailored
to the problem (National Research Council, 2005).
The notion of focusing resources also included attention to recurring problems
that may be lost in the routine processing of cases.15 Thus, in a jurisdiction where gun
This document is a research report submitted to the U.S. Department of Justice. This report has not been published by the Department. Opinions or points of view expressed are those of the author(s)
and do not necessarily reflect the official position or policies of the U.S. Department of Justice.

17
cases not involving actual violence were found to be routinely dismissed, revised
procedures that ensure that every case involving a firearm receives particular attention
from police and prosecutors may be an important “system-fix” that can change the
message sent to offenders about illegal gun possession.
Using Research to Guide Action
A core ingredient of focusing resources was to use data to identify the people,
places, and things driving gun crime at the local level. Experience has indicated that at a
certain level there are common elements of much gun violence. Particularly in the
nation’s urban areas, it tends to involve young men, with offenders and victims often
sharing extensive prior histories in the justice system, and to be concentrated in particular
neighborhoods. These basic patterns, when assessed by the local task force, can help to
begin to focus PSN resources. Beyond these patterns, however, there tends to be
variation across communities along a number of dimensions such as the link to drug
trafficking, the tie to gangs or networks of offenders, the nature of the illegal gun market,
and particularly in rural areas, the tie to domestic violence. Thus, by involving a research
partner with the task force, PSN was geared toward identifying these patterns to focus
suppression (law enforcement, prosecution), intervention, and prevention resources.
The research partner, as mentioned above, was also intended to monitor
implementation of PSN and provide continual feedback to the task force to support
ongoing revision of strategies.
Expanding the Boundaries of Involvement
As demonstrated in Figure Two, the partnership component of PSN was also a
core component of the strategic problem-solving model. At a minimal level, the U.S.
This document is a research report submitted to the U.S. Department of Justice. This report has not been published by the Department. Opinions or points of view expressed are those of the author(s)
and do not necessarily reflect the official position or policies of the U.S. Department of Justice.

18
Attorney’s Office was dependent on local, state, and federal law enforcement agencies to
bring gun cases for federal prosecution. The strategic problem-solving model also
suggested that the inclusion of other criminal justice system partners could further
maximize the impact of interventions. Thus, inclusion of the U.S. Marshal and federal-
local fugitive task forces could provide a vehicle for strategic warrant service on
offenders thought to be at high-risk for gun crime. Similarly, the inclusion of probation
and parole officers might yield police-probation-parole home visits to high-risk
probationers and parolees to discourage the illegal possession of firearms. In both
examples, the notion was that increased federal prosecution of gun crime offenders may
have greater impact if part of a proactive, comprehensive strategy focused on the people
and places driving gun crime at the local level. Specifically, increased prosecution
coupled with multiple strategies to communicate to potential offenders the increased
certainty and severity for illegal possession and use of guns was central to the focused
deterrence strategy.
Similarly, inclusion of community partners, service providers, the faith
community, and other local partners was intended to provide additional resources for the
development of prevention and intervention programs geared toward reducing gun crime.
Community based prevention programs aimed at the children or younger siblings of gun
offenders could potentially yield long-term prevention benefits. Faith-based or victim
advocate intervention with shooting victims were hoped to prevent retaliation. Ex-
offender mentoring and job placement programs could provide important resources for
offenders returning to the community from prison. The value of the strategic model was
This document is a research report submitted to the U.S. Department of Justice. This report has not been published by the Department. Opinions or points of view expressed are those of the author(s)
and do not necessarily reflect the official position or policies of the U.S. Department of Justice.

19
that limited resources could most effectively be targeted to the critical components of gun
violence in the community.
Finally, the inclusion of community members and community leaders was seen as
crucial to establishing legitimacy and support for PSN. There was a recognition that
aggressive prosecution of gun crime offenders was likely to have a differential impact on
particular communities. This was particularly true of urban, minority neighborhoods that
have been most victimized by gun crime. Focusing resources on the key people and
places driving gun crime would disproportionately affect these neighborhoods.
Demonstrating that the focus was data-driven based on levels of gun crime victimization,
that prevention and intervention strategies would accompany aggressive prosecution, and
that community leaders would be included in PSN, were suggested as critical steps in
building community support.
Strategic Interventions
Building on the core components of PSN, as well as the strategic problem-solving
model, a series of strategic practices and interventions emerged in PSN sites across the
country (see Figure Three). These were drawn from the experience in Boston,
Richmond, and the SACSI sites. Not all have been utilized in all PSN sites, and those
that were implemented were adapted to fit local context. Yet, these strategic
interventions and practices were utilized by a number of PSN task forces with promising
results. The strategies are described in more detail in Chapter Six.
The strategies included incident reviews whereby police officers, investigators,
and special unit personnel (e.g., gangs, narcotics), and often prosecutors and
probation/parole officers, came together and systematically reviews homicides and
This document is a research report submitted to the U.S. Department of Justice. This report has not been published by the Department. Opinions or points of view expressed are those of the author(s)
and do not necessarily reflect the official position or policies of the U.S. Department of Justice.

20
shootings to better understand the dynamics driving gun violence in the local jurisdiction.
The goal was to generate both strategic intelligence on the people, places, and contexts
generating gun violence, as well as tactical intelligence that could lead to enforcement,
intervention, and prevention actions.
A second strategy employed in many jurisdictions was the development of a
chronic violent offender list identifying individuals believed to be at greatest risk of
committing violent gun crime. These individuals became the focus of investigations and
the information was shared with law enforcement and prosecutors with the goals of
increasing officer safety and ensuring that these individuals not “slip through the cracks”
of the justice system if arrested.
A strategy derived from Boston Ceasefire and employed in many SACSI sites was
the use of offender notification meetings in which at-risk probationers and parolees, often
with network or gang affiliations, heard directly from justice officials about the renewed
focus on gun crime and the commitment to aggressive prosecution for the illegal
possession and use of a gun. The deterrence message was coupled with offers of
assistance and social support.
Given the threat of federal prosecution communicated in offender notification
meetings and in media campaigns, as well as the PSN DOJ commitment to increasing the
level of federal prosecution for gun crime, the task forces needed to develop mechanisms
to bring gun cases to the U.S. Attorney’s Offices and to decide the appropriate venue for
prosecution (federal or local). In many jurisdictions, joint case screening processes were
developed whereby Assistant U.S. Attorneys, county or state’s attorneys (local
This document is a research report submitted to the U.S. Department of Justice. This report has not been published by the Department. Opinions or points of view expressed are those of the author(s)
and do not necessarily reflect the official position or policies of the U.S. Department of Justice.

21
prosecutors), ATF agents, and local police officers, jointly screened gun crime cases to
determine if the case should be prosecuted federally or locally.
In a number of jurisdictions these strategies were intended to be mutually
reinforcing. Thus, incident reviews were used to identify groups of chronic offenders
believed to be at-risk for being involved in violence as perpetrators or victims who could
then be called in to an offender notification meeting. Incident review information could
be combined with systematic analysis of arrest and conviction data to identify individuals
to be included on most violent offender lists. This information could then be used in case
screening decisions in terms of prioritizing the most serious and chronic violent offenders
for aggressive federal prosecution. The results of federal prosecution could then be
communicated in offender notification meetings to reinforce the focused deterrence
message.
A number of jurisdictions also attempted to implement the focused deterrence and
incapacitation goals were through additional strategies. Building on “promising
practices” research evidence16, police departments in a number of jurisdictions utilized
directed police patrol in gun crime hot spots. ATF implemented supply side efforts, re-
entry programs were developed, police-probation-parole teams conducted home visits,
nuisance abatement teams targeted problem properties and a variety of prevention
activities were developed as part of PSN. These efforts were implemented with greatly
varying levels of intensity and greater and lesser integration with other PSN strategies.
At least at the logic model level, however, the notion of the strategic problem solving
process would suggest that they be focused on those people, places, and contexts that the
data analysis suggested as the sources of the gun crime problem.
This document is a research report submitted to the U.S. Department of Justice. This report has not been published by the Department. Opinions or points of view expressed are those of the author(s)
and do not necessarily reflect the official position or policies of the U.S. Department of Justice.

22
Table 2: Strategic Problem Solving
Core Themes • Focusing Resources • Strategic Practices and Interventions
-Maximizing the impact of interventions -Incident reviews -Targeting the most serious gun crime problems (people, places context)
-Chronic violent offender lists
-Addressing reoccurring problems -Gun case screening processes -Fixing system gaps - Offender notification meetings • Using Research to Help Guide Action -Data driven proactive plan
-Unpacking the local gun crime problem • Additional Strategic Interventions -Continually adjusting strategies -Illegal gun markets/supple side strategies • Expanding Boundaries of Involvement -Re-entry -Criminal justice system partners (local,
state, federal) -Police-Probation-Parole teams
-Community partners (expand resources, build legitimacy
-Directed patrol (gun crime hotspots)
-Problem properties/nuisance abatement -Prevention (street workers, school-based,
juvenile gun courts, etc. and Intervention
Summary
Project Safe Neighborhoods represents a major, multi-year, program designed
with the goal of reducing levels of gun crime and violence in the United States. The
multi-component nature of the initiative, coupled with the flexibility for local adaptation,
makes it difficult to describe the specific elements of the program. The MSU research
team’s involvement with a wide variety of officials at DOJ who were responsible for
designing and overseeing Project Safe Neighborhoods suggests that the architects of PSN
evolved in their thinking of what the program was. Initially, it appeared that the main
focus was on replicating Richmond’s Project Exile with a focus on increased federal
prosecution for gun crime and a media campaign intended to communicate a deterrent
message. Although this was one model that PSN task forces could follow, the program
was expanded to include the strategic problem solving model presented above. This was
evident through the funding provided to contract with local research partners as well as
This document is a research report submitted to the U.S. Department of Justice. This report has not been published by the Department. Opinions or points of view expressed are those of the author(s)
and do not necessarily reflect the official position or policies of the U.S. Department of Justice.

23
through the series of trainings provided to all PSN task forces on problem solving,
integration of research, and the types of strategic interventions represented in Table 2.
Although this reality makes a description of PSN challenging, and it creates enormous
challenges for evaluation of impact, it does account for the extreme variation across the
country in the nature of local gun crime problems and the inherently complex nature of
the criminal justice system response to gun crime in a federated governmental structure.
This document is a research report submitted to the U.S. Department of Justice. This report has not been published by the Department. Opinions or points of view expressed are those of the author(s)
and do not necessarily reflect the official position or policies of the U.S. Department of Justice.

24
Chapter Three: PSN Training and Technical Assistance: MSU’s Role Background and Initial Involvement
In 2002, a research team from Michigan State University (MSU) was awarded a
Cooperative Agreement from the National Institute of Justice (NIJ) to serve as the
national research partner for Project Safe Neighborhoods (PSN). The Cooperative
Agreement included three basic roles: develop a training program on strategic problem
solving and the integration of research to be delivered to all 94 PSN task forces; provide
ongoing technical assistance to the task forces on research, problem solving, and strategic
interventions as well as to the Firearms Enforcement Assistance Team (FEAT) at DOJ
that was responsible for the implementation of PSN; and conduct research on PSN.
The MSU team included faculty and staff who had been involved as local
researchers in the SACSI initiative (Indianapolis and Detroit). This capacity was
expanded by including nationally known researchers who had been involved in SACSI
and who brought expertise in problem solving, gun and gang violence. This national team
worked cooperatively with NIJ and the DOJ FEAT team on the training and technical
assistance programs. The research team from MSU with its cadre of researchers also
implemented a series of research activities that are described in subsequent chapters.
This chapter describes some of the key training and technical assistance activities
provided by the MSU team.
PSN Curriculum Development
The MSU team relied heavily on the SACSI program to develop the strategic
problem solving curriculum. Migima Designs, a small firm that had been enlisted to
document the SACSI process, was enlisted to work with MSU on a base strategic
This document is a research report submitted to the U.S. Department of Justice. This report has not been published by the Department. Opinions or points of view expressed are those of the author(s)
and do not necessarily reflect the official position or policies of the U.S. Department of Justice.

25
problem solving training curriculum. DOJ officials and subject matter experts were
convened for a systematic curriculum review that culminated with a pilot training.
Additional curricula were developed for subsequent trainings and workshops.
Specifically, continued collaboration with DOJ, PSN partners, and with consideration of
the district task force needs resulted in the creation of materials for a series of advanced
and specialized workshops offered on a regional basis.
PSN Training
Strategic Problem Solving
The first pilot PSN training occurred on September 30-October 1, 2002, in
Chantilly, VA. Six PSN districts were selected based on task force progress.
Representatives from the six districts, the FEAT team, and NIJ were tasked with
critiquing the training materials and format. Also in attendance to provide feedback were
members of 11 organizations17 that were part of DOJ’s national PSN training and
technical assistance team.
Following these revisions, the national training program on strategic problem
solving was implemented. Over the course of 12 months, from September 2002 to
September 2003, more than 900 participants from 92 PSN task forces participated in the
Strategic Problem Solving Training (SPST).18 Table 3 presents a comprehensive list of
the Strategic Problem Solving Trainings.
This document is a research report submitted to the U.S. Department of Justice. This report has not been published by the Department. Opinions or points of view expressed are those of the author(s)
and do not necessarily reflect the official position or policies of the U.S. Department of Justice.

26
Table 3: Strategic Problem Solving Trainings
Training #1: September 30-October 1, 2002 Chantilly, Virginia
Training #4: November 20-21, 2002 Destin, Florida
Training #7: February 26-27, 2003 Destin, Florida
Training #10: May 13-14, 2003, Philadelphia, Pennsylvania
1. Massachusetts 25. Arkansas- Eastern 49. Arkansas- Western 76. Alaska 2. Wisconsin- Eastern 26. Alabama- Middle 50. Florida- Middle 77. Delaware 3. Missouri- Eastern 27. Alabama- Southern 51. Georgia- Northern 78. Pennsylvania- Middle 4. Missouri- Western 28. Alabama- Northern 52. Michigan- Eastern 79. New York- Eastern 5. Virginia- Eastern 29. Florida- Southern 53. New York- Western 80. New York Northern 6. Pennsylvania- Eastern 30. Florida- Northern 54. North Carolina- Eastern 81. New York- Southern
31. Georgia- Middle 55. North Carolina- Middle 82. Tennessee- Western 32. Georgia- Southern 56. North Carolina- Western 33. Louisiana- Eastern 57. Puerto Rico 34. Mississippi- Southern 58. Rhode Island 35. Mississippi- Northern 36. Virgin Islands
Training #2: October 28-29, 2002 Chicago, Illinois
Training #5: December 12-13, 2002 Los Angeles, California
Training #8: March 26 -27, 2003 Chantilly, Virginia
Training #11: September 23-24, 2003 Las Vegas, Nevada
7. Illinois- Central 37. California- Central 59. Connecticut 83. Arizona 8. Illinois- Northern 38. California- Northern 60. District of Columbia 84. California- Eastern 9. Illinois- Southern 39. California- Southern 61. Maine 85. Idaho
10. Kansas 40. Ohio- Southern 62. Pennsylvania- Western 86. Louisiana- Middle 11. Kentucky- Eastern 41. Oklahoma- Eastern 63. Vermont 87. New Hampshire 12. Michigan- Western 42. Utah 64. West Virginia- Southern 88. North Dakota 13. Ohio- Northern 43. Washington- Eastern 89. South Carolina 14. Oklahoma- Western 44. Washington- Western 90. South Dakota 15. Tennessee- Eastern 91. Virginia- Western 16. Wisconsin- Western 92. West Virginia- Northern Training #3: October 30-31, 2002 Chicago, IL
Training #6: January 22-23, 2003 Plano, Texas
Training #9: April 28-29, 2003 Denver, Colorado
17. Iowa- Northern 45. Texas- Eastern 65. Colorado 18. Iowa- Southern 46. Texas- Northern 66. Guam 19. Indiana- Northern 47. Texas- Southern 67. Mariana Islands 20. Indiana- Southern 48. Texas- Western 68. Hawaii 21. Kentucky- Western 69. Louisiana- Western 22. Nebraska 70. Montana 23. Oregon 71. New Jersey 24. Tennessee- Middle 72. Nevada
73. New Mexico 74. Oklahoma- Northern 75. Wyoming
This document is a research report submitted to the U.S. Department of Justice. This report has not been published by the Department. Opinions or points of view expressed are those of the author(s)
and do not necessarily reflect the official position or policies of the U.S. Department of Justice.

27
Evaluation scores from the trainings were very positive. Overall scores
consistently fell in the Very Good (4) to Excellent (5) range. Attendees were particularly
positive about the opportunity to interact with their peers from other districts.
Advanced and Specialized Workshops
Given the enthusiastic response to the SPSTs, DOJ requested that MSU develop a
series of advanced and specialized workshops for PSN task forces. In September 2003, a
training development seminar was convened in Detroit. In attendance were the national
MSU research team and representatives from NIJ and the FEAT team. Based on MSU’s
outreach to PSN project coordinators (see subsequent discussion) and the reports of
project coordinators to DOJ, training needs and topics were identified and reviewed.
Workshop curricula were drafted and later developed by the MSU team. The curricula
was piloted and approved in December 2003, in San Diego. From January to June 2004,
three specialized workshops were delivered. Table 4 summarizes the specialized
workshops.
This document is a research report submitted to the U.S. Department of Justice. This report has not been published by the Department. Opinions or points of view expressed are those of the author(s)
and do not necessarily reflect the official position or policies of the U.S. Department of Justice.

28
Table 4: Specialized Workshops
Specialized Workshop for PSN Coordinators and Research Partners
Specialized Workshop for PSN Coordinators and Research Partners
Rural Focused Specialized Training Session for PSN Coordinators and Research Partners
Workshop #1 Workshop #2 Workshop #3 January 14-15, 2004
New Orleans, LA February 26-27, 2004
San Diego, CA April 28-29, 2004 San Antonio, TX
1. Alabama- Northern 2. Arkansas- Eastern 3. Arkansas- Western 4. California- Central 5. California- Northern 6. Delaware 7. Florida- Middle 8. Georgia- Middle 9. Georgia- Southern 10. Illinois- Northern 11. Iowa- Northern 12. Iowa- Southern 13. Louisiana- Eastern 14. Louisiana- Western 15. Massachusetts 16. Mississippi- Southern 17. Missouri- Eastern 18. Missouri- Western 19. District of Nebraska 20. North Carolina- Eastern 21. North Carolina- Middle 22. Ohio- Northern 23. South Carolina 24. Tennessee- Eastern 25. Texas- Northern 26. Virginia- Eastern 27. Wisconsin- Western
28. Arizona 29. California- Central 30. California- Southern 31. Colorado 32. Connecticut 33. Florida- Northern 34. Georgia- Northern 35. Illinois- Central 36. Illinois- Southern 37. Indiana- Northern 38. Indiana- Southern 39. Kentucky- Eastern 40. Maryland 41. Michigan- Eastern 42. Michigan- Western 43. New Jersey 44. New Mexico 45. New York- Eastern 46. New York- Northern 47. New York- Southern 48. New York- Western 49. North Carolina- Western 50. District of Ohio 51. District of Oklahoma 52. Oregon 53. Pennsylvania- Eastern 54. Pennsylvania- Western 55. Puerto Rico 56. Rhode Island 57. Tennessee- Western 58. Texas- Southern 59. Texas- Western 60. District of Utah 61. Washington- Eastern 62. Washington- Western 63. District of Columbia 64. Wisconsin- Eastern
65. Alabama- Middle 66. Alabama- Southern 67. District of Alaska 68. Florida- Southern 69. Georgia- Southern 70. Guam 71. Mariana Islands 72. District of Hawaii 73. District of Idaho 74. District of Kansas 75. Kentucky- Western 76. District of Maine 77. Michigan- Western 78. Minnesota 79. Montana 80. New Hampshire 81. North Dakota 82. Oklahoma- Eastern 83. Pennsylvania- Middle 84. South Dakota 85. Texas- Eastern 86. District of Vermont 87. Virgin Islands 88. Virginia- Western 89. Washington- Western 90. West Virginia- Eastern 91. West Virginia- Western 92. Wyoming
This document is a research report submitted to the U.S. Department of Justice. This report has not been published by the Department. Opinions or points of view expressed are those of the author(s)
and do not necessarily reflect the official position or policies of the U.S. Department of Justice.

29
Similar to the SPSTs, the three specialized workshops were very well received by
attendees. The overall rating averaged 4.3 on a 5-point scale (4=very good; 5=excellent).
Attendees noted the value of plenary presentations immediately followed by breakout
sessions. The breakouts allowed comparable districts time to engage one another in
facilitated discussion.
Regional Training
The next stage in PSN problem solving training involved a series of regional
trainings beginning in 2005. MSU relied heavily upon telephone contacts with Project
Coordinators and Research Partners. During routine telephone calls with these two
groups, the following sample topics emerged as concerns for the district task forces:
• Engaging the community, community involvement, selecting key partners, getting started
• Balancing PSN responsibilities with a regular caseload (for AUSA’s in the role of project coordinator), prioritizing, getting support from management.
• Innovative programs/strategies/initiatives from other PSN districts. • New PSN coordinators need basic information/training (coordinators who came
on board after the initial trainings). • Share the latest technology for case tracking databases, crime labs, etc. • Measurement of outcomes, particularly prevention strategies?
These recommendations were included in sessions of the PSN national conferences
and included as research tracks within the conference.
Peer to Peer Training and Technical Assistance
During the first half of 2007, MSU worked with American University, American
Probation and Parole Association, and Institute for Law and Justice, to develop a peer-to-
peer training and technical assistance program. The goal of the program was to facilitate
This document is a research report submitted to the U.S. Department of Justice. This report has not been published by the Department. Opinions or points of view expressed are those of the author(s)
and do not necessarily reflect the official position or policies of the U.S. Department of Justice.

30
peer-to-peer workshops whereby task force members could learn about “best practices”
as well as interact with their peers from other PSN task forces. The initial series of
workshops included three topical areas: probation and parole strategies; community
partnerships; and smart prosecution/case screening. MSU’s role included participation in
all three peer-to-peer programs. MSU focused on placing the program in the context of
PSN strategic problem solving, best practices from across all PSN task forces, and with a
focus on performance measures and evaluation.
The first of these day and one-half programs occurred in the District of South
Carolina and focused on probation and parole strategies. The trainings were relatively
small with typically three to five PSN task forces in attendance. In total, five peer-to-
peer trainings have been held.
PSN Technical Assistance
Training and Technical Assistance (TA) were companion pieces for equipping the
PSN task forces with current and relevant information for PSN implementation and
maintenance. Beginning in the fall of 2002, when technical assistance was provided to
three districts, in excess of 325 requests were fulfilled by the MSU team (through 2008).
Nearly every district made some form of TA request.
TA was provided in multiple forms including on-site interaction, support for peer-
to-peer travel between districts, meetings at PSN National Conferences and training
sessions, and telephone conversations. Primarily requests were initiated by PSN project
coordinators (PCs) and research partners (RPs). TA requests covered a wide range of
topics. Examples include:
This document is a research report submitted to the U.S. Department of Justice. This report has not been published by the Department. Opinions or points of view expressed are those of the author(s)
and do not necessarily reflect the official position or policies of the U.S. Department of Justice.

31
• Data Collection & Reporting/ Gaining Access to Data Sources • On-Site TA/ Training • IRB/ Humans Subjects/ Data Confidentiality Issues • Database development • Information on Programs from Other Districts • Survey Instruments and Related Research Tools • Task Force Cooperation Issues • MOUs/ Partnership Agreements • Requests for PSN Resource Materials including Spanish speaking documents • ATF Gun Tracing Data • Assistance with Media Campaign • Assistance with Data Interpretation and Presentation • Research Partner Expectation Issues • Strategy Specific Information (e.g., Reentry, Most Violent Offender, Offender
Notification/ Lever-Pulling, Case Screening, Incident Reviews, Gangs) • Requests for Contact Information • Requests for Speakers for Conferences or Meetings • Publishing Findings from PSN Data • BJA Reporting Requirements • Evaluation Methodology
The largest number of requests pertained to data collection and reporting and
gaining access to data sources. One example of MSU working to address a multi-faceted,
interrelated request was collaboration with DOJ to create data collection instruments and
instructions for PSN task forces to provide data on firearms crime and firearms
enforcement. Similarly, MSU worked with the Western District of Missouri to make
available a data base on case processing that had been developed by the district’s task
force.
MSU and American University (AU), a National PSN Training Team member,
developed a site visit protocol as well as a TA request tracking database. The database
was maintained by AU and served to coordinate TA requests and delivery as well as
reporting to DOJ.
This document is a research report submitted to the U.S. Department of Justice. This report has not been published by the Department. Opinions or points of view expressed are those of the author(s)
and do not necessarily reflect the official position or policies of the U.S. Department of Justice.

32
Conferences and Meetings
Since the initial PSN National Conference in 2003 where MSU hosted
seven sessions in support of research and problem solving components of PSN,
MUS was a consistent participant in the planning and delivery of the conference.
Among the topics covered were Evaluation Methods and Measures, Targeting
Strategies to Solve Problems, Integrating Multiple Strategies to Reduce Gun
Violence, Building and Sustaining Effective Partnerships, Gang Strategies, and
participation in the PSN Technical Assistance Providers sessions.
Other conferences where MSU team members presented on PSN included, but are
not limited to: the National Institute of Justice’s Annual Research and Evaluation
Conference, the International Association of Chiefs of Police Annual Conference, the
annual meeting of the American Society of Criminology, Academy of Criminal Justice
Sciences, and Office of Juvenile Justice and Delinquency Annual and Gang Conference.
Focus Groups
In 2005, at MSU’s School of Criminal Justice, a focus group on chronic violent
offender lists was held with project coordinators, research partners, and criminal justice
officials. PSN task forces in attendance included the Northern and Southern District of
Georgia, the Middle District of North Carolina, the Eastern District of Missouri, Southern
District of Illinois, District of New Mexico, District of Massachusetts, Southern District
of Indiana, Eastern District of Michigan, and Western District of New York. This small
group of individuals was able to exchange ideas on what works and what are the
challenges of creating and maintaining chronic violent offender lists. Information
This document is a research report submitted to the U.S. Department of Justice. This report has not been published by the Department. Opinions or points of view expressed are those of the author(s)
and do not necessarily reflect the official position or policies of the U.S. Department of Justice.

33
garnered from the focus group was used in part to write the Strategic Case Study on
Chronic Violent Offender Lists.
Telephone Contacts
A member of the MSU PSN Training Team contacted each district’s PSN Project
Coordinator (PC) bi-annually, shortly following submission of the Attorney General’s
Semi-Annual Progress Reports. A structured interview questionnaire was developed as
well as a tracking form. Telephone calls were initiated in the first six months of 2003.
MSU’s telephone calls built upon the AG Reports, but did not duplicate them. The PC
phone contacts provided information on the role of the PC, partnerships/task forces,
strategic problem solving efforts, research, and training and technical assistance.
Likewise, routine calls were made to the Research Partners (RP). Specifically, the RPs
were surveyed on the integration of research into PSN activities and decision-making, the
benefits of research partnerships, and the challenges and issues experienced by research
partners. The primary benefit of the calls, above and beyond the information collected,
was the rapport built with the PCs and RPs.
Gun Tracing Workstations
MSU worked with a research team at Northeastern University to provide gun-
tracing workstations to three pilot cities (Chicago, IL, Indianapolis, IN, and Phoenix,
AZ). Through collaboration with the Bureau of Alcohol, Tobacco, and Firearms (BATF),
a research team at Northeastern University developed the workstations. The goal was to
support the development of strategic and tactical analytical models to support supply side
interventions. Site visits and discussion with personnel in the three pilot sites indicated
that the type of data was potentially quite valuable. However, the data were soon out-of-
This document is a research report submitted to the U.S. Department of Justice. This report has not been published by the Department. Opinions or points of view expressed are those of the author(s)
and do not necessarily reflect the official position or policies of the U.S. Department of Justice.

34
date and of limited utility. This feedback was provided to Northeastern and BATF and
efforts are underway to develop an online program that would have real- or near real-time
data available.
Databases
Technical Assistance
As mentioned previously, MSU created a database to track the numerous, diverse
Training and TA requests. Requests were entered into an Access database. Tracking of
such requests was used for DOJ reporting and to gauge training and TA needs in the
districts.
PSN District Data
As part of the BJA award to local PSN Research Partners (RPs), the PSN task
forces were asked to compile and submit bi-annual data on outputs (arrests, prosecutions,
etc.) and outcomes (gun crimes) to DOJ. The reporting was to MSU who compiled the
data and served as a data repository for DOJ. MSU created a database to store and
analyze the information. Upon receipt of the data, MSU would clean the data and enter it
into an Access database. The database was often used to provide DOJ with district target
area information. The reporting expectation was not a formal grant requirement and RPs
submitted data in various degrees of completeness (see Chapter Four).
City Violent Crime and Homicide Data
Given the limitations with the data reporting from the districts, MSU sought to
develop additional sources of data to support assessment of the impact of PSN on violent
crime. MSU developed a comprehensive city-level homicide and violent crime file using
This document is a research report submitted to the U.S. Department of Justice. This report has not been published by the Department. Opinions or points of view expressed are those of the author(s)
and do not necessarily reflect the official position or policies of the U.S. Department of Justice.

35
census, Uniform Crime Report (UCR) homicide data, supplemental homicide reports, and
UCR violent crime data from data sources available through the National Criminal
Justice Data Archive. Homicides were coded by date thereby offering a long-term trend
data for every city over 100,000.
Development of Case Studies
In the second half of 2003, the MSU team used a variety of information sources to
identify districts with promising practices. An initial set of case study reports were
developed focused on specific gun violence reduction strategies. These were then
supplemented by a series comprehensive case studies on specific districts. A list of case
studies is displayed in Table 5. The case studies are reviewed in more detail in
subsequent chapters.
Table 5: Case Studies
Strategic Interventions Comprehensive Gun Prosecution Case Screening: Case Study #1
Middle District of Alabama: Case Study #5
Offender Notification Meetings: Case Study #2
District of Massachusetts: Case Study #6
Crime Incident Review: Case Study #3
Eastern District of Missouri: Case Study #7
Chronic Violent Offender Lists: Case Study #4
District of Nebraska: (submitted to DOJ November 2006)
Strategic Problem-Solving Responses to Gang Crime and Gang Problems: Case Study #8
Southern District of Alabama: (submitted to DOJ March 2007)
Violent Crime Impact Teams (submitted to DOJ August 2008)
Middle District of North Carolina: (submitted to DOJ October 2007)
This document is a research report submitted to the U.S. Department of Justice. This report has not been published by the Department. Opinions or points of view expressed are those of the author(s)
and do not necessarily reflect the official position or policies of the U.S. Department of Justice.

36
Products
As mentioned throughout the chapter, numerous PSN “products” were developed.
Table 6 displays the products developed by MSU either alone or in collaboration with
other PSN National Team members (see, http://www1.cj.msu.edu/~outreach/psn/).
Table 6: MSU PSN Products
Product Purpose Format Training Curriculum Guide for districts to implement,
maintain, and evaluate PSN Print Electronic (PDF) PSN website
Technical Assistance Site Visit Protocol
Guide for the MSU Training Team members making on-site Technical Assistance visits
Print, Electronic (PDF), PSN website
Human Subjects/Case Study Protocol Guide for the MSU Training Team members gathering information and data to form case studies of strategies and selected districts
Print Electronic (PDF) PSN website
Tracking Databases (technical assistance, contacts with PSN PCs, and district specific information like target crime, target area, possible interventions, facilitator feedback on training, and other strategic problem solving variables)
Reference for MSU Training Team members
Microsoft Access
Case Studies Reports featuring promising strategies and districts with comprehensive approaches and positive results
Print Electronic (PDF) PSN website
Various Resource Materials (e.g., incident reviews, White Paper on privacy, confidentiality and data sharing, Indianapolis video tape of offender pulling meetings, and a bibliography of books, articles, and papers related to firearms violence and interventions)
Suggestions for districts Print Electronic (PDF) CD-ROM
PowerPoint Presentations Resource for training, technical assistance, and presentations
PowerPoint, PSN website
PSN website Comprehensive resource for the public
Website http://www1.cj.msu.edu/~outreach/psn/
This document is a research report submitted to the U.S. Department of Justice. This report has not been published by the Department. Opinions or points of view expressed are those of the author(s)
and do not necessarily reflect the official position or policies of the U.S. Department of Justice.

37
PSN: Evolution to Gangs and Drug Markets
Given reports of increasing gang activity and the role of gang members in gun
crime, the national PSN program provided support to PSN task forces to develop gang
prevention, intervention, re-entry, and suppression strategies beginning in 2006. Support
was provided to all PSN districts and more fundamental support to particular districts
through the Comprehensive Anti-Gang Initiative (CAGI). Initially six sites were selected
to participate in the CAGI initiative. This was later expanded to four additional sites and
more recently two additional sites were selected. As part of its PSN role, MSU provided
two trainings on promising gang interventions as well as TA support related to collection
of performance measures. MSU is conducting an evaluation of CAGI under a separate
NIJ research award.
In 2007, PSN again expanded its scope through BJA’s Drug Market Intervention
(DMI) program. The DMI was modeled on a very promising approach to eliminating
open air drug markets developed in High Point, NC. For High Point officials, this
represented an evolution from strategic problem solving focused on gun violence, later
applied to gang violence, and now adapted to address drug markets. MSU is
collaborating with BJA, AU, and John Jay College to provide training and TA to support
the implementation of DMI in 18 jurisdictions across the U.S. MSU is also working with
several sites to evaluate impact of DMI. CAGI and DMI cities are displayed in Table 7.
.
This document is a research report submitted to the U.S. Department of Justice. This report has not been published by the Department. Opinions or points of view expressed are those of the author(s)
and do not necessarily reflect the official position or policies of the U.S. Department of Justice.

38
Table 7: CAGI and DMI cities
CAGI Super Six (2006) DMI I (2007-2008)Cleveland (OH-ND) Dallas/Fort Worth (TX-ND) Los Angeles (CA-CD) Milwaukee (WI-ED) Pennsylvania Corridor (PA-ED) Tampa (FLMD)
Baltimore, MD Chicago, IL Cook County, IL Dallas, TX Durham, NC Fort Meyers/Ocala, FL19 Indianapolis, IN Milwaukee, WI New Haven, CT
CAGI Four (2007) DMI II (2009)Indianapolis (IN-SD) Oklahoma City (OK-ED) Rochester (NY-WD) Raleigh/Durham (NC-ED and NC-MD)
Atlanta , GA Fitchburg, MA Memphis, TN Mesa, AZ Middletown, OH Peoria, IL Providence, RI Ocala, FL Seattle, WA
CAGI-Two (2008) Chicago (IL-ND) Detroit (MI-ED)
The extension of the PSN model from gun violence to gangs and drugs suggests
the powerful role that the U.S. Attorneys’ Offices can play in convening multi-agency
law enforcement and community groups to address serious crime problems.
Data Sources and Methods The research-based training and technical assistance activities described
throughout this chapter, coupled with a variety of PSN research activities, provided the
data used throughout the remainder of this report. Details on specific data sources and
related methodological issues are described in other sections of the report as the specific
analyses and findings are presented. Additional information is available in published
This document is a research report submitted to the U.S. Department of Justice. This report has not been published by the Department. Opinions or points of view expressed are those of the author(s)
and do not necessarily reflect the official position or policies of the U.S. Department of Justice.

39
reports that are cited throughout the report. The key data sources included information
on PSN implementation as well as city-level crime data used to assess impact on violent
crime.
A key source of implementation data was the semi-annual reports submitted by
the PSN task force (formally submitted by the USAO) to the Department of Justice.
These reports reflected self-reported information on the task force goals, structure,
strategies, accomplishments and challenges. The specific items and format changed over
time. Two reports were used in analyses reported herein. Specifically, the reports from
July 2004 and July 2005 were utilized. The July 2004 report was used because it served
as one of the sources of information for an assessment of implementation that was
conducted two years into the implementation of PSN (reported in Chapters Four and
Five). The July 2005 report was used because it was the most proximate in time to a
survey of PSN research partners. Both reports had high levels of participation from the
PSN task forces (90 of 93 task forces and 84 of 93 task forces responded in 2004 and
2005, respectively). The research partner survey was conducted in late summer and early
fall 2005 with a response rate of 85 percent (79 completed surveys out of 93 research
partners). Data on the level of federal prosecution for gun offenses in each federal
judicial district were collected for the fiscal years 2000-2007. This included cases filed
and the number of defendants. These data elements were complemented by qualitative
data gathered through regular phone contacts with PSN coordinators and research
partners, site visits conducted for strategic and site-specific case studies as well as site
visits related to technical assistance.
This document is a research report submitted to the U.S. Department of Justice. This report has not been published by the Department. Opinions or points of view expressed are those of the author(s)
and do not necessarily reflect the official position or policies of the U.S. Department of Justice.

40
The data gathered to assess impact of PSN on crime was compiled from a variety
of sources. As noted above, DOJ requested each task force to submit data on outputs
(e.g., arrests, prosecutions) and outcomes (e.g., homicides, assaults, robberies with a gun
in target areas) but there was very uneven reporting across the 93 districts and over time.
UCR data on violent crime from 2000-2006 was collected for every U.S. city over
100,000 population. This included PSN target or treatment cities as well as non-PSN
target cities. A similar database was constructed using Supplemental Homicide Reports
and will be used in future analyses. The crime data were supplemented with U.S. Census
Bureau and Bureau of Labor Statistics for city level demographic, economic and
population data that were used to construct measures of concentrated disadvantage and
population density. Data from the FBI’s UCR program on Police Employee Records
were used to create measures of police density at the city level and Bureau of Justice
Statistics data were used for measures of state level incarceration.
This document is a research report submitted to the U.S. Department of Justice. This report has not been published by the Department. Opinions or points of view expressed are those of the author(s)
and do not necessarily reflect the official position or policies of the U.S. Department of Justice.

41
Chapter Four: Implementation of PSN Core Components
As mentioned earlier in Chapter Three, MSU made a concerted effort to stay in
contact with the PSN Research Partners and Project Coordinators through regular phone
and email contacts. There were also several other methods used by the research team to
augment their understanding of current site activities and issues: a Research Partner
survey, Semi-annual reports to the Attorney General, and Data Quality Reports.
These sources of information also provided a picture of PSN implementation
across the districts. In this chapter, we present findings from these sources as a way of
describing general patterns in implementation of the various components of PSN. In the
last section of the chapter, we present data on the relationship between research
integration and other aspects of PSN. This is followed in Chapter Five with a theory-
based analysis of patterns of implementation across the PSN districts.
Research Partner Survey
The funding provided by the PSN program to allow PSN task forces to hire a
local research partner (RP) was intended to fulfill several purposes. Building on the
experience of the Boston Gun Project and DOJ’s Strategic Approaches to Community
Safety Initiative (SACSI), the PSN initiative was intended to support a strategic problem
solving approach to addressing gun crime in the particular district or focus area. Thus,
RPs were to work with the task force to analyze the nature of the local gun crime problem
and to support the task force development of intervention strategies (enforcement,
intervention, prevention). The RP would also be a resource to the task force in
identifying research-based best or promising practices. Once programs were
implemented, it was hoped that the RP would provide systematic feedback to the task
This document is a research report submitted to the U.S. Department of Justice. This report has not been published by the Department. Opinions or points of view expressed are those of the author(s)
and do not necessarily reflect the official position or policies of the U.S. Department of Justice.

42
force on the nature and intensity of the interventions. Finally, it was hoped that RPs
would conduct an evaluation of the impact of PSN in the particular district. This
represented an ambitious agenda for a significant but relatively limited amount of funding
($150,000 over three years). Ultimately, PSN allowed the local task force to work out
details of expectations and deliverables.
As noted previously, the MSU research team attempted to support the role of
research through training workshops and technical assistance. In an effort to gather
information about the experience of PSN research partners, the MSU team conducted a
survey of all research partners during the late summer and early fall of 2005. This survey
consisted mainly of closed-ended questions using either modified Likert scale items or
yes/no response items. There were also open-ended/comments fields for elaboration by
respondents. MSU first administered the survey via email to the identified research
partner or, in the case of multiple research contacts for one district, the lead researcher for
each district. Respondents could either return the survey via email or facsimile. The
research team then followed-up with phone calls to those districts that did not respond to
one of four email requests for survey participation. Of the 93 PSN district research
partners, 79 responded to the survey (84.9%) (see Table 8).
The following is a summary of the results from the Research Partner Survey that
pertain to core PSN themes.
• Extent to which the strategic problem solving process has been integrated into the PSN task force
The majority of respondents stated that the task force is interested in looking at
data (79.5%). In particular, over 47 percent of respondents indicated that their PSN task
force is specifically interested in looking at data to identify and solve problems.
This document is a research report submitted to the U.S. Department of Justice. This report has not been published by the Department. Opinions or points of view expressed are those of the author(s)
and do not necessarily reflect the official position or policies of the U.S. Department of Justice.

43
However, just less than 21 percent of respondents stated that the PSN task force is not
interested in using data and analysis to drive planning.
Almost three quarters of all respondents (70.5%) stated that the task force had
used research and data for some purpose. Most respondents indicated they used this
research and data to create programs or strategies (39.7%), while slightly less stated that
they used research to expand existing programs or strategies (23.1%). Very few
respondents indicated that they had used research and data for justifying or publicizing
existing programs (7.7%). In contrast, about 30 percent said the task force had not
connected research and data to programs or strategies for any purposes.
When asked how the district task force evaluates results, the majority of
respondents stated that they were, at the very least, in discussions about evaluating
results. Almost 32 percent of the research partners stated that although evaluations of
PSN programs were underway they were not yet complete at the time of the survey, while
almost one-third (29.1%) stated that the task force had already received an evaluation
report(s) on PSN efforts. Nineteen percent of the respondents indicated that the task
force had not requested or supported the development of evaluations for the PSN task
force at the time of the survey.
This document is a research report submitted to the U.S. Department of Justice. This report has not been published by the Department. Opinions or points of view expressed are those of the author(s)
and do not necessarily reflect the official position or policies of the U.S. Department of Justice.
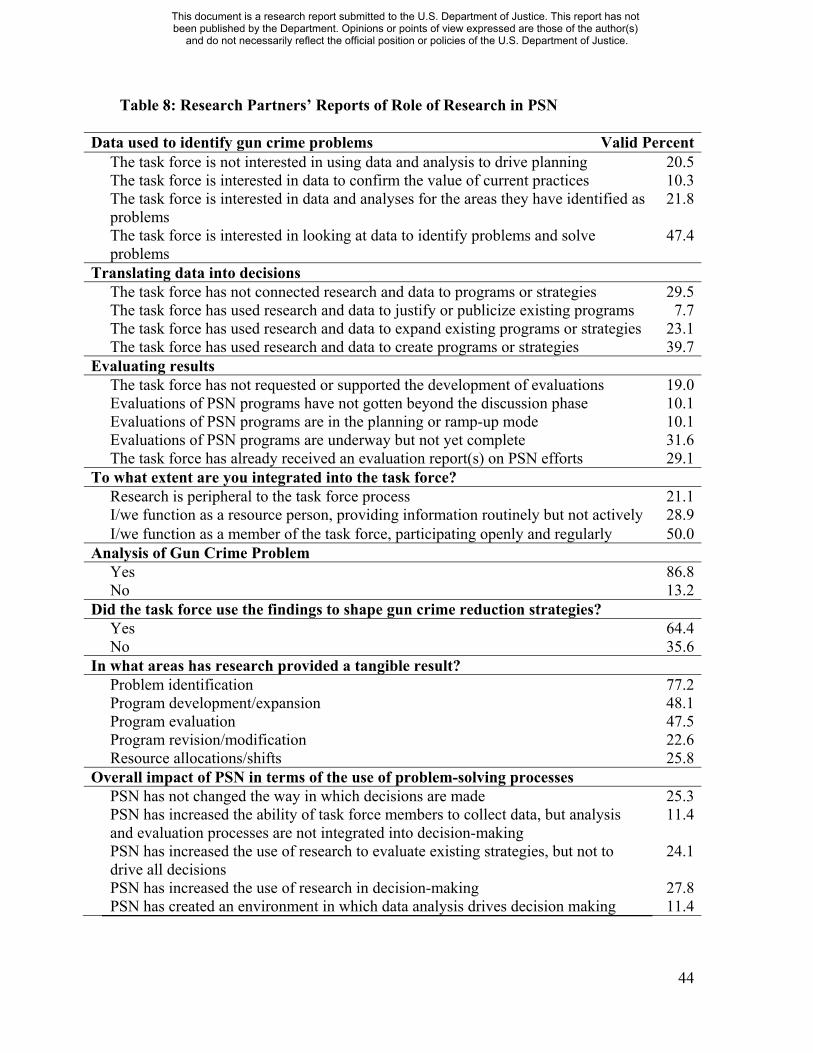
44
Table 8: Research Partners’ Reports of Role of Research in PSN
Data used to identify gun crime problems Valid Percent The task force is not interested in using data and analysis to drive planning 20.5 The task force is interested in data to confirm the value of current practices 10.3 The task force is interested in data and analyses for the areas they have identified as
problems 21.8
The task force is interested in looking at data to identify problems and solve problems
47.4
Translating data into decisions The task force has not connected research and data to programs or strategies 29.5 The task force has used research and data to justify or publicize existing programs 7.7 The task force has used research and data to expand existing programs or strategies 23.1 The task force has used research and data to create programs or strategies 39.7Evaluating results The task force has not requested or supported the development of evaluations 19.0 Evaluations of PSN programs have not gotten beyond the discussion phase 10.1 Evaluations of PSN programs are in the planning or ramp-up mode 10.1 Evaluations of PSN programs are underway but not yet complete 31.6 The task force has already received an evaluation report(s) on PSN efforts 29.1To what extent are you integrated into the task force? Research is peripheral to the task force process 21.1 I/we function as a resource person, providing information routinely but not actively 28.9 I/we function as a member of the task force, participating openly and regularly 50.0Analysis of Gun Crime Problem Yes 86.8 No 13.2Did the task force use the findings to shape gun crime reduction strategies? Yes 64.4 No 35.6In what areas has research provided a tangible result? Problem identification 77.2 Program development/expansion 48.1 Program evaluation 47.5 Program revision/modification 22.6 Resource allocations/shifts 25.8Overall impact of PSN in terms of the use of problem-solving processes PSN has not changed the way in which decisions are made 25.3 PSN has increased the ability of task force members to collect data, but analysis
and evaluation processes are not integrated into decision-making 11.4
PSN has increased the use of research to evaluate existing strategies, but not to drive all decisions
24.1
PSN has increased the use of research in decision-making 27.8 PSN has created an environment in which data analysis drives decision making 11.4
This document is a research report submitted to the U.S. Department of Justice. This report has not been published by the Department. Opinions or points of view expressed are those of the author(s)
and do not necessarily reflect the official position or policies of the U.S. Department of Justice.

45
• Extent to which the research partner and other research team members are integrated into the task force.
One-half of the respondents (50.0%) indicated that they (as the research partner)
function as a member of the task force, participating openly and regularly reflecting full
integration in the task force with other members, while almost 29 percent (28.9%)
consider themselves integrated but less so, by functioning as a resource providing
information routinely but not actively. Just over 21 percent (21.1%) of respondents
indicated that there is relatively no integration as research is peripheral to the task force
process. This is consistent with previous responses about how research and data have
been used by the task force.
• Local analysis of the gun problem
Roughly 87 percent (86.8%) of respondents stated that the research team was able
to conduct analyses of the local crime problem. Of that 87 percent, over one-third
(35.6%) stated that the task force did not use the findings to shape gun crime reduction
strategies and about 65 percent (64.4%) of those respondents did use those findings to
help them in their reduction strategies.
• Research provided a tangible result and future use of research
The respondents were asked to respond whether or not research provided them
with tangible results as it related to five specific areas: problem identification, program
development/expansion, program evaluation, program revision/modification, and
resource allocation/shifts. Seventy-seven percent of respondents indicated that research
provided them with results with problem identification. For the remaining four areas, the
majority of respondents indicated that research did not provide any tangible results.
About 48 percent indicated that research provided tangible results were obtained for both
This document is a research report submitted to the U.S. Department of Justice. This report has not been published by the Department. Opinions or points of view expressed are those of the author(s)
and do not necessarily reflect the official position or policies of the U.S. Department of Justice.

46
program development/expansion as well as program evaluation (48.1% and 47.5%,
respectively). Almost 27 percent (26.6%) percent and 30 percent (30.4%) percent of
respondents indicated tangible results for program revision/modification and resource
allocation/shift respectively. However, the majority of respondents (77.4%) indicated
they believed that task force members would be more likely to use research and research
partners after their PSN experience.
• Overall impact of PSN as it relates to the use of problem-solving process
Roughly equal numbers of respondents indicated that PSN has not changed the
way in which decisions are made (25.3%), PSN has increased the use of research to
evaluate existing strategies, but not to drive all decisions (24.1%), and that PSN has
increased the use of research in decision-making (27.8%). Just over 11 percent (11.4%)
indicated that PSN has increased their ability to collect data
• Barriers to research-driven problem solving
In this section, respondents were asked to rate twelve potential barriers to research
driven problem solving as not a problem, some problem, or a major problem (Table 9).
The most significant problems identified included information not being collected
(33.3%) and administrative and organizational problems (30.3%). Combining “some”
and “major” problems revealed that the following were barriers in the majority of
districts: information not being collected (78.2%), administrative barriers (76%),
administrative or organizational issues (68.5%), lack of action by members of task force
(64.1%), lack of interest in research (60.2%), turf issues (57.7%), lack of technology or
technical support (55.7%), lack of funds (54.5%), and lack of personnel (51.9%).
This document is a research report submitted to the U.S. Department of Justice. This report has not been published by the Department. Opinions or points of view expressed are those of the author(s)
and do not necessarily reflect the official position or policies of the U.S. Department of Justice.

47
Table 9: Potential barriers to research driving problem solving
Not a problem Some problem Major problem Response # % # % # % Legal barriers 48 60.8 30 38.8 1 1.3 Administrative barriers 19 24.1 41 51.9 19 24.1 Perceived risk to agency 42 53.2 29 36.7 8 10.1 Turf issues 33 42.3 35 44.9 10 12.8 Information is not collected 17 21.8 35 44.9 26 33.3 Information in incompatible form 24 31.2 37 18.1 16 20.8 Lack of technology or technical support 35 44.3 30 38.0 14 17.7 Lack of interest in research 31 39.7 33 42.3 14 17.9 Lack of action by members 28 35.9 35 44.9 15 19.2 Lack of funds 36 45.6 36 45.6 7 8.9 Lack of personnel 38 48.1 31 39.2 10 12.7 Administrative or organizational issues 24 31.6 29 38.2 23 30.3
• Additional funding for research partner beyond initial award
At the time of the survey, none of the respondents indicated that they had been
provided any additional funding beyond that of the initial BJA award. Over one-half
(51.4%) of respondents said they did not know if they would receive continued funding.
Subsequent contacts with RPs indicated that many had received additional funding to
continue their work with the task force following the completion of the original grant
award (56/84 as of September 2007). The subsequent funding to RPs was discretionary
on part of the PSN task and thus seemed to indicate that the majority of PSN task forces
perceived value in the RP.
• Support and engagement from the United States Attorney’s Office An overwhelming majority (88.3%) of respondents indicated that the United States
Attorney’s Office was either supportive or supportive and engaged (37.7% and 50.6%
respectively) in PSN. Just less than 12 percent (11.7%) indicated that the USAO was
neither supportive nor engaged in PSN.
This document is a research report submitted to the U.S. Department of Justice. This report has not been published by the Department. Opinions or points of view expressed are those of the author(s)
and do not necessarily reflect the official position or policies of the U.S. Department of Justice.

48
• Support from PSN project coordinator
Similarly, over 92 percent of respondents indicated that their project coordinator
was somewhat supportive or very supportive (33.8% and 58.8% respectively) or their
research efforts. About eight percent indicated that their project coordinator was not
supportive (7.5%) of their research efforts.
• Experience of research partner
Just over one-quarter of respondents indicated that their PSN experience had been
somewhat negative or negative (17.5% and 10.0% respectively). The remaining 73
percent indicated that their experience had been somewhat positive (20.0%) or positive
(52.5%).
Thus, as would be expected the experiences of RPs with the PSN task forces was
uneven. The most positive responses related to the support, involvement and engagement
with the U.S. Attorney’s Office and the PSN task force. In a majority of districts it
appeared that this support resulted in, at least, consideration of the role of research in
strategic planning. In some districts, however, this did not necessarily translate into what
the RP perceived as meaningful use of the research. In subsequent sections we consider
the impact of the integration of research into the PSN task forces as well as some of the
patterns of research integration that emerged across the PSN districts.
Semi-annual reports to the Attorney General
The Department of Justice required the U.S. Attorney, typically through the PSN
coordinator, to complete a semi-annual report on the progress of PSN in the particular
district. DOJ provided MSU with these reports in the hope that the MSU team could
identify promising practices as well as identify districts that might be experiencing
This document is a research report submitted to the U.S. Department of Justice. This report has not been published by the Department. Opinions or points of view expressed are those of the author(s)
and do not necessarily reflect the official position or policies of the U.S. Department of Justice.

49
challenges that could be addressed by technical assistance. These reports requested
information on a wide variety of PSN related subjects. The report consisted of mainly
close ended questions but always with an option to explain or expand on a certain
response. Topics included Task Force constitution and meeting schedule, partners, data
sources, prevention strategies, evaluation, strategic planning, mass media campaign,
community outreach, training, and technical assistance needs, reception, and
effectiveness.
DOJ provided both an electronic copy of each site’s report as it was submitted as
well as a single electronic file (Excel spreadsheet) that contained all sites’ submitted data.
MSU used the electronic copies of the reports to help provide background information
before contacting a specific site. MSU also aggregated and analyzed the data using the
single Excel file and provided a summary report to the Department of Justice. MSU then
responded to requests for further inquiry based on the summary.
Over the years of PSN the format and the questions covered in the survey were
continually modified. Although this made sense from a programmatic standpoint, from a
research perspective it was less than desirable because it precluded analyses of trends.
The following is a summary of some of the report questions as they correspond to the
research partner survey conducted by MSU and related items on the various components
of PSN. The data come from reports submitted to the Attorney General in July of 2005,
covering the time period January 1 through June 30, 2005. During this period, Michigan
State University received completed reports for 84 of the 93 PSN districts.
This document is a research report submitted to the U.S. Department of Justice. This report has not been published by the Department. Opinions or points of view expressed are those of the author(s)
and do not necessarily reflect the official position or policies of the U.S. Department of Justice.

50
Partnerships
As can be seen from Table 10:, PSN Task Forces were comprised of a wide variety of agencies. As would be expected, the most common task force members include other criminal justice agencies. Nearly three-fourths listed “community leaders/organizations.” Over one-third listed “other” that included a wide variety of partners (Table 10). Most Task Forces met either monthly (26.5%) or quarterly (21.7%), although 18 percent met weekly or bi-weekly (10.8% and 7.2%, respectively). The remaining Task Forces reported meeting less than once a month (4.8%) or on an as needed basis (28.9%) (
This document is a research report submitted to the U.S. Department of Justice. This report has not been published by the Department. Opinions or points of view expressed are those of the author(s)
and do not necessarily reflect the official position or policies of the U.S. Department of Justice.

51
Table 11).
Table 10: Task Force Organizations
Response Number Percent Valid Percent Federal law enforcement 82 88.2 97.6 State law enforcement 72 77.4 85.7 Local law enforcement 80 86.0 95.2 State and local prosecutors 80 86.0 95.2 Probation and parole authorities 70 75.3 83.3 Federal governmental agencies 30 32.3 35.7 Community leaders/organizations 61 65.6 72.6 State or local governmental agencies 67 72.0 79.8 Other 29 31.2 34.5
Other responses: Hospitals, media company, DV prevention professionals, college/university partners, State district attorney association, State commission on crime and delinquency, City public schools, Local YMCA, media, Boys and Girls Clubs, Campfire USA, Re-entry program, Tribal Law Enforcement, former FFLs, firearms experts, National Rifle Association, community members, HIDTA, Weed and Seed, State Department of Correction, CrimeStoppers, former offenders, sports organizations.
This document is a research report submitted to the U.S. Department of Justice. This report has not been published by the Department. Opinions or points of view expressed are those of the author(s)
and do not necessarily reflect the official position or policies of the U.S. Department of Justice.

52
Table 11: PSN Task Force/Steering Committee meeting frequency
Response Number Percent Valid Percent Weekly 9 9.7 10.8 Twice a month 6 6.5 7.2 Monthly 22 23.7 26.5 Less than once a month 4 4.3 4.8 Quarterly 18 19.4 21.7 Ad hoc 24 25.8 28.9 Total 83 89.2 100.0
Over 60 percent of project coordinators indicated that the task force research
partner attended task force meetings most of the time or all of the time (20.7% and 42.7%
respectively). Just 11 percent indicated that there research partner never attends task
force meetings. The remaining quarter (25.6%) indicated that the research partner attends
occasionally. Almost 88 percent (87.8%) of project coordinators indicated they were
satisfied or very satisfied with their research partner (41.5% and 46.3% respectively).
Fifty-one percent indicated that the task force “continued grant funding” for their
research partner.
The PSN task forces also reported that other federal programs were active in their
district. The most common were Organized Crime Drug Enforcement Task Forces
(OCDETF) and Weed and Seed reported by 42 and 39 percent of the districts (see Table
12).
Table 12: Active federal programs in the district
Response Number Percent Valid Percent ATF Violent Crime Impact 14 15.1 16.7 FBI Safe Street Task Forces 1 20.4 22.6 OCDETF 35 37.6 41.7 Weed and Seed 33 35.5 39.3 DEA Mobile Enforcement Teams 15 16.1 17.9 Other 11 11.8 13.1
This document is a research report submitted to the U.S. Department of Justice. This report has not been published by the Department. Opinions or points of view expressed are those of the author(s)
and do not necessarily reflect the official position or policies of the U.S. Department of Justice.

53
• Involvement of Research Partner
Strategic Planning
At the time of these reports to the Attorney General’s Office, two-thirds of
responding districts had identified a principal target area. Not surprisingly, almost 80
percent (79.7) of the target areas were considered urban. The remaining respondents
classified their target areas as rural (9.4%), tribal (3.1%), and other (7.8%). Eight-one
percent of target areas included public housing projects (80.6%). For the roughly 25
percent that had not identified a target area at the time of the report, almost one-half
(48.4%) had chosen to focus on the entire district while another one-third (35.5%)
indicated they had chosen to focus on multiple areas equally. Sixteen percent chose to
focus on a specific type of problem (e.g. domestic violence).
As stated earlier, all but one responding district (98.8%) indicated that they had
assessed the nature and scope of gun violence in the district or a particular area of the
district. Over 90 percent of responding project coordinators (92.7) indicated that the task
force’s research partner conducted or participated in the assessment of gun violence.
Table 13 indicates what types of data were used to conduct the assessment.
Table 13: Data sources used to conduct nature and scope of gun violence assessment
Response Number Percent Valid Percent UCR data 71 76.3 84.5 Other police data 79 84.9 94.0 Crime gun tracing 62 66.7 73.8 Crime mapping 67 72.0 79.8 Crime incident reviews 54 58.1 64.3 Court or probation data 52 55.9 61.9 Department of corrections data 42 45.2 50.0 Community-level data 33 35.5 39.3 General citizen surveys 20 21.5 23.8 Offender surveys, interviews or focus groups 24 25.8 28.6 Other 17 18.3 20.2
This document is a research report submitted to the U.S. Department of Justice. This report has not been published by the Department. Opinions or points of view expressed are those of the author(s)
and do not necessarily reflect the official position or policies of the U.S. Department of Justice.

54
• Strategic Interventions
PSN Task Forces were encouraged to “unpack” their local gun crime problem and
allocate resources as each saw fit. While the key elements to the local gun problem
varied across districts there were some clear patterns. Table 14 displays the key elements
of the local gun violence problem as indicated by project coordinators. Respondents
could choose multiple elements for their response. If respondents indicated more than
two key elements, and almost all did (82/84), they were then asked to choose what they
considered the two most important elements of the gun violence problem.
Overwhelmingly, the top four responses were drugs, felons in possession, chronic
offenders, and gangs.
Table 14: Key elements of the gun violence problem in [your] district
Response Number Percent Valid Percent Gangs 60 64.5 71.4 Drugs 80 86.0 95.2 Chronic Offenders 71 76.3 84.5 Domestic Violence 41 44.1 48.8 Felons in Possession 80 86.5 95.2 Juvenile Offenders 36 68.7 42.9 Corrupt FFL Dealers 17 18.3 20.2 Straw Purchasers 42 45.2 50.0 Brady False Statements 24 25.8 28.6 Gun Trafficking as a Source State 25 26.9 29.8 Gun Trafficking as a Market State 9 9.7 10.7 Other* 10 10.8 11.9
*Other responses: Willingness to use guns to resolve personal disputes, Armed Robbery/Hobbes Act, firearms possessed or used in drug trafficking crimes, bank robberies, violence offenders, aliens in possession, and gun carrying culture.
Project Coordinators also reported a wide variety of enforcement/deterrence
focused strategies aimed at the local gun problem. Here again, respondents could select
more than one response (Table 15). Not surprisingly given the background of PSN,
increased federal prosecution of gun crime was nearly universally identified as a core
This document is a research report submitted to the U.S. Department of Justice. This report has not been published by the Department. Opinions or points of view expressed are those of the author(s)
and do not necessarily reflect the official position or policies of the U.S. Department of Justice.

55
strategy (97.6%). A related very common strategic intervention was the development of
some type of case screening procedure to identify gun crime cases and decide on the
venue for prosecution. When asked specifically (i.e. a single item question, in addition to
question for Table 15), all but one responding district (98.8%) indicated that they had
established a prosecution screening mechanism for all cases, or a subset of cases, in
which a gun was used or recovered as well as assessed the nature and scope of gun
violence in the district or a particular area of the district. In addition, just over one-half
(55.4%) of project coordinators indicated that state or local prosecutors had been cross-
designated to assist them in prosecuting gun cases.
Table 15: Enforcement/deterrence focused strategies
Response Number Percent Valid Percent Joint federal-local prosecution screening of firearms
77 82.8 91.7
Increased federal prosecution of firearms related cases
82 88.2 97.6
Increased state or local prosecution of firearms-related cases
47 50.5 56.0
Deployment of street-level firearms enforcement unit
37 39.8 44.0
Offender notification meetings 38 40.9 45.5 Probation/parole law enforcement home visits 36 38.7 42.9 Directed police patrol in high crime areas 48 51.6 57.7 Chronic violent offender list 46 49.5 54.8 Inmate reentry programs 39 41.9 46.4 Supply-side interventions 39 41.9 46.4 Warrant service 28 30.1 33.3 Nuisance abatement civil action against problem properties
15 16.1 17.9
Investigation of criminal org/gang violence 58 62.4 69.0 Other* 22 23.7 26.2
*Other responses: Media campaign, Not With My Gun program, Gang injunctions, firearms purchaser letters, extensive law enforcement training, public housing evictions, neighborhood prosecution teams, school prevention, Project Super Achilles, batterers’ intervention programs, Drug Education for Youth program, community partnerships and responsible advertising, school based violence prevention, Hobbs Act robbery task force, Inmate/Parole video, neighborhood programs, notification programs.
This document is a research report submitted to the U.S. Department of Justice. This report has not been published by the Department. Opinions or points of view expressed are those of the author(s)
and do not necessarily reflect the official position or policies of the U.S. Department of Justice.

56
The other most common strategies included investigation of gang violence,
increased directed police patrol, increased state and local prosecution, and chronic violent
offender lists. Over 40 percent of PSN task forces reported inmate re-entry programs,
supply side enforcement, offender notification meetings, street level enforcement units,
and probation/parole home visits. All suggest the concept of deterrence-based, focused
interventions.
Often, enforcement/deterrence strategies were coupled with prevention strategies.
The most common prevention strategy was neighborhood development such as Weed and
Seed. The other most common were education and school based programs (Table 16).
Table 16: Prevention Strategies
Response Number Percent Valid Percent Clergy outreach to offenders 32 34.4 38.1 Employment programs 23 24.7 27.4 Substance abuse programs 19 20.4 22.6 Education programs 61 65.6 72.6 Vocational training programs 22 23.7 26.2 Neighborhood development (e.g. Weed and Seed)
62 66.7 73.8
Youth street worker outreach 24 25.8 28.6 School-based prevention 60 64.5 71.4 Hospital trauma center outreach 8 8.6 9.5 Other 19 20.4 22.6
Training, Outreach, and Accountability
The AG surveys asked project coordinators about their technical assistance needs
and requests. During the six month reporting period (i.e. the January 1 to June 30, 2005
time period), almost 55 percent of project coordinators indicated they had requested
technical assistance. The most common requests for technical assistance was directed to
ATF (35.7%) and the DOJ Firearms Enforcement Assistance Team (FEAT) Point of
Contact (23.8%). Almost one quarter (22.6%) had requested technical assistance
This document is a research report submitted to the U.S. Department of Justice. This report has not been published by the Department. Opinions or points of view expressed are those of the author(s)
and do not necessarily reflect the official position or policies of the U.S. Department of Justice.

57
specifically from MSU during the reporting period. As a follow up question, eighty-nine
percent of respondents indicated that they had received the necessary technical assistance
and 93 percent indicated that it was effective.
PSN task forces also saw themselves as resources for law enforcement,
prosecutors, and community members in their district. Over eighty percent (81.9%) of
project coordinators indicated that they had organized training for their district. The
majority of training was targeted at law enforcement (57.1%) although over one-third
(34.5%) indicated they had trained prosecutors and the community as well.
Three-fourths (77.1%) of project coordinators indicated that their Task Force had
funded a media partner and over 09 percent (90.2%) indicated they had a local mass
media campaign in place. Almost all responding districts indicated they were involved in
community outreach (96.4%).When asked if their task force had evaluated the
effectiveness of any of their PSN strategies, just over 83 percent (83.1%) of project
coordinators indicated that they had. Fifty-four of 72 (75.0%) districts indicated that
their research partner conducted this evaluation.
Data Quality Report
As one of the grant expectations, PSN Research Partners were asked by DOJ to
submit various data for their PSN sites to Michigan State University. The Semi-Annual
Researcher Reporting Form requested monthly data and was divided into four sections:
(1) Crime Measures, (2) Outputs- Arrests and Seizures, (3) Outputs- Prosecution, and (4)
Additional Measures. The Crime Measures section consisted of three UCR violent crime
indexes, homicide, aggravated assault, and armed robbery. Respondents were asked to
separate out each crime measure with a firearm if possible (i.e. submit all homicides and
This document is a research report submitted to the U.S. Department of Justice. This report has not been published by the Department. Opinions or points of view expressed are those of the author(s)
and do not necessarily reflect the official position or policies of the U.S. Department of Justice.

58
then homicides with a firearm). The Outputs- Arrests and Seizures requested arrest data
for the three UCR measures as well as arrests for illegal weapons offenses (both adults
and juveniles) and numbers of seized firearms. The Outputs- Prosecution requested
filings and guilty plea/verdicts for the three UCR measures and illegal weapons
possession as well as Federal prosecution defendant filings for firearms related cases
(sections 922 and 924). The Additional Measures sections requested Shots Fired Calls
for Service data and Trauma Center firearm injuries data and allowed for the research
partner to submit any other data he or she was able to collect not previously requested.
The data were requested in monthly format, where possible, in the hope of supporting
systematic evaluation of impact.
As research partners submitted those data to MSU, they were cataloged,
transferred into a database if possible, and rated on their quality and completeness. The
categories are as follows:
Figure 2: Data rating description
Very Good
• Submitted most to all of the variables in monthly form.
Good
• Submitted most of the variables in monthly form and usually some additional ones in place of missing variables.
Poor
• Submitted some data in monthly form but severely limited, usually only UCR data.
Very Poor
• Submitted limited variables in annual form or submitted data that were hard to interpret.
This document is a research report submitted to the U.S. Department of Justice. This report has not been published by the Department. Opinions or points of view expressed are those of the author(s)
and do not necessarily reflect the official position or policies of the U.S. Department of Justice.

59
Table 17 and Table 18 display the profile of data submission. The years represent
the time frame of the data submitted, not when the research partner submitted the data.
The data for 2000 and 2001 were requested in the hope that they would provide baseline
data from which to assess trends in PSN outputs as well as outcome measures.
This document is a research report submitted to the U.S. Department of Justice. This report has not been published by the Department. Opinions or points of view expressed are those of the author(s)
and do not necessarily reflect the official position or policies of the U.S. Department of Justice.

60
Table 17: Data submission profile
No data Submitted
Very Good
Good
Poor
Very Poor
# % # % # % # % # % 2000 43 46.2 9 9.7 15 16.1 12 12.9 14 15.1 2001 34 36.6 10 10.8 20 21.5 12 12.9 17 18.3 2002 36 38.7 9 9.7 20 21.5 16 17.2 12 12.9 2003 56 60.2 6 6.5 16 17.2 10 10.8 5 5.4 2004 61 65.6 4 4.3 15 16.1 9 9.7 4 4.3 2005 84 90.3 3 3.2 4 4.3 1 1.1 1 1.1 N=93 (Guam and Mariana Islands were considered one PSN District) Row totals may not equal 100% due to rounding.
Table 18: Data submission profile- categories collapsed
No data Submitted
Very Good or Good
Poor or Very Poor
# % # % # % 2000 43 46.2 24 25.8 26 28.0 2001 34 36.6 30 32.3 29 31.2 2002 36 38.7 29 31.2 28 30.1 2003 56 60.2 22 23.7 15 16.1 2004 61 65.6 19 20.4 13 14.0 2005 84 90.3 7 7.5 2 21.2 N=93 (Guam and Mariana Islands were considered one PSN District) Row totals may not equal 100% due to rounding.
As can be seen from the previous two tables, for most years it was difficult for at
least one-third of the PSN sites to submit any data at all to MSU. And, if data were
submitted, the quality leaned towards poor or very poor, making it difficult for MSU to
perform any sort of meaningful analysis with the submitted data. Indeed, the uneven data
reporting and the uneven quality of the data precluded comparisons across districts.
Some districts, with strong research partners and availability of crime information
systems were able to submit time series of data that could be used for analysis within the
district. The tables also indicate declines in data reporting over time that reflect in many
This document is a research report submitted to the U.S. Department of Justice. This report has not been published by the Department. Opinions or points of view expressed are those of the author(s)
and do not necessarily reflect the official position or policies of the U.S. Department of Justice.

61
cases the end of the original grant to the RP and the loss of research capacity to gather
and report data.
The problems with data availability and quality create significant problems for
evaluating a national program such as PSN. This was exacerbated by the nature of the
national UCR crime statistics that do not include measures of gun crime (other than for
jurisdictions with incident based reporting), cannot be analyzed at a level below the entire
city or county (as opposed to a specific target area), and that are only available with a
considerable time lag. The hope was that the involvement of RPs working with local
police departments could provide localized crime data but this proved very challenging,
particularly with respect to providing data that could be compared across jurisdictions.
The data reporting assessment was used as one indicator in a composite measure
of the integration of research in PSN task forces. This is described in the next chapter.
Changes in Federal Prosecution of Gun Cases Another indicator of PSN implementation was the level of federal prosecution of
gun crimes. As noted, one of the goals of PSN was to increase the level of federal
prosecution for illegal use of a firearm and possession by a prohibited person.
Nationally, the level of federal prosecution increased significantly. In fiscal year (FY)
2000 there were 8,054 federal firearms charge filings against defendants.20 By FY 2002
this had increased to over 10,000. During the FY 2003-2005 period filings were right
around 13,000 annually. Defendant filings declined somewhat in 2006 and 2007 but
were still over 12,000 each year. Using FY 2004 as the point of peak filings, federal
prosecution had increased 61 percent from FY 2000 before the implementation of PSN
(see Table 19).
This document is a research report submitted to the U.S. Department of Justice. This report has not been published by the Department. Opinions or points of view expressed are those of the author(s)
and do not necessarily reflect the official position or policies of the U.S. Department of Justice.

62
The national data, however, mask very significant variation across the federal
judicial districts. Ten districts experienced an increase of 200 percent or more. Fifty of
the districts observed increases of 60 percent or more. In sharp contrast, the bottom ten
districts ranged from no change to a 38 percent decline in firearms charge filings.
Table 19: Federal Firearms Cases (U.S. Code 922, 924), Defendant Filings, Ranked by Percent Change 2000-2004
District ID
FY 2000
FY 2001
FY 2002
FY 2003
FY 2004
FY 2005***
FY 2006
FY 2007
Pct Chg 2000-2004
1 12 14 35 97 87 72 47 50 625 2 8 13 73 42 42 30 34 52 425 3 27 45 65 96 138 108 113 71 411 4 68 113 212 263 322 213 229 258 374 5 41 63 111 191 168 196 167 157 310 6 21 30 40 103 86 119 100 89 310 7 12 26 60 65 48 62 34 55 300 8 15 12 13 30 48 37 48 54 220 9 99 202 250 376 304 232 192 186 207
10 28 24 58 78 84 74 99 87 200 11 13 18 26 29 38 32 44 34 192 12 44 58 66 43 119 105 121 114 170 13 30 38 61 72 81 131 138 131 170 14 53 57 56 76 141 90 88 88 166 15 83 82 178 218 219 143 116 50 164 16 27 34 58 65 68 67 65 38 152 17 88 103 195 229 215 215 160 133 144 18 22 47 38 37 52 39 40 39 136 19 141 129 191 334 314 287 268 242 123 20 65 63 149 137 144 164 131 92 122 21 30 42 49 35 66 33 46 55 120 22 27 28 26 51 59 32 16 21 119 23 140 191 345 346 302 379 382 447 116 24 54 93 95 111 114 129 158 136 111 25 128 127 170 283 269 265 257 270 110 26 11 18 14 20 23 36 25 25 109 27 67 66 83 110 139 183 176 148 107 28 34 25 50 75 68 107 110 88 100 29 36 96 53 81 70 103 99 73 94 30 127 200 186 238 244 249 196 232 92 31 124 105 123 171 233 157 214 221 88 32 157 202 224 282 291 197 94 38 85 33 180 153 243 328 333 292 265 181 85 34 36 36 53 56 66 100 98 100 83
This document is a research report submitted to the U.S. Department of Justice. This report has not been published by the Department. Opinions or points of view expressed are those of the author(s)
and do not necessarily reflect the official position or policies of the U.S. Department of Justice.

63
35 104 146 203 234 190 172 236 209 83 36 91 101 138 175 165 218 162 187 81 37 20 23 30 39 36 40 27 28 80 38 200 203 255 330 352 373 361 332 76 39 102 135 124 215 179 259 293 251 75 40 192 183 224 327 334 347 352 356 74 41 111 149 261 282 193 184 129 131 74 42 49 104 97 112 82 112 101 75 67 43 78 84 109 116 129 154 123 109 65 44 48 66 87 110 79 120 85 108 65 45 104 114 121 146 171 130 161 130 64 46 159 196 157 268 260 197 207 172 64 47 64 43 65 107 104 99 86 117 63 48 50 36 67 75 81 59 67 53 62 49 62 79 82 64 100 97 109 132 61 50 54 49 95 118 87 115 90 128 61 51 63 47 64 89 99 97 107 132 57 52 85 117 117 114 133 178 102 144 56 53 126 129 155 207 196 198 206 206 56 54 63 65 102 114 98 92 59 64 56 55 170 142 131 159 264 304 342 229 55 56 48 38 88 92 74 83 78 94 54 57 51 64 64 60 76 66 64 58 49 58 111 101 149 164 159 146 111 103 43 59 65 69 105 96 93 129 91 121 43 60 29 22 37 45 41 33 38 32 41 61 221 232 283 305 310 296 238 315 40 62 35 53 54 61 49 61 64 54 40 63 164 183 256 189 229 238 199 190 40 64 148 128 148 164 206 174 201 165 39 65 147 219 213 141 198 183 173 137 35 66 211 193 243 302 283 376 263 289 34 67 174 231 228 228 230 221 224 307 32 68 55 39 58 69 71 64 88 88 29 69 40 42 64 62 51 84 62 68 28 70 220 318 196 223 279 262 244 259 27 71 61 51 81 68 75 47 53 40 23 72 83 75 100 119 102 85 64 140 23 73 115 134 121 151 141 155 157 138 23 74 30 26 55 37 36 54 45 50 20 75 67 44 43 81 78 76 117 111 16 76 63 80 81 110 72 88 105 60 14 77 139 129 116 157 158 146 104 87 14 78 33 31 31 31 37 44 42 59 12 79 350 357 339 459 387 357 384 363 11 80 213 200 178 203 216 258 235 196 1 81 49 36 48 90 49 43 70 88 0 82 139 133 145 143 137 207 144 137 -1 83 93 74 79 112 85 71 112 62 -9 84 245 224 171 206 223 195 191 203 -9
This document is a research report submitted to the U.S. Department of Justice. This report has not been published by the Department. Opinions or points of view expressed are those of the author(s)
and do not necessarily reflect the official position or policies of the U.S. Department of Justice.

64
85 82 96 63 112 74 85 120 102 -10 86 70 48 50 65 59 89 78 83 -16 87 118 66 88 99 91 111 144 148 -23 88 143 123 118 139 93 118 79 65 -35 89 74 46 58 106 48 71 61 50 -35 90 29 25 30 23 18 14 20 49 -38
U.S. Total
8,054 8,845 10,634 13,037 12,962 13,062 12,479 12,087 61
Another way to view federal prosecution is to consider the level of prosecution
per the size of the population. Table 20 presents the federal filings against defendants for
firearms charges based on population of the judicial district. Nationally, the rate of
prosecutions increased from 2.8 per 100,000 population in FY 2000 to over 4.5 per
100,000 from FY2003-05. Again, there was significant variation across the districts.
The highest rate in 2004 was 51 per 100,000 and the top twelve districts had a
prosecution rate of 10 or more per 100,000 population. The bottom 13 districts had rates
under 2.0 per 100,000 population. This was less than half the national average and five
times lower than the top group of districts. Although, as reported in the previous section,
nearly every PSN project coordinator (98%) reported that increased federal prosecution
of gun crimes was a key PSN goal, the data clearly revealed that this was not achieved in
all districts.
This significant variation across the U.S. Attorney’s Offices in both the change in
level of federal prosecution and the rate of prosecution given district population provided
the opportunity to consider the level of prosecution as an indicator of PSN
implementation. Additionally, the level of federal prosecution served as a variable to
assess whether implementation of PSN had an impact on violent crime (discussed in
Chapter Seven).
This document is a research report submitted to the U.S. Department of Justice. This report has not been published by the Department. Opinions or points of view expressed are those of the author(s)
and do not necessarily reflect the official position or policies of the U.S. Department of Justice.

65
Table 20: Federal Firearms Cases (U.S. Code 922, 924), Defendant Filings, per 100,000 population, Ranked by Rate in 2004
District
ID* FY
2000 FY
2001 FY
2002 FY
2003 FY
2004 FY
2005 FY
2006 FY
2007
32 27.50 35.38 39.24 49.40 50.97 34.51 16.47 6.66 4 4.46 7.42 13.91 17.26 21.13 13.98 15.03 16.93
10 5.61 4.81 11.63 15.64 16.84 14.84 19.85 17.45 1 1.86 2.17 5.44 15.07 13.51 11.18 7.30 7.77 9 4.27 8.72 10.79 16.23 13.12 10.02 8.29 8.03
38 7.02 7.12 8.95 11.58 12.35 13.09 12.67 11.65 59 8.18 8.68 13.21 12.07 11.70 16.23 11.45 15.22 47 7.04 4.73 7.15 11.77 11.44 10.89 9.46 12.86 30 5.45 8.58 7.98 10.21 10.47 10.68 8.41 9.95 55 6.56 5.48 5.06 6.14 10.19 11.74 13.21 8.84 17 4.14 4.84 9.17 10.77 10.11 10.11 7.53 6.26 15 3.82 3.77 8.19 10.03 10.08 6.58 5.34 2.30 19 4.40 4.03 5.96 10.42 9.80 8.96 8.36 7.55 5 2.37 3.64 6.42 11.05 9.72 11.33 9.66 9.08
25 4.53 4.50 6.02 10.02 9.53 9.39 9.10 9.56 31 4.57 3.87 4.53 6.30 8.58 5.78 7.88 8.14 18 3.57 7.62 6.16 6.00 8.43 6.33 6.49 6.33 24 3.99 6.88 7.03 8.21 8.43 9.54 11.69 10.06 22 3.83 3.98 3.69 7.24 8.38 4.54 2.27 2.98 86 9.77 6.70 6.98 9.07 8.23 12.42 10.88 11.58 64 5.86 5.07 5.86 6.49 8.16 6.89 7.96 6.53 6 1.98 2.83 3.77 9.71 8.11 11.22 9.43 8.39
71 6.11 5.11 8.11 6.81 7.51 4.71 5.31 4.01 79 6.77 6.91 6.56 8.88 7.49 6.91 7.43 7.02 23 3.41 4.65 8.40 8.42 7.35 9.23 9.30 10.88 35 3.95 5.55 7.72 8.89 7.22 6.54 8.97 7.94 52 4.58 6.31 6.31 6.15 7.17 9.60 5.50 7.76 73 5.63 6.56 5.92 7.39 6.90 7.58 7.68 6.75 34 3.74 3.74 5.51 5.82 6.86 10.40 10.19 10.40 33 3.64 3.09 4.91 6.63 6.73 5.90 5.36 3.66 3 1.31 2.18 3.15 4.65 6.69 5.24 5.48 3.44
60 4.50 3.42 5.75 6.99 6.37 5.13 5.90 4.97 69 4.98 5.23 7.96 7.72 6.35 10.45 7.72 8.46 40 3.60 3.44 4.21 6.14 6.27 6.51 6.61 6.68 48 3.86 2.78 5.18 5.79 6.26 4.56 5.18 4.09 21 2.78 3.89 4.54 3.24 6.12 3.06 4.26 5.10 51 3.89 2.90 3.95 5.49 6.11 5.98 6.60 8.14 45 3.65 4.00 4.25 5.12 6.00 4.56 5.65 4.56 72 4.87 4.40 5.87 6.99 5.99 4.99 3.76 8.22 39 3.33 4.40 4.04 7.01 5.84 8.44 9.55 8.18 74 4.73 4.10 8.67 5.83 5.68 8.52 7.10 7.89 61 4.04 4.24 5.17 5.57 5.66 5.41 4.35 5.76 85 6.23 7.30 4.79 8.51 5.63 6.46 9.12 7.75
This document is a research report submitted to the U.S. Department of Justice. This report has not been published by the Department. Opinions or points of view expressed are those of the author(s)
and do not necessarily reflect the official position or policies of the U.S. Department of Justice.

66
56 3.59 2.84 6.58 6.88 5.54 6.21 5.83 7.03 82 5.60 5.35 5.84 5.76 5.52 8.33 5.80 5.52 13 1.96 2.48 3.98 4.70 5.28 8.54 9.00 8.54 2 0.99 1.61 9.04 5.20 5.20 3.72 4.21 6.44
66 3.87 3.54 4.45 5.53 5.19 6.89 4.82 5.30 46 2.97 3.67 2.94 5.01 4.86 3.68 3.87 3.22 78 4.34 4.07 4.07 4.07 4.86 5.78 5.52 7.75 14 1.79 1.92 1.89 2.56 4.75 3.03 2.96 2.96 83 5.19 4.13 4.41 6.25 4.74 3.96 6.25 3.46 76 3.97 5.04 5.11 6.93 4.54 5.55 6.62 3.78 58 3.15 2.87 4.23 4.66 4.52 4.15 3.15 2.92 50 2.78 2.52 4.89 6.07 4.48 5.92 4.63 6.59 84 4.49 4.10 3.13 3.77 4.09 3.57 3.50 3.72 42 2.39 5.07 4.73 5.47 4.00 5.47 4.93 3.66 67 2.95 3.92 3.87 3.87 3.90 3.75 3.80 5.21 70 3.02 4.37 2.69 3.06 3.83 3.60 3.35 3.56 89 5.84 3.63 4.58 8.37 3.79 5.61 4.82 3.95 8 1.18 0.94 1.02 2.35 3.76 2.90 3.76 4.24
29 1.93 5.16 2.85 4.35 3.76 5.53 5.32 3.92 7 0.89 1.94 4.47 4.85 3.58 4.62 2.54 4.10
80 3.49 3.28 2.92 3.33 3.54 4.23 3.85 3.21 77 3.11 2.89 2.60 3.52 3.54 3.27 2.33 1.95 37 1.87 2.15 2.80 3.65 3.37 3.74 2.52 2.62 68 2.49 1.76 2.62 3.12 3.21 2.89 3.98 3.98 49 1.91 2.43 2.52 1.97 3.07 2.98 3.35 4.06 12 1.13 1.49 1.70 1.10 3.06 2.70 3.11 2.93 41 1.66 2.23 3.90 4.22 2.89 2.75 1.93 1.96 63 2.05 2.29 3.21 2.37 2.87 2.98 2.49 2.38 36 1.54 1.71 2.33 2.96 2.79 3.68 2.74 3.16 81 2.68 1.97 2.63 4.92 2.68 2.35 3.83 4.82 27 1.22 1.20 1.51 2.00 2.53 3.32 3.20 2.69 44 1.43 1.96 2.58 3.27 2.35 3.56 2.53 3.21 57 1.47 1.85 1.85 1.73 2.20 1.91 1.85 1.68 53 1.36 1.40 1.68 2.24 2.12 2.14 2.23 2.23 26 0.93 1.53 1.19 1.70 1.95 3.06 2.12 2.12 43 1.13 1.22 1.59 1.69 1.88 2.24 1.79 1.59 16 0.73 0.93 1.58 1.77 1.85 1.82 1.77 1.03 11 0.59 0.82 1.19 1.33 1.74 1.46 2.01 1.55 20 0.71 0.69 1.63 1.50 1.58 1.80 1.44 1.01 75 1.33 0.88 0.86 1.61 1.55 1.51 2.33 2.21 54 0.98 1.01 1.59 1.77 1.52 1.43 0.92 1.00 62 1.04 1.57 1.60 1.81 1.45 1.81 1.90 1.60 28 0.72 0.53 1.06 1.58 1.44 2.26 2.32 1.86 88 1.91 1.64 1.58 1.86 1.24 1.58 1.05 0.87 65 0.83 1.24 1.20 0.80 1.12 1.03 0.98 0.77 87 1.37 0.77 1.02 1.15 1.06 1.29 1.68 1.72 90 0.95 0.82 0.98 0.75 0.59 0.46 0.66 1.61
U.S. Total
2.80 3.07 3.70 4.53 4.50 4.54 4.34 4.20
∗ District ID reflects the ranking based on percent increase from 2000 to 2004 reported in Table 19
This document is a research report submitted to the U.S. Department of Justice. This report has not been published by the Department. Opinions or points of view expressed are those of the author(s)
and do not necessarily reflect the official position or policies of the U.S. Department of Justice.

67
Integration of PSN Research: Indicators of Success and Struggles
As noted in Chapters One and Two, one of the unique components of PSN was
the support provided for research partners. Although both the project coordinators and
research partner reports indicated patterns of success in integrating RPs and research,
they also revealed significant variation across the districts in the perceived value and
success in research integration.
Research on collaborative task groups has found that effective decision-making
depends on the development of partner competencies, or the ability to both target the
mandated goal (vertical competency) and build information-sharing capacities among
group members (horizontal competency) (Agranoff & McGuire, 1998; Bardach, 2001).
To make truly strategic decision, these collaborative groups need to consider a wide
range of alternatives. Both the ease and effectiveness of strategic decision-making in
groups has been linked to the use of a person or process that is able to collect information
from all members of the collaborative group and distribute it back to members in a form
they can understand and utilize (Comfort, 2002, 2005; Csete & Doyle, 2004). This has
been referred to as the “information-transformation hub.”
The following brief analysis is offered to provide some indicators as to whether
Project Safe Neighborhoods (PSN) research partners were able to serve as an
information-transformation hub that allowed a task force to use data strategically. The
responses, which were taken from the July 2004 report by the U.S. Attorneys (or Project
Coordinators) to the Attorney General, provide some indicators of success, or potential
problems, integrating research into strategic decision-making.21 Responses were
available from ninety districts.
This document is a research report submitted to the U.S. Department of Justice. This report has not been published by the Department. Opinions or points of view expressed are those of the author(s)
and do not necessarily reflect the official position or policies of the U.S. Department of Justice.

68
How helpful is data analysis?
While task forces reported generally positive perceptions of their research efforts
and their research partners, there was some variation in their perceptions of how helpful
data analysis had been in focusing their task force on the gun violence issues. Illustrated
in Table 21, over one-half of the responses indicated that data analysis was somewhat
helpful, about one-third thought it was quite helpful, and twelve percent did not believe
data analysis had been helpful. These patterns were quite similar to those observed in the
data reported above from the 2005 Attorney General reports.
Table 21: Data helpfulness in focusing the task force on gun violence
Rating # of districts Percent Not helpful 11 12.4 Somewhat helpful 48 53.9 Very much 30 33.7 Total 89 100.0
Ingredients of Research Integration and Research Environment The integration of research would seem to be dependent on the qualities of the RP
and the availability of crime information sources. These components would also be
likely to be associated with the perceived value of research. These issues were addressed
by asking the following questions.
1. Was the presence of the research partner associated with the perception that data analysis is helpful?
2. Does having more information sources increase the perception that data analysis is helpful?
3. Was the presence of the research partner associated with having more data sources to utilize?
This document is a research report submitted to the U.S. Department of Justice. This report has not been published by the Department. Opinions or points of view expressed are those of the author(s)
and do not necessarily reflect the official position or policies of the U.S. Department of Justice.

69
• Question 1: Was the presence of the research partner associated with the perception that data analysis is helpful?
When asked about the attendance of the research partner at task force meetings,
there was a relationship between research partner attendance and the perception that data
were helpful in focusing the task force on issues of gun violence.22 For example, in
districts where it was reported that data were very helpful in focusing on issues of gun
violence, nearly three-quarters of the RPs attended all task force meetings. In contrast, in
districts where data were not considered helpful, only 30 percent of RPs attended all task
force meetings (see Table 22). There is a “chicken and egg question” in terms of
whether useful data led to RP attendance or attendance resulted in useful data, but the
pattern is clear that attendance in meetings and perceived utility of data were related.
Table 22: Research partner attendance and data helpfulness perceptions
Rating How often attend RP Helpful All Most Occasionally Never Missing Total Not Really 3 2 4 1 1 11 Somewhat 20 13 14 2 0 49 Very Much 22 1 6 1 0 30
• Question 2: Does having more information sources increase the perception that data
analysis is helpful?
As illustrated in Figure 3, at a statistically significant level23, the districts that
found data analysis most helpful were those that also had multiple data sources to utilize
in planning efforts. The average number of data sources ranged from 2.55 in the task
forces that did not find data helpful to 6.77 in the task forces that found data very helpful.
This suggests that the information infrastructure, or the availability of information
sources, was an important ingredient of research integration.
This document is a research report submitted to the U.S. Department of Justice. This report has not been published by the Department. Opinions or points of view expressed are those of the author(s)
and do not necessarily reflect the official position or policies of the U.S. Department of Justice.

70
Figure 3: Data sources used and helpfulness of data analysis
• Question 3: Was the presence of the research partner associated with having more
data sources to utilize?
Those surveyed were asked if they used each of eleven different data sources.24
The mean number of data sources across the 90 districts was 5.66 (standard deviation =
2.509). The association between the number of data sources and the attendance of the
research partner did not rise to statistical significance, as might be expected given the
small numbers in some of the categories. However, Figure 4 illustrates that a relationship
between number of information sources and attendance of RPs does appear to exist.
Thus, in districts where three or fewer information sources were used, RPs were less
likely to regularly attend task force meetings in comparison to districts with more
information sources (Figure 4).
0
1
2
3
4
5
6
7
8
Not really Somewhat Very much
Average number of data sources
This document is a research report submitted to the U.S. Department of Justice. This report has not been published by the Department. Opinions or points of view expressed are those of the author(s)
and do not necessarily reflect the official position or policies of the U.S. Department of Justice.

71
Figure 4: Percentage of data sources used and research partner attendance
Summary
These results supported the premise that available information systems and the
inclusion of the research partner in task force meetings resulted in data that were seen as
valuable to the task force. Again, these results cannot clarify whether it is a quality of the
task force (support for research), the research partner (desire to be an active research
collaborator), or availability of crime data that comes first and causes the other factors to
align. The results suggested that all three conditions are likely required if data and
analysis are to be effectively employed in task force planning and collaboration.
These patterns are explored in more depth in the following chapter as part of the
patterns of overall implementation.
0%
10%
20%
30%
40%
50%
60%
70%
80%
90%
100%
Never or occasionally Most of the time All of the time
10+
7‐9
4‐6
0‐3
This document is a research report submitted to the U.S. Department of Justice. This report has not been published by the Department. Opinions or points of view expressed are those of the author(s)
and do not necessarily reflect the official position or policies of the U.S. Department of Justice.

72
Chapter Five: Predictors of PSN Implementation
The various crime reduction initiatives in the past decade have taught us that to have a truly significant impact, the federal government must do more than just increase its arrest and prosecution numbers. Our efforts must be comprehensive. We must build effective partnerships with our state and local counterparts. We must enhance our capacity to obtain and analyze crime and other data that should guide our strategies and afford us the opportunity to measure the impact of our efforts…And we must build a powerful and lasting coalition with our citizens – one that empowers them to be agents of change in their own communities. Project Safe Neighborhoods is that comprehensive approach.
(DOJ, 2001, p. 2-6)
As mentioned earlier, the PSN initiative began in 2001. Funds were distributed to
the federal judicial districts based on a modified per capita formula. United States
Attorneys were tasked to convene a PSN planning team, to engage federal, state, and
local officials, and were encouraged to develop partnerships with social service
providers, community groups, community leaders, and community members. As noted
previously, PSN task forces were asked to focus on five key elements to frame gun
violence prevention efforts: 1) Partnerships, 2) Strategic Planning, 3) Accountability, 4)
Training, and 5) Outreach (DOJ, 2001).
PSN thus represented a model of federally-incentivized policies crafted to allow
local jurisdictions to build strategic and collaborative efforts to deal with complex
problems within the context of that jurisdiction. As noted in Chapter One, PSN was
developed with a recognition of the differences in implementation environments.
Consequently, policies and programs generally needed to be tailored to the specific needs
and resources of the particular jurisdiction. To this end, PSN stressed strategic planning
processes that would build coalitions among and across levels of government, public
This document is a research report submitted to the U.S. Department of Justice. This report has not been published by the Department. Opinions or points of view expressed are those of the author(s)
and do not necessarily reflect the official position or policies of the U.S. Department of Justice.

73
agencies, community leaders, and multiple stakeholder groups and use information to
drive action. Although this model had the power to catalyze local efforts, it also
complicated efforts to create measures of implementation and measures of success.
In order to maximize the return on investment of federally-incentivized policies
such as PSN, it is critical to understand the extent to which jurisdictions were able to
implement the policy, and what factors predict successful implementation, struggles, or
implementation failure. This chapter presents measures constructed to determine which
core principles were implemented, and reviews findings on factors that were associated
with implementation success. The evaluation question addressed in this chapter is why
were some districts able to more fully implement the PSN policy?
Evaluation Mission: Theory and Questions
A risk framework, integrating organizational performance models of competing
factors proposed by Quinn (1991), group performance proposed by Comfort (2002,
2005), and cell survival proposed by Csete (2004), provided the theoretical basis for the
hypothesis and evaluation questions (Zimmermann, 2006). The risk framework of policy
implementation is based on the proposition that implementation is most likely when key
decision-makers perceive the benefits of implementation to exceed the costs.
Conversely, implementation is unlikely to occur when the risks of implementation are
likely to exceed benefits. The calculation will be influenced by perceptions of both the
likelihood of the costs as well as their magnitude, relative to benefits.
Quinn provided a framework upon which to build hypotheses. Comfort, building
on Csete’s models, proposed that success in group implementation of any policy or
protocol depends on the ability of the collaborative group to both share information and
This document is a research report submitted to the U.S. Department of Justice. This report has not been published by the Department. Opinions or points of view expressed are those of the author(s)
and do not necessarily reflect the official position or policies of the U.S. Department of Justice.

74
to use that information in service to a shared goal or objective. Comfort (2002; 2005)
found that the greater the similarity between organizations in a collaborative effort, the
less energy and resources it takes to share information. Comfort, translating Csete’s
(2004) research into a model of group behavior, predicted that if a framework is
institutionalized that allows information to flow into the group and translate that
information into forms that all members can use, then the costs, energy, and resources
necessary to participate in and draw a net benefit from the collaboration are reduced and
implementation is enhanced.
These models led to the general evaluation hypotheses that PSN implementation
will be enhanced by:
1) the ability of group members to easily share ideas and information because of a past history of collaboration,
2) research resources which increase the usefulness of information to all participating members and groups,
3) a perception that PSN will produce a net positive for all participating groups when the need for the policy and the resources provided for the policy are weighed against the cost of participation.
This chapter, therefore, attempts to test the degree to which these factors enhanced PSN
implementation.
Evaluation Limitations
Project Safe Neighborhoods was designed as a full coverage program, meaning
that all federal judicial districts are engaged in the program. Full coverage programs,
while providing a benefit for all, limit the potential to create a true experiment to
determine factors that aid or inhibit implementation success. Rather than compare
similar districts who did – and did not – receive resources under PSN, a full coverage
evaluation relies on comparisons of the extent to which the policy was adopted.
This document is a research report submitted to the U.S. Department of Justice. This report has not been published by the Department. Opinions or points of view expressed are those of the author(s)
and do not necessarily reflect the official position or policies of the U.S. Department of Justice.

75
Borrowing from the medical field, criminologists and public policy researchers
have begun to talk about the idea of interventions and dosages. If one jurisdiction
implemented PSN fully and another only implemented a portion of the policy, one could
think about this as the districts receiving all of the recommended interventions or limited
interventions. One could thus think of jurisdictions as receiving a lower or higher dose of
the intervention. Consequently in this analysis we assessed variation across districts and
investigated factors that led to lower or higher levels of implementation.
Additional limitations, or evaluation challenges, are the broad nature of the
initiative and the practical problems in gathering consistent and reliable information
across time and across an entire country. Another threat to the internal validity of PSN
implementation measures is the threat referred to as history – or conditions occurring in
the policy environment that influence the outcome but that are not related to the program.
An example would be a natural disaster – such as Hurricane Katrina. While difficult to
quantify in an evaluation, a reasonable hypothesis would be that the disruptions in the
Eastern District of Louisiana, related to the natural disaster, would influence
implementation of PSN.
Defining PSN Implementation
For the purpose of this report, PSN implementation was defined by the level of
adoption of each of the core elements as measured by an aggregate score of adoption of
three core elements (Figure 5). Specifically, measures were constructed based on
indicators of engaging partners, strategic planning, and enhanced federal prosecution.25
This document is a research report submitted to the U.S. Department of Justice. This report has not been published by the Department. Opinions or points of view expressed are those of the author(s)
and do not necessarily reflect the official position or policies of the U.S. Department of Justice.

76
Figure 5: Policy Implementation Measures
Partnerships
Data‐Driven Plans
Prosecution
Policy
Implementation
Data Sources
For this evaluation, a variety of data sources were used. Those sources included
information from the semi-annual reports submitted to DOJ by each district on PSN
implementation progress, data reports on gun-related crime submitted to both the
Department of Justice and the PSN Research Team at Michigan State University (MSU),
official data from the United States Department of Justice and the United States Census
Bureau, a survey of PSN Research Partners conducted by the PSN Research Team at
MSU, and other publicly available information sources.26 Most measures were available
for ninety of the ninety-four federal judicial districts under study.27 However,
approximately twelve percent of the district research partners did not complete the
research partner survey, so data for all measures were available for 79 districts.
This document is a research report submitted to the U.S. Department of Justice. This report has not been published by the Department. Opinions or points of view expressed are those of the author(s)
and do not necessarily reflect the official position or policies of the U.S. Department of Justice.

77
Implementation Success: Constructing Measures
Partnerships
The semi-annual reports submitted by each United States Attorney’s Office
(USAO) indicated that all districts have conducted team meetings and have, to a greater
or lesser extent, invited or actively engaged partners from across levels of government
and across agencies. In order to construct an implementation success measure, responses
in the report were used that indicated the types of programs that were implemented.
Types of interventions were grouped by category. For example, to assess the degree to
which law enforcement actively participated in PSN implementation, a law enforcement
category was established. If the report from the USAO indicated that any law
enforcement intervention had been implemented, such as directed patrol or street-level
enforcement, the district would be given a score of 1 for that category. Seven possible
areas of collaboration were identified and therefore scores could range from zero to
seven. That process was used for all categories and the final partnership score was a sum
of all categories score. The collaboration areas and questions from the USAO reports
used to construct the categories are listed in Appendix A.
Data-Driven Planning
Three information sources were used to construct a measure of the degree to
which data were used to drive planning processes. Information from the USAO semi-
annual reports and information gathered from the research partner survey were used.
Questions and ratings used can be found in Appendix B. The items from the research
partner survey included those indicating the degree to which the researcher had been able
to analyze gun crime in the district, the extent to which information was being used to
This document is a research report submitted to the U.S. Department of Justice. This report has not been published by the Department. Opinions or points of view expressed are those of the author(s)
and do not necessarily reflect the official position or policies of the U.S. Department of Justice.

78
drive decisions, and whether ongoing evaluations were being completed. One question
from the USAO semi-annual reports to the AG was used. That question asked about the
helpfulness of data in planning. The third element was a rating of data quality. The
quality of gun crime data reported was rated by the MSU PSN National Research Team.
Ratings for four years of data reporting were aggregated and scored. Using all three data
sources, a scale, with a maximum score of fourteen, was constructed for data-driven
planning.
Enhanced Federal Prosecution
In order to reflect both the change in federal prosecutions for gun crimes and the
order of magnitude in that change, given different environments, two prosecution
measures were used to create an overall measure of enhanced federal prosecution. The
numeric change in federal prosecutions for gun crime and the change in per capita federal
prosecutions for gun crime indicating the difference for the year prior to PSN
implementation (2000) compared to the next four years, were reduced to a factor score.
This was done through a principle component analysis (oblique rotation). One factor was
extracted, and that factor explained 82.9 percent of the variance.
Overall PSN Policy Implementation
To measure overall implementation, scores from the three implementation
elements were converted to standardized form and summed. Implementation success was
constructed in several ways in order to better understand the patterns of implementation
success or failure. By constructing success by implementation element and in aggregate,
it was possible to use a continuous measure that rated districts on overall success and
success on each of the elements. This provided insights into implementation patterns.
This document is a research report submitted to the U.S. Department of Justice. This report has not been published by the Department. Opinions or points of view expressed are those of the author(s)
and do not necessarily reflect the official position or policies of the U.S. Department of Justice.

79
For example, a district might have been very successful in increasing federal prosecution
for gun crime, but had marginal success in using data-driven planning or building
collaborative programs. Having the option to explore each element provided an ability to
identify districts that experienced implementation success in a particular domain.28
In addition to creating these continuous scales, districts were also grouped into
high, medium, and low implementation in each area and overall. This simplified scale
permitted patterns of success to be analyzed by general group and enhanced the ability to
create graphic images to illustrate patterns of implementation.
Patterns of Policy Implementation
Bivariate analysis of the policy elements of 1) engaging partners, 2) using data to
drive decisions, and 3) enhanced federal prosecution indicated support for the evaluation
hypothesis that a research focus enhances the ability of the collaborative group to
implement other aspects of PSN. As illustrated in Table 23 and Figure 6, higher scores
on the research element were significantly correlated with engaging a broader range of
partners in an array of PSN programs. The significance level of this correlation was <
.01.
Data-driven decision-making was also significantly associated with enhanced
federal prosecution (Table 23 and Figure 6). Higher scores on using data to drive
decisions were associated with increases in rates of federal prosecution for gun crime.
However, there was no significant association between engaging a broader range of
partners and increasing rates of federal prosecution for gun crime (Table 23 and Figure
6).
This document is a research report submitted to the U.S. Department of Justice. This report has not been published by the Department. Opinions or points of view expressed are those of the author(s)
and do not necessarily reflect the official position or policies of the U.S. Department of Justice.

80
Table 23: Correlations among PSN Policy Elements
Partners Data-driven Prosecution Partners Pearson Correlation 1.00 Sig. (2-tailed) N Data-driven Pearson Correlation 0.34 1.00 Sig. (2-tailed) 0.00** N 79 Prosecution Pearson Correlation 0.04 0.25 1.00 Sig. (2-tailed) 0.70 0.03* N 90 79 **correlation is significant at the .01 level (2-tailed). *correlation is significant at the .05 level (2-tailed).
This finding indicated support for the proposal that using research strategies both
aided groups in working together toward a common goal and provided critical
information to help the group achieve its mission. Why, then was there no significant
correlation between engaging in a broad range of efforts with a broad range of entities
and enhanced federal prosecution?
The Comfort and Csete models indicated that if groups do not have the human or
technical ability to easily share information across multiple groups, that those groups will
restrict communication and collaboration to groups with whom they have common
definitions, work patterns, and goals. As an example consider a PSN task force including
prosecutors and law enforcement officials with a long history of prosecutors working
with law enforcement, but little history of collaboration with schools. The school
officials have data systems that are not compatible with those of law enforcement and
prosecution, and members have some fears about legal and administrative constraints on
data sharing across these systems. School officials have some concerns about gun
violence, but addressing gun violence may be much lower on their goal structure than it is
for law enforcement officials or prosecutors. The Comfort and Csete models would
This document is a research report submitted to the U.S. Department of Justice. This report has not been published by the Department. Opinions or points of view expressed are those of the author(s)
and do not necessarily reflect the official position or policies of the U.S. Department of Justice.

81
predict narrow implementation – or implementation that allowed group members to
actively engage only with those members and on those projects for which information
sharing and planning could be accomplished with some ease. For PSN, with the locus of
funding and leadership lodged in federal prosecution, it was hypothesized that narrow
implementation would involve a prosecution focus. An analysis of the patterns of
implementation for districts scoring in the lowest third, in terms of data-driven decisions,
indicated that one-half (14 of 28) of the districts that scored in the lowest third on data-
driven processes, also scored in the lowest third in engaging partners (Table 24 and
Figure 6). Only 14 percent were able to implement a high level of collaboration. In
contrast, only 29 percent of districts in the lowest third of data-driven implementation
scored in the lowest third for enhanced prosecution, and 28 percent of these districts
scored in the highest third of enhanced prosecution.
Table 24: Cross tabulation of Implementation Elements
Engaging Partners Enhanced Prosecution Low Medium High Low Medium High N % N % N % N % N % N % Data-Driven
Low 14 0.18 8 0.10 6 0.08 8 0.10 12 0.15 8 0.10 Medium 16 0.08 10 0.13 6 0.08 7 0.09 8 0.10 7 0.09
High 4 0.05 10 0.13 15 0.19 10 0.13 7 0.09 12 0.15
This document is a research report submitted to the U.S. Department of Justice. This report has not been published by the Department. Opinions or points of view expressed are those of the author(s)
and do not necessarily reflect the official position or policies of the U.S. Department of Justice.

82
Figure 6: Correlation among Implementation Elements
Data‐Driven
Enhanced Prosecution
Engaging Partners
r =.34p <.01
r =.25p <.05
The key point is that data-driven decision-making was related to both the
development of collaborative partnerships and the level of federal prosecution. Beyond
this threshold, it appeared that some districts were able to implement a more narrowly-
focused PSN strategy based on increased federal prosecution even if there was little
reliance on data-driven processes. However, it was rare to find healthy collaborations
absent data-driven processes.
Factors in the External Environment
A risk model to predict policy implementation, based on the Quinn (1991)
competing factors model could be framed to test the degree to which factors in the
external policy environment can predict the degree to which districts were able to
implement PSN (Zimmermann, 2006). Factors in the external environment were chosen
for two reasons. First, the theories underlying the model predict that members of a
collaborative group, such as the PSN team, would view policy implementation as lower
This document is a research report submitted to the U.S. Department of Justice. This report has not been published by the Department. Opinions or points of view expressed are those of the author(s)
and do not necessarily reflect the official position or policies of the U.S. Department of Justice.

83
risk, and of more benefit, if the policy targets a compelling need and commonly-held
goal, if the district has the human and technological capacity to work together to address
the goal, if the public and key constituents will support the policy, and if resources are
provided that promise a net positive benefit from implementation.
A second reason that external factors were chosen for this test, was that such
factors are readily available to policy makers and researchers prior to policy
implementation. A review of such factors could aid policy makers in deciding how to
incentivize policies, such as PSN, and identify districts that might be positioned to best
implement such a policy.
Figure 7: Comparison of Implementation Levels of Districts in the Lowest Third of Data-Driven Implementation on Engaging Partners and Enhanced Prosecution
A Risk Model of PSN Implementation
The Risk Model for PSN implementation focuses on four sectors: 1) needs and
goals, 2) infrastructure, 3) human factors, and 4) resources. The construction of the
model and each of these variables was explained in depth in an earlier version of this
analysis (Zimmermann, 2006). A simplified model of and an overview of factors and
results is presented here.
Engaging Partners
Low
Medium
High
Prosecution
Low
Medium
High
This document is a research report submitted to the U.S. Department of Justice. This report has not been published by the Department. Opinions or points of view expressed are those of the author(s)
and do not necessarily reflect the official position or policies of the U.S. Department of Justice.

84
Needs and Goals - Gun Crime
Zimmermann (2006) investigated the level of need for PSN in two ways. The
need for PSN was measured as the level of selected violent crimes per capita in the year
prior to PSN implementation. The prediction was that PSN districts with higher levels of
violent crime would perceive more benefits and lowered risks for implementing PSN.
Since gun crime is not a specific reporting category in the Uniform Crime Report, the
level of reported homicides, robberies, aggravated assaults, and rapes were constructed as
a surrogate measure. The second variable was federal prosecutions for gun crime (per
capita), also for the year prior to PSN implementation.
Infrastructure
Two infrastructure variables were constructed. The first infrastructure variable
measured human capacity for collaboration. Districts were grouped into those that had
had experience with a similar collaborative process and those without such a history. The
second variable was a rating of the overall information systems capacity in the policy
environment.29 This scale was constructed by Barrett, Greene, and Mariani, rating the
competency of the public sectors in information technologies and infrastructure (2001).
The hypothesis was that in districts with experience in multi-agency collaboration and
with an information infrastructure that can support data-driven decision making and
information sharing, the benefits of implementing PSN would exceed the costs. In
contrast, in contexts with little experience of collaboration and lacking an information
infrastructure, the costs may exceed the benefits.
This document is a research report submitted to the U.S. Department of Justice. This report has not been published by the Department. Opinions or points of view expressed are those of the author(s)
and do not necessarily reflect the official position or policies of the U.S. Department of Justice.

85
Human Factors – Public and Political Attitudes
Public and political attitudes toward offenders were constructed using a surrogate
measure of the number of state prison inmates incarcerated on an average daily basis per
capita. This measure was constructed using average daily population prison statistics and
United States Census Bureau data (ACA, 2000; USCB, 2000).30 The incarceration rate,
having controlled for levels of violent crime, served as a proxy for public and political
sentiments toward criminal sentencing policy. Presumably in a context where there is
more support for harsh sentencing, the benefits of increasing use of federal prosecution
for violent gun offenders would more likely to exceed the costs of policy implementation.
Resources
A resource variable was constructed using 2003 funding levels. As noted earlier
in this chapter, funding was provided on a modified per capita formula. The modified
formula provided a “floor” level for the lowest population districts and capped the
highest population districts. Presumably, higher relative levels of resources should
decrease the costs of implementation.
Data Analysis
Descriptives and Bivariate Analysis
Table 25 provides a description of the measures or central tendency (means) and
variation of the variables used in this analysis. Of note is that, since PSN was a full
coverage program, the implementation environment for PSN varies widely. An example
is gun crime per capita, which – in the year 2000 – ranged from a low of roughly 44
serious, violent crimes per 100,000 to approximately 1,500 per 100,000. Bivariate
This document is a research report submitted to the U.S. Department of Justice. This report has not been published by the Department. Opinions or points of view expressed are those of the author(s)
and do not necessarily reflect the official position or policies of the U.S. Department of Justice.

86
correlations indicated that the following variables were positively and significantly
associated with higher levels of PSN implementation (see Table 26):
1) violent crime, 2) federal prosecutions of gun crime, prior to implementation, 3) higher levels of information technology, and 4) prior experience with similar collaborative decision-making processes.
Neither the level of funding nor the number of inmates per capita were correlated with
the level of PSN implementation.
Table 25: Descriptive Statistics for Predictor Variables
N Mean Min. Max. SD Needs and Goals Sector Violent crime 89 490.63 53.58 1507.36 253.85 Federal prosecution – gun crime 90 2.88 0.5 23.82 7.5 Structure and Infrastructure Technology 89 7.08 2.00 11.00 1.90 Prior collaborative programs 87 0.77 1.00 2.00 0.42 Human Factors Sector Incarceration rate 89 405.99 114.61 775.09 151.01 Resources and Survival Sector PSN funding 90 584,841 285,000 1,300,000 345,347
This document is a research report submitted to the U.S. Department of Justice. This report has not been published by the Department. Opinions or points of view expressed are those of the author(s)
and do not necessarily reflect the official position or policies of the U.S. Department of Justice.

87
Table 26: Bivariate Correlations: Implementation to Predictor Variable and Among Predictor Variables
Implementation Crime Cases Technology Programs Inmates Funding Implementation Pearson
Correlation 1.00
Sig. (2-tailed) N 79 Crime Pearson
Correlation 0.37 1.00
Sig. (2-tailed) 0.00** N 78 89 Cases Pearson
Correlation 0.28 0.33 1.00
Sig. (2-tailed) 0.01* 0.00** N 79 89 90 Technology Pearson
Correlation 0.35 0.00 0.05 1.00
Sig. (2-tailed) 0.00** 1.00 0.61 N 78 88 89 89 Programs Pearson
Correlation .046 0.27 -0.02 0.11 1.00
Sig. (2-tailed) 0.00** 0.01* 0.85 0.33 N 76 86 87 86 87 Inmates Pearson
Correlation 0.00 0.33 0.07 -0.08 0.23 1.00
Sig. (2-tailed) 0.98 0.00 0.53 0.46 0.03* N 78 88 89 89 86 89 Funding Pearson
Correlation 0.12 0.28 -0.30 0.18 0.29 0.03 1.00
Sig. (2-tailed) 0.28 0.01** 0.00** 0.09 0.01** 0.81 N 79 89 90 89 87 89 90
Analysis of the Risk Model
A least squares regression analysis was conducted (Table 27). The analysis
indicated that the model predicted roughly 45 percent of the variation in implementation
across the PSN districts. The human and technological competency factors in the
infrastructure sector were the only factors that significantly influenced the model. This
means that, once other factors in the model were controlled for statistically, variation in
the other factors were not helpful in explaining or predicting the level of implementation
districts were able to achieve.
Both the strength of the infrastructure sector and the theory underlying this
analysis indicated the potential importance of districts’ ability to collaborate and use
This document is a research report submitted to the U.S. Department of Justice. This report has not been published by the Department. Opinions or points of view expressed are those of the author(s)
and do not necessarily reflect the official position or policies of the U.S. Department of Justice.

88
information. Given this, a subgroup analysis was conducted to explore the degree to
which infrastructure may play a key role, and be an important factor for policy makers to
understand as they craft federally-incentivized policies – such as PSN.
Table 27: Implementation Regressed on the Risk Model
Coefficient Std. Error Beta Sig. Crime 0.00 0.00 0.18 0.08 Cases -0.03 0.13 -0.03 0.79 Technology 0.34 0.10 0.33 0.00** Programs 1.75 0.33 0.50 0.00** Inmates 0.00 0.00 -0.09 0.32 Funding 0.00 0.00 -0.07 0.53 R2= .45, N=73, intercept = -3.89 ** p<.01
Analysis of High and Low Information Technology Groups
In order to test the potential that a jurisdiction that included a better management
information infrastructure was critical to lowering the cost – or risk – of PSN
implementation, a subgroup analysis was performed. To create the subgroups, districts
were divided into two groups as designated as either high information technology or low
information technology.31
Low technology districts had significantly less success in implementing PSN. For
low technology districts, the level of gun crime had no significant impact on PSN
implementation. However, one finding that reinforced the need for information sharing
was that prior experience with similar strategic partnerships was significantly correlated
with implementation success.
This document is a research report submitted to the U.S. Department of Justice. This report has not been published by the Department. Opinions or points of view expressed are those of the author(s)
and do not necessarily reflect the official position or policies of the U.S. Department of Justice.

89
Overall Implementation for High and Low Technology Groups
A comparison of the mean level of implementation for all groups and for high and
low technology subgroups indicated that those districts in the high technology group
implemented PSN at a significantly higher level (p<.01) than those in the low technology
group.32 Figure 8 illustrates the differences between the two groups. All districts were
divided into three groups, based on overall implementation scores: low, medium, and
high implementation. As pictured in Figure 8, roughly 40 percent of low technology
districts were classified as low implementers. In the high technology group, the percent
was about half that of the low technology group. For the high technology group, almost
half the group were high implementers – while about a quarter of the low technology
group were in the highest third on implementation.
This document is a research report submitted to the U.S. Department of Justice. This report has not been published by the Department. Opinions or points of view expressed are those of the author(s)
and do not necessarily reflect the official position or policies of the U.S. Department of Justice.

90
Figure 8: Comparison of Low and High Information Technology Districts on PSN Implementation Levels
Information Technology
High24%
Medium35%
Low41%
Low
High45%
Medium34%
Low21%
High
Discussion
The results of the various analyses support a risk-based theory of PSN
implementation. The comparison of the levels of adoption of the three elements of PSN
implementation – data-driven decision making, collaborative program implementation,
and enhanced prosecution – reinforces both the efficacy of the inclusion of a research
component in the strategy and the strength of the risk model. As research capacity
increased, so did both the ability to implement protocols across agencies and areas and
the ability to increase gun prosecutions.
The results of the external factor models and subgroup analysis, similarly,
reinforce the potential predictive power of the risk model. The model would predict that
having the human and technological capacity to share data and use that information to
solve problems decreases the costs of implementing a policy such as PSN. For districts
This document is a research report submitted to the U.S. Department of Justice. This report has not been published by the Department. Opinions or points of view expressed are those of the author(s)
and do not necessarily reflect the official position or policies of the U.S. Department of Justice.

91
with a history of collaborative decision making and with the infrastructure in place to
share information in service to that decision making, implementing PSN would require
less investment. Since the human investment of coalition building and group dynamics is
lessened, as is the fiscal and technological resources needed to set up an infrastructure to
share information, the expected return on investment (ROI) for participation in PSN
would be greater. Conversely, the results would support the theory that in districts in
which humans would need to spend a good deal of time and energy setting up good group
processes and building trust – and creating a management information system that could
overcome interoperability issues – that the costs are so high that PSN is too costly, too
much of a risk to undertake.
Of critical note is that these factors were predictive of level of implementation
whereas the levels of violent crime in the district were not. This suggests that beyond the
“push factor” of level of violent crime, these components of data-driven decision-making,
dependent on prior collaboration, and information infrastructure, were more influential of
the degree of PSN implementation.
Conclusion
The results of this research indicated that some districts were highly successful at
implementing PSN, while others struggled. Given the findings, it can be argued that a
key to success was a human and technological infrastructure that allowed districts to
engage in the strategic, collaborative planning and implementation that was envisioned
for the PSN policy.
Given that, there are implications for policy. For complex issues, such as
strategically addressing gun violence at the district level, decision makers may wish to
This document is a research report submitted to the U.S. Department of Justice. This report has not been published by the Department. Opinions or points of view expressed are those of the author(s)
and do not necessarily reflect the official position or policies of the U.S. Department of Justice.

92
consider the infrastructure of the local jurisdiction, prior to determining the type of
resources to make available to that area. For areas with well developed human and
technical competencies, funding and supporting a collaborative, strategic policy would be
predicted to meet with success. However, incentivizing such a policy in a district without
experience in collaborative and strategic planning among expected partners – or in a
district with limited information systems infrastructures, the ROI would be expected to be
low.
In a low infrastructure jurisdiction, policy makers might consider two options.
One would be to assess the human and technological capacities necessary to implement
such a policy, and first fund the necessary upgrades, training, and resources needed to
build capacities. Only after this capacity-building phase, would incentives be offered to
move the collaborative group toward implementation of the policy.
A second option for jurisdictions with low infrastructural capacity would be
incentivized policies that did not require the breath of collaboration that is necessary in a
policy, such as PSN. A policy that could be implemented by one agency, or a narrow
group of similar agencies, does not hold the promise for truly strategic problem solving
and community empowerment. However, it does lower the costs and risks for
jurisdictions that do not have the infrastructure in place to successfully implement
strategic and collaborative policies.
Finally, as noted in other sections of the report, the case studies conducted with
high implementation PSN task forces revealed a consistent pattern of demonstrated
leadership that was noted consistently in site visit interviews. Typically this involved
some combination of leadership and vision from the U.S. Attorney, the PSN coordinator,
This document is a research report submitted to the U.S. Department of Justice. This report has not been published by the Department. Opinions or points of view expressed are those of the author(s)
and do not necessarily reflect the official position or policies of the U.S. Department of Justice.

93
the Chief of Police, local prosecutor, and other officials. Our data cannot address the
“chicken and egg” question of whether strong leadership produced a commitment to data-
driven decision-making, prior development of partnerships, and an information
infrastructure, or whether these capacities enabled strong leaders to implement the PSN
model more effectively. Based on the PSN experience as well as decades of research on
program implementation, it seems likely that both leadership and the infrastructure and
human factors sectors are critical for effective implementation.
Solving complex problems, such as gun violence, requires complex and rich
protocols, engaging multiple stakeholder groups. Project Safe Neighborhoods was a
federal effort that recognized the need to knit strong webs of official and local resources,
to strategically develop targeted problem solving interventions, with the goal of creating
a unified safety net for communities. However, to be successful, jurisdictions will need
to build the capacity to work together, using the best possible information, to create
solutions that are truly strategic.
This document is a research report submitted to the U.S. Department of Justice. This report has not been published by the Department. Opinions or points of view expressed are those of the author(s)
and do not necessarily reflect the official position or policies of the U.S. Department of Justice.

94
Chapter 6: Comprehensive Case Studies
An initial stage in the research on the implementation and impact of Project Safe
Neighborhoods, consisted of a series of case studies of specific PSN district programs.
These site-specific case studies were intended to provide information about how PSN was
structured and implemented in different jurisdictions. PSN was developed as a national
program tailored to address varying gun crime patterns in local jurisdictions. One of the
key roles of the research partner was to analyze these patterns to help inform the local
PSN task force. This local nature of PSN also made it important to examine
implementation and impact at the local level. Consequently, the series of site-specific
cases studies addressed these issues.
The local nature of the national PSN program also created challenging evaluation
issues. Whereas some components of PSN (e.g., coordination through U.S. Attorney’s
Office; national media campaign; inclusion of research partners and community
engagement partners) were common across the country, other components were locally
driven (e.g., specific target areas, intervention strategies). Additionally, there was
significant variation across the various PSN districts in terms of the timing of PSN
implementation. As noted in the previous chapter, it appeared that in districts with
existing federal-state-local programs focused on gun crime, the implementation of PSN
often occurred at a quicker pace than was the case in districts where new relationships
focused on gun crime had to be forged. Similarly, where research partners had
established relationships with local criminal justice agencies the integration of research
tended to occur more rapidly.
This document is a research report submitted to the U.S. Department of Justice. This report has not been published by the Department. Opinions or points of view expressed are those of the author(s)
and do not necessarily reflect the official position or policies of the U.S. Department of Justice.

95
These characteristics raised a number of thorny evaluation issues. For example,
the national dimensions of PSN made it difficult to identify comparison sites to assess the
impact of PSN. Similarly, the multiple components of PSN made it difficult to generalize
across all PSN districts in terms of the nature and intensity of PSN intervention strategies.
For example, in some districts, PSN resulted in a significant increase in federal
prosecution of gun crime case coupled with a communication strategy of a deterrence-
based message. This reflected a Project Exile-type strategy. In other districts, research
helped isolate particular target areas and dimensions of gun violence (e.g., gangs, drug
market locations) and resulted in focused interventions targeted at these dimensions. This
reflected a SACSI-type strategy referred to as “strategic problem solving/pulling levers.”
Given this variation across districts, as a first step in the national research
program, a series of site-specific case studies was conducted. Having decided on this
approach, the first challenge was choosing districts for study. The main criterion for
selection was a sense that key components of the PSN strategy had been implemented in
a meaningful fashion and had been in operation for a sufficient period to potentially
affect levels of gun crime. The MSU research team reviewed multiple indicators in an
effort to identify districts meeting these criteria. These included district reports to the
Department of Justice (DOJ), interviews with PSN project coordinators and PSN research
partners, and review of data and project reports submitted to DOJ. From these sources,
districts were nominated for a possible case study based on:
• Evidence of implementation of PSN strategies (e.g., increased federal prosecution, joint prosecution case review processes, incident reviews, offender notification meetings, chronic violent offender programs, targeted patrol, probation/parole strategies, gang strategies, prevention, supply-side strategies, etc.)
This document is a research report submitted to the U.S. Department of Justice. This report has not been published by the Department. Opinions or points of view expressed are those of the author(s)
and do not necessarily reflect the official position or policies of the U.S. Department of Justice.

96
• Evidence of new and enhanced partnerships (local, state, federal; community, etc.)
• Integration of research partners and/or evidence of research-based strategies • Meaningful implementation for a sufficient time period to allow assessment of
impact • Sufficient base-rate levels of gun crime to allow assessment of impact
In effect, these dimensions were employed to ask: Is gun crime being addressed
differently in this district based on one or several of the PSN core components?
Once sites were identified, the MSU research team conducted site visits to learn
more about PSN structure, implementation, and impact. Cooperative relationships
between the local research partners and the MSU research team were established for the
purpose of generating the case studies. This provided the benefit of the “deep knowledge”
of the local research partners with the “independent eyes” of the national research team.
Given this strategy, in effect a purposive sampling approach, the case studies
cannot be considered representative of PSN in all 94 judicial districts. Rather, these were
studies of PSN within specific sites. These studies were intended to generate new
knowledge about the adaptation of the national PSN program to local contexts as well as
about the impact of PSN on levels of gun crime in specific jurisdictions. This chapter
summarizes the results of the comprehensive case studies conducted by MSU.
Project Exile-Strategy Sites
The Middle and Southern Districts of Alabama
The State of Alabama is served by three federal judicial districts, with
corresponding United States Attorneys’ Offices (USAOs): the Northern, Middle, and
Southern Districts. In terms of PSN, Alabama was unique because the three districts
coordinated a common Project Safe Neighborhoods (PSN) theme, logo, and message.
Specifically, Alabama ICE, standing for Isolate the Criminal Element, was the common
This document is a research report submitted to the U.S. Department of Justice. This report has not been published by the Department. Opinions or points of view expressed are those of the author(s)
and do not necessarily reflect the official position or policies of the U.S. Department of Justice.

97
vehicle used across all three districts to communicate a consistent theme: Gun Crime =
Hard Time. Two of the three federal districts were the focus of comprehensive case
studies by the MSU research team: the Middle and Southern Districts.33
The comprehensive case studies revealed that the two sites largely implemented
PSN in a Project Exile fashion. The increased federal prosecution component was
coupled with a community-wide strategy of communicating the threat of sanctions. This
was a core ingredient of the statewide ICE program and was modeled on Richmond’s
Project Exile. Simply put, the media campaign was intended to maximize the impact of
federal sanctions by communicating the USAO’s commitment to federal prosecution of
illegal gun possession and use.
The Middle and Southern Districts of Alabama are two of the smaller federal
districts in terms of population (ranked 75th and 82nd respectively). At the outset of PSN,
both districts also suffered from high homicide rates, above the national average per
10,000 population, as evidenced by Uniform Crime Report data from 2001 (see Table
28). Officials in both districts believed that one of the key causes for the high rate of
homicide was extreme prison overcrowding in Alabama that had resulted in illegal gun
possession being handled as a minor offense with no risk of incarceration. Indeed,
officials shared data demonstrating that a significant number of homicides and gun
assaults were either receiving no or minimal prison time in state prisons. The threat of
federal prosecution and imprisonment for illegal gun possession and use was considered a
potentially powerful tool by these local, state, and federal officials.
This document is a research report submitted to the U.S. Department of Justice. This report has not been published by the Department. Opinions or points of view expressed are those of the author(s)
and do not necessarily reflect the official position or policies of the U.S. Department of Justice.

98
Table 28: Aggravated Assault and Murder Rates, 2001
Site Aggravated Assault Rate
(Per 10,000)
Murder Rate (Per 10,000)
United State’s Average* 30.65 0.65 Alabama Middle District 24.31 0.73 Alabama Southern District 24.68 0.85 * 90 federal judicial districts
Despite having limited resources, both the Middle and the Southern District of
Alabama United States Attorneys’ Offices made it their goal to prosecute as many
firearms cases as possible. For both districts, this required excellent relationships with
local law enforcement as they would be the ones bringing the cases for federal
prosecution. Both districts relied heavily on their Law Enforcement Coordinators to
foster new relationships as well as strengthen existing ones. However, each district took
a slightly different approach to their task forces and how they would receive possible
cases for federal prosecution from local law enforcement.
Task Force Structure and Gun Case Screening
In response to local law enforcement’s concerns about “one more federal task
force,” the United States Attorney (USA) in the Middle District took a different approach
to their Alabama ICE task force. Recognizing that law enforcement resources were
sparse, the USA still asked agencies to assign an officer to the ICE task force but with the
understanding that the officer would remain in his or her own agency and community
rather than being assigned full-time to the task force. In many respects, the task force
member would serve as the point-of-contact within the local agency. This structure was
described by many officials as a key to the success of Alabama ICE in the Middle
District.
This document is a research report submitted to the U.S. Department of Justice. This report has not been published by the Department. Opinions or points of view expressed are those of the author(s)
and do not necessarily reflect the official position or policies of the U.S. Department of Justice.

99
The task force, known as the Prosecution and Investigative Review Team (PIRT),
met weekly at the U.S. Attorney’s office in Montgomery. Following the decentralized
task force format, members were not required to come every week. However, if they had
a case to present or sought updates on prior cases, the PIRT meeting provided a venue for
local task force members to communicate directly with a team of AUSAs, local
prosecutors, ATF agents, and other local law enforcement officials. Through these
meetings, law enforcement officers received immediate feedback on the prospects for
federal prosecution as well as continual feedback on existing cases. Interviews
consistently revealed that this weekly meeting was a critical component of team building
among the local, state, and federal officials involved in the Middle District’s Alabama
ICE.
In contrast to the Middle District, the Southern District had what they considered
a “hybrid” task force model. That is, they decided a more common “round table”
approach where every contributing agency had someone at the table would not work well
for them. What made this task force different was that the core components were located
within the Mobile Police Department (MPD), rather than the USAO. The reasoning
behind this decision was that the Mobile Police Department is the largest police
department in the Southern District and, therefore, had the highest rates of gun crime in
the district and would generate the most federal gun cases. The MPD Chief demonstrated
his commitment to PSN by dedicating one sergeant and one patrolman full-time to work
on ICE cases. Additionally, ATF worked with the MPD to develop a case screening
system. The screening system was designed to correspond to the elements of a gun crime
needed to support federal prosecution. The sergeant became the department’s Gun
This document is a research report submitted to the U.S. Department of Justice. This report has not been published by the Department. Opinions or points of view expressed are those of the author(s)
and do not necessarily reflect the official position or policies of the U.S. Department of Justice.

100
Coordinator, under the Criminal Investigation Division, and would be augmented by an
officer who was cross-deputized with ATF. This officer would work specifically with an
agent dedicated to ICE cases and serve as the liaison between the Gun Coordinator at
MPD and ATF.
Both the Middle and the Southern Districts believed that training was a key
component to their Alabama ICE efforts. Both USAOs realized that local law
enforcement officers would need to be educated about federal gun laws, how to
investigate cases and write reports, the elements needed for federal prosecution, and case
processing. Here, the Law Enforcement Coordinator played a pivotal role in bringing
training to law enforcement agencies in the district.
Communication Strategy
In addition to increased federal gun case prosecution, both the Middle and
Southern Districts of Alabama focused a considerable amount of their time and energy on
their communication strategy. This was a core ingredient in the statewide Alabama ICE
program and was modeled on Richmond’s Project Exile. Simply put, the media campaign
was intended to maximize the impact of federal sanctions by communicating the USAO’s
commitment to federal prosecution of illegal gun possession and use. According to one
criminal justice official in the Southern District, “…it was never about locking everyone
up but is about getting the message to the criminal population.”
Interviews with officials in ATF and the USAO revealed that task force members
noticed through the street officer’s incident report narratives that the word was out on the
street – “don’t get caught with a gun.” Officers quoted suspects as saying, “I can’t get
caught with a gun,” and “I’m a felon, I can’t get ICED.” Officers also reported that
This document is a research report submitted to the U.S. Department of Justice. This report has not been published by the Department. Opinions or points of view expressed are those of the author(s)
and do not necessarily reflect the official position or policies of the U.S. Department of Justice.

101
suspects increasingly (i.e. since ICE inception) admitted to drugs charges but denied gun
possession suggesting they were aware of the possible federal consequences. Police and
prosecution officials also reported seeing buzzwords in the police report narratives like
“felon” and “ICE” communicated by offenders.
Evidence of Implementation—Outputs
The data clearly indicated that federal prosecution of gun crime offenses
increased in the Middle District. Despite the relatively small number of AUSAs (nine in
2000), the number of indictments under U.S. Code Title 922 and 924 violations increased
from 15 in fiscal year (FY) 2000 and 20 in FY 2001, to 92 in FY 2003, an increase of
over 500 percent. Similarly, the number of defendants prosecuted in federal court
increased from 21 in FY 2000 to 103 in FY 2003 and 86 in FY 2004. This increase in
indictments and defendants placed the Middle District in the top seven percent of districts
in terms of its percentage-point increase in federal prosecution. The numbers were even
more telling when considered in light of the district’s population. As one of the least
populous U.S. districts (ranked 19th least populous out of 94), the Middle District’s 2003
rate of defendants per 100,000 population was 9.7. This federal prosecution rate per
100,000 population was among the top 15 (i.e., 14th) of the 94 judicial districts. Thus,
evidence suggested that the task force’s goal of accepting all gun cases (absent
evidentiary problems) was achieved.
Similarly, the Southern District, despite only having only 14 lawyers in the
criminal division, witnessed the number of indictments under U.S. Code 922 and 924
increase from 46 in FY 2000 to 81 in FY 2002, an increase of just over 76 percentage
points. Subsequently, indictments in the same category increased to 109 in FY 2005, a
This document is a research report submitted to the U.S. Department of Justice. This report has not been published by the Department. Opinions or points of view expressed are those of the author(s)
and do not necessarily reflect the official position or policies of the U.S. Department of Justice.

102
139 percentage point increase from FY 2000. Likewise, the number of gun crime
defendants prosecuted in federal court increased from 65 in FY 2000 to 129 in FY 2005,
an increase of over 98 percentage points.
The numbers were even more telling when considered in light of the district’s
population. As one of the least populous federal judicial districts (ranked 8th least
populous out of 90 federal districts34), the Southern District of Alabama consistently
ranked in the top seven percent in regards to rate of defendants per 100,000 population.
For 2005, the number of defendants prosecuted per 100,000 was just over 16. This rate
ranked second among the 90 judicial districts for that year. Clearly, the goal of increased
federal prosecution was realized in the Southern District of Alabama.
Evidence of Impact—Outcomes
Ultimately, the goal of PSN was to reduce gun crime. To assess whether the
Middle and Southern District’s PSN strategies had this impact, the outcome analyses
focused on gun crime and homicide trends in the City of Montgomery and the City of
Mobile respectively. As an initial step in the outcome analysis, annual trends in
homicide, armed robbery, and assault with a firearm for each city were reviewed (refer to
Table 29). In Montgomery, comparing 2002 and 2003 with the previous two years
provided evidence of a decline in these crimes, particularly for aggravated assaults with a
firearm. In Mobile, declines were seen in both aggravated assaults with a firearm and
robbery with a firearm, though with an upturn in 2005. Homicide increased and
decreased from year to year with little discernible pattern over the six-year period,
although the base rates were quite small and thus difficult to interpret.
This document is a research report submitted to the U.S. Department of Justice. This report has not been published by the Department. Opinions or points of view expressed are those of the author(s)
and do not necessarily reflect the official position or policies of the U.S. Department of Justice.

103
Table 29: Gun crime trend- Cities of Montgomery and Mobile
2000 2001 2002 2003 2004 2005
M=Middle S=Southern M S M S M S M S M S M S
Homicide (total) 30 14 27 39 30 34 18 18 25 22 - 32 Aggravated assault with a firearm
319 135 293 121 303 113 244 78 283 92 - 145
Robbery with a firearm
448 497 464 487 543 432 505 374 488 347 - 348
While trend lines were suggestive of a reduction in gun crime in both cities, to
assess the significance of these trends time series analyses were conducted. Time series,
considered one of the most powerful evaluation tools, account for crime trends prior to
the intervention point and assess the significance of any change in crime levels following
the intervention. Examining Montgomery (the Middle District) first, the time series
analyses were based on monthly data from January 2000 through December 2004.19
Assaults with a firearm had a statistically significant decline (p < .05) suggesting there
was a maximum likelihood mean reduction of three assaults with firearms per month
immediately after the intervention date of May 2002. This translated into a reduction
from approximately 309 gun assaults per year to approximately 270. Homicide also
declined, though its significance level was marginal (alpha .116). This translated to a
reduction from 29.5 homicides per year to 22.8. The analyses did not indicate any effect
on armed robbery.
A possible explanation for this decline in violent crimes could be that overall
crime rates were declining at a simultaneous, or similar, rate. If this were the case, the
above findings would simply be a result of a general decline in crime. In order to control
for a possible global change in crime independent of firearm offenses, monthly time
This document is a research report submitted to the U.S. Department of Justice. This report has not been published by the Department. Opinions or points of view expressed are those of the author(s)
and do not necessarily reflect the official position or policies of the U.S. Department of Justice.

104
series analyses of motor vehicle thefts and property offenses were examined. The logic
was that if such a global crime decline occurred, the time series analysis on property
crimes would have a similar reduction.
When examining the comparison offenses in Montgomery, there was actually a
slight increase in the average number of motor vehicle thefts and overall property
offenses, although this change was not statistically significant (see Table 30). Thus,
property offenses remained consistent over the time series period. That is, the comparison
variables that account for outside factors (global decline in overall crime) did not change
during this same period. This suggests that the reduction in assaults with firearms may be
attributable to the PSN intervention.
Table 30: Montgomery Time Series Analysis-- May 2002 Intervention Date
Crime
Pre-Intervention
Mean
Post- Intervention
Mean
Mean Difference (Post-Pre)
ARIMA Model
Intervention Coefficient
p- value (s.e.) p d q
Target Offenses Assaults with a firearm
25.78 22.50 -3.28 0 0 0 -3.29 (1.6) .038
Armed Robbery (ln) 3.64 3.68 0.04 0 0 1 .049 (.10) .616 Homicide 2.46 1.90 -.056 0 0 0 -.558 (.36) .116 Comparison Offenses MV Theft (Ln) 4.67 4.86 0.19 0 1 0 -.017 (.05) .747 Property (Ln) 7.09 7.15 0.16 1 1 0 -.019 (.021) .787
The research partner working with the Southern District of Alabama took a
similar but somewhat different approach to the time series analysis. Data for a large
number of crimes committed with a gun were available for analysis. To address the
threat that changes in gun crime reflected changes in overall crime trends, the trend in
property crime was included as a control variable in the gun crime analyses. Table 31
summarizes the results of the ARIMA analysis of the eight models35 for Mobile. With the
This document is a research report submitted to the U.S. Department of Justice. This report has not been published by the Department. Opinions or points of view expressed are those of the author(s)
and do not necessarily reflect the official position or policies of the U.S. Department of Justice.

105
exception of sex crimes with a gun, all the coefficients were negative suggesting a
decline in gun crime. That is, the PSN intervention, after controlling for property crime,
had a significant effect in four crime categories (total gun crime, all violent crime with a
gun, robberies with a gun and all assaults with a gun) and in gunshot trauma admissions.
There was no reduction in sex crimes and the reduction in homicides and menacing was
not statistically significant.
Total gun crime36 in Mobile after the implementation of PSN, decreased on
average by about 26 incidents per month, after controlling for property crime. Similarly,
violent crime with a gun37 decreased on average by about 16 incidents per month and
robbery with a gun decreased on average by about 11 incidents per month after
controlling for property crimes.
In addition to police data, gunshot trauma admissions, representing the number of
patients admitted to the local trauma center (i.e., University of South Alabama Hospital),
were available for analysis. Trauma center admission for gunshot wounds decreased on
average by about 2 incidents per month after controlling for property crimes. Given the
costs of gunshot wounds (Cook and Lugwig, 2000; Miller and Cohen, 1997), this
suggests a significant cost saving following the intervention of PSN. Thus, both police
and trauma center data suggest that the SDAL PSN intervention had an impact on the
level of gun crime in Mobile and that this held when contrasted with the trend in property
crime.
This document is a research report submitted to the U.S. Department of Justice. This report has not been published by the Department. Opinions or points of view expressed are those of the author(s)
and do not necessarily reflect the official position or policies of the U.S. Department of Justice.

106
Table 31: Mobile Time Series Analysis—(through August 1, 2006)
Crime
Pre- Intervention
Mean
Post- Intervention
Mean
Mean Difference (Post-Pre)
ARIMA Model
Intervention Coefficient
Property Crime
F
R- squared
p d q Target Offenses Total gun crime 130.04 100.49 -29.55 0 1 1 -.26 * .05* Violent crime w/gun 52.02 39.94 -12.08 0 1 1 -.16* .04* Homicide w/gun 1.65 1.65 0 0 0 0 -0.27 .003* 1.96 .04 Sex crime w/gun .65 .79 +.14 0 0 0 .139 0 .240 .005 Robbery w/gun 39.51 29.81 -9.7 0 1 1 -.11* .03* Assault w/gun 13.44 10.56 -2.88 1 0 0 -2.57* -.02 Menacing w/gun 36.04 25.67 -10.37 0 1 1 -6 -.002 Gunshot trauma admission
11.10 8.76 -2.34 0 0 0 -2 .003 3.76* .09
Comparison Offenses Property crime 681.42 687.40 +5.98
*p=<.05
This document is a research report submitted to the U.S. Department of Justice. This report has not been published by the Department. Opinions or points of view expressed are those of the author(s)
and do not necessarily reflect the official position or policies of the U.S. Department of Justice.

107
Challenges Encountered by PSN Task Forces
As with most PSN task forces, ICE officials in both the Middle and Southern
District of Alabama described a series of ongoing challenges. Foremost for the Middle
District were the number of federal gun prosecutors and ATF agents. The USAO PSN
team was concerned that their ability to effectively prosecute cases referred to the USAO,
given the increased desire of local officials throughout the district to refer cases for
federal prosecution, would be constrained by the small number of ATF agents and federal
prosecutors.
Another challenge related to turnover in key personnel. The Montgomery Police
Department witnessed the resignation of the chief of police, who had been one of the key
proponents of ICE. Fortunately, the new chief was described as being similarly
committed. Similarly, officers assigned to the PSN task force were often reassigned.
The district addressed this issue through a commitment to training, and interviews
suggested that some turnover was beneficial because the officers assigned to the task
force would take their knowledge of ICE and federal gun crime prosecution to their new
assignments.
In the Southern District, one of the major challenges for the research partner
involved data collection. This was not an uncommon challenge across PSN sites.
Despite the desire to collect and use data from across the district, the research partner was
forced to concentrate on Mobile for evaluation purposes due to the nature of the data
sources. Given the concentration of gun crime in Mobile, however, this was not a major
obstacle for the inclusion of research in the PSN initiative.
This document is a research report submitted to the U.S. Department of Justice. This report has not been published by the Department. Opinions or points of view expressed are those of the author(s)
and do not necessarily reflect the official position or policies of the U.S. Department of Justice.

108
Similar to the Middle District, the Southern District of Alabama experienced the
loss of two major players within PSN. First, the United States Attorney and second the
Chief of the Mobile Police Department. However, these changes did not appear to have
negatively affected the day to day operations of PSN as the program was well-established
and the new USAO and Chief of Police were supportive. Additionally, the former chief
moved to the Sheriff’s Department and thereby brought an additional collaborating law
enforcement agency to the PSN task force.
Summary
Interviews with officials in both the Middle and Southern Districts of Alabama
revealed a consistent emphasis on strong leadership as the key to the successful
implementation of PSN. In the Middle District, this leadership came from the USAO and
eventually resulted in a high level of participation from local police departments and
ATF. In the Southern District, initial leadership stemmed from the Mobile Police
Department, supported by the USAO. This leadership element created the environment
for other key components like the PSN Task Force structure, partnerships and regular
meetings. As the data reviewed above indicated, a plausible case can be made that this
leadership resulted in changes in how gun crime was addressed within each of these
districts and was associated with declines in gun crime in the key PSN target cities.
Strategic Problem Solving/Pulling Levers Case Study Sites
District of Nebraska, Middle District of North Carolina, Eastern District of Missouri, and District of Massachusetts A series of case studies were also conducted in PSN task forces that followed the
strategic problem solving model and that implemented multiple interventions in targeted
This document is a research report submitted to the U.S. Department of Justice. This report has not been published by the Department. Opinions or points of view expressed are those of the author(s)
and do not necessarily reflect the official position or policies of the U.S. Department of Justice.

109
cities or geographic areas of cities. The included Omaha in the District of Nebraska, five
cities in the Middle District of North Carolina, St. Louis in the Eastern District of
Missouri, and Lowell in the District of Massachusetts. Full case study reports are
available.38 In the following section, the districts and cities are described, key elements
of the PSN intervention are reviewed, and evidence regarding the impact of the
intervention is presented.
Context
At the outset of PSN, the four sites had varying levels of homicide and aggravated
assault rates. North Carolina, Nebraska, and Massachusetts tended to have modest levels
of violent crime whereas the Eastern District of Missouri had much higher rates. Table 32
indicates these rates (per 10,000) for three of the four PSN sites. In comparison to other
federal judicial districts, the District of Nebraska did not suffer from extremely high
violent crime rates, ranked 71st overall among federal judicial districts (lowest quartile) in
its murder rate and 57th (third quartile) in aggravated assault rate. However, Douglas
County, which includes Omaha, had a much higher violent crime rate with a homicide
rate and aggravated assault rate over twice that of the entire state (Omaha accounted for
80 percent of the district’s gun crime) (Table 32).
The District of Massachusetts was also below the national average in terms of
murder rate but above the national average in terms of aggravated assault rate. Virtually
all of the state’s gun crimes occurred in Boston and ten other smaller urban cities within
the state (e.g. Brockton, Fall River, Lawrence, Lowell, Springfield, and Worcester).
Lowell was one of the first smaller cities to implement a PSN task force and was selected
for the case study based on the integration of its research partners and the comprehensive
This document is a research report submitted to the U.S. Department of Justice. This report has not been published by the Department. Opinions or points of view expressed are those of the author(s)
and do not necessarily reflect the official position or policies of the U.S. Department of Justice.

110
problem analysis that was conducted. UCR data revealed that compared to all U.S. cities
with populations greater than 75,000, Lowell placed above average in terms of violent
crime and below average in terms of property crime (Table 32).
The Middle District of North Carolina suffered from more modest violent crime
rates. Specifically, the district ranked 30th (third quartile) overall among federal judicial
districts when analyzing murder rates, and 44th (third quartile) in aggravated assaults.
Task force officials decided to focus on its five largest jurisdictions: Durham,
Greensboro, High Point, Salisbury, and Winston-Salem (Table 32).
In contrast, the Eastern District of Missouri ranked higher than the U.S. average in
terms of both its murder rate and aggravated assault rate. It also ranked higher when
compared to U.S. judicial districts of comparable size. The primary focus area for PSN
was the city of St. Louis. The city of St. Louis consistently ranked among the highest
three to five cities in the nation in reference to homicide and aggravated assault (Table
32).
Table 32: Aggravated Assault and Murder Rates, 2001
Site Aggravated Assault Rate (Per 10,000)
Murder Rate (Per 10,000)
United State’s Average* 30.65 0.65 North Carolina Middle District 26.57 0.60 District of Nebraska 20.45 0.25 Douglas County 38.29 0.54 District of Massachusetts 36.84 0.24 Missouri Eastern District 35.52 0.73 * 90 federal judicial districts
Development and Implementation
As noted in Chapter Five, one of the characteristics of PSN task forces ranked as
high in terms of implementation was prior experience with multiple agency crime
This document is a research report submitted to the U.S. Department of Justice. This report has not been published by the Department. Opinions or points of view expressed are those of the author(s)
and do not necessarily reflect the official position or policies of the U.S. Department of Justice.

111
reduction collaborations. This was true for all of these jurisdictions as they all had a
history of multi-agency violence reduction efforts as well as experience of working with
a research partner. Specifically, Omaha, St. Louis, and Winston-Salem were all
participants in the Strategic Approaches for Community Safety Initiative (SACSI).39
Officials in Lowell, Massachusetts were familiar with the Boston Gun Project, and the
police department collaborated with members of the Boston research team in a number of
problem solving initiatives.
Task Force Structure
All of the sites built on this prior experience in developing a PSN task force
structure. In Nebraska, two different but related working groups developed: one specific
to Omaha and another in Lincoln. The case study focused on Omaha due to its much
higher levels of gun crime. The PSN task force in Omaha was comprised of federal, state,
and local law enforcement and prosecutors, the Department of Corrections, the state
Crime Commission, Weed and Seed, the local school system, and research partners from
the University of Nebraska at Omaha. The working group benefited from the active
participation of the U.S. Attorney and the Omaha Chief of Police. Coordination was
provided by a PSN Operations Director with support from the Law Enforcement
Coordinator, both housed within the U.S. Attorney’s Office. The working group utilized
a strategic problem solving approach that involved regular incident reviews and analysis
from the research partners. The working group also relied on routine meetings including
gun crime case screening, incident reviews, and a gun, gangs, and drugs enforcement
team.
This document is a research report submitted to the U.S. Department of Justice. This report has not been published by the Department. Opinions or points of view expressed are those of the author(s)
and do not necessarily reflect the official position or policies of the U.S. Department of Justice.

112
In the District of North Carolina, the U.S. Attorney’s Office coordinated the
overall PSN initiative through a Middle District Advisory Team (MDAT) that oversaw
task forces in five cities (Durham, Greensboro, High Point, Salisbury and Winston-
Salem). With the announcement of PSN in early 2001, the USAO requested that each city
send two representatives to be part of the MDAT and this informally formed the skeleton
of their task force. As time passed, MDAT moved towards a more formal structure with
a Chair and Co-Chair and each city appointed three representatives to MDAT, one of
which had to be from law enforcement. Non-law enforcement task force members
included representatives from social services and local religious groups in addition to
others. Additionally, the PSN Project Coordinator served as a MDAT member. The
North Carolina Governor’s Crime Commission (the fiscal agent), the research partner,
probation and parole, and the community engagement partner all attended every MDAT
meeting.
Although adapted to the local context, the five task forces included strong
partnerships with local and federal law enforcement, local prosecutors, probation and
parole, as well as strong community collaboration with neighborhood groups, the faith
community, social services, and the business sector. In addition, the task force worked
very closely with a team of researchers from several universities and utilized PSN funds
to support the role of service coordinator. Both the research partners and the service
providers were integral members of the PSN task forces.
The PSN task force in Lowell built upon the city’s experience with community-
and problem-oriented policing. The Lowell police department was decentralized with
officers assigned to one of three geographic districts. The community-policing model
This document is a research report submitted to the U.S. Department of Justice. This report has not been published by the Department. Opinions or points of view expressed are those of the author(s)
and do not necessarily reflect the official position or policies of the U.S. Department of Justice.

113
emphasized partnerships with community groups and other law enforcement agencies.
These partnerships facilitated the implementation of PSN. The PSN working group
consisted of the PSN coordinator and federal prosecutors from the U.S. Attorneys Office,
local law enforcement including LPD detectives, federal law enforcement including the
FBI and BATF, county prosecutors, probation officers, and research partners from
Harvard and Northeastern Universities.
Finally, in the Eastern District of Missouri, the PSN task force was also
coordinated in the United States Attorney’s Office and included representation from
federal, state and local law enforcement, local and federal prosecutors, and probation and
parole. It also included the juvenile court, level I trauma center, city neighborhood
services, street outreach workers, a media relations partner, and the regional justice
information system. The task force collaborated with a research team from the
University of Missouri – St. Louis with years of experience working with the local
criminal justice system. The overall PSN task force initially met monthly and later
moved to a quarterly schedule. Several task force committees met more regularly. For
example, the gun case prosecution team met bi-weekly and reviewed all cases involving a
gun. There was also a weekly violence review held at the North Patrol station to review
the activities of the Violent Crime Task Force. Additional task forces were convened at
various times to address specific issues and problems.
Community Engagement and Media Campaign
Task forces in all the sites attempted to build community partnerships and to
implement a communication strategy. As noted above, North Carolina used funds to
support a community engagement partner and fund service coordinators. Several of the
This document is a research report submitted to the U.S. Department of Justice. This report has not been published by the Department. Opinions or points of view expressed are those of the author(s)
and do not necessarily reflect the official position or policies of the U.S. Department of Justice.

114
sites collaborated with their Weed and Seed programs as well as with the schools. All
included multiple local, state, and federal criminal justice partners. All included media
campaigns involving public service announcements (PSAs) and billboards and several
utilized strategies such as posters in the jail and on busses and bus benches. The Middle
District of North Carolina, Lowell, and Omaha also implemented a series of offender
notification meetings to deliver a deterrence and social support message to at-risk
populations of probationers and parolees. This followed the “pulling levers” model that
originated in Boston and continued through the SACSI program.
Nature of the Gun Crime Problem
The analysis of gun crime problems in Omaha, the Middle District of North
Carolina cities, and Lowell indicated that all had significant connections to gangs. In
Omaha, gun violence was concentrated in several geographic areas of Omaha (northeast
and southeast) and a significant portion of the gun crime involved gangs and the nexus
between gangs, guns, and drugs. Over 28 gangs and 2,600 gang members were
identified.
Problem analyses in the five North Carolina sites also suggested that gangs
contributed substantially to the gun crime problem. Homicide reviews in several sites
confirmed the assumption that gun crime was related to gangs and drugs. Gun crime
seemed to be largely driven by chronic offending offenders and victims, involved drug
and gang activity, and included group associations of gangs, groups of chronic offenders,
and inter-generational links. Offenders returning from prison were another source of gun
crime.
This document is a research report submitted to the U.S. Department of Justice. This report has not been published by the Department. Opinions or points of view expressed are those of the author(s)
and do not necessarily reflect the official position or policies of the U.S. Department of Justice.

115
Similarly, gun crime in Lowell involved young males, with prior criminal
histories, and gang involvement. Analysis of department incident data revealed that
young, minority males were disproportionately offenders and victims of serious gun
violence. Gang members accounted for a substantial portion of the gun violence problem
in Lowell. Based on information from the department’s gang intelligence database and a
focus group of detectives, 74 percent of gun homicide offenders (14 of 19) and 46 percent
of aggravated gun assault offenders (10 of 22) were revealed to be active gang members.
As noted above, St. Louis had very high levels of gun crime and there was a
strong spatial concentration of homicide, gun crime and violent crime. That is, a
relatively small part of the city accounted for a large proportion of the violent crime.
Indeed, the “top ten” most violent neighborhoods accounted for more than 40 percent of
all murders. Gun crime typically involved high rate offenders at risk for both
victimization and perpetration of violence. A substantial number of these offenders and
homicide victims were under probation and parole supervision. The analysis did not
suggest heavy gang involvement but the distinction between St. Louis and the other cities
in terms of gang involvement may have been definitional. St. Louis reported loosely
structured neighborhood groups and crews involved in gun crime. Similar groups may
have been labeled gangs in the other jurisdictions.
Evidence of Implementation-Outputs
The prosecution data clearly reflected that the goal of increasing federal
prosecution of gun crime offenses has occurred in the District of Nebraska. Since the
announcement of PSN in 2001 and the full implementation of PSN in the District of
Nebraska, the number of indictments under U.S. Code 922 and 924 increased
This document is a research report submitted to the U.S. Department of Justice. This report has not been published by the Department. Opinions or points of view expressed are those of the author(s)
and do not necessarily reflect the official position or policies of the U.S. Department of Justice.

116
dramatically. For example, in Fiscal Year (FY) 2001 there were 54 indictments under
US Code 922 and 924. This increased to 95 indictments in FY 2002, to 166 in FY 2003,
and 171 in FY 2005, an increase of 200 percentage points since 2001. Similarly, the
number of defendants prosecuted in federal court increased from 63 in FY 2001 to 111 in
FY 2002 and 196 in FY 2005. This increase in indictments and defendants placed the
District of Nebraska in the top nine percent in terms of its percentage point increase in
federal prosecution. The numbers were even more telling when considered in light of
the district’s population. This federal prosecution rate of 11.0 per 100,000 population
was ranked 8th among the 90 federal judicial districts in 2003.
Similarly, the Middle District of North Carolina also made a commitment to
increase the threat of federal prosecution for gun crimes. The number of cases filed
under U.S. Code 922 and 924 increased steadily since the inception of PSN. From
FY2000 to FY2004, the number of cases increased from 104 to 187, an increase of
almost 80 percentage points. Similarly, the number of defendants increased from 5.8
defendants per 100,000 population in FY2000 to 8.1 defendants per 100,000 population
in FY2004. This placed the Middle District of North Carolina at the top of the second
quartile when comparing defendants per 100,000 population for the 90 federal districts.
In the Eastern District of Missouri, a total of 1,381 individuals were indicted for
gun crimes by the United States Attorney’s Office or the St. Louis Circuit Attorney’s
Office between January 2002 and October 2005. The majority of indictments (82%)
were reported by the U.S. Attorney’s office. In total, the United States Attorney’s Office
averaged 17.4 indictments per quarter. The number of Federal indictments peaked in
quarter two and three of 2003 and then again in the second quarter of 2004. Thus, similar
This document is a research report submitted to the U.S. Department of Justice. This report has not been published by the Department. Opinions or points of view expressed are those of the author(s)
and do not necessarily reflect the official position or policies of the U.S. Department of Justice.

117
to Omaha and the Middle District of North Carolina, the results suggested that the United
States Attorney’s Office and the St. Louis Circuit Attorney’s Office made a large number
of indictments during the intervention period. In addition, the majority of individuals
indicted were sentenced to a lengthy term of incarceration.
In Lowell, the use of federal prosecution was used more strategically and as a
focused deterrence threat. Partly this reflected the belief, in contrast to many other
jurisdictions, that Massachusetts state law provided substantial penalties for illegal gun
possession and use. The threat of federal sanctions was used in a series of offender
notification meetings with gang members who were warned that continued involvement
in gun crime would result in federal prosecution. A particularly innovative strategy with
several Asian gangs was to use a pulling levers strategy with adults in the community that
urged them to exercise control over the youths who were believed to be involved in gang
violence.
All of these jurisdictions coupled the increase in federal prosecution (or the threat
thereof in Lowell) with a variety of other interventions and strategies. All included the
integration of research partners. All of the sites with the exception of St. Louis
conducted systematic incident reviews. St. Louis relied on homicide file reviews and
other sources of crime information conducted by a team of researchers experienced with
the St. Louis Police Department. All the sites except Lowell developed chronic violent
offender programs and Lowell used detailed network analyses of gang structures. All but
St. Louis utilized offender notification meetings that combined the deterrence message
with social support. St. Louis utilized a complementary set of strategies, including stories
in a local neighborhood-based newspaper highlighting homicide and gun crime
This document is a research report submitted to the U.S. Department of Justice. This report has not been published by the Department. Opinions or points of view expressed are those of the author(s)
and do not necessarily reflect the official position or policies of the U.S. Department of Justice.

118
prosecutions as well as victimization. Additionally, all of the sites included law
enforcement strategies such as directed police patrol in gun crime hotspots and police-
probation-parole home visits. All developed mechanisms for federal and local
prosecutors to screen gun crime cases. Finally, all included various prevention and
intervention strategies in collaboration with schools, social service providers, and
neighborhood leaders and organizations.
Evidence of Impact-Outcomes
Each case study included an assessment of the impact on gun crime. This was
often conducted in collaboration with the local PSN research partner. Thus, the specific
measures and target areas were driven by the local program. This makes comparability
across sites problematic. Readers interested in the details of each evaluation are directed
to the original case studies (Decker et al., 2007; McDevitt et al., 2007; Hipple et al.,
submitted to DOJ, A; Hipple et al, submitted to DOJ, B).
For Omaha, the research team initially reviewed the annual trends in three firearm
related crimes: homicide, armed robbery, and aggravated assault. Given the relatively
small number of homicides with a firearm (ranging from 24 in 2000 to 15 in 2004), the
analysis focused on total violent gun crimes that was a composite of homicide with a
firearm, aggravated assault with a firearm, and armed robbery with a firearm.
Following discussions with the local research team, February 2003 was
designated as the intervention date. This was the point of PSN implementation when law
enforcement training had occurred and there was a significant increase in federal
prosecution for gun crimes. Overall, in Omaha the average number of firearm offenses
per month reduced from 77.35 per month before intervention to 61.62 per month after
This document is a research report submitted to the U.S. Department of Justice. This report has not been published by the Department. Opinions or points of view expressed are those of the author(s)
and do not necessarily reflect the official position or policies of the U.S. Department of Justice.

119
February 2003. These preliminary findings were suggestive of a reduction in gun crime.
However, in order to assess the significance of these trends, the research team conducted
a time series analysis.
The time series analyses were based on data in monthly format from January 2000
through June 2005. When the total number of firearm offenses was examined at the
aggregate level, the ARIMA models showed a statistically significant reduction (p < .01)
from pre-intervention to post-intervention. The analysis indicated there was a statistically
significant reduction in the overall firearm offenses of 20 percent, per month, between
pre- and post- PSN intervention.40 Table 33 displays the statistically significant decline in
overall firearm crimes from the raw number of offenses.
Table 33: Time Series Analysis – February 2003 Intervention Date
Crime
Pre-intervention
Mean
Post- intervention
Mean
Mean Difference (Post-Pre)
ARIMA Model
Intervention Coefficient
(s.e.)
p-value
P d q Targeted Offenses Total firearm offenses (Ln)
4.32
4.08
-.24
0
0
2
-.23 (.08)
.003
Comparison Offenses
MV Theft (Ln)
5.78
5.60
-.18
0
2
2
-.01 (.02)
.544
Burglaries 269.5 285.4 15.9 1 0 0 11.9 (15.9) .453
The trend in gun crime was compared to property crime. There was no
statistically significant change in property crime during this period. Thus, there was no
evidence that the decline in gun crime was due to some factor influencing all crime in
Omaha. That is, the comparison to property crime was consistent with an interpretation
that PSN led to a reduction in gun crime in the District of Nebraska.
This document is a research report submitted to the U.S. Department of Justice. This report has not been published by the Department. Opinions or points of view expressed are those of the author(s)
and do not necessarily reflect the official position or policies of the U.S. Department of Justice.

120
As noted, the Middle District of North Carolina focused resources on five cities in
their efforts to reduce gun crime: Durham, Greensboro, High Point, Salisbury, and
Winston-Salem. Given the small population of Salisbury, and corresponding low rates of
gun crime, and the fact that High Point was subject to an independent NIJ evaluation, the
focus was on the cities of Durham, Greensboro and Winston-Salem. Consultation with
the local research partners suggested that the appropriate intervention date was May
2002.
Given the small to medium population base for these cities, the base rate of gun
crime was relatively low. Consequently, consistent with Omaha, the focus was on total
firearms offenses (a composite measure of homicides, assaults, and robberies committed
with a firearm). Table 34 shows the average number of monthly firearm offenses for
each site pre-intervention and post-intervention. As indicated, the total number of
firearm offenses declined in all three of the sites between pre-PSN intervention and post-
PSN intervention.
Table 34: Total monthly firearm offenses, pre-PSN and post-PSN intervention for three target cities
City Pre-intervention
Average Post-Intervention
Average Durham 76.75 68.90 Greensboro 70.42 57.43* Winston-Salem 50.46 41.23*
*Independent samples t-test p<.001
In the next step of the analysis, time series analyses were conducted for each of
the three sites. The results suggested a statistically significant decline in firearm offenses
in two of the three sites. Winston-Salem showed a statistically significant decline
between pre- and post-PSN intervention with total firearm crimes declining by just over 9
This document is a research report submitted to the U.S. Department of Justice. This report has not been published by the Department. Opinions or points of view expressed are those of the author(s)
and do not necessarily reflect the official position or policies of the U.S. Department of Justice.

121
per month. Greensboro had a statistically significant decline in total firearm offenses of
approximately 13 per month, between pre and post-PSN intervention. Durham also
experienced declines in total firearms though they did not attain statistical significance
and thus could reflect chance variation.41
In Lowell, Massachusetts the gun violence intervention strategy was targeted
towards Asian youth gangs who the analysis had shown were disproportionately involved
in gun crime. The intervention began in October 2002. This date represented the start of
police raids on gambling houses and as a result an increase in arrests for related crimes.
The goal of the raids and arrests was to send a message to Asian youth gangs to stop all
violence.
The specific focus of the PSN-Lowell intervention was on gun assaults involving
gang-related youths. Aggravated assaults with a gun declined from 4.94 per a month in
the pre intervention period to 3.56 for the post intervention period.42 This represented a
28.02 percent decline in aggravated assaults with a gun – or one less gun assault per
month. To test whether this result was the likely result of the PSN intervention, the
change in prevalence of gun assaults within Lowell was compared to the change in
prevalence of gun assaults in several Massachusetts cities: Brockton, Boston, Fall River,
Lawrence, Springfield, and Worcester.
Table 35 shows the monthly average number of gun assaults before and after the
introduction of the targeted deterrence intervention in Lowell compared to the difference
and percent change across all cities. As the table shows, Lowell experienced the greatest
decrease in aggravated gun assaults after the introduction of the intervention.43 Overall
the findings of this comparison analysis were consistent with the finding that PSN-Lowell
This document is a research report submitted to the U.S. Department of Justice. This report has not been published by the Department. Opinions or points of view expressed are those of the author(s)
and do not necessarily reflect the official position or policies of the U.S. Department of Justice.

122
may have resulted in a reduction in aggravated assaults with a gun, consistent with the
simple pre-post test analysis.
Table 35: Comparison of Pre- to Post-Intervention Change in Aggravated Assaults with a Firearm in Select Massachusetts Cities
Aggravated Assaults with a Firearm
City Pre-Intervention Monthly Average
Post-Intervention Monthly Average Difference Percent
Change Lowell 4.94 3.56 -1.38 -28.02 Boston 37.61 36.50 -1.11 -2.94 Brockton 8.76 8.04 -0.72 -8.27 Fall River 2.52 4.75 2.23 88.86 Lawrence 1.62 3.18 1.56 96.52 Springfield 27.55 46.57 19.03 69.07 Worcester 7.48 6.59 -0.89 -11.92 Notes:
- Boston and Fall River data are missing the last three months of the series. Post-intervention monthly average computed by dividing total by 24 months.
- Springfield data are missing last six months from series. Post-intervention monthly average computed by dividing total by 21 months.
- Brockton and Lawrence data are missing first year 2000 from series. Pre-intervention monthly average computed by dividing total by 21 months.
In St. Louis, PSN was implemented in two target neighborhoods. The evaluation
contrasted the trend in the two target or intervention neighborhoods with the trends in
contiguous neighborhoods as well as control neighborhoods in other parts of the city that
also had high levels of gun crime. The data were limited to broad analyses of aggravated
assault involving a firearm, robbery, and homicide before and after the intervention in the
first quarter of 2003. The following tables detail the magnitude of change before and
after the intervention.
As displayed in Table 36 there were substantial declines in incident rates for
aggravated assault involving a firearm over the analysis period and across neighborhood
groups. The overall magnitude of change was greatest for the control group (39%
This document is a research report submitted to the U.S. Department of Justice. This report has not been published by the Department. Opinions or points of view expressed are those of the author(s)
and do not necessarily reflect the official position or policies of the U.S. Department of Justice.

123
decline). In contrast, the intervention neighborhoods experienced a seven percent decline
in aggravated assault offenses.
Table 36: Comparison of Pre- to Post-Intervention Change in Violent Crime Incidents
Neighborhood Group
Pre-Intervention
Quarterly Average
Post-Intervention
Quarterly Average Difference
Percent Change
Aggravated Assaults with Firearm Intervention 14.65 13.72 -0.93 -6.57% Contiguous 4.96 4.12 -0.85 -18.61% Control 3.32 2.24 -1.08 -38.97% Robbery with Firearm Intervention 9.30 7.93 -1.38 -15.96 Contiguous 4.89 4.30 -0.59 -12.80 Control 3.42 2.26 -1.16 -40.84 Homicides Intervention 1.24 1.00 -0.24 -21.28 Contiguous .43 .25 -0.18 -51.81 Control .23 .15 -0.08 -40.00 Weapons Offenses Intervention 4.92 3.48 -1.45 -34.44 Contiguous 1.72 1.12 -0.60 -42.01 Control 1.23 .87 -0.36 -34.54
The decline in armed robberies was also substantial, although again it was
apparent across intervention, control, and contiguous neighborhoods. For the
intervention group, the rate of robbery declined 16 percent between the pre and post
intervention periods. The contiguous neighborhoods experienced a similar decline (13%)
while robbery rates in the control neighborhoods declined 41 percent.
Similar to robbery and assault incidents, homicides declined in all of
neighborhoods. Homicide rates declined 21 percent in the intervention neighborhood, 51
percent in the contiguous neighborhoods and 41 percent in the control neighborhoods.
This document is a research report submitted to the U.S. Department of Justice. This report has not been published by the Department. Opinions or points of view expressed are those of the author(s)
and do not necessarily reflect the official position or policies of the U.S. Department of Justice.

124
The final comparison of incidents across the neighborhoods involved weapons
offenses. Consistent declines above 34 percent were observed in the intervention,
contiguous, and control neighborhoods following the PSN intervention.
From the standpoint of violent crime in St. Louis, the review of gun assaults,
robberies involving a firearm, homicides, and weapons incidents revealed positive news.
From an evaluation standpoint, however, the results raised questions about the cause of
the decline. The fact that the decline was generally smaller in the intervention
neighborhoods than was the case in the control and contiguous neighborhoods suggested
that some factor other than the PSN intervention caused these declines. The most
generous interpretation from a PSN standpoint is that PSN had a city-wide impact.
However, a highly plausible rival hypothesis is that some factor other than PSN was
producing the declines in gun crime across the city.
Thus, in looking at the impact analyses across these jurisdictions, promising
results emerge. Every city included witnessed a decline in gun crime. Lowell, Omaha,
Greensboro, and Winston-Salem experienced statistically significant declines and they
appeared to be significant when contrasted with the comparison crime trend. St. Louis
also witnessed a decline in its two treatment neighborhoods but this was true in
contiguous and control neighborhoods as well. Durham witnessed a decline but it was
not significant. These results will be considered in light of similar findings from several
other jurisdictions as well as from the cross-city comparison that is presented in the next
chapter.
This document is a research report submitted to the U.S. Department of Justice. This report has not been published by the Department. Opinions or points of view expressed are those of the author(s)
and do not necessarily reflect the official position or policies of the U.S. Department of Justice.

125
Additional Findings from the Site Specific Case Studies
Information from all of the four sites addressed in these case studies, consistent
with the studies in Middle and Southern Alabama, suggested that the key components of
a successful PSN task force included leadership and partnerships.
Leadership
PSN leadership in all of the sites began with the U.S. Attorney. In the District of
Nebraska strong leadership was demonstrated within the USAO by the PSN Operations
Director as well as the Law Enforcement Coordinator and these players capitalized on
existing relationships by coordinating with federal, state, and local agencies to create the
momentum needed to implement a successful PSN program.
In the Middle District of North Carolina there was also consistent leadership
provided by the U.S. Attorney and from the Assistant U.S. Attorney who served as PSN
project coordinator. Officials from throughout the district repeatedly talked about the
commitment of the USA, Project Coordinator and the entire U.S. Attorney Office. This
was manifest in the participation of these key officials in the MDAT and task force
meetings, despite the numerous demands on their time.
The Eastern District of Missouri experienced significant turnover since PSN
began with a total of three U.S. Attorneys serving the district. Each, however,
maintained the strong commitment to PSN during the period of the case study. In
addition, the PSN Coordinator balanced one of the largest gun case prosecution caseloads
with the coordination and day-to-day leadership of the initiative. St. Louis officials also
consistently described exceptional leadership from the police department, notably the
Major who ran the Violent Crime Task Force.
This document is a research report submitted to the U.S. Department of Justice. This report has not been published by the Department. Opinions or points of view expressed are those of the author(s)
and do not necessarily reflect the official position or policies of the U.S. Department of Justice.

126
Finally, in Lowell, the USAO gave the PSN coordinator wide latitude to
implement the district-wide task force and participate directly in the PSN-Lowell
working group. The leadership from the PSN coordinator was described as a critical
factor to building and maintaining partnerships. In follow-up interviews, participants in
this process gave a great deal of credit to the coordinator for making the partnership work
and making it worth their involvement. They reported that the PSN coordinator kept the
group focused on the goal of prosecuting serious gun crimes and helped to avoid
interagency competition that can arise in such partnerships.
Partnerships
The USAO in the District of Nebraska had a strong history of established
partnerships across the state. ATF had been a strong partner as demonstrated by their
dedication of two agents to PSN. Similarly, ICE was described as a powerful federal
partner. Their ability to arrange enforcement operations, deport offenders with weapons
violations, and share intelligence made them an asset not always utilized in PSN sites.
Similarly, the United States Marshal Service Metro Area Fugitive Taskforce was the lead
agency for warrant sweeps. Task force members also described the importance of the
inclusion of regional law enforcement and school systems from surrounding communities
that border Omaha that resulted in enhanced information sharing, improved the tracking
of weapons, increased cases submitted for prosecution, and spread the PSN message.
Implementing PSN in five cities across the geographically large Middle Distirct
of North Carolina could not have been possible without partnerships. One aspect of
suporting the partnerships was that the Task Force officers took it upon themselves to
provide feedback to local officers and their supervisors.
This document is a research report submitted to the U.S. Department of Justice. This report has not been published by the Department. Opinions or points of view expressed are those of the author(s)
and do not necessarily reflect the official position or policies of the U.S. Department of Justice.

127
Similarly, the coordination among and within agencies produced by PSN in St.
Louis was described as one of the most important effects produced by the task force. The
regular face-to-face meetings and exchange of information within and between parts of
the criminal justice system (local and federal law enforcement/local law enforcement and
federal prosecution) had become routinized and reflected a new way of how criminal
justice is “done” in St. Louis.
In Lowell, interagency partnerships were described as providing resources,
information sharing and flexibility in choosing responses not available in classic law
enforcement bureaucracies. Officials attributed PSN for leading to close working
relationships between the LPD, federal enforcement agencies, and the U.S. Attorney’s
Office.
Challenges
The case studies also revealed challenges in the implementation of PSN.
Members of several of the task forces noted resistance from some judges to the increasing
number of gun cases. Both federal and local prosecutors stated, however, that they did
not let it deter them from bringing cases to court. In jurisdictions utilizing regular
incident reviews, some task force members questioned their benefit. While information
sharing was occurring, local law enforcement occasionally felt that enforcement follow-
up by was lacking. When this concern arose in Omaha, the task force implemented
directed patrol operations, warrant sweeps, and Operation Nightlight initiatives as
mechanisms to follow-up on violent crime patterns revealed in the incident reviews.
Personnel in all the sites described the challenge of taking on responsibilities for
implementation of PSN on top of their traditional duties. In a district like the Middle
This document is a research report submitted to the U.S. Department of Justice. This report has not been published by the Department. Opinions or points of view expressed are those of the author(s)
and do not necessarily reflect the official position or policies of the U.S. Department of Justice.

128
District of North Carolina, the challenge of finding the appropriate balance of extending
finite, limited resources to a broad target area was an ongoing concern. Issues of where
and how to focus (i.e., what projects and in which cities) were common concerns.
Several of the case study sites experienced obstacles when trying to get probation
and parole involved. However, this was also an area where over time many districts
described increasing involvement and participation in PSN by probation and parole.
Many PSN officials also remarked on the important resources that probation and parole
officers and agencies could contribute to gun crime reduction.
An additional challenge for most PSN sites was developing meaningful
partnerships with various elements of the community. As described in an earlier chapter,
this was a common finding. Partnerships were easier to build with other criminal justice
agencies than with schools, social services, neighborhood leaders, the faith community,
employers and other potential partners. Further, developing such relationships were often
new duties for Assistant United States Attorneys, who often served as PSN coordinators.
Success in building such relationships often came from distributed leadership, for
example the reliance on the Law Enforcement Coordinator who had experience working
with the community, as well as through building upon existing relationships that may
have been established through weed and seed or a community policing initiative. A
particular concern in many districts was establishing trusted relationships with the
Hispanic community.
In the next chapter, results from a comparison of the trend in violent crime across
a large number of cities are considered.
This document is a research report submitted to the U.S. Department of Justice. This report has not been published by the Department. Opinions or points of view expressed are those of the author(s)
and do not necessarily reflect the official position or policies of the U.S. Department of Justice.

129
Chapter Seven: Impact Analysis
The case studies presented in the prior chapter suggest that the strategies
implemented by PSN task forces in selected districts and target cities hold potential for
reducing the level of violent crime. These included districts that followed a strategic
problem solving process and a pulling levers approach involving multiple strategies,
similar to that developed in the Boston Gun Project and replicated in the SACSI program,
as well as districts placing an emphasis on increased federal prosecution and a
communication strategy modeled on Richmond’s Project Exile. When coupled with the
studies of Boston, Indianapolis, and Richmond (Kennedy, 1997; Braga et al., 2001;
McGarrell et al., 2006; Corsaro and McGarrell, 2009; Rosenfeld, Fornango, and Baumer,
2005), these can be characterized as “promising practices.” However, the cities selected
for these PSN case studies were chosen because of indications that they had implemented
PSN in a meaningful fashion. They are not representative of PSN target cities or PSN
task forces across the United States. In this chapter, the analysis of the impact of PSN is
extended beyond this sample of case studies to all U.S. cities with a population over
100,000.
Analytic Framework
Given the well-known challenge of assessing a single-site crime intervention, the
examination of a nationally implemented violent crime reduction initiative that covered
94 U.S. federal districts44 and spanned over half a decade at a cost of over three billion
U.S. dollars is certainly a daunting challenge for any research team. The primary issue is
that aggregate-level studies of policy interventions suffer from a number of
methodological flaws (Berk, 2005; Bushway and McDowall, 2006). Rosenfeld,
This document is a research report submitted to the U.S. Department of Justice. This report has not been published by the Department. Opinions or points of view expressed are those of the author(s)
and do not necessarily reflect the official position or policies of the U.S. Department of Justice.

130
Fornango and Baumer (2005) attempted to examine the specific intervention effect of
Boston’s Operation Ceasefire (Braga et al., 2001; Kennedy et al., 2001; Piehl et al.,
2003), New York’s Compstat program (Kelling and Sousa, 2001; Fagan et al., 1998;
Harcourt, 2001; Moore and Braga, 2003), and Richmond’s Project Exile (Raphael and
Ludwig, 2003) relative to the mean change in homicide rates in the largest 95 U.S. cities
before, during, and in the case of Boston, after implementation. More specifically,
Rosenfeld et al. (2005) proposed that a true intervention effect in these specific treatment
cities should have been empirically distinguishable from the average change in homicide
in the 95 largest U.S. cities before, during, and after implementation. The model used in
the Rosenfeld et al. study was both a complex analysis and also a very conservative
evaluation approach because they argued any intervention effect should be observed
while controlling for other influences of homicide as evidenced in prior research (see
Land et al., 1990; Levitt, 2002; Marvell and Moody, 1997; Spelman, 2000).
In a response to the Rosenfeld et al. approach, Berk (2005) commented that all
types of analytic strategies that employ (often) less than reliable observational data
should be viewed with a degree of caution. Berk more specifically argued that evaluation
research within criminal justice should be more concerned with diligence in the collection
of appropriate data and applying a rigorous analytic framework, such as utilizing
experimental designs in order to ensure internal and external validity. Given that the
purpose of this study is to evaluate the impact of PSN implementation nationally, we
believe that the aggregate level approach used by Rosenfeld et al. is an appropriate
analytic strategy for just such an initiative. While we certainly are aware of the numerous
weaknesses with this type of approach, we attempt to minimize some of these limitations
This document is a research report submitted to the U.S. Department of Justice. This report has not been published by the Department. Opinions or points of view expressed are those of the author(s)
and do not necessarily reflect the official position or policies of the U.S. Department of Justice.

131
by relying upon systematic measures of PSN implementation and PSN dosage both
within and across large U.S. cities.
The strategy employed was designed to examine violent crime trends from 2000
to 2006 in all cities with a population of 100,000 or larger. A series of comparisons were
then constructed to compare PSN “treatment” cities with “non-treatment” cities; cities
compared by the level of PSN dosage; and cities compared by one specific component of
PSN dosage – federal prosecution level trends for criminal cases where U.S.C. 922 or
924 were brought as charges against a defendant.45 At the basic level, the logic behind
this evaluation strategy was to examine the following hypothesis: if PSN had an impact
on violent crime, greater declines should be apparent when comparing violent crime
trends between treatment cities, higher dosage cities, and high federal prosecution cities
with non-treatment, low dosage, and low prosecution cities.
Data
The data used in the subsequent analyses were culled from multiple sources. We
relied on data from the Federal Bureau of Investigation (FBI) Uniform Crime Reports
(UCR) that captured Type I offenses for the years 2000-2006 to create violent crime
outcome measures for each city. Data from the 2000 U.S. Census and 2000 Bureau of
Labor Statistics were used to create static structural indicators measuring the
demographic and population profiles for each city. Data were obtained from FBI UCR
Police Employee records for the period 2000-2006 to create an annual city-level police
density measure.46 Data were also collected from Bureau of Justice Statistics (BJS) to
create a yearly measure of state incarceration rates. Finally in order to obtain measures of
PSN implementation, including indicators of treatment and dosage, we used data
This document is a research report submitted to the U.S. Department of Justice. This report has not been published by the Department. Opinions or points of view expressed are those of the author(s)
and do not necessarily reflect the official position or policies of the U.S. Department of Justice.

132
collected by the Michigan State University (MSU) School of Criminal Justice PSN
Research Team. MSU researchers partnered with the Department of Justice and were
responsible for bi-annual data collection detailing the process and outcome measures that
were reported directly from the PSN project coordinators and research partners across the
country, which was a stipulation of the PSN program. Taken collectively, these data
sources were used to create the measures in the subsequent statistical models.
Dependent Variable
Given the PSN focus on gun crime, the ideal outcome measure would be based on
the number of firearm-related crime offenses in the jurisdiction. Unfortunately, firearm
offenses are not available as part of the Uniform Crime Reporting System, the only
consistently available source of crime data covering cities across the entire United
States.47 Consequently, in order to assess the impact of the national PSN intervention, we
used a composite violent crime count variable, which was an aggregate measure of
murder, robbery, and aggravated assault between 2000 and 2006 for all U.S. cities that
had a population of 100,000 or greater.48 Within-city regressions were used to impute
values for missing violent crime data prior to aggregation since the outcome measure is a
composite variable.49 However, where missing data existed for two or more within-city
offenses, we simply left the data as missing since Hierarchal General Linear Modeling
(HGLM) is flexible in handling missing data (Raudenbush and Bryk, 2002:199-200).
Missing data were an issue in less than 1.6 percent of the homicide counts over the seven
year period.50 A similar strategy was employed with 1.9 percent of robbery counts and
1.8 percent of assault counts.51 In all, this strategy yielded complete violent crime
measures for 98.5 percent of the violent crime cases (1,739 of 1,764 cases) and complete
This document is a research report submitted to the U.S. Department of Justice. This report has not been published by the Department. Opinions or points of view expressed are those of the author(s)
and do not necessarily reflect the official position or policies of the U.S. Department of Justice.

133
violent crime data for 95.6 percent of cities (241/252 cities), noting that seven cities
accounted for most of the missing data (22/25 cases).52
Independent Variables
Several independent variables were utilized at multiple levels in the subsequent
hierarchical regression models. We employed two structural measures at level 2 that
were treated as static (i.e., time invariant) characteristics of each city, population density
and concentrated disadvantage, which are established macro-level correlates of homicide
specifically (Land et al., 1990; Messner and Rosenfeld, 1998; Rosenfeld et al., 2005) as
well as violence and crime in general (Blau and Blau, 1982; Chamlin and Cochran, 1997;
Kane, 2006; LaFree, 1999; Liska and Bellair, 1995; Miethe, Hughes, McDowall, 1991;
Messner and Golden, 1992; Sampson and Raudenbush, 1999). Population density was
operationalized as the number of people per square miles and was logged in order to
reduce skewness. Concentrated disadvantage was a composite variable obtained from a
principal components factor analysis that included the following highly inter-correlated
measures: percent of families with children under 18 headed by a female, percent of
persons below poverty, median family income, male unemployment rate (i.e. males 16
years old and above who are unemployed), and percent African American. The factor
loadings for this measure (i.e. concentrated disadvantage) were all moderately strong (>
.60) and 72.7 percent of the inter-correlation between these items was captured in this
measure. Thus, the concentrated disadvantage measure used here is comparable to
disadvantage measures that have been used in similar research (Krivo and Peterson,
1996; Land et al., 1990; Reisig and Parks, 2004; Rosenfeld et al., 2005; Sampson and
Raudenbush, 1999).
This document is a research report submitted to the U.S. Department of Justice. This report has not been published by the Department. Opinions or points of view expressed are those of the author(s)
and do not necessarily reflect the official position or policies of the U.S. Department of Justice.

134
In terms of dynamic or time variant independent variables, prior research
indicates that trends in incarceration and police density are related to homicide (Marvell
and Moody, 1997; Spelman, 2000) and violent crime (Kuziemko and Levitt, 2004).
Thus, we incorporated into our analyses the annual state incarceration rate for each city
included in our research methodology. Similarly, an indicator of police per 100,000
residents was used, which was measured as an annual city-level measure created from the
UCR Police Employee data (i.e., the number of law enforcement officers in each city per
year/population). We also include a series of annual dummy variables designed to
control for random variability in violent crime trends in each year.
PSN Indicators: Treatment and Dosage
The most significant challenge for the evaluation of PSN stemmed from the fact
that at one level it is a full coverage program. That is, PSN is a nationally implemented
program covering the entire United States. The threat of federal prosecution for illegal
gun possession and use was theoretically available in every community of the U.S. and
the media component of PSN was a national campaign.53 When the entire U.S. receives
the treatment, unambiguous assessment of treatment impact is difficult to obtain. To
overcome this challenge, two strategies were employed. First, PSN task forces identified
target jurisdictions that were the focus of the task force’s efforts. We expected that if
PSN had an impact, it should be observed in target sites in comparison to non-target sites.
Second, we constructed measures of dosage. As explained earlier, PSN was not
implemented evenly across all 93 PSN task forces. We hypothesized that if PSN had an
impact on gun crime, it should result in greater reductions in high dosage jurisdictions in
comparison to low dosage jurisdictions. Additionally, one specific type of dosage was
This document is a research report submitted to the U.S. Department of Justice. This report has not been published by the Department. Opinions or points of view expressed are those of the author(s)
and do not necessarily reflect the official position or policies of the U.S. Department of Justice.

135
the level of federal prosecution for illegal gun crime. This measure was based on a
Project Exile model of increasing the incapacitation and deterrence effect on felons in
possession or illegal use of a firearm. If there was such an Exile effect, it should be
apparent in those jurisdictions experiencing the most significant increase in federal
prosecution.
Perhaps most important to the current study, a measure of PSN treatment was
incorporated into the statistical models as a level 2 static measure (0 = non-PSN treatment
city, 1 = PSN treatment city) (Papachristos et al., 2007). The operationalization of the
PSN treatment indicator used here is similar to ‘level’ of implementation (Berk, 2005:
452). In terms of delineating between PSN treatment cities and non-PSN treatment cities,
we relied on a systematic approach drawing from district level data and district reports
that the MSU PSN research team received from 2000-2006. In all, 68 U.S. federal
districts had large cities (i.e., population over 100,000) that were the focus of a PSN
intervention strategy. In addition, 20.5 percent of these districts had multiple large cities
that were the focus of a PSN intervention, which led to an N of 82 treatment cities and
170 non-treatment cities to provide comparison estimates. 54 Only those cities that were
specifically designated as a PSN treatment city, either by the district project coordinator,
research partner, or both were considered treatment cities in this evaluation.
When an entire county was the specific focus of PSN implementation, any city
with a population over 100,000 that was housed within the county was designated a PSN
treatment city. This was an issue in four (5.8%) of the districts. When documentation
indicated the entire federal district was the focus of the intervention, we contacted the site
coordinator for clarification regarding specific target cities in the district.55 Finally, given
This document is a research report submitted to the U.S. Department of Justice. This report has not been published by the Department. Opinions or points of view expressed are those of the author(s)
and do not necessarily reflect the official position or policies of the U.S. Department of Justice.

136
the district nature of the intervention and the fact that all included cities were part of a
federal district, we have confidence that non-treatment cities were indeed absent a focus
of PSN strategies due to the fact that district coordinators and researchers were in a
position to clarify this issue. We must note that it was impossible to rule out a ‘trickle
down’ or adoption effect that may have occurred in non-treatment cities. In order to
control for this issue, we also relied on a more precise measure of PSN ‘dosage’ (Berk,
2005: p. 452) that we included as a time-variant measure at level 1.
Dosage was a composite variable designed to capture the overall policy adoption
of the outlined PSN strategy. More specifically, dosage was an aggregate measure of
standardized z-scores of the three specific PSN policy elements framed by the
Department of Justice: (1) collaborative implementation, (2) research integration into
strategic planning, and (3) enhanced federal prosecution (for a more detailed review, see
Zimmerman, 2006; see also Chapter Five, pp. 73-77).56 Data were culled from the formal
semi-annual reports from the United States Attorneys’ Offices (USAO) between 2000
and 2005, as well as the MSU research partner survey and from data submitted to the
MSU PSN national research team, discussed in detail in Chapter Four.
Collaborative implementation was designed to measure the extent to which the
U.S. Attorney’s Office worked with other law enforcement, criminal justice, and
community groups and developed intervention strategies that crossed agencies. The
measure focused on a reported emphasis of the task force on enhanced local and state
prosecution, enhanced federal prosecution, law enforcement implementation including
directed patrol (McGarrell et al., 2001) or street-level enforcement (Braga and Pierce,
2005), parole and probation integration through the notification meeting or offender
This document is a research report submitted to the U.S. Department of Justice. This report has not been published by the Department. Opinions or points of view expressed are those of the author(s)
and do not necessarily reflect the official position or policies of the U.S. Department of Justice.

137
home visits (Braga et al., 2001; McGarrell et al., 2005), community programs (i.e.,
reported more than the modal value), supply-side intervention (Koper, 2005; Ludwig,
2005), and gang focus (Braga et al., 2006; 2008).
The second component of dosage was designed to measure variation in the level
of integration of research in task force analysis and planning. Research integration
measured whether PSN created an environment where data analysis drove decision
making as well as the quality of the data submitted to the MSU PSN team (for details oif
measures, see Chapter Five, pp. 75-76).
The third component was a measure of the level and trend in federal prosecution
for gun crime charges. Specifically, a factor score measured changes in federal
prosecution (Papachristos et al., 2007), which relied on both numeric changes as well as
changes in the per capita prosecution rate. Thus, adding these standardized scores
together created a dosage range from low (3) to high (9) for PSN treatment cities.
Although PSN officially was launched in 2001, interviews with PSN officials and
review of various data indicated that PSN was not implemented at the local level until
2002. Thus, for purposes of the evaluation, 2002 was considered the treatment date.57 In
terms of operationalization, dosage was treated as a time-variant measure at level 1.
Non-treatment cities received a zero for the dosage indicator between 2000 and 2006
since there was no indication of implementation of this three-stage approach in the
control cities. Intervention sites also received a zero for dosage in years 2000 and 2001
because we chose 2002 as the beginning of PSN implementation. In 2002 through 2006
PSN target sites received a fixed score that reflected the amount of PSN dosage (ranging
from 3 to 9) that was implemented in each unique target city.58
This document is a research report submitted to the U.S. Department of Justice. This report has not been published by the Department. Opinions or points of view expressed are those of the author(s)
and do not necessarily reflect the official position or policies of the U.S. Department of Justice.

138
The examination of dosage based on collaborative implementation of multiple
strategies, research integration, and prosecution, reflected a test of the strategic problem
solving model of PSN implementation. These components of dosage reflected key
ingredients of the type of model developed in Boston, applied in Indianpolis and SACSI
cities, and reflected in the case studies of the Middle District of North Carolina, Lowell,
Omaha, St. Louis, and in the studies of Chicago (Papachristos, 2007) and Stockton
(Braga, 2008).
In addition to the overall dosage measure, a separate analysis focused on the level
and trend of federal prosecution was conducted. This was intended to specifically focus
on the effect of federal prosecution levels. It thus represented a test of the Project Exile
model (Rosenfeld, Fornango and Baumer, 2005) as reflected in the case studies of Mobile
and Montgomery.
The reality is that the federal prosecution emphasis overlaps the strategic problem
solving and exile models. That is, the federal prosecution intervention can be considered
a component of the focused deterrence framework that is part of both models. Thus, the
analyses that follow do not reflect a strict test of two distinct strategies. Rather,
examination of the models should shed light on whether implementation of either of these
models related to changes in violent crime.
Analytic Strategy
To assess the relationship between PSN implementation and potential changes in
violent crime, we applied growth curve models to violent crime trends using data from all
U.S. cities that had a population greater than 100,000. In total, we examined changes in
violent crime trends in 252 of the largest U.S. cities. We relied upon Hierarchical
This document is a research report submitted to the U.S. Department of Justice. This report has not been published by the Department. Opinions or points of view expressed are those of the author(s)
and do not necessarily reflect the official position or policies of the U.S. Department of Justice.

139
Generalized Linear Models (HGLM) to assess within- and between- city changes in
violent crime between 2000 and 2006, using a Poisson sampling model with a correction
for over-dispersion, and the city population as the exposure variable. In this case, the
annual violent crime counts were treated as repeated measures nested within cities at
level 1. Incorporating the exposure variable allowed interpretation of the left-hand side
of the level 1 equation as the log violent crime rate per 100,000 population (Browning et
al., 2006; Raudenbush and Bryk, 2002). The inclusion of the population as the exposure
variable was based on the notion that the expected violent crime count of a city (i) in a
given year (t) is contingent upon both the criminal propensity of offenders in a given city
as well as the number of people living in that city. More specifically, larger cities have a
greater opportunity to house more offenders and subsequently will have more offenses.
In this case lambda (λ) is interpreted as a violent crime rate outcome.
The data contain multiple observations for the same cities over time, meaning
each of the observations are not statistically independent. Thus, we estimated random
effects models to capture all the unobserved and stable city-specific characteristics that
generate differences between cities in violent crime and also a random error term at
different observation occasions (see Brame, Bushway, and Paternoster, 1999; Rosenfeld
et al., 2005; Horney, Osgood, and Marshall, 1995; Xie and McDowall, 2008). In
addition, all level 1 measures were group-centered in order to create a unique intercept
and slope estimate for each city in the analysis, while each level 2 measure was grand
mean centered in order to provide unique between city estimates. Group centering a
time-varying covariate (X) at level 1 provides an unbiased estimate of the effect of
change between the independent variable X and violent crime within a city as the
This document is a research report submitted to the U.S. Department of Justice. This report has not been published by the Department. Opinions or points of view expressed are those of the author(s)
and do not necessarily reflect the official position or policies of the U.S. Department of Justice.

140
outcome, which is the focus of the current study. Our analyses relied on the use of HLM
computer software (version 6.02a; Raudenbush et al., 2004) throughout.
Time-varying (i.e., dynamic) explanatory variables including changes in city level
police density, the state prison population, and dosage effect of PSN were included in the
unconditional level 1 HGLM model. In addition, a series of dummy variables were
included at level 1 in order to control for the annual random within-city changes in
violent crime, using the year 2000 as the reference category. We included two
theoretically relevant and static social indicators at level 2: concentrated disadvantage
and population density. We used a two-level model that predicts within-city trajectories
in violent crime at level 1 and between-city violent crime variation at level 2 using the
predicted level 1 intercepts and slopes as outcomes (Hox, 2002). Ultimately, we used
this multi-level approach to assess whether there was an observed relationship between
PSN implementation (i.e., both PSN dosage and PSN treatment in different models) and
violent crime, controlling for theoretically relevant indicators within- and between cities.
59 The same approach was then used to assess the impact of trends in federal prosecution
levels.
Results – Treatment and Multiple Component Dosage
Figure 9 displays the average violent crime trends for the 252 cities examined
here, which are disaggregated into PSN treatment cities and non-PSN treatment cities.
Treatment cities averaged roughly 1,083 violent crimes per 100,000 population prior to
national PSN implementation (i.e., year 2000 and year 2001). Subsequently after
national PSN implementation, the year 2002 and beyond, violent crime rates in treatment
cities averaged 1,037 per 100,000 population. Overall, treatment cities experienced a 4.1
This document is a research report submitted to the U.S. Department of Justice. This report has not been published by the Department. Opinions or points of view expressed are those of the author(s)
and do not necessarily reflect the official position or policies of the U.S. Department of Justice.

141
percent reduction in violent crime trends, which equated to roughly 45 fewer violent
crimes per 100,000 residents between pre- and post- national PSN implementation.
Comparatively, non-treatment cities averaged roughly 612 violent crimes per 100,000
population prior to national PSN implementation. Between 2002 and 2006, non-target
cities averaged 607 violent crimes per 100,000 population. Thus, non-target cities
experienced a 0.9 percent decline, which equated to roughly five fewer violent crimes per
100,000 population over this period. Thus, the data presented in Figure 9 provided sound
preliminary support that target cities experienced a substantively greater decline in
violent crime after national PSN implementation compared with non-target cities.
Figure 9: Violent Crime Trends in Large U.S. Cities between 2000 and 2006 (Violent Crime Rate per 100,000)
Figure 10 displays the average violent crime trends for both treatment and non-
treatment cities by disaggregating treatment sites into three categories related to PSN
500
600
700
800
900
1000
1100
2000 2001 2002 2003 2004 2005 2006
Target cities (N = 82) Non‐target cities (N = 170)
This document is a research report submitted to the U.S. Department of Justice. This report has not been published by the Department. Opinions or points of view expressed are those of the author(s)
and do not necessarily reflect the official position or policies of the U.S. Department of Justice.

142
dosage: Low, Medium, and High. Low dosage cities (N = 14) were those treatment sites
that were consistently low on measures related to research integration, collaborative
implementation, and enhanced federal prosecution. Interestingly, low PSN dosage sites
and non-treatment sites (N = 170) experienced very similar violent crime trends between
2000 and 2006. Medium dosage cities (N = 33) experienced a far more gradual and
sustained decline in violent crime after 2001 than all other city distinctions, as evidenced
in Figure 10. Medium dosage sites tended to be moderate to very strong in at least two of
the three measures that comprise the PSN dosage measure. High dosage cities (N = 35)
tended to score very high in all of the indicators related to PSN dosage, and they also
tended to be cities that had a much higher base-line violent crime rate prior to PSN
implementation. Also interestingly, high dosage sites had a more abrupt reduction
between 2002 and 2003, but also experienced a marginal rebound in violent crime around
2005.
Figure 10: Violent Crime Trends in U.S. Cities by Dosage Designation
500
600
700
800
900
1000
1100
1200
1300
2000 2001 2002 2003 2004 2005 2006
Num
ber o
f Violent Crimes per 100
,000
Non‐treatment cities (N = 170)
Low dosage cities (N = 14)
Medium dosage cities (N = 33)
High dosage cities (N = 35)
This document is a research report submitted to the U.S. Department of Justice. This report has not been published by the Department. Opinions or points of view expressed are those of the author(s)
and do not necessarily reflect the official position or policies of the U.S. Department of Justice.

143
We next used HGLM growth curve models to assess whether there was a PSN
intervention effect on violent crime trends, net of other theoretically relevant factors
related to violent crime.
HGLM Growth Curve Models – Treatment and Multiple Component Dosage
Table 37 provides the descriptive statistics for the variables included in the
conditional growth curve models that utilized all the independent variables available here.
One note is that 11 of the 252 cities were excluded from analysis due to incomplete and
inadequate data. None of these eleven cities were PSN-target cities.60 In terms of the
univariate distribution of the variables, the average violent crime count was 2,712 with a
standard deviation of 6,098 violent crimes, which means the outcome measure was highly
skewed (s2 violent crime > X̄ violent crime) requiring an additional model parameter to
correct for over-dispersion (Raudenbush and Bryk, 2002: p. 334). In terms of
theoretically important measures that were time-variant, the cities examined averaged
roughly 273 officers per 100,000 population between 2000 and 2006. The average state
prison incarceration rate was roughly 473 per 100,000 population over this period. In
terms of static structural indicators, concentrated disadvantage ranged from low (-2.58) to
high (2.74) and population density ranged from low [ln(2.18 ppsqmile)] to high [ln(4.42
ppsqmile)]. The low variability in the population density measure was expected given
that the sample here only included large U.S. cities and the measure was logged (ln) to
reduce skewness. Finally, roughly 34 percent of the cities in the final model were PSN
treatment cities (82/241 cities).
This document is a research report submitted to the U.S. Department of Justice. This report has not been published by the Department. Opinions or points of view expressed are those of the author(s)
and do not necessarily reflect the official position or policies of the U.S. Department of Justice.

144
Table 37: Descriptive Statistics
Variable Mean S.D. Minimum Maximum Level 1 Measures (N = 1660) Violent Crime Count 2712.4 6098.1 72 74115 Dosage 1.5 2.75 0 9 Prison Rate 472.9 145.4 126 872 Police Density 273.5 111.8 108 927 Year 2000 .14 .35 0 1 Year 2001 .14 .35 0 1 Year 2002 .14 .35 0 1 Year 2003 .14 .35 0 1 Year 2004 .14 .35 0 1 Year 2005 .14 .35 0 1 Year 2006 .14 .35 0 1 Level 2 Measures (N = 241) Disadvantage61 .04 .99 -2.58 2.74 Population Density (ln) 3.52 .31 2.18 4.42 Treatment .34 .47 0 1 The results of the HGLM growth curve estimates were used to determine whether
PSN treatment cities experienced a change in violent crime rates, net of other relevant
correlates related to violent crime. The unconditional random effects baseline model
indicated significant variation and reduction in violent crime trends within cities in the
current study (π0i = -5.17, p < .01). In addition, the χ2 statistic accompanying the
estimated variance component in the unconditional model indicated significant variation
in violent crime among cities (s2 component = .432, df = 247, χ2 = 46,715, p < .01).
Table 38 summarizes the results of the conditional model that includes all level 1
and level 2 measures included in the current study.62 Consistent with prior research, the
strongest indicator of violent crime rates across cities was concentrated disadvantage.
Cities with more concentrated disadvantage experienced significantly more violent crime.
Every unit increase in the standardized measure of concentrated disadvantage was
This document is a research report submitted to the U.S. Department of Justice. This report has not been published by the Department. Opinions or points of view expressed are those of the author(s)
and do not necessarily reflect the official position or policies of the U.S. Department of Justice.

145
accompanied by a 66 percent increase in violent crime across cities. Similarly,
population density also had a significant relationship with violent crime across cities but
in a negative direction. In terms of within city estimates, state prison incarceration rates
had a marginally significant (p < .10) and positive relationship with a violent crime
increase over time, meaning that cities that experienced a rise in violent crime were also
very likely to have a rise in state prison incarceration rates. 63 Most important to the
present examination, PSN dosage exerted a negative and statistically significant
relationship (p < .05) with changing violent crime rates, net of dynamic and static
indicators.
Consistent across analyses, cities that experienced an increase in PSN dosage
were significantly more likely to experience a decline in violent crime rates over time.
For every unit increase in the standardized PSN dosage measure, within-city violent
crime rates declined by roughly -5.7 percent. Although included as statistical controls,
the dummy variables designed to capture annual random variability in violent crime also
revealed a pattern that was consistent with the line graphs seen in Figure 9. The ‘peak’
decline year for violent crime trends was 2004 both in terms of coefficient size and
statistical significance, while in 2005 the coefficient became both empirically smaller and
reduced from statistical significance (p < .05) to marginal significance (p < .10), while in
2006 became the indicator became statistically insignificant (p = .338). Thus, net of
other factors, including PSN dosage, there appeared to be a ‘rebound’ effect in violent
crime after 2004, net of the PSN dosage reduction. Implications of these findings are
discussed in the next section.
This document is a research report submitted to the U.S. Department of Justice. This report has not been published by the Department. Opinions or points of view expressed are those of the author(s)
and do not necessarily reflect the official position or policies of the U.S. Department of Justice.

146
In terms of model improvement from the unconditional model that did not include
any covariates to the conditional model, there are no conventional model fit statistics,
such as the deviance statistic, for Poisson count models in HGLM (Raudenbush et al.,
2004: ch. 5.1). However, model improvement can be compared by examining the change
in the residual variance component between the unconditional model and conditional
model (Raudenbush and Bryk, 2002: p. 309; Rosenfeld et al., 2005: p. 447). In the
unconditional model, the residual variance was .4320, while in the conditional model the
residual variance was .2066. Thus, the percentage reduction in the error variance
between the unconditional model and the conditional mixed-model was 52.1 percent,64
suggesting a substantial improvement in model fit.
Table 38: Conditional Random-Effects Poisson Model of Violent Crime Rates in Large U.S. Cities between 2000 and 2006 (Examining PSN Dosage)
Fixed Effects
Coefficient
Standard Error
Odds Ratio
Level 1 (Within-City Effects) Intercept -5.176 .0296 .006 PSN Dosage -.0059* .0030 .994 Incarceration Rate .0005+ .0003 1.001 Police Density .0002 .0003 1.000 Year 2001 -.0180+ .0094 .982 Year 2002 .0195 .0129 1.019 Year 2003 -.0225+ .0132 .977 Year 2004 -.0449** .0135 .956 Year 2005 -.0261+ .0140 .978 Year 2006 -.0125 .0145 .987 Level 2 (Between-City Effects) Disadvantage .5030** .0316 1.65 (Ln) Population Density -.2918** .0999 .747 Random Effects
Variance Component
χ2
p Value
Intercept, r 0i .2066 27078.1 < .01 Dosage, r1i .0002 173.1 < .01 Incarceration rates, r2i .0000 235.3 < .01 Police density, r3i .0000 196.8 < .01 Level 1 error, eti 22.95 - - **p < .01, *p < .05, + p < .10
This document is a research report submitted to the U.S. Department of Justice. This report has not been published by the Department. Opinions or points of view expressed are those of the author(s)
and do not necessarily reflect the official position or policies of the U.S. Department of Justice.
147
Cross-level interaction effects (i.e., slopes as outcomes) capturing the relationship
between disadvantage and PSN dosage (disadvantage*PSN dosage) and population
density and PSN dosage (density*PSN dosage) both yielded statistically significant and
negative interaction estimates, though in both models the direct effects of PSN dosage
were no longer statistically significant.65 There is little theoretical reason to believe PSN
dosage was a product of, or in some way was influenced directly by, either of these city
structural features. However, the cross-level interaction estimates were examined in
order to be consistent with an empirical hierarchical model-building approach
(Raudenbush and Bryk, 2002: chapter 2). Most importantly, the PSN dosage effect
retained statistical significance in alternative cross-level interaction models indicating a
robust relationship between dosage and violent crime reduction. We also substituted the
dichotomous measure designating treatment cities from non-treatment cities (0 = non-
PSN treatment city, 1 = PSN treatment city) in place of the PSN dosage measure at level
1 following the same pre/post intervention guidelines used in the dosage measure. The
results were very consistent with those presented in Table 38 (see Appendix C, Table C-
1).
One of the greatest threats to the validity of the above findings indicating a
relationship between increased PSN dosage and a reduction in violent crime is the
internal measurement validity of the PSN dosage measure used in the previous models.
More specifically, in terms of the operationalization of the PSN dosage measure used at
level 1, the analysis is based on the assumption that the three-phase component to PSN
(i.e., collaborative implementation, research into strategic planning, and enhanced federal
prosecution) started in 2002 and maintained its dosage intensity over time in all treatment
This document is a research report submitted to the U.S. Department of Justice. This report has not been published by the Department. Opinions or points of view expressed are those of the author(s)
and do not necessarily reflect the official position or policies of the U.S. Department of Justice.

148
cities through 2006. In order to include treatment as a level 1 measure, the research team
had to choose the best overall discrete time point to designate as the national PSN start
date. While some districts were able to provide specific start and end dates for their
specific PSN implementation that differed from the current time measure, we did not
want to selectively choose to use such information until a more detailed analytic
approach could be used for all districts.
Currently, there are no systematic measures available for a majority of PSN
treatment cities concerning their specific start and end dates, and how dosage varied over
the period examined here. We acknowledge this is a somewhat limited approach with a
major and very challengeable assumption. In order to address this issue, an additional
growth curve model is presented below that does not require a designated start and end
date by treating PSN treatment as a static factor at level 2, though this approach is not
without its own set of limitations in the current context. This analytic approach was
adopted from a similar and very rigorous PSN research evaluation that also relied on
growth curve models to assess the intervention effect in Chicago (Papachristos et al.,
2007). Papachristos et al. treated PSN target neighborhoods as a static factor at level 2
and created a cross-level interaction term using time as a single level 1 covariate when
analyzing neighborhood differences in crime trends within Chicago. Similar to their
strategy, we substituted a single measure of time (0 – 7 for the number of years of data
available here) in place of all annual dummy variables used in the prior mixed-model.
Table 39 displays the results of the growth curve model where PSN treatment (0 =
non-PSN treatment city, 1 = PSN treatment city) was designated as a static measure at
level 2.66 The results were very similar to the prior model displayed above. Specifically
This document is a research report submitted to the U.S. Department of Justice. This report has not been published by the Department. Opinions or points of view expressed are those of the author(s)
and do not necessarily reflect the official position or policies of the U.S. Department of Justice.

149
across cities, PSN treatment sites had significantly more violent crime (roughly 37
percent) than non-treatment sites. Similarly, there was significantly more violent crime
in cities where disadvantage was higher and lower violent crime in cities that had higher
population density. In terms of the cross-level interaction effect where the time slope
was estimated as a function of PSN treatment, there was a significant decline in violent
crime (p < .01) in PSN treatment cities over time compared to non-treatment cities, net of
within- and between city correlates of violent crime. Thus, as time passed (i.e.
increased), PSN treatment cities experienced a 2.4 percent reduction in violent crime
compared to non-treatment cities.67
Table 39: Conditional Random-Effects Poisson Model of Violent Crime Rates in Large U.S. Cities between 2000 and 2006 (Examining PSN Treatment*Time)
Fixed Effects
Coefficient
Standard Error
Odds Ratio
Level 1 (Within-City Effects) Intercept -5.17** .0283 .0056 Incarceration Rate .0008* .0003 1.000 Police Density .0002 .0003 1.000 Time -.0045* .0021 .9954 Level 2 (Between-City Effects) Disadvantage .4538** .0320 1.574 (Ln) Population Density -.1959* .0969 .8220 PSN Treatment City .3133** .0626 1.367 Cross-Level Interaction Effects PSN Treatment City*Time -.0252** .0038 .9731 Random Effects
Variance Component
χ2
p Value
Intercept, r 0i .1878 31858.4 < .01 Incarceration rates, r1i .0000 633.9 < .01 Police density, r2i .0000 616.1 < .01 Level 1 error, eti 25.16 - - **p < .01, *p < .05, + p < .10
While the model presented in Table 39 did not require a designated start and end
date, which was a requirement when including PSN dosage as a level 1 time variant
This document is a research report submitted to the U.S. Department of Justice. This report has not been published by the Department. Opinions or points of view expressed are those of the author(s)
and do not necessarily reflect the official position or policies of the U.S. Department of Justice.

150
measure, it assumes PSN treatment was static between 2000 and 2006 in all treatment
cities. 68 Finally, in order to examine the apparent quadratic function (i.e., the fall and
rise) seen in violent crime rates in treatment cites, both time (t1) and time squared (t^2)
variables were included in the above model, and both estimates were statistically
significant (p < .01) and in opposite direction (negative and positive respectively). Thus,
there was a quadratic change in violent crime rates over time within cities (See Appendix
D, Table D-1). The cross-level interaction estimates between level 2 treatment with both
time and time squared at level 1 yielded statistically significant results (p < .05), again in
the opposite direction for each interaction effect. Importantly, the odds of the event rate
for the decline (.949) were greater than the rebound (1.003) in violent crime which means
that the ‘fall’ in violent crime was greater than the ‘rise’ and thus there was a greater
reduction as time increased.
Results - Federal Prosecution Levels and Trends in Violent Crime
The prosecution measure used here is calculated as the annual number of
defendants prosecuted in federal court for each year between 2000 and 2006. The
prosecution data were measured at the federal judicial district level and represent the
number of federal prosecutions for gun crimes in each U.S. district. Complete
prosecution data, therefore, existed for all of the cities in this study because every city in
the United States falls within a federal jurisdictional boundary. The data were provided
by the Executive Office of United States Attorneys69 and reflected prosecution under
sections 922 and 924 of the United State Code, the main provisions covering federal
firearms charges.70
This document is a research report submitted to the U.S. Department of Justice. This report has not been published by the Department. Opinions or points of view expressed are those of the author(s)
and do not necessarily reflect the official position or policies of the U.S. Department of Justice.

151
More specifically, the eighty-two PSN target cities were located in sixty-six
federal districts meaning that roughly 80.5 percent of all PSN target cities were housed
within their own unique federal jurisdiction. Importantly, none of the remaining PSN
target sites (n = 16) had more than three PSN target cities that shared the same federal
boundary. It was important to assess whether changes in federal prosecution between
pre- and post-PSN intervention had a relationship with changes in violent crime rates
across PSN target cities. The PSN strategy focused heavily on improved criminal justice
cooperation with a significant emphasis on the increased use of federal prosecution in
order to maximize penalties for gun, gang, and violent offenses. Thus, the question
whether changes in prosecution changed violent crime in PSN target cities is certainly
theoretically tenable and worth examining.
In order to visually display this relationship, we calculated the unique percentage
increase for each federal district by comparing the average annual number of federal
defendants between pre- and post-PSN with the designated start date of 2002 (i.e., the
pre-intervention number of defendants per year for 2000 and 2001 and the post-
intervention number of defendants per year for 2002 to 2006). We then grouped the PSN
target cities that were located in districts in the top one-third (high prosecution, n = 26),
middle one-third (medium prosecution, n = 29) and bottom one-third (low prosecution, n
= 27) of all federal districts.
Federal jurisdictions classified as high prosecution sites experienced prosecution
increases from 72 percent to over 400 percent, with a median increase of 111 percent
increase in federal prosecutions between pre- and post-PSN. Jurisdictions grouped as
medium prosecution sites experienced increases in federal prosecution ranging from 29
This document is a research report submitted to the U.S. Department of Justice. This report has not been published by the Department. Opinions or points of view expressed are those of the author(s)
and do not necessarily reflect the official position or policies of the U.S. Department of Justice.

152
percent to roughly 70 percent, with a median increase of 53.6 percent. Districts classified
as low prosecution sites experienced a rate of change that ranged between -35.8 percent
(decrease in prosecution between pre- and post- PSN) to a 28.2 percent increase, with a
median increase of 15.6 percent in federal prosecutions. In terms of a change in violent
crime, Figure 11 clearly shows that target cities that were located in federal districts
classified as high prosecution sites (i.e., districts that had the largest increase in federal
prosecution between 2000 and 2006) experienced a rate of decline in violent crime that
was much greater and more sustained than cities located in medium and low federal
prosecution sites. More specifically, PSN target cities in high prosecution districts
experienced an average decline in violent crime of -13.1 percent, while violent crime in
target cities in medium and low prosecution districts changed by -3.1 percent and -5.3
percent respectively.71
Figure 11: Violent Crime Changes in PSN Target Sites Grouped by Prosecution Ranking
The next step was to examine the relationship between high, medium, and low
prosecution federal districts and violent crime changes in non-PSN target cities as well.
850.00
900.00
950.00
1000.00
1050.00
1100.00
1150.00
2000 2001 2002 2003 2004 2005 2006
Violent Crime Ra
te per 100
,000
High prosecution sites (n = 26)
Medium prosecution sites (n = 29)
Low prosecution sites (n = 27)
This document is a research report submitted to the U.S. Department of Justice. This report has not been published by the Department. Opinions or points of view expressed are those of the author(s)
and do not necessarily reflect the official position or policies of the U.S. Department of Justice.

153
We graphed the change in violent crime in non-target cities (N=172) using the same
criteria that was applied to the district-level classification used in the prior trend analyses
for the PSN-target cities. Ninety of the non-target cities (52.9 percent) were classified
within high-prosecution districts, forty-two cities (24.8 percent) were classified in
medium prosecution districts, and thirty-eight cities (22.3 percent) were housed within
low prosecution districts.72 These results indicated that non-target cities housed in high
prosecution districts were the only non-target cities to experience a sustained decline in
violent crime between 2000 and 2006, though the difference over this period was
obviously not as pronounced as was evident in PSN target cities. In addition, non-target
cities in medium and low prosecution sites experienced little to no decline between 2000
and 2006 (see Figure 12). Specifically, non-target cities in high prosecution districts
experienced a -4.9 percent reduction in violent crime between pre- and post PSN
intervention, while non-target cities in medium prosecution districts experienced a
decline of less than 1 percent and non-target cities in low prosecution districts actually
experienced a 7.8 percent increase in violent crime.
This document is a research report submitted to the U.S. Department of Justice. This report has not been published by the Department. Opinions or points of view expressed are those of the author(s)
and do not necessarily reflect the official position or policies of the U.S. Department of Justice.

154
Figure 12: Violent Crime Changes in Non-PSN Target Sites Grouped by Prosecution Ranking
HGLM Growth Curve Models – Federal Prosecution Trends
The trends reviewed in Figure 11 and Figure 12 suggested that cities in high
prosecution federal districts experienced larger declines and less of a rebound in violent
crime than cities in medium and low prosecution districts. These analyses, however, do
not test for statistical significance nor do they control for other factors that may influence
violent crime trends. In order to examine whether the annual changes in federal
prosecution had a statistically significant relationship with the annual changes in violent
crime across PSN target sites while also controlling for relevant structural factors that
prior research has shown to influence changes in violent crime rates, we utilized a two-
level HGLM analysis. These analyses were similar to those used in the prior models that
400
450
500
550
600
650
700
750
800
2000 2001 2002 2003 2004 2005 2006
Violent Crime Ra
te Per 100
,000
High prosecution sites (n = 90)
Medium prosecution sites (n = 42)
Low prosecution sites (n = 38)
This document is a research report submitted to the U.S. Department of Justice. This report has not been published by the Department. Opinions or points of view expressed are those of the author(s)
and do not necessarily reflect the official position or policies of the U.S. Department of Justice.

155
assessed the PSN treatment and PSN dosage impact in all large U.S. cities. Thus, we
selected out the eighty-two PSN target cities for regression analysis.
While statistical independence (i.e., shared federal prosecution measures at level
1) is violated in roughly one-fifth of the target cities, it is of minimal concern in the PSN
target city models because a maximum of three target cities existed in those federal
districts that housed multiple target cities. Thus, roughly four-fifths of the entire target
cities in the models had their own independent measure for prosecution that was
extracted from the federal district level, while the remaining cities by and large shared
these measures with only one additional target city. The prosecution measure is treated
as a dynamic time-varying covariate and, along with all other independent variables at
level 1, was group-centered to create a unique intercept and slope estimate for each city
in the analysis.
Table 40 provides the descriptive statistics for the variables included in the
conditional HGLM that utilized all independent variables in this target city analysis.
Similar to the prior dosage and treatment analyses, the target city prosecution analysis
drew from a Poisson distribution with a correction for over-dispersion since the violent
crime measure was heavily skewed, and the city-population was used as the exposure
variable in order to control for relative population differences. The level 2 variables
included measures of concentrated disadvantage and population density (logged) for the
eighty-two target cities, while the level 1 measures included seven years of state
incarceration and police density data for each of the target cities, and a control measure
categorized as a time variable to account for random variation in violent crime between
2000 and 2006. Most important for this examination, the prosecution variable was the
This document is a research report submitted to the U.S. Department of Justice. This report has not been published by the Department. Opinions or points of view expressed are those of the author(s)
and do not necessarily reflect the official position or policies of the U.S. Department of Justice.

156
annual number of defendants prosecuted in federal court and was included as a time-
varying covariate for each of the PSN target cities, which had a range from twelve
defendants in a given district in a given year to four hundred fifty nine defendants.
Table 40: Descriptive Statistics for Target City Prosecution Analyses
Variable Mean S.D. Minimum Maximum Level 1 Measures (N = 574) Violent Crime Count 5408.3 9735.7 73 74115 Prosecution 143.5 90.2 12 459 Prison Rate 452.2 144.1 158 872 Police Density 333.9 116.4 136 695 Time 3.0 2.0 0 6 Level 2 Measures (N = 82) Disadvantage .45 .85 -2 2.74 Population Density (ln) 3.49 .34 2.18 4.42 The unconditional random effects baseline model indicated significant variation
and a reduction in violent crime trends within PSN target cities (π0i = -4.77, p < .01). The
χ2 statistic accompanying the estimated variance component in the unconditional model
indicated significant variation in violent crime among target cities (s2 component = .229,
df = 81, χ2 = 6,789, p < .01). Thus, the next step was to assess whether annual changes in
federal prosecution had a relationship with annual violent crime rates across PSN target
cities, controlling for other important static and dynamic factors. Table 41 indicates that
controlling for structural factors that have been established as correlates of changes in
violent crime (e.g., disadvantage, population density, state incarceration rates, police
density, and controlling random changes in crime over time), as federal prosecution
increased in the jurisdictions where the PSN target cities were located, violent crime
reduced at a statistically significant level (p < .01) by 3.2 percent between 2000 and
2006.73
This document is a research report submitted to the U.S. Department of Justice. This report has not been published by the Department. Opinions or points of view expressed are those of the author(s)
and do not necessarily reflect the official position or policies of the U.S. Department of Justice.

157
Table 41: Conditional Random Effects Model Examining Changes in Federal Prosecution across PSN Target Cities
Fixed Effects
Coefficient
Standard Error
Odds Ratio
Level 1 (Within-City Effects) Intercept -4.787 .0413 .0083 Prosecution -.0032** .0014 .9968 Incarceration Rate .0014* .0005 1.001 Police Density -.0000 .0006 .9999 Time -.0202** .0032 .9792 Level 2 (Between-City Effects) Disadvantage .3998** .0533 1.491 (Ln) Population Density -.1179 .1316 .8887 Random Effects
Variance Component
χ2
p Value
Intercept, r 0i .1334 11077 < .01 Incarceration rates, r2i .0000 241.0 < .01 Police density, r3i .0000 214.0 < .01 Level 1 error, eti 38.01 - - **p < .01, *p < .05, + p < .10
The final step was to examine whether changes in federal prosecution affected
PSN target cities different than non-PSN target cities across the entire sample of large
U.S. cities. A two-level HGLM model of non-treatment cities would heavily violate the
assumption of statistical independence because the remaining 171 non-target cities were
housed again in seventy-seven total federal districts, and thus extreme repetition would
occur. In order to address this issue, we estimated a 3-level HGLM model where within-
city violent crime change over time was modeled at level 1 (N = 1,736), PSN target city
designation was modeled at level 2 (N = 248), and federal prosecution designation (e.g.,
high/medium/low) was modeled at level 3 (N = 77).74 We tested whether the federal
designation (level 3) interacted with PSN target city classification (level 2) to impact
changes in violent crime within cities (level 1). While an increase in prosecution
designation did have a negative relationship with violent crime (i.e., higher prosecution
meant lower violent crime over time), the estimate was statistically insignificant (p = .37)
This document is a research report submitted to the U.S. Department of Justice. This report has not been published by the Department. Opinions or points of view expressed are those of the author(s)
and do not necessarily reflect the official position or policies of the U.S. Department of Justice.

158
both alone and controlling for all other relevant factors at level 1 and level 2 (p = .84) that
were included in the prior HGLM analyses. Thus, the change in prosecution was not able
to significantly delineate PSN target cities from non-target cities in the models here.
However, given that a large number of target and non-target cities experienced a rebound
in violent crime after 2005, this result was somewhat expected.
The results of the analyses here examining the relationship between changes in
federal prosecution and changes in violent crime across PSN target sites indicated that
there was a strong relationship between the increase in federal prosecution and the
decrease in violent crime trends. This was not a surprising result given the prior PSN
dosage analysis also indicated a relationship between increased PSN dosage and
decreased violent crime across large U.S. cities between 2000 and 2006. One-third of the
dosage measure was operationalized as increased federal prosecution. Most importantly,
the prosecution results examined here provide support that a large driving force behind
the dosage-violent crime relationship was the fact that increased federal prosecution was
very much related and important to reduced violent crime.
Thus, there was very strong support that high PSN dosage sites altered the manner
in which defendants were prosecuted and that the influx of federal defendants was very
likely due to the increased focus on the use of federal sanctions in an effort to reduce
youth, gang, and gun violence. High-prosecution districts experienced much greater
declines in violence in target cities and also a decline in violence in non-target cities after
the start of the PSN strategy. These results suggest the increased use of federal sanctions
had a substantive and significant impact on the reduction in violent crime, which held net
of other important factors that have been established as correlates of violent crime.
This document is a research report submitted to the U.S. Department of Justice. This report has not been published by the Department. Opinions or points of view expressed are those of the author(s)
and do not necessarily reflect the official position or policies of the U.S. Department of Justice.

159
Diagnostic Tests
We performed a series of diagnostic tests examining the distributional properties
of the residuals in the aforementioned models. HGLM analysis assumes a normal
distribution of level 1 residuals and a violation of this assumption can lead to a bias in the
standard errors of the fixed effects estimates and inferential statistics (Raudenbush et al.,
2004: p. 38). We examined a series of Q-Q plots75 of the observed values of the level 1
residuals for both the time variant PSN Dosage model presented in Table 38 as well the
time-invariant PSN Treatment model seen in Table 39. In both instances the plots were
approximately linear. This suggested that a departure from a normal distribution of
residuals was of minimal concern (See Appendix C, Figure C-1 and Appendix D, Figure
D-1 respectively). We were also very detailed when exploring diagnostic tests of the
level 2 estimates, which required a series of examinations. We inspected plots comparing
the Empirical Bayes (EB) with Ordinary Least Squares (OLS) residuals for each
estimated indicator as well as the Mahalanobis distances for each of the level 2 estimates
in both sets of models presented in the main findings section. All of these examinations
indicated that the level 2 residuals also conformed to the normality distribution
requirement (Raudenbush et al., 2004: p. 41). Finally, a zero-order correlation analysis of
the level 2 measures indicated that no bivariate relationship at level 2 exceeded a
correlation of .320, which is of minimal concern. Thus, the diagnostic tests indicated that
none of the inferential statistics presented here were likely to be influenced by heavily
biased standard errors.
This document is a research report submitted to the U.S. Department of Justice. This report has not been published by the Department. Opinions or points of view expressed are those of the author(s)
and do not necessarily reflect the official position or policies of the U.S. Department of Justice.

160
Discussion
The graphs and models presented in the results section paint a very consistent
picture: PSN intervention cites experienced a significantly greater decline in violent
crime than non-PSN intervention cities. The decline, or negative growth, in violent crime
in PSN cities was observed using a time-variant measure of PSN dosage at level 1 and a
static measure of implementation, also referred to as a treatment indicator at level 2. A
complementary analysis of the impact of the trend in federal prosecution levels on violent
crime in PSN target cities produced very consistent findings. The significant PSN
treatment relationship was found to be associated with the reduction in violent crime held
net of both dynamic and static indicators including concentrated disadvantage, population
density, changes in state incarceration rates, and changes in police density, which are all
factors commonly associated with changes in violent crime. Thus, the analytic approach
used here helps to control for some relevant ‘alternative’ explanations in terms of the
observed violent crime reduction that was seen in PSN target cities, which lends more
support to a PSN intervention effect.
One cautionary note was the rebound in violent crime that occurred during the
period of 2004 to 2006. The increase was observed in almost sites (treatment, non-
treatment; low, medium and high dosage) and was evident in the time estimates in both
HGLM unconditional growth curve models presented here. The fact that the increase
occurred in all categories of cities suggests factors beyond the PSN program. It does,
however, beg the question, “what is a successful intervention?” Was the PSN impact a
short-term effect? Did the intensity of PSN intervention fade over time? Or, would the
uptick have been more significant absent PSN? This last interpretation is suggested in
This document is a research report submitted to the U.S. Department of Justice. This report has not been published by the Department. Opinions or points of view expressed are those of the author(s)
and do not necessarily reflect the official position or policies of the U.S. Department of Justice.

161
the trends observed in Figure 11 that indicated that target cities in high federal
prosecution districts were the outlier in terms of avoiding the increase in violent crime
observed in most cities. Indeed, this group of cities witnessed a continued decline in
violent crime in 2005 and the increase in violent crime in 2006 did not reach 2004 levels.
This was in stark contrast to the other cities that experienced increases in 2005 and 2006.
This issue will be discussed in the concluding chapter.
Evaluation strategies must systematically compare observed crime reductions
with those that would have occurred without the intervention, which in turn requires
comparisons with other places and controls for other influences based on nationally
representative samples (Rosenfeld et al., 2005: 440). The use of UCR violent crime data
to create a representative sample of treatment and non-treatment sites, the HGLM growth
curve statistical methodology used to create estimates of within and between city changes
in violent crime over time, and the use of static and dynamic independent variables
related to violent crime while also including PSN treatment and PSN dosage at varying
levels represents just such a rigorous research methodology. PSN represents a major
nationally implemented program, and in many ways was an unprecedented strategic
approach designed to reduce violent crime. Evaluating PSN from a national perspective
is an equally daunting challenge for any research team. The analyses presented herein
are certainly not without their limitations, which we describe in detail.
Limitations
There are a number of limitations to the analytic strategy employed here, which
also will serve as a guide for future research attempting to examine the dynamic PSN-
violent crime relationship. First, the limitation of an ‘off/on’ PSN dosage effect requiring
This document is a research report submitted to the U.S. Department of Justice. This report has not been published by the Department. Opinions or points of view expressed are those of the author(s)
and do not necessarily reflect the official position or policies of the U.S. Department of Justice.

162
a designated beginning and end point has already been discussed. The fact that the PSN
treatment estimates were robust lends support that the observed co-variation between
treatment and violent crime reduction occurred at the aggregate level. A more detailed
analytic approach should discern the unique start and end dates for each city in the
analysis. Similarly more precise time variant dosage measures should be included in a
‘within PSN target city’ examination including factors such as changes in federal
prosecution, the number of ATF gun seizures, and the duration of the research partner’s
involvement in directed decision making. Indeed, if PSN was the driving force behind
the change in violent crime rates within target cities, there should be a relationship
between high, medium, and low dosage and subsequent changes in violent crime across
PSN treatment cities. Following the direction of Bushway and McDowall (2006), we
propose the next step in conducting a more detailed PSN policy analysis will rely on the
use of interrupted time series models to assess changes in violent crime within PSN target
cities, particularly once unique onset and duration measures are captured.76 Future
research should strengthen our understanding of PSN implementation, the evolution of
dosage, and sustainability.
Second, the methodology employed here also assumes equal treatment within
PSN target cities. Many of the PSN task forces focused on intensive hot spot areas
within cities, rather than a broad focus across entire cities. For example, Papachristos et
al. (2007) compared PSN treatment neighborhoods against non-treatment areas within
Chicago. This would suggest the Chicago-based intervention was not a city-wide
approach but was more specific to discrete neighborhoods within the city. It is certainly
reasonable to suspect that a number of PSN treatment cities used a similar approach,
This document is a research report submitted to the U.S. Department of Justice. This report has not been published by the Department. Opinions or points of view expressed are those of the author(s)
and do not necessarily reflect the official position or policies of the U.S. Department of Justice.

163
which is not captured in the methodology here. More detailed methodology should
attempt to discern overall target city approaches from a more discrete neighborhood
focus.
Third, PSN was enacted in all federal districts, though only 68 U.S. districts had
cities with a population over 100,000 that received PSN treatment. This equates to
roughly 75 percent of all U.S. districts, which means roughly one quarter of all districts
were excluded from the current analytic methodology. One of the issues in a large
number of the remaining districts is that many of these sites relied on a more general and
rural focus across a large range of locations rather than a specific city. For example,
some rural sites focused on a state reduction in domestic violence. Given that these rural
areas were likely to have a series of unique strategies over vast areas, a subsequent
unique analytic approach is needed to perform a systematic evaluation of these sites.
Having said this, the diffusion of the intervention across a federal judicial district and or
state also raises issue of the dosage of the intervention and the statistical power to
measure impact given the limitations of common and available crime measures across
police jurisdictions. For example, the District of Maine included a strategic focus on
domestic violence. However, the number of domestic homicides is relatively low and
does not provide statistical power to measure impact along the lines employed herein.
An intensive, local-level evaluation strategy would need to be employed to measure the
impact of such a PSN strategy.
Fourth, PSN was an initiative designed to reduce violence, and in particular gun
violence and gun related crime (Wellford et al., 2005). The outcome used in the analyses
presented here relied upon UCR Type I violent crimes including robbery, aggravated
This document is a research report submitted to the U.S. Department of Justice. This report has not been published by the Department. Opinions or points of view expressed are those of the author(s)
and do not necessarily reflect the official position or policies of the U.S. Department of Justice.

164
assault, and homicide and no subsequent measure exists in the UCR data that reports the
presence of a firearm during the commission of these particular offenses. An alternative
strategy that would have provided systematic firearm related violent crime data would
have been to rely on the Supplementary Homicide Reports (SHR), which are lethal
offense data that are also collected by the FBI.77 While our understanding of firearm
related fatalities would be improved using the SHR data, this approach also has serious
limitations. First, preliminary PSN case study reports submitted to the Office of Justice
Programs indicated that some districts experienced changes in firearm related aggravated
assaults (McDevitt et al., 2007; McGarrell et al., 2007), firearm related robberies (Decker
et al., 2007a), as well as firearm related homicides (Decker et al., 2007b) after PSN
implementation. Simply relying on SHR data would limit the assessment of potential
changes in non-lethal violent crime, regardless of whether a firearm was used. Second,
an analysis of SHR data indicated that over half (N = 125) of all cities with a population
of 100,000 or more averaged less than 1 homicide per month (.94) between 2000 and
2006,78 thus restricting sample size. Unfortunately, there is no organized data collection
system that has information on firearm-related violent crime beyond homicide.79 A
systematic firearm related analysis is vital to a more thorough understanding of the utility
of PSN strategies. As noted in previous chapters, PSN task forces were asked by DOJ to
submit gun crime data. Although the Michigan State University PSN research team had
access violent firearm related offense data reported by many of the districts, there was
serious under-reporting and a lack of comparability across districts. This creates a
serious issue of a selection bias by only analyzing data from sites that actually submitted
This document is a research report submitted to the U.S. Department of Justice. This report has not been published by the Department. Opinions or points of view expressed are those of the author(s)
and do not necessarily reflect the official position or policies of the U.S. Department of Justice.

165
firearm related offenses, and will subsequently exclude a comparison group of non-
treatment sites.
A final threat to the finding that PSN appears to have resulted in declines in
violent crime in high dosage treatment cities relates to selection effects and the possibility
that the results may reflect a regression to the mean effect. That is, it is plausible that
treatment cities were chosen as PSN target sites based on high levels of violent crime at
the time PSN was being planned. If these high rates were based on unusual temporal
factors, then the rate of violent crime may have fallen absent the PSN implementation.
This is particularly likely when viewing the trend in violent crime among target and non-
target cities. As displayed in Figure 9, target cities did have a considerably higher rate of
violent crime in 2000 and 2001 compared to non-target cities. On the other hand, there is
contrary evidence that suggests something beyond regression to the mean was occurring.
Specifically, the second dosage measure, levels of federal prosecution, resulted in a
comparison of cities that had very similar levels of violent crime in 2000-2001. Yet, as
indicated in Figure 11 it was only in high federal prosecution districts that cities
experienced a steep and sustained decline in violent crime. Further, as will be displayed
in the next chapter, the pattern of declining rates of violent crime was persistent for
dosage effects even within non-target cities (see Table 42). Specifically, non-target cities
in high dosage districts experienced a 4.9 percent decline in violent crime whereas non-
target cities in low dosage cities experienced a 7.8 percent increase in violent crime.
Given that these cities were not selected based on levels of initial crime, it is unlikely that
the decline in violent crime in high dosage districts was based on regression to the
mean.80
This document is a research report submitted to the U.S. Department of Justice. This report has not been published by the Department. Opinions or points of view expressed are those of the author(s)
and do not necessarily reflect the official position or policies of the U.S. Department of Justice.

166
In conclusion, the limitations outlined here also serve as the foundation for future
research. However, it is equally important to note that future inquiry is warranted in
large part because the analyses presented in this chapter were indeed suggestive of a PSN
intervention effect. Specifically, PSN treatment sites, high dosage sites, and high
prosecution sites experienced a significantly greater reduction in violent crime compared
to non-treatment sites, lower dosage sites, and lower prosecution sites. These results
were observed after controlling for other important factors related to changes in violent
crime, and were subsequently seen during the period when PSN was implemented at a
national-level. While the results presented in this chapter suffer from many of the
limitations that have been discussed in prior criminal justice evaluations, we have
controlled for a great many methodological issues by following the examples in prior
successful and rigorous evaluation studies. Finally, we outline a number of potential
future areas of inquiry to further strengthen and augment the methodology presented
here.
This document is a research report submitted to the U.S. Department of Justice. This report has not been published by the Department. Opinions or points of view expressed are those of the author(s)
and do not necessarily reflect the official position or policies of the U.S. Department of Justice.

167
Chapter Eight: Key Findings, Research and Policy Considerations
The final chapter includes discussion of key findings as well as considerations for
future research and policy. The findings are organized by general observations on the
components of successful implementation, the role of research and integration of
research, and PSN strategy development. This is followed by a summary of the research
findings on the impact of PSN on violent crime. Several theoretical and future research
issues are considered and several policy implications are presented.
Importance of Leadership
Throughout this project the MSU research team had the opportunity to interact
with officials in every PSN task force, to visit over 36 districts, and develop a series of
strategic and site specific case studies that involved interviews with numerous PSN
officials. A consistent finding was that in districts where PSN was being implemented in
a serious and meaningful fashion, and where there was evidence that gun crime was
being addressed in new ways following the implementation of PSN, that the leadership of
the U.S. Attorney and the U.S. Attorney’s Office was critical. Many described the
“power” of the office to bring together other local, state, and federal law enforcement and
criminal justice partners, as well as other elements of local government, social services,
and neighborhood groups. Others described the importance of the U.S. Attorney making
PSN a major priority of the office and the reduction in violent crime a key goal.
There was also evidence of variation across the U.S. Attorneys in terms of the
extent to which they made, or were able to successfully articulate and make actionable,
PSN a major priority. This was evident in the variation in the patterns of PSN
implementation and particularly in the variation in federal prosecution levels for firearms
This document is a research report submitted to the U.S. Department of Justice. This report has not been published by the Department. Opinions or points of view expressed are those of the author(s)
and do not necessarily reflect the official position or policies of the U.S. Department of Justice.

168
charges across the PSN districts. The finding that federal prosecution increased
nationally by over 60 percent since the implementation of PSN suggested that the
majority of U.S. Attorneys did make PSN and increased gun crime prosecution a priority.
However, the national data minimize the wide variability across U.S. Attorney’s Offices.
As described in Chapter Four, the top Ten districts experienced an increase of 200
percent or more. Fifty of the districts observed increases of 60 percent or more. In sharp
contrast, the bottom ten districts ranged from no change to a 38 percent decline in
firearms charge filings. When viewed from the perspective of the level of federal
prosecution of gun crime per capita, similar findings of wide variation emerged. The top
twelve districts had a prosecution rate of 10 or more per 100,000 population. The bottom
13 districts had rates under 2.0 per 100,000 population. This was less than half the
national average and five times lower than the top group of districts.
In districts with significant increases in federal prosecution the U.S. Attorney’s
Office typically took a number of steps. The first was to convey the priority within the
office. Many established relationships with the local prosecutor and often used PSN
funds to cross-designate local prosecutors as Special Assistant U.S. Attorneys who would
prosecute gun cases in federal court. The development of joint case screening processes
with the local prosecutor, local law enforcement and ATF was a similar step.
Coordination with ATF on prioritization of gun cases for federal prosecution and
communicating to local law enforcement the increased emphasis on federal prosecution
of gun cases were also observed in districts where PSN was a clear priority.
Certainly there were justifiable reasons for having a lower level of federal
prosecution than other districts. Lower levels of violent crime and differences in
This document is a research report submitted to the U.S. Department of Justice. This report has not been published by the Department. Opinions or points of view expressed are those of the author(s)
and do not necessarily reflect the official position or policies of the U.S. Department of Justice.

169
penalties for gun crime under state law were two factors. Thus, for example, the district
of Massachusetts had a lower per capita prosecution rate for gun crimes than the national
average. One explanation was that the state of Massachusetts had comparatively strong
penalties for gun crime. Further, the level of prosecution increased in the District of
Massachusetts (+106%) above the national average, thus suggesting that PSN was a
priority within the U.S. Attorney’s Office. Absent compelling evidence to the contrary,
however, it is difficult to believe that PSN was made a major priority in the 11 districts
that had no increase or a decline in federal prosecution of gun cases.
In addition to the leadership of the U.S. Attorney, districts with a high level of
PSN implementation often developed what appeared to be a “distributed leadership”
model. Within the USAO this frequently meant reliance on a team that included the PSN
coordinator (typically an Assistant U.S. Attorney) and the Law Enforcement Coordinator
(LEC). In these districts, leadership was often found in the formal leaders of other
partnering agencies including the local chief of police or sheriff, federal law
enforcement,81 probation and parole, the department of corrections, and local municipal
or county government. In many task forces such leadership was provided by other
partners including the schools, social services, weed and seed coalitions, neighborhood
leaders, the faith community, and other community organizations. Additionally, effective
task forces typically included leaders from throughout these organizations that
represented the day-to-day line level officials who were critical to changing the way
business was done with respect to gun crime. In a number of task forces, the research
partner played an important leadership role.
This document is a research report submitted to the U.S. Department of Justice. This report has not been published by the Department. Opinions or points of view expressed are those of the author(s)
and do not necessarily reflect the official position or policies of the U.S. Department of Justice.

170
Importance of Focused Interventions
One of the reasons for the inclusion of strategic planning and the integration of
research in PSN was to support focused interventions. The promising programs upon
which PSN was based all included a focused deterrence logic model whereby
enforcement resources were aimed at the people, places and contexts believed to be
producing high rates of gun crime and violence. This was reinforced by a National
Academies of Science review of research evidence on the effectiveness of policing
strategies in reducing crime that found that the more focused the intervention, the more
impact on crime (National Research Council, 2005). The emphasis on focusing
resources was included as a point of emphasis in the strategic problem solving training
provided to all PSN districts.
The concept of focusing resources was a source of tension for many U.S.
Attorneys. Specifically, many if not all USA’s were understandably committed to
serving their entire district. The emphasis on focusing on target cities or even target
neighborhoods or police districts was often perceived as in conflict with the goal of
serving the entire district. For some PSN task forces, this was seemingly irreconcilable
and the entire district remained the formal target area. For other districts, distinctions
were made between components of the PSN strategy that could be delivered district-wide
(e.g., the media campaign; commitment to local law enforcement to review priority gun
cases for federal prosecution) and those that could be delivered in a key target area (e.g.,
street-level gun enforcement teams; offender notification meetings; neighborhood re-
development). The importance of developing a focus on key target areas was suggested
This document is a research report submitted to the U.S. Department of Justice. This report has not been published by the Department. Opinions or points of view expressed are those of the author(s)
and do not necessarily reflect the official position or policies of the U.S. Department of Justice.

171
in the case studies as well as the cross-city analyses of the impact of PSN on violent
crime.
The Role of Research and Research Integration
PSN also represented a federal commitment of resources to support law
enforcement-researcher partnerships as an ingredient in the PSN task forces. This was an
outgrowth of several factors. First, the inclusion of research partners was a key element
of Boston Ceasefire (Gun Project) as well as the Strategic Approaches to Community
Safety Initiative. Second, the research partners were considered instrumental in assisting
the task forces in conducting problem analyses to develop the type of focused
interventions described above. Third, PSN included an emphasis on accountability. It
was hoped that the research partners would help gather performance measures and assess
the impact of the local PSN program.
The evidence suggested that like other components of PSN, the inclusion of
research partners produced mixed results across the 93 PSN task forces. Although
difficult to measure systematically, it appeared that in about one-fifth of the districts there
was very little evidence of the integration of research. In some cases this appeared to be
the product of a lack of interest on the part of the U.S. Attorney or the PSN task force
officials. Research partners were not included as members of the task force and minimal
interaction occurred. In other instances this appeared to be based on the failure of the
research partner to be part of the task force and/or to produce research findings
considered relevant and of value to the task force. During the course of the PSN program
the MSU research team received calls of frustration from U.S. Attorneys and PSN
coordinators who complained that they were not getting anything of value from their
This document is a research report submitted to the U.S. Department of Justice. This report has not been published by the Department. Opinions or points of view expressed are those of the author(s)
and do not necessarily reflect the official position or policies of the U.S. Department of Justice.

172
research partner. At the same time, calls from research partners were received expressing
frustration at not being included in the task force and not having the opportunity to
understand task force goals and priorities for research. In these districts with no or
limited success in the integration of research, the problems seemed to stem from
combinations of the following:
• Lack of interest in, or understanding of the value of, research on part of USA and/or PSN task force
• Lack of understanding or interest in the active research partner role on part of researcher (in contrast to a more detached research role)
• Data availability problems that made difficult delivery of timely and valuable analyses
On the other hand, there was evidence of research integration in the vast majority
of PSN task forces. This was most apparent in the research partners providing data-
driven analyses of the local gun crime problem. A compelling piece of evidence of the
perceived value of research was the finding that over one-half of the PSN task forces
provided discretionary funds to continue the work of their research partners after the
initial grant award had expired. Another encouraging observation, from the perspective
of police-research partnerships, was the emergence of long-term research partnerships
that have seemingly emerged from PSN. Examples included the relationship in the
Western District of Tennessee with the University of Memphis and the Northern District
of Ohio with Kent State University, the District of Nebraska with the University of
Nebraska at Omaha, and the Western District of New York with Rochester Institute of
Technology. The Middle District of North Carolina established long-term relationships
with teams of researchers at the University of North Carolina Greensboro and Winston-
Salem State University, and the Eastern District of Wisconsin had similar relationships
This document is a research report submitted to the U.S. Department of Justice. This report has not been published by the Department. Opinions or points of view expressed are those of the author(s)
and do not necessarily reflect the official position or policies of the U.S. Department of Justice.

173
with a network of researchers from a number of institutions. The state of Massachusetts
adopted the research partner model as a core element of the Shannon Project, a gang
violence reduction initiative (Massachusetts Executive Office of Public Safety and
Security, 2008).
The importance of research integration was also suggested in the analyses of PSN
implementation. Research involvement was positively related to two other key
components of PSN: formal partnerships and level of federal prosecution. That is, PSN
districts that reported higher levels of research integration (by both PSN coordinators and
the research partner), also had a larger number of PSN partners and higher levels of
prosecution. Two interpretations are plausible. The first is that the same districts that
were most committed to PSN (thus having more partners and higher levels of
prosecution), were also committed to integrating research. The second is that valuable
research helped solidify partnerships and may have assisted focusing resources on the
gun crime problem, thereby increasing levels of federal prosecution. The data do not
allow us to disentangle causal order.
Similar findings emerged in terms of the role of information infrastructure and
PSN implementation. An absence of information infrastructure was associated with
lower levels of PSN implementation. This may indicate that when the information
infrastructure could not support research integration, the other PSN components of
partnerships and federal prosecution also tended to suffer.
The Emergence of Gun Crime Intervention Strategies
As noted in previous chapters a variety of strategies were employed by PSN task
forces. The most common were increased federal prosecution; joint federal-local
This document is a research report submitted to the U.S. Department of Justice. This report has not been published by the Department. Opinions or points of view expressed are those of the author(s)
and do not necessarily reflect the official position or policies of the U.S. Department of Justice.

174
prosecution case screening; directed police patrol; chronic violent offender programs;
street level firearms enforcement teams; offender notification meetings; re-entry
programs; and firearms supply side interventions. The most common prevention
strategies included neighborhood development; education; and school-based prevention
programs. It was impossible to distinguish the impact of specific strategies on trends in
violent crime. The case studies suggested support for a Project Exile-style emphasis on
increased federal prosecution of gun crime coupled with a communication strategy that
sought to increase the perceived risk of prosecution of illegal gun possession and use.
Additional case studies provided support for a strategic problem solving, pulling levers
set of strategies that used research-based problem analysis to direct resources at the key
contexts driving violence and then used the threat of federal prosecution, direct
communication to groups of at-risk individuals (offender notification meetings), and
additional levers (probation/parole supervision, warrant service, street level enforcement)
to similarly increase the perceived risk of illegal gun possession and use. Although the
research approach did not allow disentangling the components of these strategies,
interviews and observations suggested that a number of PSN task forces were able to
combine multiple components into an overall strategy emphasizing focused deterrence.
Integrating Strategies in Project Safe Neighborhoods While one of the central principles of PSN is establishing an inclusive and
coordinated approach to reducing gun violence, when these approaches become
collaborative rather than simply coordinated they appeared more likely to be successful.
For years, creating a task force had been a popular strategy in criminal justice to address
crime problems. Such task forces typically involved sharing personnel and other
This document is a research report submitted to the U.S. Department of Justice. This report has not been published by the Department. Opinions or points of view expressed are those of the author(s)
and do not necessarily reflect the official position or policies of the U.S. Department of Justice.

175
resources in a combined effort to address crime. The collaborative model, however,
suggested that not only were resources shared, communications improved and operations
coordinated, but that decision making was shared across traditional agency boundaries.
Often when this level of integration was attained there were considerable benefits beyond
simple cooperation.
Perhaps the best example of this occurred in the area of case review. Almost
every PSN district had a formal process for determining the most appropriate prosecution
venue for gun cases. In some situations, this was conducted through referrals on an
individual case basis from local prosecutors while in other jurisdictions a formal meeting
was held in which all gun cases were discussed. While there is certainly no single best
way of conducting this process, in many districts the formal discussion of cases often led
to an exchange of information and intelligence. Such information was useful in not only
determining prosecution venue but this information was often considered very helpful in
developing intelligence, generating informants, and identifying individuals who may be
suitable for attention through a most violent offender initiative.
In addition, in many districts the case review discussion reflected a broad
consideration of a variety of factors about the case and included viewpoints from not only
federal prosecutors but also law enforcement as well as community prosecutors. With
this range of input, decisions were often made reflecting the value of the case to the
community and the role the defendant played in gun violence or gangs rather than a strict
calculation of sentencing vulnerability. Such a collaborative process often included
consideration of the value of the case to the community and additional information that
could be obtained from the individual offender in the prosecution venue decision rather
This document is a research report submitted to the U.S. Department of Justice. This report has not been published by the Department. Opinions or points of view expressed are those of the author(s)
and do not necessarily reflect the official position or policies of the U.S. Department of Justice.

176
than exclusively sentencing exposure. This collective and shared decision making
process often led to a greater focus on the gang and gun violence problem beyond making
individual case decisions.
Another commonly used component of many PSN initiatives was an incident
review process. In these initiatives, information was reviewed from specific cases that
were representative of gun violence incidents for the purpose of developing a more
comprehensive picture of gang activity and gun violence in the jurisdiction and target
areas. While one objective of this activity was to assemble what was known about
specific incidents from a variety of law enforcement sources, this information was also
quite valuable for other PSN project components. In particular, information that was
obtained through this process could be directly used in formulating most violent offender
programs as well as in developing information that could be used to structure offender
notification meetings.
An additional intervention that developed during the PSN program was the Drug
Market Initiative. In this strategy, communities worked with law enforcement agencies
to stop drug distribution and other structured criminal activities in the neighborhood.
This initiative was pioneered in the Middle District of North Carolina in High Point and
has now spread to many other jurisdictions. In this approach, the criminal justice
community developed a strong partnership with the neighborhood to stop drug
distribution and the resulting violence in this area. This strategy also demonstrated the
value of integrating various PSN components. While offender notification was central to
this approach, successful implementation of this model often included incident reviews to
obtain a larger picture of the drug market in the neighborhood and to identify the
This document is a research report submitted to the U.S. Department of Justice. This report has not been published by the Department. Opinions or points of view expressed are those of the author(s)
and do not necessarily reflect the official position or policies of the U.S. Department of Justice.

177
hierarchy of individuals in groups and gangs involved in drug distribution. In addition,
the case screening process helped distinguish drug offenders with chronic records and/or
histories of violence who would be prosecuted and lower level dealers who would be
included in an offender notification meeting and offered a second chance. The key point
is that the integration of strategies appeared to both focus enforcement resources as well
as to support the collaborative network involved in PSN through the sharing of
information.
Moving Towards Evidence-Based Practice to Reduce Gun Crime
The findings from the series of site-specific PSN case studies, when combined
with a complementary series of studies that began with the Boston Gun Project suggests
that focused, deterrence-based interventions hold considerable promise for reducing
levels of violent gun crime. These interventions can be summarized as falling in three
categories: directed police patrol, Project Exile-style strategies, and strategic problem
solving/pulling levers strategies.
Directed Police Patrol
Directed police patrol with a focus on gun crime and illegal gun possession was
one of the more popular strategies reported by U.S. Attorneys and PSN coordinators in
their reports to the Attorney General (58% reported utilizing in 2005). It does not appear
that directed patrol, as a specific strategy in isolation from more general PSN strategies,
was systematically evaluated in PSN. The support for directed patrol comes from a series
of quasi-experiments conducted in Kansas City, Indianapolis, and Pittsburgh in the 1990s
(Sherman and Rogan, 1995; McGarrell et al., 2001; Cohen and Ludwig, 2003). In all
three studies, directed police patrol aimed at gun crime hot spots were associated with
This document is a research report submitted to the U.S. Department of Justice. This report has not been published by the Department. Opinions or points of view expressed are those of the author(s)
and do not necessarily reflect the official position or policies of the U.S. Department of Justice.

178
significant declines in gun crime. Further, it appeared that with appropriate management
and supervision, the intensive patrols were conducted in a way that did not generate
police-citizen conflict, a concern associated with such focused enforcement.
Project Exile
Project Exile seeks to increase the threat of punishment for illegal possession and
use of firearms as a way of discouraging gun possession and carrying among high risk
individuals (prior felons, misdemeanants with domestic violence convictions, mentally
ill, and youths). The strict provisions of federal law, including no right to bail, long
sentences with minimal good-time, and incarceration in the federal prison system, are
considered key elements of the deterrence message. This message is then communicated
through a variety of media including billboards, posters in jails and lock-ups, radio and
television public service announcements. The model was originally developed in
Richmond, Virginia. Rosenfeld and colleagues (Rosenfeld, Fornango & Baumer, 2005)
found that Exile was associated with a significant decline in homicide controlling for a
number of other factors.
As described above, two PSN case studies evaluated the impact of Exile-style
interventions. The first took place in Montgomery in the Middle District of Alabama
(McGarrell et al. 2007). Time series analysis was used to examine the trend in assaults
with a firearm, armed robbery with a firearm, and homicides. The key reduction was in
assaults with a firearm. Homicides also declined, but the decline did not attain statistical
significance. There was no change in armed robbery. In examining these trends it is
important to note that gun assaults were by far the most common violent gun crime in
Montgomery at about 25 per month. In contrast, armed robberies and homicides
This document is a research report submitted to the U.S. Department of Justice. This report has not been published by the Department. Opinions or points of view expressed are those of the author(s)
and do not necessarily reflect the official position or policies of the U.S. Department of Justice.

179
occurred at the rate of approximately two to three per month. Thus, the strategy appeared
to impact the most serious component of gun crime in Montgomery. Due to the absence
of an appropriate control or comparison site, the trend in gun crime was compared to the
trend in property crime, measured as motor vehicle thefts and overall property offenses.
Neither changed during this time period, thus minimizing the likelihood that the decline
in gun assaults was due to some other factor influencing crime in Montgomery.
The second evaluation of a PSN Exile strategy took place in Mobile in the
Southern District of Alabama (Hipple et al., 2007). Time series analyses were also
utilized. Once again a logical control or comparison site was not available. In this case,
the trend in property crime was included in the time series models to control for the effect
of unmeasured factors affecting all crime in Mobile. The results indicated that total gun
crime declined by about 26 incidents per month. Violent crime with a gun declined by
about 16 incidents per month and armed robberies by about 11 per month. Each decline
was statistically significant. Further, gunshot wound admissions to the local trauma
center declined at the same time that the police data indicated a reduction in gun crime,
thus strengthening the conclusion that gun crime was reduced.
Strategic Problem Solving/Pulling Levers
The strategic problem solving/pulling levers strategy refers to a comprehensive
intervention that traces to the Boston Gun Project. Detailed problem analysis, conducted
in collaboration of a multi-agency law enforcement team and researchers, is used to
pinpoint the people, groups, and contexts associated with gun crime. The analysis then
informs a set of pulling levers interventions that seeks to convey a strong deterrence
message to those most at risk for being involved in gun crime as offenders and victims.
This document is a research report submitted to the U.S. Department of Justice. This report has not been published by the Department. Opinions or points of view expressed are those of the author(s)
and do not necessarily reflect the official position or policies of the U.S. Department of Justice.

180
This is considered most powerful when the deterrence message is communicated to
groups of potential offenders in offender notification meetings. The goal is to use the
social network to reinforce the deterrence message. The deterrence message is coupled
with a message of social support, typically offered by social service providers and local
residents.
At the time of the development of PSN, the evidence for the potential impact of
this strategy was largely based on studies in Boston and Indianapolis. In Boston, the
pulling levers intervention conducted in the mid-1990s was associated with more than a
60 percent decline in youth homicide (Kennedy, 1997; Braga et al., 2001; Piehl, 2003).
Following a very similar approach, the pulling levers approach in Indianapolis was
associated with a 34 percent reduction in homicide (McGarrell and Chermak, 2003;
McGarrell et al., 2006; Corsaro and McGarrell, 2009). Since that time, a number of other
studies have found evidence of an impact of the pulling levers strategy on homicide and
gun crime. These include Tita and colleagues’ quasi-experiment conducted in Los
Angeles (Tita et al., 2003) as well as a series of PSN case studies.
Anthony Braga, one of the researchers involved in the Boston Gun Project, served
as research partner in the Eastern District of California. Braga conducted a thorough
problem analysis that informed a pulling levers intervention in Stockton. The evaluation
indicated a significant decline in gun homicides in Stockton compared to other similar
California cities (Braga, 2008).
PSN officials in Lowell, Massachusetts employed a pulling levers strategy to
address youth gang gun violence. The pre- and post-analysis indicated a significant
reduction in gun assaults when compared to trends in gun crime in other Massachusetts
This document is a research report submitted to the U.S. Department of Justice. This report has not been published by the Department. Opinions or points of view expressed are those of the author(s)
and do not necessarily reflect the official position or policies of the U.S. Department of Justice.

181
cities (McDevitt et al., 2006; Braga et al., 2008). Similar results were observed in Omaha
(District of Nebraska). Time series analyses revealed a 20 percent decline in total
firearms offenses during a time that property crime was unchanged (Hipple et al., 2007).
The Middle District of North Carolina implemented the strategic problem
solving/pulling levers model in five communities: Durham, Greensboro, High Point,
Salisbury, and Winston-Salem. The PSN case study focused on Durham, Greensboro and
Winston-Salem.82 Time series analyses were conducted of the trend in total gun crimes
(homicides with a firearm, robberies with a firearm, and aggravated assaults with a
firearm). All three cities experienced declines with the reductions in Greensboro (13
fewer incidents per month) and Winston-Salem (9 fewer incidents per month) being
statistically significant.
As described in Chapter 6, a case study was also conducted in St. Louis in the
Eastern District of Missouri (Decker et al., 2007). The PSN intervention focused on
several very high crime neighborhoods and compared the impact on gun crime to several
comparison neighborhoods as well as the trend in gun crime for the city as a whole.
Although there was a statistically significant decline in the PSN target areas, there were
also declines in the comparison areas and the entire city. Thus, although it is possible
that PSN had an impact across the city, it is impossible to attribute the decline to PSN.
An additional systematic evaluation was conducted by the PSN research partners
in Chicago (Northern District of Illinois). Similar to St. Louis, the PSN program in
Chicago focused on specific high violent crime neighborhoods in different parts of the
city. The evaluation involved comparison of these PSN treatment neighborhoods to other
similar neighborhoods. The results demonstrated that the PSN treatment neighborhoods
This document is a research report submitted to the U.S. Department of Justice. This report has not been published by the Department. Opinions or points of view expressed are those of the author(s)
and do not necessarily reflect the official position or policies of the U.S. Department of Justice.

182
experienced a statistically significant decline in gun crime relative to comparison
neighborhoods (Papachristos et al. 2007).
This series of studies results in eleven tests of the strategic problem
solving/pulling levers approach to reducing gun crime. In nine of the eleven, a
statistically significant decline in gun crime was associated with the implementation of
the strategic problem solving intervention. The two exceptions were St. Louis and
Durham.83 Both experienced declines in gun crime. In the case of St. Louis, the decline
also occurred in the comparison sites. In Durham, the decline was not statistically
significant.
Summary
Since the findings from Boston and Kansas City in the mid-1990s (Kennedy,
1997; Sherman and Rogan, 1995), an accumulating body of evidence has emerged
suggesting that focused deterrence interventions can have an impact on reducing gun
crime at a local level. PSN built on this evidence and contributed to the research
evidence. The series of studies are summarized in Figure 13.
.
This document is a research report submitted to the U.S. Department of Justice. This report has not been published by the Department. Opinions or points of view expressed are those of the author(s)
and do not necessarily reflect the official position or policies of the U.S. Department of Justice.

183
Figure 13: Studies Suggestive of Focused Deterrence Impact on Gun Crime*
Directed Police Patrol
• Kansas City• Indianapolis• Pittsburgh
Project Exile
• Richmond• Montgomery• Mobile
Strategic Problem Solving/Pulling Levers
• Boston• Indianapolis• Los Angeles• Stockton• Lowell• Omaha• Greensboro• Winston‐Salem• Chicago
Equivocal Evidence
• St. Louis• Durham
*Full citations are provided in the Appendix.
Cross-City Comparison
The promising results described above from the case studies were reinforced in
the analyses of trends in violent crime in all U.S. cities with populations over 100,000.
As noted previously, evaluating PSN was challenging due to the national coverage of the
program. Thus, the strategy was to compare cities that were PSN target sites with non-
target sites and to compare cities based on the dosage level of PSN implementation. The
logic behind the comparisons was that if PSN had its intended impact on violent crime it
should be most apparent in PSN target cities and as the dosage level increased.
The findings consistently provided support for the idea that meaningful
implementation of PSN led to reductions in violent crime. As the three component
dosage measure (partnerships, research integration, federal prosecution of gun crime)
increased, PSN target cities experienced lower levels of violent crime contrasting the
2000-2001 pre-PSN level of crime with the trend in 2002-2006. When the dosage
measure was limited to the impact of increased federal prosecution, the findings again
revealed that PSN target cities in high dosage federal districts had the greatest decline in
crime. Additionally, these cities resisted the uptick in violent crime witnessed across the
This document is a research report submitted to the U.S. Department of Justice. This report has not been published by the Department. Opinions or points of view expressed are those of the author(s)
and do not necessarily reflect the official position or policies of the U.S. Department of Justice.

184
country in 2005 and although there was an increase in 2006 it was much less pronounced
than in other cities. These results were consistent controlling for other factors that have
been shown to influence levels of violent crime (e.g., concentrated disadvantage,
population density, levels of police staffing, incarceration trends).
The results of these analyses are presented in Table 42. PSN target cities
experienced over an eight percent decline in violent crime whereas non-target cities
experienced no change in violent crime (-0.25%). Non-target cities in high prosecution
districts, and PSN target cities in low and medium prosecution districts were relatively
similar with three to five percent declines. The most compelling evidence of a PSN
effect is provided in the contrast between low dosage, non-PSN target cities with high
dosage, PSN target cities. The low dosage non-target cities experienced a 7.8 percent
increase in violent crime during this time period. A reasonable interpretation is that this
is the anticipated changed in violent crime during the 2000-2006 period absent the PSN
intervention. The high dosage, PSN treatment sites experienced a 13.1 percent decline in
violent crime during the same period. This suggested that cities that were the subject of
an intensive PSN intervention based on a focused deterrence model witnessed a
significant decline in violent crime in contrast to what would have been expected with no
PSN intervention.
This document is a research report submitted to the U.S. Department of Justice. This report has not been published by the Department. Opinions or points of view expressed are those of the author(s)
and do not necessarily reflect the official position or policies of the U.S. Department of Justice.

185
Table 42: Summary of Changes in Violent Crime in Target and Non-Target Cities, by Level of Federal Prosecution
Level of Federal Prosecution
PSN Target Cities Non-PSN Target Cities
Low -5.3% +7.8% Medium -3.1% <-1.0% High -13.1% -4.9% Total* -8.89% -0.25% *Total percentage change was calculated from the entire target/non-target city data
Research Implications
The key research finding was that the case studies and the cross-city analyses
support the concept that focused deterrence strategies appear to have an impact on levels
of violent crime. This point was reinforced when coupled with studies from the projects
that served as foundation for PSN. Having said this, future research could extend this
study and the associated body of research in a number of ways.
With the exception of the directed patrol studies reviewed herein, the Project
Exile model and the strategic problem solving/pulling levers model share several
components that were supported. Specifically, both included partnerships led by the U.S.
Attorney’s Office, both included an increase in federal prosecution for illegal gun use and
possession, and both include strategies to communicate the deterrence threat to at-risk
populations. The strategic problem solving/pulling levers model put additional emphasis
on research integration, inclusion of multiple strategies, and offender notification
meetings as a tool for communicating to groups of at-risk individuals. Both models
appear very promising in reducing violent crime. Future research would benefit from
careful research designs that would allow for more systematic comparisons of these
overall strategies as well as specific components of the strategies.
This document is a research report submitted to the U.S. Department of Justice. This report has not been published by the Department. Opinions or points of view expressed are those of the author(s)
and do not necessarily reflect the official position or policies of the U.S. Department of Justice.
186
Similarly, this body of research provides much stronger evidence of the impact at
a community level than it does at the individual level84. Very little systematic research
has been published on the impact of these types of strategies on individuals subject to the
interventions. From a theoretical standpoint, current research does not clarify if the
observed impact is due to incapacitation of chronic violent offenders, deterrence of illegal
gun carrying and use, shifts in network norms and behavior among groups involved in
gun crime, changes in the perceived legitimacy of the law, or some combination of these
forces.
Additionally, research is needed to address the sustainability of these types of
multi-agency interventions. Boston and Indianapolis, whose pulling levers interventions
served as models for PSN, both suffered increased levels of homicide and violent crime
during the decade that began in 2000. Several of the cities included in the case studies
later experienced increases in homicide. The violent crime trends reviewed in Chapter
Seven reflected an increase in violent crime after 2004. Several interpretations are
plausible.
It could be that the impact of increased federal prosecution, the communication
strategies, and the pulling lever interventions fade over time. That is, there is a short-
term impact of these largely enforcement strategies but it is not sustained. This
explanation is largely focused on the logic of the intervention model. Critics of the
intervention would likely argue that it is insufficient absent longer-term strategies to
invest in human capital and community economic and physical development. Some
critics would go a step further and warn that the short-term enforcement may ultimately
be self-defeating by working against human and social capital.
This document is a research report submitted to the U.S. Department of Justice. This report has not been published by the Department. Opinions or points of view expressed are those of the author(s)
and do not necessarily reflect the official position or policies of the U.S. Department of Justice.

187
A second interpretation is that the theory behind the intervention is sound but that
it is difficult to sustain these multiple agency coalitions and focused interventions over
time. Decay can occur as personnel turnover results in losses of leadership, new task
force members join but are unfamiliar with the logic model become involved, or
enforcement activities become routinized rather than strategically focused on the people,
networks, places, and contexts currently driving violence. Follow-up study of PSN task
forces that have remained active and focused over a long period of time would be very
helpful in understanding the sustainability of coalitions.
A third interpretation is that the rebound in violent crime experienced in many
cities in 2005-2006 was caused by broader economic, social, and political factors (e.g.,
Police Executive Research Forum, 2006) and the increase in crime would have been
worse absent PSN. Support for this argument would point to the delay in the rebound
and the much more modest increase in violent crime when comparing PSN target cities in
high prosecution districts with other cities, particularly non-target cities in low
prosecution districts.
At this point available research does not provide an answer to these three
interpretations. More research is needed to advance understanding of the long-term
impact of these types of interventions and about the sustainability of research-driven,
multiple agency coalitions.
Policy Considerations
The valuable experience of being involved in the national PSN initiative resulted
in several policy considerations. First, the call for more research should not be taken as
reason to delay action. The human toll of violent gun crime and the deleterious impact of
This document is a research report submitted to the U.S. Department of Justice. This report has not been published by the Department. Opinions or points of view expressed are those of the author(s)
and do not necessarily reflect the official position or policies of the U.S. Department of Justice.

188
gun violence on families and communities demands action. The body of evidence that
has emerged since the mid-1990s on focused deterrence strategies suggests that multiple
agency coalitions, working with community partners, can have a significant impact on
violent crime at the local level. The current PSN research suggests that the leadership of
the U.S. Attorney’s Office and the use or threat of federal prosecution are important tools
for the focused deterrence approach.
Second, the limitations of existing crime information systems became apparent in
PSN. To the credit of the Department of Justice, PSN included an emphasis on
accountability through performance measures and outcome measures, and it included
funding for research partners to assist in gathering performance measures and assessing
outcomes. Unfortunately, the limits of existing crime information systems precluded
effective implementation of these goals. The national crime reporting system, the UCR,
does not include measures of gun crime. Incident based reporting systems can generate
measures of gun crime but are not available in many jurisdictions and thus of limited
value for cross-city comparisons and national estimates of gun crime. The National
Crime Victimization Survey provides national estimates of violent crime but not at the
local level. Given the advances in information technology, development of an improved
national reporting system, at least for the nation’s largest cities that generate a
disproportionate amount of violent gun crime would be a significant advance and critical
for supporting future assessment of the impact of federal violence reduction
interventions.
The goal of seeking to reduce gun crime nationally is certainly laudable. Given
the wide variation in the community level risk of gun crime victimization, resource
This document is a research report submitted to the U.S. Department of Justice. This report has not been published by the Department. Opinions or points of view expressed are those of the author(s)
and do not necessarily reflect the official position or policies of the U.S. Department of Justice.

189
constraints, and the evidence-based practice of highly focused interventions, a tiered
approach to national violence reduction programs may be advisable. Needs assessment
of the capacity to implement multiple agency focused interventions could be coupled
with risk assessment to prioritize funding for program intervention. This approach could
improve future evaluation of impact as well as increase capacity for implementation.
From a research and evaluation standpoint, if resources to support high dosage
interventions are limited, then a larger pool of sites could be identified for potential
implementation. Random allocation or other systematic approaches (e.g., matching by
propensity) could be used to select treatment and comparison sites, thus greatly
strengthening the ability to assess impact.
Additionally, for sites considered low on information infrastructure and with little
experience with multi-agency collaboration, the results of this study suggest that efforts
to build capacity on these dimensions could help support future implementation
effectiveness.
Ultimately PSN has advanced knowledge and provided support for practice in
several key ways. First, it built upon and extends evidence-based practice that emerged
in the mid-1990s. There are highly promising interventions that appear to offer officials
sound strategies to reduce gun crime at the local level. Although there is still much to be
learned about successful interventions, lack of knowledge should no longer serve as an
excuse for inaction in addressing gun crime. Second, it lent support to the power of the
office of the U.S. Attorney to lead local, state, and federal coalitions in addressing crime
control and prevention priorities. Third, it fostered law enforcement – researcher
This document is a research report submitted to the U.S. Department of Justice. This report has not been published by the Department. Opinions or points of view expressed are those of the author(s)
and do not necessarily reflect the official position or policies of the U.S. Department of Justice.

190
partnerships that, while not always successful, were associated with more successful
implementation of program goals.
This document is a research report submitted to the U.S. Department of Justice. This report has not been published by the Department. Opinions or points of view expressed are those of the author(s)
and do not necessarily reflect the official position or policies of the U.S. Department of Justice.

191
References
American Correctional Association, (2000). 2000 directory: Adult and juvenile correctional departments, institutions, agencies, and probation and parole authorities. Lanham, MD: American Correctional Association.
Barrett, K., Greene, R., and M. Mariani. (2001, February 2001). Grading the states 2001. Retrieved October 15, 2005, from http://www.governing.com/gpp/2001/gp1glanc.htm.
Betts, P., K. Henning, R. Janikowski, L. Klesges, H. Scott, and A. Anderson. 2003. Memphis Sexual Assault Project: Final Report. Memphis, TN: University of Memphis.
Berk, R. A. (2005). “Knowing when to fold 'em: An essay on evaluating the impact of
Ceasefire, Compstat, and Exile.” Criminology and Public Policy, 4, 451-466.
Blau, J. R., & Blau, P. M. (1982). “The cost of inequality: Metropolitan structure and violent crime.” American Sociological Review, 47, 114-129.
Braga, A. A. 2004. Gun Violence Among Serious Young Offenders. Washington, DC: U.S. Department of Justice, Office of Community Oriented Policing Services.
Braga, A. A., J. McDevitt, and G.L. Pierce. (2006). “Understanding and preventing gang
violence: problem analysis and response development in Lowell, Massachusetts.” Police Quarterly 9, (1) 20-46.
Braga, A.A., P.J Cook, D.M. Kennedy, and M.H. Moore (2002). “The illegal supply of
firearms.” In M. Tonry (Ed.) Crime and Justice: An Annual Review. Chicago: University of Chicago Press.
Braga, A.A., D.M. Kennedy, A.M. Piehl, and E.J. Waring. (2001). “Measuring the impact
of Operation Ceasefire.” In Reducing Gun Violence: The Boston Gun Project’s Operation Ceasefire. Washington, DC: National Institute of Justice.
Braga, A. A, D. M. Kennedy, E.J. Waring, and A.M. Piehl. (2001). “Problem-oriented
policing, deterrence, and youth violence: an evaluation of Boston’s Operation Ceasefire.” Journal of Research in Crime and Delinquency, 38 (3): 195 – 225.
Braga, A. A., Pierce, G. L., McDevitt, J., Bond, B. J., and Cronin, S. (2008). “The
strategic prevention of gun violence among gang-involved offenders.” Justice Quarterly, 25, 132-162.
Braga, A. A., and G.L. Pierce. (2005). “Disrupting illegal firearms markets in Boston: The effects of Operation Ceasefire on the supply of new handguns to criminals.” Criminology and Public Policy, 4, 717-748.
This document is a research report submitted to the U.S. Department of Justice. This report has not been published by the Department. Opinions or points of view expressed are those of the author(s)
and do not necessarily reflect the official position or policies of the U.S. Department of Justice.

192
Browning, C. R., D. Wallace, S.L. Feinberg, and K.A. Cagney. (2006). “Neighborhood social processes, physical conditions, and disaster-related mortality: The case of the 1995 Chicago heat wave.” American Sociological Review, 71 (661-678).
Bushway, S.D., and D. McDowall. (2006). “Here we go again-can we learn anything from aggregate-level studies of policy interventions?” Criminology and Public Policy, 3, 461-470.
Bushway, S.D., R. Brame, and R. Paternoster. (1999). “Assessing stability and change in criminal offending: A comparison of random effects, semiparametric and fixed effects modeling strategies.” Journal of Quantitative Criminology, 15 (1), 23-61.
Bureau of Justice Statistics: www.ojp.usdoj.gov/bjs/ijs.htm (Accessed 12/28/04). Chamlin, M., and J. Cochran. (1997). Social altrusm and crime. Criminology, 35, 203-
228.
Chermak, S. 2006. Reducing Violent Crime and Firearms Violence: The Indianapolis Lever-Pulling Experiment. Final Report Submitted to the National Institute of Justice.
Cohen, J. and J. Ludwig (2003). “Policing Crime Guns” in Ludwig, J. and PJ Cook (eds.)
Evaluating Gun Policy: Effects on Crime and Violence. Washington, DC: Brookings Institution Press.
Coleman, V., W.C. Holton Jr., K. Olson, S.C. Robinson, and J. Stewart. (1999). “Using
Knowledge and Teamwork to Reduce Crime.” National Institute of Justice Journal October: 16-23.
Comfort, L. K. (2002). “Managing intergovernmental responses to terrorism and other
extreme events.” Publius, 32(4), 29-49.
Comfort, L. K. (2005). “Risk, security, and disaster management.” Annual Review of Political Science, 8, 335-356.
Cook, P. and J. Ludwig. (2000) Gun Violence: The Real Costs. New York: Oxford University Press.
Cook, P. and J. Ludwig. (2004). “Principles for effective gun policy.” Fordham Law
Review LXXIII, II: 589-613. Corsaro, N. and E.F. McGarrell. 2009. “Testing a promising homicide reduction strategy:
re-assessing the impact of the Indianapolis ‘Pulling Levers’ intervention.” Journal of Experimental Criminology. 5:63-82.
This document is a research report submitted to the U.S. Department of Justice. This report has not been published by the Department. Opinions or points of view expressed are those of the author(s)
and do not necessarily reflect the official position or policies of the U.S. Department of Justice.

193
Csete, M., and Doyle, J. (2004). “Bow ties, metabolism, and disease.” Trends in Biotechnology, 22(9), 446-450.
Dalton, E. (2003). Lessons in Preventing Homicide. East Lansing, MI: School of Criminal Justice, Michigan State University. http://www.cj.msu.edu/~outreach/psn/erins_report_jan_2004.pdf (Accessed 1/9/05).
Decker, S. (2002). Policing Gangs and Youth Yiolence. Newbury Park, CA: Wadsworth. Decker, S. H., B.M, Huebner, A. Watkins, L. Green, T, Bynun and E.F. McGarrell.
(2007a). Project Safe Neighborhood: Strategic Interventions: Eastern District of Missouri, Case Study 7. Washington, D.C: U.S. Department of Justice, Office of Justice Programs.
Decker, S. H., E.F. McGarrell, H. Perez, N.K. Hipple, and T. Bynum. (2007b). Project Safe Neighborhood: Strategic Interventions: Strategic Problem-Solving Responses to Gang Crime and Gang Problems, Case Study 8. Washington, D.C: U.S. Department of Justice, Office of Justice Programs.
Easterling, D., L. Harvey, D. Mac-Thompson, and M. Allen. (2002). Evaluation of SACSI in Winston-Salem: Engaging the Community in a Strategic Analysis of Youth Violence. Greensboro, NC: University of North Carolina.
Fagan, J., F.E. Zimring, and J. Kim. (1998). “Declining homicide in New York City: A
tale of two trends.” Journal of Criminal Law and Criminology, 88, 1277-1323.
Harcourt, M. (2001). Illusion of order: The false promise of broken windows policing. Cambridge, MA: Oxford University Press.
Hipple, N.K., H.A. Perez, E.F. McGarrell, N. Corsaro, T.H. Robinson (forthcoming a). Project Safe Neighborhood: Strategic Interventions: District of Nebraska, Case Study. Washington, D.C: U.S. Department of Justice, Office of Justice Programs.
Hipple, N.K., J.M. Frabutt, N. Corsaro, E.F. McGarrell, M.J. Gathings, (forthcoming b). Project Safe Neighborhood: Strategic Interventions: Middle District of North Carolina, Case Study. Washington, D.C: U.S. Department of Justice, Office of Justice Programs.
Horney, J. D., D.W. Osgood, and I.H. Marshall. (1995). “Criminal careers in the short-term: Intra-individual variability in crime and its relation to local life circumstances.” American Sociological Review, 60 (655-673).
Kane, R. J. (2006). “On the limits of social control: Structural deterrence and the policing of "suppressible" crimes.” Justice Quarterly, 23, 186-213.
This document is a research report submitted to the U.S. Department of Justice. This report has not been published by the Department. Opinions or points of view expressed are those of the author(s)
and do not necessarily reflect the official position or policies of the U.S. Department of Justice.

194
Kapsch, S. and L. Lyman. (2002). Strategic Approaches to Community Safety Research Team Final Report. Final Report submitted to the National Institute of Justice.
Kelling, G., &and W.H. Sousa, Jr. (2001). Do police matter? An analysis of the impact
of New York City's police reforms. Manhattan Institute Civic Report (December).
Kennedy, D. M., A.A. Braga, and A. M. Piehl. (2001). “Developing and implementing operation ceasefire.” In Reducing Gun Violence: The Boston Gun Project’s Operation Ceasefire. Washington, DC: National Institute of Justice.
Kennedy, D. M., A.M. Piehl, and A.A. Braga. (1996). “Youth violence in Boston: gun
markets, serious youth offenders, and a use-reduction strategy.” Law and Contemporary Problems 59: 147- 196.
Koper, C. S. (2005). “Purchase of multiple firearms as a risk factor for criminal gun use:
Implications for gun policy and enforcement.” Criminology and Public Policy, 4, 749-778.
Krivo, L. J., and R. D. Peterson. (1996). “Extremely disadvantaged neighborhoods and urban crime.” Social Forces, 75, 619-650.
Kuziemko, I., and S.D. Levitt. (2004). “An empirical analysis of imprisoning drug offenders.” Journal of Public Economics, 88, 2043-2067.
LaFree, G. (1999). “Declining violent crime rates in the 1990s.” Annual Review of Sociology, 25, 148-168.
Land, K. C., P.L. McCall, and L.E. Cohen, L. E. (1990). “Structural covariates of homicide rates: Are there any invariances across time and social space?” American Journal of Sociology, 95, 922-963.
Lane, Jodi, Susan Turner, and Carmen Flores. (2004). “Researcher-practitioner collaboration in community corrections: overcoming hurdles for successful partnerships.” Criminal Justice Review 29, 1: 97-114.
Levitt, S. D. (2002). “Deterrence.” In J. Q. Wilson, and J. Petersilia (Editors), Crime:
Public Policies for Crime Control. Oakland, CA: ICS Press.
Liska, A. E., and P.E. Bellair. (1995). “Violent crime rates and racial composition: Convergence over time.” American Journal of Sociology, 101, 578-610.
Ludwig, J. (2005). “Better enforcement, less crime.” Criminology and Public Policy, 4, 677-716.
Ludwig, J. and P. Cook. (2003). Evaluating Gun Policy: Effects on Crime and Violence. Washington, DC: Brookings Institution Press.
This document is a research report submitted to the U.S. Department of Justice. This report has not been published by the Department. Opinions or points of view expressed are those of the author(s)
and do not necessarily reflect the official position or policies of the U.S. Department of Justice.

195
Marvell, T. B., & Moody Jr., C. E. (1997). The impact of prison growth on homicide. Homicide
Massachusetts Office of Public Safety and Security, (accessed 12/29/2008).
http://www.mass.gov/?pageID=eopssubtopic&L=5&L0=Home&L1=Funding+%26+Training+Opportunities&L2=Justice+%26+Prevention&L3=Grant+Programs&L4=Senator+Charles+E.+Shannon%2c+Jr.+Community+Safety+Initiative&sid=Eeops
McDevitt, J., A.A. Braga, S. Cronin, E.F. McGarrell, and T. Bynum. (2007). Project Safe Neighborhood: Strategic Interventions: Lowell, District of Massachusetts, Case Study 6. Washington, D.C: U.S. Department of Justice, Office of Justice Programs.
McGarrell, E.F., S. Chermak, J. Wilson, and N. Corsaro. (2006). “Reducing Homicide through a ‘Lever-Pulling’ Strategy.” Justice Quarterly 23,2:214-231.
McGarrell, E.F. and S. Chermak. (2003a). Strategic Approaches to Reducing Firearms
Violence: Final Report on the Indianapolis Violence Reduction Partnership. Final Report submitted to the National Institute of Justice .
McGarrell, E.F. and S. Chermak. (2002). “Problem solving to reduce gang and drug-
related violence in Indianapolis.” In, Scott H. Decker (Ed.) Policing Gangs and Youth Violence. Newbury Park, CA: Wadsworth.
McGarrell, E.F., S. Chermak, A. Weiss and J. Wilson. (2001). “Reducing Firearms
Violence through Directed Police Patrol.” Criminology and Public Policy 1, 1:119-148.
McGarrell, E.F., N. Hipple, and D. Banks. 2003. “Community Meetings as a Tool in
Inmate Re-entry.” Justice Research and Policy 5,2:5-32. McGarrell, E. F., N.K. Hipple, N. Corsaro, E. Pappanastos, E. Stevens, and J. Albritton,
(2007). Project Safe Neighborhood: Strategic Interventions: Middle District of Alabama, Case Study 5. Washington, D.C: U.S. Department of Justice, Office of Justice Programs.
McGarrell, E. F., C. Zimmerman, N.K. Hipple, N. Corsaro, and H. Perez, H. (2005). “The roles of the police in the offender reentry process.” International Journal of Comparative and Applied Criminal Justice, 29, 53-78.
Messner, S. F., and R. M. Golden. (1991). “Racial inequality and racially disaggregated homicide rates: An assessment of alternative theoretical explanations.” Criminology, 30, 421-447.
This document is a research report submitted to the U.S. Department of Justice. This report has not been published by the Department. Opinions or points of view expressed are those of the author(s)
and do not necessarily reflect the official position or policies of the U.S. Department of Justice.

196
Messner, S. F., and R. Rosenfeld. (1998). “Social structure and homicide: Theory and research.” In M. D. Smith, and M. A. Zahn (Editors), Homicide: A Sourcebook of Social Research. Thousand Oaks, CA: Sage Publications.
Miethe, T. D., M. Hughes, and D. McDowall, (1991). “Social change and crime rates: An evaluation of alternative theoretical approaches.” Social Forces, 70, 165-185.
Miller, T.R. and M. A. Cohen, (1997). “Costs of gunshot and cut/stab wounds in the United States, with some Canadian comparisons”, Accident Analysis and Prevention, 29: 329-41.
Moore, M. H., and A.A. Braga, (2003). “Measuring and improving police performance: The lessons of Compstat and its progeny.” Policing, 26, 439-453.
National District Attorneys Association. (2001). Combating Gun Violence: An in-depth look at Richmond’s Project Exile. American Prosecutors Research Institute.
National Research Council. (2005). Firearms and Violence: A Critical Review.
Committee to Improve Research Information and Data on Firearms. Charles F. Wellford, John H. Pepper, and Carol V. Petrie, editors. Committee on Law and Justice, Division of Behavioral and Social Sciences and Education. Washington, DC: The National Academies Press.
Office of Juvenile Justice and Delinquency Prevention. (1999). Promising Strategies to
Reduce Gun Violence. Washington, DC: U.S. Department of Justice. Office of Management and Budget, Executive Office of the President:
http://www.whitehouse.gov/omb/budget/fy2009/justice.html (accessed 12/29/2008).
Papachristos, A. V., T.L. Meares, and J. Fagan, J. (2007). “Attention felons: Evaluating Project Safe Neighborhoods in Chicago.” Journal of Empirical Legal Studies, 4, 223-272.
Piehl, A. M., S.J. Cooper, A.A. Braga, and D.M. Kennedy. (2003). “Testing for structural breaks in the evaluation of programs.” Review of Economics and Statistics, 85, 550-558.
Police Executive Research Forum. 2006. A Gathering Storm: Violent Crime in America. Washington, DC: Police Executive Research Forum.
Quinn, R. E. (1991). Beyond Rational Management: Mastering the Paradoxes and
Competing Demands of High Performance. San Francisco, CA: Jossey-Bass Publishers.
This document is a research report submitted to the U.S. Department of Justice. This report has not been published by the Department. Opinions or points of view expressed are those of the author(s)
and do not necessarily reflect the official position or policies of the U.S. Department of Justice.

197
Raphael, S., and J. Ludwig. (2003). “Prison sentence enhancements: The case of project exile.” In J. Ludwig, and P. J. Cook (Editors), Evaluating Gun Policy: Effects on Crime and Violence. Washington, D.C.: Brookings Institute Press.
Raudenbush, S. W., A.S. Bryk, Y. F. Cheong, R. T. Congdon, Jr., and M. D. Toit. (2004). HLM for Windows version 6.02a. Lincolnwood, IL: Social Scientific Software.
Resig, M. D., and R.B. Parks. (2004). “Can community policing help the truly disadvantaged.” Crime and Delinquency, 50, 139-167.
Rosenfeld, R., R. Fornango, and E. Baumer. (2005). Did Ceasefire, Compstat, and Exile reduce homicide. Criminology and Public Policy, 4, 419-450.
Roehl, J., D. Rosenbaum, S. Costello, J. Coldren, A. Schuck, L. Kunard, and D. Forde.
(2008). “Paving the way for Project Safe Neighborhoods: SACSI in 10 U.S. Cities.” National Institute of Justice Research in Brief.
Rosenfeld, R, R. Fornango, and E. Baumer. Forthcoming. “Evaluating the effects of local
law enforcement interventions on homicide trends: Ceasefire, COMPSTAT, and Exile.”
Sampson, R. J., and S.W. Raudenbush. (1999). “Systematic social observation of public
spaces: A new look at disorder in urban neighborhoods.” American Journal of Sociology, 105, 603-651.
Sherman, L.W., and D.P. Rogan. (1995). “Effects of gun seizure on gun violence: ‘hot Spots’ patrol in Kansas City.” Justice Quarterly 12(4):673-693.
Silverman, E. (1999). NYPD Battles Crime: Innovative Strategies in Policing. Boston:
Northeastern University Press. Silverman, E.B. (2006). “Compstat’s Innovation.” In D. Weisburd and A.A. Braga
(Editors). Police Innovation: Contrasting Perspectives. New York: Cambridge University Press.
Spelman, W. (2000). “The limited importance of prison expansion.” In A. Blumstein and
J. Wallman (Editors), The Crime Drop in America. New York, NY: Cambridge University Press.
U.S. Census Bureau (2000). United States Census 2000. Retrieved November 15, 2005, from http://www.census.gov/main/www/cen2000.html.
U.S. Department of Justice, Bureau of Justice Assistance, (2004). Project Safe Neighborhoods: America’s Network Against Gun Violence. Bureau of Justice Assistance Program Brief. Washington, DC: U.S. Department of Justice.
This document is a research report submitted to the U.S. Department of Justice. This report has not been published by the Department. Opinions or points of view expressed are those of the author(s)
and do not necessarily reflect the official position or policies of the U.S. Department of Justice.

198
U.S. Department of Justice. (2001). Toolkit: Project safe neighborhoods - America's network against gun violence. Washington, DC: United States Department of Justice, Office of the Attorney General.
Weisburd, D., S.D. Mastrofski, J.J. Willis, and R. Greenspan. “Changing Everything so that Everything can Remain the Same: Compstat and American Policing.” In D. Weisburd and A.A. Braga (Editors). Police Innovation: Contrasting Perspectives. New York: Cambridge University Press.
Wellford, C. F., J.V. Pepper, and C.V. Petrie. (2005). Firearms and Violence: A Critical Review. Washington, D.C.: The National Academy Press.
Xie, M., and D. McDowall, D. (2008). “The effects of residential turnover on household victimization.” Criminology, 46 (3), 539-575.
Zimmermann, C.A. (2006). Federal Incentives to Address Gun Violence: A Model of Success and Failure. Unpublished Ph.D. dissertation, Michigan State University, East Lansing, MI.
Zimring, F. and G. Hawkins. (1999). Crime is Not the Problem: Lethal Violence in
America. New York: Oxford University Press.
This document is a research report submitted to the U.S. Department of Justice. This report has not been published by the Department. Opinions or points of view expressed are those of the author(s)
and do not necessarily reflect the official position or policies of the U.S. Department of Justice.

Appendix A
Project Safe Neighborhoods Survey for the Research Partner Thank you for taking the time to fill out this survey. This document is a form that allows you to respond by clicking on the boxes or typing in responses. Please enter the requested information in the form given but feel free to add comments to help clarify your responses.
Research Partner Information Name: Date Survey Completed: /2005 Phone District Name:
Research Partner Survey
1. To what extent has the strategic problem solving process been integrated into the PSN task force? For each section, please indicate one statement that is closest to your perception of the manner in which the PSN task force is using information to drive decisions. Please add comments to better explain your answers. Part A. Using data to identify problems The task force is interested in looking at data to identify problems and solve problems. The task force is interested in data and analysis for areas they have already identified as problems. The task force is interested in data to confirm the value of current practices. The task force is not interested in using data and analysis to drive planning Part B. Translating data into decisions The task force has used research and data to create programs or strategies. The task force has used research and data to expand existing programs or strategies. The task force has used research and data to justify or publicize existing programs. The task force has not connected research and data to pogroms or strategies. Part C. Evaluating results The task force has already received an evaluation report(s) on PSN efforts Evaluations of PSN programs are underway but not yet complete. Evaluations of PSN programs are in the planning or ramp-up mode. Evaluations of PSN programs have not gotten beyond the discussion phase. The task force has not requested or supported the development of evaluations. Comments:
This document is a research report submitted to the U.S. Department of Justice. This report has not been published by the Department. Opinions or points of view expressed are those of the author(s)
and do not necessarily reflect the official position or policies of the U.S. Department of Justice.

2. To what extent are you (and other research team members) integrated into the task force? Please indicate the statement the best describes your perception of your relationship with the task force and then provide any comments that will help explain your answer (choose one). I/we function as a resource person, providing information routinely but not actively participating in all phases of discussion and planning I/we function as a member of the task force, participating openly and regularly with task force members. Research is peripheral to the task force process. Comments:
3. Was the research team able to conduct analyses of the local gun crime problem? yes no don’t know
a. If yes, did the task force use the findings to shape gun crime reduction strategies? yes no don’t know
Comments:
4. In what areas has research provided a tangible result? Check all that apply and give an example for those areas with tangible results. Check all that apply Give an example Problem identification Program development/expansion Program evaluation Program revision/modification Resource allocations/shifts
5. Do you think that task force members will be more likely to use research and research patners after their PSN experience? yes no don’t know
Comments:
This document is a research report submitted to the U.S. Department of Justice. This report has not been published by the Department. Opinions or points of view expressed are those of the author(s)
and do not necessarily reflect the official position or policies of the U.S. Department of Justice.

6. In your view, the overall impact of PSN in terms of the use of problem-solving processes is best describes by which of the following statements (choose one). Please comment to clarify your opinion. PSN has created an environment in which data analysis drives decision making. PSN has increased the use of research in decision-making. PSN has increased the use of research to evaluate existing strategies, but not to drive all decisions. PSN has increased the ability of task force members to collect data, but analysis and evaluation processes are not integrated into decision-making PSN has not changed the way in which decisions are made. Comments:
7. Please rate each of these areas to the extent they created barriers to research-driven problem solving. Please select one of the three responses. Feel free to add comments. a. Legal barriers No problem Some problem Major problemb. Administrative barriers No problem Some problem Major problemc. Perceived risk to agency No problem Some problem Major problemd. Turf issues No problem Some problem Major probleme. Information not collected No problem Some problem Major problemf. Information in incompatible form No problem Some problem Major problemg. Lack of technology/technical support No problem Some problem Major problemh. Lack of interest in research No problem Some problem Major problemi. Lack of action by members* No problem Some problem Major problemj. Lack of funds No problem Some problem Major problemk. Lack of personnel No problem Some problem Major probleml. Administrative/organization issues No problem Some problem Major problem
*Members failing to follow through with data collection, working on data issues in their agency etc. Comments:
8. Has the PSN task force provided any additional fduning for researcu beyond the initial BJA grant? yes no don’t know Comments:
9. From your perspective, how supportive and engaged has the U.S. Attorny been in PSN (choose one)? The U.S. Attorney has been both supportive and engaged in PSN. The U.S. Attorney has been supportive of PSN. The U.S. Attorney does not appear to be supportive or engaged in PSN. Comments:
This document is a research report submitted to the U.S. Department of Justice. This report has not been published by the Department. Opinions or points of view expressed are those of the author(s)
and do not necessarily reflect the official position or policies of the U.S. Department of Justice.

10. How supportive has the PSN project coordinator been of your research efforts? Very supportive somewhat supportive not supportive Comments:
11. Overall, has the PSN research experience been positive or negative? positive somewhat positive somewhat negative negative Comments:
12. Please provide any additional comments about your experience in PSN that you would like to share. Comments:
This document is a research report submitted to the U.S. Department of Justice. This report has not been published by the Department. Opinions or points of view expressed are those of the author(s)
and do not necessarily reflect the official position or policies of the U.S. Department of Justice.

Appendix B
Project Safe Neighborhoods Semi-Annual Report to the Attorney General
The following questions were used in the construction of measures for this study. 15. Has data analysis helped the task force focus on gun violence? Very much Somewhat Not really
17. a1. Please identify enforcement/deterrence focused strategies your task force has implemented: Increased federal prosecution of firearms-related cases Increased state and local prosecution of firearms-related cases Deployment of street-level firearms enforcement unit Offender notification meetings Probation/parole enforcement home visits Directed police patrol I high crime area Supply-side interventions Investigations of criminal organizational/gang violence
17. a2. Please identify prevention focused strategies your task force has implemented: Clergy outreach to offenders Employment programs Substance abuse programs Education programs Vocational training programs Neighborhood development programs Youth street worker outreach School-based prevention Hospital trauma center outreach Other
This document is a research report submitted to the U.S. Department of Justice. This report has not been published by the Department. Opinions or points of view expressed are those of the author(s)
and do not necessarily reflect the official position or policies of the U.S. Department of Justice.

Appendix C
The HGLM model presented in Table 2 can be written as follows:85
ηti = π0i + π 1i(PSNDosage) + π 2i(PrisonRate) + π 3i(PoliceDensity) + π 4i(2001)
+ π 5i(2002) + π 6i(2003) + π 7i(2004) + π 8i(2005) + π 9i(2006) + eti
where ηti = the expected violent crime rate
where π0i = β00 + β01(Disadvantage) + β02(PopDensity) + roi
where π1i = β10 + r1i
where π2i = β20 + r2i
where π3i = β30 + r3i
where π4i + …+ π9i = β40 +…+ β90
Thus, the reduced two-level equation can be written as:
ηti = [π0i + π 1i + π 2i + π 3i + π 4i + …+ π 9i] + [roi + r1i + r2i + r3i + eti ]
The outcome in the HGLM is the count of violent crimes at level 1 and includes time-varying covariates within the cities (i.e., level 1 measures) and time invariant measures at level 2. As seen in the above equations, PSN dosage is included as a time-varying measure at level 1. Here, the HGLM model uses an overdispersed Poisson sampling model at level 1 and a log link function to equate the transformed count into a linear structural model. The log link function in the HGLM is used to equate the transformed count into a linear structural model, consistent with the regression-based analytic approach.
In the analysis, the HGLM Poisson model assumes an expected violent crime
count E (Yit | λ) = mit λit,
where λit is expressed as the violent crime rate of a city i at time t and mit is the exposure measure, which is expressed as the city population in 100,000s. The expected violent crime rate for a city is transformed through a natural logarithmic function, where ηti = ln(λit). The logged event rate, ηti , becomes the dependent variable in the level 1 model.
This document is a research report submitted to the U.S. Department of Justice. This report has not been published by the Department. Opinions or points of view expressed are those of the author(s)
and do not necessarily reflect the official position or policies of the U.S. Department of Justice.

Table C-1: Conditional Random-Effects Poisson Model of Violent Crime Rates in Large U.S. Cities between 2000 and 2006 (Examining Treatment as a Level 1 Indicator) Fixed Effects
Coefficient
Standard Error
Odds Ratio
Level 1 (Within-City Effects) Intercept -4.144 .3523 .015 PSN Treatment City -.0383* .0195 .962 Incarceration Rate .0005+ .0003 1.001 Police Density .0002 .0003 1.000 Year 2001 -.0184* .0094 .981 Year 2002 .0196 .0130 1.019 Year 2003 -.0227+ .0133 .977 Year 2004 -.0453** .0137 .955 Year 2005 -.0220 .0141 .978 Year 2006 -.0125 .0146 .987 Level 2 (Between-City Effects) Disadvantage .5030** .0316 1.65 (Ln) Population Density -.2918** .0999 .747 Random Effects
Variance Component
χ2
p Value
Intercept, r 0i .2066 27110.8 < .01 Treatment City, r1i .0097 178.4 < .01 Incarceration rates, r2i .0000 234.8 < .01 Police density, r3i .0000 197.1 < .01 Level 1 error, eti 22.97 - - **p < .01, *p < .05, + p < .10
This document is a research report submitted to the U.S. Department of Justice. This report has not been published by the Department. Opinions or points of view expressed are those of the author(s)
and do not necessarily reflect the official position or policies of the U.S. Department of Justice.

Figure C-1: Q-Q Plot of Level 1 Residuals for PSN Dosage Model
Observed Value0.500.250.00-0.25-0.50
Exp
ecte
d N
orm
al V
alu
e
0.4
0.2
0.0
-0.2
-0.4
This document is a research report submitted to the U.S. Department of Justice. This report has not been published by the Department. Opinions or points of view expressed are those of the author(s)
and do not necessarily reflect the official position or policies of the U.S. Department of Justice.

Appendix D
The HGLM model presented in Table 39, which was the alternative growth curve model where the PSN treatment city designation is a static measure at level 2, is written as follows (Note: all level 1 measures were group-mean centered, and level 2 measures were grand mean centered):
ηti = π0i + π 1i(PrisonRate) + π 2i(PoliceDensity) + π 3i(Time) + eti
where π0i = β00 + β01(PSN Treatment City) + β02(Disadvantage) + β03(PopDensity) + roi
where π1i = β10 + r1i
where π2i = β20 + r2i
where π3i = β30 + β31(PSN Treatment City)
Thus, the reduced two-level equation can be written as:
ηti = [π0i + π 1i + π 2i + π 3i ]+ [roi + r1i + r2i + eti ]
The outcome in the HGLM is the count of violent crimes at level 1 and includes time-varying covariates within the cities (i.e., level 1 measures) and time invariant measures at level 2. As seen in the above equations, PSN treatment is a level 2 static measure. Here, the HGLM model uses an overdispersed Poisson sampling model at level 1 and a log link function to equate the transformed count into a linear structural model. The log link function in the HGLM is used to equate the transformed count into a linear structural model, consistent with the regression-based analytic approach.
In the analysis, the HGLM Poisson model assumes an expected violent crime
count E (Yit | λ) = mit λit,
where λit is expressed as the violent crime rate of a city i at time t and mit is the exposure measure, which is expressed as the city population in 100,000s. The expected violent crime rate for a city is transformed through a natural logarithmic function, where ηti = ln(λit). The logged event rate, ηti , becomes the dependent variable in the level 1 model.
This document is a research report submitted to the U.S. Department of Justice. This report has not been published by the Department. Opinions or points of view expressed are those of the author(s)
and do not necessarily reflect the official position or policies of the U.S. Department of Justice.

Table D-1: Conditional Random-Effects Poisson Model of Violent Crime Rates in Large U.S. Cities between 2000 and 2006 (Cross-Level Interaction Effects including Quadratic Function of Time) Fixed Effects
Coefficient
Standard Error
Odds Ratio
Level 1 (Within-City Effects) Intercept -5.17** .0283 .0056 Incarceration Rate .0006+ .0003 1.000 Police Density .0002 .0003 1.000 Time -.0024** .0061 .9756 Time^2 .0032 .0009 1.003 Level 2 (Between-City Effects) Disadvantage .4543** .0320 1.574 (Ln) Population Density -.2026* .0969 .8220 PSN Treatment City .3117** .0627 1.367 Cross-Level Interaction Effects PSN Treatment*Time -.0513** .0109 .9499 PSN Treatment*Time^2 .0037* .0016 1.003 Random Effects
Variance Component
χ2
p Value
Intercept, r 0i .1880 32785.3 < .01 Incarceration rates, r1i .0000 680.2 < .01 Police density, r2i .0000 608.8 < .01 Level 1 error, eti 24.44 - - **p < .01, *p < .05, + p < .10
This document is a research report submitted to the U.S. Department of Justice. This report has not been published by the Department. Opinions or points of view expressed are those of the author(s)
and do not necessarily reflect the official position or policies of the U.S. Department of Justice.

Figure D-1: Q-Q Plot of Level 1 Residuals for PSN Treatment Model
Observed Value0.80.60.40.20.0-0.2-0.4
Exp
ecte
d N
orm
al V
alu
e
0.4
0.2
0.0
-0.2
-0.4
This document is a research report submitted to the U.S. Department of Justice. This report has not been published by the Department. Opinions or points of view expressed are those of the author(s)
and do not necessarily reflect the official position or policies of the U.S. Department of Justice.

Appendix E
Table E-1: Studies Suggestive of Focused Deterrence Impact on Gun Crime
Directed Police Patrol Project Exile Strategic Problem Solving/Pulling Levers Equivocal Evidence Kansas City (Sherman and Rogan, 1995)
Richmond (Rosenfeld, Fornango, and Baumer, 2005)
Boston (Kennedy, 1997; Braga, Kennedy, Waring and Piehl, 2001; Piehl, Cooper, Braga, and Kennedy, 2003)
St. Louis (Decker, Huebner, Watkins, Green, Bynum, and McGarrell, 2007)
Indianapolis (McGarrell, Chermak, Weiss and Wilson, 2001; McGarrell, Chermak, and Weiss, 2002)
Montgomery (McGarrell, Hipple, Corsaro, Pappanastos, and Stevens, 2007)
Indianapolis (McGarrell and Chermak, 2003; McGarrell, Chermak, Wilson, and Corsaro, 2006; Corsaro and McGarrell, 2009)
Durham (Hipple, Frabutt, Corsaro, McGarrell, and Gathings, 2007)
Pittsburgh (Cohen and Ludwig, 2003)
Mobile (Hipple, O’Shea and McGarrell, 2007)
Los Angeles (Tita, Riley, Ridgeway, Grammich, Abrahamse, and Greenwood, 2003)
Stockton (Braga, 2008) Lowell (McDevitt, Braga, Cronin,
McGarrell, and Bynum, 2007)
Omaha (Hipple, Perez, McGarrell, Corsaro, Robinson, and Culver, 2007)
Greensboro (Hipple, Frabutt, Corsaro, McGarrell, and Gathings, 2007)
Winston-Salem (Hipple, Frabutt, Corsaro, McGarrell, and Gathings, 2007)
Chicago (Papachristos, Meares, and Fagan, 2007)
This document is a research report submitted to the U.S. Department of Justice. This report has not been published by the Department. Opinions or points of view expressed are those of the author(s)
and do not necessarily reflect the official position or policies of the U.S. Department of Justice.

Endnotes
1 Bureau of Justice Statistics: www.ojp.usdoj.gov/bjs/ijs.htm. 2 Levels of property crime and violent crime not involving a gun are lower in the U.S. than many other western democracies but gun crime remains exceptionally high in the U.S. See Zimring and Hawkins, 1999; Bureau of Justice Statistics: www.ojp.usdoj.gov/bjs/ijs.htm. 3 Rosenfeld, Fornango, and Baumer, 2005. The National District Attorneys Association (2001) initially reported that Project Exile was associated with a decline in homicide. Raphael and Ludwig (2003) analyzed the Richmond homicide data and found that the decline in homicide was consistent with national declines in homicide and could not be clearly attributed to the impact of Project Exile. Rosenfeld et al. then evaluated Exile utilizing a longer post-intervention time period and found that Project Exile had an impact on the homicide rate. The authors argued that the evidence for impact of Project Exile was stronger than the case for the impact of COMPSTAT or Boston’s Ceasefire. 4 Silverman, E. 1999. 5 Braga, Kennedy, Waring, and Piehl, 2001; Braga, Kennedy, Piehl and Waring, 2001; Kennedy, Braga, and Piehl. 2001. 6 Kennedy, Piehl, and Braga, 1996; Braga, Cook, Kennedy, and Moore, 2002. 7 Coleman et al., 1999. See also, Roehl et al. 2004; Dalton, 2003. 8 McGarrell and Chermak, 2003a,b. Subsequently, the initial findings were supported in more systematic analyses. See McGarrell, Chermak, Wilson, and Corsaro, 2006; Corsaro and McGarrell, forthcoming. 9 Kapsch and Lyman, 2002. Easterling et al., 2002. 10 Betts et al., 2003. 11 Roehl et al. 2008. 12 Data compiled by Professor Joe Trotter and colleagues as part of American University’s PSN Technical Assistance Program. 13 U.S. Department of Justice, Bureau of Justice Assistance, 2004. See also, www.psn.gov. 14 There are 94 U.S. Attorneys Offices but Guam and the Marianas Islands have been treated as a single PSN task force thus resulting in 93 PSN task forces. For an excellent discussion of researcher-practitioner collaboration, see Lane, Turner, and Flores, 2004. 15 For example, PSN officials in many jurisdictions report that for years illegal possession of a firearm by a felon or concealed carrying offenses, and even crimes committed with a firearm present but no shooting, were routinely treated as non-violent offenses with high rates of dropped charges, dismissed cases, and suspended sentences. 16 Sherman and Rogan, 1995; McGarrell, Chermak, Weiss, and Wilson, 2001; Cohen and Ludwig, 2003. 17 American University (AU), the Bureau of Alcohol, Tobacco & Firearms (ATF), Community Oriented Policing Services (COPS), the Community Policing Consortium, the International Association of Chiefs of Police (IACP), the National Crime Prevention Council (NCPC), the National District Attorneys Association & American Prosecutors Research Institute (NDAA & APRI), the United State Department of Justice (USDOJ), Bureau of Justice Assistance (BJA), and National Institute of Justice (NIJ). 18 The districts serving Guam and the Marianas Islands were combined thus resulting in 93 PSN task forces across the 94 U.S. Attorney’s Offices. One district chose not to have its task force participate in the training resulting in the 92 task forces that did attend the trainings. 19 After DMI training #2, Fort Meyers decided not to implement the DMI. Ocala became an official site during the third DMI training. 20 Cases filed are included in Table 19. The picture that emerges from cases is virtually identical to filings against defendants. 21 The July 2004 report was used due to the availability of the indicators on research that were utilized in this report to the Attorney General. 22 A Chi Square test shows the probability of this relationship between attendance and data analysis helpfulness occurring by chance was .068. 23 A Chi Square test showed that the probability that this relationship occurred by chance is .000. 24 Ten sources were specified and the eleventh category was “other.”
This document is a research report submitted to the U.S. Department of Justice. This report has not been published by the Department. Opinions or points of view expressed are those of the author(s)
and do not necessarily reflect the official position or policies of the U.S. Department of Justice.

25 Reports from the districts indicate that all districts fulfilled the mandates to contract with a media/outreach partner and to provide training. Given the lack of variation in these elements, implementation success measures were created focusing on the elements noted. 26 The information source used will be noted in the description of variable construction. 27 The districts covering Guam, Marianas Islands, Puerto Rico, and the Virgin Islands were not included in the analysis due to data limitations. 28 Scores were converted to Z scores. 29 This is a state-level variable and rates the level of public information technology infrastructures. 30 This is a state-level variable. Potential problems with variable testing are discussed in the Zimmermann (2006) study. Nesting was not found to be problematic. 31 For a complete discussion of the construction of these groups, please see Zimmermann (2006). Given that the ranking of groups was on a discreet scale, the subgroups are not equal in number. Also, information technology was chosen over collaborative program history, as the subgroups were so unbalanced in number for the programs variable, the analysis would be exceedingly limited in statistical power. 32 A Student t test, not assuming equal variances, indicates a difference between groups, significant at the .01 level. 33 McGarrell et al., 2007; Hipple, O’Shea, and McGarrell, 2007. 34 Comparable population data were unavailable for the federal districts of Puerto Rico, the Virgin Islands, Guam, and the Marinas Islands. All comparisons are based on the 90 remaining federal districts. 35 Three of the eight models had ARIMA parameters of 0,0,0. The dependent variables, in these models, were not autocorrelated. The method of analysis in these models, thus, was OLS linear regression. In those models, the F statistic and R-square are reported. 36 That is, all categories in the Mobile Police Department database in which a gun was used in commission of the offense and those instances when a gun was in possession of an offender. 37 That is, homicide with a gun, rape with a gun, robbery with a gun, aggravated assault with a gun. 38 Decker et al., 2007; McDevitt et al., 2007; Hipple et al., forthcoming a; Hipple et al, forthcoming b. 39 A task force team coordinated by the U.S. Attorney’s Office participated in SACSI as an “unfunded” site. 40 Since the natural logarithm of offenses was used in the analysis, we report a factor reduction of -.23 between pre- and post-intervention. In order to convert from the log form to a percentage change in the actual number of offenses, we use the standard formula [exponential (beta coefficient) -1], or in this case [exponential (-.23) -1], which equals -.205. This equates to a 20 percent reduction in gun offenses. 41 Salisbury was included in the original analysis. It experienced a decline but it did not attain statistical significance. The base rates were too low to allow for meaningful assessment. 42 This difference in mean was significant using a two-tailed test (p<.05). 43 Since the series reported here do not reflect identical time periods, we tested whether using only common periods across the sites changed the results. For example, we restricted the analysis to a comparison between the changes one year (12 months) pre-intervention to one year (12 months) post-intervention. In this analysis and others, Lowell still demonstrated the greatest decline in aggravated assaults with a gun. 44 Although there were 94 U.S. federal districts that made-up the PSN focus, one PSN task force was combined (Guam and Marianas Islands) and three PSN sites (Guam/Marianas Islands, Puerto Rico, and Virgin Islands) were excluded from the present analysis and discussion due to missing data issues. Thus, the focus was on the 90 PSN task forces covering the 50 states and the District of Columbia. 45 Includes any and all criminal cases where 18 U.S.C. 922 or 924 was brought as any charge against a defendant. However, both statutes were run together to eliminate any double counting of cases/defendants when more than one subsection of Section 922 or 924 was charged against the same defendant, or both Sections 922 and 924 were charged against the same defendant. 46 Rosenfeld et al. (2005) relied on the Law Enforcement Management and Administration Statistics (LEMAS) surveys for their police density measure. However, their study had a significant lag between their period of interest and their analyses, and thus LEMAS data were available for the period of time they examined (i.e., the 1990’s). Complete LEMAS data through 2006 were not available at the time of our study and we substituted with the use of UCR employee data.
This document is a research report submitted to the U.S. Department of Justice. This report has not been published by the Department. Opinions or points of view expressed are those of the author(s)
and do not necessarily reflect the official position or policies of the U.S. Department of Justice.

47 In future analyses we plan to use Supplemental Homicide Reports (SHR) to focus on gun homicides. The limitation of the SHR data is that many of the cities have small numbers of homicides and thus the population of cities becomes further restricted due to data power issues. 48 The selection of cities with a population of 100,000 or greater was based on maximizing the sample size while also providing sufficient base rates of violent offenses to support the analyses. 49 We were concerned with cases where at least one of the measures (homicide, robbery, or assault) had missing data, but the other offenses had complete data. If aggregation occurred under this circumstance there would be a bias in the measure. Thus, we imputed missing data values prior to aggregation. 50 Missing homicide data were an issue in 29/1,764 cases, 1.6 percent. In 16 of these cases, we were able to supplement the missing annual homicide count with the Supplementary Homicides Reports (SHR) data, given that both data sources were initially housed by the FBI reporting system and are created from incident information. For 10 of the remaining 16 cases, we used within-city regressions to impute a missing value for missing homicide data. In the remaining 6 cases, we simply left the homicide count as missing due to the ‘multiple-missing’ data issue. 51 Missing robbery data were an issue in 34/1,764 cases, or 1.9 percent of the cases. Missing assault data were an issue in 33/1,764 cases, or 1.8 percent. 52 None of the ‘chronic missing data’ cities (Westminster, Co; Olathe, KS; Overland Park, KS; Warren, MI; Akron, Oh; Alexandria, VA; and Chesapeake, VA) were designated as PSN treatment sites. 53 The coverage of the media campaign is impossible to measure in a fashion that would allow measurement of variation across jurisdictions. It included a national campaign that involved television and radio public service announcements (PSAs) and each district included its own campaign that also included PSAs as well as billboards, posters, and other creative mediums. 54 Fourteen of 68 districts included in the analyses had multiple large cities that were the focus of PSN intervention. 55 We contacted project coordinators or research partners in 26.4 percent (18/68) of the districts for target clarification. 56 Zimmerman (2006) notes that additional elements framed by DOJ including media outreach strategies, formal training, and cross-agency collaboration exhibited extremely low variability across districts and were considered constants and were thus dropped in the aggregation of the overall policy adoption, or dosage variable. 57 The reality is that for many districts, it was not until 2003 or later that the task force was truly operational and various enforcement, intervention, and prevention components actually implemented. Thus, the reliance of a common 2002 treatment date results in a conservative test of PSN’s impact as it may discount impact observed in late adopter jurisdictions. The 2002 date is justifiable based on federal prosecution trends. This makes sense in that it is a strategy under the control of the U.S. Attorney’s Office and thus was often the earliest indicator of PSN implementation. 58 The limitation of this approach is discussed and addressed throughout the results and discussion sections. 59 We did not include PSN treatment as a level 2 measure and PSN dosage as a level 1 measure within the same model due to the high inter-relationship between these two measures. Specifically, dosage only increased in PSN target cities. However, when examining a model that included both treatment and dosage at different levels, the results were virtually identical to those presented here-in (i.e., the dosage-violent crime relationship remained the same at level 1 with or without the treatment estimate at level 2). 60 A series of Independent Samples T-Tests comparing measures from the eleven cities excluded from the mixed-regression models to non-treatment cities were performed. None of the tests were statistically significant (p > .05) where measures existed (including violent crime rates in a given year, level 1 covariates in a given year, and level 2 covariates that were treated as time-invariant), indicating that the non-treatment cities excluded from the analyses were not significantly different than non-treatment cities that were included in the regressions presented here-in. 61 We re-estimated our models adding a constant (3.0) to the disadvantage measure to eliminate the negative values and the estimates did not change in any meaningful way. Thus, for simplicity we simply used the disadvantage measure as it was originally created from the principal components analysis. 62 Refer to Appendix A for the equation for this model. 63 We felt it necessary to address the concern that PSN implementation could have led to an increase in law enforcement agents at the city level and an increase in incarceration rates at the state level. In this case, increases in police density and incarceration could actually constitute an indirect reflection of PSN
This document is a research report submitted to the U.S. Department of Justice. This report has not been published by the Department. Opinions or points of view expressed are those of the author(s)
and do not necessarily reflect the official position or policies of the U.S. Department of Justice.

implementation. To address this concern, we estimated a growth curve model where annual police density (the outcome at level 1) was a function of a city being designated a PSN site at level 2 (0 = non-treatment site, 1 = treatment site). The estimated effect was actually negative and statistically significant, indicating that PSN sites actually had a larger decline in police per 100,000 residents than did non-PSN sites. The same was true when state incarceration changes were modeled as the outcome variable at level 1. Thus, we find contradictory evidence to the concern that PSN sites actually led to a significant increase in state incarceration rates as well as increases in law enforcement density These relationships were actually negative. 64 The reduction of 52.1 percent of the residual variance from the unconditional to the conditional model was computed as a percentage change: (.2066-.4320)/.4320 = .521 or 52.1 percent. 65 Results available upon request. 66 Refer to Appendix A for the equation for this model. 67 [exp(-.0252)] = -.024 or -2.4 percent. 68 This was a minimal concern in the research done in Chicago by Papachristos et al. (2007) because they included additional relevant time-variant measures such as prosecution changes and sentences associated with federal prosecution in their linear growth models. Thus, they included both static and dynamic PSN treatment measures in one overall model. 69 Caseload data were extracted from the United States Attorneys' Case Management System. Thanks to Karen Shaller for her help with these data. 70 The federal prosecution data are measured based on the federal fiscal year. For example, FY2000 encompasses the period 10/01/1999 to 9/30/2000. Therefore the crime data are lagged by three months with the prosecution data. The fiscal year data reflect a lagged effect on the calendar year crime data. 71 The percentage changes in violent crime across high, medium, and low prosecution sites was calculated by comparing the average number of violent crimes during the pre-intervention period (years 2000 and 2001) with average number of violent crimes during the post-intervention period (years 2002 to 2006). 72 It is important to note that the uneven distribution of target and non-target cities in the three classifications used for the prosecution categorization was because the upper, middle, and lower tier classification was based at the district-level and not the city-level. Thus, over half (52.9 %) of the non-target cities were classified as high prosecution sites because a majority of these cities shared jurisdictional boundaries in the high federal prosecution districts. 73Table 41 is a random-effects model but does not include random variance components for either the federal prosecution or the variable to control for random changes in violent crime over the period of time examined here. This was due to the fact that the HGLM model would not converge when adding random variance parameters for these measures in the complete model. 74 Five cities were excluded due to missing data across the 3-level model. 75 Q-Q plots graph the quintiles of the observed values of the residuals against the quintiles of a specified distribution. In this case, we specified a normal distribution, which was consistent with testing the assumption of HGLM modeling (Raudenbush and Bryk, 2002). 76 The case studies reviewed in Chapter Six reflect this approach. 77 As noted previously, analyses based on SHR reports are being conducted in subsequent stages. 78 Twenty five percent of all U.S. cities with a population of 100,000 or more averaged 3.85 homicides per year, or .32 homicides per month. Fifty percent averaged 11.28 homicides per year, or .94 per month. Seventy five percent of all large U.S. cities averaged 30 homicides per year, or 2.5 homicides per month. 79 For jurisdictions with an incident-based reporting system, further analyses of gun crime are possible. 80 The planned time series analyses utilizing monthly SHR data will further address the threat of regression to the mean. 81 Most commonly this was ATF but in a number of task forces DEA, FBI, the Marshals Service, and other federal agencies were important task force members. 82 Salisbury was included in the analysis. However, its smaller population produces very low base rates of gun crime and low statistical power to assess impact. High Point was not included because it is currently part of a separate NIJ evaluation. 83 St. Louis was also distinct from the other sites in the list of “strategic problem solving/pulling levers” sites in that the PSN task force did not utilize offender notification meetings as a tool for communicating the focused deterrence message to groups of high risk individuals. The task force did, however, rely on
This document is a research report submitted to the U.S. Department of Justice. This report has not been published by the Department. Opinions or points of view expressed are those of the author(s)
and do not necessarily reflect the official position or policies of the U.S. Department of Justice.

other mechanisms to communicate the threat of federal prosecution and local officials reported that the word on the street was to avoid gun charges that would mean being “walked across the street” from local to federal court. 84 Examples of studies finding non-significant impacts of offender notification meetings at the individual level include Chermak (2006) and McGarrell, Hipple, and Banks (2003). This is not to question the effectiveness of offender notification meetings but rather to note that their established impact is more evident at the neighborhood- than the individual-level. 85 Note: All level 1 measures were group-centered, all level 2 measures were grand-mean centered, and no random variance components were estimated for the annual dummy variables because all cities had the same fixed value for this measure.
This document is a research report submitted to the U.S. Department of Justice. This report has not been published by the Department. Opinions or points of view expressed are those of the author(s)
and do not necessarily reflect the official position or policies of the U.S. Department of Justice.